EP4060552B1 - Markierungsfreie analyse von hellfeldmikroskopbildern - Google Patents
Markierungsfreie analyse von hellfeldmikroskopbildern Download PDFInfo
- Publication number
- EP4060552B1 EP4060552B1 EP21162619.7A EP21162619A EP4060552B1 EP 4060552 B1 EP4060552 B1 EP 4060552B1 EP 21162619 A EP21162619 A EP 21162619A EP 4060552 B1 EP4060552 B1 EP 4060552B1
- Authority
- EP
- European Patent Office
- Prior art keywords
- objects
- test
- training
- image
- test sample
- Prior art date
- Legal status (The legal status is an assumption and is not a legal conclusion. Google has not performed a legal analysis and makes no representation as to the accuracy of the status listed.)
- Active
Links
Images


Classifications
-
- G—PHYSICS
- G06—COMPUTING OR CALCULATING; COUNTING
- G06V—IMAGE OR VIDEO RECOGNITION OR UNDERSTANDING
- G06V20/00—Scenes; Scene-specific elements
- G06V20/60—Type of objects
- G06V20/69—Microscopic objects, e.g. biological cells or cellular parts
- G06V20/698—Matching; Classification
-
- G—PHYSICS
- G01—MEASURING; TESTING
- G01N—INVESTIGATING OR ANALYSING MATERIALS BY DETERMINING THEIR CHEMICAL OR PHYSICAL PROPERTIES
- G01N15/00—Investigating characteristics of particles; Investigating permeability, pore-volume or surface-area of porous materials
- G01N15/02—Investigating particle size or size distribution
- G01N15/0205—Investigating particle size or size distribution by optical means
- G01N15/0227—Investigating particle size or size distribution by optical means using imaging; using holography
-
- G—PHYSICS
- G01—MEASURING; TESTING
- G01N—INVESTIGATING OR ANALYSING MATERIALS BY DETERMINING THEIR CHEMICAL OR PHYSICAL PROPERTIES
- G01N15/00—Investigating characteristics of particles; Investigating permeability, pore-volume or surface-area of porous materials
- G01N15/10—Investigating individual particles
- G01N15/14—Optical investigation techniques, e.g. flow cytometry
- G01N15/1429—Signal processing
- G01N15/1433—Signal processing using image recognition
-
- G—PHYSICS
- G06—COMPUTING OR CALCULATING; COUNTING
- G06F—ELECTRIC DIGITAL DATA PROCESSING
- G06F18/00—Pattern recognition
- G06F18/20—Analysing
- G06F18/24—Classification techniques
- G06F18/241—Classification techniques relating to the classification model, e.g. parametric or non-parametric approaches
- G06F18/2413—Classification techniques relating to the classification model, e.g. parametric or non-parametric approaches based on distances to training or reference patterns
- G06F18/24147—Distances to closest patterns, e.g. nearest neighbour classification
-
- G—PHYSICS
- G01—MEASURING; TESTING
- G01N—INVESTIGATING OR ANALYSING MATERIALS BY DETERMINING THEIR CHEMICAL OR PHYSICAL PROPERTIES
- G01N15/00—Investigating characteristics of particles; Investigating permeability, pore-volume or surface-area of porous materials
- G01N15/02—Investigating particle size or size distribution
- G01N2015/0294—Particle shape
-
- G—PHYSICS
- G01—MEASURING; TESTING
- G01N—INVESTIGATING OR ANALYSING MATERIALS BY DETERMINING THEIR CHEMICAL OR PHYSICAL PROPERTIES
- G01N15/00—Investigating characteristics of particles; Investigating permeability, pore-volume or surface-area of porous materials
- G01N15/10—Investigating individual particles
- G01N2015/1006—Investigating individual particles for cytology
-
- G—PHYSICS
- G01—MEASURING; TESTING
- G01N—INVESTIGATING OR ANALYSING MATERIALS BY DETERMINING THEIR CHEMICAL OR PHYSICAL PROPERTIES
- G01N15/00—Investigating characteristics of particles; Investigating permeability, pore-volume or surface-area of porous materials
- G01N15/10—Investigating individual particles
- G01N15/14—Optical investigation techniques, e.g. flow cytometry
- G01N2015/1486—Counting the particles
-
- G—PHYSICS
- G01—MEASURING; TESTING
- G01N—INVESTIGATING OR ANALYSING MATERIALS BY DETERMINING THEIR CHEMICAL OR PHYSICAL PROPERTIES
- G01N15/00—Investigating characteristics of particles; Investigating permeability, pore-volume or surface-area of porous materials
- G01N15/10—Investigating individual particles
- G01N15/14—Optical investigation techniques, e.g. flow cytometry
- G01N2015/1493—Particle size
-
- G—PHYSICS
- G01—MEASURING; TESTING
- G01N—INVESTIGATING OR ANALYSING MATERIALS BY DETERMINING THEIR CHEMICAL OR PHYSICAL PROPERTIES
- G01N15/00—Investigating characteristics of particles; Investigating permeability, pore-volume or surface-area of porous materials
- G01N15/10—Investigating individual particles
- G01N15/14—Optical investigation techniques, e.g. flow cytometry
- G01N2015/1497—Particle shape
-
- G—PHYSICS
- G06—COMPUTING OR CALCULATING; COUNTING
- G06V—IMAGE OR VIDEO RECOGNITION OR UNDERSTANDING
- G06V2201/00—Indexing scheme relating to image or video recognition or understanding
- G06V2201/03—Recognition of patterns in medical or anatomical images
Definitions
- the present invention is in the field of Brightfield microscopy.
- PDOs patient derived tumour organoids
- the current gold-standard assay is based on the measurement of intracellular ATP levels as an endpoint assay using the CellTiter-Glo 3D assay (Promega). This assay can be affected by the luminescent labelling, is limited to one time-point, and cannot distinguish cytostatic ( i.e. growth arrest) from a cytotoxic ( i.e. cell death) response.
- the methods described herein overcome the problems of the art.
- the one or more c-objects in training sample (102) may have been labelled with a live cell fluorescence label (L) and the training c-object data (124) may comprise the training fluorescent image (114, 114') of the live cell fluorescence labelled (L) c-objects acquired during the acquisition event (110)
- the one or more c-objects in the training sample (102) may have been labelled with a live cell fluorescence label (L) and at least one morphological fluorescence label (M), and
- a processing method (200) for highlighting one or more cellular objects, c-objects, in a test Brightfield, BF, image (212), comprising:
- an assay for determining viability of a population of one or more c-objects that are single cells and/or assemblies of cells in a test sample (202), comprising:
- an assay for determining velocity of c-objects of a population of one or more c-objects that are single cells and/or assemblies of cells in a test sample (202), comprising:
- an assay for determining fusion of c-objects of a population of one or more c-objects that are single cells and/or assemblies of cells in a test sample (202), comprising:
- an assay (label-free) for determining splitting of c-objects of a population of one or more c-objects that are single cells and/or assemblies of cells in a test sample (202), comprising:
- a screening method for determining an effect of one or more potential active agents on a test sample (202) containing a population of one or more c-objects that are single cells and/or assemblies of cells comprising:
- a screening method for determining a resistance to a therapeutic effect of one or more potential active agents on a test sample (202) containing a population of one or more c-objects that are assemblies of cells comprising:
- the terms "one or more” or “at least one”, such as one or more or at least one member(s) of a group of members, is clear per se, by means of further exemplification, the term encompasses inter alia a reference to any one of said members, or to any two or more of said members, such as, e.g ., any ⁇ 3, ⁇ 4, ⁇ 5, ⁇ 6 or ⁇ 7 etc. of said members, and up to all said members.
- the trained PM is for highlighting cellular objects (c-objects) in a test Brightfield (BF) image of a test sample of c-objects acquired using a microscope having at least a BF acquisition mode.
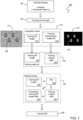
- Training method (100) comprises receiving a plurality of training data sets (120). Each training data set (110) is captured from a training sample (102). Each training data set (110) comprises a training Brightfield (BF) image (112, 112') of the training sample (102) and training c-object data (124) of the training sample (102). The training sample (102) comprises one or more c-objects that have been labelled with one or more fluorescent labels. Both the training BF image (112, 112') and training c-object data (124) are obtained from an acquisition event (110) of a training microscope (104).
- An acquisition event (110) is a capture by the training microscope (104) of a plurality of images simultaneously or near-simultaneously such the position and orientation of the one or more c-objects in both images is the same.
- One image of the plurality is the training BF image (112, 112'), and another other image of the plurality is a training fluorescent image (114). Any further training fluorescent images (114) captured during the acquisition event (110) constitute further images in the plurality.
- the training c-object data (124) is generated automatically from one or more training fluorescent images (114, 114') captured during the acquisition event (110).
- At least one of the fluorescent labels in the training sample (102) may be a live cell fluorescent label that highlights only c-objects (all types, or specific types) and in any state.
- an input to the PM (132) is the training BF image (122) of the data training set (120), and an output to the PM is processed training BF image data (134).
- the processed training BF image data (134) is compared with the training c-object data (124) of the training data set (120).
- the PM (132) is adjusted so that the outputted processed training BF image data (134) approaches the training c-object data (124) of the training set (120).
- the processed training BF image data (134) output of the predictive model (134) may comprise a probability map image.
- the c-object data (124) may comprise the training fluorescent image (114, 114'); the processed training BF image data (134) will during training, approach the training fluorescent image (114, 114'). In other words, the fluorescent image (114, 114') is ground truth.
- the c-object data (124) may comprise the training fluorescent image (114, 114') and one or more c-object parameter labels (114B', 114BC', 114D'); the processed training BF image data (134) will during training, approach the training fluorescent image (114, 114') and one or more c-object parameter labels (114B', 114BC', 114D') - this is described in more detail elsewhere herein ( e.g . see FIG. 2 ).
- a c-object (206) in the Brightfield image (206) becomes a "fluorescently stained” c-object (254) in the primary output image (252) by application of the processing method (200).
- One or more properties of the c-object (254) in the primary output image (252) e.g. intensity, area, shape, size
- properties of the c-object (254) in the primary output image (252) correspond to the properties of same c-object (206) in the Brightfield image (206) as if it had been fluorescently stained by a fluorescent label and fluorescently imaged.
- Highlighting may include setting the background to a monotone, such as black, or white, or another colour. Highlighting may typically include replacing the original regions of the training or test BF image (112', 212') indicating c-objects (106, 206) with regions of similar relative size, shape and orientation; the shading of each c-object may be different compared with the BF image (112', 212') attributable to the shading present in the training fluorescent images (114, 114') and is caused by the fluorescent label.
- the shading of the c-object may be indicative of fluorescent intensity.
- FIG. 1 for instance, the c-objects (106) in the training BF image (112') are replaced by highlighted c-objects (116) in the training fluorescent image (114').
- the c-objects (206) in the test BF image (212') are replaced by highlighted c-objects (254) in the primary output image (252) of the trained PM output (250).
- the training Brightfield image (112, 112') might be an unprocessed image, or might be processed in a number of ways standard in the art, for instance it may be randomly resized to different scales, and/or cropped into section e.g . 128 pixel by 128 pixel sections, and/or introduced to noise via a gaussian blur or salt/pepper noise, and/or randomly flipped and rotated.
- a principal advantage of the training method (100) is that the training c-object data (124) is automatically generated from the one or more training fluorescence images (114). The requirement for user intervention is minimised.
- c-objects had to be identified manually based on the image, or using additional segmentation software to separate objects from the background based on the image.
- artefacts present in the image such as debris, air bubbles and shadows giving rise to error in both manual and traditional automatic methods.
- an image of highlighted c-objects is empirically obtained automatically thereby reducing processing time for production of the training data. Reduction in processing times is important because a typical BF image of a sample c-objects may contain hundreds to thousands of c-objects.
- the training BF image (112) is identical to the training fluorescent image (114), hence the training fluorescent image (114) is a superior ground truth, leading to more accurately trained PM (240).
- the fluorescent greyscale image of a c-object provides different and more simplified information compared with the Brightfield image of a c-object, which simplifies the training and test output, reducing processing times.
- the simplified training and test output provides a simplified representation of a c-object that reduces any further processing steps.
- test refers to the sample, images, data and microscope of a sample under investigation whose image is to be processed.
- the test sample contains one or more c-objects that are to be characterised.
- the test sample is a culture.
- the test sample may be a co-culture.
- training refers to the sample, images, data and microscope of a sample used in the training data set.
- the training sample is a culture.
- the training sample may be a co-culture.
- the sample (test and training) contains one or more, preferably a plurality of cellular objects (c-objects).
- the sample is a cell culture.
- the sample may be a co-culture.
- the one or more c-objects may be single cells or assemblies of cells such as organoids or spheroids.
- Samples containing a culture of single cells is sometimes call a 2D cell culture.
- Samples containing a culture of organoids or spheroids is sometimes called a 3D cell culture.
- a sample that is a culture may contain tens, hundreds to thousands of c-objects that are single cells.
- a sample that is a culture may contain 1 to hundreds of c-objects that assemblies of cells such as organoids or spheroids.
- the sample (test and training) may contain the same class of c-objects (e.g. all organoids, or all single cells).
- the sample (test and training) may contain a mixture of different c-objects classes (e.g
- the sample may be a mono-culture of c-objects of the same type (e.g. all organoids/spheroids).
- the sample may be a co-culture of c-objects of two or more different types (e.g. organoids together with fibroblasts, or with immune cells or with endothelial cells).
- a c-object may be of a certain type (known as "type” herein) that can be detected by a fluorescence label (see later below).
- type a certain type
- a non-exhaustive types include patient-derived organoids, cancer cells (single or assemblies of), cancer-associated fibroblasts, immune cells, endothelial cells.
- a c-object may have a certain state (known as "state” herein) that can be detected by a fluorescence label (see later below).
- states include dead, apoptotic, senescent, undergoing Epithelial to mesenchymal transition (EMT).
- EMT Epithelial to mesenchymal transition
- the one or more c-objects may be fluorescently labelled with a live cell fluorescent label that highlights only c-objects, all of them, and in any state. It is a universal label. It allows the shape of the c-object to be fluorescently imaged. Debris is not labelled and non-cellular objects are not labelled.
- a live cell fluorescent label may be denoted Fluorescent label (L).
- the live cell fluorescent label may be used to generate a primary output image (252) (described later below). Examples of live cell fluorescent labels include nucleic acid dyes including the Hoechst series of fluorescent dyes ( e.g .
- Caspase 3/7 green marker for cellular senescence (e.g. measure B-galactosidase activity, e.g. CellEvent TM Senescence Green Flow Cytometry Assay Kit ThermoFisher), marker for Epithelial to mesenchymal transition (EMT) (BioTracker TM TiY Vimentin Live Cell Dye Merck).
- EMT Epithelial to mesenchymal transition
- One c-object state may be accompanied by a difference in morphology compared to other states.
- the fluorescent label may be an additive that is added to the c-object, and contact of the additive with a c-object causes binding and fluorescent labelling of the c-object; this may be called a transient fluorescent label.
- Examples include the Hoechst series of fluorescent dyes.
- the fluorescent label may be introduced into the c-object by cloning of a gene (e.g . viral transduction) that expresses a fluorescent label or that expresses a tag that reacts with one or more other substances to produce fluorescence; this may be called a stable fluorescent label. Examples include NucLight/Cytolight Red/Green Lentivirus Reagent (Sartorius).
- the microscope (test and training) has at least a Brightfield (BF) imaging mode, for acquisition of a Brightfield image of the sample.
- the image may be a static image, or a part of a moving image (real-time acquisition).
- the training microscope and optionally the test microscope also has a fluorescence imaging mode for acquisition of a fluorescence image of the sample.
- both BF imaging mode and fluorescence imaging mode are present, the microscope is configured to capture both image types in an acquisition event.
- An acquisition event is a capture by the microscope of a plurality of images simultaneously or near-simultaneously such the position and orientation of c-objects in both images is the same.
- the delay between separate captures is in an order of tens of milliseconds.
- the fluorescence imaging mode may operate at a plurality of different wavelengths or channels, in order to capture selectively different fluorescent images at different emission wavelength bands (e.g . blue, green and red).
- the microscope may be configured to capture a Brightfield image, and a first fluorescent image at a first excitation and/or emission wavelength band, and an optional second fluorescent image at a second excitation and/or emission wavelength band, and optional further fluorescent images at a further excitation and/or emission wavelength bands in an acquisition event.
- the training microscope and/or the test microscope may further have a luminescence measurement mode for measurement of luminescence of the sample.
- the microscope is configured to capture the BF image and luminescence and optional fluorescence image in an acquisition event.
- the training microscope is used for capture of images used for training of the PM.
- the test microscope is used for capture of images used for the imaging processing method or method for characterising cellular objects (c-objects).
- the training microscope and the test microscope may be the same or different.
- Example of a suitable microscope includes the Tecan Spark Cyto.
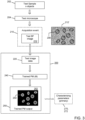
- a further exemplary method (100) for training the PM is shown schematically in FIG. 2 , involving 2 or more distinct fluorescent labels, one of which is used to generate c-object parameter labels.
- the PM is trained using a plurality of training data sets (110). Each training data set (110) is captured from a training sample (102). Each training data set (110) comprises a training Brightfield (BF) image (112, 112') of the training sample (102) and training c-object data (124) of the training sample (102).
- the training sample (102) comprises one or more c-objects that have been labelled with two or more distinct fluorescent labels (e.g . L and M, optionally also M1 and M2).
- Both the training BF image (112) and training c-object data (124) are obtained from an acquisition event (110) of the training microscope (104).
- An acquisition event (110) as mentioned earlier is a capture by the training microscope (104) of a plurality of images simultaneously or near-simultaneously such the position and orientation of c-objects in both images is the same.
- One image of the plurality is the training BF image (112)
- another image of the plurality is a training fluorescent image having absorption/emission profile L (114A) (attributed to Fluorescent label L)
- another image of the plurality is a training fluorescent image having absorption/emission profile M (114B) (attributed to Fluorescent label M).
- Further training fluorescent images e.g.
- the training c-object data (124) is determined from two or more training fluorescent images (114A, 114B, 114C, 114D) captured during the acquisition event.
- At least one of the fluorescent labels (e.g . L) in the training sample (102) may be a live cell fluorescent label that highlights only c-objects, all of them, and in any state.
- the live cell fluorescent label is used in the training fluorescence image (L) (114A) of the training c-object data (124). Examples of live cell fluorescent labels are listed elsewhere herein.
- the c-object parameter label (114B', 114C', 114D') corresponds to the function of the morphological fluorescent label (e.g. dead, apoptotic, senescent, undergoing Epithelial to mesenchymal transition (EMT)).
- At least one fluorescent label is a morphological fluorescent label (generating the primary output image (252) (channel 1)) and the other is a fluorescent label (generating the c-object parameter channel (256) (channel 2)).
- an input to the PM (132) is the training BF image (122) of the data training set (120), and an output to the PM is processed training BF image data (134).
- the processed training BF image data (134) is compared with the training c-object data (124) of the training data set (120).
- the training c-object data (124) comprises the training fluorescent image (114A) and one or c-object parameter labels (114B', 114C', 114D').
- the PM (132) is adjusted so that the outputted processed training BF image data (134) approaches the training c-object data (124) of the training set (120).
- the processed training BF image data (134) will during training, approach the training fluorescent image (114A) and the one or more c-object parameter labels (114B', 114C', 114D').
- test image data (220) comprising a Brightfield image (212, 212') of a test sample (202).
- the c-objects do not need to be labelled with a live cell fluorescent label.
- the trained PM output (250) may comprise a primary output image (252) corresponding to the test image (212, 212') in which the c-objects (254) have been highlighted.
- the primary output image (252) is generated as a result of training the PM using training samples (102) in which the c-objects have been labelled with the live cell fluorescent label. It is appreciated that trained PM that has been trained using samples (102) in which the c-objects have been labelled with both a live cell fluorescent label and a morphological fluorescent label will still produce a primary output image (252).
- the primary output image (252) may be outputted in a 1 st channel (channel 1). An example of the primary output image (252) is shown in FIGs. 3 and 4 .
- the trained PM output (250) may further comprise one or more c-object parameter channels (256). These may be termed channel 2, channel 3, etc.
- a c-object parameter channel (256) a c-object parameter label (256) or probability that the c-object parameter label (256) is true may be marked in a location corresponding to that c-object in the primary output image (252), or in an equivalent way.
- the c-object parameter channels (256) are generated as a result of training the PM using training samples (102) in which the c-objects have been labelled with the morphological fluorescent label in addition to the live cell fluorescent label.
- An example of a c-object parameter channel (256) is shown in FIG. 4 .
- the c-object data (124) may comprise a parameterised representation of the training fluorescent image (114, 114').
- parameterised representation it is meant that the training fluorescent image (114, 114') is pre-processed into a set of representational parameters defining the c-objects in the training fluorescent image. Accordingly, representational parameters replace the training fluorescent image (114, 114'). Examples of representational parameters include number of c-objects, size of each c-object, orientation of each c-object, shape of each c-object, intensity of each c-object).
- the processed training BF image data (134) will during training (130), approach the parameterised representation of the training fluorescent image (114, 114').
- the training c-object data (124) is automatically generated from each training fluorescence image (114, 114', 114A, 114B, 114C, 114D).
- the training c-object data (124) contains the training fluorescence image (114, 114', 114A) ( e.g . FIGs. 1 and 2 )
- the training fluorescence image (114, 114', 114A) is automatically generated during the acquisition event because the c-objects have been fluorescently labelled, usually with a live cell fluorescent label (L), in the training sample.
- L live cell fluorescent label
- a training sample containing one to tens to thousands of c-objects thus automatically generates c-object training data (124) that contains images of highlighted c-objects devoid of background, debris, fibres, artefacts, and air bubbles.
- the training c-object data (124) contains c-object parameter labels (114B', 114C', 114D') ( e.g. FIG. 2 )
- the c-object parameter labels may be automatically generated from the corresponding further training fluorescent image (114B, 114C, 114D) (usually with a morphological fluorescent label (M)) because it contains highlighted c-objects with background, debris, fibres, artefacts, and air bubbles filtered out by pre-processing.
- M morphological fluorescent label
- a numeric probability that the highlighted c-object is attributed to a function of morphological fluorescent label can be automatically generated for each highlighted c-object in the training fluorescent image (114B, 114C, 114D) based on parameters such as intensity.
- a sample containing one to tens to thousands of c-objects thus automatically generates training data that is a probability for each c-object, devoid of interference from background, debris, fibres, artefacts, and air bubbles.
- protocols or software for automatic generation of the c-object parameter labels includes ImageJ, FIJI, Cell Profiler Analyst, Icy.
- the processing method (200) is for highlighting one or more c-objects in the test image.
- the c-objects in the test image may be single cells or assemblies of cells ( e.g . organoids, spheroids).
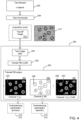
- An exemplary processing method is shown in FIG. 3 .
- the processing method (200) comprises receiving test image data (220) containing the test BF image (212, 212') of a test sample (202) acquired during an acquisition event (210) by the test microscope (204) in BF acquisition mode.
- the test sample (202) contains cellular objects (c-objects) (206), and the Brightfield (BF) test image (212, 212') is obtained by a test microscope (204) having at least a BF acquisition mode.
- the c-objects in the test image (212, 212') do not need to be fluorescently labelled.
- the processing method (200) comprises processing the test image data (220) using the trained predictive model (PM) (240) described herein.
- the trained predictive model (PM) (240) produces a trained PM output (250).
- the trained PM output (250) may comprise a primary output image (252) corresponding to the test image (212, 212') in which the c-objects (254) have been highlighted (channel 1).
- a principal advantage of the processing method (200) is that c-objects are highlighted from a Brightfield image without the need for fluorescent labels.
- Live cell fluorescent labels e.g. Hoechst - a DNA binder
- a typical sample may contain hundreds to thousands of c-objects; the label-free highlighting allows monitoring of growth and mobility of a population.
- the effect of one or more potential active agents on growth and/or mobility can also be determined without fluorescent labels.
- the processing method (200) may be for highlighting one or more c-objects in the test image, in addition to an indication of a state of one or more c-objects.
- the one or more c-objects in the test image may be single cells or assemblies of cells (e.g. organoids, spheroids).
- the PM (240) has been trained with training c-object data (120) comprising both the training fluorescence image (114A) and c-object parameter labels (114B', 114C', 114D'), as shown, for instance, in FIG. 2
- the trained PM output (250) may comprise a primary output image (252) and one or more c-object parameter channels (256) indicative of the c-object state.
- An example of such a processing method (200) is shown in FIG. 4 .
- the indication of the state of c-objects include a probability of the c-object having certain state.
- the processing method (200) comprises receiving test image data (220) containing a test BF image (212, 212') of a test sample (202) acquired during an acquisition event (210) the BF acquisition mode.
- the test sample (202) contains one or more cellular objects (c-objects) (206), wherein the test image (212, 212') is obtained by a test microscope (204) having at least a Brightfield (BF) acquisition mode.
- the c-objects in the test image (212, 212') do not need to be fluorescent labelled.
- the processing method (200) comprises processing the test image data (220) using the trained predictive model (PM) (240) described herein.
- the trained predictive model (PM) (240) produces a trained PM output (250).
- the trained PM output (250) may comprise a primary output image (252) corresponding to the test image (212, 212') in which the c-objects (254) have been highlighted (channel 1).
- the trained PM output (250) may further comprise a c-object parameter channel (256) (channel 2).
- the output image (252) obtained from the trained PM (240) was generated from the training fluorescence image (114A) in which c-objects are labelled with fluorescent label (L) - a live cell fluorescent label.
- the c-object parameter channel (256) obtained from the trained PM (240) was generated from the training fluorescence image (114B) in which c-objects were labelled with fluorescent label (M) - a morphological cell fluorescent label.
- a combination (257) of the primary output image (252) and the c-object parameter channel (256) may be generated.
- a principal advantage of the processing method (200) is that the state of c-objects in the sample can be determined without the need for addition of a morphological fluorescent label in the test sample.
- a morphological fluorescent label might affect the functioning of c-objects.
- a typical sample may contain hundreds to thousands of c-objects; the label-free highlighting allows monitoring of the c-object state of a population.
- the effect of one or more potential active agents on c-object state can also be determined without fluorescent labels.
- the processing methods (200) described herein may be applied at one or more time points to a test sample (202); typical applications include monitoring of c-object growth.
- the processing methods (200) may be applied at regular intervals such as hourly, or several time a day for one or several days.
- the processing method (200) may be applied in continuously (real-time) to a test sample (202) to obtain moving images; typical applications include monitoring of c-object mobility (e.g. velocity, merging events, splitting event).
- the processing methods (200) described herein may be used for determining one or more characterising parameters (270) of the one or more c-objects in the test sample (202) ( FIGs. 3 , 4 ).
- the test sample may be a culture.
- the test sample may be a co-culture.
- the c-objects may be cancer cells or cancer-related cells.
- the characterising parameters may be determined for each c-object in the test image, and/or for the population of c-objects in the test image.
- the characterising parameters (270) may be used in subsequent assays and screening methods.
- the characterising parameters (270) may be categorised into different sub-groups, for instance, primary characterising parameters (272), specific characterising parameters (274), and derivative characterising parameters.
- Primary characterising parameters (272) may be determined from the primary output image (252) ( FIGs. 3 , 4 , 5 ). These include but are not limited to: c-object count, c-object location, c-object orientation, c-object shape, area of an individual c-object, mean area of a c-object, total area of all c-objects in the primary output image (252), intensity of an individual c-object, mean intensity of a c-object, and total c-object intensity all c-objects in the primary output image (252).
- the Primary characterising parameters (272) can be determined from the primary output image (252) by standard image processing techniques such as connected component analysis and measuring region properties.
- Specific characterising parameters (274) may be determined from the one or more c-object parameter channels (256) ( FIG. 4 ) or from a fluorescent label added to the test sample ( FIGs. 5 and 6 ). Specific characterising parameters (274) depend on the function of the morphological fluorescent label used during training of the PM or added to the test sample (202). Examples of specific characterising parameters include ( e.g. detection of state: cell death (e.g. Cytotox green/red, CellTox green), cell apoptosis ( e.g. Caspase 3/7 green), cellular senescence ( e.g. measure B-galactosidase activity, e.g . CellEvent TM Senescence Green Flow Cytometry Assay Kit ThermoFisher), Epithelial to mesenchymal transition (EMT) (BioTracker TM TiY Vimentin Live Cell Dye Merck).
- EMT Epithelial to mesenchymal transition
- c-objects cellular objects
- a test sample (202) comprising a one or more (e.g. a plurality) of c-objects, the method comprising:
- the one or more c-objects in the test sample do not need to be fluorescently labelled.
- the predictive model was trained using a training sample (102) where the c-objects were fluorescently labelled with a live cell fluorescent label (L) to produce a fluorescent training image (114) ( FIG. 1 ).
- Characterising parameters obtained from the primary output image (252) include primary characterising parameters (272) ( FIG. 3 ).
- Characterising parameters (270) obtained from the primary output image (252) include primary characterising parameters (272), and characterising parameters (270) obtained from the specific output image (256) include specific characterising parameters (274) ( FIG. 4 ).
- the test sample (202) may contain a mono-culture of c-objects (e.g . single cells, assemblies of cells).
- the test sample may contain a co-culture of c-objects (e.g . label-free patient-derived organoids and label-free cancer-associated fibroblasts (training sample (102) labelled with live cell fluorescent label (L) and training sample (102) labelled with a different live cell fluorescent label (L) to produce primary output image (252)).
- c-objects cellular objects
- a test sample (202) comprising a one or more ( e.g . a plurality of) c-objects, the method comprising:
- the c-objects in the test sample are fluorescently labelled.
- the fluorescent label may be a live cell fluorescent label, or a morphological fluorescent label.
- the predictive model was trained using a training sample (102) where the c-objects were fluorescently labelled with a live cell fluorescent label (L) to produce a fluorescent training image (114) ( FIG. 1 ).
- Characterising parameters obtained from the primary output image (252) include primary characterising parameters (272) ( FIG. 5 ).
- Characterising parameters (270) obtained from the primary output image (252) include primary characterising parameters (272), and characterising parameters (270) obtained from the specific output image (256) include specific characterising parameters (274) ( FIG. 6 ).
- Additional characterising parameters (270) including primary (272) or specific (274) characterising parameters (270) - depending on the fluorescent label (M', S') in the test sample (202) - are determined from the test fluorescent image (214) ( FIGs. 5 and 6 ).
- the test sample (202) may contain a mono-culture of c-objects (e.g . single cells, assemblies of cells).
- the test sample may contain a co-culture of c-objects (e.g . patient-derived organoids (training sample (102) labelled with live cell fluorescent label (L) to produce primary output image (252)) and cancer-associated fibroblasts labelled with a live cell fluorescent label (L)).
- c-objects e.g . patient-derived organoids (training sample (102) labelled with live cell fluorescent label (L) to produce primary output image (252)
- cancer-associated fibroblasts labelled with a live cell fluorescent label (L)
- the one or more characterising parameters determined of the one or more c-objects in the test sample (102) may be applied in different assays, for instance, to determine viability, death, growth, viable growth, velocity, fusion, splitting of c-objects in the test sample.
- the test sample may be a culture.
- the c-objects may be cancer cells or cancer-related cells.
- one or more of the assays may be used in a screening method for a potential active agent. Exemplary assays are shown in FIGs. 3 to 6 .
- the processing method (200) may be used herein to determine a viability of a population of one or more c-objects that are single cells and/or assemblies of cells (e.g . organoid, spheroid) in a test sample (202).
- the inventors have found a close correlation between the total or mean area of highlighted c-objects in the primary output image (252) and viability (see FIG. 11 C) ; the correlation applies to assemblies of cells ( e.g . organoid, spheroid).
- the inventors have also found a close correlation between the count of highlighted c-objects in the primary output image (252) and viability (see FIG. 11 A) ; the correlation applies to single cells.
- Viability as used herein means the portion of a population of c-objects that are functioning.
- An indicator of functioning is ATP generation.
- the processing method shown in FIG. 3 may exemplarily be applied.
- the processing methods shown in FIGs. 4 and 5 (making use of fluorescent label) - which also produce a primary output image (252) - may also be applied.
- an assay for determining viability of a population of one or more c-objects that are single cells and/or assemblies of cells in a test sample (202), comprising:
- the total or mean area of all c-objects is normalised to a vehicle (100% viability) and 100% cell death control (0% viability, e.g. control sample of c-objects containing staurosporine) to account for the area taken up by dead c-objects in the Brightfield image.
- the vehicle is typically a solvent (e.g . used to dissolve a potential active agent such as DMSO and/or PBS)).
- a potential active agent such as DMSO and/or PBS
- the viability is determined without need for a fluorescent label of cell death in the test sample.
- an assay for determining viability (normalised) of a population of one or more c-objects that are single cells in a test sample (202), comprising:
- the count of c-objects is normalised to a vehicle (100% viability) and 100% cell death control (0% viability, e.g . control sample of c-objects containing staurosporine) to account for the counts taken up by dead c-objects in the Brightfield image.
- the viability (normalised) is determined without need for a fluorescent label of cell death in the test sample.
- Viability may be determined using a fluorescent label in the test sample (202) to measure cell death.
- An exemplary scheme is shown in FIG. 5 .
- the morphological fluorescent label for cell death may be any, for instance, Cytotox green, Cytotox red, CellTox green.
- the trained predictive model (240) used in the processing method (200) was preferably trained using training samples (102) comprising c-objects labelled with a live cell fluorescent label.
- Viability (corrected) may be determined without any fluorescent label in the test sample (202).
- An exemplary scheme is shown in FIG. 4 .
- the viability (corrected) of single cells is determined without need for a fluorescent label of cell death in the test sample.
- the morphological fluorescent label for cell death used during PM training may be any, for instance, Cytotox green, Cytotox red, CellTox green.
- the processing method (200) may be used herein to determine a death of a population of one or more c-objects that are single cells and/or assemblies of cells (e.g . organoid, spheroid) in a test sample (202).
- Death as used herein means the portion of a population of c-objects that are non-functioning.
- An indicator of non-functioning is a breach of the cell-wall (e.g . lysis, apoptosis).
- the processing methods shown in FIGs. 4 and 5 may exemplarily be applied.
- Death may be determined using a fluorescent label in the test sample (202) to measure cell death.
- An exemplary scheme is shown in FIG. 5 .
- Death is determined from primary characterising parameters (272) obtained from primary output image (252) and specific characterising parameters (274) obtained from test fluorescence image (214, 214').
- the above parameters may be normalised to a vehicle (0% cell death) and 100% cell death control (e.g. staurosporine).
- the morphological fluorescent label for cell death may be any, for instance, Cytotox green, Cytotox red, CellTox green.
- the trained predictive model (240) used in the processing method (200) was preferably trained using training samples (102) comprising c-objects labelled with a live cell fluorescent label.
- Death may be determined without any fluorescent label in the test sample (202).
- An exemplary scheme is shown in FIG. 4 .
- the death of single cells is determined without need for a fluorescent label of cell death.
- the morphological fluorescent label for cell death used during PM training may be any, for instance, Cytotox green, Cytotox red, CellTox green.
- the processing method (200) may be used herein to determine a growth (proliferation) of a population of one or more viable c-objects (viable growth) that are single cells and/or assemblies of cells ( e.g . organoid, spheroid) in a test sample (202).
- Viable growth as used herein means the growth rate among the portion of a population of c-objects that are viable. Dead c-objects are screened out by the assay, leading to a more accurate assay.
- An indicator of viable growth is increase in morphological size among functioning c-objects.
- An indicator of functioning is ATP generation.
- Viable growth may be determined from area of an individual c-object, mean area of a c-object, and/or from total area of all c-objects in the primary output image (252).
- the processing methods shown in FIGs. 4 and 5 may exemplarily be applied.
- Viable growth may be determined using a fluorescent label in the test sample (202) to measure cell death.
- An exemplary scheme is shown in FIG. 5 .
- the morphological fluorescent label for cell death may be any, for instance, Cytotox green, Cytotox red, CellTox green.
- the trained predictive model (240) used in the processing method (200) was preferably trained using training samples (102) comprising c-objects labelled with a live cell fluorescent label.
- the processing method (200) may be used herein to determine a growth (proliferation) of a population of one or more viable c-objects that are assemblies of cells ( e.g . organoid, spheroid) in a test sample (202).
- Growth as used herein means the growth rate among the population of c-objects.
- An indicator of growth is increase in morphological size among functioning c-objects. Growth may be determined from area of an individual c-object area, mean area of a c-object, and/or from total area of all c-objects in the primary output image (252).
- the processing method shown in FIG. 3 (fluorescent label-free) may exemplarily be applied.
- the processing methods shown in FIGs. 4 and 5 making use of fluorescent label) are not excluded as they also produce a primary output image (252).
- Growth may be determined without any fluorescent label in the test sample (202).
- An exemplary scheme is shown in FIG. 3 .
- the trained predictive model (240) used in the processing method (200) was preferably trained using training samples (102) comprising c-objects labelled with a live cell fluorescent label.
- the processing method (200) may be used herein to determine velocity of one or more c-objects that are single cells and/or assemblies of cells (e.g . organoid, spheroid) in a test sample (202).
- Velocity as used herein means the change in distance (and direction) over time for c-objects in the population. The velocity may be determined by tracking the movement path over time for individual c-objects. The velocity may be averaged over the population. C-objects that exhibit no movement may or may not be included in the average. Velocity may be an indicator of Epithelial to mesenchymal transition (EMT), invasion/migration, aggression, or activation of immune cells or fibroblasts.
- EMT Epithelial to mesenchymal transition
- FIG. 3 fluorescent label-free
- FIGs. 4 and 5 making use of fluorescent label
- an assay for determining velocity of one or more single cells and/or assemblies of cells e.g. organoid, spheroid
- a test sample e.g. organoid, spheroid
- an assay for determining velocity of one or more single cells and/or assemblies of cells e.g. organoid, spheroid
- a test sample e.g. organoid, spheroid
- the tracking of highlighted c-objects may be performed using standard image tracking software, tracking software examples include FIJI, Velocity, TrackMate.
- the processing method (200) may be used herein to determine fusion of c-objects that are single cells and/or assemblies of cells (e.g . organoid, spheroid) in a test sample (202).
- Fusion as used herein means an event in which previously separate c-objects move towards each other and join together to form a single c-object ( e.g . 2 cells becoming 1 fused cell).
- the fusion may be determined by tracking the movement path over time for individual c-objects.
- the fusion may be averaged over the population. C-objects that exhibit no movement may or may not be included in the average.
- Fusion may be an indicator of Epithelial to mesenchymal transition (EMT), invasion/migration, aggression, or activation of immune cells or fibroblasts.
- EMT Epithelial to mesenchymal transition
- FIGs. 4 and 5 making use of fluorescent label
- an assay for determining fusion of single cells and/or assemblies of cells e.g. organoid, spheroid
- a population in a test sample comprising:
- an assay for determining fusion of single cells and/or assemblies of cells e.g. organoid, spheroid
- a population in a test sample comprising:
- a fusion event may be recorded when the movement paths of two or more highlighted c-objects (254) converge and join, and remain joined.
- the tracking of highlighted c-objects (254) may be performed using standard image tracking software.
- edges are derived from nearest neighbor matches of objects in sequential timepoints within a threshold distance.
- a greedy assignment is made to those edges.
- Each set of edges above a specified length e.g . 3 is a track.
- Objects that do not have an assigned edge after greedy assignment may be assigned to an object with an existing edge if the area of that child (fused) object is above 0.8 the sum of the parent objects being merged. If this edge can be made, the edge formed under this may be considered a fusion event.
- the processing method (200) may be used herein to determine splitting of c-objects that are single cells and/or assemblies of cells (e.g . organoid, spheroid) in a test sample (202).
- Splitting as used herein means an event in which a previously a singular c-object divides into two or more separate c-objects that move away from other (e.g . 1 cell becoming 2 separate cell).
- the splitting may be determined by tracking the creating of new movement path over time for a singular c-object.
- the splitting may be averaged over the population. C-objects that exhibit no movement may or may not be included in the average.
- Splitting may be an indicator of Epithelial to mesenchymal transition (EMT), invasion/migration, or aggression.
- EMT Epithelial to mesenchymal transition
- an assay for determining splitting of single cells and/or assemblies of cells e.g. organoid, spheroid
- a population in a test sample comprising:
- an assay for determining splitting of single cells and/or assemblies of cells e.g. organoid, spheroid
- a population in a test sample comprising:
- a splitting event may be recorded when movement path of a highlighted c-object (254) branches into two more separate paths.
- the tracking of highlighted c-objects (254) may be performed using standard image tracking software.
- edges are derived from nearest neighbor matches of objects in sequential timepoints within a threshold distance.
- a greedy assignment is made to those edges.
- Each set of edges above a specified length e.g . 3 is a track.
- Objects that do not have an assigned edge after greedy assignment may be assigned to an object with an existing edge if the area of that child objects are less the sum of the parent object being split. If this edge can be made, the edge formed under this may be considered a splitting event.
- the assays may be used in a screening method for a potential active agent.
- the screening method may be for determining an effect of a potential active agent, an efficacy of a potential active agent, a resistance to treatment with a potential active agent, identifying a potential active agent, or determining other properties relating to a potential active agent.
- the potential active agent is intended to affect a characterising parameter of a c-object.
- the assay may involve a measurement of one of more characterising parameters (e.g . primary, specific, derivative).
- the assay be a measurement of viability (general, normalised, corrected), death, growth, velocity, fusion, splitting.
- the screening method typically compares an assay performed in the absence of potential active agent with an assay performed in the presence of potential active agent (usually at varying concentrations).
- the test sample may be a culture or co-culture; hence one or more c-objects may be cultured during the screening.
- the one or more c-objects may be cancer cells or cancer-related single cells or assemblies of cells (organoids or spheroids).
- the assays may be performed continuously (real time) or at discrete time points.
- the screening method may be on multiple test samples held on multi-well plates (e.g. 384 well).
- the potential active agent may be an anti-cancer (e.g . tumour) agent.
- a screening method for determining an effect of one or more potential active agents on a test sample (202) containing a population of one or more c-objects that are single cells and/or assemblies of cells (e.g . organoid, spheroid) comprising:
- a screening method for determining an effect of one or more potential active agents on a population of one or more c-objects that are single cells and/or assemblies of cells comprising:
- a screening method for determining an efficacy of one or more potential active agents in a test sample (202) containing a population of one or more c-objects that are single cells and/or assemblies of cells (e.g . organoid, spheroid) comprising:
- a screening method for determining an efficacy of one or more potential active agents on a population of one or more c-objects that are single cells and/or assemblies of cells comprising:
- a more efficacious potential active agent will exhibit an increased effect compared with a less efficacious potential active agent.
- a more efficacious potential active agent may exhibit for instance increased death, reduced growth, decreased velocity, decreased fusion, decreased splitting compared with a less efficacious potential active agent.
- a resistant c-object is one that exhibits a resistance to an (therapeutic) effect of one or more potential active agents.
- Patient-derived organoids contain a heterogeneous population of cells which may have different mutations. Some mutations may result in a reduced response to a potential active agent. These cells eventually grow again, leading to a relapse in a cancer patient.
- the present screening method identifies resistance ex vivo.
- a screening method for determining a resistance of c-objects that are single cells and/or assemblies of cells (e.g . organoid, spheroid) in a population to one or more potential active agents comprising:
- Resistant individual c-objects will exhibit a growth (i.e. growth rate) in the presence of the one or more potential active agents that is greater than an average of the growth of all c-objects in the population.
- the growth is measured from the change in c-object area in the primary output image (252) over time.
- a screening method for identifying resistant c-objects that are single cells and/or assemblies of cells (e.g . organoid, spheroid) in a population, which resistant c-objects show resistance to an effect of one or more potential active agents comprising:
- the mean growth has a mean growth standard deviation.
- the resistant c-objects may be identified when its individual growth is different from the mean growth by one or more mean growth standard deviations.
- the resistant c-object has a faster growth than the mean growth.
- the growth assay may be the viable growth assay or the growth assay described herein.
- a screening method for identifying one or more potential active agents effective against single cells and/or assemblies of cells e.g . organoid, spheroid
- a more effective potential active agent can be identified by an increased effect compared with a less effective potential active agent.
- a more effective potential active agent may exhibit for instance increased death, reduced growth, decreased velocity, decreased fusion, decreased splitting compared with a less effective potential active agent.
- the predictive model (PM) is preferably one built on the advances made by the UNET, feature pyramid and ResNet network architectures.
- the overall structure may contain convolutional blocks which reduce spatial size before being passed to the next block.
- the reduction may be accomplished by a convolutional layer with stride-2 instead of a down sampling function.
- skip connections are made between layers to speed up learning. Instead of summation skip connections that exist between intermediate layers, the present CNN network skips the output of all intermediate layers to a final convolutional layer.
- the training BR image (112) may not be inputted directly into the PM (132); it may be randomly resized to different scales, and/or cropped into 128 pixel by 128 pixel sections, and/or introduced to noise via a gaussian blur or salt/pepper noise, and/or randomly flipped and rotated.
- the some data training sets (120) may contain incorrect data, for instance, false positives (e.g . live cell fluorescently labelled objects in the training fluorescence image that are not c-objects) and/or false negatives (e.g . c-objects in the training BF image that have not been labelled in the training fluorescence image).
- false positives e.g . live cell fluorescently labelled objects in the training fluorescence image that are not c-objects
- false negatives e.g . c-objects in the training BF image that have not been labelled in the training fluorescence image
- the CNN comprises shortcuts.
- the final block receives not just the output of the final standard block, but also resampled outputs of each standard block. This has been found to be optimal for biological application. Steps of back propagation - where errors in the PM are corrected so that the processed training BF image data (134) approaches the training c-object data (124) of the training set (120) - become more efficient.
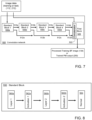
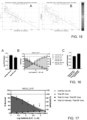
- FIG. 7 shows an exemplary convolution network (500) of 4 standard blocks (550a-d).
- the forward method of the convolutional network (500) comprises passing a training image (112) or a test image (212) sequentially through a plurality ( e.g . 4 or more) standard blocks (550a-d).
- Each standard block (550a-d) may halve the spatial dimensions via stride-2 convolution before being passed (510a-d) to the next standard block.
- the output (512a-d) of each standard block (550a-d) may also be resampled to the original input size and passed to the final block (520).
- All block outputs (512a-d, 510d) as well as the original image (112, 212) may be concatenated (522) at the final block (520).
- the final block may comprises a 1x1 convolution that produces the final output (Processed Training BF image (134) or Trained PM output (250)) with the correct number of output channels.
- FIG. 8 shows an exemplary standard block (550) having plurality of pairwise convolution layers (560a-c) and activation functions (562a-b); the convolution layer (560a-c) is first in the pair.
- the final step (564) of the standard block (550) is a range normalisation function. Data is passed sequentially through the sequence 560a, 562a, 560b, 562b, 564.
- Convolution layer 1 is 3x3 padded convolutional layer with stride-1.
- Activation function 1 is a non-linear activation function.
- Convolutional Layer 2 (560b) is a 3x3 padded convolutional layer with stride-2.
- Activation function 2 is a non-linear activation function.
- the final normalisation function is a range normalization function configured to normalise each output channel to range 0 to 1.
- the output of each standard block (550) is one half the size in X and Y dimensions from its input.
- the non-linear activation function (562a-b) is preferably a Leaky ReLU function.
- the Leaky ReLU function returns the original value if it is above 0 and 0.1 times the value if it is below zero.
- the Leaky ReLU has been shown to be an improvement over the standard ReLU function due to the existence of gradients below the zero cutoff which allow for continued back propagation. Thus acting as a solution for the "Dead ReLU" problem.
- the final step of the standard block (550) may be a Range Normalization Function (564).
- a Range Normalization may be used that that sets the minimum activation to 0 and divides by the maximum activation or 1.
- An exemplary range normalization function is shown in equation [2], where x is the activation values.
- this activation function enforces activation of range 0 to 1. Additionally, it has been shown that activation distributions are asymmetrical and highly skewed. As a result, the commonly used statistical batch normalization function which normalizes to a mean and standard deviation makes critical assumptions about symmetry that is unlikely to be true about the data and decrease performance.
- the predictive model functions as a detector rather than a classifier.
- argmax functions such as a SoftMax which force outputs of a network to converge towards a singular class to be 1 while all others are 0 cannot be used.
- loss functions which rely on argmax outputs such as Cross Entropy cannot not be used in favour of loss functions such as DICE which evaluate each class individually.
- a method described herein may be a computer implemented method.
- the method may be performed using a standard computer system such as an Intel Architecture IA-32 based computer system 2, and implemented as programming instructions of one or more software modules stored on non-volatile (e.g ., hard disk or solid-state drive) storage associated with the corresponding computer system.
- non-volatile e.g ., hard disk or solid-state drive
- at least some of the steps of any of the described processes could alternatively be implemented, either in part or in its entirety, as one or more dedicated hardware components, such as gate configuration data for one or more field programmable gate arrays (FPGAs), or as application-specific integrated circuits (ASICs), for example.
- FPGAs field programmable gate arrays
- ASICs application-specific integrated circuits
- a computing device or system configured for performing a method as described herein.
- a device program or computer program product having instructions which when executed by a computing device or system cause the computing device or system to perform a method as described herein.
- a computer readable medium having stored thereon instructions which when executed by a computing device or system cause the computing device or system to perform a method as described herein.
- a data stream representative of a computer program or computer program product having instructions which when executed by a computing device or system cause the computing device or system to perform a method as described herein.
- Tumor tissue and normal lung tissue were obtained from NSCLC undergoing curative surgery at the Antwerp University Hospital (UZA).
- Written informed consent was obtained from all patients, and the study was approved by the UZA Ethical Committee (ref. 17/30/339). All samples were registered in the Biobank Antwerp, Belgium; ID: BE 71030031000 .
- Tissue was stored in Ad-DF+++ (Advanced DMEM/F12 (GIBCO), with 1% GlutaMAX (GIBCO), 1% HEPES (GIBCO), 1% penicillin/streptomycin (GIBCO) supplemented with 2% Primocin (Invivogen) at 4°C and transported on ice to be processed within 24 hours for organoid culture according to the protocol of Dijkstra et al. with some minor differences. Tumor and normal tissue were minced with two scalpels, collected in 0.1% BSA precoated tubes and washed with PBS.
- Ad-DF+++ Advanced DMEM/F12
- GlutaMAX GlutaMAX
- HEPES 1% HEPES
- GIBCO penicillin/streptomycin
- fragments were dissociated with 0.5 mg/mL dispase type II (Sigma-Aldrich), 1.5 mg/mL collagenase type II (Sigma-Aldrich), 1:500 Primocin and 10 ⁇ M Y-27632 (Cayman Chemicals) in MG 2+ /Ca 2+ PBS (GIBCO) for 60 minutes at 37°C.
- Digested cells were washed three times with PBS and resuspended in 2/3 Cultrex Type 2 (R&D Systems) and 1/3 Full Lung Ad-DF+++ medium and plated in drops which were allowed to solidify for 30 minutes at 37°C after which they were overlayed with Full Ad-DF+++ medium.
- Full Ad-DF+++ medium consisted of 10% Noggin conditioned medium (HEK293-mNoggin-Fc; kindly provided by Hans Clever, Hubrecht Institute), 10% R-spondin-1 conditioned medium (293T-HA-Rspol-Fc; kindly provided by Calvin Kuo, Stanford University), 1 x B27 supplement (GIBCO), 10 mM nicotinamide (Sigma Aldrich), 25 ng/mM human recombinant FGF-7 (Peprotech), 100 ng/mL human recombinant FGF-10 (Peprotech), 500 nM A83-01 (Tocris), 1 ⁇ M SB202190 (Cayman Chemicals) and 5 ⁇ M Y-27632 (only used after passaging and thawing).
- organoids were digested to single cells with TrypLE Express (GIBCO).
- GEBCO TrypLE Express
- Cultrex Harvesting Solution R&D Systems
- GBCO Recovery Cell Culture Freezing Medium
- organoids were passaged as single cells using TrypLE and plated in Cultrex drops. Subsequently, organoids were harvested with Cultrex Harvesting Solution, collected in a 15 mL tubes coated with 0.1% BSA/PBS, washed with Ad-DF+++ and resuspended in 1 mL Full Ad-DF+++ medium (without Y-27632). Next the number of organoids were counted with the Sceptor 2.0 using a 60 ⁇ M sensor (Merck Millipore). Organoids were then diluted in Full Ad-DF+++ and 5% Cultrex on ice to a concentration that results in 500-2000 organoids/40 ⁇ L.
- Hoechst 33342 50 nM / well, ThermoFisher
- Cisplatin Tocris
- Carboplatin Selleckchem
- Dose-response curves plotted, and IC50-values were calculated using GraphPad Prism 9. Drug concentrations were transformed to log10 and raw data results were normalized to vehicle (100%) and/or baseline control (0%) (Staurosporin 5 ⁇ M or 100 ⁇ M cisplatin) for viability assessment, and vice versa for cell death assessment. Curves were fitted using the log (inhibitor/agonist) vs. normalized response - Variable slope function. Screen quality was determined by calculating the Z Factor score using the equation [3]: 1 ⁇ 3 ⁇ SD negative control + 3 ⁇ SD positive control average negative control ⁇ average postive control
- the training sample contained the organoids and single cells (c-object) as described above labelled with Hoechst 33342 (green), and the Brightfield image and the Hoechst fluorescence image captured by the Tecan Spark Cyto were used as the data training set.
- Software package Pytorch was used to modify the predictive model.
- Hoechst fluorescence image was ground truth (training c-object data).
- intensity values to be used against the predictions were pre-processed as a loss function.
- Raw Hoechst fluorescence images were first normalized from uint8 to float [0,1]. Subsequently, images were median filtered with a 3x3 kernel. Subsequently, images were saturation clipped and renormalized to 0.2 so that values equal to and greater than 0.2 were set to 1. Values between 0 and 0.2 where linearly scaled to 0 and 1.Saturation clipping rather than thresholding provided a benefit of maintaining soft probabilities, which minimised impact of poor threshold choice and provided gradients for learning by back propagation. As organoids increased in size and the total amount of Hoechst did not increase, the dye was distributed within the organoid, resulting in weaker signal over the course of growth; soft probabilities diminished this effect.
- a soft dice loss coefficient as defined in equation [4] was used as the basis for the loss function used in training.
- the dice coefficient is a commonly used accuracy metric for sematic segmentation. It is defined as intersection over union between ground truth and prediction values.
- a key attribute of soft coefficients are the ability to use values between 0 and 1 instead of binary pixel classifications.
- a dice loss is defined as 1 minus the buffered or smoothed dice coefficient.
- raw images were not fed into the CNN in the training phase. Instead, they were randomly resized to different scales, cropped into 128 pixel by 128 pixel sections, introduced to noise via a gaussian blur or salt/pepper noise, and finally randomly flipped and rotated.
- each epoch of the training phase the average loss for each input image was recorded and used as a weighting parameter for selection of that image in future epochs. Images that have not be trained yet have the highest priority and were selected first before repeats were selected. The rationale here is that prioritizing training on images in which performance is lowest will be the most effective.
- the weighted selection scheme also had a benefit of compensating for uneven distributions of image content. Overrepresented images may be first learned in early training cycles and then be suppressed in future training cycles.
- Images A1, B1... to F1 are all training BF images (112, 112'), and images A2, B2... to F2 are all corresponding training fluorescent images (114, 114') from different training samples A to F captured with the training microscope in an acquisition event.
- Each pair of training BF images and training fluorescent images (A1+A2; B1+B2. ... F1+F2) constitute a data training set (120).
- Images A3, B3... to F3 are probability map image outputs of the predictive model (134) for training samples A to F.
- a first sample contained a serial dilution of single cells and 3-day old organoids from two lines (NSCLC_013T and NSCLC_006N) prepared as described above.
- a test sample contained no fluorescent label.
- a control sample was labelled using Hoechst fluorescence (Hoechst 33342 (blue)).
- the Brightfield image (test sample) and the Hoechst fluorescence image (control sample) were captured by the Tecan Spark Cyto.
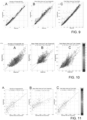
- the Brightfield image was processed using the method described herein, and the trained PM output was a primary output (BF) image (252). Pairwise comparison ( FIG. 9 ) showed a strong correlation of the organoid (c-object) Count ( FIG. 9A ), Mean Area ( FIG. 9B ), and Total Area ( FIG. 9C ) detected in the primary output image when compared to Hoechst fluorescence image.
- a second test sample contained three organoid lines (NSCLC_051T, NSCLC_051N and NSCLC_050N; 500/well plated as 2-day old organoids) treated with a 10-point titration of cisplatin, prepared as described above.
- a test sample contained organoids and no fluorescent label.
- a control sample contained organoids labelled using Hoechst fluorescence (Hoechst 33342 (blue)).
- the Brightfield images (test sample) and the Hoechst fluorescence images (control sample) were captured by the Tecan Spark Cyto.
- the Brightfield image was processed using the method described herein, and the trained PM output were primary output images (252). These were compared with the fluorescent images. Pairwise comparison ( FIG.
- FIG. 10 showed a strong correlation with cytotoxicity from the cisplatin treatment of the organoid (c-object) Count ( FIG. 10A ), Mean Area ( FIG. 10B ), and Total Area ( FIG. 10C ) detected in the primary output image when compared to Hoechst fluorescence image.
- Common artefacts air-bubbles, extracellular matrix, dust, fibres did not disrupt the processing ( FIGs. 18A and B).
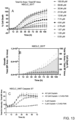
- a drug screen for seven standard-of-care lung cancer treatments (cisplatin, carboplatin, gemcitabine, erlotinib, gefitinib, osimertinib or afatinib) on an independent PDO line (NSCLC_013T) that the predictive model had not been trained on.
- Staurosporine (1 ⁇ M) was used as a standardized 100% cell death control.
- FIG. 12A to G a correspondence of IC50 values was observed between the (total area highlighted c-objects) and CellTiter-Glo 3D assay.
- gemcitabine the total c-object area resulted in a strong fit of the data.
- a fluorescent cell death marker (Cytotox Green or equivalent) in the test sample was used to correct for the area covered by dead entities e.g. at high concentration of potential active agent.
- the parameter Total Area highlighted c-objects - Total Fluorescent Area was used.
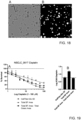
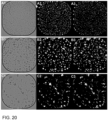
- the parameter was characterized by a Z-factor of 0.80 for the NSCLC_051T line and both the dose-response curves and IC50-values showed an improved overlap with the CellTiter-Glo 3D assay for NSCLC_051T ( FIGs. 19A and B).
- the parameter showed a clear distinction in sensitivity between the NSCLC_051T, 051N/T and 051N lines ( FIG. 14A ).
- this parameter allowed for real-time monitoring of cell viability ( FIG. 14B ) or vehicle normalized survival ( FIG. 14C ) which allows for early detection of therapy response.
- Fluorescent/Brightfield imaging was used to distinguish a cytostatic response (i.e. growth arrest) from a cytotoxic response (i.e. cell death). The amount of therapy induced cell death was quantified. Pairwise comparison showed an inverse correlation of Total Fluorescent Area and Total Fluorescent Intensity normalized to (Total Area Highlighted c-objects) with the CellTiter-Glo 3D readout ( FIGs . 15A and B ). The assay quality was assessed based on the Z-factor using 100 ⁇ M cisplatin as positive control for NSCLC_051T.
- Total Fluorescent Area / Total Area Highlighted c-objects
- Total Fluorescent Intensity / Total Area Highlighted c-objects
- % survival inhibitory dose-response curve
- stimulatory dose-response curve of both the Total Fluorescence Area and Intensity parameters normalized to (Total Area Highlighted c-objects) (% cell death) for cisplatin treated NSCLC_051T PDOs, suggesting a cytotoxic response in this organoid line ( FIGs. 16A to C).
- FIG. 13A An example of a cytostatic response is given for NSCLC_013T treated with gefitinib ( FIGs. 17 ).
- these parameters allow for real-time monitoring of cell death ( FIG. 13A ), internal quality control of organoid health ( FIG. 13B ) and studying types of cell death more in depth ( e.g . apoptosis) ( FIG. 13C ).
Landscapes
- Engineering & Computer Science (AREA)
- Chemical & Material Sciences (AREA)
- General Physics & Mathematics (AREA)
- Physics & Mathematics (AREA)
- Life Sciences & Earth Sciences (AREA)
- General Health & Medical Sciences (AREA)
- Health & Medical Sciences (AREA)
- Pathology (AREA)
- Biochemistry (AREA)
- Analytical Chemistry (AREA)
- Dispersion Chemistry (AREA)
- Immunology (AREA)
- Theoretical Computer Science (AREA)
- Signal Processing (AREA)
- Data Mining & Analysis (AREA)
- Bioinformatics & Computational Biology (AREA)
- Bioinformatics & Cheminformatics (AREA)
- Computer Vision & Pattern Recognition (AREA)
- Evolutionary Biology (AREA)
- Evolutionary Computation (AREA)
- General Engineering & Computer Science (AREA)
- Artificial Intelligence (AREA)
- Biomedical Technology (AREA)
- Molecular Biology (AREA)
- Multimedia (AREA)
- Investigating Or Analysing Biological Materials (AREA)
Claims (14)
- Trainingsverfahren (100) zum Trainieren eines vorhersagenden Modells, PM, (132) zum Markieren von zellulären Objekten, c-Objekten, in einem Hellfeld(BF)-Testbild einer Testprobe (202), bei der es sich um eine Zellkultur von einem oder mehreren c-Objekten handelt, die unter Verwendung eines Testmikroskops (204) erfasst werden, das mindestens einen BF-Erfassungsmodus aufweist, wobei das Trainingsverfahren (100) Folgendes umfasst:- Empfangen einer Vielzahl von Trainingsdatensätzen (120), wobei:- jeder Trainingsdatensatz (120) aus einer Trainingsprobe (102) erlangt wurde, die eine Zellkultur ist, die eine oder mehrere c-Objekte umfasst, die mit einem oder mehreren fluoreszierenden Kennzeichen (L, M) gekennzeichnet wurden;- jeder Trainingsdatensatz (110) ein BF-Trainingsbild (112, 112') der Trainingsprobe (102) und c-Objekttrainingsdaten (124) der Trainingsprobe (102) umfasst,- die c-Objekttrainingsdaten (124) aus einem oder mehreren fluoreszierenden Trainingsbildern (114, 114') automatisch erzeugt werden;- sowohl das BF-Trainingsbild (112, 112') als auch ein oder mehrere fluoreszierende Trainingsbilder (114, 114') in einem Bilderfassungsereignis (110) eines Trainingsmikroskops (104) erlangt wurden, das einen BF-Bildgebungsmodus und einen fluoreszierenden Bildgebungsmodus aufweist;- Trainieren (130) des PM (132), wobei:- eine Eingabe in das PM (132) das BF-Trainingsbild (122) des Trainingsdatensatzes (120) ist und eine Ausgabe vom PM (132) verarbeitete BF-Trainingsbilddaten (134) sind;- die verarbeiteten BF-Trainingsbilddaten (134) mit den c-Objekttrainingsdaten (124) des Trainingsdatensatzes (120) verglichen werden; und- das PM (132) derart angepasst wird, dass sich die ausgegebenen verarbeiteten BF-Trainingsbilddaten (134) den c-Objekttrainingsdaten (124) des Trainingssatzes (120) annähern.
- Trainingsverfahren (100) nach Anspruch 1, wobei:- die einen oder mehreren c-Objekte in einer Trainingsprobe (102) mit einem fluoreszierenden Frischzellenkennzeichen (L) gekennzeichnet wurden und die c-Objekttrainingsdaten (124) das fluoreszierende Trainingsbild (114, 114') der fluoreszierenden Frischzellengekennzeichneten (L) c-Objekte umfassen, die während des Erfassungsereignisses (110) erfasst wurden.
- Trainingsverfahren (100) nach Anspruch 1 oder 2, wobei:- die einen oder mehreren c-Objekte in der Trainingsprobe (102) mit einem fluoreszierenden Frischzellenkennzeichen (L) und mindestens einem morphologischen fluoreszierenden Kennzeichen (M) gekennzeichnet wurden; und- c-Objekttrainingsdaten (124) Folgendes umfassen:- ein fluoreszierendes Trainingsbild (114A) der fluoreszierenden Frischzellengekennzeichneten (L) c-Objekte, die während des Erfassungsereignisses (110) erfasst wurden- c-Objektparameterkennzeichen (114B', 114C', 114D'), die aus einem fluoreszierenden Trainingsbild (114B, 114C, 114D) der morphologischen fluoreszierenden gekennzeichneten (M) c-Objekte erzeugt werden, die während des Erfassungsereignisses (110) erfasst wurden.
- Verarbeitungsverfahren (200) zum Markieren von einem oder mehreren zellulären Objekten, c-Objekten, in einem Hellfeld(BF)-Testbild (212), das Folgendes umfasst:- Empfangen von Testbilddaten (220), die das BF-Testbild (212, 212') einer Testprobe (202) enthalten, bei der es sich um eine Zellkultur handelt, die die einen oder mehreren c-Objekte enthalten, die während eines Erfassungsereignisses (210) von einem Testmikroskop (204) im BF-Erfassungsmodus erfasst wurden;- Verwenden der Testbilddaten (220) als eine Eingabe in ein trainiertes vorhersagendes Modell, PM (240), das gemäß dem Trainingsverfahren nach einem der Ansprüche 1 bis 3 trainiert wurde;- Ausgeben einer trainierten PM-Ausgabe (250) aus dem trainierten PM (240), die ein primäres Ausgabebild (252) umfasst, in der c-Objekte des Testbildes (212) markiert sind.
- Verarbeitungsverfahren (200) zum Markieren von einem oder mehreren zellulären Objekten, c-Objekten, und Bereitstellen einer Anzeige eines c-Objektzustands in einem Hellfeld(BF)-Testbild (212), das Folgendes umfasst:- Empfangen von Testbilddaten (220), die das BF-Testbild (212, 212') einer Testprobe (202) enthalten, bei der es sich um eine Zellkultur handelt, die während des Erfassungsereignisses (210) von einem Testmikroskop (204) im BF-Erfassungsmodus erfasst wurden;- Verwenden der Testbilddaten (220) als eine Eingabe in ein trainiertes vorhersagendes Modell (PM) (240), das gemäß dem Trainingsverfahren nach Anspruch 3 trainiert wurde,- Ausgeben einer trainierten PM-Ausgabe (250), die ein primäres Ausgabebild (252), in der c-Objekte des Testbildes (212) markiert sind, und einen oder mehrere c-Objektparameterkanäle (256), die den c-Objektzustand anzeigen, umfasst.
- Verfahren zum Bestimmen von einem oder mehreren charakterisierenden Parametern (270) von einem oder mehreren zellulären Objekten, c-Objekten, in einer Testprobe (202), bei der es sich um eine Zellkultur handelt, das Folgendes umfasst:- Umsetzen des Verfahrens nach Anspruch 4 oder 5 an der Testprobe (202)- Bestimmen der einen oder mehreren charakterisierenden Parameter (270), die primäre charakterisierende Parameter (272) sind, die eines oder mehrere der Folgendes beinhalten: c-Objektzählung, c-Objektlage, c-Objektausrichtung, c-Objektform, Bereich eines einzelnen c-Objekts, Mittelbereich eines c-Objekts, Gesamtbereich aller c-Objekte, Intensität eines einzelnen c-Objekts, Mittelintensität eines c-Objekts und c-Objektgesamtintensität aller c-Objekte, anhand des primären Ausgabebildes (252).
- Verfahren zum Bestimmen von einem oder mehreren charakterisierenden Parametern (270) von einem oder mehreren zellulären Objekten, c-Objekten, in einer Testprobe (202), bei der es sich um eine Zellkultur handelt, das Folgendes umfasst:- Umsetzen des Verfahrens nach Anspruch 5 an der Testprobe (202);- Bestimmen der einen oder mehreren charakterisierenden Parameter (270), die spezifische charakterisierende Parameter (274) sind, die c-Objektzustand beinhalten, anhand der einen oder mehreren c-Objektparameterkanäle (256).
- Prüfung zum Bestimmen von Lebensfähigkeit einer Population von einem oder mehreren c-Objekten, die einzelne Zellen und/oder Anordnungen von Zellen in einer Testprobe (202) sind, bei der es sich um eine Zellkultur handelt, die Folgendes umfasst:- Durchführen des Verarbeitungsverfahrens (200) nach Anspruch 4 oder 5, um ein primäres Ausgabebild (252) zu erhalten, und- Bestimmen der Lebensfähigkeit anhand der Zählung oder des Gesamt- oder des Mittelbereichs von markierten c-Objekten im primären Ausgabebild (252).
- Prüfung zum Bestimmen von Wachstum von lebensfähigen c-Objekten einer Population von einem oder mehreren c-Objekten, die Anordnungen von Zellen in einer Testprobe (202) sind, bei der es sich um eine Zellkultur handelt, die Folgendes umfasst:- Empfangen von mindestens einem BF-Testbild (212) und mindestens einem fluoreszierenden Testbild (214, 214') der Testprobe (202), die in einem Erfassungsereignis von einem Testmikroskop (204) erlangt wurde, das mindestens einen Hellfelderfassungsmodus und einen fluoreszierenden Bildgebungsmodus aufweist, zu mehreren Zeitpunkten, wobei die Testprobe (202) mit einem morphologischen fluoreszierenden Zelltod-Kennzeichen in Kontakt gebracht wurde;- Verarbeiten des mindestens einen BF-Testbildes (212) gemäß einem Verarbeitungsverfahren (200) nach Anspruch 5, um das primäre Ausgabebild (252) zu erhalten,- Bestimmen eines Gesamt- oder Mittelbereichs von markierten c-Objekten zu jedem Zeitpunkt anhand des primären Ausgabebildes (252);- Bestimmen eines Gesamtbereichs oder Mittelbereichs oder einzelnen Bereichs von c-Objekten, der durch die Fluoreszenz belegt ist, zu jedem Zeitpunkt anhand des fluoreszierenden Testbildes (214, 214');- Bestimmen von Wachstum von lebensfähigen c-Objekten anhand eines Gesamtbereichs oder Mittelbereichs oder einzelnen Bereichs der markierten c-Objekte im primären Ausgabebild (252) minus einem Gesamt- oder Mittelbereich von markierten c-Objekten, die von den c-Objekten im fluoreszierenden Testbild (214, 214') emittiert wurde, in Abhängigkeit von Zeit.
- Prüfung zum Bestimmen von Geschwindigkeit von c-Objekten einer Population von einem oder mehreren c-Objekten, die einzelne Zellen und/oder Anordnungen von Zellen in einer Testprobe (202) sind, bei der es sich um eine Zellkultur handelt, die Folgendes umfasst:- Empfangen von mindestens einem BF-Testbild (212) der Testprobe (202), von denen jedes von einem Testmikroskop (204) erfasst wurde, das mindestens einen Hellfelderfassungsmodus aufweist, zu mehreren Zeitpunkten,- Verarbeiten des mindestens einen BF-Testbild (212) gemäß einem Verarbeitungsverfahren (200) nach Anspruch 4 oder 5, um das primäre Ausgabebild (252) zu den mehreren Zeitpunkten, zu erhalten,- Verfolgen einer Bewegung von markierten c-Objekten (254) in den primären Ausgabebildern (252) über die mehreren Zeitpunkte; und- Bestimmen der Geschwindigkeit der c-Objekte in der Testprobe (202) anhand des Abstands, über den sich die markierten c-Objekte (254) über die Zeit bewegt haben.
- Prüfung zum Bestimmen einer Verschmelzung von c-Objekten einer Population von einem oder mehreren c-Objekten, die einzelne Zellen und/oder Anordnungen von Zellen in einer Testprobe (202) sind, bei der es sich um eine Zellkultur handelt, die Folgendes umfasst:- Empfangen von mindestens einem BF-Testbild (212) der Testprobe (202), von denen jedes von einem Testmikroskop (204) erfasst wurde, das mindestens einen Hellfelderfassungsmodus aufweist, zu mehreren Zeitpunkten,- Verarbeiten der mindestens einen BF-Testbilder (212) gemäß einem Verarbeitungsverfahren (200) nach Anspruch 4 oder 5, um das primäre Ausgabebild (252) zu den mehreren Zeitpunkten, zu erhalten,- Verfolgen einer Bewegung von markierten c-Objekten (254) in den primären Ausgabebildern (252) über die mehreren Zeitpunkte; und- Bestimmen der Verschmelzung von c-Objekten in der Testprobe (202) anhand des Bewegungspfades der markierten c-Objekte (254) über die Zeit.
- Prüfung zum Bestimmen von Aufteilung von c-Objekten einer Population von einem oder mehreren c-Objekten, die einzelne Zellen und/oder Anordnungen von Zellen in einer Testprobe (202) sind, bei der es sich um eine Zellkultur handelt, die Folgendes umfasst:- Empfangen von mindestens einem BF-Testbild (212) der Testprobe (202), von denen jedes von einem Testmikroskop (204) erfasst wurde, das mindestens einen Hellfelderfassungsmodus aufweist, zu mehreren Zeitpunkten,- Verarbeiten der mindestens einen BF-Testbilder (212) gemäß einem Verarbeitungsverfahren (200) nach Anspruch 4 oder 5, um das primäre Ausgabebild (252) zu den mehreren Zeitpunkten, zu erhalten,- Verfolgen einer Bewegung von markierten c-Objekten (254) in den primären Ausgabebildern (252) über die mehreren Zeitpunkte; und- Bestimmen der Aufteilung von c-Objekten in der Testprobe (202) anhand des Bewegungspfades der markierten c-Objekte (254) über die Zeit.
- Screeningverfahren zum Bestimmen einer Auswirkung von einem oder mehreren potenziellen aktiven Mitteln auf eine Testprobe (202), bei der es sich um eine Zellkultur handelt, die eine Population von einem oder mehreren c-Objekten enthält, die einzelne Zellen und/oder Anordnungen von Zellen sind, das Folgendes umfasst:- Umsetzen einer Prüfung nach einem der Ansprüche 8 bis 12 an einer Vielzahl von Testproben (202), wobei mindestens eine der Testproben (202) die c-Objekte und kein potenzielles aktives Mittel enthält und mindestens eine der Testproben die c-Objekte und die einen oder mehreren potenziellen aktiven Mittel enthält;- Bestimmen einer Auswirkung der einen oder mehreren potenziellen aktiven Mittel durch Vergleichen der Prüfungen der verschiedenen Testproben (202).
- Screeningverfahren zum Bestimmen einer Resistenz gegenüber einer therapeutischen Auswirkung von einem oder mehreren potenziellen aktiven Mitteln auf eine Testprobe (202), bei der es sich um eine Zellkultur handelt, die eine Population von einem oder mehreren c-Objekten enthält, die Anordnungen von Zellen sind, das Folgendes umfasst:- Umsetzen einer Wachstumsprüfung nach Anspruch 9 an einer Vielzahl von Testproben (202), wobei mindestens eine der Testproben die c-Objekte und die einen oder mehreren potenziellen aktiven Mittel enthält;- Identifizieren von resistenten c-Objekten in der Testprobe (202) anhand der Prüfung, wobei ein resistentes c-Objekt, verglichen mit einem mittleren Wachstum der Testprobe, ein anderes einzelnes Wachstum aufweist.
Priority Applications (1)
| Application Number | Priority Date | Filing Date | Title |
|---|---|---|---|
| EP21162619.7A EP4060552B1 (de) | 2021-03-15 | 2021-03-15 | Markierungsfreie analyse von hellfeldmikroskopbildern |
Applications Claiming Priority (1)
| Application Number | Priority Date | Filing Date | Title |
|---|---|---|---|
| EP21162619.7A EP4060552B1 (de) | 2021-03-15 | 2021-03-15 | Markierungsfreie analyse von hellfeldmikroskopbildern |
Publications (3)
| Publication Number | Publication Date |
|---|---|
| EP4060552A1 EP4060552A1 (de) | 2022-09-21 |
| EP4060552B1 true EP4060552B1 (de) | 2025-02-26 |
| EP4060552C0 EP4060552C0 (de) | 2025-02-26 |
Family
ID=74874732
Family Applications (1)
| Application Number | Title | Priority Date | Filing Date |
|---|---|---|---|
| EP21162619.7A Active EP4060552B1 (de) | 2021-03-15 | 2021-03-15 | Markierungsfreie analyse von hellfeldmikroskopbildern |
Country Status (1)
| Country | Link |
|---|---|
| EP (1) | EP4060552B1 (de) |
Families Citing this family (2)
| Publication number | Priority date | Publication date | Assignee | Title |
|---|---|---|---|---|
| CN116012838B (zh) * | 2022-12-30 | 2023-11-07 | 创芯国际生物科技(广州)有限公司 | 基于人工智能的类器官活性识别方法及系统 |
| US12499699B2 (en) * | 2023-05-16 | 2025-12-16 | Araceli Biosciences Inc. | Systems and methods for effect size optimization of object classification |
Family Cites Families (3)
| Publication number | Priority date | Publication date | Assignee | Title |
|---|---|---|---|---|
| US20190178867A1 (en) * | 2016-12-31 | 2019-06-13 | Flagship Biosciences, Inc. | Method for Identification of Tissue Objects in IHC Without Specific Staining |
| GB201721615D0 (en) * | 2017-12-21 | 2018-02-07 | Koninklijke Nederlandse Akademie Van Wetenschappen | Immune cell organoid co-cultures |
| US12038432B2 (en) * | 2018-02-02 | 2024-07-16 | Wake Forest University Health Sciences | Organoids related to immunotherapy and methods of preparing and using the same |
-
2021
- 2021-03-15 EP EP21162619.7A patent/EP4060552B1/de active Active
Also Published As
| Publication number | Publication date |
|---|---|
| EP4060552A1 (de) | 2022-09-21 |
| EP4060552C0 (de) | 2025-02-26 |
Similar Documents
| Publication | Publication Date | Title |
|---|---|---|
| Duran et al. | Detection of senescence using machine learning algorithms based on nuclear features | |
| Pramparo et al. | Prediction of autism by translation and immune/inflammation coexpressed genes in toddlers from pediatric community practices | |
| EP4060552B1 (de) | Markierungsfreie analyse von hellfeldmikroskopbildern | |
| Wadey et al. | Tissue expression and correlation of a panel of urinary biomarkers following cisplatin-induced kidney injury | |
| Gudo et al. | Impact of asymptomatic Plasmodium falciparum parasitemia on the imunohematological indices among school children and adolescents in a rural area highly endemic for malaria in southern Mozambique | |
| Osterburg et al. | Unique natural killer cell subpopulations are associated with exacerbation risk in chronic obstructive pulmonary disease | |
| Poz et al. | Monocyte distribution width (MDW): a useful biomarker to improve sepsis management in emergency department | |
| Wood et al. | How does space influence the relationship between host and parasite diversity? | |
| EP3887535B1 (de) | Assay und kit zur bestimmung antimikrobieller suszeptibilität | |
| Vahadane et al. | Development of an automated combined positive score prediction pipeline using artificial intelligence on multiplexed immunofluorescence images | |
| Dedeene et al. | An artificial intelligence-driven support tool for prediction of urine culture test results | |
| Masli et al. | Reduced tear thrombospondin‐1/matrix metalloproteinase‐9 ratio can aid in detecting Sjögren's syndrome etiology in patients with dry eye | |
| Theil et al. | Orally administered branaplam does not impact neurogenesis in juvenile mice, rats, and dogs | |
| Rho et al. | Additional diagnoses other than rejection in the kidney allograft biopsy: pitfalls for biopsy-based transcript diagnostics | |
| Sun et al. | Blood transcriptomes of SARS-CoV-2–infected kidney transplant recipients associated with immune insufficiency proportionate to severity | |
| US20260035747A1 (en) | Tissue based rna in situ hybridization for diagnosis and treatment selection in dermatology | |
| Vande Walle et al. | Single-cell analysis reveals cell death as driver of NLRP3-mediated secretion of IL-1β in human monocytes | |
| Cicala et al. | Colonic epithelial permeability to ions is restored after vedolizumab treatment and may predict clinical response in inflammatory bowel disease patients | |
| Klasinc et al. | A novel flow cytometric approach for the quantification and quality control of chlamydia trachomatis preparations | |
| Casiani et al. | Monocyte profiles and their association with depression severity and functional disability | |
| Leenen | Visualization of the inflammatory response to injury by neutrophil phenotype categories | |
| Furuzawa-Carballeda et al. | Achalasia alters physiological networks depending on sex | |
| Miyazaki et al. | Elevated neutrophil-lymphocyte ratio as a biomarker for suicide attempts in emergency department physical trauma patients: a retrospective observational study | |
| Djune-Yemeli et al. | Longitudinal study of cross-reactive antigenemia in individuals with high Loa loa microfilarial density reveals promising biomarkers for distinguishing lymphatic filariasis from loiasis | |
| Visuña et al. | Novel deep learning-based technique for tuberculosis bacilli detection in sputum microscopy |
Legal Events
| Date | Code | Title | Description |
|---|---|---|---|
| PUAI | Public reference made under article 153(3) epc to a published international application that has entered the european phase |
Free format text: ORIGINAL CODE: 0009012 |
|
| STAA | Information on the status of an ep patent application or granted ep patent |
Free format text: STATUS: THE APPLICATION HAS BEEN PUBLISHED |
|
| AK | Designated contracting states |
Kind code of ref document: A1 Designated state(s): AL AT BE BG CH CY CZ DE DK EE ES FI FR GB GR HR HU IE IS IT LI LT LU LV MC MK MT NL NO PL PT RO RS SE SI SK SM TR |
|
| STAA | Information on the status of an ep patent application or granted ep patent |
Free format text: STATUS: REQUEST FOR EXAMINATION WAS MADE |
|
| 17P | Request for examination filed |
Effective date: 20230302 |
|
| RBV | Designated contracting states (corrected) |
Designated state(s): AL AT BE BG CH CY CZ DE DK EE ES FI FR GB GR HR HU IE IS IT LI LT LU LV MC MK MT NL NO PL PT RO RS SE SI SK SM TR |
|
| REG | Reference to a national code |
Ref country code: DE Ref legal event code: R079 Free format text: PREVIOUS MAIN CLASS: G06K0009000000 Ipc: G06F0018241300 Ref country code: DE Ref legal event code: R079 Ref document number: 602021026618 Country of ref document: DE Free format text: PREVIOUS MAIN CLASS: G06K0009000000 Ipc: G06F0018241300 |
|
| RIC1 | Information provided on ipc code assigned before grant |
Ipc: G01N 15/14 20060101ALI20240628BHEP Ipc: G06V 20/69 20220101ALI20240628BHEP Ipc: G06F 18/2413 20230101AFI20240628BHEP |
|
| GRAP | Despatch of communication of intention to grant a patent |
Free format text: ORIGINAL CODE: EPIDOSNIGR1 |
|
| STAA | Information on the status of an ep patent application or granted ep patent |
Free format text: STATUS: GRANT OF PATENT IS INTENDED |
|
| INTG | Intention to grant announced |
Effective date: 20240917 |
|
| GRAS | Grant fee paid |
Free format text: ORIGINAL CODE: EPIDOSNIGR3 |
|
| GRAA | (expected) grant |
Free format text: ORIGINAL CODE: 0009210 |
|
| STAA | Information on the status of an ep patent application or granted ep patent |
Free format text: STATUS: THE PATENT HAS BEEN GRANTED |
|
| RIN1 | Information on inventor provided before grant (corrected) |
Inventor name: LIN, ABRAHAM Inventor name: DEBEN, CHRISTOPHE Inventor name: CARDENAS, EDGAR |
|
| AK | Designated contracting states |
Kind code of ref document: B1 Designated state(s): AL AT BE BG CH CY CZ DE DK EE ES FI FR GB GR HR HU IE IS IT LI LT LU LV MC MK MT NL NO PL PT RO RS SE SI SK SM TR |
|
| REG | Reference to a national code |
Ref country code: GB Ref legal event code: FG4D |
|
| REG | Reference to a national code |
Ref country code: CH Ref legal event code: EP |
|
| REG | Reference to a national code |
Ref country code: DE Ref legal event code: R096 Ref document number: 602021026618 Country of ref document: DE |
|
| REG | Reference to a national code |
Ref country code: IE Ref legal event code: FG4D |
|
| U01 | Request for unitary effect filed |
Effective date: 20250317 |
|
| U07 | Unitary effect registered |
Designated state(s): AT BE BG DE DK EE FI FR IT LT LU LV MT NL PT RO SE SI Effective date: 20250324 |
|
| PGFP | Annual fee paid to national office [announced via postgrant information from national office to epo] |
Ref country code: AT Payment date: 20250417 Year of fee payment: 5 |
|
| U20 | Renewal fee for the european patent with unitary effect paid |
Year of fee payment: 5 Effective date: 20250425 |
|
| PG25 | Lapsed in a contracting state [announced via postgrant information from national office to epo] |
Ref country code: RS Free format text: LAPSE BECAUSE OF FAILURE TO SUBMIT A TRANSLATION OF THE DESCRIPTION OR TO PAY THE FEE WITHIN THE PRESCRIBED TIME-LIMIT Effective date: 20250526 |
|
| PG25 | Lapsed in a contracting state [announced via postgrant information from national office to epo] |
Ref country code: PL Free format text: LAPSE BECAUSE OF FAILURE TO SUBMIT A TRANSLATION OF THE DESCRIPTION OR TO PAY THE FEE WITHIN THE PRESCRIBED TIME-LIMIT Effective date: 20250226 |
|
| PG25 | Lapsed in a contracting state [announced via postgrant information from national office to epo] |
Ref country code: ES Free format text: LAPSE BECAUSE OF FAILURE TO SUBMIT A TRANSLATION OF THE DESCRIPTION OR TO PAY THE FEE WITHIN THE PRESCRIBED TIME-LIMIT Effective date: 20250226 |
|
| PG25 | Lapsed in a contracting state [announced via postgrant information from national office to epo] |
Ref country code: NO Free format text: LAPSE BECAUSE OF FAILURE TO SUBMIT A TRANSLATION OF THE DESCRIPTION OR TO PAY THE FEE WITHIN THE PRESCRIBED TIME-LIMIT Effective date: 20250526 Ref country code: IS Free format text: LAPSE BECAUSE OF FAILURE TO SUBMIT A TRANSLATION OF THE DESCRIPTION OR TO PAY THE FEE WITHIN THE PRESCRIBED TIME-LIMIT Effective date: 20250626 |
|
| PG25 | Lapsed in a contracting state [announced via postgrant information from national office to epo] |
Ref country code: HR Free format text: LAPSE BECAUSE OF FAILURE TO SUBMIT A TRANSLATION OF THE DESCRIPTION OR TO PAY THE FEE WITHIN THE PRESCRIBED TIME-LIMIT Effective date: 20250226 |
|
| PG25 | Lapsed in a contracting state [announced via postgrant information from national office to epo] |
Ref country code: GR Free format text: LAPSE BECAUSE OF FAILURE TO SUBMIT A TRANSLATION OF THE DESCRIPTION OR TO PAY THE FEE WITHIN THE PRESCRIBED TIME-LIMIT Effective date: 20250527 |
|
| PGFP | Annual fee paid to national office [announced via postgrant information from national office to epo] |
Ref country code: CH Payment date: 20250401 Year of fee payment: 5 |
|
| PG25 | Lapsed in a contracting state [announced via postgrant information from national office to epo] |
Ref country code: SM Free format text: LAPSE BECAUSE OF FAILURE TO SUBMIT A TRANSLATION OF THE DESCRIPTION OR TO PAY THE FEE WITHIN THE PRESCRIBED TIME-LIMIT Effective date: 20250226 |
|
| PG25 | Lapsed in a contracting state [announced via postgrant information from national office to epo] |
Ref country code: CZ Free format text: LAPSE BECAUSE OF FAILURE TO SUBMIT A TRANSLATION OF THE DESCRIPTION OR TO PAY THE FEE WITHIN THE PRESCRIBED TIME-LIMIT Effective date: 20250226 |
|
| PG25 | Lapsed in a contracting state [announced via postgrant information from national office to epo] |
Ref country code: SK Free format text: LAPSE BECAUSE OF FAILURE TO SUBMIT A TRANSLATION OF THE DESCRIPTION OR TO PAY THE FEE WITHIN THE PRESCRIBED TIME-LIMIT Effective date: 20250226 |
|
| PG25 | Lapsed in a contracting state [announced via postgrant information from national office to epo] |
Ref country code: MC Free format text: LAPSE BECAUSE OF FAILURE TO SUBMIT A TRANSLATION OF THE DESCRIPTION OR TO PAY THE FEE WITHIN THE PRESCRIBED TIME-LIMIT Effective date: 20250226 |
|
| PLBE | No opposition filed within time limit |
Free format text: ORIGINAL CODE: 0009261 |
|
| STAA | Information on the status of an ep patent application or granted ep patent |
Free format text: STATUS: NO OPPOSITION FILED WITHIN TIME LIMIT |
|
| REG | Reference to a national code |
Ref country code: CH Ref legal event code: L10 Free format text: ST27 STATUS EVENT CODE: U-0-0-L10-L00 (AS PROVIDED BY THE NATIONAL OFFICE) Effective date: 20260107 |
|
| PG25 | Lapsed in a contracting state [announced via postgrant information from national office to epo] |
Ref country code: IE Free format text: LAPSE BECAUSE OF NON-PAYMENT OF DUE FEES Effective date: 20250315 |
|
| 26N | No opposition filed |
Effective date: 20251127 |
|
| REG | Reference to a national code |
Ref country code: CH Ref legal event code: U11 Free format text: ST27 STATUS EVENT CODE: U-0-0-U10-U11 (AS PROVIDED BY THE NATIONAL OFFICE) Effective date: 20260401 |
|
| PGFP | Annual fee paid to national office [announced via postgrant information from national office to epo] |
Ref country code: GB Payment date: 20260324 Year of fee payment: 6 |
|
| U20 | Renewal fee for the european patent with unitary effect paid |
Year of fee payment: 6 Effective date: 20260326 |