EP4030319A1 - Signal interpolation method and measurement instrument - Google Patents
Signal interpolation method and measurement instrument Download PDFInfo
- Publication number
- EP4030319A1 EP4030319A1 EP21151449.2A EP21151449A EP4030319A1 EP 4030319 A1 EP4030319 A1 EP 4030319A1 EP 21151449 A EP21151449 A EP 21151449A EP 4030319 A1 EP4030319 A1 EP 4030319A1
- Authority
- EP
- European Patent Office
- Prior art keywords
- signal
- threshold
- interpolation method
- samples
- portions
- Prior art date
- Legal status (The legal status is an assumption and is not a legal conclusion. Google has not performed a legal analysis and makes no representation as to the accuracy of the status listed.)
- Pending
Links
Images


Classifications
-
- G—PHYSICS
- G06—COMPUTING OR CALCULATING; COUNTING
- G06F—ELECTRIC DIGITAL DATA PROCESSING
- G06F17/00—Digital computing or data processing equipment or methods, specially adapted for specific functions
- G06F17/10—Complex mathematical operations
- G06F17/17—Function evaluation by approximation methods, e.g. inter- or extrapolation, smoothing, least mean square method
-
- H—ELECTRICITY
- H04—ELECTRIC COMMUNICATION TECHNIQUE
- H04L—TRANSMISSION OF DIGITAL INFORMATION, e.g. TELEGRAPHIC COMMUNICATION
- H04L7/00—Arrangements for synchronising receiver with transmitter
- H04L7/0016—Arrangements for synchronising receiver with transmitter correction of synchronization errors
- H04L7/002—Arrangements for synchronising receiver with transmitter correction of synchronization errors correction by interpolation
- H04L7/0029—Arrangements for synchronising receiver with transmitter correction of synchronization errors correction by interpolation interpolation of received data signal
-
- H—ELECTRICITY
- H04—ELECTRIC COMMUNICATION TECHNIQUE
- H04L—TRANSMISSION OF DIGITAL INFORMATION, e.g. TELEGRAPHIC COMMUNICATION
- H04L1/00—Arrangements for detecting or preventing errors in the information received
- H04L1/20—Arrangements for detecting or preventing errors in the information received using signal quality detector
- H04L1/205—Arrangements for detecting or preventing errors in the information received using signal quality detector jitter monitoring
Definitions
- the invention relates to a signal interpolation method. Further, the invention relates to a measurement instrument.
- TJ Total Jitter
- DJ Deterministic Jitter
- RJ Random Jitter
- Random Jitter is unbounded in amplitude and assumed to be Gaussian. In contrast, Deterministic Jitter (DJ) is not random and is bounded in amplitude. Deterministic Jitter (DJ) comprises Inter-Symbol Interference (ISI), Duty Cycle Distortion (DCD), and Periodic Jitter (PJ), wherein Inter-Symbol Interference (ISI) and Duty Cycle Distortion (DCD) relate to Data Dependent Jitter (DDJ). Accordingly, Deterministic Jitter (DJ) comprises Periodic Jitter (PJ) and Data Dependent Jitter (DDJ).
- ISI is caused by the time differences required for a signal to arrive at a threshold when starting from different places in bit sequences, i.e. symbols.
- DCD is the difference in the mean pulse width of a logic "1" pulse compared to the mean pulse width of a logic "0" pulse in a clock-like bit sequence.
- TIE Time Interval Error
- the data clock is not usually transmitted with the data. Therefore, it is inter alia known in the state of the art to use different techniques to arrive at the respective timings of the events.
- CDR Clock Data Recovery
- the invention provides a signal interpolation method that comprises the steps of:
- the invention is based on the finding that a waveform of the digitized input signal is generated, namely the interpolated signal, which can be further processed in order to identify and separate different jitter components, for instance by performing a Fourier transformation of the interpolated signal derived from the digitized signal.
- the interpolated signal is obtained in a certain way, thereby simplifying the subsequent separation of the different jitter components such that the timings of the events can be determined/estimated in an improved manner.
- the analog input signal is processed such that a crossing of the digitized input signal with respect to the threshold is identified.
- the threshold was set.
- the threshold corresponds to a predetermined threshold.
- the crossing can be identified by recognizing that two successive samples of the digitized signal are associated below and above the threshold.
- the respective waveform is interpolated, namely the interpolated signal that has the two signal portions each having a linear scope.
- the signal portions are combined with each other, thereby creating a respective crosspoint of the interpolated signal with respect to the threshold.
- An aspect provides that the linear slopes of the two signal portions are variable, thereby construing a variable crosspoint at which the signal interpolated crosses the threshold.
- a floating crosspoint is provided that can be set appropriately.
- the two signal portions being variable can be combined such that an arbitrary crosspoint of the interpolated signal can be obtained, namely the interpolated waveform.
- edge timings may be derived appropriately, e.g. early edges or rather late edges.
- Another aspect provides that the two signal portions are linearly combined, thereby obtaining the signal interpolated. Hence, the signal portions merge into each other, which might result in a kink of the interpolated signal. In general, a linear interpolation of the signal/waveform derived from the digitized input signal is done.
- the first signal portion crosses the threshold.
- this relates to an early edge, as the first signal portion is associated with the first of the at least two successive samples, resulting in a crossing closer to the first of the two successive samples.
- the crosspoint in the first signal portion namely the crosspoint associated with the early edge, can be calculated according to a model applied, which comprises information concerning the levels of the first sample and the threshold as well as the steepness in general, namely the level difference between two successive samples in the respective symbol transition area.
- the second signal portion crosses the threshold.
- this relates to a late edge, as the second signal portion is associated with the second of the at least two successive samples, resulting in a crossing closer to the second of the two successive samples.
- the crosspoint in the second signal portion namely the crosspoint associated with the late edge, can be calculated according to a model applied, which comprises information concerning the levels of the second sample and the threshold as well as the steepness in general, namely the level difference between two successive samples in the respective symbol transition area.
- slopes of the two signal portions depend on each other. Accordingly, the slope of the first signal portion influences the slope of the second signal portion and vice versa.
- the slopes depend on each other in that the steeper the slope of the first signal portion, the flatter the slope of the second signal portion or vice versa. Generally, both slopes together have to ensure that a symbol transition between the two successive samples take place.
- the slope of the first signal portion may range between 0 and a steepness, wherein the slope of the second signal portion is the steepness minus the slope of the first signal portion. Therefore, both slopes depend on each other, wherein both slopes together ensure that the respective signal portions together are associated with the respective steepness at the symbol transition area that encompasses the crossing of the threshold by the digitized signal.
- a further aspect provides that the linear slopes of the signal portions are different from each other. Accordingly, the crosspoint is located in the first signal portion or rather the second signal portion.
- the linear slopes of the signal portions are equal, thereby ensuring that the first signal portion and the second signal portion both cross the threshold, namely via the end and the beginning respectively.
- the interpolated signal comprises a synthesized time interval error (TIE) signal.
- TIE time interval error
- the time interval error signal corresponds to the mean signed difference between the measured time locations of each symbol transition and the nominal symbol transition times.
- the invention provides a measurement instrument with a reception interface, at least one input channel, a sampling module and an analysis module.
- the reception interface is configured to receive an analog input signal.
- the sampling module is configured to digitize the analog input signal received and to output a digitized input signal having samples.
- the analysis module is configured to determine crossing of the digitized input signal with respect to a threshold that was set, namely a predetermined threshold.
- the analysis module is also configured to interpolate a signal between at least two successive samples, wherein the signal interpolated has two signal portions each having a linear slope, and wherein one of the signal portions crosses the threshold. Accordingly, the measurement instrument can be used to perform the signal interpolation method described above, as the analysis module is configured to perform the respective interpolating step.
- module is understood to describe suitable hardware, suitable software, or a combination of hardware and software that is configured to have a certain functionality.
- the hardware may, inter alia, comprise a CPU, a GPU, an FPGA, an ASIC, or other types of electronic circuitry.
- the phrase "at least one of A, B, and C", for example, means (A), (B), (C), (A and B), (A and C), (B and C), or (A, B, and C), including all further possible permutations when more than three elements are listed.
- the term “at least one of A and B” generally means “A and/or B", namely "A” alone, “B” alone or "A and B”.
- a measurement instrument 10 is shown that has a housing 12 that encompasses several modules used for processing a signal received.
- the measurement instrument 10 For receiving the respective signal to be processed, the measurement instrument 10 has a reception interface 14 that is located at a front end 16 of the measurement instrument 10.
- the reception interface 14 is connected with at least one input channel 18 that connects the reception interface 14 with a sampling module 20.
- the sampling module 20 digitizes the analog input signal that has been received via the reception interface 14 in order to obtain a digitized input signal that has several samples.
- the sampling module 20 is connected with an analysis module 22 that receives the digitized input signal outputted by the sampling module 20.
- the analysis module 22 is configured to determine a crossing of the digitized input signal with respect to a threshold that was set, particularly a threshold level.
- the threshold that was set corresponds to a predetermined threshold.
- the analysis module 22 interpolates a signal, namely a waveform, between at least two successive samples associated with a symbol transition area, namely two successive samples located prior and after the crossing determined previously. Accordingly, the at least two successive samples have different levels, particularly lower and higher than the threshold level respectively.
- the analysis module 22 generates an arbitrary interpolated signal that has two signal portions that merge into each other.
- the respective signal portions each have a linear slope, wherein at least one of the signal portions crosses the threshold that was set, namely the predetermined threshold.
- the measurement instrument 10 further comprises a display 24 that is connected with the analysis module 22 for graphically illustrating information provided by the analysis module 22.
- the respective method steps performed by the measurement instrument 10 are shown in Figure 2 , as the analog input signal is received and digitized, thereby obtaining the digitized input signal that is compared with a threshold in order to identify crosspoints of the digitized input signal with respect to the threshold.
- the analysis module 22 generates or rather interpolates the interpolated signal between two successive samples located prior and after an identified crossing/crosspoint of the digitized input signal with respect to the threshold.
- the respective signal interpolated namely the waveform derived, has two signal portions each having a linear slope.
- the respective signal portions may each have a variable linear slope, thereby construing a variable crosspoint at which the signal interpolated crosses the threshold.
- the signal interpolated can be generated such that the first signal portion or rather the second signal portion crosses the respective threshold, resulting in an early edge or rather a late edge.
- the early edge is located closer to the first of the two successive symbols located around the symbol transition area, whereas the late edge is located closer to the second of the two successive samples.
- the respective slopes of the two signal portions depend on each other, as the steeper the slope of the first signal portion, the flatter the slope of the second signal portion. Consequently, the flatter the slope of the first signal portion, the steeper the slope of the second signal portion.
- the slope of the second signal portion corresponds to the steepness minus the slope of the first signal portion, thereby ensuring that both slopes together correspond to the steepness.
- the steepness amounts to 1 and/or that the levels of the symbols are different, e.g. "level 0" and “level 1” such that the threshold level amounts to "level 0.5", as schematically indicated in the overviews shown in Figure 4 .
- a floating point accuracy of the respective crosspoint can be ensured due to the linear combining of two possible slopes of the signal portions, which in turn results in an interpolated signal/waveform that can be used for estimating the different jitter components in a simple and cost-efficient manner.
- the interpolated signal comprises a synthesized time interval error (TIE) signal.
- TIE time interval error
- circuitry e.g., one or more circuits
- circuitry operably couple two or more components, generate information, process information, analyze information, generate signals, encode/decode signals, convert signals, transmit and/or receive signals, control other devices, etc.
- Circuitry of any type can be used.
- circuitry includes, among other things, one or more computing devices such as a processor (e.g., a microprocessor), a central processing unit (CPU), a digital signal processor (DSP), an application-specific integrated circuit (ASIC), a field-programmable gate array (FPGA), a system on a chip (SoC), or the like, or any combinations thereof, and can include discrete digital or analog circuit elements or electronics, or combinations thereof.
- a processor e.g., a microprocessor
- CPU central processing unit
- DSP digital signal processor
- ASIC application-specific integrated circuit
- FPGA field-programmable gate array
- SoC system on a chip
- circuitry includes hardware circuit implementations (e.g., implementations in analog circuitry, implementations in digital circuitry, and the like, and combinations thereof).
- circuitry includes combinations of circuits and computer program products having software or firmware instructions stored on one or more computer readable memories that work together to cause a device to perform one or more protocols, methodologies or technologies described herein.
- circuitry includes circuits, such as, for example, microprocessors or portions of microprocessor, that require software, firmware, and the like for operation.
- circuitry includes one or more processors or portions thereof and accompanying software, firmware, hardware, and the like.
- the present application may reference quantities and numbers. Unless specifically stated, such quantities and numbers are not to be considered restrictive, but exemplary of the possible quantities or numbers associated with the present application. Also in this regard, the present application may use the term “plurality” to reference a quantity or number. In this regard, the term “plurality” is meant to be any number that is more than one, for example, two, three, four, five, etc. The terms “about”, “approximately”, “near” etc., mean plus or minus 5% of the stated value.
Landscapes
- Engineering & Computer Science (AREA)
- Physics & Mathematics (AREA)
- General Physics & Mathematics (AREA)
- Computer Networks & Wireless Communication (AREA)
- Signal Processing (AREA)
- Mathematical Optimization (AREA)
- Computational Mathematics (AREA)
- Mathematical Analysis (AREA)
- Pure & Applied Mathematics (AREA)
- Data Mining & Analysis (AREA)
- Mathematical Physics (AREA)
- Theoretical Computer Science (AREA)
- Quality & Reliability (AREA)
- Algebra (AREA)
- Databases & Information Systems (AREA)
- Software Systems (AREA)
- General Engineering & Computer Science (AREA)
- Analogue/Digital Conversion (AREA)
Abstract
Description
- The invention relates to a signal interpolation method. Further, the invention relates to a measurement instrument.
- It is known in signal processing that jitter occurring in the time domain or rather in the frequency domain has an influence on the ideal timing of an event in a signal. Accordingly, jitter results in a mispositioning of significant edges in a sequence of data bits from their ideal positions. In modern serial data communications systems, the respective serial data clock is not usually transmitted with the data such that jitter may cause data errors at the receiving end.
- It is therefore important to determine the amount and kind of jitter that may be present in a signal to be analyzed. In this regard, it is noted that jitter in general, also called Total Jitter (TJ), comprises two distinct types, namely Deterministic Jitter (DJ) and Random Jitter (RJ).
- Random Jitter (RJ) is unbounded in amplitude and assumed to be Gaussian. In contrast, Deterministic Jitter (DJ) is not random and is bounded in amplitude. Deterministic Jitter (DJ) comprises Inter-Symbol Interference (ISI), Duty Cycle Distortion (DCD), and Periodic Jitter (PJ), wherein Inter-Symbol Interference (ISI) and Duty Cycle Distortion (DCD) relate to Data Dependent Jitter (DDJ). Accordingly, Deterministic Jitter (DJ) comprises Periodic Jitter (PJ) and Data Dependent Jitter (DDJ).
- ISI is caused by the time differences required for a signal to arrive at a threshold when starting from different places in bit sequences, i.e. symbols. DCD is the difference in the mean pulse width of a logic "1" pulse compared to the mean pulse width of a logic "0" pulse in a clock-like bit sequence.
- PJ is characterized by periodic variations in edge transition times at frequencies that are uncorrelated with the data rate. The mean signed difference between the measured time location of each sequential data symbol transition and the nominal symbol transition time is called Time Interval Error (TIE).
- As mentioned above, the data clock is not usually transmitted with the data. Therefore, it is inter alia known in the state of the art to use different techniques to arrive at the respective timings of the events.
- For instance, a Clock Data Recovery (CDR) is used in order to identify the respective timing of the events in the signal to be analyzed, as Duty Cycle Distortion would be noticeable after a Clock Data Recovery and a measurement in the histogram, or statistical analysis of the edges per bit sequence.
- Further, it is also known to derive the respective timings of the events based on a spectrum analysis of the signal to be analyzed, wherein deterministic jitter and random jitter are separated from each other by using their spectral properties. In fact, it is known that deterministic jitter exhibits a spectrum of impulses, whereas random jitter exhibits a broad, flat spectrum. These different spectral properties are used for obtaining the respective jitter components such that the timings of the events can be determined/estimated accordingly.
- However, the known techniques for determining/estimating the timings of the events are complex.
- Accordingly, there is a need for a simple and cost-efficient way to determine or rather estimate the timings of events in a signal to be analyzed.
- The invention provides a signal interpolation method that comprises the steps of:
- Receiving an analog input signal,
- Digitizing the analog input signal received, thereby obtaining a digitized input signal having samples,
- Determining a crossing of the digitized input signal with respect to a threshold that was set, and
- Interpolating a signal between at least two successive samples, wherein the signal interpolated has two signal portions each having a linear slope, and wherein one of the signal portions crosses the threshold.
- The invention is based on the finding that a waveform of the digitized input signal is generated, namely the interpolated signal, which can be further processed in order to identify and separate different jitter components, for instance by performing a Fourier transformation of the interpolated signal derived from the digitized signal. The interpolated signal is obtained in a certain way, thereby simplifying the subsequent separation of the different jitter components such that the timings of the events can be determined/estimated in an improved manner.
- In fact, the analog input signal is processed such that a crossing of the digitized input signal with respect to the threshold is identified. The threshold was set. Hence, the threshold corresponds to a predetermined threshold. Particularly, the crossing can be identified by recognizing that two successive samples of the digitized signal are associated below and above the threshold. In the area about the crossing of the threshold, the respective waveform is interpolated, namely the interpolated signal that has the two signal portions each having a linear scope. The signal portions are combined with each other, thereby creating a respective crosspoint of the interpolated signal with respect to the threshold.
- An aspect provides that the linear slopes of the two signal portions are variable, thereby construing a variable crosspoint at which the signal interpolated crosses the threshold. Thus, a floating crosspoint is provided that can be set appropriately. In other words, the two signal portions being variable can be combined such that an arbitrary crosspoint of the interpolated signal can be obtained, namely the interpolated waveform.
- Accordingly, different edge timings may be derived appropriately, e.g. early edges or rather late edges.
- Another aspect provides that the two signal portions are linearly combined, thereby obtaining the signal interpolated. Hence, the signal portions merge into each other, which might result in a kink of the interpolated signal. In general, a linear interpolation of the signal/waveform derived from the digitized input signal is done.
- For instance, the first signal portion crosses the threshold. Generally, this relates to an early edge, as the first signal portion is associated with the first of the at least two successive samples, resulting in a crossing closer to the first of the two successive samples.
- Particularly, a crosspoint associated with the first signal portion follows the
equation 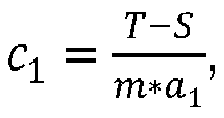
- Alternatively, the second signal portion crosses the threshold. Generally, this relates to a late edge, as the second signal portion is associated with the second of the at least two successive samples, resulting in a crossing closer to the second of the two successive samples.
- Particularly, a crosspoint associated with the second signal portion follows the
equation 
- Another aspect provides that the slopes of the two signal portions depend on each other. Accordingly, the slope of the first signal portion influences the slope of the second signal portion and vice versa.
- In fact, the slopes depend on each other in that the steeper the slope of the first signal portion, the flatter the slope of the second signal portion or vice versa. Generally, both slopes together have to ensure that a symbol transition between the two successive samples take place.
- Accordingly, the slope of the first signal portion may range between 0 and a steepness, wherein the slope of the second signal portion is the steepness minus the slope of the first signal portion. Therefore, both slopes depend on each other, wherein both slopes together ensure that the respective signal portions together are associated with the respective steepness at the symbol transition area that encompasses the crossing of the threshold by the digitized signal.
- A further aspect provides that the linear slopes of the signal portions are different from each other. Accordingly, the crosspoint is located in the first signal portion or rather the second signal portion.
- In case that the crosspoint is located in the center between both successive samples, the linear slopes of the signal portions are equal, thereby ensuring that the first signal portion and the second signal portion both cross the threshold, namely via the end and the beginning respectively.
- Another aspect provides that the interpolated signal comprises a synthesized time interval error (TIE) signal. The time interval error signal corresponds to the mean signed difference between the measured time locations of each symbol transition and the nominal symbol transition times.
- Further, the invention provides a measurement instrument with a reception interface, at least one input channel, a sampling module and an analysis module. The reception interface is configured to receive an analog input signal. The sampling module is configured to digitize the analog input signal received and to output a digitized input signal having samples. The analysis module is configured to determine crossing of the digitized input signal with respect to a threshold that was set, namely a predetermined threshold. The analysis module is also configured to interpolate a signal between at least two successive samples, wherein the signal interpolated has two signal portions each having a linear slope, and wherein one of the signal portions crosses the threshold. Accordingly, the measurement instrument can be used to perform the signal interpolation method described above, as the analysis module is configured to perform the respective interpolating step.
- The characteristics and advantages mentioned above also apply to the measurement instrument in a similar manner.
- It is to be noted that the term "module" is understood to describe suitable hardware, suitable software, or a combination of hardware and software that is configured to have a certain functionality. The hardware may, inter alia, comprise a CPU, a GPU, an FPGA, an ASIC, or other types of electronic circuitry.
- Further aspects and advantages of the claimed subject matter will become more readily appreciated as the same become better understood by reference to the following description, when taken in conjunction with the accompanying drawings. In the drawings,
-
Figure 1 schematically shows a measurement instrument according to the invention, -
Figure 2 schematically shows steps of a signal interpolation method according to the invention, -
Figure 3 schematically shows an overview illustrating the variable slopes of the signal portions, yielding a variable crosspoint, and -
Figure 4 schematically shows further overviews illustrating the variable slopes of the signal portions, yielding a variable crosspoint for different models. - The detailed description set forth below in connection with the appended drawings, where like numerals reference like elements, is intended as a description of various embodiments of the disclosed subject matter and is not intended to represent the only embodiments. Each embodiment described in this disclosure is provided merely as an example or illustration and should not be construed as preferred or advantageous over other embodiments. The illustrative examples provided herein are not intended to be exhaustive or to limit the claimed subject matter to the precise forms disclosed.
- For the purposes of the present disclosure, the phrase "at least one of A, B, and C", for example, means (A), (B), (C), (A and B), (A and C), (B and C), or (A, B, and C), including all further possible permutations when more than three elements are listed. In other words, the term "at least one of A and B" generally means "A and/or B", namely "A" alone, "B" alone or "A and B".
- In
Figure 1 , ameasurement instrument 10 is shown that has a housing 12 that encompasses several modules used for processing a signal received. - For receiving the respective signal to be processed, the
measurement instrument 10 has areception interface 14 that is located at afront end 16 of themeasurement instrument 10. - The
reception interface 14 is connected with at least oneinput channel 18 that connects thereception interface 14 with asampling module 20. Thesampling module 20 digitizes the analog input signal that has been received via thereception interface 14 in order to obtain a digitized input signal that has several samples. - The
sampling module 20 is connected with ananalysis module 22 that receives the digitized input signal outputted by thesampling module 20. - The
analysis module 22 is configured to determine a crossing of the digitized input signal with respect to a threshold that was set, particularly a threshold level. Thus, the threshold that was set corresponds to a predetermined threshold. - Further, the
analysis module 22 interpolates a signal, namely a waveform, between at least two successive samples associated with a symbol transition area, namely two successive samples located prior and after the crossing determined previously. Accordingly, the at least two successive samples have different levels, particularly lower and higher than the threshold level respectively. - The
analysis module 22 generates an arbitrary interpolated signal that has two signal portions that merge into each other. The respective signal portions each have a linear slope, wherein at least one of the signal portions crosses the threshold that was set, namely the predetermined threshold. - The
measurement instrument 10 further comprises adisplay 24 that is connected with theanalysis module 22 for graphically illustrating information provided by theanalysis module 22. - In general, the respective method steps performed by the
measurement instrument 10 are shown inFigure 2 , as the analog input signal is received and digitized, thereby obtaining the digitized input signal that is compared with a threshold in order to identify crosspoints of the digitized input signal with respect to the threshold. - Afterwards, the
analysis module 22 generates or rather interpolates the interpolated signal between two successive samples located prior and after an identified crossing/crosspoint of the digitized input signal with respect to the threshold. The respective signal interpolated, namely the waveform derived, has two signal portions each having a linear slope. - The respective signal portions may each have a variable linear slope, thereby construing a variable crosspoint at which the signal interpolated crosses the threshold.
- This concept is shown in more detail in
Figure 3 for different slopes of the two signal portions that together form the signal interpolated. - Generally, the signal interpolated can be generated such that the first signal portion or rather the second signal portion crosses the respective threshold, resulting in an early edge or rather a late edge. The early edge is located closer to the first of the two successive symbols located around the symbol transition area, whereas the late edge is located closer to the second of the two successive samples.
- As shown in
Figure 3 , the respective slopes of the two signal portions depend on each other, as the steeper the slope of the first signal portion, the flatter the slope of the second signal portion. Consequently, the flatter the slope of the first signal portion, the steeper the slope of the second signal portion. - In fact, the slope of the first signal portion ranges between 0 and the steepness that is defined by the levels of the samples, e.g. level "-1" and level "1", namely 1-(-1)=2, and the shortest distance, e.g. a sample index step, namely 2-1=1, resulting in a steepness of 2/1=2. Then, the slope of the second signal portion corresponds to the steepness minus the slope of the first signal portion, thereby ensuring that both slopes together correspond to the steepness.
- In fact, the crosspoint associated with the first signal portion follows the
equation 
- In the embodiment shown in
Figure 3 , the parameters are as follows: T = 0, S = -1, m = 2 (as already described above). Then, the fraction of the first signal portion between the levels of the samples can be altered between 0.5 and 1, resulting in a variable crosspoint c 1, which may be between 0.5 and 1 with respect to the first sample having thesample index 1 such that the crosspoint c 1 has a sample index between 1.5 and 2. - Hence, the formula provided above can be rewritten as follows for the respective example provided:

- Accordingly, the dependency of the fraction of the first signal portion between the levels of the samples and the variable crosspoint c 1 can be expressed as follows for the example given:

- Further, the crosspoint associated with the second signal portion follows the
equation 
- In the embodiment shown in
Figure 3 , the parameters are as follows: E = 1, T = 0, m = 2 (as already described above). Then, the fraction of the second signal portion between the levels of the samples can be altered between 0.5 and 1, resulting in a variable crosspoint c 2, which may be between 0 and 0.5 with respect to a center of both samples having thesample index 2 such that the crosspoint c 2 has a sample index between 2 and 2.5. - However, it is also possible that the steepness amounts to 1 and/or that the levels of the symbols are different, e.g. "
level 0" and "level 1" such that the threshold level amounts to "level 0.5", as schematically indicated in the overviews shown inFigure 4 . - Generally, a floating point accuracy of the respective crosspoint can be ensured due to the linear combining of two possible slopes of the signal portions, which in turn results in an interpolated signal/waveform that can be used for estimating the different jitter components in a simple and cost-efficient manner.
- For instance, the interpolated signal comprises a synthesized time interval error (TIE) signal.
- Certain embodiments disclosed herein, particularly the respective module(s), utilize circuitry (e.g., one or more circuits) in order to implement standards, protocols, methodologies or technologies disclosed herein, operably couple two or more components, generate information, process information, analyze information, generate signals, encode/decode signals, convert signals, transmit and/or receive signals, control other devices, etc. Circuitry of any type can be used.
- In an embodiment, circuitry includes, among other things, one or more computing devices such as a processor (e.g., a microprocessor), a central processing unit (CPU), a digital signal processor (DSP), an application-specific integrated circuit (ASIC), a field-programmable gate array (FPGA), a system on a chip (SoC), or the like, or any combinations thereof, and can include discrete digital or analog circuit elements or electronics, or combinations thereof. In an embodiment, circuitry includes hardware circuit implementations (e.g., implementations in analog circuitry, implementations in digital circuitry, and the like, and combinations thereof).
- In an embodiment, circuitry includes combinations of circuits and computer program products having software or firmware instructions stored on one or more computer readable memories that work together to cause a device to perform one or more protocols, methodologies or technologies described herein. In an embodiment, circuitry includes circuits, such as, for example, microprocessors or portions of microprocessor, that require software, firmware, and the like for operation. In an embodiment, circuitry includes one or more processors or portions thereof and accompanying software, firmware, hardware, and the like.
- The present application may reference quantities and numbers. Unless specifically stated, such quantities and numbers are not to be considered restrictive, but exemplary of the possible quantities or numbers associated with the present application. Also in this regard, the present application may use the term "plurality" to reference a quantity or number. In this regard, the term "plurality" is meant to be any number that is more than one, for example, two, three, four, five, etc. The terms "about", "approximately", "near" etc., mean plus or minus 5% of the stated value.
Claims (14)
- A signal interpolation method, the method comprising the steps of:- Receiving an analog input signal,- Digitizing the analog input signal received, thereby obtaining a digitized input signal having samples,- Determining a crossing of the digitized input signal with respect to a threshold that was set, and- Interpolating a signal between at least two successive samples, wherein the signal interpolated has two signal portions each having a linear slope, and wherein one of the signal portions crosses the threshold.
- The signal interpolation method according to claim 1, wherein the linear slopes of the two signal portions are variable, thereby construing a variable crosspoint at which the signal interpolated crosses the threshold.
- The signal interpolation method according to claim 1 or 2, wherein the two signal portions are linearly combined, thereby obtaining the signal interpolated.
- The signal interpolation method according to any of the preceding claims, wherein the first signal portion crosses the threshold.
- The signal interpolation method according to claim 4, wherein a crosspoint associated with the first signal portion follows the equation

- The signal interpolation method according to any of claims 1 to 3, wherein the second signal portion crosses the threshold.
- The signal interpolation method according to claim 6, wherein a crosspoint associated with the second signal portion follows the equation

- The signal interpolation method according to any of the preceding claims, wherein the slopes of the two signal portions depend on each other.
- The signal interpolation method according to any of the preceding claims,, wherein the slopes depend on each other in that the steeper the slope of the first signal portion, the flatter the slope of the second signal portion or vice versa.
- The signal interpolation method according to any of the preceding claims, wherein the slope of the first signal portion ranges between 0 and a steepness, and wherein the slope of the second signal portion is the steepness minus the slope of the first signal portion.
- The signal interpolation method according to any of the preceding claims, wherein the linear slopes of the signal portions are different from each other.
- The signal interpolation method according to any of the preceding claims, wherein the interpolated signal comprises a synthesized time interval error signal.
- A measurement instrument with a reception interface (14), at least one input channel (18), a sampling module (20) and an analysis module (22), wherein the reception interface (!4) is configured to receive an analog input signal, wherein the sampling module (20) is configured to digitize the analog input signal received and to output a digitized input signal having samples, wherein the analysis module (22) is configured to determine crossing of the digitized input signal with respect to a threshold that was set, and wherein the analysis module (22) is configured to interpolate a signal between at least two successive samples, wherein the signal interpolated has two signal portions each having a linear slope, and wherein one of the signal portions crosses the threshold.
- The measurement instrument according to claim 13, wherein the measurement instrument (10) is configured to perform the signal interpolation method according to any of the claims 1 to 12.
Priority Applications (2)
| Application Number | Priority Date | Filing Date | Title |
|---|---|---|---|
| EP21151449.2A EP4030319A1 (en) | 2021-01-13 | 2021-01-13 | Signal interpolation method and measurement instrument |
| US17/543,241 US11632227B2 (en) | 2021-01-13 | 2021-12-06 | Signal interpolation method and measurement instrument |
Applications Claiming Priority (1)
| Application Number | Priority Date | Filing Date | Title |
|---|---|---|---|
| EP21151449.2A EP4030319A1 (en) | 2021-01-13 | 2021-01-13 | Signal interpolation method and measurement instrument |
Publications (1)
| Publication Number | Publication Date |
|---|---|
| EP4030319A1 true EP4030319A1 (en) | 2022-07-20 |
Family
ID=74181061
Family Applications (1)
| Application Number | Title | Priority Date | Filing Date |
|---|---|---|---|
| EP21151449.2A Pending EP4030319A1 (en) | 2021-01-13 | 2021-01-13 | Signal interpolation method and measurement instrument |
Country Status (2)
| Country | Link |
|---|---|
| US (1) | US11632227B2 (en) |
| EP (1) | EP4030319A1 (en) |
Citations (4)
| Publication number | Priority date | Publication date | Assignee | Title |
|---|---|---|---|---|
| US7388937B1 (en) * | 2003-04-21 | 2008-06-17 | Pmc-Sierra, Inc. | Systems and methods for jitter analysis of digital signals |
| US8478576B1 (en) * | 2010-03-04 | 2013-07-02 | Donald Kevin Cameron | Including variability in simulation of logic circuits |
| US20140286381A1 (en) * | 2013-03-22 | 2014-09-25 | Fujitsu Limited | Receiver circuit and semiconductor integrated circuit |
| EP2985617A2 (en) * | 2014-07-30 | 2016-02-17 | Tektronix, Inc. | Method for performing joint jitter and amplitude noise analysis on a real time oscilloscope |
Family Cites Families (2)
| Publication number | Priority date | Publication date | Assignee | Title |
|---|---|---|---|---|
| US6832172B2 (en) | 2001-06-15 | 2004-12-14 | Tektronix, Inc. | Apparatus and method for spectrum analysis-based serial data jitter measurement |
| US7945009B1 (en) * | 2006-08-22 | 2011-05-17 | Marvell International Ltd. | Jitter measurement |
-
2021
- 2021-01-13 EP EP21151449.2A patent/EP4030319A1/en active Pending
- 2021-12-06 US US17/543,241 patent/US11632227B2/en active Active
Patent Citations (4)
| Publication number | Priority date | Publication date | Assignee | Title |
|---|---|---|---|---|
| US7388937B1 (en) * | 2003-04-21 | 2008-06-17 | Pmc-Sierra, Inc. | Systems and methods for jitter analysis of digital signals |
| US8478576B1 (en) * | 2010-03-04 | 2013-07-02 | Donald Kevin Cameron | Including variability in simulation of logic circuits |
| US20140286381A1 (en) * | 2013-03-22 | 2014-09-25 | Fujitsu Limited | Receiver circuit and semiconductor integrated circuit |
| EP2985617A2 (en) * | 2014-07-30 | 2016-02-17 | Tektronix, Inc. | Method for performing joint jitter and amplitude noise analysis on a real time oscilloscope |
Also Published As
| Publication number | Publication date |
|---|---|
| US20220224502A1 (en) | 2022-07-14 |
| US11632227B2 (en) | 2023-04-18 |
Similar Documents
| Publication | Publication Date | Title |
|---|---|---|
| EP1267172B1 (en) | Apparatus and method for spectrum analysis-based serial data jitter measurement | |
| CN114553261B (en) | Method for generating decision feedback equalization compensated error count | |
| JP4723030B2 (en) | Improved digital trigger circuit | |
| US7388937B1 (en) | Systems and methods for jitter analysis of digital signals | |
| US7254168B2 (en) | Method for decomposing timing jitter on arbitrary serial data sequences | |
| US6898535B2 (en) | Method and apparatus for decomposing signal jitter using multiple acquisitions | |
| US11184268B2 (en) | Jitter determination method and measurement instrument | |
| US10965571B2 (en) | Time interval error determination method and measurement instrument | |
| EP2985610A1 (en) | Method for determining a correlated waveform on a real time oscilloscope | |
| US10958551B2 (en) | Jitter determination method and measurement instrument | |
| US11316768B2 (en) | Bit error rate determination method and measurement instrument | |
| US11632227B2 (en) | Signal interpolation method and measurement instrument | |
| KR100561555B1 (en) | Radar pulse analysis method | |
| US11012165B2 (en) | Jitter determination method and measurement instrument | |
| RU2380826C1 (en) | Method of separating data signal jitter | |
| CN101095290B (en) | Apparatus and method for determining the arrival time of a received sequence | |
| CN110988836B (en) | Method and system for measuring pulse arrival time | |
| EP3570450A1 (en) | Timing estimation device and timing estimation method | |
| US11346884B2 (en) | Signal analysis method and measurement instrument | |
| RU2338261C1 (en) | Method of telemetering signal recording and processing with time channeling | |
| Dobrogowski et al. | Testing of the methods of real-time MTIE calculation | |
| US20050273285A1 (en) | Period determination of a periodic NRZ signal | |
| US11095290B2 (en) | Clock recovery method and clock recovery module | |
| GB2424809A (en) | Separation of random and deterministic components of jitter | |
| Guenther | Ward et al. |
Legal Events
| Date | Code | Title | Description |
|---|---|---|---|
| PUAI | Public reference made under article 153(3) epc to a published international application that has entered the european phase |
Free format text: ORIGINAL CODE: 0009012 |
|
| STAA | Information on the status of an ep patent application or granted ep patent |
Free format text: STATUS: THE APPLICATION HAS BEEN PUBLISHED |
|
| AK | Designated contracting states |
Kind code of ref document: A1 Designated state(s): AL AT BE BG CH CY CZ DE DK EE ES FI FR GB GR HR HU IE IS IT LI LT LU LV MC MK MT NL NO PL PT RO RS SE SI SK SM TR |
|
| STAA | Information on the status of an ep patent application or granted ep patent |
Free format text: STATUS: REQUEST FOR EXAMINATION WAS MADE |
|
| 17P | Request for examination filed |
Effective date: 20221228 |
|
| RBV | Designated contracting states (corrected) |
Designated state(s): AL AT BE BG CH CY CZ DE DK EE ES FI FR GB GR HR HU IE IS IT LI LT LU LV MC MK MT NL NO PL PT RO RS SE SI SK SM TR |
|
| P01 | Opt-out of the competence of the unified patent court (upc) registered |
Effective date: 20230525 |
|
| STAA | Information on the status of an ep patent application or granted ep patent |
Free format text: STATUS: EXAMINATION IS IN PROGRESS |
|
| 17Q | First examination report despatched |
Effective date: 20250716 |