EP4015651A1 - Treatment prediction and effectiveness of anti-tnf alpha treatment in ibd patients - Google Patents
Treatment prediction and effectiveness of anti-tnf alpha treatment in ibd patients Download PDFInfo
- Publication number
- EP4015651A1 EP4015651A1 EP20214794.8A EP20214794A EP4015651A1 EP 4015651 A1 EP4015651 A1 EP 4015651A1 EP 20214794 A EP20214794 A EP 20214794A EP 4015651 A1 EP4015651 A1 EP 4015651A1
- Authority
- EP
- European Patent Office
- Prior art keywords
- treatment
- genes
- pathway
- expression levels
- mmp9
- Prior art date
- Legal status (The legal status is an assumption and is not a legal conclusion. Google has not performed a legal analysis and makes no representation as to the accuracy of the status listed.)
- Withdrawn
Links
- 238000011282 treatment Methods 0.000 title claims abstract description 265
- 108090000623 proteins and genes Proteins 0.000 claims abstract description 307
- 230000014509 gene expression Effects 0.000 claims abstract description 175
- 230000004044 response Effects 0.000 claims abstract description 107
- 208000022559 Inflammatory bowel disease Diseases 0.000 claims abstract description 94
- 238000000034 method Methods 0.000 claims abstract description 79
- 150000001875 compounds Chemical class 0.000 claims abstract description 72
- 101150054149 ANGPTL4 gene Proteins 0.000 claims abstract description 33
- 102000045205 Angiopoietin-Like Protein 4 Human genes 0.000 claims abstract description 33
- 108700042530 Angiopoietin-Like Protein 4 Proteins 0.000 claims abstract description 33
- 230000002349 favourable effect Effects 0.000 claims abstract description 33
- 208000011231 Crohn disease Diseases 0.000 claims description 87
- 206010009900 Colitis ulcerative Diseases 0.000 claims description 86
- 201000006704 Ulcerative Colitis Diseases 0.000 claims description 85
- 239000000523 sample Substances 0.000 claims description 82
- 101000990902 Homo sapiens Matrix metalloproteinase-9 Proteins 0.000 claims description 75
- 102100030412 Matrix metalloproteinase-9 Human genes 0.000 claims description 75
- 108010037462 Cyclooxygenase 2 Proteins 0.000 claims description 69
- 102100038280 Prostaglandin G/H synthase 2 Human genes 0.000 claims description 69
- 108010022233 Plasminogen Activator Inhibitor 1 Proteins 0.000 claims description 67
- 101000669513 Homo sapiens Metalloproteinase inhibitor 1 Proteins 0.000 claims description 65
- 102100039364 Metalloproteinase inhibitor 1 Human genes 0.000 claims description 65
- 101001013150 Homo sapiens Interstitial collagenase Proteins 0.000 claims description 58
- 102000000380 Matrix Metalloproteinase 1 Human genes 0.000 claims description 58
- 108010040168 Bcl-2-Like Protein 11 Proteins 0.000 claims description 55
- 101000990915 Homo sapiens Stromelysin-1 Proteins 0.000 claims description 55
- 102100030416 Stromelysin-1 Human genes 0.000 claims description 55
- 102000001765 Bcl-2-Like Protein 11 Human genes 0.000 claims description 53
- 101000638886 Homo sapiens Urokinase-type plasminogen activator Proteins 0.000 claims description 53
- 102100031358 Urokinase-type plasminogen activator Human genes 0.000 claims description 53
- 101000803403 Homo sapiens Vimentin Proteins 0.000 claims description 50
- 102100035071 Vimentin Human genes 0.000 claims description 50
- 102100026596 Bcl-2-like protein 1 Human genes 0.000 claims description 49
- 101150008012 Bcl2l1 gene Proteins 0.000 claims description 49
- 108700000711 bcl-X Proteins 0.000 claims description 49
- 101000599852 Homo sapiens Intercellular adhesion molecule 1 Proteins 0.000 claims description 48
- 102100037877 Intercellular adhesion molecule 1 Human genes 0.000 claims description 48
- 102100025945 Glutaredoxin-1 Human genes 0.000 claims description 47
- 101000856983 Homo sapiens Glutaredoxin-1 Proteins 0.000 claims description 47
- 102100040247 Tumor necrosis factor Human genes 0.000 claims description 47
- 101000760337 Homo sapiens Urokinase plasminogen activator surface receptor Proteins 0.000 claims description 46
- 102100024689 Urokinase plasminogen activator surface receptor Human genes 0.000 claims description 46
- 101001028730 Homo sapiens Transcription factor JunB Proteins 0.000 claims description 44
- 108091058560 IL8 Proteins 0.000 claims description 44
- 102000004890 Interleukin-8 Human genes 0.000 claims description 44
- 108090001007 Interleukin-8 Proteins 0.000 claims description 44
- 102100037168 Transcription factor JunB Human genes 0.000 claims description 44
- 108010058546 Cyclin D1 Proteins 0.000 claims description 43
- 102100024165 G1/S-specific cyclin-D1 Human genes 0.000 claims description 43
- 108090001005 Interleukin-6 Proteins 0.000 claims description 39
- 102100023059 Nuclear factor NF-kappa-B p100 subunit Human genes 0.000 claims description 38
- 108010044012 STAT1 Transcription Factor Proteins 0.000 claims description 38
- 102100029904 Signal transducer and activator of transcription 1-alpha/beta Human genes 0.000 claims description 38
- 101000598002 Homo sapiens Interferon regulatory factor 1 Proteins 0.000 claims description 37
- 101000979338 Homo sapiens Nuclear factor NF-kappa-B p100 subunit Proteins 0.000 claims description 37
- 101000611183 Homo sapiens Tumor necrosis factor Proteins 0.000 claims description 37
- 102100036981 Interferon regulatory factor 1 Human genes 0.000 claims description 37
- 101000961071 Homo sapiens NF-kappa-B inhibitor alpha Proteins 0.000 claims description 36
- 101000830568 Homo sapiens Tumor necrosis factor alpha-induced protein 2 Proteins 0.000 claims description 36
- 101710143112 Mothers against decapentaplegic homolog 4 Proteins 0.000 claims description 36
- 102100025725 Mothers against decapentaplegic homolog 4 Human genes 0.000 claims description 36
- 102100039337 NF-kappa-B inhibitor alpha Human genes 0.000 claims description 36
- 102100024595 Tumor necrosis factor alpha-induced protein 2 Human genes 0.000 claims description 36
- BSFODEXXVBBYOC-UHFFFAOYSA-N 8-[4-(dimethylamino)butan-2-ylamino]quinolin-6-ol Chemical compound C1=CN=C2C(NC(CCN(C)C)C)=CC(O)=CC2=C1 BSFODEXXVBBYOC-UHFFFAOYSA-N 0.000 claims description 35
- 108700003785 Baculoviral IAP Repeat-Containing 3 Proteins 0.000 claims description 35
- 102100021662 Baculoviral IAP repeat-containing protein 3 Human genes 0.000 claims description 35
- 101150104237 Birc3 gene Proteins 0.000 claims description 35
- 102100021943 C-C motif chemokine 2 Human genes 0.000 claims description 35
- 102100032367 C-C motif chemokine 5 Human genes 0.000 claims description 35
- 102100039398 C-X-C motif chemokine 2 Human genes 0.000 claims description 35
- 102100036189 C-X-C motif chemokine 3 Human genes 0.000 claims description 35
- 102100023471 E-selectin Human genes 0.000 claims description 35
- 102100020997 Fractalkine Human genes 0.000 claims description 35
- 102100034221 Growth-regulated alpha protein Human genes 0.000 claims description 35
- 101000897480 Homo sapiens C-C motif chemokine 2 Proteins 0.000 claims description 35
- 101000797762 Homo sapiens C-C motif chemokine 5 Proteins 0.000 claims description 35
- 101000889128 Homo sapiens C-X-C motif chemokine 2 Proteins 0.000 claims description 35
- 101000947193 Homo sapiens C-X-C motif chemokine 3 Proteins 0.000 claims description 35
- 101000622123 Homo sapiens E-selectin Proteins 0.000 claims description 35
- 101000854520 Homo sapiens Fractalkine Proteins 0.000 claims description 35
- 101001069921 Homo sapiens Growth-regulated alpha protein Proteins 0.000 claims description 35
- 101001033249 Homo sapiens Interleukin-1 beta Proteins 0.000 claims description 35
- 101000622304 Homo sapiens Vascular cell adhesion protein 1 Proteins 0.000 claims description 35
- 102100039065 Interleukin-1 beta Human genes 0.000 claims description 35
- 101150058731 STAT5A gene Proteins 0.000 claims description 35
- 101100379220 Saccharomyces cerevisiae (strain ATCC 204508 / S288c) API2 gene Proteins 0.000 claims description 35
- 102100024481 Signal transducer and activator of transcription 5A Human genes 0.000 claims description 35
- 102000004398 TNF receptor-associated factor 1 Human genes 0.000 claims description 35
- 108090000920 TNF receptor-associated factor 1 Proteins 0.000 claims description 35
- 102100023543 Vascular cell adhesion protein 1 Human genes 0.000 claims description 35
- 108010009356 Cyclin-Dependent Kinase Inhibitor p15 Proteins 0.000 claims description 34
- -1 (R)DOI Chemical compound 0.000 claims description 33
- 108700039143 HMGA2 Proteins 0.000 claims description 33
- 102100028999 High mobility group protein HMGI-C Human genes 0.000 claims description 33
- 101150073387 Hmga2 gene Proteins 0.000 claims description 33
- 108090000177 Interleukin-11 Proteins 0.000 claims description 32
- 102000003815 Interleukin-11 Human genes 0.000 claims description 32
- 102000009512 Cyclin-Dependent Kinase Inhibitor p15 Human genes 0.000 claims description 31
- 108010009540 DNA (Cytosine-5-)-Methyltransferase 1 Proteins 0.000 claims description 31
- 102100036279 DNA (cytosine-5)-methyltransferase 1 Human genes 0.000 claims description 31
- 102100021977 Ectonucleotide pyrophosphatase/phosphodiesterase family member 2 Human genes 0.000 claims description 31
- 101000897035 Homo sapiens Ectonucleotide pyrophosphatase/phosphodiesterase family member 2 Proteins 0.000 claims description 31
- 101000998194 Homo sapiens NF-kappa-B inhibitor epsilon Proteins 0.000 claims description 31
- 102100033104 NF-kappa-B inhibitor epsilon Human genes 0.000 claims description 31
- 101001121371 Homo sapiens Putative transcription factor Ovo-like 1 Proteins 0.000 claims description 30
- 101000596771 Homo sapiens Transcription factor 7-like 2 Proteins 0.000 claims description 30
- 102100026326 Putative transcription factor Ovo-like 1 Human genes 0.000 claims description 30
- 102100035101 Transcription factor 7-like 2 Human genes 0.000 claims description 30
- 230000001965 increasing effect Effects 0.000 claims description 30
- 102100031168 CCN family member 2 Human genes 0.000 claims description 29
- 102100031153 Growth arrest and DNA damage-inducible protein GADD45 beta Human genes 0.000 claims description 29
- 102100022057 Hepatocyte nuclear factor 1-alpha Human genes 0.000 claims description 29
- 101000777550 Homo sapiens CCN family member 2 Proteins 0.000 claims description 29
- 101001066164 Homo sapiens Growth arrest and DNA damage-inducible protein GADD45 beta Proteins 0.000 claims description 29
- 101001045751 Homo sapiens Hepatocyte nuclear factor 1-alpha Proteins 0.000 claims description 29
- 101000633054 Homo sapiens Zinc finger protein SNAI2 Proteins 0.000 claims description 28
- 102100029570 Zinc finger protein SNAI2 Human genes 0.000 claims description 28
- 101001117317 Homo sapiens Programmed cell death 1 ligand 1 Proteins 0.000 claims description 26
- 101000688996 Homo sapiens Ski-like protein Proteins 0.000 claims description 26
- 102100024216 Programmed cell death 1 ligand 1 Human genes 0.000 claims description 26
- 102100024451 Ski-like protein Human genes 0.000 claims description 26
- 101001135738 Homo sapiens Parathyroid hormone-related protein Proteins 0.000 claims description 25
- 102100036899 Parathyroid hormone-related protein Human genes 0.000 claims description 25
- 229960000598 infliximab Drugs 0.000 claims description 24
- 102100039328 Endoplasmin Human genes 0.000 claims description 23
- 101000812663 Homo sapiens Endoplasmin Proteins 0.000 claims description 23
- 101000808011 Homo sapiens Vascular endothelial growth factor A Proteins 0.000 claims description 23
- 101000785626 Homo sapiens Zinc finger E-box-binding homeobox 1 Proteins 0.000 claims description 23
- 102100040990 Platelet-derived growth factor subunit B Human genes 0.000 claims description 23
- 108010019674 Proto-Oncogene Proteins c-sis Proteins 0.000 claims description 23
- 102100039037 Vascular endothelial growth factor A Human genes 0.000 claims description 23
- 102100026457 Zinc finger E-box-binding homeobox 1 Human genes 0.000 claims description 23
- 102100026802 72 kDa type IV collagenase Human genes 0.000 claims description 22
- 101000627872 Homo sapiens 72 kDa type IV collagenase Proteins 0.000 claims description 22
- 101001046870 Homo sapiens Hypoxia-inducible factor 1-alpha Proteins 0.000 claims description 22
- 101000599940 Homo sapiens Interferon gamma Proteins 0.000 claims description 22
- 101000616502 Homo sapiens Phosphatidylinositol 3,4,5-trisphosphate 5-phosphatase 1 Proteins 0.000 claims description 22
- 101000801232 Homo sapiens Tumor necrosis factor receptor superfamily member 1B Proteins 0.000 claims description 22
- 101000944219 Homo sapiens cAMP-dependent protein kinase catalytic subunit beta Proteins 0.000 claims description 22
- 102100022875 Hypoxia-inducible factor 1-alpha Human genes 0.000 claims description 22
- 102100037850 Interferon gamma Human genes 0.000 claims description 22
- 102100021797 Phosphatidylinositol 3,4,5-trisphosphate 5-phosphatase 1 Human genes 0.000 claims description 22
- 102100027584 Protein c-Fos Human genes 0.000 claims description 22
- 102100033733 Tumor necrosis factor receptor superfamily member 1B Human genes 0.000 claims description 22
- 102100033065 cAMP-dependent protein kinase catalytic subunit beta Human genes 0.000 claims description 22
- 230000003247 decreasing effect Effects 0.000 claims description 22
- 101001030211 Homo sapiens Myc proto-oncogene protein Proteins 0.000 claims description 21
- 101000861454 Homo sapiens Protein c-Fos Proteins 0.000 claims description 21
- 102100038895 Myc proto-oncogene protein Human genes 0.000 claims description 21
- 102100034786 Cell migration-inducing and hyaluronan-binding protein Human genes 0.000 claims description 20
- 101000945881 Homo sapiens Cell migration-inducing and hyaluronan-binding protein Proteins 0.000 claims description 20
- 101001056180 Homo sapiens Induced myeloid leukemia cell differentiation protein Mcl-1 Proteins 0.000 claims description 20
- 102100026539 Induced myeloid leukemia cell differentiation protein Mcl-1 Human genes 0.000 claims description 20
- 102100031162 Collagen alpha-1(XVIII) chain Human genes 0.000 claims description 19
- 102100030074 Dickkopf-related protein 1 Human genes 0.000 claims description 19
- 102100036089 Fascin Human genes 0.000 claims description 19
- 102100035290 Fibroblast growth factor 13 Human genes 0.000 claims description 19
- 108090000379 Fibroblast growth factor 2 Proteins 0.000 claims description 19
- 101000940068 Homo sapiens Collagen alpha-1(XVIII) chain Proteins 0.000 claims description 19
- 101000864646 Homo sapiens Dickkopf-related protein 1 Proteins 0.000 claims description 19
- 101001021925 Homo sapiens Fascin Proteins 0.000 claims description 19
- 101000666775 Homo sapiens T-box transcription factor TBX3 Proteins 0.000 claims description 19
- 102100038409 T-box transcription factor TBX3 Human genes 0.000 claims description 19
- 108010083162 Twist-Related Protein 1 Proteins 0.000 claims description 19
- 102100030398 Twist-related protein 1 Human genes 0.000 claims description 19
- 102100032510 Heat shock protein HSP 90-beta Human genes 0.000 claims description 18
- 101001016856 Homo sapiens Heat shock protein HSP 90-beta Proteins 0.000 claims description 18
- 102100032912 CD44 antigen Human genes 0.000 claims description 17
- 101000868273 Homo sapiens CD44 antigen Proteins 0.000 claims description 17
- 101000972291 Homo sapiens Lymphoid enhancer-binding factor 1 Proteins 0.000 claims description 16
- 101000864800 Homo sapiens Serine/threonine-protein kinase Sgk1 Proteins 0.000 claims description 16
- 102100022699 Lymphoid enhancer-binding factor 1 Human genes 0.000 claims description 16
- 102100030070 Serine/threonine-protein kinase Sgk1 Human genes 0.000 claims description 16
- 101001128158 Homo sapiens Nanos homolog 2 Proteins 0.000 claims description 15
- 101001124991 Homo sapiens Nitric oxide synthase, inducible Proteins 0.000 claims description 15
- 101000620365 Homo sapiens Protein TMEPAI Proteins 0.000 claims description 15
- 101000869480 Homo sapiens Serum amyloid A-1 protein Proteins 0.000 claims description 15
- 101000638154 Homo sapiens Transmembrane protease serine 2 Proteins 0.000 claims description 15
- 108090000174 Interleukin-10 Proteins 0.000 claims description 15
- 102000003814 Interleukin-10 Human genes 0.000 claims description 15
- 102100029438 Nitric oxide synthase, inducible Human genes 0.000 claims description 15
- 102100022429 Protein TMEPAI Human genes 0.000 claims description 15
- 102100032277 Serum amyloid A-1 protein Human genes 0.000 claims description 15
- 102100031989 Transmembrane protease serine 2 Human genes 0.000 claims description 15
- 102100035925 DNA methyltransferase 1-associated protein 1 Human genes 0.000 claims description 14
- 101000930289 Homo sapiens DNA methyltransferase 1-associated protein 1 Proteins 0.000 claims description 14
- 101000966913 Homo sapiens ELL-associated factor 2 Proteins 0.000 claims description 14
- 101000878253 Homo sapiens Peptidyl-prolyl cis-trans isomerase FKBP5 Proteins 0.000 claims description 14
- 101000596046 Homo sapiens Plastin-2 Proteins 0.000 claims description 14
- 101001048702 Homo sapiens RNA polymerase II elongation factor ELL2 Proteins 0.000 claims description 14
- 101000762938 Homo sapiens TOX high mobility group box family member 4 Proteins 0.000 claims description 14
- 102100037026 Peptidyl-prolyl cis-trans isomerase FKBP5 Human genes 0.000 claims description 14
- 102100023750 RNA polymerase II elongation factor ELL2 Human genes 0.000 claims description 14
- 102100026749 TOX high mobility group box family member 4 Human genes 0.000 claims description 14
- 108010016788 Cyclin-Dependent Kinase Inhibitor p21 Proteins 0.000 claims description 12
- 102100033270 Cyclin-dependent kinase inhibitor 1 Human genes 0.000 claims description 12
- 210000001072 colon Anatomy 0.000 claims description 10
- 108020004999 messenger RNA Proteins 0.000 claims description 8
- 230000000968 intestinal effect Effects 0.000 claims description 7
- 229960000106 biosimilars Drugs 0.000 claims description 6
- VFLDPWHFBUODDF-FCXRPNKRSA-N curcumin Chemical compound C1=C(O)C(OC)=CC(\C=C\C(=O)CC(=O)\C=C\C=2C=C(OC)C(O)=CC=2)=C1 VFLDPWHFBUODDF-FCXRPNKRSA-N 0.000 claims description 6
- 230000002496 gastric effect Effects 0.000 claims description 6
- 229960002964 adalimumab Drugs 0.000 claims description 5
- 229960003115 certolizumab pegol Drugs 0.000 claims description 5
- 238000001514 detection method Methods 0.000 claims description 5
- 229960001743 golimumab Drugs 0.000 claims description 5
- 150000003384 small molecules Chemical class 0.000 claims description 5
- TYMMXVZAUGQKRF-UHFFFAOYSA-N (3-bromo-2,5-dimethoxy-7-bicyclo[4.2.0]octa-1(6),2,4-trienyl)methanamine;hydrobromide Chemical compound Br.COC1=CC(Br)=C(OC)C2=C1C(CN)C2 TYMMXVZAUGQKRF-UHFFFAOYSA-N 0.000 claims description 3
- UEJJHQNACJXSKW-UHFFFAOYSA-N 2-(2,6-dioxopiperidin-3-yl)-1H-isoindole-1,3(2H)-dione Chemical compound O=C1C2=CC=CC=C2C(=O)N1C1CCC(=O)NC1=O UEJJHQNACJXSKW-UHFFFAOYSA-N 0.000 claims description 3
- 240000004530 Echinacea purpurea Species 0.000 claims description 3
- 108010008165 Etanercept Proteins 0.000 claims description 3
- BYPFEZZEUUWMEJ-UHFFFAOYSA-N Pentoxifylline Chemical compound O=C1N(CCCCC(=O)C)C(=O)N(C)C2=C1N(C)C=N2 BYPFEZZEUUWMEJ-UHFFFAOYSA-N 0.000 claims description 3
- 101100098971 Saccharomyces cerevisiae (strain ATCC 204508 / S288c) TCB2 gene Proteins 0.000 claims description 3
- QHMBSVQNZZTUGM-UHFFFAOYSA-N Trans-Cannabidiol Natural products OC1=CC(CCCCC)=CC(O)=C1C1C(C(C)=C)CCC(C)=C1 QHMBSVQNZZTUGM-UHFFFAOYSA-N 0.000 claims description 3
- SNPPWIUOZRMYNY-UHFFFAOYSA-N bupropion Chemical compound CC(C)(C)NC(C)C(=O)C1=CC=CC(Cl)=C1 SNPPWIUOZRMYNY-UHFFFAOYSA-N 0.000 claims description 3
- 229960001058 bupropion Drugs 0.000 claims description 3
- ZTGXAWYVTLUPDT-UHFFFAOYSA-N cannabidiol Natural products OC1=CC(CCCCC)=CC(O)=C1C1C(C(C)=C)CC=C(C)C1 ZTGXAWYVTLUPDT-UHFFFAOYSA-N 0.000 claims description 3
- QHMBSVQNZZTUGM-ZWKOTPCHSA-N cannabidiol Chemical compound OC1=CC(CCCCC)=CC(O)=C1[C@H]1[C@H](C(C)=C)CCC(C)=C1 QHMBSVQNZZTUGM-ZWKOTPCHSA-N 0.000 claims description 3
- 229950011318 cannabidiol Drugs 0.000 claims description 3
- 150000001765 catechin Chemical class 0.000 claims description 3
- ADRVNXBAWSRFAJ-UHFFFAOYSA-N catechin Natural products OC1Cc2cc(O)cc(O)c2OC1c3ccc(O)c(O)c3 ADRVNXBAWSRFAJ-UHFFFAOYSA-N 0.000 claims description 3
- 235000005487 catechin Nutrition 0.000 claims description 3
- 229940109262 curcumin Drugs 0.000 claims description 3
- 235000012754 curcumin Nutrition 0.000 claims description 3
- 239000004148 curcumin Substances 0.000 claims description 3
- VFLDPWHFBUODDF-UHFFFAOYSA-N diferuloylmethane Natural products C1=C(O)C(OC)=CC(C=CC(=O)CC(=O)C=CC=2C=C(OC)C(O)=CC=2)=C1 VFLDPWHFBUODDF-UHFFFAOYSA-N 0.000 claims description 3
- PCXRACLQFPRCBB-ZWKOTPCHSA-N dihydrocannabidiol Natural products OC1=CC(CCCCC)=CC(O)=C1[C@H]1[C@H](C(C)C)CCC(C)=C1 PCXRACLQFPRCBB-ZWKOTPCHSA-N 0.000 claims description 3
- 235000014134 echinacea Nutrition 0.000 claims description 3
- 229960000403 etanercept Drugs 0.000 claims description 3
- 229960004942 lenalidomide Drugs 0.000 claims description 3
- GOTYRUGSSMKFNF-UHFFFAOYSA-N lenalidomide Chemical compound C1C=2C(N)=CC=CC=2C(=O)N1C1CCC(=O)NC1=O GOTYRUGSSMKFNF-UHFFFAOYSA-N 0.000 claims description 3
- 229960001476 pentoxifylline Drugs 0.000 claims description 3
- 229960000688 pomalidomide Drugs 0.000 claims description 3
- UVSMNLNDYGZFPF-UHFFFAOYSA-N pomalidomide Chemical compound O=C1C=2C(N)=CC=CC=2C(=O)N1C1CCC(=O)NC1=O UVSMNLNDYGZFPF-UHFFFAOYSA-N 0.000 claims description 3
- 239000002399 serotonin 2A agonist Substances 0.000 claims description 3
- 229960003433 thalidomide Drugs 0.000 claims description 3
- 102000012335 Plasminogen Activator Inhibitor 1 Human genes 0.000 claims 9
- 102000026633 IL6 Human genes 0.000 claims 6
- 238000001574 biopsy Methods 0.000 abstract description 37
- 238000002203 pretreatment Methods 0.000 abstract description 16
- 230000000977 initiatory effect Effects 0.000 abstract description 3
- 230000037361 pathway Effects 0.000 description 350
- 230000000694 effects Effects 0.000 description 191
- 230000005754 cellular signaling Effects 0.000 description 114
- 102100039418 Plasminogen activator inhibitor 1 Human genes 0.000 description 58
- 102000040945 Transcription factor Human genes 0.000 description 58
- 108091023040 Transcription factor Proteins 0.000 description 58
- ZRKFYGHZFMAOKI-QMGMOQQFSA-N tgfbeta Chemical compound C([C@H](NC(=O)[C@H](C(C)C)NC(=O)CNC(=O)[C@H](CCC(O)=O)NC(=O)[C@H](CCCNC(N)=N)NC(=O)[C@H](CC(N)=O)NC(=O)[C@H](CC(C)C)NC(=O)[C@H]([C@@H](C)O)NC(=O)[C@H](CCC(O)=O)NC(=O)[C@H]([C@@H](C)O)NC(=O)[C@H](CC(C)C)NC(=O)CNC(=O)[C@H](C)NC(=O)[C@H](CO)NC(=O)[C@H](CCC(N)=O)NC(=O)[C@@H](NC(=O)[C@H](C)NC(=O)[C@H](C)NC(=O)[C@@H](NC(=O)[C@H](CC(C)C)NC(=O)[C@@H](N)CCSC)C(C)C)[C@@H](C)CC)C(=O)N[C@@H]([C@@H](C)O)C(=O)N[C@@H](C(C)C)C(=O)N[C@@H](CC=1C=CC=CC=1)C(=O)N[C@@H](C)C(=O)N1[C@@H](CCC1)C(=O)N[C@@H]([C@@H](C)O)C(=O)N[C@@H](CC(N)=O)C(=O)N[C@@H](CCC(O)=O)C(=O)N[C@@H](C)C(=O)N[C@@H](CC=1C=CC=CC=1)C(=O)N[C@@H](CCCNC(N)=N)C(=O)N[C@@H](C)C(=O)N[C@@H](CC(C)C)C(=O)N1[C@@H](CCC1)C(=O)N1[C@@H](CCC1)C(=O)N[C@@H](CCCNC(N)=N)C(=O)N[C@@H](CCC(O)=O)C(=O)N[C@@H](CCCNC(N)=N)C(=O)N[C@@H](CO)C(=O)N[C@@H](CCCNC(N)=N)C(=O)N[C@@H](CC(C)C)C(=O)N[C@@H](CC(C)C)C(O)=O)C1=CC=C(O)C=C1 ZRKFYGHZFMAOKI-QMGMOQQFSA-N 0.000 description 46
- 230000019491 signal transduction Effects 0.000 description 44
- 102000004887 Transforming Growth Factor beta Human genes 0.000 description 40
- 108090001012 Transforming Growth Factor beta Proteins 0.000 description 40
- 102000013814 Wnt Human genes 0.000 description 38
- 108050003627 Wnt Proteins 0.000 description 38
- 108010017324 STAT3 Transcription Factor Proteins 0.000 description 37
- 102100024040 Signal transducer and activator of transcription 3 Human genes 0.000 description 37
- 102000004889 Interleukin-6 Human genes 0.000 description 33
- 102000004169 proteins and genes Human genes 0.000 description 29
- 238000013518 transcription Methods 0.000 description 19
- 230000035897 transcription Effects 0.000 description 19
- 238000013103 analytical ultracentrifugation Methods 0.000 description 16
- 238000003068 pathway analysis Methods 0.000 description 14
- 230000001276 controlling effect Effects 0.000 description 13
- 238000012544 monitoring process Methods 0.000 description 13
- 102100024490 Cdc42 effector protein 3 Human genes 0.000 description 12
- 102100027641 DNA-binding protein inhibitor ID-1 Human genes 0.000 description 12
- 101000762414 Homo sapiens Cdc42 effector protein 3 Proteins 0.000 description 12
- 101001081590 Homo sapiens DNA-binding protein inhibitor ID-1 Proteins 0.000 description 12
- 102100030608 Mothers against decapentaplegic homolog 7 Human genes 0.000 description 12
- 101700026522 SMAD7 Proteins 0.000 description 12
- 210000004027 cell Anatomy 0.000 description 12
- 101150090724 3 gene Proteins 0.000 description 11
- 102000005962 receptors Human genes 0.000 description 11
- 108020003175 receptors Proteins 0.000 description 11
- MZOFCQQQCNRIBI-VMXHOPILSA-N (3s)-4-[[(2s)-1-[[(2s)-1-[[(1s)-1-carboxy-2-hydroxyethyl]amino]-4-methyl-1-oxopentan-2-yl]amino]-5-(diaminomethylideneamino)-1-oxopentan-2-yl]amino]-3-[[2-[[(2s)-2,6-diaminohexanoyl]amino]acetyl]amino]-4-oxobutanoic acid Chemical compound OC[C@@H](C(O)=O)NC(=O)[C@H](CC(C)C)NC(=O)[C@H](CCCN=C(N)N)NC(=O)[C@H](CC(O)=O)NC(=O)CNC(=O)[C@@H](N)CCCCN MZOFCQQQCNRIBI-VMXHOPILSA-N 0.000 description 10
- 108060008682 Tumor Necrosis Factor Proteins 0.000 description 10
- 102100020903 Ezrin Human genes 0.000 description 9
- 101000854648 Homo sapiens Ezrin Proteins 0.000 description 9
- 238000000585 Mann–Whitney U test Methods 0.000 description 9
- 102100030610 Mothers against decapentaplegic homolog 5 Human genes 0.000 description 9
- 101710143113 Mothers against decapentaplegic homolog 5 Proteins 0.000 description 9
- 208000037265 diseases, disorders, signs and symptoms Diseases 0.000 description 9
- 238000000528 statistical test Methods 0.000 description 9
- 238000002560 therapeutic procedure Methods 0.000 description 9
- 102100025615 Gamma-synuclein Human genes 0.000 description 8
- 101000787273 Homo sapiens Gamma-synuclein Proteins 0.000 description 8
- 201000010099 disease Diseases 0.000 description 8
- 102000052116 epidermal growth factor receptor activity proteins Human genes 0.000 description 8
- 108700015053 epidermal growth factor receptor activity proteins Proteins 0.000 description 8
- 210000004877 mucosa Anatomy 0.000 description 8
- YOHYSYJDKVYCJI-UHFFFAOYSA-N n-[3-[[6-[3-(trifluoromethyl)anilino]pyrimidin-4-yl]amino]phenyl]cyclopropanecarboxamide Chemical compound FC(F)(F)C1=CC=CC(NC=2N=CN=C(NC=3C=C(NC(=O)C4CC4)C=CC=3)C=2)=C1 YOHYSYJDKVYCJI-UHFFFAOYSA-N 0.000 description 8
- 208000024891 symptom Diseases 0.000 description 8
- 101000635938 Homo sapiens Transforming growth factor beta-1 proprotein Proteins 0.000 description 7
- 238000011529 RT qPCR Methods 0.000 description 7
- 102100030742 Transforming growth factor beta-1 proprotein Human genes 0.000 description 7
- 239000008186 active pharmaceutical agent Substances 0.000 description 7
- 239000003795 chemical substances by application Substances 0.000 description 7
- 229940079593 drug Drugs 0.000 description 7
- 239000003814 drug Substances 0.000 description 7
- 239000013074 reference sample Substances 0.000 description 7
- 238000012360 testing method Methods 0.000 description 7
- 230000002103 transcriptional effect Effects 0.000 description 7
- 108091032973 (ribonucleotides)n+m Proteins 0.000 description 6
- 102100021663 Baculoviral IAP repeat-containing protein 5 Human genes 0.000 description 6
- 108700039887 Essential Genes Proteins 0.000 description 6
- 102100031150 Growth arrest and DNA damage-inducible protein GADD45 alpha Human genes 0.000 description 6
- 102100040407 Heat shock 70 kDa protein 1B Human genes 0.000 description 6
- 102100034051 Heat shock protein HSP 90-alpha Human genes 0.000 description 6
- 101001066158 Homo sapiens Growth arrest and DNA damage-inducible protein GADD45 alpha Proteins 0.000 description 6
- 101001037968 Homo sapiens Heat shock 70 kDa protein 1B Proteins 0.000 description 6
- 101001016865 Homo sapiens Heat shock protein HSP 90-alpha Proteins 0.000 description 6
- 102100030590 Mothers against decapentaplegic homolog 6 Human genes 0.000 description 6
- 101710143114 Mothers against decapentaplegic homolog 6 Proteins 0.000 description 6
- 108091028043 Nucleic acid sequence Proteins 0.000 description 6
- 108010002687 Survivin Proteins 0.000 description 6
- 239000003446 ligand Substances 0.000 description 6
- 230000001960 triggered effect Effects 0.000 description 6
- 108091027981 Response element Proteins 0.000 description 5
- 230000007783 downstream signaling Effects 0.000 description 5
- 238000001802 infusion Methods 0.000 description 5
- 230000002401 inhibitory effect Effects 0.000 description 5
- 238000005259 measurement Methods 0.000 description 5
- 230000011664 signaling Effects 0.000 description 5
- 102100036848 C-C motif chemokine 20 Human genes 0.000 description 4
- 102100025064 Cellular tumor antigen p53 Human genes 0.000 description 4
- 102100029145 DNA damage-inducible transcript 3 protein Human genes 0.000 description 4
- 102100029790 Defensin-6 Human genes 0.000 description 4
- 101000713099 Homo sapiens C-C motif chemokine 20 Proteins 0.000 description 4
- 101000865479 Homo sapiens Defensin-6 Proteins 0.000 description 4
- 101000976051 Homo sapiens Involucrin Proteins 0.000 description 4
- 101001139126 Homo sapiens Krueppel-like factor 6 Proteins 0.000 description 4
- 101000979748 Homo sapiens Protein NDRG1 Proteins 0.000 description 4
- 101000663000 Homo sapiens TNFAIP3-interacting protein 1 Proteins 0.000 description 4
- 101000638161 Homo sapiens Tumor necrosis factor ligand superfamily member 6 Proteins 0.000 description 4
- 102000000588 Interleukin-2 Human genes 0.000 description 4
- 108010002350 Interleukin-2 Proteins 0.000 description 4
- 102100023913 Involucrin Human genes 0.000 description 4
- 102100020679 Krueppel-like factor 6 Human genes 0.000 description 4
- 102100024980 Protein NDRG1 Human genes 0.000 description 4
- 238000003559 RNA-seq method Methods 0.000 description 4
- 102100037667 TNFAIP3-interacting protein 1 Human genes 0.000 description 4
- 108010057666 Transcription Factor CHOP Proteins 0.000 description 4
- 108010078814 Tumor Suppressor Protein p53 Proteins 0.000 description 4
- 102100031988 Tumor necrosis factor ligand superfamily member 6 Human genes 0.000 description 4
- 108010073919 Vascular Endothelial Growth Factor D Proteins 0.000 description 4
- 102100038234 Vascular endothelial growth factor D Human genes 0.000 description 4
- 230000000112 colonic effect Effects 0.000 description 4
- 238000003745 diagnosis Methods 0.000 description 4
- 239000000539 dimer Substances 0.000 description 4
- 230000028993 immune response Effects 0.000 description 4
- 239000003112 inhibitor Substances 0.000 description 4
- 230000000670 limiting effect Effects 0.000 description 4
- 238000002493 microarray Methods 0.000 description 4
- 125000003729 nucleotide group Chemical group 0.000 description 4
- 210000001519 tissue Anatomy 0.000 description 4
- 102000017904 ADRA2C Human genes 0.000 description 3
- 102100028163 ATP-binding cassette sub-family C member 4 Human genes 0.000 description 3
- 102100022144 Achaete-scute homolog 2 Human genes 0.000 description 3
- 102100021569 Apoptosis regulator Bcl-2 Human genes 0.000 description 3
- 102100035683 Axin-2 Human genes 0.000 description 3
- 108091012583 BCL2 Proteins 0.000 description 3
- 102100022544 Bone morphogenetic protein 7 Human genes 0.000 description 3
- 102100031051 Cysteine and glycine-rich protein 1 Human genes 0.000 description 3
- 102100038522 Fascin-2 Human genes 0.000 description 3
- 102100038523 Fascin-3 Human genes 0.000 description 3
- 102100039676 Frizzled-7 Human genes 0.000 description 3
- 102100039611 Glutamine synthetase Human genes 0.000 description 3
- 102100040352 Heat shock 70 kDa protein 1A Human genes 0.000 description 3
- 102100027875 Homeobox protein Nkx-2.5 Human genes 0.000 description 3
- 101000986629 Homo sapiens ATP-binding cassette sub-family C member 4 Proteins 0.000 description 3
- 101000901109 Homo sapiens Achaete-scute homolog 2 Proteins 0.000 description 3
- 101000720032 Homo sapiens Alpha-2C adrenergic receptor Proteins 0.000 description 3
- 101000874569 Homo sapiens Axin-2 Proteins 0.000 description 3
- 101000899361 Homo sapiens Bone morphogenetic protein 7 Proteins 0.000 description 3
- 101000802406 Homo sapiens E3 ubiquitin-protein ligase ZNRF3 Proteins 0.000 description 3
- 101000866287 Homo sapiens Excitatory amino acid transporter 2 Proteins 0.000 description 3
- 101001030534 Homo sapiens Fascin-2 Proteins 0.000 description 3
- 101001030532 Homo sapiens Fascin-3 Proteins 0.000 description 3
- 101000885797 Homo sapiens Frizzled-7 Proteins 0.000 description 3
- 101000888841 Homo sapiens Glutamine synthetase Proteins 0.000 description 3
- 101001037759 Homo sapiens Heat shock 70 kDa protein 1A Proteins 0.000 description 3
- 101000632197 Homo sapiens Homeobox protein Nkx-2.5 Proteins 0.000 description 3
- 101000911772 Homo sapiens Hsc70-interacting protein Proteins 0.000 description 3
- 101001032341 Homo sapiens Interferon regulatory factor 9 Proteins 0.000 description 3
- 101000605528 Homo sapiens Kallikrein-2 Proteins 0.000 description 3
- 101000945751 Homo sapiens Leukocyte cell-derived chemotaxin-2 Proteins 0.000 description 3
- 101000581803 Homo sapiens Lithostathine-1-beta Proteins 0.000 description 3
- 101001133056 Homo sapiens Mucin-1 Proteins 0.000 description 3
- 101001000780 Homo sapiens POU domain, class 2, transcription factor 1 Proteins 0.000 description 3
- 101000741790 Homo sapiens Peroxisome proliferator-activated receptor gamma Proteins 0.000 description 3
- 101001091365 Homo sapiens Plasma kallikrein Proteins 0.000 description 3
- 101000611936 Homo sapiens Programmed cell death protein 1 Proteins 0.000 description 3
- 101000605534 Homo sapiens Prostate-specific antigen Proteins 0.000 description 3
- 101000972806 Homo sapiens Protein naked cuticle homolog 1 Proteins 0.000 description 3
- 101000824318 Homo sapiens Protocadherin Fat 1 Proteins 0.000 description 3
- 101000779418 Homo sapiens RAC-alpha serine/threonine-protein kinase Proteins 0.000 description 3
- 101000835745 Homo sapiens Teratocarcinoma-derived growth factor 1 Proteins 0.000 description 3
- 101000711846 Homo sapiens Transcription factor SOX-9 Proteins 0.000 description 3
- 101000644847 Homo sapiens Ubl carboxyl-terminal hydrolase 18 Proteins 0.000 description 3
- 101000702691 Homo sapiens Zinc finger protein SNAI1 Proteins 0.000 description 3
- 206010061218 Inflammation Diseases 0.000 description 3
- 102100038251 Interferon regulatory factor 9 Human genes 0.000 description 3
- 108010050904 Interferons Proteins 0.000 description 3
- 102000014150 Interferons Human genes 0.000 description 3
- 102100038356 Kallikrein-2 Human genes 0.000 description 3
- 102100034762 Leukocyte cell-derived chemotaxin-2 Human genes 0.000 description 3
- 102100027338 Lithostathine-1-beta Human genes 0.000 description 3
- 102100025744 Mothers against decapentaplegic homolog 1 Human genes 0.000 description 3
- 102100025751 Mothers against decapentaplegic homolog 2 Human genes 0.000 description 3
- 101710143123 Mothers against decapentaplegic homolog 2 Proteins 0.000 description 3
- 102100025748 Mothers against decapentaplegic homolog 3 Human genes 0.000 description 3
- 101710143111 Mothers against decapentaplegic homolog 3 Proteins 0.000 description 3
- 102100030607 Mothers against decapentaplegic homolog 9 Human genes 0.000 description 3
- 102100034256 Mucin-1 Human genes 0.000 description 3
- 108010070047 Notch Receptors Proteins 0.000 description 3
- 101710148753 Ornithine aminotransferase Proteins 0.000 description 3
- 102100027177 Ornithine aminotransferase, mitochondrial Human genes 0.000 description 3
- 102100035593 POU domain, class 2, transcription factor 1 Human genes 0.000 description 3
- 102100038825 Peroxisome proliferator-activated receptor gamma Human genes 0.000 description 3
- 102100040678 Programmed cell death protein 1 Human genes 0.000 description 3
- 102100038358 Prostate-specific antigen Human genes 0.000 description 3
- 102100022560 Protein naked cuticle homolog 1 Human genes 0.000 description 3
- 102100022095 Protocadherin Fat 1 Human genes 0.000 description 3
- 102100033810 RAC-alpha serine/threonine-protein kinase Human genes 0.000 description 3
- 102000012980 SLC1A2 Human genes 0.000 description 3
- 101700032040 SMAD1 Proteins 0.000 description 3
- 101700031501 SMAD9 Proteins 0.000 description 3
- 102100026404 Teratocarcinoma-derived growth factor 1 Human genes 0.000 description 3
- 102100023132 Transcription factor Jun Human genes 0.000 description 3
- 102100034204 Transcription factor SOX-9 Human genes 0.000 description 3
- 102100020726 Ubl carboxyl-terminal hydrolase 18 Human genes 0.000 description 3
- 102000006083 ZNRF3 Human genes 0.000 description 3
- 102100030917 Zinc finger protein SNAI1 Human genes 0.000 description 3
- 230000005856 abnormality Effects 0.000 description 3
- 230000001363 autoimmune Effects 0.000 description 3
- 108091006374 cAMP receptor proteins Proteins 0.000 description 3
- 238000005094 computer simulation Methods 0.000 description 3
- 238000001839 endoscopy Methods 0.000 description 3
- 230000035876 healing Effects 0.000 description 3
- 230000006872 improvement Effects 0.000 description 3
- 230000004054 inflammatory process Effects 0.000 description 3
- 229940079322 interferon Drugs 0.000 description 3
- 229940100601 interleukin-6 Drugs 0.000 description 3
- 230000003834 intracellular effect Effects 0.000 description 3
- 238000013178 mathematical model Methods 0.000 description 3
- 210000004400 mucous membrane Anatomy 0.000 description 3
- 239000002773 nucleotide Substances 0.000 description 3
- 239000013610 patient sample Substances 0.000 description 3
- 239000000902 placebo Substances 0.000 description 3
- 229940068196 placebo Drugs 0.000 description 3
- 238000004393 prognosis Methods 0.000 description 3
- 210000000813 small intestine Anatomy 0.000 description 3
- CDKIEBFIMCSCBB-UHFFFAOYSA-N 1-(6,7-dimethoxy-3,4-dihydro-1h-isoquinolin-2-yl)-3-(1-methyl-2-phenylpyrrolo[2,3-b]pyridin-3-yl)prop-2-en-1-one;hydrochloride Chemical compound Cl.C1C=2C=C(OC)C(OC)=CC=2CCN1C(=O)C=CC(C1=CC=CN=C1N1C)=C1C1=CC=CC=C1 CDKIEBFIMCSCBB-UHFFFAOYSA-N 0.000 description 2
- 102000010400 1-phosphatidylinositol-3-kinase activity proteins Human genes 0.000 description 2
- 102100027769 2'-5'-oligoadenylate synthase 1 Human genes 0.000 description 2
- 101001059929 Caenorhabditis elegans Forkhead box protein O Proteins 0.000 description 2
- 208000014997 Crohn colitis Diseases 0.000 description 2
- 208000023373 Crohn ileitis Diseases 0.000 description 2
- 102100021307 Cyclic AMP-responsive element-binding protein 3-like protein 4 Human genes 0.000 description 2
- 102000004127 Cytokines Human genes 0.000 description 2
- 108090000695 Cytokines Proteins 0.000 description 2
- 102100035890 Delta(24)-sterol reductase Human genes 0.000 description 2
- 102100026245 E3 ubiquitin-protein ligase RNF43 Human genes 0.000 description 2
- 102100037680 Fibroblast growth factor 8 Human genes 0.000 description 2
- 102100031181 Glyceraldehyde-3-phosphate dehydrogenase Human genes 0.000 description 2
- 102100028092 Homeobox protein Nkx-3.1 Human genes 0.000 description 2
- 101001008907 Homo sapiens 2'-5'-oligoadenylate synthase 1 Proteins 0.000 description 2
- 101000895309 Homo sapiens Cyclic AMP-responsive element-binding protein 3-like protein 4 Proteins 0.000 description 2
- 101000929877 Homo sapiens Delta(24)-sterol reductase Proteins 0.000 description 2
- 101000838507 Homo sapiens Developmentally-regulated GTP-binding protein 1 Proteins 0.000 description 2
- 101000692702 Homo sapiens E3 ubiquitin-protein ligase RNF43 Proteins 0.000 description 2
- 101001027382 Homo sapiens Fibroblast growth factor 8 Proteins 0.000 description 2
- 101000578249 Homo sapiens Homeobox protein Nkx-3.1 Proteins 0.000 description 2
- 101000599951 Homo sapiens Insulin-like growth factor I Proteins 0.000 description 2
- 101001032342 Homo sapiens Interferon regulatory factor 7 Proteins 0.000 description 2
- 101001032345 Homo sapiens Interferon regulatory factor 8 Proteins 0.000 description 2
- 101000619640 Homo sapiens Leucine-rich repeats and immunoglobulin-like domains protein 1 Proteins 0.000 description 2
- 101000602176 Homo sapiens Neurotensin/neuromedin N Proteins 0.000 description 2
- 101000605432 Homo sapiens Phospholipid phosphatase 1 Proteins 0.000 description 2
- 101000873843 Homo sapiens Sorting and assembly machinery component 50 homolog Proteins 0.000 description 2
- 101000976959 Homo sapiens Transcription factor 4 Proteins 0.000 description 2
- 101000836148 Homo sapiens Transforming acidic coiled-coil-containing protein 2 Proteins 0.000 description 2
- 101001087394 Homo sapiens Tyrosine-protein phosphatase non-receptor type 1 Proteins 0.000 description 2
- 102100027037 Hsc70-interacting protein Human genes 0.000 description 2
- 102100037852 Insulin-like growth factor I Human genes 0.000 description 2
- 102100038070 Interferon regulatory factor 7 Human genes 0.000 description 2
- 102100038069 Interferon regulatory factor 8 Human genes 0.000 description 2
- 102100022170 Leucine-rich repeats and immunoglobulin-like domains protein 1 Human genes 0.000 description 2
- TWRXJAOTZQYOKJ-UHFFFAOYSA-L Magnesium chloride Chemical compound [Mg+2].[Cl-].[Cl-] TWRXJAOTZQYOKJ-UHFFFAOYSA-L 0.000 description 2
- 206010028980 Neoplasm Diseases 0.000 description 2
- 102100037590 Neurotensin/neuromedin N Human genes 0.000 description 2
- 108091007960 PI3Ks Proteins 0.000 description 2
- 108091093037 Peptide nucleic acid Proteins 0.000 description 2
- 102100038121 Phospholipid phosphatase 1 Human genes 0.000 description 2
- 108091030071 RNAI Proteins 0.000 description 2
- 102100035853 Sorting and assembly machinery component 50 homolog Human genes 0.000 description 2
- 102000006467 TATA-Box Binding Protein Human genes 0.000 description 2
- 108010044281 TATA-Box Binding Protein Proteins 0.000 description 2
- 102100027044 Transforming acidic coiled-coil-containing protein 2 Human genes 0.000 description 2
- 206010054094 Tumour necrosis Diseases 0.000 description 2
- 102100033001 Tyrosine-protein phosphatase non-receptor type 1 Human genes 0.000 description 2
- 102100029633 UDP-glucuronosyltransferase 2B15 Human genes 0.000 description 2
- 101710200683 UDP-glucuronosyltransferase 2B15 Proteins 0.000 description 2
- 208000025865 Ulcer Diseases 0.000 description 2
- 239000002160 alpha blocker Substances 0.000 description 2
- 238000004458 analytical method Methods 0.000 description 2
- 230000000259 anti-tumor effect Effects 0.000 description 2
- 210000000436 anus Anatomy 0.000 description 2
- 230000008901 benefit Effects 0.000 description 2
- 238000002052 colonoscopy Methods 0.000 description 2
- 239000003246 corticosteroid Substances 0.000 description 2
- 229960001334 corticosteroids Drugs 0.000 description 2
- 230000001419 dependent effect Effects 0.000 description 2
- 230000004069 differentiation Effects 0.000 description 2
- 210000000981 epithelium Anatomy 0.000 description 2
- 230000003628 erosive effect Effects 0.000 description 2
- 210000003238 esophagus Anatomy 0.000 description 2
- 210000001035 gastrointestinal tract Anatomy 0.000 description 2
- 230000009368 gene silencing by RNA Effects 0.000 description 2
- 108020004445 glyceraldehyde-3-phosphate dehydrogenase Proteins 0.000 description 2
- 230000002962 histologic effect Effects 0.000 description 2
- 239000000710 homodimer Substances 0.000 description 2
- 208000009326 ileitis Diseases 0.000 description 2
- 230000001939 inductive effect Effects 0.000 description 2
- 208000015181 infectious disease Diseases 0.000 description 2
- 230000008595 infiltration Effects 0.000 description 2
- 238000001764 infiltration Methods 0.000 description 2
- 230000002757 inflammatory effect Effects 0.000 description 2
- 210000002429 large intestine Anatomy 0.000 description 2
- 238000000370 laser capture micro-dissection Methods 0.000 description 2
- 238000004949 mass spectrometry Methods 0.000 description 2
- 108091070501 miRNA Proteins 0.000 description 2
- 239000002679 microRNA Substances 0.000 description 2
- 210000000214 mouth Anatomy 0.000 description 2
- 229930014626 natural product Natural products 0.000 description 2
- 210000000440 neutrophil Anatomy 0.000 description 2
- 102000039446 nucleic acids Human genes 0.000 description 2
- 108020004707 nucleic acids Proteins 0.000 description 2
- 150000007523 nucleic acids Chemical class 0.000 description 2
- 230000036542 oxidative stress Effects 0.000 description 2
- 230000007310 pathophysiology Effects 0.000 description 2
- 210000000664 rectum Anatomy 0.000 description 2
- 230000001105 regulatory effect Effects 0.000 description 2
- 210000002784 stomach Anatomy 0.000 description 2
- 238000013517 stratification Methods 0.000 description 2
- 230000002100 tumorsuppressive effect Effects 0.000 description 2
- 102000015936 AP-1 transcription factor Human genes 0.000 description 1
- 108050004195 AP-1 transcription factor Proteins 0.000 description 1
- 102000039549 ATF family Human genes 0.000 description 1
- 108091067350 ATF family Proteins 0.000 description 1
- 208000004998 Abdominal Pain Diseases 0.000 description 1
- 102100022900 Actin, cytoplasmic 1 Human genes 0.000 description 1
- 108010085238 Actins Proteins 0.000 description 1
- 208000023275 Autoimmune disease Diseases 0.000 description 1
- 108060000903 Beta-catenin Proteins 0.000 description 1
- 102000015735 Beta-catenin Human genes 0.000 description 1
- IVOMOUWHDPKRLL-KQYNXXCUSA-N Cyclic adenosine monophosphate Chemical compound C([C@H]1O2)OP(O)(=O)O[C@H]1[C@@H](O)[C@@H]2N1C(N=CN=C2N)=C2N=C1 IVOMOUWHDPKRLL-KQYNXXCUSA-N 0.000 description 1
- 206010012735 Diarrhoea Diseases 0.000 description 1
- 206010059866 Drug resistance Diseases 0.000 description 1
- 208000030453 Drug-Related Side Effects and Adverse reaction Diseases 0.000 description 1
- 102100023877 E3 ubiquitin-protein ligase RBX1 Human genes 0.000 description 1
- 101710095156 E3 ubiquitin-protein ligase RBX1 Proteins 0.000 description 1
- 102100031780 Endonuclease Human genes 0.000 description 1
- 101710128765 Enhancer of filamentation 1 Proteins 0.000 description 1
- 102000004190 Enzymes Human genes 0.000 description 1
- 108090000790 Enzymes Proteins 0.000 description 1
- 102100031982 Ephrin type-B receptor 3 Human genes 0.000 description 1
- 108090000123 Fos-related antigen 1 Proteins 0.000 description 1
- 102000003817 Fos-related antigen 1 Human genes 0.000 description 1
- 101150096607 Fosl2 gene Proteins 0.000 description 1
- 108010001498 Galectin 1 Proteins 0.000 description 1
- 102100021736 Galectin-1 Human genes 0.000 description 1
- 206010018691 Granuloma Diseases 0.000 description 1
- 102100039874 Guanine nucleotide-binding protein G(z) subunit alpha Human genes 0.000 description 1
- 102100040754 Guanylate cyclase soluble subunit alpha-1 Human genes 0.000 description 1
- 101001064458 Homo sapiens Ephrin type-B receptor 3 Proteins 0.000 description 1
- 101000887490 Homo sapiens Guanine nucleotide-binding protein G(z) subunit alpha Proteins 0.000 description 1
- 101001038755 Homo sapiens Guanylate cyclase soluble subunit alpha-1 Proteins 0.000 description 1
- 101000995138 Homo sapiens NFAT activation molecule 1 Proteins 0.000 description 1
- 101000736088 Homo sapiens PC4 and SFRS1-interacting protein Proteins 0.000 description 1
- 101000620591 Homo sapiens Ras-related protein Rab-36 Proteins 0.000 description 1
- 101001092196 Homo sapiens Ret finger protein-like 3 Proteins 0.000 description 1
- 101000829138 Homo sapiens Somatostatin receptor type 3 Proteins 0.000 description 1
- 101000596772 Homo sapiens Transcription factor 7-like 1 Proteins 0.000 description 1
- 101000666382 Homo sapiens Transcription factor E2-alpha Proteins 0.000 description 1
- 101001050288 Homo sapiens Transcription factor Jun Proteins 0.000 description 1
- 101000708741 Homo sapiens Transcription factor RelB Proteins 0.000 description 1
- 101000848450 Homo sapiens tRNA (guanine(26)-N(2))-dimethyltransferase Proteins 0.000 description 1
- 206010062016 Immunosuppression Diseases 0.000 description 1
- 101150026829 JUNB gene Proteins 0.000 description 1
- 101150021395 JUND gene Proteins 0.000 description 1
- 102000043136 MAP kinase family Human genes 0.000 description 1
- 108091054455 MAP kinase family Proteins 0.000 description 1
- 102100022450 Mitochondrial tRNA-specific 2-thiouridylase 1 Human genes 0.000 description 1
- 101000713102 Mus musculus C-C motif chemokine 1 Proteins 0.000 description 1
- 101001002507 Mus musculus Immunoglobulin-binding protein 1 Proteins 0.000 description 1
- 102100034394 NFAT activation molecule 1 Human genes 0.000 description 1
- 101000764517 Nephroselmis olivacea Photosystem I assembly protein Ycf3 Proteins 0.000 description 1
- 102100023617 Neutrophil cytosol factor 4 Human genes 0.000 description 1
- 102000005650 Notch Receptors Human genes 0.000 description 1
- 108010071563 Proto-Oncogene Proteins c-fos Proteins 0.000 description 1
- 206010037660 Pyrexia Diseases 0.000 description 1
- 101710178916 RING-box protein 1 Proteins 0.000 description 1
- 108010092799 RNA-directed DNA polymerase Proteins 0.000 description 1
- 102100022295 Ras-related protein Rab-36 Human genes 0.000 description 1
- 206010038063 Rectal haemorrhage Diseases 0.000 description 1
- 102100035528 Ret finger protein-like 3 Human genes 0.000 description 1
- 108700028341 SMARCB1 Proteins 0.000 description 1
- 101150008214 SMARCB1 gene Proteins 0.000 description 1
- 102100025746 SWI/SNF-related matrix-associated actin-dependent regulator of chromatin subfamily B member 1 Human genes 0.000 description 1
- 102000007374 Smad Proteins Human genes 0.000 description 1
- 108010007945 Smad Proteins Proteins 0.000 description 1
- 108020004459 Small interfering RNA Proteins 0.000 description 1
- 102100023803 Somatostatin receptor type 3 Human genes 0.000 description 1
- 101001106895 Staphylococcus aureus (strain COL) Peptide chain release factor 3 Proteins 0.000 description 1
- 108091005735 TGF-beta receptors Proteins 0.000 description 1
- 102100038313 Transcription factor E2-alpha Human genes 0.000 description 1
- 102100032727 Transcription factor RelB Human genes 0.000 description 1
- 102000016715 Transforming Growth Factor beta Receptors Human genes 0.000 description 1
- IVOMOUWHDPKRLL-UHFFFAOYSA-N UNPD107823 Natural products O1C2COP(O)(=O)OC2C(O)C1N1C(N=CN=C2N)=C2N=C1 IVOMOUWHDPKRLL-UHFFFAOYSA-N 0.000 description 1
- 208000036142 Viral infection Diseases 0.000 description 1
- 238000001793 Wilcoxon signed-rank test Methods 0.000 description 1
- 230000002159 abnormal effect Effects 0.000 description 1
- 238000013459 approach Methods 0.000 description 1
- 238000013528 artificial neural network Methods 0.000 description 1
- 230000008827 biological function Effects 0.000 description 1
- 239000000090 biomarker Substances 0.000 description 1
- 230000015572 biosynthetic process Effects 0.000 description 1
- 238000001815 biotherapy Methods 0.000 description 1
- 239000008280 blood Substances 0.000 description 1
- 230000037396 body weight Effects 0.000 description 1
- 239000000872 buffer Substances 0.000 description 1
- 201000011510 cancer Diseases 0.000 description 1
- 230000007969 cellular immunity Effects 0.000 description 1
- 230000008859 change Effects 0.000 description 1
- 238000006243 chemical reaction Methods 0.000 description 1
- 239000003153 chemical reaction reagent Substances 0.000 description 1
- 230000001684 chronic effect Effects 0.000 description 1
- 208000037976 chronic inflammation Diseases 0.000 description 1
- 230000006020 chronic inflammation Effects 0.000 description 1
- 238000003776 cleavage reaction Methods 0.000 description 1
- 238000002648 combination therapy Methods 0.000 description 1
- 229940095074 cyclic amp Drugs 0.000 description 1
- 230000006378 damage Effects 0.000 description 1
- 210000002249 digestive system Anatomy 0.000 description 1
- 208000035475 disorder Diseases 0.000 description 1
- 238000002651 drug therapy Methods 0.000 description 1
- 210000003979 eosinophil Anatomy 0.000 description 1
- 230000008378 epithelial damage Effects 0.000 description 1
- 238000002474 experimental method Methods 0.000 description 1
- 206010016256 fatigue Diseases 0.000 description 1
- 238000009093 first-line therapy Methods 0.000 description 1
- 238000001943 fluorescence-activated cell sorting Methods 0.000 description 1
- 101150064107 fosB gene Proteins 0.000 description 1
- 210000003736 gastrointestinal content Anatomy 0.000 description 1
- 239000003102 growth factor Substances 0.000 description 1
- 239000000833 heterodimer Substances 0.000 description 1
- 210000003405 ileum Anatomy 0.000 description 1
- 210000002865 immune cell Anatomy 0.000 description 1
- 230000005847 immunogenicity Effects 0.000 description 1
- 239000002955 immunomodulating agent Substances 0.000 description 1
- 229940121354 immunomodulator Drugs 0.000 description 1
- 230000002584 immunomodulator Effects 0.000 description 1
- 230000001506 immunosuppresive effect Effects 0.000 description 1
- 230000001524 infective effect Effects 0.000 description 1
- 230000004968 inflammatory condition Effects 0.000 description 1
- 208000027866 inflammatory disease Diseases 0.000 description 1
- 230000005764 inhibitory process Effects 0.000 description 1
- 238000001990 intravenous administration Methods 0.000 description 1
- 230000003902 lesion Effects 0.000 description 1
- 238000010801 machine learning Methods 0.000 description 1
- 229910001629 magnesium chloride Inorganic materials 0.000 description 1
- 230000007246 mechanism Effects 0.000 description 1
- 244000005700 microbiome Species 0.000 description 1
- 210000005087 mononuclear cell Anatomy 0.000 description 1
- 125000004573 morpholin-4-yl group Chemical group N1(CCOCC1)* 0.000 description 1
- 230000035772 mutation Effects 0.000 description 1
- 108010086154 neutrophil cytosol factor 40K Proteins 0.000 description 1
- 238000010606 normalization Methods 0.000 description 1
- 108091008581 nuclear androgen receptors Proteins 0.000 description 1
- 230000001991 pathophysiological effect Effects 0.000 description 1
- 238000011338 personalized therapy Methods 0.000 description 1
- 239000002243 precursor Substances 0.000 description 1
- 230000036647 reaction Effects 0.000 description 1
- 230000000306 recurrent effect Effects 0.000 description 1
- 230000009467 reduction Effects 0.000 description 1
- 230000002829 reductive effect Effects 0.000 description 1
- 238000011160 research Methods 0.000 description 1
- 230000007017 scission Effects 0.000 description 1
- 238000007790 scraping Methods 0.000 description 1
- 238000007619 statistical method Methods 0.000 description 1
- 230000004936 stimulating effect Effects 0.000 description 1
- 238000012706 support-vector machine Methods 0.000 description 1
- 238000001356 surgical procedure Methods 0.000 description 1
- 230000009885 systemic effect Effects 0.000 description 1
- 230000008685 targeting Effects 0.000 description 1
- 238000013519 translation Methods 0.000 description 1
- 239000013638 trimer Substances 0.000 description 1
- 231100000397 ulcer Toxicity 0.000 description 1
- 230000036269 ulceration Effects 0.000 description 1
- 229960005486 vaccine Drugs 0.000 description 1
- 238000010200 validation analysis Methods 0.000 description 1
- 230000009385 viral infection Effects 0.000 description 1
- 230000003612 virological effect Effects 0.000 description 1
- 208000016261 weight loss Diseases 0.000 description 1
- 230000004580 weight loss Effects 0.000 description 1
Images


Classifications
-
- C—CHEMISTRY; METALLURGY
- C12—BIOCHEMISTRY; BEER; SPIRITS; WINE; VINEGAR; MICROBIOLOGY; ENZYMOLOGY; MUTATION OR GENETIC ENGINEERING
- C12Q—MEASURING OR TESTING PROCESSES INVOLVING ENZYMES, NUCLEIC ACIDS OR MICROORGANISMS; COMPOSITIONS OR TEST PAPERS THEREFOR; PROCESSES OF PREPARING SUCH COMPOSITIONS; CONDITION-RESPONSIVE CONTROL IN MICROBIOLOGICAL OR ENZYMOLOGICAL PROCESSES
- C12Q1/00—Measuring or testing processes involving enzymes, nucleic acids or microorganisms; Compositions therefor; Processes of preparing such compositions
- C12Q1/68—Measuring or testing processes involving enzymes, nucleic acids or microorganisms; Compositions therefor; Processes of preparing such compositions involving nucleic acids
- C12Q1/6876—Nucleic acid products used in the analysis of nucleic acids, e.g. primers or probes
- C12Q1/6883—Nucleic acid products used in the analysis of nucleic acids, e.g. primers or probes for diseases caused by alterations of genetic material
-
- G—PHYSICS
- G01—MEASURING; TESTING
- G01N—INVESTIGATING OR ANALYSING MATERIALS BY DETERMINING THEIR CHEMICAL OR PHYSICAL PROPERTIES
- G01N33/00—Investigating or analysing materials by specific methods not covered by groups G01N1/00 - G01N31/00
- G01N33/48—Biological material, e.g. blood, urine; Haemocytometers
- G01N33/50—Chemical analysis of biological material, e.g. blood, urine; Testing involving biospecific ligand binding methods; Immunological testing
- G01N33/68—Chemical analysis of biological material, e.g. blood, urine; Testing involving biospecific ligand binding methods; Immunological testing involving proteins, peptides or amino acids
- G01N33/6893—Chemical analysis of biological material, e.g. blood, urine; Testing involving biospecific ligand binding methods; Immunological testing involving proteins, peptides or amino acids related to diseases not provided for elsewhere
-
- C—CHEMISTRY; METALLURGY
- C12—BIOCHEMISTRY; BEER; SPIRITS; WINE; VINEGAR; MICROBIOLOGY; ENZYMOLOGY; MUTATION OR GENETIC ENGINEERING
- C12Q—MEASURING OR TESTING PROCESSES INVOLVING ENZYMES, NUCLEIC ACIDS OR MICROORGANISMS; COMPOSITIONS OR TEST PAPERS THEREFOR; PROCESSES OF PREPARING SUCH COMPOSITIONS; CONDITION-RESPONSIVE CONTROL IN MICROBIOLOGICAL OR ENZYMOLOGICAL PROCESSES
- C12Q2600/00—Oligonucleotides characterized by their use
- C12Q2600/106—Pharmacogenomics, i.e. genetic variability in individual responses to drugs and drug metabolism
-
- C—CHEMISTRY; METALLURGY
- C12—BIOCHEMISTRY; BEER; SPIRITS; WINE; VINEGAR; MICROBIOLOGY; ENZYMOLOGY; MUTATION OR GENETIC ENGINEERING
- C12Q—MEASURING OR TESTING PROCESSES INVOLVING ENZYMES, NUCLEIC ACIDS OR MICROORGANISMS; COMPOSITIONS OR TEST PAPERS THEREFOR; PROCESSES OF PREPARING SUCH COMPOSITIONS; CONDITION-RESPONSIVE CONTROL IN MICROBIOLOGICAL OR ENZYMOLOGICAL PROCESSES
- C12Q2600/00—Oligonucleotides characterized by their use
- C12Q2600/158—Expression markers
-
- G—PHYSICS
- G01—MEASURING; TESTING
- G01N—INVESTIGATING OR ANALYSING MATERIALS BY DETERMINING THEIR CHEMICAL OR PHYSICAL PROPERTIES
- G01N2800/00—Detection or diagnosis of diseases
- G01N2800/06—Gastro-intestinal diseases
- G01N2800/065—Bowel diseases, e.g. Crohn, ulcerative colitis, IBS
-
- G—PHYSICS
- G01—MEASURING; TESTING
- G01N—INVESTIGATING OR ANALYSING MATERIALS BY DETERMINING THEIR CHEMICAL OR PHYSICAL PROPERTIES
- G01N2800/00—Detection or diagnosis of diseases
- G01N2800/52—Predicting or monitoring the response to treatment, e.g. for selection of therapy based on assay results in personalised medicine; Prognosis
-
- G—PHYSICS
- G01—MEASURING; TESTING
- G01N—INVESTIGATING OR ANALYSING MATERIALS BY DETERMINING THEIR CHEMICAL OR PHYSICAL PROPERTIES
- G01N2800/00—Detection or diagnosis of diseases
- G01N2800/60—Complex ways of combining multiple protein biomarkers for diagnosis
Definitions
- the present invention relates to the field of diagnostics, in particular in the field of Inflammatory bowel diseases such as Crohn's disease and Ulcerative colitis.
- the invention in particular relates to methods based on gene expression levels to predict treatment response to an anti-TNFalpha compound based on a pre-treatment biopsy, and to method of determining the treatment effectiveness of such treatment based on a biopsy obtained after initiation of the treatment with an anti-TNFalpha compound.
- the invention further relates to the use of anti-TNFalpha compounds in the treatment of Inflammatory bowel disease wherein the treatment is combined with the method for predicting treatment response and only administered when a favorable response is predicted.
- the invention relates to kits and uses thereof in the methods and uses described herein.
- IBD Inflammatory bowel disease
- CD Crohn's disease
- UC Ulcerative colitis
- Treatment can be directed at inhibition of the inflammation and auto-immune reaction, healing of the intestinal wall, and correcting the microbiome.
- Multiple types of drugs can inhibit the inflammation and immune response, e.g. corticosteroids and TNFalpha blockers.
- Use of combination therapy is one of the most effective treatments in Crohn Disease (CD) ( Colombel et al.
- the invention relates to a method for predicting the treatment response of a subject suffering from inflammatory bowel disease (IBD) to treatment with an anti-TNFalpha compound based on the expression levels of three or more genes, wherein the expression levels of the three or more genes are selected from the group consisting of:
- the invention relates to a method for determining the effectiveness of a treatment of a subject suffering from IBD with an anti-TNFalpha compound based on the expression levels of three or more genes, wherein if the IBD is UC, the three or more genes are selected from the group consisting of BCL2L11, CDKN1A, DNMT1, EAF2, ELL2, ENPP2, FKBP5, GLRX, LCP1, MMP1, MMP3, MMP9, PLAU, PLAUR, PMEPA1, PRKACB, PTGS2, SERPINE1, SGK1, TIMP1, TMPRSS2 and VIM; or wherein the IBD is CD, the three or more genes are selected from the group consisting of BCL2L1, BCL2L11, BIRC3, CCL2, CCL22, CCL3, CCL4, CCL5, CX3CL1, CXCL1, CXCL2, CXCL3, DNMT1, ENPP2, GLRX, ICAM1, IL1B, IL6, IL8,
- the invention relates to an anti-TNFalpha compound for use of in the treatment of IBD in a subject, wherein the use comprises:
- the invention relates to a kit of parts comprising primers and probes for the detection of the expression levels of three or more target genes, wherein the expression levels of the three or more genes are selected from:
- the invention in a fifth aspect relates to a use of the kit according to the fourth aspect of the invention in the method according to the first or the second aspect of the invention.
- pathway activity models diagnosis can be linked to a pathophysiological disease mechanism, in terms of a specific combined signaling pathway activity profile, and this can be used to predict treatment response, treatment effectiveness and treatment monitoring.
- the inventors used pathway analysis of public datasets to determine which cellular signaling pathways can be used to predict whether a patient suffering from IBD will have a good treatment response to treatment with an anti-TNFalpha compound, to determine the effectiveness in patients being treated with an anti-TNFalpha compound.
- the different groups e.g. responders and non-responders, or effective treatment vs
- the invention relates to a method for predicting the treatment response of a subject suffering from inflammatory bowel disease (IBD) to treatment with an anti-TNFalpha compound based on the expression levels of three or more, e.g. three, four, five, six seven, eight, nine, ten, eleven or twelve or more, genes, wherein the expression levels of the three or more, e.g. three, four, five, six seven, eight, nine, ten, eleven or twelve or more, genes are selected from the group consisting of:
- the three or more expression levels are used to predict whether the treatment response to treatment of IBD in the patient with an anti-TNFalpha compound is favorable or not favorable.
- a decreased expression level of CDKN2B, HMGA2, OVOL1, SMAD4, BCL2L11, HNF1A or TCF7L2, or an increased expression level of any of the other genes corresponds to a not favorable treatment response.
- treatment prediction refers to predicting the likelihood of an IBD patient (e.g. an UC or a CD patient) to having a treatment response as defined herein below to treatment with an anti-TNFalpha compound, wherein said treatment prediction is made prior to treatment, for example based on a biopsy or sample from the patient.
- treatment effectiveness refers to predicting the likelihood of an IBD patient (e.g. an UC or a CD patient) to having a treatment response as defined herein below to treatment with an anti-TNFalpha compound, wherein said treatment prediction is made after onset of said treatment, for example based on a biopsy or sample from the patient.
- the expression levels of CDKN2B, HMGA2, OVOL1, SMAD4, BCL2L11, HNF1A or TCF7L2 demonstrate a negative correlation with pathway activity, meaning their expression levels are reduced with increased pathway activity. Therefore when adding up expression levels of multiple target gene the expression levels of the genes CDKN2B, HMGA2, OVOL1, SMAD4, BCL2L11, HNF1A or TCF7L2 are preferably modified with a negative constant, preferably with "-1".
- the IBD is Ulcerative Colitis (UC) or Crohn Disease (CD). It was found that these genes were predictive for treatment response both UC and CD patients.
- anti-TNF-a agents including infliximab (IFX), adalimumab (ADA), golimumab (GOL) and certolizumab pegol (CER)
- IFX infliximab
- ADA adalimumab
- GTL golimumab
- CER certolizumab pegol
- anti-TNF-a agents are not a magic bullet for all IBD cases. Firstly, side-effects can be severe and life-threatening in some patients, mainly due to infective events and then to immunogenicity, with the formation of antibodies-to-anti-TNF-a and a consequent loss of response (LOR) to these drugs over time. Therefore, there is a great need for accurate prediction methods to anti-TNFalpha therapies in IBD patients.
- the methods disclosed herein provide an accurate method for predicting treatment response in IBD patients to anti-TNFalpha therapy based on a biopsy, as evidenced by the Experimental results below. The method is based on the expression levels of a carefully curated set of genes which are found to be predictive.
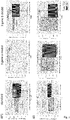
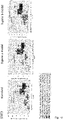
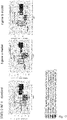
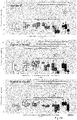
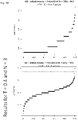
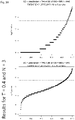
- pathway activities were analyzed on public datasets (GSE12251, GSE16879, GSE23597 and GSE52746). It was found that, individually, each of the TGFbeta, NFkB, MAPK-AP1, STAT3 and WNT cellular signaling pathways could be used to predict if a patient would responds to treatment with an anti-TNFalpha compound, by comparing the cellular signaling pathway activities of responders and non-responders in pre-treatment biopsies.
- Pathway activities for each of the TGFbeta, NFkB, MAPK-AP1, STAT3 and WNT cellular signaling pathways were significantly higher in pre-treatment biopsies from subjects that do not respond to treatment with an anti-TNFalpha compound compared to subjects that respond well to treatment with an anti-TNFalpha compound.
- the invention relates to a method for predicting the treatment response of a subject suffering from inflammatory bowel disease (IBD) to treatment with an anti-TNFalpha compound based on inferred cellular signaling pathway activity or activities in a sample obtained from the subject, the method comprising comparing the inferred cellular signaling pathway activity, or when multiple cellular signaling pathway activities are used the combined cellular signaling pathway activities, with a threshold value, wherein the cellular signaling pathway is one or more cellular signaling pathway selected from TGFbeta, NFkB, MAPK-AP1, STAT3 and WNT, as detailed herein below.
- the target genes used for determining cellular signaling pathway activity using these pathway models are preferably selected as follows:
- the pathway models are constructed with a large set of genes keeping in mind that they are broadly applicable, therefore not every gene will be upregulated in a specific context (e.g. cell or tissue type, or specific biological function), although it is found that in most cases a randomly selected subset of three genes should be predictive of pathway activity in any application.
- predicting response to anti-TNFalpha treatment based on a pre-treatment biopsy of a subject suffering from IBD can be based on a random selection of three genes. Therefore target genes that contribute less to the total pathway activity were identified and removed from the list, resulting in a cured list of target genes.
- the curation of the target genes list was performed based on total cellular signaling pathway activity regardless of group (responder vs non-responder) as to not introduce any bias.
- the curated target genes lists are:
- the invention relates to a method for predicting the treatment response of a subject suffering from inflammatory bowel disease (IBD) to treatment with an anti-TNFalpha compound based on the expression levels of three or more genes, wherein the expression levels of the three or more genes are selected from one or more groups selected from group 1, group 2, group 3, group 4, and group 5; and wherein group 1 consist of the genes: ANGPTL4, CDKN2B, CTGF, GADD45B, HMGA2, IL11, INPP5D, JUNB, MMP2, MMP9, OVOL1, PDGFB, PTHLH, SERPINE1, SKIL, SMAD4, SNAI2, TIMP1, VEGFA; wherein group 2 consist of the genes: BCL2L1, BIRC3, CCL2, CCL22, CCL3, CCL4, CCL5, CX3CL1, CXCL1, CXCL2, CXCL3, ICAM1, IL1B, IL6, IL8, IRF1, MMP9, NFKB2,
- group 1 consist of the genes: ANGPTL4, CDKN2B, CTGF, GADD45B, IL11, INPP5D, JUNB, MMP2, MMP9, PTHLH, SERPINE1, SNAI2, TIMP1
- group 2 consist of the genes: BCL2L1, BIRC3, CCL2, CCL22, CCL3, CCL4, CCL5, CX3CL1, CXCL1, CXCL2, CXCL3, ICAM1, IL1B, IL6, IL8, IRF1, MMP9, NFKB2, NFKBIA, NFKBIE, PTGS2, SELE, STAT5A, TNF, TNFAIP2, TRAF1, VCAM1;
- group 3 consist of the genes: CCND1, GLRX, MMP1, MMP3, MMP9, PLAU, PLAUR, PTGS2, SERPINE1, TIMP1, VIM
- group 4 consist of the genes: BCL2L1, CCND1, CD274, FGF2, FS
- the three or more genes may be selected from a single group or may be a combination of different groups. As the strongest correlation was found between the NFkB and TGFbeta cellular signaling pathway activities and treatment response prediction, preferably the three or more genes are chosen form group 1 and/or group 2.
- the method is preferably based on three or more, for example three, four, five, six, seven eight, nine, ten, eleven or twelve or more, genes selected from the group consisting of ANGPTL4, BCL2L1, BCL2L11, BIRC3, CCL2, CCL22, CCL3, CCL4, CCL5, CCND1, CD274, CD44, CDKN2B, COL18A1, CTGF, CX3CL1, CXCL1, CXCL2, CXCL3, DKK1, DNMT1, ENPP2, FGF2, FOS, FSCN1, GADD45B, GLRX, HIF1A, HMGA2, HNF1A, HSP90AB1, HSP90B1, ICAM1, IFNG, IL11, IL10, IL1B, IL6,
- the three or more for example three, four, five, six, seven eight, nine, ten, eleven or twelve or more, genes selected from the group consisting of ANGPTL4, BCL2L1, BIRC3, CCL2, CCL22, CCL3, CCL4, CCL5, CCND1, CD274, CD44, CDKN2B, COL18A1, CTGF, CX3CL1, CXCL1, CXCL2, CXCL3, DKK1, FGF2, FSCN1, GADD45B, GLRX, HIF1A, HSP90B1, ICAM1, IFNG, IL11, IL1B, IL6, IL8, INPP5D, IRF1, JUNB, KIAA1199, MCL1, MMP1, MMP2, MMP3, MMP9, NFKB2,
- the TGFbeta and the NFkB have the strongest correlation with predicting anti-TNFalpha treatment effectiveness based on pre-treatment biopsy, therefore the prediction is preferably based on a selection of the curated TGFbeta or NFkB cellular signaling pathway target genes:
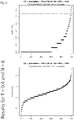
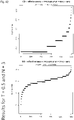
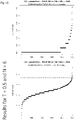
- N genes were randomly selected 1000 times and it was reviewed how often the random selection of N genes were statistically significant in distinguishing responders and non-responders to anti-TNFalpha treatment.
- the results are plotted in Table 15, avgp refers to Average P value (of the 1000 random selections of N genes) and sigper refers to the percentage of the 1000 selections that are significant (P lower or equal to 0.05).
- avgp refers to Average P value (of the 1000 random selections of N genes)
- sigper refers to the percentage of the 1000 selections that are significant (P lower or equal to 0.05).
- the corresponding gene sets are listed in list A.
- the method is preferably based on N or more, for example one, two, three, four, five, six, seven eight, nine, ten, eleven or twelve or more, genes selected from a group as listed in LIST A below wherein the application is listed as prediction or prediction2 and N is indicated in LIST A for the respective set, and wherein an increased expression level of CDKN2B, HMGA2, OVOL1, SMAD4, BCL2L11, HNF1A or TCF7L2, or a decreased expression level of any of the other genes corresponds to a favorable treatment response, and wherein a decreased expression level of CDKN2B, HMGA2, OVOL1, SMAD4, BCL2L11, HNF1A or TCF7L2, or an increased expression level of any of the other genes corresponds to a not favorable treatment response.
- IBD Inflammatory bowel disease
- Crohn's disease affects the small intestine and large intestine, as well as the mouth, esophagus, stomach and the anus, whereas ulcerative colitis primarily affects the colon and the rectum.
- treatment response refers to an improvement of the grade of the disease when comparing post treatment and pre-treatment grading.
- Grading systems have been developed for both UC and CD. For UC this has been described in Geboes et al. ( Geboes, K et al. "A reproducible grading scale for histological assessment of inflammation in ulcerative colitis.” Gut vol. 47,3 (2000): 404-9. doi:10.1136/gut.47.3.404 ; hereby incorporated by reference in its entirety).
- a grade can be assigned for each factor corresponding from grade 0 to 5, with the subgrade indicating the severity, ranging from 0 (no abnormality / not present) to 3 (most severe symptom) as indicated in Table 1 of Geboes et al. (hereby incorporated by reference).
- Grade 0 scores structural change, grade 1 chronic inflammation infiltrate, grade 2 scores lamina intestinal neutrophils and eosinophils, grade 3 scores neutrophils in the epithelium grade 4 scores crypt destruction and grade 5 scores erosion or ulceration.
- a favorable treatment response as defined herein means that when comparing grades 0-5 prior and after treatment, the subgrades are on average lower after treatment, preferably each subgrade is individually lower or equal after treatment, with the proviso that at least one subgrade is lower after treatment, indicating less severe symptoms.
- Equally a non-favorable treatment response as defined herein means that when comparing grades 0-5 prior and after treatment, the subgrades are on average equal or higher after treatment, for example each subgrade is individually higher or equal after treatment, indicating equal or more severe symptoms.
- CD D'Haens GR, Geboes K, Peeters M, Baert F, Penninckx F, Rutgeerts P.
- a favorable treatment response as defined herein means that when comparing the grades prior and after treatment, the grades are on average lower after treatment, preferably each grade is individually lower or equal after treatment with the proviso that at least one grade is lower, indicating less severe symptoms.
- Equally a non-favorable treatment response as defined herein means that when comparing the grades prior and after treatment, the grades are on average equal or higher after treatment, for example each grade is individually equal or higher after treatment, indicating equal or more severe symptoms.
- subject refers to a human or non-human animal.
- the subject is suffering from, diagnosed with, suspected to have, undergoing treatment for or has been cured from an inflammatory bowel disease (IBD) such as Ulcerative Colitis (UC) or Crohn's Disease (CD), unless the subject is a healthy control subject.
- IBD inflammatory bowel disease
- UC Ulcerative Colitis
- CD Crohn's Disease
- the subject may also be referred herein as patient.
- anti-TNFalpha compound or anti-TNFalpha therapy or anti-TNFalpha treatment are used interchangeably, and refer to a compound having an inhibitory effect on TNFalpha signaling, or it may refer to administration of said compound to a subject as defined herein, depending on the context.
- Compounds having an inhibitory effect on TNF-alpha signaling may exert their effect in the ligand (TNFalpha), e.g. by preventing the ligand to bind to its receptor.
- the compounds may exert their effect directly on the receptor or downstream of the receptor by preventing the receptor or downstream signaling pathways to be activated.
- TNFalpha blockers Compounds having an inhibitory effect on TNF-alpha signaling are known to the skilled person and may also be referred to as TNFalpha blockers or anti-TNFalpha drugs.
- Anti-TNFalpha compounds may for example be inhibitory antibodies, small molecule inhibitors or nucleotide based inhibitors such as RNAi, miRNA, however other inhibitors may be known to the person skilled in the art.
- Non limiting examples of anti-TNFalpha compounds are antibody based compounds such as Adalimumab, Certolizumab, Etanercept, Golimumab, Infliximab, or a biosimilars or chimeric products of any of the preceding compounds, such as for example the CT-P13 Infliximab biosimilar, or small molecule based compound such as thalidomide, lenalidomide, pomalidomide, a xanthane derivative such as pentoxifylline, bupropion, an 5-HT 2A agonist such as (R)DOI, TCB2, LSD and LA-SS-Az; or a natural compound such as curcumin, catechins, cannabidiol or Echinacea purpurea.
- antibody based compounds such as Adalimumab, Certolizumab, Etanercept, Golimumab, Infliximab, or a biosimilars or chimeric products of any of the preceding compounds
- expression level refers to quantifying the number of mRNA copies transcribed from a gene. Generally this number will not be an absolute value but a relative value, and therefore is preferably normalized for example in reference to the expression of one or more housekeeping genes.
- Housekeeping genes are genes which are assumed to have constant expression levels independent of cell type and/or functional status of the cell (i.e. from a diseased or healthy subject), and therefore can be used to normalize experimentally determined relative expression levels.
- Housekeeping genes are generally known to the skilled person, non-limiting examples of housekeeping genes that may be used for normalization are beta-actin, glyceraldehyde-3-phosphate dehydrogenase (GAPDH) and Transcription factor IID TATA binding protein (TBP).
- GPDH glyceraldehyde-3-phosphate dehydrogenase
- TBP Transcription factor IID TATA binding protein
- the phrase "expression level of a target gene” denotes a value that is representative of the amount, e.g. a concentration, of a target gene present in a sample. This value may be based on the amount of a transcription product of the target gene (e.g. mRNA) or a translation product thereof (e.g. protein). Preferably, the expression level is based on the amount of mRNA formed from the target gene.
- techniques such as qPCR, multiple qPCR, multiplexed qPCR, ddPCR, RNAseq, RNA expression array or mass spectrometry may be used.
- a gene expression microarray e.g. Affymetrix microarray, or RNA sequencing methods, like an Illumina sequencer, can be used.
- sample also encompasses the case where e.g. a tissue of the subject have been taken from the subject and, e.g., have been put on a microscope slide, and where for performing the claimed method a portion of this sample is extracted, e.g., by means of Laser Capture Microdissection (LCM), or by scraping off the cells of interest from the slide, or by fluorescence-activated cell sorting techniques.
- the sample is obtained form or is a biopsy.
- the biopsy or sample may be obtained from a healthy subject (e.g. to serve as a reference sample) or from a subject suffering from IBD.
- the sample is a gastric, colon, intestinal or rectal sample, therefore in a preferred embodiment the biopsy used to provide the sample is a gastric, colon, intestinal or rectal biopsy.
- healthy subject or “healthy reference subject” or “healthy control subject” are used interchangeably, and when used herein refer to a subject not having IBD.
- the predictions referred herein may be based on inferred cellular signaling pathway activity. Therefore in an alternative of the first aspect the invention relates to a method for predicting the treatment response of a subject suffering from inflammatory bowel disease (IBD) to treatment with an anti-TNFalpha compound based on inferred cellular signaling pathway activity or activities in a sample obtained from the subject, the method comprising:
- the activity of the respective cellular signaling pathway being defined by the activity level of the respective TF elements.
- the calibrated mathematical pathway model being a model that is calibrated using a ground truth dataset including samples in which transcription of the three or more target genes is induced by the respective TF elements and samples in which transcription of the three or more target genes is not induced by the respective TF elements.
- the TF for the relevant cellular signaling pathways described herein are listed below.
- the IBD is ulcerative colitis (UC) or Crohn Disease (CD).
- the threshold value is independently determined in one or more reference samples.
- the three or more, e.g. three, four, five, six, seven, eight, nine, ten, eleven or twelve or more, target genes of the TGFbeta cellular signaling pathway are selected from ANGPTL4, CDC42EP3, CDKNIA, CDKN2B, CTGF, GADD45A, GADD45B, HMGA2, ID1, IL11, SERPINE1, INPP5D, JUNB, MMP2, MMP9, NKX2-5, OVOL1, PDGFB, PTHLH, SGK1, SKIL, SMAD4, SMAD5, SMAD6, SMAD7, SNAI1, SNAI2, TIMP1, and VEGFA, preferably, from the group consisting of: ANGPTL4, CDC42EP3, CDKNIA, CTGF, GADD45A, GADD45B, HMGA2, ID
- target genes of the NFkB cellular signaling pathway are selected from BCL2L1, BIRC3, CCL2, CCL3, CCL4, CCL5, CCL20, CCL22, CX3CL1, CXCL1, CXCL2, CXCL3, ICAM1, IL1B, IL6, IL8, IRF1, MMP9, NFKB2, NFKBIA, NFKB IE, PTGS2, SELE, STAT5A, TNF, TNFAIP2, TNIP1, TRAF1, and VCAM1; the three or more, e.g.
- target genes of the MAPK-AP1 cellular signaling pathway are selected from BCL2L11, CCND1, DDIT3, DNMT1, EGFR, ENPP2, EZR, FASLG, FIGF, GLRX, IL2, IVL, LOR, MMP1, MMP3, MMP9, SERPINE1, PLAU, PLAUR, PTGS2, SNCG, TIMP1, TP53, and VIM, preferably, from the group consisting of: CCND1, EGFR, EZR, GLRX, MMP1, MMP3, PLAU, PLAUR, SERPINE1, SNCG, and TIMP1; the three or more, e.g.
- target genes of the STAT3 cellular signaling pathway are selected from AKT1, BCL2, BCL2L1, BIRC5, CCND1, CD274, CDKN1A, CRP, FGF2, FOS, FSCN1, FSCN2, FSCN3, HIF1A, HSP90AA1, HSP90AB1, HSP90B1, HSPA1A, HSPA1B, ICAM1, IFNG, IL10, JUNB, MCL1, MMP1, MMP3, MMP9, MUC1, MYC, NOS2, POU2F1, PTGS2, SAA1, STAT1, TIMP1, TNFRSF1B, TWIST1, VIM, and ZEB1, preferably, either from the group consisting of: BCL2L1, BIRC5, CCND1, CD274, FOS, HIF1A, HSP90AA1 , HSP90AB1 , MMP1 , and MYC, or from the group consisting of: BCL2L1, BIRC5, CCND1, CD274, FOS,
- target genes of the WNT cellular signaling pathway are selected from KIAA1199, AXIN2, RNF43, TBX3, TDGF1, SOX9, ASCL2, IL8, SP5, ZNRF3, KLF6, CCND1, DEFA6 and FZD7, optionally further at least one target gene, e.g.
- the sample obtained from the subject is a gastric, colon, intestinal or rectal sample.
- a numerical value can be assigned to the pathway activity.
- this value can for example be normalize to result in a value from 0 to 100, where 0 is no pathway activity and 100 is theoretical maximum pathway activity.
- the value may be normalized such that the average value is 0 and thus decreased pathway activity is represented by a negative value and increased pathway activity is represented by a positive value. It is understood that the values obtained using such model are dependent on the model used, and do not represent absolute values. Therefore, the same model should be used for calibrating, determining reference values and when used in the method of the invention, so that it allows comparison of the obtained numerical values for pathway activity.
- the numerical value obtained for a pathway activity in a sample for a specific state may be compared to the numerical value obtained for that pathway activity in a reference sample (e.g. non-responder to treatment with an anti-TNF-alpha compound).
- a reference sample e.g. non-responder to treatment with an anti-TNF-alpha compound.
- cellular signaling pathway activity can be determined in a biopsy sample from a subject not responding to treatment with an anti-TNF-alpha compound. Since it is determined by the inventors that the TGFbeta, NFkB, MAPK-AP1, STAT3 and WNT cellular signaling pathway activities in non-responders to anti-TNF-alpha treatment are higher (in a sample from a biopsy obtained pre-treatment), these can bet set as a baseline numerical values representing an high pathway activities, i.e. the reference value.
- baseline numerical values can be set for low activities for these pathways representing the lower value obtained from samples form biopsies obtained from responders to anti-TNFalpha treatment.
- the numerical value representing that pathway activity can be compared with the reference values, and it can be determined whether the pathway activity is high or low, by comparing with the references based on the numerical values. The comparison may be made with multiple reference samples to allow for more accurate results and statistics to be performed.
- a reference sample can be used to set a baseline pathway activity, allowing further comparison of the pathway activity. For example, the average and standard deviation can be calculated which can be used to calculate values for a healthy individual, and define a threshold for abnormal pathway activity.
- a reference can be used with a known state (e.g. severe infection) and used in the comparison of the pathway activity/activities.
- the pathway activity is determined to be higher or lower when the obtained numerical value for the pathway activity differs with at least one standard deviation from the numerical value obtained for the pathway activity in the reference sample.
- the threshold may also be set higher, for example 2 times the standard deviation or even 3 times the standard deviation. It is further understood that the threshold may be determined using alternative ways, e.g. statistical methods, to determine a significant deviation from the reference value.
- the reference value for a certain pathway activity in a sample in principle only needs to be determined once. Therefore, the step of determining a reference pathway activity is not part of the methods of the invention, as a predetermined reference pathway activity can be used.
- determining the expression levels of the target genes based on the extracted RNA may be a part of the method, meaning the method includes the step of determining the expression levels of the target genes on RNA extracted from the sample obtained from the patient using methods known to the skilled person or described herein.
- the method may further include the step of obtaining a sample form the patient in order to extract the RNA.
- the expression levels may have been determined separately and the demining step (of the expression levels of the target genes) is not an active step in the method of the invention. In such case the expression levels are provided as an input value, e.g. a relative expression level in reference to one or more control gene expression levels.
- cellular signaling pathway target genes whose expression levels are preferably analyzed have been identified, alternatively methods for identifying suitable target genes are described herein.
- pathway activity for example by a mathematical model, three or more, for example, three, four, five, six, seven, eight, nine, ten, eleven, twelve or more, target genes from each assessed cellular signaling pathway can be analyzed to determine pathway activities.
- the signaling pathway measurements are performed using qPCR, multiple qPCR, multiplexed qPCR, ddPCR, RNAseq, RNA expression array or mass spectrometry.
- a gene expression microarray data e.g. Affymetrix microarray, or RNA sequencing methods, like an Illumina sequencer, can be used.
- pathway means "signal transduction pathway”, “signaling pathway” and “cellular signaling pathway” are used interchangeably herein.
- an “activity of a signaling pathway” may refer to the activity of a signaling pathway associated transcription factor (TF) element in the sample, the TF element controlling transcription of target genes, in driving the target genes to expression, i.e., the speed by which the target genes are transcribed, e.g. in terms of high activity (i.e. high speed) or low activity (i.e. low speed), or other dimensions, such as levels, values or the like related to such activity (e.g. speed). Accordingly, for the purposes of the present invention, the term “activity”, as used herein, is also meant to refer to an activity level that may be obtained as an intermediate result during "pathway analysis" as described herein.
- TF transcription factor
- transcription factor element preferably refers to an intermediate or precursor protein or protein complex of the active transcription factor, or an active transcription factor protein or protein complex which controls the specified target gene expression.
- the protein complex may contain at least the intracellular domain of one of the respective signaling pathway proteins, with one or more co-factors, thereby controlling transcription of target genes.
- the term refers to either a protein or protein complex transcriptional factor triggered by the cleavage of one of the respective signaling pathway proteins resulting in a intracellular domain.
- target gene means a gene whose transcription is directly or indirectly controlled by a respective transcription factor element.
- the "target gene” may be a "direct target gene” and/or an “indirect target gene” (as described herein).
- Pathway analysis enables quantitative measurement of signal transduction pathway activity in cells, e.g. of a sample, based on inferring activity of a signal transduction pathway from measurements of mRNA levels of the well-validated direct target genes of the transcription factor associated with the respective signaling pathway (see for example W Verhaegh et al., 2014, supra; W Verhaegh, A van de Stolpe, Oncotarget, 2014, 5(14):5196 ).
- the determining of the activity or activities of the signaling pathway(s), the combination of multiple pathway activities and applications thereof is performed as described for example in the following documents, each of which is hereby incorporated in its entirety for the purposes of determining activity of the respective signaling pathway: published international patent applications WO2013011479 (titled “ASSESSMENT OF CELLULAR SIGNALING PATHWAY ACTIVITY USING PROBABILISTIC MODELING OF TARGET GENE EXPRESSION”), WO2014102668 (titled “ASSESSMENT OF CELLULAR SIGNALING PATHWAY ACTIVITY USING LINEAR COMBINATION(S) OF TARGET GENE EXPRESSIONS”), WO2015101635 (titled “ASSESSMENT OF THE PI3K CELLULAR SIGNALING PATHWAY ACTIVITY USING MATHEMATICAL MODELLING OF TARGET GENE EXPRESSION”), WO2016062891 (titled “ASSESSMENT OF TGF- ⁇ CELLULAR SIGN
- the models have been biologically validated for ER, AR, PI3K-FOXO, HH, Notch, TGF- ⁇ , Wnt, NFkB, JAK-STAT1/2, JAK-JAK-STAT3 and MAPK-MAPK-AP1 pathways on several cell types.
- Unique sets of cellular signaling pathway target genes whose expression levels are preferably analyzed have been identified. For use in the mathematical models, three or more, for example, three, four, five, six, seven, eight, nine, ten, eleven, twelve or more, target genes from each assessed cellular signaling pathway can be analyzed to determine pathway activities.
- a concept which is preferably applied herein for the purposes of the present invention, wherein the activity of a signaling pathway in a cell such as a cell present in a sample is determinable by receiving expression levels of one or more, preferably three or more, target genes of the signaling pathway, determining an activity level of a signaling pathway associated transcription factor (TF) element in the sample, the TF element controlling transcription of the three or more target genes, the determining being based on evaluating a calibrated mathematical pathway model relating expression levels of the one or more, preferably three or more target genes to the activity level of the signaling pathway, and optionally inferring the activity of the signaling pathway in the cell present in a sample based on the determined activity level of the signaling pathway associated TF element.
- TF transcription factor
- the activity level can be directly used as an input to determine the immune response in a subject and/or determine whether an infection is viral and/or determine the severity of a viral infection and/or determine the cellular immunity conferred by a vaccine, which is also contemplated by the present invention.
- activity level of a TF element denotes the level of activity of the TF element regarding transcription of its target genes.
- the calibrated mathematical pathway model may be a probabilistic model, preferably a Bayesian network model, based on conditional probabilities relating the activity level of the signaling pathway associated TF element and the expression levels of the three or more target genes, or the calibrated mathematical pathway model may be based on one or more linear combination(s) of the expression levels of the three or more target genes.
- the calibrated mathematical pathway model is preferably a linear model, or a Bayesian network model based on conditional probabilities.
- the determination of the expression level and optionally the inferring of the activity of a signaling pathway in the subject may be performed, for example, by inter alia (i) evaluating a portion of a calibrated probabilistic pathway model, preferably a Bayesian network, representing the cellular signaling pathways for a set of inputs including the expression levels of the three or more target genes of the cellular signaling pathway measured in a sample of the subject, (ii) estimating an activity level in the subject of a signaling pathway associated transcription factor (TF) element, the signaling pathway associated TF element controlling transcription of the three or more target genes of the cellular signaling pathway, the estimating being based on conditional probabilities relating the activity level of the signaling pathway associated TF element and the expression levels of the three or more target genes of the cellular signaling pathway measured in the sample of the subject, and optionally (iii) inferring the activity of the cellular signaling pathway based on the estimated activity level of the signaling pathway associated TF element in the sample of the subject.
- TF signal
- the determination of the expression level and optionally the inferring of the activity of a cellular signaling pathway in the subject may be performed by inter alia (i) determining an activity level of a signaling pathway associated transcription factor (TF) element in the sample of the subject, the signaling pathway associated TF element controlling transcription of the three or more target genes of the cellular signaling pathway, the determining being based on evaluating a calibrated mathematical pathway model relating expression levels of the three or more target genes of the cellular signaling pathway to the activity level of the signaling pathway associated TF element, the mathematical pathway model being based on one or more linear combination(s) of expression levels of the three or more target genes, and optionally (ii) inferring the activity of the cellular signaling pathway in the subject based on the determined activity level of the signaling pathway associated TF element in the sample of the subject.
- TF transcription factor
- references have been assigned to each signaling pathway of interest here and exemplarily corresponding target genes suitable for determination of the signaling pathway's activity have been indicated.
- the inferring comprises:
- a Wnt transcription factor (TF) element is defined to be a protein complex containing at least one of the TCF/LEF TF family members, i.e., TCF1, TCF3, TCF4 or LEF1, preferably wherein the Wnt TF element comprises beta-catenin/TCF4, which is capable of binding to specific DNA sequences, thereby controlling transcription of target genes.
- an AR transcription factor (TF) element is defined to be a protein complex containing at least one or preferably a dimer of nuclear Androgen receptor.
- TGFbeta transcription factor element or "TGFbeta TF element” or “TF element” when referring to the TGFbeta pathway is defined to be a protein complex containing at least one or, preferably, a dimer of the TGFbeta members (SMAD1 , SMAD2, SMAD3 , SMAD5 and SMAD8 with SMAD4) or a trimer (two proteins from SMAD1, SMAD2, SMAD3, SMAD5 and SMAD8 with SMAD4), which is capable of binding to specific DNA sequences, thereby controlling transcription of target genes.
- SMAD1 , SMAD2, SMAD3 , SMAD5 and SMAD8 with SMAD4 dimer of the TGFbeta members
- trimer two proteins from SMAD1, SMAD2, SMAD3, SMAD5 and SMAD8 with SMAD4
- the term refers to either a protein or protein complex transcriptional factor triggered by the binding of TGFbeta to its receptor or an intermediate downstream signaling agent between the binding of TGFbeta to its receptor and the final transcriptional factor protein or protein complex.
- TGFbeta binds to an extracellular TGFbeta receptor that initiates an intracellular "SMAD" signaling pathway and that one or more SMAD proteins (receptor-regulated or R-SMADs (SMAD1, SMAD2, SMAD 3, SMAD5 and SMAD8) and SMAD4) participate in, and may form a hetero-complex which participates in, the TGFbeta transcription signaling cascade which controls expression.
- SMAD receptor-regulated or R-SMADs
- an NFkB transcription factor (TF) element is defined to be a protein complex containing at least one or, preferably, a dimer of the NFkB members (NFKB 1 or p50/p105, NFKB2 or p52/p100, RELA or p65, REL, and RELB), which is capable of binding to specific DNA sequences, thereby controlling transcription of target genes.
- the term "JAK-STAT1/2 transcription factor element” or "JAK-STAT1/2 TF element” or “TF element” when referring to the JAK-STAT1/2 is defined to be a protein complex containing at least a STAT1-STAT2 heterodimer or a STAT1 homodimer, which is capable of binding to specific DNA sequences, preferably the ISRE (binding motif AGTTTC NTTCNC/T) or GAS (binding motif TTC/A NNG/TAA) response elements, respectively, thereby controlling transcription of target genes.
- the term refers to either a protein or protein complex transcriptional factor that is formed by different stimuli such as IFNs triggered by the binding of the stimulating ligand to its receptor resulting in downstream signaling.
- the term "JAK-STAT3 transcription factor element” or "JAK-STAT3 TF element” or “TF element” when referring to the JAK-STAT3 pathway is defined to be a protein complex containing at least a STAT3 homodimer, which is capable of binding to specific DNA sequences, preferably the response elements with binding motif CTGGGAA, thereby controlling transcription of target genes.
- the term refers to either a protein or protein complex transcriptional factor triggered by the binding of STAT3 inducing ligands such as interleukin-6 (IL-6) and IL-6 family cytokines to its receptor or an intermediate downstream signaling agent between the binding the ligand to its receptor and the final transcriptional factor protein or protein complex.
- STAT3 inducing ligands such as interleukin-6 (IL-6) and IL-6 family cytokines
- AP-1 transcription factor element or "AP-1 TF element” or “TF element” when referring to the MAPK-AP1 pathway is defined to be a protein complex containing at least a member of the Jun (e.g. c-Jun, JunB and JunD) family and/or a member of the Fos (e.g. c-Fos, FosB, Fra-1 and Fra-2) family and/or a member of the ATF family and/or a member of the JDP family, forming e.g.
- Jun ⁇ Jun or Jun ⁇ Fos dimers capable of binding to specific DNA sequences, preferably the response elements 12-0-Tetradecanoylphorbol-13-acetate (TPA) response element (TRE) with binding motif 5'-TGA G/C TCA-3' or cyclic AMP response element (CRE) with binding motif 5'-TGACGTCA-3', thereby controlling transcription of target genes.
- TPA 12-0-Tetradecanoylphorbol-13-acetate
- CRE cyclic AMP response element
- the term refers to either a protein or protein complex transcriptional factor triggered by the binding of AP-1 inducing ligands, such as growth factors (e.g., EGF) and cytokines, to its receptor or an intermediate downstream signaling agent, or triggered by the presence of an AP-1 -activating mutation.
- AP-1 inducing ligands such as growth factors (e.g., EGF) and cytokines
- the three or more e.g. three, four, five, six seven, eight, nine, ten, eleven or twelve or more, expression levels are combined by adding up their relative expression levels, with the proviso that the expression levels of the genes CDKN2B, HMGA2, OVOL1, SMAD4, BCL2L11, HNF1A or TCF7L2 are multiplied with a weight factor of -1.
- the combined expression levels are compared to a threshold value to determine whether the treatment response is favorable or not favorable, wherein the treatment response is predicted to be favorable when the combined three or more expression levels are below the threshold value, and wherein the treatment response is predicted to be unfavorable when the combined three or more expression levels are above the threshold value.
- relative expression level refers to the quantitative value obtained for the expression level of the gene which has been normalized, e.g. by using a housekeeping gene or genes, to correct for sample variation.
- a threshold value for the combined expression levels can be set from reference samples with a known status, meaning reference samples obtained from IBD patient pre-treatment from which it is known whether they are responders or non-responders. Since the combined expression values represents a set of numerical values, an average can be calculated for a specific set of genes (i.e. three or more genes selected form the list identified above) and for a specific status (i.e. responder or non-responder). Based on these values a threshold can be set. For example the threshold can be set as the median between responders and non-responders, or can be set such that a predetermined percentage of responders or non-responders fall above or below the set value. Such methods are known to the skilled artisan.
- Such threshold value for a specific set of genes allows for easy comparison of the value obtained a sample form a subject suffering from IBD, and quickly diagnosing whether the subject would benefit from anti-TNF-alpha treatment. It is particularly preferred to combine the three or more expression levels by adding up the logarithmic values of their relative expression levels, preferably the log2 values.
- the IBD is Ulcerative Colitis (UC) or Crohn Disease (CD).
- UC Ulcerative Colitis
- CD Crohn Disease
- the target genes selected from the TGFbeta, NFkB, MAPK-AP1, STAT3 and WNT cellular signaling pathways are predictive for both subjects suffering from UC and CD.
- the invention relates to a method for determining the effectiveness of a treatment of a subject suffering from IBD with an anti-TNFalpha compound based on the expression levels of two or more genes, wherein if the IBD is UC, the two or more, e.g.
- genes are selected from the group consisting of BCL2L11, CDKN1A, DNMT1, EAF2, ELL2, ENPP2, FKBP5, GLRX, LCP1, MMP1, MMP3, MMP9, PLAU, PLAUR, PMEPA1, PRKACB, PTGS2, SERPINE1, SGK1, TIMP1, TMPRSS2 and VIM; or wherein the IBD is CD, the two or more, e.g.
- genes are selected from the group consisting of BCL2L1, BCL2L11, BIRC3, CCL2, CCL22, CCL3, CCL4, CCL5, CX3CL1, CXCL1, CXCL2, CXCL3, DNMT1, ENPP2, GLRX, ICAM1, IL1B, IL6, IL8, IRF1, MMP1, MMP3, MMP9, NFKB2, NFKBIA, NFKBIE, PLAU, PLAUR, PTGS2, SELE, SERPINE1, STAT5A, TIMP1, TNF, TNFAIP2, TRAF1, VCAM1 and VIM; wherein the three or more expression levels are used to determine whether the treatment of IBD in the patient with an anti-TNFalpha compound is effective or not effective, wherein a decreased expression level of BCL2L11 or PRKACB or an increased expression level of any of the other genes corresponds to a not effective treatment, and wherein
- the AR and MAPK-AP1 (for UC) or MAPK-AP1 and NFkB (for CD) cellular signaling pathway activities in post treatment patient samples undergoing treatment with an anti-TNFalpha compound are indicative if a subject is responding well to treatment with an anti-TNFalpha compound even when no pre-treatment information is available. Therefore the curated lists for these pathways can be used to predict treatment effectiveness.
- the listed target genes have been selected in the same manner as for treatment response, based on pathways with significant different pathway activity between states (effective treatment vs non-effective treatment), where the pathway genes are curated based on the genes contributing most to the pathway score. For treatment effectiveness predictions, different pathways were found to be significant when comparing UC and CD patients, so distinct target genes groups are selected depending on the exact diagnosis of the IBD (being UC or CD).
- treatment effectiveness refers to whether a subject having IBD responds favorably to treatment with an anti-TNFalpha compound as determined after onset of the treatment.
- treatment effectiveness can be defined herein as an improvement in the overall grade using the grading systems for UC and CD referred above.
- the two or more genes are selected from the group consisting of EAF2, ELL2, FKBP5, GLRX, LCP1, MMP1, MMP3, MMP9, PLAU, PLAUR, PMEPA1, PTGS2, SERPINE1, TIMP1, TMPRSS2 and VIM.
- the two or more genes are selected from the group consisting of BCL2L1, BIRC3, CCL2, CCL22, CCL3, CCL4, CCL5, CX3CL1, CXCL1, CXCL2, CXCL3, GLRX, ICAM1, IL1B, IL6, IL8, IRF1, MMP1, MMP3, MMP9, NFKB2, NFKBIA, NFKBIE, PLAU, PLAUR, PTGS2, SELE, SERPINE1, STAT5A, TIMP1, TNF, TNFAIP2, TRAF1, VCAM1 and VIM.
- the two or more expression levels are combined by adding up their relative expression levels, with the proviso that the expression levels of the genes BCL2L11 or PRKACB are multiplied with a weight factor of -1, preferably wherein the combined expression levels are compared to a threshold value to determine whether the treatment is effective or not effective, wherein the treatment is predicted to be effective when the combined two or more expression levels are below the threshold value, and wherein the treatment is predicted not to be effective when the combined two or more expression levels are above the threshold value.
- the method of the second aspect of the invention relates to a method for determining the effectiveness of a treatment of a subject suffering from IBD with an anti-TNFalpha compound based on the expression levels of two or more genes, wherein the expression levels of the three or more genes are selected from one or more groups, wherein if the IBD is UC, the genes are selected from group 3 or group 6, wherein if the IBD is CD, the genes are selected from group 2 or group 3, wherein group 2 consist of the genes: BCL2L1, BIRC3, CCL2, CCL22, CCL3, CCL4, CCL5, CX3CL1, CXCL1, CXCL2, CXCL3, ICAM1, IL1B, IL6, IL8, IRF1, MMP9, NFKB2, NFKBIA, NFKBIE, PTGS2, SELE, STAT5A, TNF, TNFAIP2, TRAF1, VCAM1; wherein group 3 consist of the genes: BCL2L11, DNMT1, ENPP2, GLRX
- group 2 consist of the genes: BCL2L1, BIRC3, CCL2, CCL22, CCL3, CCL4, CCL5, CX3CL1, CXCL1, CXCL2, CXCL3, ICAM1, IL1B, IL6, IL8, IRF1, MMP9, NFKB2, NFKBIA, NFKBIE, PTGS2, SELE, STAT5A, TNF, TNFAIP2, TRAF1, VCAM1.
- group 3 consist of the genes: GLRX, MMP1, MMP3, MMP9, PLAU, PLAUR, PTGS2, SERPINE1, TIMP1, VIM.
- group 6 consist of the genes: EAF2, ELL2, FKBP5, LCP1, PLAU, PMEPA1, TMPRSS2.
- T value target genes
- N values number of genes
- the invention relates to a method for determining the effectiveness of a treatment of a subject suffering from IBD with an anti-TNFalpha compound based on the expression levels of N or more, for example one, two, three, four, five, six, seven eight, nine, ten, eleven or twelve or more, genes selected from a group as listed in LIST A below wherein the application is listed as effectiveness and N is indicated in LIST A for the respective set, and wherein if the IBD is UC, the N or more, e.g. one, two, three, four, five, six, seven, eight, nine, ten, eleven, twelve or more, genes are selected from the group indicated is UC; or wherein the IBD is CD, the N or more, e.g.
- one, two, three, four, five, six, seven, eight, nine, ten, eleven, twelve or more, genes are selected from the indicated is CD; and wherein the N or more expression levels are used to determine whether the treatment of IBD in the patient with an anti-TNFalpha compound is effective or not effective, wherein a decreased expression level of BCL2L11 or PRKACB or an increased expression level of any of the other genes corresponds to a not effective treatment, and wherein an increased expression level of BCL2L11 or PRKACB or a decreased expression level of any of the other genes corresponds to an effective treatment.
- the method of the second aspect of the invention relates to a method for determining the effectiveness of a treatment of a subject suffering from IBD with an anti-TNFalpha compound based on inferred cellular signaling pathway activity or activities in a sample obtained from the subject, the method comprising:
- the sample obtained from the subject is a gastric, colon, intestinal or rectal sample.
- the sample may for example be a gastric, colon, intestinal or rectal biopsy.
- the method further includes determining the expression levels of the target genes based on mRNA extracted from the sample obtained from the subject, preferably wherein the method further includes extracting the mRNA from the sample obtained from the subject.
- the threshold value is independently determined in from one or more reference samples.
- the method according to the first aspect of the invention can be used in successful stratification of IBD patients (both UC and CD), to predict response to treatment with an anti-TNFalpha compound. Therefore treatment with an anti-TNFalpha compound in an IBD patient is preferably combined with the method as described herein, and the anti-TNFalpha compound is only administered when it is established that the treatment prediction is favorable.
- the invention relates to an anti-TNFalpha compound for use of in the treatment of IBD in a subject, wherein the use comprises: performing the method as defined in the first or the second aspect of the invention to determine the treatment response of the subject to anti-TNFalpha treatment, and administering the anti-TNFalpha compound of the treatment response to anti-TNFalpha treatment is found to be favorable for the subject.
- the invention relates to a method of treatment of a subject having IBD by administering an anti-TNFalpha compound, the method comprising performing the method as defined in the first or the second aspect of the invention to determine the treatment response of the subject to anti-TNFalpha treatment, and administering the anti-TNFalpha compound of the treatment response to anti-TNFalpha treatment is found to be favorable for the subject.
- the IBD is UC or CD.
- the anti-TNFalpha compound is selected from the group consisting of antibody based compounds such as Adalimumab, Certolizumab, Etanercept, Golimumab, Infliximab, or a biosimilars or chimeric products of any of the preceding compounds, such as for example the CT-P13 Infliximab biosimilar, or small molecule based compound such as thalidomide, lenalidomide, pomalidomide, a xanthane derivative such as pentoxifylline, bupropion, an 5-HT 2A agonist such as (R)DOI, TCB2, LSD and LA-SS-Az; or a natural compound such as curcumin, catechins, cannabidiol or Echinacea purpurea.
- antibody based compounds such as Adalimumab, Certolizumab, Etanercept, Golimumab, Infliximab, or a biosimilars or chimeric products of any of the
- An anti TNFalpha compound may be an antibody, a small molecule or a short nucleotide type inhibitor.
- Other TNFalpha inhibiting compounds may be known to the skilled person, therefore the above list should not be construed as limiting the invention.
- An antiTNFalpha compound may also be a short nucleotide such as an RNAi, miRNA, siRNA or short nucleotide analogue such as 2'-O-methyl-substituted RNA, locked nucleic acid (LNA) or bridged nucleic acid (BNA), morpholino, or peptide nucleic acid (PNA), targeting a component of the TNFalpha signaling pathway.
- LNA locked nucleic acid
- BNA bridged nucleic acid
- PNA peptide nucleic acid
- the invention relates to a kit of parts comprising primers and probes for the detection of the expression levels of three or more target genes, wherein the expression levels of the three or more genes are selected from:
- kit may be advantageously used in the methods and uses described herein. Therefore, in a fifth aspect the invention relates to a use of the kit according to the fourth aspect in the method of the first or the second or the third aspect of the invention.
- Methods for designing primers and probes for the quantitative detection of expression levels are well known in the art. For example qPCR can be used. The genes named here are listed under their default name. Their sequences can be retrieved from a public database such NCBI genes or genome browsers such as Ensembl or the UCSC genome browser.
- the kit may additionally comprise buffers and/or enzymes and/or other reagents which can be used in the detection, such as dNTP, MgCl 2 solution, Reverse Transcriptase and/or polymerase.
- log2odds scores for pathway activity, derived from the probability scores for pathway activity provided by the Bayesian pathway model analysis.
- Log2odds scores indicate the level of activity of a signaling pathway on a linear scale.
- Figs. 1 to 4 Pathway activity scores of dataset GSE12251 including UC patients with responded (yes) or not responded (no) to anti TNFalpha treatment. Pathway activity score on Y-axis in log2odds. Two sided Mann-Whitney-Wilcoxon statistical tests were performed; p-values are indicated in the figures. P-values indicate: *p ⁇ 0.05; **p ⁇ 0.01; ***p ⁇ 0.001. Depicted are cellular signaling pathway activity scores using a model based on the full gene set (standard) or using a random selection of three genes (3 gene a model; 3 gene b model).
- Fig. 1 shows pathway scores for the MAPK-AP1 and AR pathways.
- Fig. 2 shows pathway scores for the NFkB and STAT1/2 INF I pathways.
- Fig. 3 shows pathway scores for the STAT1/2 INF II and STAT3 pathways.
- Fig. 4 shows pathway scores for the TGFbeta and WNT pathways.
- Figs. 5 to 12 Pathway analysis of dataset GSE16879 containing mucosal biopsies were obtained at endoscopy in actively inflamed mucosa from IBD patients (UC) before and 4-6 weeks after their first infliximab infusion (TNF-alpha blocker) and in normal mucosa from control patients. Pathway activity score on Y-axis in log2odds. Two sided Mann-Whitney-Wilcoxon statistical tests were performed; p-values are indicated in the figures. P-values indicate: *p ⁇ 0.05; **p ⁇ 0.01; ***p ⁇ 0.001.
- Fig. 5 shows pathway scores for the AR pathway.
- Fig. 6 shows pathway scores for the MAPK-AP1 pathway.
- Fig. 7 shows pathway scores for the NFkB pathway.
- Fig. 8 shows pathway scores for the STAT1/2 INF I pathway.
- Fig. 9 shows pathway scores for the STAT1/2 INF II pathway.
- Fig. 10 shows pathway scores for the STAT3 pathway.
- Fig. 11 shows pathway scores for the TGFbeta pathway.
- Fig. 12 shows pathway scores for the WNT pathway.
- Figs. 13 to 20 Pathway analysis of dataset GSE16879 including actively inflamed mucosa from CD patients, before and 4-6 weeks after their first anti-TNFalpha treatment and in normal mucosa from control patients. Most important pathways include for response prediction; AP1, TGFBeta, WNT, NFkB, STAT3, for treatment effectiveness the NFKB and API. P-values and legends are included in the figure. Pathway activity score on Y-axis in log2odds. Two sided Mann-Whitney-Wilcoxon statistical tests were performed; p-values are indicated in the figures. P-values indicate: *p ⁇ 0.05; **p ⁇ 0.01; ***p ⁇ 0.001.
- Fig. 13 shows pathway scores for the AR pathway.
- Fig. 14 shows pathway scores for the MAPK-AP1 pathway.
- Fig. 15 shows pathway scores for the NFkB pathway.
- Fig. 16 shows pathway scores for the STAT1/2 INF I pathway.
- Fig. 17 shows pathway scores for the STAT1/2 INF II pathway.
- Fig. 18 shows pathway scores for the STAT3 pathway.
- Fig. 19 shows pathway scores for the TGFbeta pathway.
- Fig. 20 shows pathway scores for the WNT pathway.
- Figs. 21 to 29 Pathway analysis of dataset GSE23597 containing mucosal biopsy samples from UC patients before treatment with placebo, 5 or 10 mg/kg infliximab, and at 8 and 30 weeks after treatment. Pathway activity score on Y-axis in log2odds. Two sided Mann-Whitney-Wilcoxon statistical tests were performed; p-values are indicated in the figures. P-values indicate: *p ⁇ 0.05; **p ⁇ 0.01; ***p ⁇ 0.001. Depicted are cellular signaling pathway activity scores using a model based on the full gene set (standard) or using a random selection of three genes (3 gene a model; 3 gene b model). Fig. 21 shows the figure legend for Fig. 22 to 29 .
- Fig. 22 shows pathway scores for the AR pathway.
- Fig. 23 shows pathway scores for the MAPK-AP1 pathway.
- Fig. 24 shows pathway scores for the NFkB pathway.
- Fig. 25 shows pathway scores for the STAT1/2 INF I pathway.
- Fig. 26 shows pathway scores for the STAT1/2 INF II pathway.
- Fig. 27 shows pathway scores for the STAT3 pathway.
- Fig. 28 shows pathway scores for the TGFbeta pathway.
- Fig. 29 shows pathway scores for the WNT pathway.
- Fig. 30 to 37 Pathway analysis of dataset GSE52746 which contains colonic samples from Crohn's disease patients and healthy colonic samples from non-inflammatory controls. Crohn's disease patients includes active CD with anti-TNF therapy (non-responders) and inactive CD with anti-TNF therapy (responders). Pathway activity score on Y-axis in log2odds. Mann-Whitney-Wilcoxon statistical test were performed; p-values are indicated in the figures. P-values indicate: *p ⁇ 0.05; **p ⁇ 0.01; ***p ⁇ 0.001. Depicted are cellular signaling pathway activity scores using a model based on the full gene set (standard) or using a random selection of three genes (3 gene a model; 3 gene b model).
- Fig. 30 shows pathway scores for the AR pathway.
- Fig. 31 shows pathway scores for the MAPK-AP1 pathway.
- Fig. 32 shows pathway scores for the NFkB pathway.
- Fig. 33 shows pathway scores for the STAT1/2 INF I pathway.
- Fig. 34 shows pathway scores for the STAT1/2 INF II pathway.
- Fig. 35 shows pathway scores for the STAT3 pathway.
- Fig. 36 shows pathway scores for the TGFbeta pathway.
- Fig. 37 shows pathway scores for the WNT pathway.
- IBD a characteristic profile of signal transduction pathway activities (AR, ER, PR, GR, HH, Notch, TGFBeta, WNT, JAK-STAT1/2, JAK-STAT3, NFkB, PI3K, MAPK).
- Mucosal biopsies were obtained at endoscopy in actively inflamed mucosa from 61 IBD patients (24 ulcerative colitis (UC), 19 Crohn's colitis (CDc) and 18 Crohn's ileitis (CDi)), before and 4-6 weeks after their first infliximab infusion (TNF-alpha blocker) and in normal mucosa from 12 control patients.
- IBD patients 24 ulcerative colitis (UC), 19 Crohn's colitis (CDc) and 18 Crohn's ileitis (CDi)
- UC ulcerative colitis
- CDc 19 Crohn's colitis
- CDi 18 Crohn's ileitis
- Figs. 5 to 12 show the pathways scores of the signaling pathways, which are involved in response prediction, treatment effectiveness and response monitoring of UC. Each case will be described separately below.
- UC the pathway activity before treatment with the anti-TNFalpha were significantly different between responders and non-responders for NFKB, TGFBeta and STAT3, using a two-sided Mann Whitney Wilcoxon test; see Figs. 5 to 12 for p-values and Table 2 for p-values, u-stats and AUC.
- CDS clinical decision support
- More sophisticated classifiers can be built by somebody skilled in the art of machine learning, by using e.g. Bayesian classification, support vector machines or neural nets.
- Table 1 Centroids (Kmeans), delta and threshold based on log2odds values.
- Pathway (Response: Yes) Centroid C1 (Response: No) Centroid C2delta
- Threshold (mean of centroids) HH -15.1 -16.4 0.65 -15.4 NFKB 9.2 -5.4 14.6 1.9 TGFbeta -8.0 -12.3 4.3 -10.15 STAT3 -6.1 -9.2 3.1 -7.65 Sum -20 -43.3 23.3 -31.65
- AR, API, NFKB and STAT3 pathways were significant lower after anti-TNFalpha treatment in responders and non-responders; see Figs. 5 to 12 for p-values and Table 3 for p-values, u-stats and AUC.
- Dataset GSE14580 anti TNF-alpha treatment UC responders and non-responders - response prediction (data not shown)
- Biopsies were obtained from UC patients before treatment with placebo, 5 or 10 mg/kg infliximab (anti-TNFalpha), and at 8 and 30 weeks after treatment.
- Mucosal biopsies were obtained at endoscopy in actively inflamed mucosa from IBD patients Crohn's colitis (CDc) and Crohn's ileitis (CDi)), before and 4-6 weeks after their first infliximab infusion and in normal mucosa from control patients.
- Figs. 13 to 20 show the pathways scores of the signaling pathways which are involved in response prediction, treatment effectiveness and response monitoring of CD.
- Dataset GSE52746 contains data from colonic biopsy samples from Crohn's disease patients and healthy colonic samples from non-inflammatory controls. From the Crohn's disease patients there were 5 non-responders (active CD patients) and 7 responders (inactive CD patients) after anti-TNF therapy. Using the pathway analysis we compared the different groups in the dataset (Table 13).
- Pathway a model genes b model genes AR ABCC4; KLK2; PMEPA1 KLK3; NKX3-1; TMPRSS2 MAPK-AP1 BCL2L11; EZR; GLRX MMP1; MMP3; PLAU NFkB CCL4; ICAM1; NFKBIA CCL3; IL6; TNFAIP2 STAT1/2* IRF9; PDCD1; SAMM50 ST13; STAT1; USP18 STAT3 HSP90B1; ICAM1; JUNB CD274; MCL1; ZEB1 TGFbeta GADD45B; IL11; JUNB ANGPTL4; CTGF; SERPINE1 WNT CD44; DEFA6; KIAA1199 EPHB3; IL8; KLF6 * The STAT
- avgp refers to Average P value (of the 1000 random selections of N genes) and sigper refers to the percentage of the 1000 selections that are significant (P lower or equal to 0.05).
- sigper refers to the percentage of the 1000 selections that are significant (P lower or equal to 0.05).
- the corresponding gene sets are listed in list A.
Abstract
The invention relates to methods based on gene expression levels of at least 3 genes, e.g. ANGPTL4 and two other genes, to predict treatment response to an anti-TNFalpha compound in inflammatory bowel disease patients based on a pre-treatment biopsy, and a method of determining the treatment effectiveness of such treatment based on a biopsy obtained after initiation of the treatment with an anti-TNFalpha compound. The invention further relates to the use of anti-TNFalpha compounds in the treatment of Inflammatory bowel disease wherein the treatment is combined with the method for predicting treatment response and only administered when a favorable response is predicted. Lastly, the invention relates to kits and uses thereof in the methods described herein.
Description
- The present invention relates to the field of diagnostics, in particular in the field of Inflammatory bowel diseases such as Crohn's disease and Ulcerative colitis. The invention in particular relates to methods based on gene expression levels to predict treatment response to an anti-TNFalpha compound based on a pre-treatment biopsy, and to method of determining the treatment effectiveness of such treatment based on a biopsy obtained after initiation of the treatment with an anti-TNFalpha compound. The invention further relates to the use of anti-TNFalpha compounds in the treatment of Inflammatory bowel disease wherein the treatment is combined with the method for predicting treatment response and only administered when a favorable response is predicted. Lastly, the invention relates to kits and uses thereof in the methods and uses described herein.
- Inflammatory bowel disease (IBD) is a group of inflammatory conditions of the colon and small intestine. Crohn's disease (CD) and Ulcerative colitis (UC) are the principal types of inflammatory bowel disease, with each a different auto-immune pathophysiology. Crohn's disease affects the small intestine and large intestine, as well as the mouth, esophagus, stomach and the anus, whereas ulcerative colitis primarily affects the colon and the rectum. In 10% of cases, definitive discrimination in not possible. However, this is important to decide the most suitable surgical therapy, determining the risk of cancer (especially in UC), and systemic drug therapy selection. This holds especially when targeted drugs are used that target the underlying pathophysiology and consequently only work for a specific disease or disease type.
- Even when using histopathology analysis in combination with other diagnostic measurements and patient signs and symptoms, it can still be difficult to diagnose the correct type of inflammatory bowel disease and to treat the disease correctly. Treatment can be directed at inhibition of the inflammation and auto-immune reaction, healing of the intestinal wall, and correcting the microbiome. Multiple types of drugs can inhibit the inflammation and immune response, e.g. corticosteroids and TNFalpha blockers. Use of combination therapy (anti-tumour necrosis factor (TNF) α monoclonal antibodies and an immunomodulator) is one of the most effective treatments in Crohn Disease (CD) (Colombel et al. N Engl J Med 2010; 362:1383-1395 DOI: 10.1056/NEJMoa0904492; incorporated by reference) particularly when given early in the disease course (D'Haens, G. Top-down therapy for IBD: rationale and requisite evidence. Nat Rev Gastroenterol Hepatol 7, 86-92 (2010). https://doi.org/10.1038/nrgastro.2009.222; D'Haens et al. 2008 VOLUME 371, ISSUE 9613, P660-667, FEBRUARY 23, 2008 DOI:https://doi.org/10.1016/S0140-6736(08)60304-9, each hereby incorporated by reference), but indiscriminate use of this strategy would be very expensive and expose many patients to side effects of drugs that they do not require. Unfortunately, in IBD, as in most autoimmune and inflammatory diseases, biomarkers that can reliably predict response or resistance to anti-TNFalpha drugs, and to measure the extent of the actual response, as well as emerging drug resistance during treatment are not available, precluding the delivery of personalized therapy.
- Therefore novel ways of predicting treatment response and effectiveness of treatment with anti-TNFalpha compounds are desired.
- In in a first aspect the invention relates to a method for predicting the treatment response of a subject suffering from inflammatory bowel disease (IBD) to treatment with an anti-TNFalpha compound based on the expression levels of three or more genes, wherein the expression levels of the three or more genes are selected from the group consisting of:
- ANGPTL4, BCL2L1, BCL2L11, BIRC3, CCL2, CCL22, CCL3, CCL4, CCL5, CCND1, CD274, CD44, CDKN2B, COL18A1, CTGF, CX3CL1, CXCL1, CXCL2, CXCL3, DKK1, DNMT1, ENPP2, FGF2, FOS, FSCN1, GADD45B, GLRX, HIF1A, HMGA2, HNF1A, HSP90AB1, HSP90B1, ICAM1, IFNG, IL11, IL10, IL1B, IL6, IL8, IRF1, INPP5D, JUNB, KIAA1199, LEF1, MCL1, MMP1, MMP2, MMP3, MMP9, MYC, NFKB2, NFKBIA, NFKBIE, NOS2, OVOL1, PDGFB, PLAU, PLAUR, PTGS2, PTHLH, SAA1, SELE, SERPINE1, SKIL, SMAD4, SNAI2, STAT1, STAT5A, TBX3, TCF7L2, TIMP1, TNF, TNFAIP2, TNFRSF1B, TRAF1, TWIST1, VCAM1, VEGFA, VIM, and ZEB1, and
- wherein an increased expression level of CDKN2B, HMGA2, OVOL1, SMAD4, BCL2L11, HNF1A or TCF7L2, or a decreased expression level of any of the other genes corresponds to a favorable treatment response, and
- wherein a decreased expression level of CDKN2B, HMGA2, OVOL1, SMAD4, BCL2L11, HNF1A or TCF7L2, or an increased expression level of any of the other genes corresponds to a not favorable treatment response.
- In a second aspect, the invention relates to a method for determining the effectiveness of a treatment of a subject suffering from IBD with an anti-TNFalpha compound based on the expression levels of three or more genes,
wherein if the IBD is UC, the three or more genes are selected from the group consisting of BCL2L11, CDKN1A, DNMT1, EAF2, ELL2, ENPP2, FKBP5, GLRX, LCP1, MMP1, MMP3, MMP9, PLAU, PLAUR, PMEPA1, PRKACB, PTGS2, SERPINE1, SGK1, TIMP1, TMPRSS2 and VIM; or
wherein the IBD is CD, the three or more genes are selected from the group consisting of BCL2L1, BCL2L11, BIRC3, CCL2, CCL22, CCL3, CCL4, CCL5, CX3CL1, CXCL1, CXCL2, CXCL3, DNMT1, ENPP2, GLRX, ICAM1, IL1B, IL6, IL8, IRF1, MMP1, MMP3, MMP9, NFKB2, NFKBIA, NFKBIE, PLAU, PLAUR, PTGS2, SELE, SERPINE1, STAT5A, TIMP1, TNF, TNFAIP2, TRAF1, VCAM1 and VIM;
wherein the three or more expression levels are used to determine whether the treatment of IBD in the patient with an anti-TNFalpha compound is effective or not effective,
wherein a decreased expression level of BCL2L11 or PRKACB or an increased expression level of any of the other genes corresponds to a not effective treatment, and
wherein an increased expression level of BCL2L11 or PRKACB or a decreased expression level of any of the other genes corresponds to an effective treatment. - In a third aspect, the invention relates to an anti-TNFalpha compound for use of in the treatment of IBD in a subject, wherein the use comprises:
- performing the method as defined in any one of the preceding claims to determine the treatment response of the subject to anti-TNFalpha treatment, and
- administering the anti-TNFalpha compound of the treatment response to anti-TNFalpha treatment is found to be favorable for the subject.
- In a fourth aspect, the invention relates to a kit of parts comprising primers and probes for the detection of the expression levels of three or more target genes, wherein the expression levels of the three or more genes are selected from:
- the group consisting of ANGPTL4, BCL2L1, BCL2L11, BIRC3, CCL2, CCL22, CCL3, CCL4, CCL5, CCND1, CD274, CD44, CDKN2B, COL18A1, CTGF, CX3CL1, CXCL1, CXCL2, CXCL3, DKK1, DNMT1, ENPP2, FGF2, FOS, FSCN1, GADD45B, GLRX, HIF1A, HMGA2, HNF1A, HSP90AB1, HSP90B1, ICAM1, IFNG, IL11, IL10, IL1B, IL6, IL8, IRF1, INPP5D, JUNB, KIAA1199, LEF1, MCL1, MMP1, MMP2, MMP3, MMP9, MYC, NFKB2, NFKBIA, NFKBIE, NOS2, OVOL1, PDGFB, PLAU, PLAUR, PTGS2, PTHLH, SAA1, SELE, SERPINE1, SKIL, SMAD4, SNAI2, STAT1, STAT5A, TBX3, TCF7L2, TIMP1, TNF, TNFAIP2, TNFRSF1B, TRAF1, TWIST1, VCAM1, VEGFA, VIM, and ZEB1; or
- the group consisting of BCL2L11, CDKN1A, DNMT1, EAF2, ELL2, ENPP2, FKBP5, GLRX, LCP1, MMP1, MMP3, MMP9, PLAU, PLAUR, PMEPA1, PRKACB, PTGS2, SERPINE1, SGK1, TIMP1, TMPRSS2 and VIM; or
- the group consisting of BCL2L1, BCL2L11, BIRC3, CCL2, CCL22, CCL3, CCL4, CCL5, CX3CL1, CXCL1, CXCL2, CXCL3, DNMT1, ENPP2, GLRX, ICAM1, IL1B, IL6, IL8, IRF1, MMP1, MMP3, MMP9, NFKB2, NFKBIA, NFKBIE, PLAU, PLAUR, PTGS2, SELE, SERPINE1, STAT5A, TIMP1, TNF, TNFAIP2, TRAF1, VCAM1 and VIM.
- In a fifth aspect the invention relates to a use of the kit according to the fourth aspect of the invention in the method according to the first or the second aspect of the invention.
- Currently available treatment decisions are based on the disease diagnosis from histopathology with other diagnostic measurements. It was found that using pathway activity models diagnosis can be linked to a pathophysiological disease mechanism, in terms of a specific combined signaling pathway activity profile, and this can be used to predict treatment response, treatment effectiveness and treatment monitoring. The inventors used pathway analysis of public datasets to determine which cellular signaling pathways can be used to predict whether a patient suffering from IBD will have a good treatment response to treatment with an anti-TNFalpha compound, to determine the effectiveness in patients being treated with an anti-TNFalpha compound. It was found that there is a significant elevation in the TGFbeta, NFkB, MAPK-AP1, STAT3 and WNT pathways in biopsies from IBD patients, pre-treatment, that have poor response to anti-TNFalpha treatment as compared to IBD patients that respond well to anti-TNFalpha treatment. These results hold both for Ulcerative Colitis and Crohn's Disease. Further is was found that treatment effectiveness can be determined for Ulcerative Colitis and Crohn's Disease patients undergoing anti-TNFalpha treatment based on the AR and/or the MAPK-AP1 cellular signaling in the case of Ulcerative Colitis, or based on the MAPK-AP1 and/or the NFkB cellular signaling pathway in case of Crohn's Disease.
- The inventors investigated further whether the target genes that form the basis of these cellular signaling pathway activity models can be used instead of the pathway models. To this extend, it was determined for each pathway which target genes provided the biggest contribution to the cellular signaling pathway activity score in the publicly available datasets used here. For each application, a selection of the cellular signaling pathway target genes was made that most contributed to the pathway activity score in that respective application. It was then tested whether random selections of target gene expression levels allow for distinguishing between different situations (e.g. responders and non-responders in pre-treatment biopsies) in a significant manner. It was found that a random selection of three target genes selected as described above allow for significant stratification in most cases. Depending on the application and strictness of target gene selection, between approximately 90 to 100 percent of the random selections of three target genes allows for a significant distinction between the different groups (e.g. responders and non-responders, or effective treatment vs non-effective treatment).
- Therefore, in a first aspect the invention relates to a method for predicting the treatment response of a subject suffering from inflammatory bowel disease (IBD) to treatment with an anti-TNFalpha compound based on the expression levels of three or more, e.g. three, four, five, six seven, eight, nine, ten, eleven or twelve or more, genes, wherein the expression levels of the three or more, e.g. three, four, five, six seven, eight, nine, ten, eleven or twelve or more, genes are selected from the group consisting of:
- ANGPTL4, BCL2L1, BCL2L11, BIRC3, CCL2, CCL22, CCL3, CCL4, CCL5, CCND1, CD274, CD44, CDKN2B, COL18A1, CTGF, CX3CL1, CXCL1, CXCL2, CXCL3, DKK1, DNMT1, ENPP2, FGF2, FOS, FSCN1, GADD45B, GLRX, HIF1A, HMGA2, HNF1A, HSP90AB1, HSP90B1, ICAM1, IFNG, IL11, IL10, IL1B, IL6, IL8, IRF1, INPP5D, JUNB, KIAA1199, LEF1, MCL1, MMP1, MMP2, MMP3, MMP9, MYC, NFKB2, NFKBIA, NFKBIE, NOS2, OVOL1, PDGFB, PLAU, PLAUR, PTGS2, PTHLH, SAA1, SELE, SERPINE1, SKIL, SMAD4, SNAI2, STAT1, STAT5A, TBX3, TCF7L2, TIMP1, TNF, TNFAIP2, TNFRSF1B, TRAF1, TWIST1, VCAM1, VEGFA, VIM, and ZEB1, and
- wherein an increased expression level of CDKN2B, HMGA2, OVOL1, SMAD4, BCL2L11, HNF1A or TCF7L2, or a decreased expression level of any of the other genes corresponds to a favorable treatment response, and
- wherein a decreased expression level of CDKN2B, HMGA2, OVOL1, SMAD4, BCL2L11, HNF1A or TCF7L2, or an increased expression level of any of the other genes corresponds to a not favorable treatment response.
- In an embodiment the three or more expression levels are used to predict whether the treatment response to treatment of IBD in the patient with an anti-TNFalpha compound is favorable or not favorable.
- In an embodiment a decreased expression level of CDKN2B, HMGA2, OVOL1, SMAD4, BCL2L11, HNF1A or TCF7L2, or an increased expression level of any of the other genes corresponds to a not favorable treatment response.
- When used herein, treatment prediction refers to predicting the likelihood of an IBD patient (e.g. an UC or a CD patient) to having a treatment response as defined herein below to treatment with an anti-TNFalpha compound, wherein said treatment prediction is made prior to treatment, for example based on a biopsy or sample from the patient.
- When used herein, treatment effectiveness refers to predicting the likelihood of an IBD patient (e.g. an UC or a CD patient) to having a treatment response as defined herein below to treatment with an anti-TNFalpha compound, wherein said treatment prediction is made after onset of said treatment, for example based on a biopsy or sample from the patient.
- It was found that the expression levels of the following genes strongly correlate with pathway activity in the investigated public datasets: ANGPTL4, BCL2L1, BCL2L11, BIRC3, CCL2, CCL22, CCL3, CCL4, CCL5, CCND1, CD274, CD44, CDKN2B, COL18A1, CTGF, CX3CL1, CXCL1, CXCL2, CXCL3, DKK1, DNMT1, ENPP2, FGF2, FOS, FSCN1, GADD45B, GLRX, HIF1A, HMGA2, HNF1A, HSP90AB1, HSP90B1, ICAM1, IFNG, IL11, IL10, IL1B, IL6, IL8, IRF1, INPP5D, JUNB, KIAA1199, LEF1, MCL1, MMP1, MMP2, MMP3, MMP9, MYC, NFKB2, NFKBIA, NFKBIE, NOS2, OVOL1, PDGFB, PLAU, PLAUR, PTGS2, PTHLH, SAA1, SELE, SERPINE1, SKIL, SMAD4, SNAI2, STAT1, STAT5A, TBX3, TCF7L2, TIMP1, TNF, TNFAIP2, TNFRSF1B, TRAF1, TWIST1, VCAM1, VEGFA, VIM, and ZEB1,
- Of this set of genes, the expression levels of CDKN2B, HMGA2, OVOL1, SMAD4, BCL2L11, HNF1A or TCF7L2 demonstrate a negative correlation with pathway activity, meaning their expression levels are reduced with increased pathway activity. Therefore when adding up expression levels of multiple target gene the expression levels of the genes CDKN2B, HMGA2, OVOL1, SMAD4, BCL2L11, HNF1A or TCF7L2 are preferably modified with a negative constant, preferably with "-1".
- The expression levels of ANGPTL4, BCL2L1, BIRC3, CCL2, CCL22, CCL3, CCL4, CCL5, CCND1, CD274, CD44, COL18A1, CTGF, CX3CL1, CXCL1, CXCL2, CXCL3, DKK1, DNMT1, ENPP2, FGF2, FOS, FSCN1, GADD45B, GLRX, HIF1A, HSP90AB1, HSP90B1, ICAM1, IFNG, IL11, IL10, IL1B, IL6, IL8, IRF1, INPP5D, JUNB, KIAA1199, LEF1, MCL1, MMP1, MMP2, MMP3, MMP9, MYC, NFKB2, NFKBIA, NFKBIE, NOS2, PDGFB, PLAU, PLAUR, PTGS2, PTHLH, SAA1, SELE, SERPINE1, SKIL, SNAI2, STAT1, STAT5A, TBX3, TIMP1, TNF, TNFAIP2, TNFRSF1B, TRAF1, TWIST1, VCAM1, VEGFA, VIM, and ZEB1 demonstrate a positive correlation with pathway activity, meaning their expression levels are increased with increased pathway activity.
- As can be deducted from the data presented herein, by using more target genes the accuracy of the prediction can be increased, as is evident from the comparison of three gene pathway models vs full pathway models, and the data comparing statistical accuracy of a prediction based on a random selection of three vs six genes. Therefore it may be desirable to increase the number of target gene expression levels that are used in the prediction, however it is emphasized that as demonstrated here a selection of three target genes suffices to make accurate predictions.
- In an embodiment the IBD is Ulcerative Colitis (UC) or Crohn Disease (CD). It was found that these genes were predictive for treatment response both UC and CD patients.
- Using a random selection of three genes from the groups listed above a significant distinction can be made between responders and non-responders to anti-TNFalpha treatment in a pre-treatment biopsy in both Ulcerative Colitis and Crohn's Disease patients, as evidenced by
Figs. 5 to 20 . - Currently no real methods are available to predict successful outcome of anti-TNFalpha treatment in Inflammatory Bowel Disease patients [Lopetuso, Loris Riccardo et al. "Can We Predict the Efficacy of Anti-TNF-a Agents?." International journal of molecular sciences vol. 18,9 1973. 14 Sep. 2017, doi:10.3390/ijmsl8091973; incorporated by reference in its entirety]. Literature data report that primary non-response to anti-TNF-a induction therapy (assessed not before weeks 8-12 after starting treatment) occurs between 20-40% of patients in clinical trials and in 10-20% in "real life" series. Secondary loss of response (LOR) is also a common clinical problem with incidence ranging between 23 and 46% at 12 months after anti-TNF-a initiation [Ben-Horin S., Kopylov U., Chowers Y. Optimizing anti-TNF treatments in inflammatory bowel disease. Autoimmun. Rev. 2014;13:24-30. doi: 10.1016/j.autrev.2013.06.002.]. The use of biological therapies, in particular anti-tumor necrosis factor (TNF)-α agents, has spread increasingly in the last two decades thanks to their potential and unique ability of altering the natural history of IBD. In fact, both controlled trials and "real life" studies showed that anti-TNF-a agents, including infliximab (IFX), adalimumab (ADA), golimumab (GOL) and certolizumab pegol (CER), are able to induce and maintain clinical remission and to reduce the need for surgery and hospitalization. Furthermore, they lead to an improvement in quality of life and also to a reduction in direct and indirect costs associated with these chronic debilitating disorders.
- Unfortunately, anti-TNF-a agents are not a magic bullet for all IBD cases. Firstly, side-effects can be severe and life-threatening in some patients, mainly due to infective events and then to immunogenicity, with the formation of antibodies-to-anti-TNF-a and a consequent loss of response (LOR) to these drugs over time. Therefore, there is a great need for accurate prediction methods to anti-TNFalpha therapies in IBD patients. The methods disclosed herein provide an accurate method for predicting treatment response in IBD patients to anti-TNFalpha therapy based on a biopsy, as evidenced by the Experimental results below. The method is based on the expression levels of a carefully curated set of genes which are found to be predictive.
- To identify cellular signaling pathways that could be predictive in pre-treatment biopsies, pathway activities were analyzed on public datasets (GSE12251, GSE16879, GSE23597 and GSE52746). It was found that, individually, each of the TGFbeta, NFkB, MAPK-AP1, STAT3 and WNT cellular signaling pathways could be used to predict if a patient would responds to treatment with an anti-TNFalpha compound, by comparing the cellular signaling pathway activities of responders and non-responders in pre-treatment biopsies. Pathway activities for each of the TGFbeta, NFkB, MAPK-AP1, STAT3 and WNT cellular signaling pathways were significantly higher in pre-treatment biopsies from subjects that do not respond to treatment with an anti-TNFalpha compound compared to subjects that respond well to treatment with an anti-TNFalpha compound. Therefore as part of the invention disclosed herein, the invention relates to a method for predicting the treatment response of a subject suffering from inflammatory bowel disease (IBD) to treatment with an anti-TNFalpha compound based on inferred cellular signaling pathway activity or activities in a sample obtained from the subject, the method comprising comparing the inferred cellular signaling pathway activity, or when multiple cellular signaling pathway activities are used the combined cellular signaling pathway activities, with a threshold value, wherein the cellular signaling pathway is one or more cellular signaling pathway selected from TGFbeta, NFkB, MAPK-AP1, STAT3 and WNT, as detailed herein below. The target genes used for determining cellular signaling pathway activity using these pathway models are preferably selected as follows:
- genes of the TGFbeta pathway are selected from the group consisting of ANGPTL4, CDC42EP3, CDKNIA, CDKN2B, CTGF, GADD45A, GADD45B, HMGA2, ID1, IL11, SERPINE1, INPP5D, JUNB, MMP2, MMP9, NKX2-5, OVOL1, PDGFB, PTHLH, SGK1, SKIL, SMAD4, SMAD5, SMAD6, SMAD7, SNAI1, SNAI2, TIMP1, and VEGFA, preferably, from the group consisting of: ANGPTL4, CDC42EP3, CDKNIA, CTGF, GADD45A, GADD45B, HMGA2, ID1, IL11, JUNB, PDGFB, PTHLH, SERPINE1, SGK1, SKIL, SMAD4, SMAD5, SMAD6, SMAD7, SNAI2, VEGFA, more preferably, from the group consisting of: ANGPTL4, CDC42EP3, CDKNIA, CTGF, GADD45B, ID1, IL11, JUNB, SERPINE1, PDGFB, SKIL, SMAD7, SNAI2, and VEGFA, more preferably, from the group consisting of: ANGPTL4, CDC42EP3, ID1, IL11, JUNB, SERPINE1, SKIL, and SMAD7;
- genes of the NFkB pathway are selected from the group consisting of BCL2L1, BIRC3, CCL2, CCL3, CCL4, CCL5, CCL20, CCL22, CX3CL1, CXCL1, CXCL2, CXCL3, ICAM1, IL1B, IL6, IL8, IRF1, MMP9, NFKB2, NFKBIA, NFKB IE, PTGS2, SELE, STAT5A, TNF, TNFAIP2, TNIP1, TRAF1, and VCAM1;
- genes of the MAPK-AP1 pathway are selected from the group consisting of BCL2L11, CCND1, DDIT3, DNMT1, EGFR, ENPP2, EZR, FASLG, FIGF, GLRX, IL2, IVL, LOR, MMP1, MMP3, MMP9, SERPINE1, PLAU, PLAUR, PTGS2, SNCG, TIMP1, TP53, and VIM, preferably, from the group consisting of: CCND1, EGFR, EZR, GLRX, MMP1, MMP3, PLAU, PLAUR, SERPINE1, SNCG, and TIMP1;
- genes of the STAT3 pathway are selected from the group consisting of AKT1, BCL2, BCL2L1, BIRC5, CCND1, CD274, CDKNIA, CRP, FGF2, FOS, FSCN1, FSCN2, FSCN3, HIF1A, HSP90AA1, HSP90AB1, HSP90B1, HSPA1A, HSPA1B, ICAM1, IFNG, IL10, JUNB, MCL1, MMP1, MMP3, MMP9, MUC1, MYC, NOS2, POU2F1, PTGS2, SAA1, STAT1, TIMP1, TNFRSF1B, TWIST1, VIM, and ZEB1, preferably, either from the group consisting of: BCL2L1, BIRC5, CCND1, CD274, FOS, HIF1A, HSP90AA1, HSP90AB1, MMP1, and MYC, or from the group consisting of: BCL2L1, CD274, FOS, HSP90B1, HSPA1B, ICAM1, IFNG, JUNB, PTGS2, STAT1, TNFRSF1B, and ZEB1;
- genes of the WNT pathway are selected from the group consisting of KIAA1199, AXIN2, R F43, TBX3, TDGF1, SOX9, ASCL2, IL8, SP5, Z RF3, KLF6, CCND1, DEFA6 and FZD7, optionally further comprising one or more target genes selected from NKD1, OAT, FAT1, LEF1, GLUL, REG1B, TCF7L2, COL18A1, BMP7, SLC1A2, ADRA2C, PPARG, DKK1, HNF1A and LECT2.
- Next the inventors reviewed whether a specific subset of target genes in the pathway models is responsible for the pathway activity. The pathway models are constructed with a large set of genes keeping in mind that they are broadly applicable, therefore not every gene will be upregulated in a specific context (e.g. cell or tissue type, or specific biological function), although it is found that in most cases a randomly selected subset of three genes should be predictive of pathway activity in any application. For the specific application, predicting response to anti-TNFalpha treatment based on a pre-treatment biopsy of a subject suffering from IBD can be based on a random selection of three genes. Therefore target genes that contribute less to the total pathway activity were identified and removed from the list, resulting in a cured list of target genes. The curation of the target genes list was performed based on total cellular signaling pathway activity regardless of group (responder vs non-responder) as to not introduce any bias. The curated target genes lists are:
- group 1 (curated TGFbeta list) consist of the genes: ANGPTL4, CDKN2B, CTGF, GADD45B, HMGA2, IL11, INPP5D, JUNB, MMP2, MMP9, OVOL1, PDGFB, PTHLH, SERPINE1, SKIL, SMAD4, SNAI2, TIMP1, VEGFA
- group 2 (curated NFkB list) consist of the genes: BCL2L1, BIRC3, CCL2, CCL22, CCL3, CCL4, CCL5, CX3CL1, CXCL1, CXCL2, CXCL3, ICAM1, IL1B, IL6, IL8, IRF1, MMP9, NFKB2, NFKBIA, NFKBIE, PTGS2, SELE, STAT5A, TNF, TNFAIP2, TRAF1, VCAM1;
- group 3 (curated MAPK-AP1 list) consist of the genes: BCL2L11, CCND1, DNMT1, ENPP2, GLRX, MMP1, MMP3, MMP9, PLAU, PLAUR, PTGS2, SERPINE1, TIMP1, VIM;
- group 4(curated STAT3 list) consist of the genes: BCL2L1, CCND1, CD274, FGF2, FOS, FSCN1, HIF1A, HSP90AB1, HSP90B1, ICAM1, IFNG, IL10, JUNB, MCL1, MMP1, MMP3, MMP9, MYC, NOS2, PTGS2, SAA1, STAT1, TIMP1, TNFRSF1B, TWIST1, VIM, ZEB1;
- group 5 (curated WNT list) consist of the genes: CCND1, CD44, COL18A1, DKK1, HNF1A, IL8, KIAA1199, LEF1, MYC, TBX3, TCF7L2.
- Therefore in an embodiment, the invention relates to a method for predicting the treatment response of a subject suffering from inflammatory bowel disease (IBD) to treatment with an anti-TNFalpha compound based on the expression levels of three or more genes, wherein the expression levels of the three or more genes are selected from one or more groups selected from group 1, group 2, group 3, group 4, and group 5; and wherein group 1 consist of the genes: ANGPTL4, CDKN2B, CTGF, GADD45B, HMGA2, IL11, INPP5D, JUNB, MMP2, MMP9, OVOL1, PDGFB, PTHLH, SERPINE1, SKIL, SMAD4, SNAI2, TIMP1, VEGFA; wherein group 2 consist of the genes: BCL2L1, BIRC3, CCL2, CCL22, CCL3, CCL4, CCL5, CX3CL1, CXCL1, CXCL2, CXCL3, ICAM1, IL1B, IL6, IL8, IRF1, MMP9, NFKB2, NFKBIA, NFKBIE, PTGS2, SELE, STAT5A, TNF, TNFAIP2, TRAF1, VCAM1; wherein group 3 consist of the genes: BCL2L11, CCND1, DNMT1, ENPP2, GLRX, MMP1, MMP3, MMP9, PLAU, PLAUR, PTGS2, SERPINE1, TIMP1, VIM; wherein group 4 consist of the genes: BCL2L1, CCND1, CD274, FGF2, FOS, FSCN1, HIF1A, HSP90AB1, HSP90B1, ICAM1, IFNG, IL10, JUNB, MCL1, MMP1, MMP3, MMP9, MYC, NOS2, PTGS2, SAA1, STAT1, TIMP1, TNFRSF1B, TWIST1, VIM, ZEB1; wherein group 5 consist of the genes: CCND1, CD44, COL18A1, DKK1, HNF1A, IL8, KIAA1199, LEF1, MYC, TBX3, TCF7L2; and wherein the three or more expression levels are used to predict whether the treatment response to treatment of IBD in the patient with an anti-TNFalpha compound is favorable or not favorable, wherein a decreased expression level of CDKN2B, HMGA2, OVOL1, SMAD4, BCL2L11, HNF1A or TCF7L2, or an increased expression level of any of the other genes corresponds to a not favorable treatment response, and wherein an increased expression level of CDKN2B, HMGA2, OVOL1, SMAD4, BCL2L11, HNF1A or TCF7L2, or a decreased expression level of any of the other genes corresponds to a favorable treatment response. Preferably, wherein:
group 1 consist of the genes: ANGPTL4, CDKN2B, CTGF, GADD45B, IL11, INPP5D, JUNB, MMP2, MMP9, PTHLH, SERPINE1, SNAI2, TIMP1;group 2 consist of the genes: BCL2L1, BIRC3, CCL2, CCL22, CCL3, CCL4, CCL5, CX3CL1, CXCL1, CXCL2, CXCL3, ICAM1, IL1B, IL6, IL8, IRF1, MMP9, NFKB2, NFKBIA, NFKBIE, PTGS2, SELE, STAT5A, TNF, TNFAIP2, TRAF1, VCAM1; whereingroup 3 consist of the genes: CCND1, GLRX, MMP1, MMP3, MMP9, PLAU, PLAUR, PTGS2, SERPINE1, TIMP1, VIM; whereingroup 4 consist of the genes: BCL2L1, CCND1, CD274, FGF2, FSCN1, HIF1A, HSP90B1, ICAM1, IFNG, JUNB, MCL1, MMP1, MMP3, MMP9, PTGS2, STAT1, TIMP1, TNFRSF1B, TWIST1, VIM, ZEB1; whereingroup 5 consist of the genes: CCND1, CD44, COL18A1, DKK1, IL8, KIAA1199, TBX3. The three or more genes may be selected from a single group or may be a combination of different groups. As the strongest correlation was found between the NFkB and TGFbeta cellular signaling pathway activities and treatment response prediction, preferably the three or more genes are chosenform group 1 and/orgroup 2. - Next all the curated pathway target genes were pooled, and the inventors analyzed if random selections of three genes of the pooled curated target genes would still allow a prediction for treatment response. In order to analyze this, a random selection of three genes was made 1000 times, and a simple linear classifier was made with those 1000 random selections of three genes by assigning each gene a weight +1 or -1 depending on the sign of their correlation (up- or down regulated when pathway activity is increased). Next the linear classifier was applied on the samples from the two sample groups to be distinguished, and a Wilcox Rank Sum test was performed, resulting in a p-value. These p-values are plotted in
Figs. 38 to 45 . As can be seen, at least 90% percent of the random selections of three genes of the pooled curated target genes has statistically relevant combined expression levels between responders and non-responders (p value of 0.05 or lower). - As expected, by selecting more curated target genes for the prediction, the likelihood that a random selection of curated target genes allow for statistically significant prediction is increased (see
Figs. 40 ,41 ,44 and45 ). Therefore, in an embodiment, the method is preferably based on three or more, for example three, four, five, six, seven eight, nine, ten, eleven or twelve or more, genes selected from the group consisting of ANGPTL4, BCL2L1, BCL2L11, BIRC3, CCL2, CCL22, CCL3, CCL4, CCL5, CCND1, CD274, CD44, CDKN2B, COL18A1, CTGF, CX3CL1, CXCL1, CXCL2, CXCL3, DKK1, DNMT1, ENPP2, FGF2, FOS, FSCN1, GADD45B, GLRX, HIF1A, HMGA2, HNF1A, HSP90AB1, HSP90B1, ICAM1, IFNG, IL11, IL10, IL1B, IL6, IL8, IRF1, INPP5D, JUNB, KIAA1199, LEF1, MCL1, MMP1, MMP2, MMP3, MMP9, MYC, NFKB2, NFKBIA, NFKBIE, NOS2, OVOL1, PDGFB, PLAU, PLAUR, PTGS2, PTHLH, SAA1, SELE, SERPINE1, SKIL, SMAD4, SNAI2, STAT1, STAT5A, TBX3, TCF7L2, TIMP1, TNF, TNFAIP2, TNFRSF1B, TRAF1, TWIST1, VCAM1, VEGFA, VIM, and ZEB1. - As further indicated in
Figs. 42 to 45 , by further increasing the threshold of accepting target genes for the curated gene list, the chance that three randomly selected genes are statistically significant for predicting treatment response is even further increased, therefore in a further preferred embodiment the three or more, for example three, four, five, six, seven eight, nine, ten, eleven or twelve or more, genes selected from the group consisting of ANGPTL4, BCL2L1, BIRC3, CCL2, CCL22, CCL3, CCL4, CCL5, CCND1, CD274, CD44, CDKN2B, COL18A1, CTGF, CX3CL1, CXCL1, CXCL2, CXCL3, DKK1, FGF2, FSCN1, GADD45B, GLRX, HIF1A, HSP90B1, ICAM1, IFNG, IL11, IL1B, IL6, IL8, INPP5D, IRF1, JUNB, KIAA1199, MCL1, MMP1, MMP2, MMP3, MMP9, NFKB2, NFKBIA, NFKBIE, PLAU, PLAUR, PTGS2, PTHLH, SELE, SERPINE1, SNAI2, STAT1, STAT5A, TBX3, TIMP1, TNF, TNFAIP2, TNFRSF1B, TRAF1, TWIST1, VCAM1, VIM, ZEB1. - As can be further derived from among others
Figs. 7 ,11 ,15 and19 , the TGFbeta and the NFkB have the strongest correlation with predicting anti-TNFalpha treatment effectiveness based on pre-treatment biopsy, therefore the prediction is preferably based on a selection of the curated TGFbeta or NFkB cellular signaling pathway target genes: - group 1 (curated TGFbeta list) consist of the genes: ANGPTL4, CDKN2B, CTGF, GADD45B, HMGA2, IL11, INPP5D, JUNB, MMP2, MMP9, OVOL1, PDGFB, PTHLH, SERPINE1, SKIL, SMAD4, SNAI2, TIMP1, VEGFA
- group 2 (curated NFkB list) consist of the genes: BCL2L1, BIRC3, CCL2, CCL22, CCL3, CCL4, CCL5, CX3CL1, CXCL1, CXCL2, CXCL3, ICAM1, IL1B, IL6, IL8, IRF1, MMP9, NFKB2, NFKBIA, NFKBIE, PTGS2, SELE, STAT5A, TNF, TNFAIP2, TRAF1, VCAM1; Therefore in an embodiment, the method is preferably based on three or more, for example three, four, five, six, seven eight, nine, ten, eleven or twelve or more, gene selected from the group consisting of, ANGPTL4, BCL2L1, BIRC3, CCL2, CCL22, CCL3, CCL4, CCL5, CDKN2B, CTGF, CX3CL1, CXCL1, CXCL2, CXCL3, GADD45B, HMGA2, ICAM1, IL11, IL1B, IL6, IL8, INPP5D, IRF1, JUNB, MMP2, MMP9, NFKB2, NFKBIA, NFKBIE, OVOL1, PDGFB, PTGS2, PTHLH, SELE, SERPINE1, SKIL, SMAD4, SNAI2, STAT5A,TIMP1, TNF, TNFAIP2, TRAF1, VEGFA and VCAM1, more preferably the method is based on three or more, for example three, four, five, six, seven eight, nine, ten, eleven or twelve or more, gene selected from the group consisting of ANGPTL4, BCL2L1, BIRC3, CCL2, CCL22, CCL3, CCL4, CCL5, CDKN2B, CTGF, CX3CL1, CXCL1, CXCL2, CXCL3, GADD45B, ICAM1, IL11, IL1B, IL6, IL8, INPP5D, IRF1, JUNB, MMP2, MMP9, NFKB2, NFKBIA, NFKBIE, PTGS2, PTHLH, SELE, SERPINE1, SNAI2, STAT5A, TIMP1, TNF, TNFAIP2, TRAF1 and VCAM1.
- The conditions for selecting target genes (T value) and number of genes (N values) were further varied to evaluate the conditions that allow for accurate prediction of treatment or treatment effectiveness. These results are set out in Table 15 below. For each condition resulting in 90% or more of the 1000 random selections of N genes having a significant differentiation between responders and non-responders, the representative gene set are listed below in LIST A. Table 15 lists for each UC and CD patient samples (based on dataset GSE16879) prediction (treatment prediction) prediction2 (treatment prediction but only target genes from the NFkB or the TGFbeta pathway are selected) or effectiveness (treatment effectiveness) for T=0.3, 0.4 and 0.5 and N=1, 2, 3 or 6. For each condition, N genes were randomly selected 1000 times and it was reviewed how often the random selection of N genes were statistically significant in distinguishing responders and non-responders to anti-TNFalpha treatment. The results are plotted in Table 15, avgp refers to Average P value (of the 1000 random selections of N genes) and sigper refers to the percentage of the 1000 selections that are significant (P lower or equal to 0.05). For each condition that has at least 90 percent significant (meaning at least 900 out of the 1000 random selections of N genes) the corresponding gene sets are listed in list A.
- Therefore, in an embodiment, the method is preferably based on N or more, for example one, two, three, four, five, six, seven eight, nine, ten, eleven or twelve or more, genes selected from a group as listed in LIST A below wherein the application is listed as prediction or prediction2 and N is indicated in LIST A for the respective set, and
wherein an increased expression level of CDKN2B, HMGA2, OVOL1, SMAD4, BCL2L11, HNF1A or TCF7L2, or a decreased expression level of any of the other genes corresponds to a favorable treatment response, and
wherein a decreased expression level of CDKN2B, HMGA2, OVOL1, SMAD4, BCL2L11, HNF1A or TCF7L2, or an increased expression level of any of the other genes corresponds to a not favorable treatment response. - Inflammatory bowel disease (IBD) is the name for a group of conditions that cause the digestive system to become inflamed (red, swollen, and sometimes painful). The most common types of IBD are ulcerative colitis and Crohn's disease. These cause similar symptoms, including diarrhea, rectal bleeding, abdominal pain, fatigue, weight loss and fever. IBD can be debilitating and sometimes leads to life-threatening complications. Crohn's disease affects the small intestine and large intestine, as well as the mouth, esophagus, stomach and the anus, whereas ulcerative colitis primarily affects the colon and the rectum.
- When used herein, treatment response refers to an improvement of the grade of the disease when comparing post treatment and pre-treatment grading. Grading systems have been developed for both UC and CD. For UC this has been described in Geboes et al. (Geboes, K et al. "A reproducible grading scale for histological assessment of inflammation in ulcerative colitis." Gut vol. 47,3 (2000): 404-9. doi:10.1136/gut.47.3.404; hereby incorporated by reference in its entirety). Briefly summarized a grade can be assigned for each factor corresponding from
grade 0 to 5, with the subgrade indicating the severity, ranging from 0 (no abnormality / not present) to 3 (most severe symptom) as indicated in Table 1 of Geboes et al. (hereby incorporated by reference).Grade 0 scores structural change,grade 1 chronic inflammation infiltrate,grade 2 scores lamina propria neutrophils and eosinophils,grade 3 scores neutrophils in theepithelium grade 4 scores crypt destruction andgrade 5 scores erosion or ulceration. Therefore a favorable treatment response as defined herein means that when comparing grades 0-5 prior and after treatment, the subgrades are on average lower after treatment, preferably each subgrade is individually lower or equal after treatment, with the proviso that at least one subgrade is lower after treatment, indicating less severe symptoms. Equally a non-favorable treatment response as defined herein means that when comparing grades 0-5 prior and after treatment, the subgrades are on average equal or higher after treatment, for example each subgrade is individually higher or equal after treatment, indicating equal or more severe symptoms. For CD (D'Haens GR, Geboes K, Peeters M, Baert F, Penninckx F, Rutgeerts P. Early lesions of recurrent Crohn's disease caused by infusion of intestinal contents in excluded ileum. Gastroenterology. 1998 Feb;114(2):262-7. doi: 10.1016/s0016-5085(98)70476-7. PMID: 9453485; hereby incorporated by reference in its entirety), briefly summarized 8 abnormalities are scored agrade 0 to 2 or 0 to 3, with agrade 0 indicating normal / not present and a higher grade indicating more severe symptoms, as indicated in Table 2 of D'Haens et al. 1998 (hereby incorporated by reference). The following abnormalities are scored: epithelial damage, architectural changes, infiltration of mononuclear cells in the lamina propria, infiltration of polymorphonuclear cell in the lamina propria, polymorphonuclear cell in the epithelium, presence of erosion and/or ulcers, presence of granuloma, and number of biopsy specimens affected. Therefore a favorable treatment response as defined herein means that when comparing the grades prior and after treatment, the grades are on average lower after treatment, preferably each grade is individually lower or equal after treatment with the proviso that at least one grade is lower, indicating less severe symptoms. Equally a non-favorable treatment response as defined herein means that when comparing the grades prior and after treatment, the grades are on average equal or higher after treatment, for example each grade is individually equal or higher after treatment, indicating equal or more severe symptoms. - When used herein, subject refers to a human or non-human animal. Preferably the subject is suffering from, diagnosed with, suspected to have, undergoing treatment for or has been cured from an inflammatory bowel disease (IBD) such as Ulcerative Colitis (UC) or Crohn's Disease (CD), unless the subject is a healthy control subject. The subject may also be referred herein as patient.
- When used herein, the terms anti-TNFalpha compound or anti-TNFalpha therapy or anti-TNFalpha treatment are used interchangeably, and refer to a compound having an inhibitory effect on TNFalpha signaling, or it may refer to administration of said compound to a subject as defined herein, depending on the context. Compounds having an inhibitory effect on TNF-alpha signaling may exert their effect in the ligand (TNFalpha), e.g. by preventing the ligand to bind to its receptor. Alternatively the compounds may exert their effect directly on the receptor or downstream of the receptor by preventing the receptor or downstream signaling pathways to be activated. Compounds having an inhibitory effect on TNF-alpha signaling are known to the skilled person and may also be referred to as TNFalpha blockers or anti-TNFalpha drugs. Anti-TNFalpha compounds may for example be inhibitory antibodies, small molecule inhibitors or nucleotide based inhibitors such as RNAi, miRNA, however other inhibitors may be known to the person skilled in the art. Non limiting examples of anti-TNFalpha compounds are antibody based compounds such as Adalimumab, Certolizumab, Etanercept, Golimumab, Infliximab, or a biosimilars or chimeric products of any of the preceding compounds, such as for example the CT-P13 Infliximab biosimilar, or small molecule based compound such as thalidomide, lenalidomide, pomalidomide, a xanthane derivative such as pentoxifylline, bupropion, an 5-HT2A agonist such as (R)DOI, TCB2, LSD and LA-SS-Az; or a natural compound such as curcumin, catechins, cannabidiol or Echinacea purpurea.
- When used herein, "expression level" refers to quantifying the number of mRNA copies transcribed from a gene. Generally this number will not be an absolute value but a relative value, and therefore is preferably normalized for example in reference to the expression of one or more housekeeping genes. Housekeeping genes are genes which are assumed to have constant expression levels independent of cell type and/or functional status of the cell (i.e. from a diseased or healthy subject), and therefore can be used to normalize experimentally determined relative expression levels. Housekeeping genes are generally known to the skilled person, non-limiting examples of housekeeping genes that may be used for normalization are beta-actin, glyceraldehyde-3-phosphate dehydrogenase (GAPDH) and Transcription factor IID TATA binding protein (TBP).
- Therefore the phrase "expression level of a target gene" denotes a value that is representative of the amount, e.g. a concentration, of a target gene present in a sample. This value may be based on the amount of a transcription product of the target gene (e.g. mRNA) or a translation product thereof (e.g. protein). Preferably, the expression level is based on the amount of mRNA formed from the target gene. In order to determine the expression level, techniques such as qPCR, multiple qPCR, multiplexed qPCR, ddPCR, RNAseq, RNA expression array or mass spectrometry may be used. For example, a gene expression microarray, e.g. Affymetrix microarray, or RNA sequencing methods, like an Illumina sequencer, can be used.
- When used herein, the term "sample" also encompasses the case where e.g. a tissue of the subject have been taken from the subject and, e.g., have been put on a microscope slide, and where for performing the claimed method a portion of this sample is extracted, e.g., by means of Laser Capture Microdissection (LCM), or by scraping off the cells of interest from the slide, or by fluorescence-activated cell sorting techniques. Preferably the sample is obtained form or is a biopsy. The biopsy or sample may be obtained from a healthy subject (e.g. to serve as a reference sample) or from a subject suffering from IBD. Preferably the sample is a gastric, colon, intestinal or rectal sample, therefore in a preferred embodiment the biopsy used to provide the sample is a gastric, colon, intestinal or rectal biopsy.
- The terms "healthy subject" or "healthy reference subject" or "healthy control subject" are used interchangeably, and when used herein refer to a subject not having IBD.
- Alternatively, the predictions referred herein may be based on inferred cellular signaling pathway activity. Therefore in an alternative of the first aspect the invention relates to a method for predicting the treatment response of a subject suffering from inflammatory bowel disease (IBD) to treatment with an anti-TNFalpha compound based on inferred cellular signaling pathway activity or activities in a sample obtained from the subject, the method comprising:
- comparing the inferred cellular signaling pathway activity, or when multiple cellular signaling pathway activities are used the combined cellular signaling pathway activities, with a threshold value;
- wherein the cellular signaling pathway is one or more cellular signaling pathway selected from TGFbeta, NFkB, MAPK-AP1, STAT3 and WNT, preferably wherein the cellular signaling pathway is one or more cellular signaling pathway selected from TGFbeta and NFkB;
- wherein the cellular signaling pathway activity or activities are inferred by
- determining an activity level of a transcription factor (TF) element of the respective cellular signaling pathway in the sample obtained from the subject, the TF element controlling transcription of three or more target genes of the respective cellular signaling pathway, the determining being based on evaluating a calibrated mathematical pathway model relating the expression levels of the three or more target genes of the respective cellular signaling pathway to the activity level of the TF element of the cellular signaling pathway, and
- inferring the activity of the cellular signaling pathway in the subject based on the determined activity level of the TF element of the respective cellular signaling pathway in the sample of the subject;
- wherein the treatment response is predicted to be favorable when the inferred cellular signaling pathway activity or the combined cellular signaling pathway activities are below the threshold value, and wherein the treatment response is predicted to be unfavorable when the inferred cellular signaling pathway activity or the combined cellular signaling pathway activities are above the threshold value.
- In an embodiment the activity of the respective cellular signaling pathway being defined by the activity level of the respective TF elements. In an embodiment the calibrated mathematical pathway model being a model that is calibrated using a ground truth dataset including samples in which transcription of the three or more target genes is induced by the respective TF elements and samples in which transcription of the three or more target genes is not induced by the respective TF elements. The TF for the relevant cellular signaling pathways described herein are listed below.
- In an embodiment the IBD is ulcerative colitis (UC) or Crohn Disease (CD). In an embodiment the threshold value is independently determined in one or more reference samples. In an embodiment the three or more, e.g. three, four, five, six, seven, eight, nine, ten, eleven or twelve or more, target genes of the TGFbeta cellular signaling pathway are selected from ANGPTL4, CDC42EP3, CDKNIA, CDKN2B, CTGF, GADD45A, GADD45B, HMGA2, ID1, IL11, SERPINE1, INPP5D, JUNB, MMP2, MMP9, NKX2-5, OVOL1, PDGFB, PTHLH, SGK1, SKIL, SMAD4, SMAD5, SMAD6, SMAD7, SNAI1, SNAI2, TIMP1, and VEGFA, preferably, from the group consisting of: ANGPTL4, CDC42EP3, CDKNIA, CTGF, GADD45A, GADD45B, HMGA2, ID1, IL11, JUNB, PDGFB, PTHLH, SERPINE1, SGK1, SKIL, SMAD4, SMAD5, SMAD6, SMAD7, SNAI2, VEGFA, more preferably, from the group consisting of: ANGPTL4, CDC42EP3, CDKNIA, CTGF, GADD45B, ID1, IL11, JUNB, SERPINE1, PDGFB, SKIL, SMAD7, SNAI2, and VEGFA, more preferably, from the group consisting of: ANGPTL4, CDC42EP3, ID1, IL11, JUNB, SERPINE1, SKIL, and SMAD7; the three or more, e.g. three, four, five, six, seven, eight, nine, ten, eleven or twelve or more, target genes of the NFkB cellular signaling pathway are selected from BCL2L1, BIRC3, CCL2, CCL3, CCL4, CCL5, CCL20, CCL22, CX3CL1, CXCL1, CXCL2, CXCL3, ICAM1, IL1B, IL6, IL8, IRF1, MMP9, NFKB2, NFKBIA, NFKB IE, PTGS2, SELE, STAT5A, TNF, TNFAIP2, TNIP1, TRAF1, and VCAM1; the three or more, e.g. three, four, five, six, seven, eight, nine, ten, eleven or twelve or more, target genes of the MAPK-AP1 cellular signaling pathway are selected from BCL2L11, CCND1, DDIT3, DNMT1, EGFR, ENPP2, EZR, FASLG, FIGF, GLRX, IL2, IVL, LOR, MMP1, MMP3, MMP9, SERPINE1, PLAU, PLAUR, PTGS2, SNCG, TIMP1, TP53, and VIM, preferably, from the group consisting of: CCND1, EGFR, EZR, GLRX, MMP1, MMP3, PLAU, PLAUR, SERPINE1, SNCG, and TIMP1; the three or more, e.g. three, four, five, six, seven, eight, nine, ten, eleven or twelve or more, target genes of the STAT3 cellular signaling pathway are selected from AKT1, BCL2, BCL2L1, BIRC5, CCND1, CD274, CDKN1A, CRP, FGF2, FOS, FSCN1, FSCN2, FSCN3, HIF1A, HSP90AA1, HSP90AB1, HSP90B1, HSPA1A, HSPA1B, ICAM1, IFNG, IL10, JUNB, MCL1, MMP1, MMP3, MMP9, MUC1, MYC, NOS2, POU2F1, PTGS2, SAA1, STAT1, TIMP1, TNFRSF1B, TWIST1, VIM, and ZEB1, preferably, either from the group consisting of: BCL2L1, BIRC5, CCND1, CD274, FOS, HIF1A, HSP90AA1 , HSP90AB1 , MMP1 , and MYC, or from the group consisting of: BCL2L1, CD274, FOS, HSP90B1, HSPA1B, ICAM1, IFNG, JUNB, PTGS2, STAT1, TNFRSF1B, and ZEB1; the three or more, e.g. three, four, five, six, seven, eight, nine, ten, eleven or twelve or more, target genes of the WNT cellular signaling pathway are selected from KIAA1199, AXIN2, RNF43, TBX3, TDGF1, SOX9, ASCL2, IL8, SP5, ZNRF3, KLF6, CCND1, DEFA6 and FZD7, optionally further at least one target gene, e.g. one, two three, four, five six, seven, eight, nine, ten or more target gene(s), selected from the group comprising or consisting of: NKD1, OAT, FAT1, LEF1, GLUL, REG1B, TCF7L2, COL18A1, BMP7, SLC1A2, ADRA2C, PPARG, DKK1, HNF1A and LECT2. In an embodiment the sample obtained from the subject is a gastric, colon, intestinal or rectal sample.
- By using a calibrated mathematical model to relate the gene expression levels to a cellular signaling pathway activity, a numerical value can be assigned to the pathway activity. Depending on the model, this value can for example be normalize to result in a value from 0 to 100, where 0 is no pathway activity and 100 is theoretical maximum pathway activity. Alternatively the value may be normalized such that the average value is 0 and thus decreased pathway activity is represented by a negative value and increased pathway activity is represented by a positive value. It is understood that the values obtained using such model are dependent on the model used, and do not represent absolute values. Therefore, the same model should be used for calibrating, determining reference values and when used in the method of the invention, so that it allows comparison of the obtained numerical values for pathway activity.
- Therefore, the numerical value obtained for a pathway activity in a sample for a specific state (e.g. responder to treatment with an anti-TNF-alpha compound) may be compared to the numerical value obtained for that pathway activity in a reference sample (e.g. non-responder to treatment with an anti-TNF-alpha compound). By performing such comparison a statement can be made about the pathway activity in the sample (e.g. a sample from a biopsy from a subject with IBD) relative to the pathway activity determined in the reference sample (e.g. a sample from a biopsy). Based on the numerical value a statement can be made about the pathway activity in the sample with respect to the pathway activity in the reference sample, e.g. whether the pathway activity in the sample is higher or lower, in correspondence with the numerical value obtained for the pathway activity. E.g. cellular signaling pathway activity can be determined in a biopsy sample from a subject not responding to treatment with an anti-TNF-alpha compound. Since it is determined by the inventors that the TGFbeta, NFkB, MAPK-AP1, STAT3 and WNT cellular signaling pathway activities in non-responders to anti-TNF-alpha treatment are higher (in a sample from a biopsy obtained pre-treatment), these can bet set as a baseline numerical values representing an high pathway activities, i.e. the reference value. Similarly baseline numerical values can be set for low activities for these pathways representing the lower value obtained from samples form biopsies obtained from responders to anti-TNFalpha treatment. By determining the numerical value for one of the TGFbeta, NFkB, MAPK-AP1, STAT3 or WNT cellular signaling pathway activity in the sample from a biopsy of a subject with IBD, the numerical value representing that pathway activity can be compared with the reference values, and it can be determined whether the pathway activity is high or low, by comparing with the references based on the numerical values. The comparison may be made with multiple reference samples to allow for more accurate results and statistics to be performed.
- Alternatively a reference sample can be used to set a baseline pathway activity, allowing further comparison of the pathway activity. For example, the average and standard deviation can be calculated which can be used to calculate values for a healthy individual, and define a threshold for abnormal pathway activity. Alternatively a reference can be used with a known state (e.g. severe infection) and used in the comparison of the pathway activity/activities.
- Therefore, in a preferred embodiment the pathway activity is determined to be higher or lower when the obtained numerical value for the pathway activity differs with at least one standard deviation from the numerical value obtained for the pathway activity in the reference sample. When the value is within the range of one standard deviation it is said to be equal or comparable to the pathway activity in the reference sample. It is understood that the threshold may also be set higher, for example 2 times the standard deviation or even 3 times the standard deviation. It is further understood that the threshold may be determined using alternative ways, e.g. statistical methods, to determine a significant deviation from the reference value.
- It is understood that the reference value for a certain pathway activity in a sample in principle only needs to be determined once. Therefore, the step of determining a reference pathway activity is not part of the methods of the invention, as a predetermined reference pathway activity can be used.
- For the purpose of the invention determining the expression levels of the target genes based on the extracted RNA may be a part of the method, meaning the method includes the step of determining the expression levels of the target genes on RNA extracted from the sample obtained from the patient using methods known to the skilled person or described herein. The method may further include the step of obtaining a sample form the patient in order to extract the RNA. Alternatively the expression levels may have been determined separately and the demining step (of the expression levels of the target genes) is not an active step in the method of the invention. In such case the expression levels are provided as an input value, e.g. a relative expression level in reference to one or more control gene expression levels.
- Sets of cellular signaling pathway target genes whose expression levels are preferably analyzed have been identified, alternatively methods for identifying suitable target genes are described herein. For use to determine pathway activity, for example by a mathematical model, three or more, for example, three, four, five, six, seven, eight, nine, ten, eleven, twelve or more, target genes from each assessed cellular signaling pathway can be analyzed to determine pathway activities.
- In an embodiment the signaling pathway measurements are performed using qPCR, multiple qPCR, multiplexed qPCR, ddPCR, RNAseq, RNA expression array or mass spectrometry. For example, a gene expression microarray data, e.g. Affymetrix microarray, or RNA sequencing methods, like an Illumina sequencer, can be used.
- The terms "pathway", "signal transduction pathway", "signaling pathway" and "cellular signaling pathway" are used interchangeably herein.
- An "activity of a signaling pathway" may refer to the activity of a signaling pathway associated transcription factor (TF) element in the sample, the TF element controlling transcription of target genes, in driving the target genes to expression, i.e., the speed by which the target genes are transcribed, e.g. in terms of high activity (i.e. high speed) or low activity (i.e. low speed), or other dimensions, such as levels, values or the like related to such activity (e.g. speed). Accordingly, for the purposes of the present invention, the term "activity", as used herein, is also meant to refer to an activity level that may be obtained as an intermediate result during "pathway analysis" as described herein.
- The term "transcription factor element" (TF element), as used herein, preferably refers to an intermediate or precursor protein or protein complex of the active transcription factor, or an active transcription factor protein or protein complex which controls the specified target gene expression. For example, the protein complex may contain at least the intracellular domain of one of the respective signaling pathway proteins, with one or more co-factors, thereby controlling transcription of target genes. Preferably, the term refers to either a protein or protein complex transcriptional factor triggered by the cleavage of one of the respective signaling pathway proteins resulting in a intracellular domain.
- The term "target gene", as used herein, means a gene whose transcription is directly or indirectly controlled by a respective transcription factor element. The "target gene" may be a "direct target gene" and/or an "indirect target gene" (as described herein).
- Pathway analysis enables quantitative measurement of signal transduction pathway activity in cells, e.g. of a sample, based on inferring activity of a signal transduction pathway from measurements of mRNA levels of the well-validated direct target genes of the transcription factor associated with the respective signaling pathway (see for example W Verhaegh et al., 2014, supra; W Verhaegh, A van de Stolpe, Oncotarget, 2014, 5(14):5196).
- Preferably the determining of the activity or activities of the signaling pathway(s), the combination of multiple pathway activities and applications thereof is performed as described for example in the following documents, each of which is hereby incorporated in its entirety for the purposes of determining activity of the respective signaling pathway: published international patent applications
WO2013011479 (titled "ASSESSMENT OF CELLULAR SIGNALING PATHWAY ACTIVITY USING PROBABILISTIC MODELING OF TARGET GENE EXPRESSION"),WO2014102668 (titled "ASSESSMENT OF CELLULAR SIGNALING PATHWAY ACTIVITY USING LINEAR COMBINATION(S) OF TARGET GENE EXPRESSIONS"),WO2015101635 (titled "ASSESSMENT OF THE PI3K CELLULAR SIGNALING PATHWAY ACTIVITY USING MATHEMATICAL MODELLING OF TARGET GENE EXPRESSION"),WO2016062891 (titled "ASSESSMENT OF TGF-β CELLULAR SIGNALING PATHWAY ACTIVITY USING MATHEMATICAL MODELLING OF TARGET GENE EXPRESSION"),WO2017029215 (titled "ASSESSMENT OF NFKB CELLULAR SIGNALING PATHWAY ACTIVITY USING MATHEMATICAL MODELLING OF TARGET GENE EXPRESSION"),WO2014174003 (titled "MEDICAL PROGNOSIS AND PREDICTION OF TREATMENT RESPONSE USING MULTIPLE CELLULAR SIGNALLING PATHWAY ACTIVITIES"),WO2016062892 (titled "MEDICAL PROGNOSIS AND PREDICTION OF TREATMENT RESPONSE USING MULTIPLE CELLULAR SIGNALING PATHWAY ACTIVITIES"),WO2016062893 (titled "MEDICAL PROGNOSIS AND PREDICTION OF TREATMENT RESPONSE USING MULTIPLE CELLULAR SIGNALING PATHWAY ACTIVITIES"),WO2018096076 (titled "Method to distinguish tumor suppressive FOXO activity from oxidative stress"), and in the patent applicationsWO2018096076 (titled "Method to distinguish tumor suppressive FOXO activity from oxidative stress"),WO2019068585 (titled "Assessment of Notch cellular signaling pathway activity using mathematical modelling of target gene expression"),WO2019120658 (titled "Assessment of MAPK-MAPK-AP1 cellular signaling pathway activity using mathematical modelling of target gene expression"),WO2019068543 (titled "Assessment of JAK-JAK-STAT3 cellular signaling pathway activity using mathematical modelling of target gene expression"),WO2019068562 (titled "Assessment of JAK-STAT1/2 cellular signaling pathway activity using mathematical modelling of target gene expression"), andWO2019068623 (titled "Determining functional status of immune cells types and immune response"). - The models have been biologically validated for ER, AR, PI3K-FOXO, HH, Notch, TGF-β, Wnt, NFkB, JAK-STAT1/2, JAK-JAK-STAT3 and MAPK-MAPK-AP1 pathways on several cell types.
- Unique sets of cellular signaling pathway target genes whose expression levels are preferably analyzed have been identified. For use in the mathematical models, three or more, for example, three, four, five, six, seven, eight, nine, ten, eleven, twelve or more, target genes from each assessed cellular signaling pathway can be analyzed to determine pathway activities.
- Common to the pathway analysis methods for determining the activities of the different signaling pathways as disclosed herein is a concept, which is preferably applied herein for the purposes of the present invention, wherein the activity of a signaling pathway in a cell such as a cell present in a sample is determinable by receiving expression levels of one or more, preferably three or more, target genes of the signaling pathway, determining an activity level of a signaling pathway associated transcription factor (TF) element in the sample, the TF element controlling transcription of the three or more target genes, the determining being based on evaluating a calibrated mathematical pathway model relating expression levels of the one or more, preferably three or more target genes to the activity level of the signaling pathway, and optionally inferring the activity of the signaling pathway in the cell present in a sample based on the determined activity level of the signaling pathway associated TF element. As described herein, the activity level can be directly used as an input to determine the immune response in a subject and/or determine whether an infection is viral and/or determine the severity of a viral infection and/or determine the cellular immunity conferred by a vaccine, which is also contemplated by the present invention.
- The term "activity level" of a TF element, as used herein, denotes the level of activity of the TF element regarding transcription of its target genes.
- The calibrated mathematical pathway model may be a probabilistic model, preferably a Bayesian network model, based on conditional probabilities relating the activity level of the signaling pathway associated TF element and the expression levels of the three or more target genes, or the calibrated mathematical pathway model may be based on one or more linear combination(s) of the expression levels of the three or more target genes. For the purposes of the present invention, the calibrated mathematical pathway model is preferably a linear model, or a Bayesian network model based on conditional probabilities.
- In particular, the determination of the expression level and optionally the inferring of the activity of a signaling pathway in the subject may be performed, for example, by inter alia (i) evaluating a portion of a calibrated probabilistic pathway model, preferably a Bayesian network, representing the cellular signaling pathways for a set of inputs including the expression levels of the three or more target genes of the cellular signaling pathway measured in a sample of the subject, (ii) estimating an activity level in the subject of a signaling pathway associated transcription factor (TF) element, the signaling pathway associated TF element controlling transcription of the three or more target genes of the cellular signaling pathway, the estimating being based on conditional probabilities relating the activity level of the signaling pathway associated TF element and the expression levels of the three or more target genes of the cellular signaling pathway measured in the sample of the subject, and optionally (iii) inferring the activity of the cellular signaling pathway based on the estimated activity level of the signaling pathway associated TF element in the sample of the subject. This is described in detail in the published international patent application
WO 2013/011479 A2 ("Assessment of cellular signaling pathway activity using probabilistic modeling of target gene expression"), the contents of which are herewith incorporated in their entirety. - In an exemplary alternative, the determination of the expression level and optionally the inferring of the activity of a cellular signaling pathway in the subject may be performed by inter alia (i) determining an activity level of a signaling pathway associated transcription factor (TF) element in the sample of the subject, the signaling pathway associated TF element controlling transcription of the three or more target genes of the cellular signaling pathway, the determining being based on evaluating a calibrated mathematical pathway model relating expression levels of the three or more target genes of the cellular signaling pathway to the activity level of the signaling pathway associated TF element, the mathematical pathway model being based on one or more linear combination(s) of expression levels of the three or more target genes, and optionally (ii) inferring the activity of the cellular signaling pathway in the subject based on the determined activity level of the signaling pathway associated TF element in the sample of the subject. This is described in detail in the published international patent application
WO 2014/102668 A2 ("Assessment of cellular signaling pathway activity using linear combination(s) of target gene expressions"). - Further details regarding the inferring of cellular signaling pathway activity using mathematical modeling of target gene expression can be found in W Verhaegh et al., "Selection of personalized patient therapy through the use of knowledge-based computational models that identify tumor-driving signal transduction pathways", Cancer Research, Vol. 74, No. 11, 2014, pages 2936 to 2945.
- To facilitate rapid identification of references, the above-mentioned references have been assigned to each signaling pathway of interest here and exemplarily corresponding target genes suitable for determination of the signaling pathway's activity have been indicated.
- Particularly preferred is a method wherein the inferring comprises:
- inferring activity of a Wnt cellular signaling pathway in the sample based at least on expression levels of three or more, e.g. three, four five six seven, eight, nine, ten eleven, twelve or thirteen or more, target gene(s) of the Wnt pathway measured in the sample selected from the group comprising or consisting of: KIAA1199, AXIN2, RNF43, TBX3, TDGF1, SOX9, ASCL2, IL8, SP5, ZNRF3, KLF6, CCND1, DEFA6 and FZD7, optionally the inferring is further based on expression levels of at least one target gene, e.g. one, two three, four, five six, seven, eight, nine, ten or more target gene(s), of the Wnt pathway measured in the sample selected from the group comprising or consisting of: NKD1, OAT, FAT1, LEF1, GLUL, REG1B, TCF7L2, COL18A1, BMP7, SLC1A2, ADRA2C, PPARG, DKK1, HNF1A and LECT2;
- inferring activity of a AR cellular signaling pathway in the sample based at least on expression levels of three or more, e.g. three, four five six seven, eight, nine, ten eleven, twelve or thirteen, target gene(s) of the AR pathway measured in the sample selected from the group comprising or consisting of: KLK2, PMEPA1, TMPRSS2, NKX3_1, ABCC4, KLK3, FKBP5, ELL2, UGT2B15, DHCR24, PPAP2A, NDRG1, LRIG1, CREB3L4, LCP1, GUCY1A3, AR and EAF2, optionally the inferring is further based on expression levels of at least one target gene, e.g. one, two, three, four, five, six, seven, eight, nine, ten eleven twelve or more target gene(s), of the AR pathway measured in the sample selected from the group comprising or consisting of: APP, NTS, PLAU, CDKN1A, DRG1, FGF8, IGF1, PRKACB, PTPN1, SGK1 and TACC2;
- inferring activity of a TGFbeta cellular signaling pathway in the sample based at least on expression levels of three or more, e.g. three, four five six seven, eight, nine, ten eleven, twelve or thirteen, target gene(s) of the TGFbeta pathway measured in the sample selected from the group comprising or consisting of: ANGPTL4, CDC42EP3, CDKNIA, CDKN2B, CTGF, GADD45A, GADD45B, HMGA2, ID1, IL11, SERPINE1, INPP5D, JUNB, MMP2, MMP9, NKX2-5, OVOL1, PDGFB, PTHLH, SGK1, SKIL, SMAD4, SMAD5, SMAD6, SMAD7, SNAI1, SNAI2, TIMP1, and VEGFA, preferably, from the group consisting of: ANGPTL4, CDC42EP3, CDKNIA, CTGF, GADD45A, GADD45B, HMGA2, ID1, IL11, JUNB, PDGFB, PTHLH, SERPINE1, SGK1, SKIL, SMAD4, SMAD5, SMAD6, SMAD7, SNAI2, VEGFA, more preferably, from the group consisting of: ANGPTL4, CDC42EP3, CDKNIA, CTGF, GADD45B, ID1, IL11, JUNB, SERPINE1, PDGFB, SKIL, SMAD7, SNAI2, and VEGFA, more preferably, from the group consisting of: ANGPTL4, CDC42EP3, ID1, IL11, JUNB, SERPINE1, SKIL, and SMAD7;
- inferring activity of a NFkB cellular signaling pathway in the sample based at least on expression levels of three or more, e.g. three, four five six seven, eight, nine, ten eleven, twelve or thirteen, target gene(s) of the NFkB pathway measured in the sample selected from the group comprising or consisting of: BCL2L1, BIRC3, CCL2, CCL3, CCL4, CCL5, CCL20, CCL22, CX3CL1, CXCL1, CXCL2, CXCL3, ICAM1, IL1B, IL6, IL8, IRF1, MMP9, NFKB2, NFKBIA, NFKB IE, PTGS2, SELE, STAT5A, TNF, TNFAIP2, TNIP1, TRAF1, and VCAM1;
- inferring activity of a JAK-STAT1/2 cellular signaling pathway in the sample based at least on expression levels of three or more, e.g. three, four five six seven, eight, nine, ten eleven, twelve or thirteen, target gene(s) of the JAK-STAT1/2 pathway measured in the sample selected from the group comprising or consisting of: BID, GNAZ, IRF1, IRF7, IRF8, IRF9, LGALS1, NCF4, NFAM1, OAS1, PDCD1, RAB36, RBX1, RFPL3, SAMM50, SMARCB1, SSTR3, ST13, STAT1, TRMT1, UFDIL, USP18, and ZNRF3, preferably, from the group consisting of: IRF1, IRF7, IRF8, IRF9, OAS1, PDCD1, ST13, STAT1, and USP18.
- inferring activity of a JAK-STAT3 cellular signaling pathway in the sample based at least on expression levels of three or more, e.g. three, four five six seven, eight, nine, ten eleven, twelve or thirteen, target gene(s) of the JAK-STAT3 pathway measured in the sample selected from the group comprising or consisting of: AKT1, BCL2, BCL2L1, BIRC5, CCND1, CD274, CDKN1A, CRP, FGF2, FOS, FSCN1, FSCN2, FSCN3, HIF1A, HSP90AA1, HSP90AB1, HSP90B1, HSPA1A, HSPA1B, ICAM1, IFNG, IL10, JUNB, MCL1, MMP1, MMP3, MMP9, MUC1, MYC, NOS2, POU2F1, PTGS2, SAA1, STAT1, TIMP1, TNFRSF1B, TWIST1, VIM, and ZEB1, preferably, either from the group consisting of: BCL2L1, BIRC5, CCND1, CD274, FOS, HIF1A, HSP90AA1 , HSP90AB1 , MMP1 , and MYC, or from the group consisting of: BCL2L1, CD274, FOS, HSP90B1, HSPA1B, ICAM1, IFNG, JUNB, PTGS2, STAT1, TNFRSF1B, and ZEB1;
- inferring activity of a MAPK-AP1 cellular signaling pathway in the sample based at least on expression levels of three or more, e.g. three, four five six seven, eight, nine, ten eleven, twelve or thirteen, target gene(s) of the MAPK-AP1 pathway measured in the sample selected from the group comprising or consisting of: BCL2L11, CCND1, DDIT3, DNMT1, EGFR, ENPP2, EZR, FASLG, FIGF, GLRX, IL2, IVL, LOR, MMP1, MMP3, MMP9, SERPINE1, PLAU, PLAUR, PTGS2, SNCG, TIMP1, TP53, and VIM, preferably, from the group consisting of: CCND1, EGFR, EZR, GLRX, MMP1, MMP3, PLAU, PLAUR, SERPINE1, SNCG, and TIMP1;
- Herein, a Wnt transcription factor (TF) element is defined to be a protein complex containing at least one of the TCF/LEF TF family members, i.e., TCF1, TCF3, TCF4 or LEF1, preferably wherein the Wnt TF element comprises beta-catenin/TCF4, which is capable of binding to specific DNA sequences, thereby controlling transcription of target genes.
- Herein, an AR transcription factor (TF) element is defined to be a protein complex containing at least one or preferably a dimer of nuclear Androgen receptor.
- Herein, the term "TGFbeta transcription factor element" or "TGFbeta TF element" or "TF element" when referring to the TGFbeta pathway is defined to be a protein complex containing at least one or, preferably, a dimer of the TGFbeta members (SMAD1 , SMAD2, SMAD3 , SMAD5 and SMAD8 with SMAD4) or a trimer (two proteins from SMAD1, SMAD2, SMAD3, SMAD5 and SMAD8 with SMAD4), which is capable of binding to specific DNA sequences, thereby controlling transcription of target genes. Preferably, the term refers to either a protein or protein complex transcriptional factor triggered by the binding of TGFbeta to its receptor or an intermediate downstream signaling agent between the binding of TGFbeta to its receptor and the final transcriptional factor protein or protein complex. For example, it is known that TGFbeta binds to an extracellular TGFbeta receptor that initiates an intracellular "SMAD" signaling pathway and that one or more SMAD proteins (receptor-regulated or R-SMADs (SMAD1, SMAD2,
SMAD 3, SMAD5 and SMAD8) and SMAD4) participate in, and may form a hetero-complex which participates in, the TGFbeta transcription signaling cascade which controls expression. - Herein, an NFkB transcription factor (TF) element is defined to be a protein complex containing at least one or, preferably, a dimer of the NFkB members (
NFKB 1 or p50/p105, NFKB2 or p52/p100, RELA or p65, REL, and RELB), which is capable of binding to specific DNA sequences, thereby controlling transcription of target genes. - Herein, the term "JAK-STAT1/2 transcription factor element" or "JAK-STAT1/2 TF element" or "TF element" when referring to the JAK-STAT1/2 is defined to be a protein complex containing at least a STAT1-STAT2 heterodimer or a STAT1 homodimer, which is capable of binding to specific DNA sequences, preferably the ISRE (binding motif AGTTTC NTTCNC/T) or GAS (binding motif TTC/A NNG/TAA) response elements, respectively, thereby controlling transcription of target genes. Preferably, the term refers to either a protein or protein complex transcriptional factor that is formed by different stimuli such as IFNs triggered by the binding of the stimulating ligand to its receptor resulting in downstream signaling.
- Herein, the term "JAK-STAT3 transcription factor element" or "JAK-STAT3 TF element" or "TF element" when referring to the JAK-STAT3 pathway is defined to be a protein complex containing at least a STAT3 homodimer, which is capable of binding to specific DNA sequences, preferably the response elements with binding motif CTGGGAA, thereby controlling transcription of target genes. Preferably, the term refers to either a protein or protein complex transcriptional factor triggered by the binding of STAT3 inducing ligands such as interleukin-6 (IL-6) and IL-6 family cytokines to its receptor or an intermediate downstream signaling agent between the binding the ligand to its receptor and the final transcriptional factor protein or protein complex.
- Herein, the term "AP-1 transcription factor element" or "AP-1 TF element" or "TF element" when referring to the MAPK-AP1 pathway is defined to be a protein complex containing at least a member of the Jun (e.g. c-Jun, JunB and JunD) family and/or a member of the Fos (e.g. c-Fos, FosB, Fra-1 and Fra-2) family and/or a member of the ATF family and/or a member of the JDP family, forming e.g. Jun∼Jun or Jun∼Fos dimers, capable of binding to specific DNA sequences, preferably the response elements 12-0-Tetradecanoylphorbol-13-acetate (TPA) response element (TRE) with binding motif 5'-TGA G/C TCA-3' or cyclic AMP response element (CRE) with binding motif 5'-TGACGTCA-3', thereby controlling transcription of target genes. Preferably, the term refers to either a protein or protein complex transcriptional factor triggered by the binding of AP-1 inducing ligands, such as growth factors (e.g., EGF) and cytokines, to its receptor or an intermediate downstream signaling agent, or triggered by the presence of an AP-1 -activating mutation.
- In an embodiment, the three or more, e.g. three, four, five, six seven, eight, nine, ten, eleven or twelve or more, expression levels are combined by adding up their relative expression levels, with the proviso that the expression levels of the genes CDKN2B, HMGA2, OVOL1, SMAD4, BCL2L11, HNF1A or TCF7L2 are multiplied with a weight factor of -1. Preferably wherein the combined expression levels are compared to a threshold value to determine whether the treatment response is favorable or not favorable, wherein the treatment response is predicted to be favorable when the combined three or more expression levels are below the threshold value, and wherein the treatment response is predicted to be unfavorable when the combined three or more expression levels are above the threshold value.
- When used herein, relative expression level refers to the quantitative value obtained for the expression level of the gene which has been normalized, e.g. by using a housekeeping gene or genes, to correct for sample variation.
- A threshold value for the combined expression levels can be set from reference samples with a known status, meaning reference samples obtained from IBD patient pre-treatment from which it is known whether they are responders or non-responders. Since the combined expression values represents a set of numerical values, an average can be calculated for a specific set of genes (i.e. three or more genes selected form the list identified above) and for a specific status (i.e. responder or non-responder). Based on these values a threshold can be set. For example the threshold can be set as the median between responders and non-responders, or can be set such that a predetermined percentage of responders or non-responders fall above or below the set value. Such methods are known to the skilled artisan. Setting such threshold value for a specific set of genes allows for easy comparison of the value obtained a sample form a subject suffering from IBD, and quickly diagnosing whether the subject would benefit from anti-TNF-alpha treatment. It is particularly preferred to combine the three or more expression levels by adding up the logarithmic values of their relative expression levels, preferably the log2 values.
- In an embodiment the IBD is Ulcerative Colitis (UC) or Crohn Disease (CD). As can be derived particularly from
figs. 5 to 20 , the target genes selected from the TGFbeta, NFkB, MAPK-AP1, STAT3 and WNT cellular signaling pathways are predictive for both subjects suffering from UC and CD. - For patients for whom no pre-treatment sample or biopsy is available to predict the treatment response and who are currently undergoing treatment with an anti-TNF-alpha compound, it may be desirable to determine the effectiveness of the treatment. Alternatively, if a treatment prediction was made and this was followed up with treatment with an anti-TNFalpha compound in the subject, it may still be desirable to follow up this treatment to see if it is effective or not and thus whether treatment should be continued. Therefore, in a second aspect, the invention relates to a method for determining the effectiveness of a treatment of a subject suffering from IBD with an anti-TNFalpha compound based on the expression levels of two or more genes,
wherein if the IBD is UC, the two or more, e.g. two, three, four, five, six, seven, eight, nine, ten, eleven, twelve or more, genes are selected from the group consisting of BCL2L11, CDKN1A, DNMT1, EAF2, ELL2, ENPP2, FKBP5, GLRX, LCP1, MMP1, MMP3, MMP9, PLAU, PLAUR, PMEPA1, PRKACB, PTGS2, SERPINE1, SGK1, TIMP1, TMPRSS2 and VIM; or
wherein the IBD is CD, the two or more, e.g. two, three, four, five, six, seven, eight, nine, ten, eleven, twelve or more, genes are selected from the group consisting of BCL2L1, BCL2L11, BIRC3, CCL2, CCL22, CCL3, CCL4, CCL5, CX3CL1, CXCL1, CXCL2, CXCL3, DNMT1, ENPP2, GLRX, ICAM1, IL1B, IL6, IL8, IRF1, MMP1, MMP3, MMP9, NFKB2, NFKBIA, NFKBIE, PLAU, PLAUR, PTGS2, SELE, SERPINE1, STAT5A, TIMP1, TNF, TNFAIP2, TRAF1, VCAM1 and VIM;
wherein the three or more expression levels are used to determine whether the treatment of IBD in the patient with an anti-TNFalpha compound is effective or not effective,
wherein a decreased expression level of BCL2L11 or PRKACB or an increased expression level of any of the other genes corresponds to a not effective treatment, and
wherein an increased expression level of BCL2L11 or PRKACB or a decreased expression level of any of the other genes corresponds to an effective treatment. - As can be derived from
figs. 5 to 20 , the AR and MAPK-AP1 (for UC) or MAPK-AP1 and NFkB (for CD) cellular signaling pathway activities in post treatment patient samples undergoing treatment with an anti-TNFalpha compound are indicative if a subject is responding well to treatment with an anti-TNFalpha compound even when no pre-treatment information is available. Therefore the curated lists for these pathways can be used to predict treatment effectiveness. The listed target genes have been selected in the same manner as for treatment response, based on pathways with significant different pathway activity between states (effective treatment vs non-effective treatment), where the pathway genes are curated based on the genes contributing most to the pathway score. For treatment effectiveness predictions, different pathways were found to be significant when comparing UC and CD patients, so distinct target genes groups are selected depending on the exact diagnosis of the IBD (being UC or CD). - When used herein, treatment effectiveness refers to whether a subject having IBD responds favorably to treatment with an anti-TNFalpha compound as determined after onset of the treatment. Favorably can be defined herein as an improvement in the overall grade using the grading systems for UC and CD referred above.
- In a preferred embodiment wherein if the IBD is UC and the two or more genes are selected from the group consisting of EAF2, ELL2, FKBP5, GLRX, LCP1, MMP1, MMP3, MMP9, PLAU, PLAUR, PMEPA1, PTGS2, SERPINE1, TIMP1, TMPRSS2 and VIM.
- In a preferred embodiment wherein if the IBD is CD and the two or more genes are selected from the group consisting of BCL2L1, BIRC3, CCL2, CCL22, CCL3, CCL4, CCL5, CX3CL1, CXCL1, CXCL2, CXCL3, GLRX, ICAM1, IL1B, IL6, IL8, IRF1, MMP1, MMP3, MMP9, NFKB2, NFKBIA, NFKBIE, PLAU, PLAUR, PTGS2, SELE, SERPINE1, STAT5A, TIMP1, TNF, TNFAIP2, TRAF1, VCAM1 and VIM.
- In an embodiment the two or more expression levels are combined by adding up their relative expression levels, with the proviso that the expression levels of the genes BCL2L11 or PRKACB are multiplied with a weight factor of -1,
preferably wherein the combined expression levels are compared to a threshold value to determine whether the treatment is effective or not effective, wherein the treatment is predicted to be effective when the combined two or more expression levels are below the threshold value, and wherein the treatment is predicted not to be effective when the combined two or more expression levels are above the threshold value. - Alternatively, the method of the second aspect of the invention relates to a method for determining the effectiveness of a treatment of a subject suffering from IBD with an anti-TNFalpha compound based on the expression levels of two or more genes, wherein the expression levels of the three or more genes are selected from one or more groups,
wherein if the IBD is UC, the genes are selected fromgroup 3 orgroup 6,
wherein if the IBD is CD, the genes are selected fromgroup 2 orgroup 3,
whereingroup 2 consist of the genes: BCL2L1, BIRC3, CCL2, CCL22, CCL3, CCL4, CCL5, CX3CL1, CXCL1, CXCL2, CXCL3, ICAM1, IL1B, IL6, IL8, IRF1, MMP9, NFKB2, NFKBIA, NFKBIE, PTGS2, SELE, STAT5A, TNF, TNFAIP2, TRAF1, VCAM1;
whereingroup 3 consist of the genes: BCL2L11, DNMT1, ENPP2, GLRX, MMP1, MMP3, MMP9, PLAU, PLAUR, PTGS2, SERPINE1, TIMP1, VIM;
whereingroup 6 consist of the genes: CDKN1A, EAF2, ELL2, FKBP5, LCP1, PLAU, PMEPA1, PRKACB, SGK1, TMPRSS2,
wherein the two or more expression levels are used to determine whether the treatment of IBD in the patient with an anti-TNFalpha compound is effective or not effective,
wherein a decreased expression level of BCL2L11 or PRKACB or an increased expression level of any of the other genes corresponds to a not effective treatment, and
wherein an increased expression level of BCL2L11 or PRKACB or a decreased expression level of any of the other genes corresponds to an effective treatment. Preferablygroup 2 consist of the genes: BCL2L1, BIRC3, CCL2, CCL22, CCL3, CCL4, CCL5, CX3CL1, CXCL1, CXCL2, CXCL3, ICAM1, IL1B, IL6, IL8, IRF1, MMP9, NFKB2, NFKBIA, NFKBIE, PTGS2, SELE, STAT5A, TNF, TNFAIP2, TRAF1, VCAM1. Preferablygroup 3 consist of the genes: GLRX, MMP1, MMP3, MMP9, PLAU, PLAUR, PTGS2, SERPINE1, TIMP1, VIM. Preferablygroup 6 consist of the genes: EAF2, ELL2, FKBP5, LCP1, PLAU, PMEPA1, TMPRSS2. - The conditions for selecting target genes (T value) and number of genes (N values) were further varied to evaluate the conditions that allow for accurate prediction of treatment or treatment effectiveness. These results are set out in Table 15 below. For each condition resulting in 90% or more of the 1000 random selections of N genes having a significant differentiation between responders and non-responders, the representative gene set are listed below in LIST A. Therefore, in an embodiment, the invention relates to a method for determining the effectiveness of a treatment of a subject suffering from IBD with an anti-TNFalpha compound based on the expression levels of N or more, for example one, two, three, four, five, six, seven eight, nine, ten, eleven or twelve or more, genes selected from a group as listed in LIST A below wherein the application is listed as effectiveness and N is indicated in LIST A for the respective set, and
wherein if the IBD is UC, the N or more, e.g. one, two, three, four, five, six, seven, eight, nine, ten, eleven, twelve or more, genes are selected from the group indicated is UC; or
wherein the IBD is CD, the N or more, e.g. one, two, three, four, five, six, seven, eight, nine, ten, eleven, twelve or more, genes are selected from the indicated is CD; and
wherein the N or more expression levels are used to determine whether the treatment of IBD in the patient with an anti-TNFalpha compound is effective or not effective,
wherein a decreased expression level of BCL2L11 or PRKACB or an increased expression level of any of the other genes corresponds to a not effective treatment, and
wherein an increased expression level of BCL2L11 or PRKACB or a decreased expression level of any of the other genes corresponds to an effective treatment. - Alternatively, the method of the second aspect of the invention relates to a method for determining the effectiveness of a treatment of a subject suffering from IBD with an anti-TNFalpha compound based on inferred cellular signaling pathway activity or activities in a sample obtained from the subject, the method comprising:
- comparing the inferred cellular signaling pathway activity, or when multiple cellular signaling pathway activities are used the combined cellular signaling pathway activities, with a threshold value;
- wherein if the IBD is UC, the cellular signaling pathway is AR and/or MAPK-AP1,
- wherein if the IBD is CD, the cellular signaling pathway is MAPK-AP1 and/or NFkB,
- wherein the cellular signaling pathway activity or activities are inferred by
- determining an activity level of a transcription factor (TF) element of the respective cellular signaling pathway in the sample obtained from the subject, the TF element controlling transcription of three or more target genes of the respective cellular signaling pathway, the determining being based on evaluating a calibrated mathematical pathway model relating the expression levels of the three or more target genes of the respective cellular signaling pathway to the activity level of the TF element of the cellular signaling pathway, and
- inferring the activity of the cellular signaling pathway in the subject based on the determined activity level of the TF element of the respective cellular signaling pathway in the sample of the subject;
- wherein the treatment is considered to be successful when the inferred cellular signaling pathway activity or the combined cellular signaling pathway activities are below the threshold value, and wherein the treatment is considered to be unsuccessful when the inferred cellular signaling pathway activity or the combined cellular signaling pathway activities are above the threshold value. In an embodiment, the threshold value is independently determined in one or more reference samples. In an embodiment the three or more, e.g. three, four, five, six, seven, eight, nine, ten, eleven or twelve or more, target genes of the AR cellular signaling pathway are selected from KLK2, PMEPA1, TMPRSS2, NKX3-1, ABCC4, KLK3, FKBP5, ELL2, UGT2B15, DHCR24, PPAP2A, NDRG1, LRIG1, CREB3L4, LCP1, GUCYIA3, AR and EAF2, optionally further at least one target gene, e.g. one, two, three, four, five, six, seven, eight, nine, ten eleven twelve or more target gene(s) selected from the group comprising or consisting of: APP, NTS, PLAU, CDKN1A, DRG1, FGF8, IGF1, PRKACB, PTPN1, SGK1 and TACC2; the three or more, e.g. three, four, five, six, seven, eight, nine, ten, eleven or twelve or more, target genes of the MAPK-AP1 cellular signaling pathway are selected from BCL2L11, CCND1, DDIT3, DNMT1, EGFR, ENPP2, EZR, FASLG, FIGF, GLRX, IL2, IVL, LOR, MMP1, MMP3, MMP9, SERPINE1, PLAU, PLAUR, PTGS2, SNCG, TIMP1, TP53, and VIM, preferably, from the group consisting of: CCND1, EGFR, EZR, GLRX, MMP1, MMP3, PLAU, PLAUR, SERPINE1, SNCG, and TIMP1; the three or more, e.g. three, four, five, six, seven, eight, nine, ten, eleven or twelve or more, target genes of the NFkB cellular signaling pathway are selected from BCL2L1, BIRC3, CCL2, CCL3, CCL4, CCL5, CCL20, CCL22, CX3CL1, CXCL1, CXCL2, CXCL3, ICAM1, IL1B, IL6, IL8, IRF1, MMP9, NFKB2, NFKBIA, NFKB IE, PTGS2, SELE, STAT5A, TNF, TNFAIP2, TNIP1, TRAF1, and VCAM1.
- In an embodiment the method according the first or the second aspect of the invention, the sample obtained from the subject is a gastric, colon, intestinal or rectal sample. The sample may for example be a gastric, colon, intestinal or rectal biopsy.
- In an embodiment according the first or the second aspect of the invention, the method further includes determining the expression levels of the target genes based on mRNA extracted from the sample obtained from the subject, preferably wherein the method further includes extracting the mRNA from the sample obtained from the subject.
- In an embodiment the method according the first or the second aspect of the invention, the threshold value is independently determined in from one or more reference samples.
- It is further envisioned that the method according to the first aspect of the invention can be used in successful stratification of IBD patients (both UC and CD), to predict response to treatment with an anti-TNFalpha compound. Therefore treatment with an anti-TNFalpha compound in an IBD patient is preferably combined with the method as described herein, and the anti-TNFalpha compound is only administered when it is established that the treatment prediction is favorable.
- Therefore, in a third aspect the invention relates to an anti-TNFalpha compound for use of in the treatment of IBD in a subject, wherein the use comprises: performing the method as defined in the first or the second aspect of the invention to determine the treatment response of the subject to anti-TNFalpha treatment, and administering the anti-TNFalpha compound of the treatment response to anti-TNFalpha treatment is found to be favorable for the subject. Alternatively, in a third aspect the invention relates to a method of treatment of a subject having IBD by administering an anti-TNFalpha compound, the method comprising performing the method as defined in the first or the second aspect of the invention to determine the treatment response of the subject to anti-TNFalpha treatment, and administering the anti-TNFalpha compound of the treatment response to anti-TNFalpha treatment is found to be favorable for the subject.
- In an embodiment the IBD is UC or CD.
- In an embodiment the anti-TNFalpha compound is selected from the group consisting of antibody based compounds such as Adalimumab, Certolizumab, Etanercept, Golimumab, Infliximab, or a biosimilars or chimeric products of any of the preceding compounds, such as for example the CT-P13 Infliximab biosimilar, or small molecule based compound such as thalidomide, lenalidomide, pomalidomide, a xanthane derivative such as pentoxifylline, bupropion, an 5-HT2A agonist such as (R)DOI, TCB2, LSD and LA-SS-Az; or a natural compound such as curcumin, catechins, cannabidiol or Echinacea purpurea. An anti TNFalpha compound may be an antibody, a small molecule or a short nucleotide type inhibitor. Other TNFalpha inhibiting compounds may be known to the skilled person, therefore the above list should not be construed as limiting the invention. An antiTNFalpha compound may also be a short nucleotide such as an RNAi, miRNA, siRNA or short nucleotide analogue such as 2'-O-methyl-substituted RNA, locked nucleic acid (LNA) or bridged nucleic acid (BNA), morpholino, or peptide nucleic acid (PNA), targeting a component of the TNFalpha signaling pathway.
- In a fourth aspect the invention relates to a kit of parts comprising primers and probes for the detection of the expression levels of three or more target genes, wherein the expression levels of the three or more genes are selected from:
- the group consisting of ANGPTL4, BCL2L1, BCL2L11, BIRC3, CCL2, CCL22, CCL3, CCL4, CCL5, CCND1, CD274, CD44, CDKN2B, COL18A1, CTGF, CX3CL1, CXCL1, CXCL2, CXCL3, DKK1, DNMT1, ENPP2, FGF2, FOS, FSCN1, GADD45B, GLRX, HIF1A, HMGA2, HNF1A, HSP90AB1, HSP90B1, ICAM1, IFNG, IL11, IL10, IL1B, IL6, IL8, IRF1, INPP5D, JUNB, KIAA1199, LEF1, MCL1, MMP1, MMP2, MMP3, MMP9, MYC, NFKB2, NFKBIA, NFKBIE, NOS2, OVOL1, PDGFB, PLAU, PLAUR, PTGS2, PTHLH, SAA1, SELE, SERPINE1, SKIL, SMAD4, SNAI2, STAT1, STAT5A, TBX3, TCF7L2, TIMP1, TNF, TNFAIP2, TNFRSF1B, TRAF1, TWIST1, VCAM1, VEGFA, VIM, and ZEB1; or
- the group consisting of BCL2L11, CDKN1A, DNMT1, EAF2, ELL2, ENPP2, FKBP5, GLRX, LCP1, MMP1, MMP3, MMP9, PLAU, PLAUR, PMEPA1, PRKACB, PTGS2, SERPINE1, SGK1, TIMP1, TMPRSS2 and VIM; or
- the group consisting of BCL2L1, BCL2L11, BIRC3, CCL2, CCL22, CCL3, CCL4, CCL5, CX3CL1, CXCL1, CXCL2, CXCL3, DNMT1, ENPP2, GLRX, ICAM1, IL1B, IL6, IL8, IRF1, MMP1, MMP3, MMP9, NFKB2, NFKBIA, NFKBIE, PLAU, PLAUR, PTGS2, SELE, SERPINE1, STAT5A, TIMP1, TNF, TNFAIP2, TRAF1, VCAM1 and VIM.
- Such kit may be advantageously used in the methods and uses described herein. Therefore, in a fifth aspect the invention relates to a use of the kit according to the fourth aspect in the method of the first or the second or the third aspect of the invention. Methods for designing primers and probes for the quantitative detection of expression levels are well known in the art. For example qPCR can be used. The genes named here are listed under their default name. Their sequences can be retrieved from a public database such NCBI genes or genome browsers such as Ensembl or the UCSC genome browser. The kit may additionally comprise buffers and/or enzymes and/or other reagents which can be used in the detection, such as dNTP, MgCl2 solution, Reverse Transcriptase and/or polymerase.
- In the claims, the word "comprising" does not exclude other elements or steps, and the indefinite article "a" or "an" does not exclude a plurality. The mere fact that certain measures are recited in mutually different dependent claims does not indicate that a combination of these measured cannot be used to advantage. Any reference signs in the claims should not be construed as limiting the scope thereof.
- General: In all the figures where signal transduction pathway analysis scores are depicted, these are given as log2odds scores for pathway activity, derived from the probability scores for pathway activity provided by the Bayesian pathway model analysis. Log2odds scores indicate the level of activity of a signaling pathway on a linear scale.
- Analyzed public datasets are indicated with their GSE number (in the figure legend of each figure).
- All validation samples for a signaling pathway model or an immune response/system model are independent samples and have not been used for calibration of the respective model to be validated.
-
Figs. 1 to 4 . Pathway activity scores of dataset GSE12251 including UC patients with responded (yes) or not responded (no) to anti TNFalpha treatment. Pathway activity score on Y-axis in log2odds. Two sided Mann-Whitney-Wilcoxon statistical tests were performed; p-values are indicated in the figures. P-values indicate: *p<0.05; **p<0.01; ***p<0.001. Depicted are cellular signaling pathway activity scores using a model based on the full gene set (standard) or using a random selection of three genes (3 gene a model; 3 gene b model).Fig. 1 shows pathway scores for the MAPK-AP1 and AR pathways.Fig. 2 shows pathway scores for the NFkB and STAT1/2 INF I pathways.Fig. 3 shows pathway scores for the STAT1/2 INF II and STAT3 pathways.Fig. 4 shows pathway scores for the TGFbeta and WNT pathways. -
Figs. 5 to 12 . Pathway analysis of dataset GSE16879 containing mucosal biopsies were obtained at endoscopy in actively inflamed mucosa from IBD patients (UC) before and 4-6 weeks after their first infliximab infusion (TNF-alpha blocker) and in normal mucosa from control patients. Pathway activity score on Y-axis in log2odds. Two sided Mann-Whitney-Wilcoxon statistical tests were performed; p-values are indicated in the figures. P-values indicate: *p<0.05; **p<0.01; ***p<0.001. Depicted are cellular signaling pathway activity scores using a model based on the full gene set (standard) or using a random selection of three genes (3 gene a model; 3 gene b model).Fig. 5 shows pathway scores for the AR pathway.Fig. 6 shows pathway scores for the MAPK-AP1 pathway.Fig. 7 shows pathway scores for the NFkB pathway.Fig. 8 shows pathway scores for the STAT1/2 INF I pathway.Fig. 9 shows pathway scores for the STAT1/2 INF II pathway.Fig. 10 shows pathway scores for the STAT3 pathway.Fig. 11 shows pathway scores for the TGFbeta pathway.Fig. 12 shows pathway scores for the WNT pathway. -
Figs. 13 to 20 . Pathway analysis of dataset GSE16879 including actively inflamed mucosa from CD patients, before and 4-6 weeks after their first anti-TNFalpha treatment and in normal mucosa from control patients. Most important pathways include for response prediction; AP1, TGFBeta, WNT, NFkB, STAT3, for treatment effectiveness the NFKB and API. P-values and legends are included in the figure. Pathway activity score on Y-axis in log2odds. Two sided Mann-Whitney-Wilcoxon statistical tests were performed; p-values are indicated in the figures. P-values indicate: *p<0.05; **p<0.01; ***p<0.001. Depicted are cellular signaling pathway activity scores using a model based on the full gene set (standard) or using a random selection of three genes (3 gene a model; 3 gene b model).Fig. 13 shows pathway scores for the AR pathway.Fig. 14 shows pathway scores for the MAPK-AP1 pathway.Fig. 15 shows pathway scores for the NFkB pathway.Fig. 16 shows pathway scores for the STAT1/2 INF I pathway.Fig. 17 shows pathway scores for the STAT1/2 INF II pathway.Fig. 18 shows pathway scores for the STAT3 pathway.Fig. 19 shows pathway scores for the TGFbeta pathway.Fig. 20 shows pathway scores for the WNT pathway. -
Figs. 21 to 29 . Pathway analysis of dataset GSE23597 containing mucosal biopsy samples from UC patients before treatment with placebo, 5 or 10 mg/kg infliximab, and at 8 and 30 weeks after treatment. Pathway activity score on Y-axis in log2odds. Two sided Mann-Whitney-Wilcoxon statistical tests were performed; p-values are indicated in the figures. P-values indicate: *p<0.05; **p<0.01; ***p<0.001. Depicted are cellular signaling pathway activity scores using a model based on the full gene set (standard) or using a random selection of three genes (3 gene a model; 3 gene b model).Fig. 21 shows the figure legend forFig. 22 to 29 .Fig. 22 shows pathway scores for the AR pathway.Fig. 23 shows pathway scores for the MAPK-AP1 pathway.Fig. 24 shows pathway scores for the NFkB pathway.Fig. 25 shows pathway scores for the STAT1/2 INF I pathway.Fig. 26 shows pathway scores for the STAT1/2 INF II pathway.Fig. 27 shows pathway scores for the STAT3 pathway.Fig. 28 shows pathway scores for the TGFbeta pathway.Fig. 29 shows pathway scores for the WNT pathway. -
Fig. 30 to 37 . Pathway analysis of dataset GSE52746 which contains colonic samples from Crohn's disease patients and healthy colonic samples from non-inflammatory controls. Crohn's disease patients includes active CD with anti-TNF therapy (non-responders) and inactive CD with anti-TNF therapy (responders). Pathway activity score on Y-axis in log2odds. Mann-Whitney-Wilcoxon statistical test were performed; p-values are indicated in the figures. P-values indicate: *p<0.05; **p<0.01; ***p<0.001. Depicted are cellular signaling pathway activity scores using a model based on the full gene set (standard) or using a random selection of three genes (3 gene a model; 3 gene b model).Fig. 30 shows pathway scores for the AR pathway.Fig. 31 shows pathway scores for the MAPK-AP1 pathway.Fig. 32 shows pathway scores for the NFkB pathway.Fig. 33 shows pathway scores for the STAT1/2 INF I pathway.Fig. 34 shows pathway scores for the STAT1/2 INF II pathway.Fig. 35 shows pathway scores for the STAT3 pathway.Fig. 36 shows pathway scores for the TGFbeta pathway.Fig. 37 shows pathway scores for the WNT pathway. -
Figs. 38 to 45 . For each prediction (treatment effectiveness and treatment prediction) the pathways that are significantly different in activity between groups were identified for UC and CD patients. For each pathway a sub-selection was made on the target genes, identifying those pathway target genes that most contributed to the pathway score in the present applications, the correlation of pathway activity and gene expression levels based on a threshold T. The curates target genes of the predictive pathways were pooled per application. Next 1000 random selections were made of either 3 or 6 (N = 3 or N = 6) of the pooled curated target genes based on either threshold T = 0.4 or T = 0.5. The linear classifier was applied on the samples from the two sample groups to be distinguished, and perform a Wilcox Rank Sum test, resulting in a p-value for each point, which are plotted inFigs. 38-45 .Fig. 38 depicts CD and UC effectiveness plots for T = 0.4 and N = 3.Fig. 39 depicts CD and UC prediction plots for T = 0.4 and N = 3.Fig. 40 depicts CD and UC effectiveness plots for T = 0.4 and N = 6.Fig. 41 depicts CD and UC prediction plots for T = 0.4 and N = 6.Fig. 42 depicts CD and UC effectiveness plots for T = 0.5 and N = 3.Fig. 43 depicts CD and UC prediction plots for T = 0.5 and N = 3.Fig. 44 depicts CD and UC effectiveness plots for T = 0.5 and N = 6.Fig. 45 depicts CD and UC prediction plots for T = 0.5 and N = 6. - We used the pathway analysis to define for IBD a characteristic profile of signal transduction pathway activities (AR, ER, PR, GR, HH, Notch, TGFBeta, WNT, JAK-STAT1/2, JAK-STAT3, NFkB, PI3K, MAPK).
- Mucosal biopsies were obtained at endoscopy in actively inflamed mucosa from 61 IBD patients (24 ulcerative colitis (UC), 19 Crohn's colitis (CDc) and 18 Crohn's ileitis (CDi)), before and 4-6 weeks after their first infliximab infusion (TNF-alpha blocker) and in normal mucosa from 12 control patients.
- Using the pathway analysis approach, we defined a specific pathway activity profile for UC and CD from a mucosal biopsy which enables the prediction of anti TNFalpha drugs treatment response after diagnosis and monitoring of the treatment response.
- Subsequently, based on the definition of a specific pathway activity profile for responders to TNFalpha blockers, we developed a few example computational models which can interpret the signaling pathway activity profile from an individual patient tissue or cell sample with respect to the likelihood that the patient will respond to the treatment of anti TNFalpha drugs.
-
Figs. 5 to 12 show the pathways scores of the signaling pathways, which are involved in response prediction, treatment effectiveness and response monitoring of UC. Each case will be described separately below. - In UC, the pathway activity before treatment with the anti-TNFalpha were significantly different between responders and non-responders for NFKB, TGFBeta and STAT3, using a two-sided Mann Whitney Wilcoxon test; see
Figs. 5 to 12 for p-values and Table 2 for p-values, u-stats and AUC. - There are multiple ways to create computational models for clinical decision support (CDS), based on the pathways' scores. Below 5 examples are provided. Pathway activity scores are given on a log2 odds scale.
- 1. Use the cluster centroids (see Table 1), and determine for a test sample the distance to each of them (d1 and d2), deciding that the tissue samples is fitting the response cluster with the centroid at closest distance, e,g, response (i.e. d1 < d2), no response (i.e. d2 < d1).
- 2. Calculate the distance to each of the two centroids (d1 and d2), and assign a probability of no response as d2/ (d1 + d2), and a corresponding probability of response as d1 / (d1 + d2).
- 3. Calculate the sum of pathway scores, and assign a sample to response if it is equal or above the corresponding threshold, and to no response if below (Table 2)
- 4. Calculate the sum of pathway scores, and assign a sample to response (define response probability 1) if the sum equals that of centroid C1 or higher, and to no response (define response probability 0) if the sum equals that of centroid C2 or lower, and a linear interpolation if in between (giving response probability between 0 and 1).
- 5. Similar to 4, but first determining a response probability (points) for each pathway separately, and then adding up. The maximum sum of 4 is obtained if the test sample has all four pathway scores below those of centroid C1, indicating maximum probability of response; the minimum sum of 0 is obtained if the test sample has all four pathway scores above those of centroid C2, indicating minimum probability of response.
- More sophisticated classifiers can be built by somebody skilled in the art of machine learning, by using e.g. Bayesian classification, support vector machines or neural nets.
Table 1: Centroids (Kmeans), delta and threshold based on log2odds values. Pathway (Response: Yes) Centroid C1 (Response: No) Centroid C2delta Threshold: (mean of centroids) HH -15.1 -16.4 0.65 -15.4 NFKB 9.2 -5.4 14.6 1.9 TGFbeta -8.0 -12.3 4.3 -10.15 STAT3 -6.1 -9.2 3.1 -7.65 Sum -20 -43.3 23.3 -31.65 - For monitoring the effect of anti-TNFalpha treatment, we compared the pathway activity scores before and after treatment, for responders as well as non-responders. Pathways scores which were significant lower after treatment are given in table 1 both for responders, and for non-responders; for pathway figures see
Fig. 3 . - AR, API, NFKB and STAT3 pathways were significant lower after anti-TNFalpha treatment in responders and non-responders; see
Figs. 5 to 12 for p-values and Table 3 for p-values, u-stats and AUC. - To determine if a patient was a responder or a non-responder/resistance against the treatment we used a combination of significant pathways, see table 4 for p-values, u-stats and AUC.
- Background information about dataset GSE12251: Twenty-two patients underwent colonoscopy with biopsy before infliximab treatment. Response to infliximab was defined as endoscopic and histologic healing at
week 8. - For the response prediction of anti TNF-alpha for UC patients based on pathway signaling we first analyzed pre-treatment pathway activity between the responders and non responders. See
Figs. 1 to 4 for the pathway analysis and Table 5 for the P-values, U-stats and AUC. The significant pathways included TGFbeta, WNT, NFKB, STAT3 and STAT1-2. - Information about samples in dataset: Patients with active UC, refractory to corticosteroids and/or immunosuppression, underwent colonoscopy with biopsies from diseased colon within a week prior to the first intravenous infusion of 5 mg infliximab per kg body weight. Response to infliximab was defined as endoscopic and histologic healing at 4-6 weeks after first infliximab treatment.
- For response prediction of anti TNF-alpha for UC patients based on pathway signaling we analyzed the pathway activity between the groups. Significant pathway models were selected using a Mann-Whitney-Wilcoxon statistical tests. Table 6 shows the p-values, U-stats and AUC. The significant pathways include TGFBeta, NFKB and STAT3.
- Information about samples: Biopsies were obtained from UC patients before treatment with placebo, 5 or 10 mg/kg infliximab (anti-TNFalpha), and at 8 and 30 weeks after treatment.
- We analyzed the signaling pathway models for the different groups before and after anti TNF-alpha treatment or placebo. The pathway analysis is shown in
Figs. 21 to 29 . P-values, U-stats and AUC are shown in Tables 7-9. - For response prediction, no large differences were detected before treatment between the responders and non responders (see Table 7 for p-values, u-stats and AUC).
- However, for monitoring the pathways Ap1, AR, NFKB, TGFBeta, STAT1-2 and STAT3 becomes lower after treatment in the responders with the lowest pathway activity scores after 30 weeks compared before start of treatment. Furthermore, the responders after 30 week which received 10 mg dose showed a larger decrease in pathway activity for AR, API, NFKB, STAT1-2 and STAT3 than the patients who received 5mg/kg anti-TNF-alpha treatment.
- For measuring the treatment effectiveness responders and non responder after treatment were compared. See table 8 for p-values. Patients who received and responded to 5 mg/kg anti-TNA-alpha showed a significant decrease in the NFKB pathway only after 30 weeks of treatment. Whereas the 10mg/kg group already had significant differences after 8 weeks compared to the non-responders. Furthermore, in the 10 mg/kg responder group also the API and STAT3 pathways (besides the NFKB) became significant different after 30 weeks of treatment compared to the non-responders.
- Mucosal biopsies were obtained at endoscopy in actively inflamed mucosa from IBD patients Crohn's colitis (CDc) and Crohn's ileitis (CDi)), before and 4-6 weeks after their first infliximab infusion and in normal mucosa from control patients.
- For response prediction, treatment effectiveness and response monitoring of CD we analyzed the pathway activity scores.
Figs. 13 to 20 show the pathways scores of the signaling pathways which are involved in response prediction, treatment effectiveness and response monitoring of CD. - For response prediction the following pathways were significantly different between the responders and non-responders before treatment; API, TGFBeta, WNT, NFkB, STAT3_blood.
- For response monitoring API, NFKB, TGFbeta, STAT3blood and WNT
- and for treatment effectiveness the NFKB and AP1.
- To monitor the effect of the treatment, we compared the pathways before and after treatment. See table 11 for the P-values, U-stats and AUC. The AP1 and NFKB pathways were significantly between the responders before and after treatment.
- To determine the effectiveness of the anti-TNF-alpha treatment we compared the responder and non responders towards treatment and used the significant pathways NFKB, API, WNT and STAT3 pathways, see Table 12 for p-values, U-stats and AUC.
- Dataset GSE52746 contains data from colonic biopsy samples from Crohn's disease patients and healthy colonic samples from non-inflammatory controls. From the Crohn's disease patients there were 5 non-responders (active CD patients) and 7 responders (inactive CD patients) after anti-TNF therapy. Using the pathway analysis we compared the different groups in the dataset (Table 13).
- For monitoring we compared the Active CD patients without anti-TNF alpha treatment, which probably consist of potential non responders and responders to anti-TNFalpha treatment, and compared these with the responders after treatment (inactive CD patients). The pathways NFKB, TGFbeta, API, STAT3 and WNT were significant lower after treatment compared to the group without treatment. See table 14 for the p-values and U-stats of the Mann-Whitney-Wilcoxon statistical test and for AUCs.
- For the effectiveness we compared the responders and non-responders after anti-TNF alpha treatment. The p values of the Mann-Whitney-Wilcoxon statistical test can be found in Table 15. Only AR and WNT were significant different between the groups.
- In order to test if a subset of genes can be used for the pathway models, for each pathway two randomly selected sub-sets of three target genes (a model and b model respectively) were selected as follows:
Pathway a model genes b model genes AR ABCC4; KLK2; PMEPA1 KLK3; NKX3-1; TMPRSS2 MAPK-AP1 BCL2L11; EZR; GLRX MMP1; MMP3; PLAU NFkB CCL4; ICAM1; NFKBIA CCL3; IL6; TNFAIP2 STAT1/2* IRF9; PDCD1; SAMM50 ST13; STAT1; USP18 STAT3 HSP90B1; ICAM1; JUNB CD274; MCL1; ZEB1 TGFbeta GADD45B; IL11; JUNB ANGPTL4; CTGF; SERPINE1 WNT CD44; DEFA6; KIAA1199 EPHB3; IL8; KLF6 * The STAT1/2 Interferon I and II models use the same target genes but are calibrated on using IFNalpha for the Interferon I model or IFNgamma for the Interferon II model, while using the same unstimulated control. - Pathway activity scores for all datasets using the "a model" and the "b model", each using three randomly selected target genes are included in
figs. 1-37 . From the figures it can be concluded that using three pathway models, as compared to the "full model" (using all target genes), the same trends can be observed and in most cases three genes suffice to distinguish between groups (e.g. responders vs non-responders). - For CD and UC, we have pathways that correlate with response prediction and with treatment effectiveness. We investigated if we can define gene lists such that with each sub-list of e.g. 3 genes can build a (simple) classifier to do the same.
-
- take the pathways corresponding to the disease (CD, UC) and application (resp., eff) of interest.
- take their corresponding genes and probesets.
- per gene, take the probeset with maximum absolute correlation with the pathway score it contributes to (across all CD and UC samples; a gene may be involved in multiple pathways).
- select a candidate gene list by taking all genes with their probeset-pathway correlation above a threshold T.
- repeatedly (1000 times) choose a random sub-list of N genes from the candidate gene list.
- make a simple linear classifier with those N genes by assigning them a weight +1 or -1 depending on the sign of their correlation.
- apply that linear classifier on the samples from the two sample groups to be distinguished, and perform a Wilcox Rank Sum test, resulting in a p-value.
- check how many of those 1000 p-values are below 0.05.
- The results are plotted in
figs. 38 to 45 . - Candidate gene lists for T = 0.4
- Prediction (UC or CD):
- TGFB : +ANGPTL4, -CDKN2B, +CTGF, +GADD45B, -HMGA2, +IL11, +INPP5D, +JUNB, +MMP2, +MMP9, -OVOL1, +PDGFB, +PTHLH, +SERPINE1, +SKIL, -SMAD4, +SNAI2, +TIMP1, +VEGFA
- NFKB : +BCL2L1, +BIRC3, +CCL2, +CCL22, +CCL3, +CCL4, +CCL5, +CX3CL1, +CXCL1, +CXCL2, +CXCL3, +ICAM1, +IL1B, +IL6, +IL8, +IRF1, +MMP9, +NFKB2, +NFKBIA, +NFKBIE, +PTGS2, +SELE, +STAT5A, +TNF, +TNFAIP2, +TRAF1, +VCAM1
- AP1 : -BCL2L11, +CCND1, +DNMT1, +ENPP2, +GLRX, +MMP1, +MMP3, +MMP9, +PLAU, +PLAUR, +PTGS2, +SERPINE1, +TIMP1, +VIM
- STAT3 : +BCL2L1, +CCND1, +CD274, +FGF2, +FOS, +FSCN1, +HIF1A, +HSP90AB1, +HSP90B1, +ICAM1, +IFNG, +IL10, +JUNB, +MCL1, +MMP1, +MMP3, +MMP9, +MYC, +NOS2, +PTGS2, +SAA1, +STAT1, +TIMP1, +TNFRSF1B, +TWIST1, +VIM, +ZEB1
- WNT : +CCND1, +CD44, +COL18A1, +DKK1, -HNF1A, +IL8, +KIAA1199, +LEF1, +MYC, +TBX3, -TCF7L2
- Effectiveness UC:
- AR : +CDKN1A, +EAF2, +ELL2, +FKBP5, +LCP1, +PLAU, +PMEPA1, - PRKACB, +SGK1, +TMPRSS2
- AP1 : -BCL2L11, +DNMT1, +ENPP2, +GLRX, +MMP1, +MMP3, +MMP9, +PLAU, +PLAUR, +PTGS2, +SERPINE1, +TIMP1, +VIM
- Effectiveness CD:
- AP1 : -BCL2L11, +DNMT1, +ENPP2, +GLRX, +MMP1, +MMP3, +MMP9, +PLAU, +PLAUR, +PTGS2, +SERPINE1, +TIMP1, +VIM
- NFKB : +BCL2L1, +BIRC3, +CCL2, +CCL22, +CCL3, +CCL4, +CCL5, +CX3CL1, +CXCL1, +CXCL2, +CXCL3, +ICAM1, +IL1B, +IL6, +IL8, +IRF1, +MMP9, +NFKB2, +NFKBIA, +NFKBIE, +PTGS2, +SELE, +STAT5A, +TNF, +TNFAIP2, +TRAF1, +VCAM1
- Candidate gene lists for T = 0.5
- Prediction (UC or CD):
- TGFB : +ANGPTL4, -CDKN2B, +CTGF, +GADD45B, +IL11, +INPP5D, +JUNB, +MMP2, +MMP9, +PTHLH, +SERPINE1, +SNAI2, +TIMP1
- NFKB : +BCL2L1, +BIRC3, +CCL2, +CCL22, +CCL3, +CCL4, +CCL5, +CX3CL1, +CXCL1, +CXCL2, +CXCL3, +ICAM1, +IL1B, +IL6, +IL8, +IRF1, +MMP9, +NFKB2, +NFKBIA, +NFKBIE, +PTGS2, +SELE, +STAT5A, +TNF, +TNFAIP2, +TRAF1, +VCAM1
- AP1 : +CCND1, +GLRX, +MMP1, +MMP3, +MMP9, +PLAU, +PLAUR, +PTGS2, +SERPINE1, +TIMP1, +VIM
- STAT3 : +BCL2L1, +CCND1, +CD274, +FGF2, +FSCN1, +HIF1A, +HSP90B1, +ICAM1, +IFNG, +JUNB, +MCL1, +MMP1, +MMP3, +MMP9, +PTGS2, +STAT1, +TIMP1, +TNFRSF1B, +TWIST1, +VIM, +ZEB1
- WNT : +CCND1, +CD44, +COL18A1, +DKK1, +IL8, +KIAA1199, +TBX3
- Effectiveness UC:
- AR : +EAF2, +ELL2, +FKBP5, +LCP1, +PLAU, +PMEPA1, +TMPRSS2
- AP1 : +GLRX, +MMP1, +MMP3, +MMP9, +PLAU, +PLAUR, +PTGS2, +SERPINE1, +TIMP1, +VIM
- Effectiveness CD:
- AP1 : +GLRX, +MMP1, +MMP3, +MMP9, +PLAU, +PLAUR, +PTGS2, +SERPINE1, +TIMP1, +VIM
- NFKB : +BCL2L1, +BIRC3, +CCL2, +CCL22, +CCL3, +CCL4, +CCL5, +CX3CL1, +CXCL1, +CXCL2, +CXCL3, +ICAM1, +IL1B, +IL6, +IL8, +IRF1, +MMP9, +NFKB2, +NFKBIA, +NFKBIE, +PTGS2, +SELE, +STAT5A, +TNF, +TNFAIP2, +TRAF1, +VCAM1
- Next it was investigated whether two or even one target gene could be predictive for treatment prediction or treatment effectiveness in UC or CD patients, and if an even lower strictness of gene selection could be used. Therefore, for each UC and CD patient samples (based on dataset GSE16879) the previous experiment was repeated for prediction (treatment prediction) prediction2 (treatment prediction but only target genes from the NFkB or the TGFbeta pathway are selected) or effectiveness (treatment effectiveness) for T=0.3, 0.4 and 0.5 and N=1, 2, 3 or 6. Again, for each condition, N genes were randomly selected 1000 times and it was reviewed how often the random selection of N genes was statistically significant in distinguishing responders and non-responders to anti-TNFalpha treatment. The results are plotted in Table 15, avgp refers to Average P value (of the 1000 random selections of N genes) and sigper refers to the percentage of the 1000 selections that are significant (P lower or equal to 0.05). For each condition that has at least 90 percent significant (meaning at least 900 out of the 1000 random selections of N genes) the corresponding gene sets are listed in list A.
Table 2 Treatment prediction UC GSE16879 Mann-Whitney UC_Before first infliximab treatment_Colon_response_Yes (n=8) vs. UC_Before first infliximab treatment_Colon_response_No (n=16) pathway p-value U-value AUC AR 2.09E-01 43 0.66 AP1 9.27E-01 66 0.52 NFKB 5.33E-03 18 0.86 TGFB 5.33E-03 18 0.86 STAT1-2 I 5.61E-01 74 0.58 STAT1-2 II 7.83E-01 59 0.54 STAT3 1.10E-02 22 0.83 WNT 6.18E-02 33 0.74 Table 3 Monitoring UC GSE16879 Mann-Whitney UC_Before first infliximab treatment_Colon_response_Yes (n=8) VS UC_After first infliximab treatment_Colon_response_Yes (n=8) pathway p-value U-value AUC AR 9.39E-04 64 1.00 AP1 9.39E-04 64 1.00 NFKB 5.20E-02 51 0.80 TGFB 3.13E-02 53 0.83 STAT1-2 I 3.13E-02 53 0.83 STAT1-2 II 1.01E-02 57 0.89 STAT3 7.41E-03 58 0.91 WNT 7.93E-01 35 0.55 Table 4 Effectiveness UC GSE16879 Mann-Whitney UC_After first infliximab treatment_Colon_response_Yes (n=8) VS UC_After first infliximab treatment_Colon_response_No (n=16) pathway p-value U-value AUC AR 2.98E-03 15 0.88 AP1 1.05E-03 10 0.92 NFKB 2.44E-03 14 0.89 TGFB 5.33E-03 18 0.86 STAT1-2 I 5.37E-02 32 0.75 STAT1-2 II 1.84E-02 25 0.80 STAT3 1.31E-03 11 0.91 WNT 1.88E-01 42 0.67 Table 5 Treatment prediction UC GSE12251 Mann-Whitney Yes (responder)(n=11) VS No (non responder)(n=11) pathway p-value U-value AUC AR 3.25E-01 45 0.63 AP1 1.00E+00 61 0.50 NFKB 5.82E-03 18 0.85 TGFB 6.39E-04 8 0.93 STAT1-2 I 1.26E-02 22 0.82 STAT1-2 II 1.81E-02 24 0.80 STAT3 2.03E-03 13 0.89 WNT 2.52E-03 14 0.88 Table 6 Treatment prediction UC GSE14580 Mann-Whitney UC_Yes (responder) (n=8) VS UC_No (non responder)(n=16) pathway p-value U-value AUC AR 2.09E-01 43 0.66 AP1 9.27E-01 66 0.52 NFKB 5.33E-03 18 0.86 TGFB 5.33E-03 18 0.86 STAT1-2 I 5.61E-01 74 0.58 STAT1-2 II 7.83E-01 59 0.54 STAT3 1.10E-02 22 0.83 WNT 6.18E-02 33 0.74 Table 7 Treatment prediction UC GSE23597 Mann-Whitney W0_reponse_No_d ose_5mg/kg (n=7) VS W0_reponse_Yes_d ose_5mg/kg (n=8) W0_reponse_No_dos e_10mg/kg (n=7) VS W0_reponse_Yes_do se_10mg/kg (n=10) pathway p-value U-value AUC p-value U-value AUC AR 9.54E-01 27 0.52 4.64E-01 27 0.61 AP1 8.62E-01 26 0.54 6.61E-01 40 0.57 NFKB 7.29E-02 44 0.79 8.07E-01 32 0.54 TGFB 2.72E-01 38 0.68 2.62E-01 47 0.67 STAT1-2 I 7.72E-01 25 0.55 7.33E-01 39 0.56 STAT1-2 II 3.25E-01 19 0.66 8.07E-01 38 0.54 STAT3 2.24E-01 39 0.70 9.61E-01 36 0.51 WNT 1.83E-01 40 0.71 7.33E-01 39 0.56 Table 8 Monitoring UC GSE23597 Mann-Whitne y W0_repons e_Yes_dose _5mg/kg (n=8) VS W8_repons e_Yes_dose _5mg/kg (n=6) W0_repons e_Yes_dose _5mg/kg (n=8) VS W30_repon se_Yes_dos e_5mg/kg (n=6) W0_repons e_Yes_dose _10mg/kg (n=10) VS W8_repons e_Yes_dose _10mg/kg (n=7) pathway p-value U-value AUC p-value U-value AUC p-value U-value AUC AR 3.33E-01 32 0.67 2.39E-02 42 0.88 0.00 67 0.96 AP1 8.14E-02 38 0.79 3.68E-03 47 0.98 0.01 64 0.91 NFKB 3.32E-02 41 0.85 5.51E-03 46 0.96 0.07 54 0.77 TGFB 6.12E-02 39 0.81 2.39E-02 42 0.88 0.13 51 0.73 STAT1-2 I 2.20E-01 34 0.71 6.12E-02 39 0.81 0.31 46 0.66 STAT1-2 II 6.12E-02 39 0.81 2.39E-02 42 0.88 0.22 48 0.69 STAT3 1.07E-01 37 0.77 4.54E-02 40 0.83 0.22 48 0.69 WNT 8.14E-02 38 0.79 2.39E-02 42 0.88 0.96 35 0.50 Table 9 Effectiveness UC GSE23597 Mann-Whitne y W8_repons e_No_dose _5mg/kg (n=7) VS W8_repons e_Yes_dos e_5mg/kg (n=6) W30_repon se_No_dose _5mg/kg (n=3) VS W30_repon se_Yes_dos e_5mg/kg (n=6) W8_repon se_No_dos e_10mg/kg (n=7) VS W8_repon se_Yes_do se_10mg/k g (n=7) pathwa y p-value U-val ue AUC p-value U-value AUC p-value U-value AUC AR 3.53E-01 28 0.67 1.56E-01 15 0.83 3.07E-01 33 0.67 AP1 2.25E-01 30 0.71 1.56E-01 15 0.83 2.98E-02 42 0.86 NFKB 7.42E-02 34 0.81 2.82E-02 18 1.00 3.07E-01 33 0.67 TGFB 1.00E-01 33 0.79 5.28E-02 17 0.94 3.07E-01 33 0.67 STAT1-2 I 6.17E-01 25 0.60 5.28E-02 17 0.94 1.00E+00 24 0.51 STAT1-2 II 7.21E-01 24 0.57 5.28E-02 17 0.94 7.98E-01 27 0.55 STAT3 1.34E-01 32 0.76 9.33E-02 16 0.89 7.98E-01 27 0.55 WNT 1.00E-01 33 0.79 2.82E-02 18 1.00 8.98E-01 26 0.53 Table 10 Treatment prediction CD GSE16879 Mann-Whitney CD_Before first infliximab treatment_Colon_response_No (n=6) VS CD_Before first infliximab treatment_Colon_response_Yes (n=12) pathway p-value U-value AUC AR 2.06E-01 50 0.69 AP1 3.51E-02 59 0.82 NFKB 2.34E-03 69 0.96 TGFB 5.73E-03 66 0.92 STAT1-2 I 4.26E-01 45 0.63 STAT1-2 II 3.25E-01 47 0.65 STAT3 1.00E-02 64 0.89 WNT 1.00E-02 64 0.89 Table 11 Monitoring CD GSE16879 Mann-Whitney CD_Before first infliximab treatment_Colon_response_Yes (n=12) VS CD_After first infliximab treatment_Colon_response_Yes (n= 11) pathway p-value U-value AUC AR 7.94E-02 95 0.72 AP1 9.92E-04 120 0.91 NFKB 1.20E-04 129 0.98 TGFB 2.82E-01 84 0.64 STAT1-2 I 3.40E-01 82 0.62 STAT1-2 II 1.66E-01 89 0.67 STAT3 3.72E-01 81 0.61 WNT 3.72E-01 81 0.61 Table 12 Effectiveness CD GSE16879 Mann-Whitney CD_After first infliximab treatment_Colon_response_No (n=7) VS CD_After first infliximab treatment_Colon_response_Yes (n=11) pathway p-value U-value AUC AR 5.72E-02 60 0.78 AP1 4.99E-03 70 6.36 NFKB 5.78E-04 77 7.00 TGFB 1.45E-02 66 6.00 STAT1-2 I 2.77E-01 51 4.64 STAT1-2 II 1.47E-01 55 5.00 STAT3 2.08E-03 73 6.64 WNT 4.63E-02 61 5.55 Table 13 Monitoring CD GSE52746 active CD patient without anti-TNF therapy (n=10) VS inactive CD patient with anti-TNF therapy (n=7) pathway p-value U-value AUC AR 1.30E-01 51 0.73 AP1 1.68E-02 60 0.86 NFKB 2.11E-03 67 0.96 TGFB 2.18E-02 59 0.84 STAT1-2 I 8.07E-01 38 0.54 STAT1-2 II 6.61E-01 40 0.57 STAT3 2.81E-02 58 0.83 WNT 2.92E-03 66 0.94 Table 14 Effectiveness CD GSE52746 Mann-Whitney active CD patient with anti-TNF therapy (n=5) VS inactive CD patient with anti-TNF therapy (n=7) pathway p-value U-value AUC AR 2.30E-02 3 0.91 AP1 3.30E-01 11 0.69 NFKB 1.04E-01 7 0.80 TGFB 7.45E-01 15 0.57 STAT1-2 I 7.45E-01 15 0.57 STAT1-2 II 1.94E-01 9 0.74 STAT3 5.16E-01 13 0.63 WNT 2.30E-02 3 0.91 Table 15 T N disease application avgp sigper 0.3 1 UC pred iction 0.163816 48 0.3 1 UC prediction2 0.15101 57 0.3 1 UC effectiveness 0.088594 72 0.3 1 CD pred iction 0.179574 51 0.3 1 CD prediction2 0.147276 54 0.3 1 CD effectiveness 0.049109 86 0.3 2 UC pred iction 0.10869 67 0.3 2 UC prediction2 0.062496 79 0.3 2 UC effectiveness 0.039748 88 0.3 2 CD pred iction 0.074105 74 0.3 2 CD prediction2 0.039602 82 0.3 2 CD effectiveness 0.007279 98 0.3 3 UC pred iction 0.051243 82 0.3 3 UC prediction2 0.029954 87 0.3 3 UC effectiveness 0.017667 91 0.3 3 CD pred iction 0.035944 87 0.3 3 CD prediction2 0.013289 93 0.3 3 CD effectiveness 0.001273 100 0.3 6 UC pred iction 0.012236 96 0.3 6 UC prediction2 0.005442 99 0.3 6 UC effectiveness 0.003728 98 0.3 6 CD pred iction 0.003404 98 0.3 6 CD prediction2 0.000723 100 0.3 6 CD effectiveness 0.000147 100 0.4 1 UC pred iction 0.143565 53 0.4 1 UC prediction2 0.127825 61 0.4 1 UC effectiveness 0.03865 81 0.4 1 CD pred iction 0.190181 55 0.4 1 CD prediction2 0.129771 58 0.4 1 CD effectiveness 0.01583 92 0.4 2 UC pred iction 0.078552 73 0.4 2 UC prediction2 0.044295 82 0.4 2 UC effectiveness 0.005908 98 0.4 2 CD pred iction 0.066315 78 0.4 2 CD prediction2 0.0372 85 0.4 2 CD effectiveness 0.00157 100 0.4 3 UC pred iction 0.041327 87 0.4 3 UC prediction2 0.018661 92 0.4 3 UC effectiveness 0.002044 100 0.4 3 CD pred iction 0.025349 89 0.4 3 CD prediction2 0.011396 94 0.4 3 CD effectiveness 0.000341 100 0.4 6 UC pred iction 0.009068 97 0.4 6 UC prediction2 0.003979 100 0.4 6 UC effectiveness 0.000992 100 0.4 6 CD pred iction 0.002672 99 0.4 6 CD prediction2 0.000537 100 0.4 6 CD effectiveness 0.000129 100 0.5 1 UC pred iction 0.099554 62 0.5 1 UC prediction2 0.079711 72 0.5 1 UC effectiveness 0.033755 87 0.5 1 CD pred iction 0.108109 67 0.5 1 CD prediction2 0.08967 67 0.5 1 CD effectiveness 0.009958 94 0.5 2 UC pred iction 0.036728 85 0.5 2 UC prediction2 0.026986 89 0.5 2 UC effectiveness 0.003925 99 0.5 2 CD pred iction 0.024161 88 0.5 2 CD prediction2 0.015855 92 0.5 2 CD effectiveness 0.000855 100 0.5 3 UC pred iction 0.023165 91 0.5 3 UC prediction2 0.009574 97 0.5 3 UC effectiveness 0.001632 100 0.5 3 CD pred iction 0.006734 96 0.5 3 CD prediction2 0.005888 97 0.5 3 CD effectiveness 0.000321 100 0.5 6 UC pred iction 0.005007 99 0.5 6 UC prediction2 0.003101 100 0.5 6 UC effectiveness 0.000953 100 0.5 6 CD pred iction 0.000485 100 0.5 6 CD prediction2 0.000281 100 0.5 6 CD effectiveness 0.000117 100 -
- Gene set T=0.3, N=2, CD effectiveness: BCL2L11, DNMT1, ENPP2, EZR, GLRX, MMP1, MMP3, MMP9, PLAU, PLAUR, PTGS2, SERPINE1, TIMP1, VIM, BCL2L1, BIRC3, CCL2, CCL22, CCL3, CCL4, CCL5, CX3CL1, CXCL1, CXCL2, CXCL3, ICAM1, IL1B, IL6, IL8, IRF1, NFKB2, NFKBIA, NFKBIE, SELE, STAT5A, TNF, TNFAIP2, TNIP1, TRAF1, VCAM1
- Gene set T=0.3, N=3, UC effectiveness: CDKN1A, EAF2, ELL2, FKBP5, IGF1, LCP1, LRIG1, PLAU, PMEPA1, PPAP2A, PRKACB, PTPN1, SGK1, TMPRSS2, UGT2B15, BCL2L11, DNMT1, ENPP2, EZR, GLRX, MMP1, MMP3, MMP9, PLAUR, PTGS2, SERPINE1, TIMP1, VIM
- Gene set T=0.3, N=3, CD prediction2: ANGPTL4, CDC42EP3, CDKN2B, CTGF, GADD45B, HMGA2, IL11, INPP5D, JUNB, MMP2, MMP9, OVOL1, PDGFB, PTHLH, SERPINE1, SKIL, SMAD4, SNAI1, SNAI2, TIMP1, VEGFA, BCL2L1, BIRC3, CCL2, CCL22, CCL3, CCL4, CCL5, CX3CL1, CXCL1, CXCL2, CXCL3, ICAM1, IL1B, IL6, IL8, IRF1, NFKB2, NFKBIA, NFKBIE, PTGS2, SELE, STAT5A, TNF, TNFAIP2, TNIP1, TRAF1, VCAM1
- Gene set T=0.3, N=3, CD effectiveness: BCL2L11, DNMT1, ENPP2, EZR, GLRX, MMP1, MMP3, MMP9, PLAU, PLAUR, PTGS2, SERPINE1, TIMP1, VIM, BCL2L1, BIRC3, CCL2, CCL22, CCL3, CCL4, CCL5, CX3CL1, CXCL1, CXCL2, CXCL3, ICAM1, IL1B, IL6, IL8, IRF1, NFKB2, NFKBIA, NFKBIE, SELE, STAT5A, TNF, TNFAIP2, TNIP1, TRAF1, VCAM1
- Gene set T=0.3, N=6, UC prediction: ANGPTL4, CDC42EP3, CDKN2B, CTGF, GADD45B, HMGA2, IL11, INPP5D, JUNB, MMP2, MMP9, OVOL1, PDGFB, PTHLH, SERPINE1, SKIL, SMAD4, SNAI1, SNAI2, TIMP1, VEGFA, BCL2L1, BIRC3, CCL2, CCL22, CCL3, CCL4, CCL5, CX3CL1, CXCL1, CXCL2, CXCL3, ICAM1, IL1B, IL6, IL8, IRF1, NFKB2, NFKBIA, NFKBIE, PTGS2, SELE, STAT5A, TNF, TNFAIP2, TNIP1, TRAF1, VCAM1, BCL2L11, CCND1, DNMT1, ENPP2, EZR, GLRX, MMP1, MMP3, PLAU, PLAUR, VIM, CD274, CRP, FGF2, FOS, FSCN1, HIF1A, HSP90AA1, HSP90AB1, HSP90B1, IFNG, IL10, MCL1, MYC, NOS2, SAA1, STAT1, TNFRSF1B, TWIST1, ZEB1, CD44, COL18A1, DKK1, HNF1A, KIAA1199, LEF1, NKD1, PPARG, SP5, TBX3, TCF7L2
- Gene set T=0.3, N=6, UC prediction2: ANGPTL4, CDC42EP3, CDKN2B, CTGF, GADD45B, HMGA2, IL11, INPP5D, JUNB, MMP2, MMP9, OVOL1, PDGFB, PTHLH, SERPINE1, SKIL, SMAD4, SNAI1, SNAI2, TIMP1, VEGFA, BCL2L1, BIRC3, CCL2, CCL22, CCL3, CCL4, CCL5, CX3CL1, CXCL1, CXCL2, CXCL3, ICAM1, IL1B, IL6, IL8, IRF1, NFKB2, NFKBIA, NFKBIE, PTGS2, SELE, STAT5A, TNF, TNFAIP2, TNIP1, TRAF1, VCAM1
- Gene set T=0.3, N=6, UC effectiveness: CDKN1A, EAF2, ELL2, FKBP5, IGF1, LCP1, LRIG1, PLAU, PMEPA1, PPAP2A, PRKACB, PTPN1, SGK1, TMPRSS2, UGT2B15, BCL2L11, DNMT1, ENPP2, EZR, GLRX, MMP1, MMP3, MMP9, PLAUR, PTGS2, SERPINE1, TIMP1, VIM
- Gene set T=0.3, N=6, CD prediction: ANGPTL4, CDC42EP3, CDKN2B, CTGF, GADD45B, HMGA2, IL11, INPP5D, JUNB, MMP2, MMP9, OVOL1, PDGFB, PTHLH, SERPINE1, SKIL, SMAD4, SNAI1, SNAI2, TIMP1, VEGFA, BCL2L1, BIRC3, CCL2, CCL22, CCL3, CCL4, CCL5, CX3CL1, CXCL1, CXCL2, CXCL3, ICAM1, IL1B, IL6, IL8, IRF1, NFKB2, NFKBIA, NFKBIE, PTGS2, SELE, STAT5A, TNF, TNFAIP2, TNIP1, TRAF1, VCAM1, BCL2L11, CCND1, DNMT1, ENPP2, EZR, GLRX, MMP1, MMP3, PLAU, PLAUR, VIM, CD274, CRP, FGF2, FOS, FSCN1, HIF1A, HSP90AA1, HSP90AB1, HSP90B1, IFNG, IL10, MCL1, MYC, NOS2, SAA1, STAT1, TNFRSF1B, TWIST1, ZEB1, CD44, COL18A1, DKK1, HNF1A, KIAA1199, LEF1, NKD1, PPARG, SP5, TBX3, TCF7L2
- Gene set T=0.3, N=6, CD prediction2: ANGPTL4, CDC42EP3, CDKN2B, CTGF, GADD45B, HMGA2, IL11, INPP5D, JUNB, MMP2, MMP9, OVOL1, PDGFB, PTHLH, SERPINE1, SKIL, SMAD4, SNAI1, SNAI2, TIMP1, VEGFA, BCL2L1, BIRC3, CCL2, CCL22, CCL3, CCL4, CCL5, CX3CL1, CXCL1, CXCL2, CXCL3, ICAM1, IL1B, IL6, IL8, IRF1, NFKB2, NFKBIA, NFKBIE, PTGS2, SELE, STAT5A, TNF, TNFAIP2, TNIP1, TRAF1, VCAM1
- Gene set T=0.3, N=6, CD effectiveness: BCL2L11, DNMT1, ENPP2, EZR, GLRX, MMP1, MMP3, MMP9, PLAU, PLAUR, PTGS2, SERPINE1, TIMP1, VIM, BCL2L1, BIRC3, CCL2, CCL22, CCL3, CCL4, CCL5, CX3CL1, CXCL1, CXCL2, CXCL3, ICAM1, IL1B, IL6, IL8, IRF1, NFKB2, NFKBIA, NFKBIE, SELE, STAT5A, TNF, TNFAIP2, TNIP1, TRAF1, VCAM1
- Gene set T=0.4, N=1, CD effectiveness: BCL2L11, DNMT1, ENPP2, GLRX, MMP1, MMP3, MMP9, PLAU, PLAUR, PTGS2, SERPINE1, TIMP1, VIM, BCL2L1, BIRC3, CCL2, CCL22, CCL3, CCL4, CCL5, CX3CL1, CXCL1, CXCL2, CXCL3, ICAM1, IL1B, IL6, IL8, IRF1, NFKB2, NFKBIA, NFKBIE, SELE, STAT5A, TNF, TNFAIP2, TRAF1, VCAM1
- Gene set T=0.4, N=2, UC effectiveness: CDKN1A, EAF2, ELL2, FKBP5, LCP1, PLAU, PMEPA1, PRKACB, SGK1, TMPRSS2, BCL2L11, DNMT1, ENPP2, GLRX, MMP1, MMP3, MMP9, PLAUR, PTGS2, SERPINE1, TIMP1, VIM
- Gene set T=0.4, N=2, CD effectiveness: BCL2L11, DNMT1, ENPP2, GLRX, MMP1, MMP3, MMP9, PLAU, PLAUR, PTGS2, SERPINE1, TIMP1, VIM, BCL2L1, BIRC3, CCL2, CCL22, CCL3, CCL4, CCL5, CX3CL1, CXCL1, CXCL2, CXCL3, ICAM1, IL1B, IL6, IL8, IRF1, NFKB2, NFKBIA, NFKBIE, SELE, STAT5A, TNF, TNFAIP2, TRAF1, VCAM1
- Gene set T=0.4, N=3, UC prediction2: ANGPTL4, CDKN2B, CTGF, GADD45B, HMGA2, IL11, INPP5D, JUNB, MMP2, MMP9, OVOL1, PDGFB, PTHLH, SERPINE1, SKIL, SMAD4, SNAI2, TIMP1, VEGFA, BCL2L1, BIRC3, CCL2, CCL22, CCL3, CCL4, CCL5, CX3CL1, CXCL1, CXCL2, CXCL3, ICAM1, IL1B, IL6, IL8, IRF1, NFKB2, NFKBIA, NFKBIE, PTGS2, SELE, STAT5A, TNF, TNFAIP2, TRAF1, VCAM1
- Gene set T=0.4, N=3, UC effectiveness: CDKN1A, EAF2, ELL2, FKBP5, LCP1, PLAU, PMEPA1, PRKACB, SGK1, TMPRSS2, BCL2L11, DNMT1, ENPP2, GLRX, MMP1, MMP3, MMP9, PLAUR, PTGS2, SERPINE1, TIMP1, VIM
- Gene set T=0.4, N=3, CD prediction2: ANGPTL4, CDKN2B, CTGF, GADD45B, HMGA2, IL11, INPP5D, JUNB, MMP2, MMP9, OVOL1, PDGFB, PTHLH, SERPINE1, SKIL, SMAD4, SNAI2, TIMP1, VEGFA, BCL2L1, BIRC3, CCL2, CCL22, CCL3, CCL4, CCL5, CX3CL1, CXCL1, CXCL2, CXCL3, ICAM1, IL1B, IL6, IL8, IRF1, NFKB2, NFKBIA, NFKBIE, PTGS2, SELE, STAT5A, TNF, TNFAIP2, TRAF1, VCAM1
- Gene set T=0.4, N=3, CD effectiveness: BCL2L11, DNMT1, ENPP2, GLRX, MMP1, MMP3, MMP9, PLAU, PLAUR, PTGS2, SERPINE1, TIMP1, VIM, BCL2L1, BIRC3, CCL2, CCL22, CCL3, CCL4, CCL5, CX3CL1, CXCL1, CXCL2, CXCL3, ICAM1, IL1B, IL6, IL8, IRF1, NFKB2, NFKBIA, NFKBIE, SELE, STAT5A, TNF, TNFAIP2, TRAF1, VCAM1
- Gene set T=0.4, N=6, UC prediction: ANGPTL4, CDKN2B, CTGF, GADD45B, HMGA2, IL11, INPP5D, JUNB, MMP2, MMP9, OVOL1, PDGFB, PTHLH, SERPINE1, SKIL, SMAD4, SNAI2, TIMP1, VEGFA, BCL2L1, BIRC3, CCL2, CCL22, CCL3, CCL4, CCL5, CX3CL1, CXCL1, CXCL2, CXCL3, ICAM1, IL1B, IL6, IL8, IRF1, NFKB2, NFKBIA, NFKBIE, PTGS2, SELE, STAT5A, TNF, TNFAIP2, TRAF1, VCAM1, BCL2L11, CCND1, DNMT1, ENPP2, GLRX, MMP1, MMP3, PLAU, PLAUR, VIM, CD274, FGF2, FOS, FSCN1, HIF1A, HSP90AB1, HSP90B1, IFNG, IL10, MCL1, MYC, NOS2, SAA1, STAT1, TNFRSF1B, TWIST1, ZEB1, CD44, COL18A1, DKK1, HNF1A, KIAA1199, LEF1, TBX3, TCF7L2
- Gene set T=0.4, N=6, UC prediction2: ANGPTL4, CDKN2B, CTGF, GADD45B, HMGA2, IL11, INPP5D, JUNB, MMP2, MMP9, OVOL1, PDGFB, PTHLH, SERPINE1, SKIL, SMAD4, SNAI2, TIMP1, VEGFA, BCL2L1, BIRC3, CCL2, CCL22, CCL3, CCL4, CCL5, CX3CL1, CXCL1, CXCL2, CXCL3, ICAM1, IL1B, IL6, IL8, IRF1, NFKB2, NFKBIA, NFKBIE, PTGS2, SELE, STAT5A, TNF, TNFAIP2, TRAF1, VCAM1
- Gene set T=0.4, N=6, UC effectiveness: CDKN1A, EAF2, ELL2, FKBP5, LCP1, PLAU, PMEPA1, PRKACB, SGK1, TMPRSS2, BCL2L11, DNMT1, ENPP2, GLRX, MMP1, MMP3, MMP9, PLAUR, PTGS2, SERPINE1, TIMP1, VIM
- Gene set T=0.4, N=6, CD prediction: ANGPTL4, CDKN2B, CTGF, GADD45B, HMGA2, IL11, INPP5D, JUNB, MMP2, MMP9, OVOL1, PDGFB, PTHLH, SERPINE1, SKIL, SMAD4, SNAI2, TIMP1, VEGFA, BCL2L1, BIRC3, CCL2, CCL22, CCL3, CCL4, CCL5, CX3CL1, CXCL1, CXCL2, CXCL3, ICAM1, IL1B, IL6, IL8, IRF1, NFKB2, NFKBIA, NFKBIE, PTGS2, SELE, STAT5A, TNF, TNFAIP2, TRAF1, VCAM1, BCL2L11, CCND1, DNMT1, ENPP2, GLRX, MMP1, MMP3, PLAU, PLAUR, VIM, CD274, FGF2, FOS, FSCN1, HIF1A, HSP90AB1, HSP90B1, IFNG, IL10, MCL1, MYC, NOS2, SAA1, STAT1, TNFRSF1B,TWIST1, ZEB1, CD44, COL18A1, DKK1, HNF1A, KIAA1199, LEF1, TBX3, TCF7L2
- Gene set T=0.4, N=6, CD prediction2: ANGPTL4, CDKN2B, CTGF, GADD45B, HMGA2, IL11, INPP5D, JUNB, MMP2, MMP9, OVOL1, PDGFB, PTHLH, SERPINE1, SKIL, SMAD4, SNAI2, TIMP1, VEGFA, BCL2L1, BIRC3, CCL2, CCL22, CCL3, CCL4, CCL5, CX3CL1, CXCL1, CXCL2, CXCL3, ICAM1, IL1B, IL6, IL8, IRF1, NFKB2, NFKBIA, NFKBIE, PTGS2, SELE, STAT5A, TNF, TNFAIP2, TRAF1, VCAM1
- Gene set T=0.4, N=6, CD effectiveness: BCL2L11, DNMT1, ENPP2, GLRX, MMP1, MMP3, MMP9, PLAU, PLAUR, PTGS2, SERPINE1, TIMP1, VIM, BCL2L1, BIRC3, CCL2, CCL22, CCL3, CCL4, CCL5, CX3CL1, CXCL1, CXCL2, CXCL3, ICAM1, IL1B, IL6, IL8, IRF1, NFKB2, NFKBIA, NFKBIE, SELE, STAT5A, TNF, TNFAIP2, TRAF1, VCAM1
- Gene set T=0.5, N=1, CD effectiveness: GLRX, MMP1, MMP3, MMP9, PLAU, PLAUR, PTGS2, SERPINE1, TIMP1, VIM, BCL2L1, BIRC3, CCL2, CCL22, CCL3, CCL4, CCL5, CX3CL1, CXCL1, CXCL2, CXCL3, ICAM1, IL1B, IL6, IL8, IRF1, NFKB2, NFKBIA, NFKBIE, SELE, STAT5A, TNF, TNFAIP2, TRAF1, VCAM1 Gene set T=0.5, N=2, UC effectiveness: EAF2, ELL2, FKBP5, LCP1, PLAU, PMEPA1, TMPRSS2, GLRX, MMP1, MMP3, MMP9, PLAUR, PTGS2, SERPINE1, TIMP1, VIM
- Gene set T=0.5, N=2, CD prediction: ANGPTL4, CDKN2B, CTGF, GADD45B, IL11, INPP5D, JUNB, MMP2, MMP9, PTHLH, SERPINE1, SNAI2, TIMP1, BCL2L1, BIRC3, CCL2, CCL22, CCL3, CCL4, CCL5, CX3CL1, CXCL1, CXCL2, CXCL3, ICAM1, IL1B, IL6, IL8, IRF1, NFKB2, NFKBIA, NFKBIE, PTGS2, SELE, STAT5A, TNF, TNFAIP2, TRAF1, VCAM1
- Gene set T=0.5, N=2, CD effectiveness: GLRX, MMP1, MMP3, MMP9, PLAU, PLAUR, PTGS2, SERPINE1, TIMP1, VIM, BCL2L1, BIRC3, CCL2, CCL22, CCL3, CCL4, CCL5, CX3CL1, CXCL1, CXCL2, CXCL3, ICAM1, IL1B, IL6, IL8, IRF1, NFKB2, NFKBIA, NFKBIE, SELE, STAT5A, TNF, TNFAIP2, TRAF1, VCAM1
- Gene set T=0.5, N=3, UC prediction: ANGPTL4, CDKN2B, CTGF, GADD45B, IL11, INPP5D, JUNB, MMP2, MMP9, PTHLH, SERPINE1, SNAI2, TIMP1, BCL2L1, BIRC3, CCL2, CCL22, CCL3, CCL4, CCL5, CX3CL1, CXCL1, CXCL2, CXCL3, ICAM1, IL1B, IL6, IL8, IRF1, NFKB2, NFKBIA, NFKBIE, PTGS2, SELE, STAT5A, TNF, TNFAIP2, TRAF1, VCAM1, CCND1, GLRX, MMP1, MMP3, PLAU, PLAUR, VIM, CD274, FGF2, FSCN1, HIF1A, HSP90B1, IFNG, MCL1, STAT1, TNFRSF1B,TWIST1, ZEB1, CD44, COL18A1, DKK1, KIAA1199, TBX3
- Gene set T=0.5, N=3, UC prediction2: ANGPTL4, CDKN2B, CTGF, GADD45B, IL11, INPP5D, JUNB, MMP2, MMP9, PTHLH, SERPINE1, SNAI2, TIMP1, BCL2L1, BIRC3, CCL2, CCL22, CCL3, CCL4, CCL5, CX3CL1, CXCL1, CXCL2, CXCL3, ICAM1, IL1B, IL6, IL8, IRF1, NFKB2, NFKBIA, NFKBIE, PTGS2, SELE, STAT5A, TNF, TNFAIP2, TRAF1, VCAM1
- Gene set T=0.5, N=3, UC effectiveness: EAF2, ELL2, FKBP5, LCP1, PLAU, PMEPA1, TMPRSS2, GLRX, MMP1, MMP3, MMP9, PLAUR, PTGS2, SERPINE1, TIMP1, VIM
- Gene set T=0.5, N=3, CD prediction: ANGPTL4, CDKN2B, CTGF, GADD45B, IL11, INPP5D, JUNB, MMP2, MMP9, PTHLH, SERPINE1, SNAI2, TIMP1, BCL2L1, BIRC3, CCL2, CCL22, CCL3, CCL4, CCL5, CX3CL1, CXCL1, CXCL2, CXCL3, ICAM1, IL1B, IL6, IL8, IRF1, NFKB2, NFKBIA, NFKBIE, PTGS2, SELE, STAT5A, TNF, TNFAIP2, TRAF1, VCAM1, CCND1, GLRX, MMP1, MMP3, PLAU, PLAUR, VIM, CD274, FGF2, FSCN1, HIF1A, HSP90B1, IFNG, MCL1, STAT1, TNFRSF1B,TWIST1, ZEB1, CD44, COL18A1, DKK1, KIAA1199, TBX3
- Gene set T=0.5, N=3, CD prediction2: ANGPTL4, CDKN2B, CTGF, GADD45B, IL11, INPP5D, JUNB, MMP2, MMP9, PTHLH, SERPINE1, SNAI2, TIMP1, BCL2L1, BIRC3, CCL2, CCL22, CCL3, CCL4, CCL5, CX3CL1, CXCL1, CXCL2, CXCL3, ICAM1, IL1B, IL6, IL8, IRF1, NFKB2, NFKBIA, NFKBIE, PTGS2, SELE, STAT5A, TNF, TNFAIP2, TRAF1, VCAM1
- Gene set T=0.5, N=3, CD effectiveness: GLRX, MMP1, MMP3, MMP9, PLAU, PLAUR, PTGS2, SERPINE1, TIMP1, VIM, BCL2L1, BIRC3, CCL2, CCL22, CCL3, CCL4, CCL5, CX3CL1, CXCL1, CXCL2, CXCL3, ICAM1, IL1B, IL6, IL8, IRF1, NFKB2, NFKBIA, NFKBIE, SELE, STAT5A, TNF, TNFAIP2, TRAF1, VCAM1 Gene set T=0.5, N=6, UC prediction: ANGPTL4, CDKN2B, CTGF, GADD45B, IL11, INPP5D, JUNB, MMP2, MMP9, PTHLH, SERPINE1, SNAI2, TIMP1, BCL2L1, BIRC3, CCL2, CCL22, CCL3, CCL4, CCL5, CX3CL1, CXCL1, CXCL2, CXCL3, ICAM1, IL1B, IL6, IL8, IRF1, NFKB2, NFKBIA, NFKBIE, PTGS2, SELE, STAT5A, TNF, TNFAIP2, TRAF1, VCAM1, CCND1, GLRX, MMP1, MMP3, PLAU, PLAUR, VIM, CD274, FGF2, FSCN1, HIF1A, HSP90B1, IFNG, MCL1, STAT1, TNFRSF1B, TWIST1, ZEB1, CD44, COL18A1, DKK1, KIAA1199, TBX3
- Gene set T=0.5, N=6, UC prediction2: ANGPTL4, CDKN2B, CTGF, GADD45B, IL11, INPP5D, JUNB, MMP2, MMP9, PTHLH, SERPINE1, SNAI2, TIMP1, BCL2L1, BIRC3, CCL2, CCL22, CCL3, CCL4, CCL5, CX3CL1, CXCL1, CXCL2, CXCL3, ICAM1, IL1B, IL6, IL8, IRF1, NFKB2, NFKBIA, NFKBIE, PTGS2, SELE, STAT5A, TNF, TNFAIP2, TRAF1, VCAM1
- Gene set T=0.5, N=6, UC effectiveness: EAF2, ELL2, FKBP5, LCP1, PLAU, PMEPA1, TMPRSS2, GLRX, MMP1, MMP3, MMP9, PLAUR, PTGS2, SERPINE1, TIMP1, VIM
- Gene set T=0.5, N=6, CD prediction: ANGPTL4, CDKN2B, CTGF, GADD45B, IL11, INPP5D, JUNB, MMP2, MMP9, PTHLH, SERPINE1, SNAI2, TIMP1, BCL2L1, BIRC3, CCL2, CCL22, CCL3, CCL4, CCL5, CX3CL1, CXCL1, CXCL2, CXCL3, ICAM1, IL1B, IL6, IL8, IRF1, NFKB2, NFKBIA, NFKBIE, PTGS2, SELE, STAT5A, TNF, TNFAIP2, TRAF1, VCAM1, CCND1, GLRX, MMP1, MMP3, PLAU, PLAUR, VIM, CD274, FGF2, FSCN1, HIF1A, HSP90B1, IFNG, MCL1, STAT1, TNFRSF1B, TWIST1, ZEB1, CD44, COL18A1, DKK1, KIAA1199, TBX3
- Gene set T=0.5, N=6, CD prediction2: ANGPTL4, CDKN2B, CTGF, GADD45B, IL11, INPP5D, JUNB, MMP2, MMP9, PTHLH, SERPINE1, SNAI2, TIMP1, BCL2L1, BIRC3, CCL2, CCL22, CCL3, CCL4, CCL5, CX3CL1, CXCL1, CXCL2, CXCL3, ICAM1, IL1B, IL6, IL8, IRF1, NFKB2, NFKBIA, NFKBIE, PTGS2, SELE, STAT5A, TNF, TNFAIP2, TRAF1, VCAM1
- Gene set T=0.5, N=6, CD effectiveness: GLRX, MMP1, MMP3, MMP9, PLAU, PLAUR, PTGS2, SERPINE1, TIMP1, VIM, BCL2L1, BIRC3, CCL2, CCL22, CCL3, CCL4, CCL5, CX3CL1, CXCL1, CXCL2, CXCL3, ICAM1, IL1B, IL6, IL8, IRF1, NFKB2, NFKBIA, NFKBIE, SELE, STAT5A, TNF, TNFAIP2, TRAF1, VCAM1
Claims (15)
- A method for predicting the treatment response of a subject suffering from inflammatory bowel disease (IBD) to treatment with an anti-TNFalpha compound based on the expression levels of three or more genes, wherein the expression levels of the three or more genes are selected from the group consisting of:ANGPTL4, BCL2L1, BCL2L11, BIRC3, CCL2, CCL22, CCL3, CCL4, CCL5, CCND1, CD274, CD44, CDKN2B, COL18A1, CTGF, CX3CL1, CXCL1, CXCL2, CXCL3, DKK1, DNMT1, ENPP2, FGF2, FOS, FSCN1, GADD45B, GLRX, HIF1A, HMGA2, HNF1A, HSP90AB1, HSP90B1, ICAM1, IFNG, IL11, IL10, IL1B, IL6, IL8, IRF1, INPP5D, JUNB, KIAA1199, LEF1, MCL1, MMP1, MMP2, MMP3, MMP9, MYC, NFKB2, NFKBIA, NFKBIE, NOS2, OVOL1, PDGFB, PLAU, PLAUR, PTGS2, PTHLH, SAA1, SELE, SERPINE1, SKIL, SMAD4, SNAI2, STAT1, STAT5A, TBX3, TCF7L2, TIMP1, TNF, TNFAIP2, TNFRSF1B, TRAF1, TWIST1, VCAM1, VEGFA, VIM, and ZEB1, andwherein an increased expression level of CDKN2B, HMGA2, OVOL1, SMAD4, BCL2L11, HNF1A or TCF7L2, or a decreased expression level of any of the other genes corresponds to a favorable treatment response, andwherein a decreased expression level of CDKN2B, HMGA2, OVOL1, SMAD4, BCL2L11, HNF1A or TCF7L2, or an increased expression level of any of the other genes corresponds to a not favorable treatment response.
- Method according to claim 1, wherein the expression levels of the three or more genes are selected from the group consisting of:
ANGPTL4, BCL2L1, BIRC3, CCL2, CCL22, CCL3, CCL4, CCL5, CCND1, CD274, CD44, CDKN2B, COL18A1, CTGF, CX3CL1, CXCL1, CXCL2, CXCL3, DKK1, FGF2, FSCN1, GADD45B, GLRX, HIF1A, HSP90B1, ICAM1, IFNG, IL11, IL1B, IL6, IL8, INPP5D, IRF1, JUNB, KIAA1199, MCL1, MMP1, MMP2, MMP3, MMP9, NFKB2, NFKBIA, NFKBIE, PLAU, PLAUR, PTGS2, PTHLH, SELE, SERPINE1, SNAI2, STAT1, STAT5A, TBX3, TIMP1, TNF, TNFAIP2, TNFRSF1B, TRAF1, TWIST1, VCAM1, VIM, ZEB1. - Method according to any one of the preceding claims, wherein the three or more expression levels are combined by adding up their relative expression levels, with the proviso that the expression levels of the genes CDKN2B, HMGA2, OVOL1, SMAD4, BCL2L11, HNF1A or TCF7L2 are multiplied with a weight factor of -1,
preferably wherein the combined expression levels are compared to a threshold value to determine whether the treatment response is favorable or not favorable, wherein the treatment response is predicted to be favorable when the combined three or more expression levels are below the threshold value, and wherein the treatment response is predicted to be unfavorable when the combined three or more expression levels are above the threshold value. - Method according to any one of the preceding claims, wherein the IBD is Ulcerative Colitis (UC) or Crohn Disease (CD).
- A method for determining the effectiveness of a treatment of a subject suffering from IBD with an anti-TNFalpha compound based on the expression levels of two or more genes,
wherein if the IBD is UC, the two or more genes are selected from the group consisting of BCL2L11, CDKN1A, DNMT1, EAF2, ELL2, ENPP2, FKBP5, GLRX, LCP1, MMP1, MMP3, MMP9, PLAU, PLAUR, PMEPA1, PRKACB, PTGS2, SERPINE1, SGK1, TIMP1, TMPRSS2 and VIM; or
wherein the IBD is CD, the two or more genes are selected from the group consisting of BCL2L1, BCL2L11, BIRC3, CCL2, CCL22, CCL3, CCL4, CCL5, CX3CL1, CXCL1, CXCL2, CXCL3, DNMT1, ENPP2, GLRX, ICAM1, IL1B, IL6, IL8, IRF1, MMP1, MMP3, MMP9, NFKB2, NFKBIA, NFKBIE, PLAU, PLAUR, PTGS2, SELE, SERPINE1, STAT5A, TIMP1, TNF, TNFAIP2, TRAF1, VCAM1 and VIM;
wherein the two or more expression levels are used to determine whether the treatment of IBD in the patient with an anti-TNFalpha compound is effective or not effective,
wherein a decreased expression level of BCL2L11 or PRKACB or an increased expression level of any of the other genes corresponds to a not effective treatment, and
wherein an increased expression level of BCL2L11 or PRKACB or a decreased expression level of any of the other genes corresponds to an effective treatment. - Method according to claim 5, wherein:wherein if the IBD is UC and the two or more genes are selected from the group consisting of EAF2, ELL2, FKBP5, GLRX, LCP1, MMP1, MMP3, MMP9, PLAU, PLAUR, PMEPA1, PTGS2, SERPINE1, TIMP1, TMPRSS2 and VIM; orwherein if the IBD is CD and the two or more genes are selected from the group consisting of BCL2L1, BIRC3, CCL2, CCL22, CCL3, CCL4, CCL5, CX3CL1, CXCL1, CXCL2, CXCL3, GLRX, ICAM1, IL1B, IL6, IL8, IRF1, MMP1, MMP3, MMP9, NFKB2, NFKBIA, NFKBIE, PLAU, PLAUR, PTGS2, SELE, SERPINE1, STAT5A, TIMP1, TNF, TNFAIP2, TRAF1, VCAM1 and VIM.
- Method according to claim 5 or 6 , wherein the two or more expression levels are combined by adding up their relative expression levels, with the proviso that the expression levels of the genes BCL2L11 or PRKACB are multiplied with a weight factor of - 1,
preferably wherein the combined expression levels are compared to a threshold value to determine whether the treatment is effective or not effective, wherein the treatment is predicted to be effective when the combined two or more expression levels are below the threshold value, and wherein the treatment is predicted not to be effective when the combined two or more expression levels are above the threshold value. - Method according to any one of the preceding claims, wherein the threshold value is independently determined from one or more reference samples.
- Method according to any one of the preceding claims, wherein the sample obtained from the subject is a gastric, colon, intestinal or rectal sample.
- Method according to any one of the preceding claims, wherein the method further includes determining the expression levels of the target genes based on mRNA extracted from the sample obtained from the subject, preferably wherein the method further includes extracting the mRNA from the sample obtained from the subject.
- An anti-TNFalpha compound for use of in the treatment of IBD in a subject, wherein the use comprises:performing the method as defined in any one of the preceding claims to determine the treatment response of the subject to anti-TNFalpha treatment, andadministering the anti-TNFalpha compound of the treatment response to anti-TNFalpha treatment is found to be favorable for the subject.
- Anti-TNFalpha compound for use according to claim 11, wherein the IBD is UC or CD.
- Anti-TNFalpha compound for use according to claim 11 or 12, wherein the anti-TNFalpha compound is selected from the group consisting of antibody based compounds Adalimumab, Certolizumab, Etanercept, Golimumab, Infliximab, or a biosimilar or a chimeric product of any of the preceding compounds such as the CT-P13 Infliximab biosimilar, or small molecule based compounds thalidomide, lenalidomide, pomalidomide, a xanthane derivative such as pentoxifylline, bupropion, an 5-HT2A agonist such as (R)DOI, TCB2, LSD and LA-SS-Az, curcumin, catechins, cannabidiol or Echinacea purpurea.
- Kit of parts comprising primers and probes for the detection of the expression levels of three or more target genes, wherein the expression levels of the three or more genes are selected from:the group consisting of ANGPTL4, BCL2L1, BCL2L11, BIRC3, CCL2, CCL22, CCL3, CCL4, CCL5, CCND1, CD274, CD44, CDKN2B, COL18A1, CTGF, CX3CL1, CXCL1, CXCL2, CXCL3, DKK1, DNMT1, ENPP2, FGF2, FOS, FSCN1, GADD45B, GLRX, HIF1A, HMGA2, HNF1A, HSP90AB1, HSP90B1, ICAM1, IFNG, IL11, IL10, IL1B, IL6, IL8, IRF1, INPP5D, JUNB, KIAA1199, LEF1, MCL1, MMP1, MMP2, MMP3, MMP9, MYC, NFKB2, NFKBIA, NFKBIE, NOS2, OVOL1, PDGFB, PLAU, PLAUR, PTGS2, PTHLH, SAA1, SELE, SERPINE1, SKIL, SMAD4, SNAI2, STAT1, STAT5A, TBX3, TCF7L2, TIMP1, TNF, TNFAIP2, TNFRSF1B, TRAF1, TWIST1, VCAM1, VEGFA, VIM, and ZEB1; orthe group consisting of BCL2L11, CDKN1A, DNMT1, EAF2, ELL2, ENPP2, FKBP5, GLRX, LCP1, MMP1, MMP3, MMP9, PLAU, PLAUR, PMEPA1, PRKACB, PTGS2, SERPINE1, SGK1, TIMP1, TMPRSS2 and VIM; orthe group consisting of BCL2L1, BCL2L11, BIRC3, CCL2, CCL22, CCL3, CCL4, CCL5, CX3CL1, CXCL1, CXCL2, CXCL3, DNMT1, ENPP2, GLRX, ICAM1, IL1B, IL6, IL8, IRF1, MMP1, MMP3, MMP9, NFKB2, NFKBIA, NFKBIE, PLAU, PLAUR, PTGS2, SELE, SERPINE1, STAT5A, TIMP1, TNF, TNFAIP2, TRAF1, VCAM1 and VIM.
- Use of the kit according to claim 14 in a method as defined in any one of claims 1 to 10.
Priority Applications (3)
| Application Number | Priority Date | Filing Date | Title |
|---|---|---|---|
| EP20214794.8A EP4015651A1 (en) | 2020-12-17 | 2020-12-17 | Treatment prediction and effectiveness of anti-tnf alpha treatment in ibd patients |
| US18/268,303 US20240043930A1 (en) | 2020-12-17 | 2021-12-09 | Treatment prediction and effectiveness of anti-tnf alpha treatment in ibd patients |
| PCT/EP2021/084880 WO2022128708A1 (en) | 2020-12-17 | 2021-12-09 | Treatment prediction and effectiveness of anti-tnf alpha treatment in ibd patients |
Applications Claiming Priority (1)
| Application Number | Priority Date | Filing Date | Title |
|---|---|---|---|
| EP20214794.8A EP4015651A1 (en) | 2020-12-17 | 2020-12-17 | Treatment prediction and effectiveness of anti-tnf alpha treatment in ibd patients |
Publications (1)
| Publication Number | Publication Date |
|---|---|
| EP4015651A1 true EP4015651A1 (en) | 2022-06-22 |
Family
ID=73855209
Family Applications (1)
| Application Number | Title | Priority Date | Filing Date |
|---|---|---|---|
| EP20214794.8A Withdrawn EP4015651A1 (en) | 2020-12-17 | 2020-12-17 | Treatment prediction and effectiveness of anti-tnf alpha treatment in ibd patients |
Country Status (3)
| Country | Link |
|---|---|
| US (1) | US20240043930A1 (en) |
| EP (1) | EP4015651A1 (en) |
| WO (1) | WO2022128708A1 (en) |
Cited By (1)
| Publication number | Priority date | Publication date | Assignee | Title |
|---|---|---|---|---|
| WO2022190036A3 (en) * | 2021-03-12 | 2022-10-20 | Janssen Biotech, Inc. | Methods for predicting treatment response in ulcerative colitis |
Citations (19)
| Publication number | Priority date | Publication date | Assignee | Title |
|---|---|---|---|---|
| WO2008147938A2 (en) * | 2007-05-24 | 2008-12-04 | Centocor, Inc. | Wnt5a as an inflammatory disease marker |
| WO2009117791A2 (en) * | 2008-03-28 | 2009-10-01 | Katholieke Universiteit Leuven | Mucosal gene signatures |
| WO2013011479A2 (en) | 2011-07-19 | 2013-01-24 | Koninklijke Philips Electronics N.V. | Assessment of cellular signaling pathway activity using probabilistic modeling of target gene expression |
| WO2014102668A2 (en) | 2012-12-26 | 2014-07-03 | Koninklijke Philips N.V. | Assessment of cellular signaling pathway activity using linear combination(s) of target gene expressions; |
| WO2014174003A1 (en) | 2013-04-26 | 2014-10-30 | Koninklijke Philips N.V. | Medical prognosis and prediction of treatment response using multiple cellular signalling pathway activities |
| WO2015101635A1 (en) | 2014-01-03 | 2015-07-09 | Koninklijke Philips N.V. | Assessment of the pi3k cellular signaling pathway activity using mathematical modelling of target gene expression. |
| WO2016062892A1 (en) | 2014-10-24 | 2016-04-28 | Koninklijke Philips N.V. | Medical prognosis and prediction of treatment response using multiple cellular signaling pathway activities |
| WO2016062893A1 (en) | 2014-10-24 | 2016-04-28 | Koninklijke Philips N.V. | Medical prognosis and prediction of treatment response using multiple cellular signaling pathway activities |
| WO2016062891A1 (en) | 2014-10-24 | 2016-04-28 | Koninklijke Philips N.V. | ASSESSMENT OF TGF-β CELLULAR SIGNALING PATHWAY ACTIVITY USING MATHEMATICAL MODELLING OF TARGET GENE EXPRESSION |
| WO2016179469A1 (en) * | 2015-05-07 | 2016-11-10 | Abbvie Inc. | Methods and compositions for diagnosing and treating inflammatory bowel disease |
| WO2017029215A1 (en) | 2015-08-14 | 2017-02-23 | Koninklijke Philips N.V. | Assessment of nfkb cellular signaling pathway activity using mathematical modelling of target gene expression |
| WO2018096076A1 (en) | 2016-11-25 | 2018-05-31 | Koninklijke Philips N.V. | Method to distinguish tumor suppressive foxo activity from oxidative stress |
| WO2019018571A1 (en) * | 2017-07-18 | 2019-01-24 | Washington University | Methods and uses of inflammatory bowel disease biomarkers |
| WO2019068623A1 (en) | 2017-10-02 | 2019-04-11 | Koninklijke Philips N.V. | Determining functional status of immune cells types and immune response |
| WO2019068543A1 (en) | 2017-10-02 | 2019-04-11 | Koninklijke Philips N.V. | Assessment of jak-stat3 cellular signaling pathway activity using mathematical modelling of target gene expression |
| WO2019068585A1 (en) | 2017-10-02 | 2019-04-11 | Koninklijke Philips N.V. | Assessment of notch cellular signaling pathway activity using mathematical modelling of target gene expression |
| WO2019068562A1 (en) | 2017-10-02 | 2019-04-11 | Koninklijke Philips N.V. | Assessment of jak-stat1/2 cellular signaling pathway activity using mathematical modelling of target gene expression |
| WO2019120658A1 (en) | 2017-12-20 | 2019-06-27 | Koninklijke Philips N.V. | Assessment of mapk-ap 1 cellular signaling pathway activity using mathematical modelling of target gene expression |
| WO2020102519A1 (en) * | 2018-11-15 | 2020-05-22 | Janssen Biotech, Inc. | Methods and compositions for prediction of response to a therapy of an inflammatory bowel disease |
Family Cites Families (2)
| Publication number | Priority date | Publication date | Assignee | Title |
|---|---|---|---|---|
| JP2021518432A (en) * | 2018-03-16 | 2021-08-02 | サイファー メディシン コーポレイション | Methods and systems for predicting responsiveness to anti-TNF therapy |
| US20220364171A1 (en) * | 2018-11-23 | 2022-11-17 | Katholieke Universiteit Leuven | Predicting a treatment response in inflammatory bowel disease |
-
2020
- 2020-12-17 EP EP20214794.8A patent/EP4015651A1/en not_active Withdrawn
-
2021
- 2021-12-09 WO PCT/EP2021/084880 patent/WO2022128708A1/en active Application Filing
- 2021-12-09 US US18/268,303 patent/US20240043930A1/en active Pending
Patent Citations (19)
| Publication number | Priority date | Publication date | Assignee | Title |
|---|---|---|---|---|
| WO2008147938A2 (en) * | 2007-05-24 | 2008-12-04 | Centocor, Inc. | Wnt5a as an inflammatory disease marker |
| WO2009117791A2 (en) * | 2008-03-28 | 2009-10-01 | Katholieke Universiteit Leuven | Mucosal gene signatures |
| WO2013011479A2 (en) | 2011-07-19 | 2013-01-24 | Koninklijke Philips Electronics N.V. | Assessment of cellular signaling pathway activity using probabilistic modeling of target gene expression |
| WO2014102668A2 (en) | 2012-12-26 | 2014-07-03 | Koninklijke Philips N.V. | Assessment of cellular signaling pathway activity using linear combination(s) of target gene expressions; |
| WO2014174003A1 (en) | 2013-04-26 | 2014-10-30 | Koninklijke Philips N.V. | Medical prognosis and prediction of treatment response using multiple cellular signalling pathway activities |
| WO2015101635A1 (en) | 2014-01-03 | 2015-07-09 | Koninklijke Philips N.V. | Assessment of the pi3k cellular signaling pathway activity using mathematical modelling of target gene expression. |
| WO2016062892A1 (en) | 2014-10-24 | 2016-04-28 | Koninklijke Philips N.V. | Medical prognosis and prediction of treatment response using multiple cellular signaling pathway activities |
| WO2016062893A1 (en) | 2014-10-24 | 2016-04-28 | Koninklijke Philips N.V. | Medical prognosis and prediction of treatment response using multiple cellular signaling pathway activities |
| WO2016062891A1 (en) | 2014-10-24 | 2016-04-28 | Koninklijke Philips N.V. | ASSESSMENT OF TGF-β CELLULAR SIGNALING PATHWAY ACTIVITY USING MATHEMATICAL MODELLING OF TARGET GENE EXPRESSION |
| WO2016179469A1 (en) * | 2015-05-07 | 2016-11-10 | Abbvie Inc. | Methods and compositions for diagnosing and treating inflammatory bowel disease |
| WO2017029215A1 (en) | 2015-08-14 | 2017-02-23 | Koninklijke Philips N.V. | Assessment of nfkb cellular signaling pathway activity using mathematical modelling of target gene expression |
| WO2018096076A1 (en) | 2016-11-25 | 2018-05-31 | Koninklijke Philips N.V. | Method to distinguish tumor suppressive foxo activity from oxidative stress |
| WO2019018571A1 (en) * | 2017-07-18 | 2019-01-24 | Washington University | Methods and uses of inflammatory bowel disease biomarkers |
| WO2019068623A1 (en) | 2017-10-02 | 2019-04-11 | Koninklijke Philips N.V. | Determining functional status of immune cells types and immune response |
| WO2019068543A1 (en) | 2017-10-02 | 2019-04-11 | Koninklijke Philips N.V. | Assessment of jak-stat3 cellular signaling pathway activity using mathematical modelling of target gene expression |
| WO2019068585A1 (en) | 2017-10-02 | 2019-04-11 | Koninklijke Philips N.V. | Assessment of notch cellular signaling pathway activity using mathematical modelling of target gene expression |
| WO2019068562A1 (en) | 2017-10-02 | 2019-04-11 | Koninklijke Philips N.V. | Assessment of jak-stat1/2 cellular signaling pathway activity using mathematical modelling of target gene expression |
| WO2019120658A1 (en) | 2017-12-20 | 2019-06-27 | Koninklijke Philips N.V. | Assessment of mapk-ap 1 cellular signaling pathway activity using mathematical modelling of target gene expression |
| WO2020102519A1 (en) * | 2018-11-15 | 2020-05-22 | Janssen Biotech, Inc. | Methods and compositions for prediction of response to a therapy of an inflammatory bowel disease |
Non-Patent Citations (11)
| Title |
|---|
| BEN-HORIN S.KOPYLOV U.CHOWERS Y: "Optimizing anti-TNF treatments in inflammatory bowel disease", AUTOIMMUN. REV., vol. 13, 2014, pages 24 - 30 |
| CELESNIK A H ET AL: "P17.19C Epigenetic and gene expression changes in patients with Crohn's disease, and responsiveness to adalimumab therapy", EUROPEAN JOURNAL OF HUMAN GENETICS, 1 October 2018 (2018-10-01), pages 739, XP055809366, Retrieved from the Internet <URL:https://www.nature.com/articles/s41431-018-0247-7> * |
| COLOMBEL ET AL., N ENGL J MED, vol. 362, 2010, pages 1383 - 1395 |
| D'HAENS GRGEBOES KPEETERS MBAERT FPENNINCKX FRUTGEERTS P: "Early lesions of recurrent Crohn's disease caused by infusion of intestinal contents in excluded ileum", GASTROENTEROLOGY, vol. 114, no. 2, February 1998 (1998-02-01), pages 262 - 7, XP005139093, DOI: 10.1016/S0016-5085(98)70476-7 |
| D'HAENS, G: "Top-down therapy for IBD: rationale and requisite evidence", NAT REV GASTROENTEROL HEPATOL, vol. 7, 2010, pages 86 - 92, Retrieved from the Internet <URL:https://doi.org/10.1038/nrgastro.2009.222> |
| FLORIAN MARTIN ET AL: "Quantification of biological network perturbations for mechanistic insight and diagnostics using two-layer causal models", BMC BIOINFORMATICS, BIOMED CENTRAL , LONDON, GB, vol. 15, no. 1, 11 July 2014 (2014-07-11), pages 238, XP021193977, ISSN: 1471-2105, DOI: 10.1186/1471-2105-15-238 * |
| GEBOES, K ET AL.: "A reproducible grading scale for histological assessment of inflammation in ulcerative colitis", GUT, vol. 47, no. 3, 2000, pages 404 - 9 |
| LOPETUSO, LORIS RICCARDO ET AL.: "Can We Predict the Efficacy of Anti-TNF-a Agents?", INTERNATIONAL JOURNAL OF MOLECULAR SCIENCES, vol. 18, no. 9, 14 September 2017 (2017-09-14), pages 1973 |
| PHUA TERRI ET AL: "Angiopoietin-like 4 Mediates Colonic Inflammation by Regulating Chemokine Transcript Stability via Tristetraprolin", SCIENTIFIC REPORTS, vol. 7, no. 1, 1 June 2017 (2017-06-01), XP055809059, Retrieved from the Internet <URL:https://www.nature.com/articles/srep44351.pdf> DOI: 10.1038/srep44351 * |
| W VERHAEGH ET AL.: "Selection of personalized patient therapy through the use of knowledge-based computational models that identify tumor-driving signal transduction pathways", CANCER RESEARCH, vol. 74, no. 11, 2014, pages 2936 - 2945, XP055212377, DOI: 10.1158/0008-5472.CAN-13-2515 |
| W VERHAEGHA VAN DE STOLPE, ONCOTARGET, vol. 5, no. 14, 2014, pages 5196 |
Cited By (1)
| Publication number | Priority date | Publication date | Assignee | Title |
|---|---|---|---|---|
| WO2022190036A3 (en) * | 2021-03-12 | 2022-10-20 | Janssen Biotech, Inc. | Methods for predicting treatment response in ulcerative colitis |
Also Published As
| Publication number | Publication date |
|---|---|
| US20240043930A1 (en) | 2024-02-08 |
| WO2022128708A1 (en) | 2022-06-23 |
Similar Documents
| Publication | Publication Date | Title |
|---|---|---|
| EP3430171B1 (en) | Detection and treatment of anti-pd-1 therapy resistant metastatic melanomas | |
| US11434522B1 (en) | Detection of chromosome interactions | |
| US9315869B2 (en) | Marker for predicting gastric cancer prognosis and method for predicting gastric cancer prognosis using the same | |
| EP3334837B1 (en) | Assessment of nfkb cellular signaling pathway activity using mathematical modelling of target gene expression | |
| Costello et al. | Dissection of the inflammatory bowel disease transcriptome using genome-wide cDNA microarrays | |
| D’Errico et al. | Genome-wide expression profile of sporadic gastric cancers with microsatellite instability | |
| US8492328B2 (en) | Biomarkers and methods for determining sensitivity to insulin growth factor-1 receptor modulators | |
| CN113025713B (en) | Use of biomarkers for predicting the sensitivity of a tumor patient to a specific anti-tumor drug | |
| CA3077501A1 (en) | Determining functional status of immune cells types and immune response | |
| US20220162705A1 (en) | Method for predicting the response to cancer immunotherapy in cancer patients | |
| KR20180126085A (en) | CHECKPOINT FAILURE AND METHODS THEREFOR | |
| US20240043930A1 (en) | Treatment prediction and effectiveness of anti-tnf alpha treatment in ibd patients | |
| US10597728B2 (en) | Methylation site regulating expression of mda-9/syntenin | |
| KR20210091244A (en) | Methods and compositions for prediction of response to therapy for inflammatory bowel disease | |
| US20110236396A1 (en) | Methods and compositions for diagnosing and treating a colorectal adenocarcinoma | |
| WO2018160880A1 (en) | Compositions and methods for detecting sessile serrated adenomas/polyps | |
| EP3093343B1 (en) | Method for assessing lymph node metastatic potential of endometrial cancer | |
| JP6784673B2 (en) | How to determine the survival prognosis of patients with pancreatic cancer | |
| US20230111281A1 (en) | Identification of the cellular function of an active nfkb pathway | |
| US20200181706A1 (en) | Biomarkers for assessing the response status for treatment of inflammatory condition or disease affecting the digestive tract such as inflammatory bowel disease in human patients | |
| US20230340601A1 (en) | Transcriptome Analysis For Treating Inflammation | |
| CA3219846A1 (en) | Anti-il-23p19 antibody regulation of genes involved in ulcerative colitis | |
| US20230098637A1 (en) | Prognostic pathways for high risk sepsis patients | |
| US20230326551A1 (en) | Methods for estimating hetergeneity of a tumour based on values for two or more genome mutation and/or gene expression related parameter, as well as corresponding devices | |
| WO2022189530A1 (en) | Prognostic pathways for high risk sepsis patients |
Legal Events
| Date | Code | Title | Description |
|---|---|---|---|
| PUAI | Public reference made under article 153(3) epc to a published international application that has entered the european phase |
Free format text: ORIGINAL CODE: 0009012 |
|
| STAA | Information on the status of an ep patent application or granted ep patent |
Free format text: STATUS: THE APPLICATION HAS BEEN PUBLISHED |
|
| AK | Designated contracting states |
Kind code of ref document: A1 Designated state(s): AL AT BE BG CH CY CZ DE DK EE ES FI FR GB GR HR HU IE IS IT LI LT LU LV MC MK MT NL NO PL PT RO RS SE SI SK SM TR |
|
| STAA | Information on the status of an ep patent application or granted ep patent |
Free format text: STATUS: THE APPLICATION IS DEEMED TO BE WITHDRAWN |
|
| 18D | Application deemed to be withdrawn |
Effective date: 20221223 |