EP4001437A1 - Methods for selecting therapy for a cancer patient - Google Patents
Methods for selecting therapy for a cancer patient Download PDFInfo
- Publication number
- EP4001437A1 EP4001437A1 EP21217161.5A EP21217161A EP4001437A1 EP 4001437 A1 EP4001437 A1 EP 4001437A1 EP 21217161 A EP21217161 A EP 21217161A EP 4001437 A1 EP4001437 A1 EP 4001437A1
- Authority
- EP
- European Patent Office
- Prior art keywords
- cell
- cancer
- genes
- cells
- patient
- Prior art date
- Legal status (The legal status is an assumption and is not a legal conclusion. Google has not performed a legal analysis and makes no representation as to the accuracy of the status listed.)
- Withdrawn
Links
- 206010028980 Neoplasm Diseases 0.000 title claims abstract description 258
- 201000011510 cancer Diseases 0.000 title claims abstract description 211
- 238000000034 method Methods 0.000 title claims abstract description 120
- 238000002560 therapeutic procedure Methods 0.000 title claims abstract description 57
- 210000004027 cell Anatomy 0.000 claims abstract description 430
- 108090000623 proteins and genes Proteins 0.000 claims abstract description 306
- 210000001744 T-lymphocyte Anatomy 0.000 claims abstract description 226
- 230000035772 mutation Effects 0.000 claims abstract description 113
- 101000578784 Homo sapiens Melanoma antigen recognized by T-cells 1 Proteins 0.000 claims abstract description 31
- 102100028389 Melanoma antigen recognized by T-cells 1 Human genes 0.000 claims abstract description 31
- 102100030984 Lymphocyte function-associated antigen 3 Human genes 0.000 claims abstract description 29
- 101001063392 Homo sapiens Lymphocyte function-associated antigen 3 Proteins 0.000 claims abstract description 28
- 102100021295 Bardet-Biedl syndrome 1 protein Human genes 0.000 claims abstract description 25
- 101000894722 Homo sapiens Bardet-Biedl syndrome 1 protein Proteins 0.000 claims abstract description 25
- 102100030346 Antigen peptide transporter 1 Human genes 0.000 claims abstract description 24
- 102100030343 Antigen peptide transporter 2 Human genes 0.000 claims abstract description 24
- 108010023335 Member 2 Subfamily B ATP Binding Cassette Transporter Proteins 0.000 claims abstract description 23
- 101800000849 Tachykinin-associated peptide 2 Proteins 0.000 claims abstract description 23
- 101000997832 Homo sapiens Tyrosine-protein kinase JAK2 Proteins 0.000 claims abstract description 21
- 102100033444 Tyrosine-protein kinase JAK2 Human genes 0.000 claims abstract description 21
- 108010044012 STAT1 Transcription Factor Proteins 0.000 claims abstract description 19
- 102100029904 Signal transducer and activator of transcription 1-alpha/beta Human genes 0.000 claims abstract description 19
- 102100021308 60S ribosomal protein L23 Human genes 0.000 claims abstract description 18
- 101000649068 Homo sapiens Tapasin Proteins 0.000 claims abstract description 18
- 102100028082 Tapasin Human genes 0.000 claims abstract description 18
- 102100028966 HLA class I histocompatibility antigen, alpha chain F Human genes 0.000 claims abstract description 17
- 101000675833 Homo sapiens 60S ribosomal protein L23 Proteins 0.000 claims abstract description 17
- 101000735881 Homo sapiens Proteasome subunit beta type-5 Proteins 0.000 claims abstract description 17
- 102100036127 Proteasome subunit beta type-5 Human genes 0.000 claims abstract description 17
- 102100028256 Collagen alpha-1(XVII) chain Human genes 0.000 claims abstract description 16
- 101000860679 Homo sapiens Collagen alpha-1(XVII) chain Proteins 0.000 claims abstract description 16
- 101000986080 Homo sapiens HLA class I histocompatibility antigen, alpha chain F Proteins 0.000 claims abstract description 16
- 101000599852 Homo sapiens Intercellular adhesion molecule 1 Proteins 0.000 claims abstract description 16
- 101000984198 Homo sapiens Leukocyte immunoglobulin-like receptor subfamily A member 1 Proteins 0.000 claims abstract description 16
- 101000984200 Homo sapiens Leukocyte immunoglobulin-like receptor subfamily A member 3 Proteins 0.000 claims abstract description 16
- 102100037877 Intercellular adhesion molecule 1 Human genes 0.000 claims abstract description 16
- 102100025587 Leukocyte immunoglobulin-like receptor subfamily A member 1 Human genes 0.000 claims abstract description 16
- 102100025556 Leukocyte immunoglobulin-like receptor subfamily A member 3 Human genes 0.000 claims abstract description 16
- 102100022406 60S ribosomal protein L10a Human genes 0.000 claims abstract description 15
- 102100032557 C-type lectin domain family 1 member A Human genes 0.000 claims abstract description 15
- 102100023942 G-protein-signaling modulator 3 Human genes 0.000 claims abstract description 15
- 102100034265 GEM-interacting protein Human genes 0.000 claims abstract description 15
- 101710102635 GEM-interacting protein Proteins 0.000 claims abstract description 15
- 101000755323 Homo sapiens 60S ribosomal protein L10a Proteins 0.000 claims abstract description 15
- 101000942282 Homo sapiens C-type lectin domain family 1 member A Proteins 0.000 claims abstract description 15
- 101000904749 Homo sapiens G-protein-signaling modulator 3 Proteins 0.000 claims abstract description 15
- 101001138062 Homo sapiens Leukocyte-associated immunoglobulin-like receptor 1 Proteins 0.000 claims abstract description 15
- 101001134172 Homo sapiens Otoancorin Proteins 0.000 claims abstract description 15
- 101000653005 Homo sapiens Thromboxane-A synthase Proteins 0.000 claims abstract description 15
- 101000625376 Homo sapiens Transcription initiation factor TFIID subunit 3 Proteins 0.000 claims abstract description 15
- 102100020943 Leukocyte-associated immunoglobulin-like receptor 1 Human genes 0.000 claims abstract description 15
- 102100034199 Otoancorin Human genes 0.000 claims abstract description 15
- 108090000920 TNF receptor-associated factor 1 Proteins 0.000 claims abstract description 15
- 102100030973 Thromboxane-A synthase Human genes 0.000 claims abstract description 15
- 102100025042 Transcription initiation factor TFIID subunit 3 Human genes 0.000 claims abstract description 15
- 102100029542 Beta-defensin 134 Human genes 0.000 claims abstract description 14
- 102100029375 Crk-like protein Human genes 0.000 claims abstract description 14
- 101000917471 Homo sapiens Beta-defensin 134 Proteins 0.000 claims abstract description 14
- 101000919315 Homo sapiens Crk-like protein Proteins 0.000 claims abstract description 14
- 101000957259 Homo sapiens Mitotic spindle assembly checkpoint protein MAD2A Proteins 0.000 claims abstract description 14
- 101000589802 Homo sapiens Pentatricopeptide repeat-containing protein 2, mitochondrial Proteins 0.000 claims abstract description 14
- 101000669667 Homo sapiens RNA-binding protein with serine-rich domain 1 Proteins 0.000 claims abstract description 14
- 101000762808 Homo sapiens Tapasin-related protein Proteins 0.000 claims abstract description 14
- 101000659324 Homo sapiens Twinfilin-1 Proteins 0.000 claims abstract description 14
- 108091065458 Homo sapiens miR-101-2 stem-loop Proteins 0.000 claims abstract description 14
- 102100038792 Mitotic spindle assembly checkpoint protein MAD2A Human genes 0.000 claims abstract description 14
- 102100032228 Pentatricopeptide repeat-containing protein 2, mitochondrial Human genes 0.000 claims abstract description 14
- 102100039323 RNA-binding protein with serine-rich domain 1 Human genes 0.000 claims abstract description 14
- 102100031877 Signal recognition particle 54 kDa protein Human genes 0.000 claims abstract description 14
- 102000004398 TNF receptor-associated factor 1 Human genes 0.000 claims abstract description 14
- 102100026714 Tapasin-related protein Human genes 0.000 claims abstract description 14
- 102100036223 Twinfilin-1 Human genes 0.000 claims abstract description 14
- 108091073053 Homo sapiens miR-548s stem-loop Proteins 0.000 claims abstract description 13
- 101710187184 Signal recognition particle 54 kDa protein Proteins 0.000 claims abstract description 13
- 101710150385 Signal recognition particle 54 kDa protein 1 Proteins 0.000 claims abstract description 13
- 101710150383 Signal recognition particle 54 kDa protein 2 Proteins 0.000 claims abstract description 13
- 101710150391 Signal recognition particle 54 kDa protein 3 Proteins 0.000 claims abstract description 13
- 101710128823 Signal recognition particle 54 kDa protein homolog Proteins 0.000 claims abstract description 13
- 102100038808 Transcription factor SOX-10 Human genes 0.000 claims abstract description 4
- 101000664703 Homo sapiens Transcription factor SOX-10 Proteins 0.000 claims abstract 3
- 108090000765 processed proteins & peptides Proteins 0.000 claims description 109
- 229920001184 polypeptide Polymers 0.000 claims description 103
- 102000004196 processed proteins & peptides Human genes 0.000 claims description 103
- 108020004999 messenger RNA Proteins 0.000 claims description 66
- 238000002659 cell therapy Methods 0.000 claims description 51
- 230000007423 decrease Effects 0.000 claims description 31
- 108091032973 (ribonucleotides)n+m Proteins 0.000 claims description 28
- 230000010782 T cell mediated cytotoxicity Effects 0.000 claims description 28
- 238000011282 treatment Methods 0.000 claims description 26
- 230000003247 decreasing effect Effects 0.000 claims description 25
- 108091008874 T cell receptors Proteins 0.000 claims description 22
- 102000016266 T-Cell Antigen Receptors Human genes 0.000 claims description 22
- 238000009169 immunotherapy Methods 0.000 claims description 22
- 108020004414 DNA Proteins 0.000 claims description 8
- 238000012163 sequencing technique Methods 0.000 claims description 8
- 238000012217 deletion Methods 0.000 claims description 6
- 239000003112 inhibitor Substances 0.000 claims description 6
- 210000000822 natural killer cell Anatomy 0.000 claims description 6
- 230000037430 deletion Effects 0.000 claims description 5
- 229940079593 drug Drugs 0.000 claims description 5
- 239000003814 drug Substances 0.000 claims description 5
- 238000003780 insertion Methods 0.000 claims description 5
- 230000037431 insertion Effects 0.000 claims description 5
- 230000004777 loss-of-function mutation Effects 0.000 claims description 5
- 210000003719 b-lymphocyte Anatomy 0.000 claims description 3
- 229940022399 cancer vaccine Drugs 0.000 claims description 3
- 238000002512 chemotherapy Methods 0.000 claims description 3
- 230000037433 frameshift Effects 0.000 claims description 3
- 238000001415 gene therapy Methods 0.000 claims description 3
- 238000001959 radiotherapy Methods 0.000 claims description 3
- 238000002271 resection Methods 0.000 claims description 3
- 108091008803 APLNR Proteins 0.000 abstract description 60
- 102000016555 Apelin receptors Human genes 0.000 abstract description 60
- 230000001404 mediated effect Effects 0.000 abstract description 28
- 230000001461 cytolytic effect Effects 0.000 abstract description 25
- 238000012216 screening Methods 0.000 abstract description 8
- 230000014509 gene expression Effects 0.000 description 89
- 210000004881 tumor cell Anatomy 0.000 description 58
- 102100025570 Cancer/testis antigen 1 Human genes 0.000 description 44
- 238000012360 testing method Methods 0.000 description 43
- 101000856237 Homo sapiens Cancer/testis antigen 1 Proteins 0.000 description 42
- 230000009089 cytolysis Effects 0.000 description 42
- 108091033409 CRISPR Proteins 0.000 description 35
- 238000010354 CRISPR gene editing Methods 0.000 description 32
- 238000003501 co-culture Methods 0.000 description 32
- 102000004169 proteins and genes Human genes 0.000 description 30
- 230000004083 survival effect Effects 0.000 description 28
- 239000012636 effector Substances 0.000 description 27
- 201000001441 melanoma Diseases 0.000 description 26
- 201000009188 Bardet-Biedl syndrome 1 Diseases 0.000 description 22
- 241000699670 Mus sp. Species 0.000 description 22
- 241000282414 Homo sapiens Species 0.000 description 21
- 239000013642 negative control Substances 0.000 description 21
- 238000003556 assay Methods 0.000 description 20
- 230000000694 effects Effects 0.000 description 19
- 101000937544 Homo sapiens Beta-2-microglobulin Proteins 0.000 description 18
- 238000004458 analytical method Methods 0.000 description 18
- 102100027314 Beta-2-microglobulin Human genes 0.000 description 17
- RXWNCPJZOCPEPQ-NVWDDTSBSA-N puromycin Chemical compound C1=CC(OC)=CC=C1C[C@H](N)C(=O)N[C@H]1[C@@H](O)[C@H](N2C3=NC=NC(=C3N=C2)N(C)C)O[C@@H]1CO RXWNCPJZOCPEPQ-NVWDDTSBSA-N 0.000 description 16
- 108010042407 Endonucleases Proteins 0.000 description 15
- 239000000523 sample Substances 0.000 description 15
- 102100031780 Endonuclease Human genes 0.000 description 14
- 102000039446 nucleic acids Human genes 0.000 description 14
- 108020004707 nucleic acids Proteins 0.000 description 14
- 150000007523 nucleic acids Chemical class 0.000 description 14
- 230000037361 pathway Effects 0.000 description 14
- 230000011664 signaling Effects 0.000 description 14
- 101000997835 Homo sapiens Tyrosine-protein kinase JAK1 Proteins 0.000 description 13
- 102100033438 Tyrosine-protein kinase JAK1 Human genes 0.000 description 13
- 230000015556 catabolic process Effects 0.000 description 13
- 208000006265 Renal cell carcinoma Diseases 0.000 description 12
- 239000000427 antigen Substances 0.000 description 12
- 230000002596 correlated effect Effects 0.000 description 12
- 230000008685 targeting Effects 0.000 description 12
- 102000018746 Apelin Human genes 0.000 description 11
- 108010052412 Apelin Proteins 0.000 description 11
- 108010002350 Interleukin-2 Proteins 0.000 description 11
- 102000000588 Interleukin-2 Human genes 0.000 description 11
- 108091007433 antigens Proteins 0.000 description 11
- 102000036639 antigens Human genes 0.000 description 11
- BWVPHIKGXQBZPV-QKFDDRBGSA-N apelin Chemical compound NCC(=O)N[C@@H](CO)C(=O)N[C@@H](CC(C)C)C(=O)N[C@@H](CCSC)C(=O)N1CCC[C@H]1C(=O)N[C@@H](CC(C)C)C(=O)N1[C@H](C(=O)N[C@@H](CC(O)=O)C(=O)NCC(=O)N[C@@H](CC(N)=O)C(=O)NCC(=O)N[C@@H](CC(C)C)C(=O)N[C@@H](CCC(O)=O)C(=O)N[C@@H](CC(O)=O)C(=O)NCC(=O)N[C@@H](CC(N)=O)C(=O)N[C@@H](C(C)C)C(=O)N[C@@H](CCCNC(N)=N)C(=O)N[C@@H](CC=2NC=NC=2)C(=O)N[C@@H](CC(C)C)C(=O)N[C@@H](C(C)C)C(=O)N[C@@H](CCC(N)=O)C(=O)N2[C@@H](CCC2)C(=O)N[C@@H](CCCNC(N)=N)C(=O)NCC(=O)N[C@@H](CO)C(=O)N[C@@H](CCCNC(N)=N)C(=O)N[C@@H](CC(N)=O)C(=O)NCC(=O)N2[C@@H](CCC2)C(=O)NCC(=O)N2[C@@H](CCC2)C(=O)N[C@@H](CC=2C3=CC=CC=C3NC=2)C(=O)N[C@@H](CCC(N)=O)C(=O)NCC(=O)NCC(=O)N[C@@H](CCCNC(N)=N)C(=O)N[C@@H](CCCNC(N)=N)C(=O)N[C@@H](CCCCN)C(=O)N[C@@H](CC=2C=CC=CC=2)C(=O)N[C@@H](CCCNC(N)=N)C(=O)N[C@@H](CCCNC(N)=N)C(=O)N[C@@H](CCC(N)=O)C(=O)N[C@@H](CCCNC(N)=N)C(=O)N2[C@@H](CCC2)C(=O)N[C@@H](CCCNC(N)=N)C(=O)N[C@@H](CC(C)C)C(=O)N[C@@H](CO)C(=O)N[C@@H](CC=2NC=NC=2)C(=O)N[C@@H](CCCCN)C(=O)NCC(=O)N2[C@@H](CCC2)C(=O)N[C@@H](CCSC)C(=O)N2[C@@H](CCC2)C(=O)N[C@@H](CC=2C=CC=CC=2)C(O)=O)CCC1 BWVPHIKGXQBZPV-QKFDDRBGSA-N 0.000 description 11
- 239000006228 supernatant Substances 0.000 description 11
- 108010075704 HLA-A Antigens Proteins 0.000 description 10
- 102000011786 HLA-A Antigens Human genes 0.000 description 10
- 102000025850 HLA-A2 Antigen Human genes 0.000 description 10
- 108010074032 HLA-A2 Antigen Proteins 0.000 description 10
- -1 SOX10 Proteins 0.000 description 10
- 230000030741 antigen processing and presentation Effects 0.000 description 10
- 238000001943 fluorescence-activated cell sorting Methods 0.000 description 10
- 230000002829 reductive effect Effects 0.000 description 10
- 230000008859 change Effects 0.000 description 9
- 238000009826 distribution Methods 0.000 description 9
- 229950010131 puromycin Drugs 0.000 description 9
- 239000013598 vector Substances 0.000 description 9
- 108020005004 Guide RNA Proteins 0.000 description 8
- 102000014150 Interferons Human genes 0.000 description 8
- 108010050904 Interferons Proteins 0.000 description 8
- 230000006037 cell lysis Effects 0.000 description 8
- 238000002474 experimental method Methods 0.000 description 8
- 239000013612 plasmid Substances 0.000 description 8
- 230000003612 virological effect Effects 0.000 description 8
- 206010057248 Cell death Diseases 0.000 description 7
- 102000001398 Granzyme Human genes 0.000 description 7
- 108060005986 Granzyme Proteins 0.000 description 7
- 108010056995 Perforin Proteins 0.000 description 7
- 102000004503 Perforin Human genes 0.000 description 7
- 238000012258 culturing Methods 0.000 description 7
- 210000003819 peripheral blood mononuclear cell Anatomy 0.000 description 7
- 238000003752 polymerase chain reaction Methods 0.000 description 7
- 230000028327 secretion Effects 0.000 description 7
- 238000012546 transfer Methods 0.000 description 7
- 238000010200 validation analysis Methods 0.000 description 7
- 108010089791 Eukaryotic Initiation Factor-2 Proteins 0.000 description 6
- 102000008014 Eukaryotic Initiation Factor-2 Human genes 0.000 description 6
- 101001094545 Homo sapiens Retrotransposon-like protein 1 Proteins 0.000 description 6
- 238000011467 adoptive cell therapy Methods 0.000 description 6
- 230000004071 biological effect Effects 0.000 description 6
- 230000000875 corresponding effect Effects 0.000 description 6
- 238000001114 immunoprecipitation Methods 0.000 description 6
- 230000003993 interaction Effects 0.000 description 6
- 229940079322 interferon Drugs 0.000 description 6
- 239000002609 medium Substances 0.000 description 6
- 238000010361 transduction Methods 0.000 description 6
- 230000026683 transduction Effects 0.000 description 6
- 102100038902 Caspase-7 Human genes 0.000 description 5
- 238000002965 ELISA Methods 0.000 description 5
- 101000741014 Homo sapiens Caspase-7 Proteins 0.000 description 5
- 101000716102 Homo sapiens T-cell surface glycoprotein CD4 Proteins 0.000 description 5
- 101000946843 Homo sapiens T-cell surface glycoprotein CD8 alpha chain Proteins 0.000 description 5
- 108700011259 MicroRNAs Proteins 0.000 description 5
- 238000003559 RNA-seq method Methods 0.000 description 5
- 108091027967 Small hairpin RNA Proteins 0.000 description 5
- 102100036011 T-cell surface glycoprotein CD4 Human genes 0.000 description 5
- 102100034922 T-cell surface glycoprotein CD8 alpha chain Human genes 0.000 description 5
- 241000700605 Viruses Species 0.000 description 5
- 230000001413 cellular effect Effects 0.000 description 5
- 230000001419 dependent effect Effects 0.000 description 5
- LOKCTEFSRHRXRJ-UHFFFAOYSA-I dipotassium trisodium dihydrogen phosphate hydrogen phosphate dichloride Chemical compound P(=O)(O)(O)[O-].[K+].P(=O)(O)([O-])[O-].[Na+].[Na+].[Cl-].[K+].[Cl-].[Na+] LOKCTEFSRHRXRJ-UHFFFAOYSA-I 0.000 description 5
- 238000000684 flow cytometry Methods 0.000 description 5
- 238000011534 incubation Methods 0.000 description 5
- 229960005386 ipilimumab Drugs 0.000 description 5
- 210000004379 membrane Anatomy 0.000 description 5
- 239000012528 membrane Substances 0.000 description 5
- 239000002953 phosphate buffered saline Substances 0.000 description 5
- 239000000047 product Substances 0.000 description 5
- 238000011084 recovery Methods 0.000 description 5
- 239000004055 small Interfering RNA Substances 0.000 description 5
- 238000001890 transfection Methods 0.000 description 5
- 238000001262 western blot Methods 0.000 description 5
- 238000010453 CRISPR/Cas method Methods 0.000 description 4
- 102100026548 Caspase-8 Human genes 0.000 description 4
- 102100039498 Cytotoxic T-lymphocyte protein 4 Human genes 0.000 description 4
- 239000006144 Dulbecco’s modified Eagle's medium Substances 0.000 description 4
- 101000983528 Homo sapiens Caspase-8 Proteins 0.000 description 4
- 101000889276 Homo sapiens Cytotoxic T-lymphocyte protein 4 Proteins 0.000 description 4
- 108091028043 Nucleic acid sequence Proteins 0.000 description 4
- 230000005867 T cell response Effects 0.000 description 4
- 108060008682 Tumor Necrosis Factor Proteins 0.000 description 4
- 230000015572 biosynthetic process Effects 0.000 description 4
- 238000005119 centrifugation Methods 0.000 description 4
- 238000006243 chemical reaction Methods 0.000 description 4
- 238000001514 detection method Methods 0.000 description 4
- 239000012091 fetal bovine serum Substances 0.000 description 4
- 230000006801 homologous recombination Effects 0.000 description 4
- 238000002744 homologous recombination Methods 0.000 description 4
- 238000000338 in vitro Methods 0.000 description 4
- 238000012750 in vivo screening Methods 0.000 description 4
- 230000007246 mechanism Effects 0.000 description 4
- 230000004060 metabolic process Effects 0.000 description 4
- 108010085238 Actins Proteins 0.000 description 3
- 102000007469 Actins Human genes 0.000 description 3
- 102100026693 FAS-associated death domain protein Human genes 0.000 description 3
- 206010064571 Gene mutation Diseases 0.000 description 3
- 102000008949 Histocompatibility Antigens Class I Human genes 0.000 description 3
- 108010088652 Histocompatibility Antigens Class I Proteins 0.000 description 3
- 101000911074 Homo sapiens FAS-associated death domain protein Proteins 0.000 description 3
- 102000008070 Interferon-gamma Human genes 0.000 description 3
- 108010074328 Interferon-gamma Proteins 0.000 description 3
- 241000713666 Lentivirus Species 0.000 description 3
- 102100040247 Tumor necrosis factor Human genes 0.000 description 3
- 101150063416 add gene Proteins 0.000 description 3
- 150000001413 amino acids Chemical group 0.000 description 3
- 230000003321 amplification Effects 0.000 description 3
- 230000000259 anti-tumor effect Effects 0.000 description 3
- 230000008901 benefit Effects 0.000 description 3
- 230000031018 biological processes and functions Effects 0.000 description 3
- 239000012472 biological sample Substances 0.000 description 3
- 210000004369 blood Anatomy 0.000 description 3
- 239000008280 blood Substances 0.000 description 3
- 239000000872 buffer Substances 0.000 description 3
- 239000013592 cell lysate Substances 0.000 description 3
- 239000003153 chemical reaction reagent Substances 0.000 description 3
- 238000011198 co-culture assay Methods 0.000 description 3
- 210000001151 cytotoxic T lymphocyte Anatomy 0.000 description 3
- 230000005782 double-strand break Effects 0.000 description 3
- 238000005516 engineering process Methods 0.000 description 3
- 230000010856 establishment of protein localization Effects 0.000 description 3
- 238000000605 extraction Methods 0.000 description 3
- 208000015181 infectious disease Diseases 0.000 description 3
- 230000002147 killing effect Effects 0.000 description 3
- 239000003446 ligand Substances 0.000 description 3
- 238000004519 manufacturing process Methods 0.000 description 3
- 230000004048 modification Effects 0.000 description 3
- 238000012986 modification Methods 0.000 description 3
- 230000006780 non-homologous end joining Effects 0.000 description 3
- 238000003199 nucleic acid amplification method Methods 0.000 description 3
- 238000003068 pathway analysis Methods 0.000 description 3
- 210000005105 peripheral blood lymphocyte Anatomy 0.000 description 3
- 239000013641 positive control Substances 0.000 description 3
- 238000003753 real-time PCR Methods 0.000 description 3
- 230000001177 retroviral effect Effects 0.000 description 3
- 238000003757 reverse transcription PCR Methods 0.000 description 3
- 230000035945 sensitivity Effects 0.000 description 3
- 230000000392 somatic effect Effects 0.000 description 3
- 125000006850 spacer group Chemical group 0.000 description 3
- 210000001519 tissue Anatomy 0.000 description 3
- 230000034512 ubiquitination Effects 0.000 description 3
- 230000003827 upregulation Effects 0.000 description 3
- YBJHBAHKTGYVGT-ZKWXMUAHSA-N (+)-Biotin Chemical compound N1C(=O)N[C@@H]2[C@H](CCCCC(=O)O)SC[C@@H]21 YBJHBAHKTGYVGT-ZKWXMUAHSA-N 0.000 description 2
- 102100024406 60S ribosomal protein L15 Human genes 0.000 description 2
- 108700028369 Alleles Proteins 0.000 description 2
- 108010074708 B7-H1 Antigen Proteins 0.000 description 2
- 102100038078 CD276 antigen Human genes 0.000 description 2
- 238000010356 CRISPR-Cas9 genome editing Methods 0.000 description 2
- 108091058556 CTAG1B Proteins 0.000 description 2
- 102100029968 Calreticulin Human genes 0.000 description 2
- 102000004127 Cytokines Human genes 0.000 description 2
- 108090000695 Cytokines Proteins 0.000 description 2
- 238000007400 DNA extraction Methods 0.000 description 2
- 102100035549 Eukaryotic translation initiation factor 2 subunit 1 Human genes 0.000 description 2
- 238000000729 Fisher's exact test Methods 0.000 description 2
- 238000012413 Fluorescence activated cell sorting analysis Methods 0.000 description 2
- 102100031351 Galectin-9 Human genes 0.000 description 2
- 101710121810 Galectin-9 Proteins 0.000 description 2
- 102100039620 Granulocyte-macrophage colony-stimulating factor Human genes 0.000 description 2
- 101001117935 Homo sapiens 60S ribosomal protein L15 Proteins 0.000 description 2
- 101000884279 Homo sapiens CD276 antigen Proteins 0.000 description 2
- 101000793651 Homo sapiens Calreticulin Proteins 0.000 description 2
- 101001020112 Homo sapiens Eukaryotic translation initiation factor 2 subunit 1 Proteins 0.000 description 2
- 101001018196 Homo sapiens Mitogen-activated protein kinase kinase kinase 5 Proteins 0.000 description 2
- 101001109145 Homo sapiens Receptor-interacting serine/threonine-protein kinase 1 Proteins 0.000 description 2
- 102100036157 Interferon gamma receptor 2 Human genes 0.000 description 2
- 208000008839 Kidney Neoplasms Diseases 0.000 description 2
- ZDXPYRJPNDTMRX-VKHMYHEASA-N L-glutamine Chemical compound OC(=O)[C@@H](N)CCC(N)=O ZDXPYRJPNDTMRX-VKHMYHEASA-N 0.000 description 2
- 229930182816 L-glutamine Natural products 0.000 description 2
- 239000012097 Lipofectamine 2000 Substances 0.000 description 2
- 108010010995 MART-1 Antigen Proteins 0.000 description 2
- 102000016200 MART-1 Antigen Human genes 0.000 description 2
- 241000124008 Mammalia Species 0.000 description 2
- 206010027476 Metastases Diseases 0.000 description 2
- 102100033127 Mitogen-activated protein kinase kinase kinase 5 Human genes 0.000 description 2
- 101100407308 Mus musculus Pdcd1lg2 gene Proteins 0.000 description 2
- 239000012124 Opti-MEM Substances 0.000 description 2
- 238000012408 PCR amplification Methods 0.000 description 2
- 239000002033 PVDF binder Substances 0.000 description 2
- KHGNFPUMBJSZSM-UHFFFAOYSA-N Perforine Natural products COC1=C2CCC(O)C(CCC(C)(C)O)(OC)C2=NC2=C1C=CO2 KHGNFPUMBJSZSM-UHFFFAOYSA-N 0.000 description 2
- 108700030875 Programmed Cell Death 1 Ligand 2 Proteins 0.000 description 2
- 102100024216 Programmed cell death 1 ligand 1 Human genes 0.000 description 2
- 102100024213 Programmed cell death 1 ligand 2 Human genes 0.000 description 2
- 102000009572 RNA Polymerase II Human genes 0.000 description 2
- 108010009460 RNA Polymerase II Proteins 0.000 description 2
- 102100022501 Receptor-interacting serine/threonine-protein kinase 1 Human genes 0.000 description 2
- 206010038389 Renal cancer Diseases 0.000 description 2
- 150000001408 amides Chemical class 0.000 description 2
- 238000000540 analysis of variance Methods 0.000 description 2
- 238000011319 anticancer therapy Methods 0.000 description 2
- 239000011324 bead Substances 0.000 description 2
- 230000000981 bystander Effects 0.000 description 2
- 230000022534 cell killing Effects 0.000 description 2
- 230000008614 cellular interaction Effects 0.000 description 2
- 230000036755 cellular response Effects 0.000 description 2
- 238000007405 data analysis Methods 0.000 description 2
- 238000013461 design Methods 0.000 description 2
- 238000011161 development Methods 0.000 description 2
- 210000002472 endoplasmic reticulum Anatomy 0.000 description 2
- 239000000499 gel Substances 0.000 description 2
- 238000010353 genetic engineering Methods 0.000 description 2
- 238000010362 genome editing Methods 0.000 description 2
- 230000006303 immediate early viral mRNA transcription Effects 0.000 description 2
- 238000003119 immunoblot Methods 0.000 description 2
- 230000002163 immunogen Effects 0.000 description 2
- 238000003364 immunohistochemistry Methods 0.000 description 2
- 238000001727 in vivo Methods 0.000 description 2
- 230000006698 induction Effects 0.000 description 2
- 229960003130 interferon gamma Drugs 0.000 description 2
- 108010085650 interferon gamma receptor Proteins 0.000 description 2
- 229940047124 interferons Drugs 0.000 description 2
- 201000010982 kidney cancer Diseases 0.000 description 2
- 230000003902 lesion Effects 0.000 description 2
- 230000000670 limiting effect Effects 0.000 description 2
- 230000004807 localization Effects 0.000 description 2
- 229920002521 macromolecule Polymers 0.000 description 2
- 230000019231 macromolecule metabolic process Effects 0.000 description 2
- 239000000463 material Substances 0.000 description 2
- 230000034153 membrane organization Effects 0.000 description 2
- 239000002679 microRNA Substances 0.000 description 2
- 239000000203 mixture Substances 0.000 description 2
- 239000002773 nucleotide Substances 0.000 description 2
- 125000003729 nucleotide group Chemical group 0.000 description 2
- 239000008188 pellet Substances 0.000 description 2
- 229930192851 perforin Natural products 0.000 description 2
- 229920002981 polyvinylidene fluoride Polymers 0.000 description 2
- 230000008569 process Effects 0.000 description 2
- XJMOSONTPMZWPB-UHFFFAOYSA-M propidium iodide Chemical compound [I-].[I-].C12=CC(N)=CC=C2C2=CC=C(N)C=C2[N+](CCC[N+](C)(CC)CC)=C1C1=CC=CC=C1 XJMOSONTPMZWPB-UHFFFAOYSA-M 0.000 description 2
- 102000005962 receptors Human genes 0.000 description 2
- 108020003175 receptors Proteins 0.000 description 2
- 230000009467 reduction Effects 0.000 description 2
- 230000008261 resistance mechanism Effects 0.000 description 2
- 230000004044 response Effects 0.000 description 2
- 230000002441 reversible effect Effects 0.000 description 2
- 102220094752 rs377388354 Human genes 0.000 description 2
- 238000010186 staining Methods 0.000 description 2
- 230000000638 stimulation Effects 0.000 description 2
- UCSJYZPVAKXKNQ-HZYVHMACSA-N streptomycin Chemical compound CN[C@H]1[C@H](O)[C@@H](O)[C@H](CO)O[C@H]1O[C@@H]1[C@](C=O)(O)[C@H](C)O[C@H]1O[C@@H]1[C@@H](NC(N)=N)[C@H](O)[C@@H](NC(N)=N)[C@H](O)[C@H]1O UCSJYZPVAKXKNQ-HZYVHMACSA-N 0.000 description 2
- 229960005322 streptomycin Drugs 0.000 description 2
- 230000004614 tumor growth Effects 0.000 description 2
- 241001430294 unidentified retrovirus Species 0.000 description 2
- NEHKZPHIKKEMAZ-ZFVKSOIMSA-N (2s)-2-[[(2s,3r)-2-[[(2s)-2-[[(2s,3s)-2-[[2-[[(2s,3s)-2-[[2-[[(2s)-2-[[(2s)-2-azaniumylpropanoyl]amino]propanoyl]amino]acetyl]amino]-3-methylpentanoyl]amino]acetyl]amino]-3-methylpentanoyl]amino]-4-methylpentanoyl]amino]-3-hydroxybutanoyl]amino]-3-methylb Chemical compound C[C@H](N)C(=O)N[C@@H](C)C(=O)NCC(=O)N[C@@H]([C@@H](C)CC)C(=O)NCC(=O)N[C@@H]([C@@H](C)CC)C(=O)N[C@@H](CC(C)C)C(=O)N[C@@H]([C@@H](C)O)C(=O)N[C@@H](C(C)C)C(O)=O NEHKZPHIKKEMAZ-ZFVKSOIMSA-N 0.000 description 1
- MZOFCQQQCNRIBI-VMXHOPILSA-N (3s)-4-[[(2s)-1-[[(2s)-1-[[(1s)-1-carboxy-2-hydroxyethyl]amino]-4-methyl-1-oxopentan-2-yl]amino]-5-(diaminomethylideneamino)-1-oxopentan-2-yl]amino]-3-[[2-[[(2s)-2,6-diaminohexanoyl]amino]acetyl]amino]-4-oxobutanoic acid Chemical compound OC[C@@H](C(O)=O)NC(=O)[C@H](CC(C)C)NC(=O)[C@H](CCCN=C(N)N)NC(=O)[C@H](CC(O)=O)NC(=O)CNC(=O)[C@@H](N)CCCCN MZOFCQQQCNRIBI-VMXHOPILSA-N 0.000 description 1
- 102000040650 (ribonucleotides)n+m Human genes 0.000 description 1
- KUKJHGXXZWHSBG-WBGSEQOASA-N 12S-HHTrE Chemical compound CCCCC[C@H](O)\C=C\C=C\C\C=C/CCCC(O)=O KUKJHGXXZWHSBG-WBGSEQOASA-N 0.000 description 1
- JKMHFZQWWAIEOD-UHFFFAOYSA-N 2-[4-(2-hydroxyethyl)piperazin-1-yl]ethanesulfonic acid Chemical compound OCC[NH+]1CCN(CCS([O-])(=O)=O)CC1 JKMHFZQWWAIEOD-UHFFFAOYSA-N 0.000 description 1
- AXAVXPMQTGXXJZ-UHFFFAOYSA-N 2-aminoacetic acid;2-amino-2-(hydroxymethyl)propane-1,3-diol Chemical compound NCC(O)=O.OCC(N)(CO)CO AXAVXPMQTGXXJZ-UHFFFAOYSA-N 0.000 description 1
- 102100032282 26S proteasome non-ATPase regulatory subunit 14 Human genes 0.000 description 1
- 102100029511 26S proteasome regulatory subunit 6B Human genes 0.000 description 1
- 102100034682 26S proteasome regulatory subunit 7 Human genes 0.000 description 1
- UAIUNKRWKOVEES-UHFFFAOYSA-N 3,3',5,5'-tetramethylbenzidine Chemical compound CC1=C(N)C(C)=CC(C=2C=C(C)C(N)=C(C)C=2)=C1 UAIUNKRWKOVEES-UHFFFAOYSA-N 0.000 description 1
- LKKMLIBUAXYLOY-UHFFFAOYSA-N 3-Amino-1-methyl-5H-pyrido[4,3-b]indole Chemical compound N1C2=CC=CC=C2C2=C1C=C(N)N=C2C LKKMLIBUAXYLOY-UHFFFAOYSA-N 0.000 description 1
- 102100026744 40S ribosomal protein S10 Human genes 0.000 description 1
- 102100033051 40S ribosomal protein S19 Human genes 0.000 description 1
- 102100031928 40S ribosomal protein S29 Human genes 0.000 description 1
- 102100030310 5,6-dihydroxyindole-2-carboxylic acid oxidase Human genes 0.000 description 1
- 101710163881 5,6-dihydroxyindole-2-carboxylic acid oxidase Proteins 0.000 description 1
- 102100040881 60S acidic ribosomal protein P0 Human genes 0.000 description 1
- 102100033416 60S acidic ribosomal protein P1 Human genes 0.000 description 1
- 102100024442 60S ribosomal protein L13 Human genes 0.000 description 1
- 102100032411 60S ribosomal protein L18 Human genes 0.000 description 1
- 102100021690 60S ribosomal protein L18a Human genes 0.000 description 1
- 102100037965 60S ribosomal protein L21 Human genes 0.000 description 1
- 102100038008 60S ribosomal protein L22-like 1 Human genes 0.000 description 1
- 102100023247 60S ribosomal protein L23a Human genes 0.000 description 1
- 102100035322 60S ribosomal protein L24 Human genes 0.000 description 1
- 102100040540 60S ribosomal protein L3 Human genes 0.000 description 1
- 102100040637 60S ribosomal protein L34 Human genes 0.000 description 1
- 102100022276 60S ribosomal protein L35a Human genes 0.000 description 1
- 102100030982 60S ribosomal protein L38 Human genes 0.000 description 1
- 102100036630 60S ribosomal protein L7a Human genes 0.000 description 1
- 102100035931 60S ribosomal protein L8 Human genes 0.000 description 1
- 102100041029 60S ribosomal protein L9 Human genes 0.000 description 1
- 240000005020 Acaciella glauca Species 0.000 description 1
- 102100030374 Actin, cytoplasmic 2 Human genes 0.000 description 1
- 208000031261 Acute myeloid leukaemia Diseases 0.000 description 1
- USFZMSVCRYTOJT-UHFFFAOYSA-N Ammonium acetate Chemical compound N.CC(O)=O USFZMSVCRYTOJT-UHFFFAOYSA-N 0.000 description 1
- 239000005695 Ammonium acetate Substances 0.000 description 1
- 108091093088 Amplicon Proteins 0.000 description 1
- 102000006306 Antigen Receptors Human genes 0.000 description 1
- 108010083359 Antigen Receptors Proteins 0.000 description 1
- 208000007860 Anus Neoplasms Diseases 0.000 description 1
- 101150063837 Aplnr gene Proteins 0.000 description 1
- 208000010839 B-cell chronic lymphocytic leukemia Diseases 0.000 description 1
- 102100038080 B-cell receptor CD22 Human genes 0.000 description 1
- 102100024222 B-lymphocyte antigen CD19 Human genes 0.000 description 1
- 201000001321 Bardet-Biedl syndrome Diseases 0.000 description 1
- 206010005949 Bone cancer Diseases 0.000 description 1
- 208000018084 Bone neoplasm Diseases 0.000 description 1
- 108091003079 Bovine Serum Albumin Proteins 0.000 description 1
- 208000003174 Brain Neoplasms Diseases 0.000 description 1
- 206010006187 Breast cancer Diseases 0.000 description 1
- 208000026310 Breast neoplasm Diseases 0.000 description 1
- 102100023458 C-type lectin-like domain family 1 Human genes 0.000 description 1
- 102000017420 CD3 protein, epsilon/gamma/delta subunit Human genes 0.000 description 1
- 108050005493 CD3 protein, epsilon/gamma/delta subunit Proteins 0.000 description 1
- 108010084313 CD58 Antigens Proteins 0.000 description 1
- 101150069031 CSN2 gene Proteins 0.000 description 1
- 206010007279 Carcinoid tumour of the gastrointestinal tract Diseases 0.000 description 1
- 102100025597 Caspase-4 Human genes 0.000 description 1
- 206010008342 Cervix carcinoma Diseases 0.000 description 1
- VYZAMTAEIAYCRO-UHFFFAOYSA-N Chromium Chemical compound [Cr] VYZAMTAEIAYCRO-UHFFFAOYSA-N 0.000 description 1
- 206010009944 Colon cancer Diseases 0.000 description 1
- 108010071942 Colony-Stimulating Factors Proteins 0.000 description 1
- 108010049207 Death Domain Receptors Proteins 0.000 description 1
- 102000009058 Death Domain Receptors Human genes 0.000 description 1
- 102000001301 EGF receptor Human genes 0.000 description 1
- 108060006698 EGF receptor Proteins 0.000 description 1
- 101150100259 EIF3L gene Proteins 0.000 description 1
- 238000012286 ELISA Assay Methods 0.000 description 1
- 102000004533 Endonucleases Human genes 0.000 description 1
- 208000000461 Esophageal Neoplasms Diseases 0.000 description 1
- LFQSCWFLJHTTHZ-UHFFFAOYSA-N Ethanol Chemical compound CCO LFQSCWFLJHTTHZ-UHFFFAOYSA-N 0.000 description 1
- 102100029776 Eukaryotic translation initiation factor 3 subunit D Human genes 0.000 description 1
- 102100038085 Eukaryotic translation initiation factor 3 subunit L Human genes 0.000 description 1
- 208000001382 Experimental Melanoma Diseases 0.000 description 1
- 238000001134 F-test Methods 0.000 description 1
- 102000003688 G-Protein-Coupled Receptors Human genes 0.000 description 1
- 108090000045 G-Protein-Coupled Receptors Proteins 0.000 description 1
- 208000022072 Gallbladder Neoplasms Diseases 0.000 description 1
- 102100040225 Gamma-interferon-inducible lysosomal thiol reductase Human genes 0.000 description 1
- 102100032865 General transcription factor IIH subunit 5 Human genes 0.000 description 1
- 239000007995 HEPES buffer Substances 0.000 description 1
- 101710197839 HLA class I histocompatibility antigen, alpha chain F Proteins 0.000 description 1
- 101710088172 HTH-type transcriptional regulator RipA Proteins 0.000 description 1
- 102100034458 Hepatitis A virus cellular receptor 2 Human genes 0.000 description 1
- 101710083479 Hepatitis A virus cellular receptor 2 homolog Proteins 0.000 description 1
- 208000017604 Hodgkin disease Diseases 0.000 description 1
- 208000021519 Hodgkin lymphoma Diseases 0.000 description 1
- 208000010747 Hodgkins lymphoma Diseases 0.000 description 1
- 241000282412 Homo Species 0.000 description 1
- 101000590281 Homo sapiens 26S proteasome non-ATPase regulatory subunit 14 Proteins 0.000 description 1
- 101001125524 Homo sapiens 26S proteasome regulatory subunit 6B Proteins 0.000 description 1
- 101001090865 Homo sapiens 26S proteasome regulatory subunit 7 Proteins 0.000 description 1
- 101000691550 Homo sapiens 39S ribosomal protein L13, mitochondrial Proteins 0.000 description 1
- 101001119189 Homo sapiens 40S ribosomal protein S10 Proteins 0.000 description 1
- 101000733040 Homo sapiens 40S ribosomal protein S19 Proteins 0.000 description 1
- 101000704060 Homo sapiens 40S ribosomal protein S29 Proteins 0.000 description 1
- 101000673456 Homo sapiens 60S acidic ribosomal protein P0 Proteins 0.000 description 1
- 101000712357 Homo sapiens 60S acidic ribosomal protein P1 Proteins 0.000 description 1
- 101001108634 Homo sapiens 60S ribosomal protein L10 Proteins 0.000 description 1
- 101001118201 Homo sapiens 60S ribosomal protein L13 Proteins 0.000 description 1
- 101001087985 Homo sapiens 60S ribosomal protein L18 Proteins 0.000 description 1
- 101000752293 Homo sapiens 60S ribosomal protein L18a Proteins 0.000 description 1
- 101000661708 Homo sapiens 60S ribosomal protein L21 Proteins 0.000 description 1
- 101000661567 Homo sapiens 60S ribosomal protein L22-like 1 Proteins 0.000 description 1
- 101001115494 Homo sapiens 60S ribosomal protein L23a Proteins 0.000 description 1
- 101000660926 Homo sapiens 60S ribosomal protein L24 Proteins 0.000 description 1
- 101000673985 Homo sapiens 60S ribosomal protein L3 Proteins 0.000 description 1
- 101000672659 Homo sapiens 60S ribosomal protein L34 Proteins 0.000 description 1
- 101001110988 Homo sapiens 60S ribosomal protein L35a Proteins 0.000 description 1
- 101001127039 Homo sapiens 60S ribosomal protein L38 Proteins 0.000 description 1
- 101000853243 Homo sapiens 60S ribosomal protein L7a Proteins 0.000 description 1
- 101000853659 Homo sapiens 60S ribosomal protein L8 Proteins 0.000 description 1
- 101000672886 Homo sapiens 60S ribosomal protein L9 Proteins 0.000 description 1
- 101000773237 Homo sapiens Actin, cytoplasmic 2 Proteins 0.000 description 1
- 101000652570 Homo sapiens Antigen peptide transporter 1 Proteins 0.000 description 1
- 101000884305 Homo sapiens B-cell receptor CD22 Proteins 0.000 description 1
- 101000980825 Homo sapiens B-lymphocyte antigen CD19 Proteins 0.000 description 1
- 101000906643 Homo sapiens C-type lectin-like domain family 1 Proteins 0.000 description 1
- 101000933112 Homo sapiens Caspase-4 Proteins 0.000 description 1
- 101001037132 Homo sapiens Gamma-interferon-inducible lysosomal thiol reductase Proteins 0.000 description 1
- 101000655402 Homo sapiens General transcription factor IIH subunit 5 Proteins 0.000 description 1
- 101000606465 Homo sapiens Inactive tyrosine-protein kinase 7 Proteins 0.000 description 1
- 101000598002 Homo sapiens Interferon regulatory factor 1 Proteins 0.000 description 1
- 101000716729 Homo sapiens Kit ligand Proteins 0.000 description 1
- 101001023379 Homo sapiens Lysosome-associated membrane glycoprotein 1 Proteins 0.000 description 1
- 101000581514 Homo sapiens Membrane-bound transcription factor site-2 protease Proteins 0.000 description 1
- 101001059990 Homo sapiens Mitogen-activated protein kinase kinase kinase kinase 2 Proteins 0.000 description 1
- 101000589301 Homo sapiens Natural cytotoxicity triggering receptor 1 Proteins 0.000 description 1
- 101000581981 Homo sapiens Neural cell adhesion molecule 1 Proteins 0.000 description 1
- 101000844245 Homo sapiens Non-receptor tyrosine-protein kinase TYK2 Proteins 0.000 description 1
- 101000711369 Homo sapiens Probable ribosome biogenesis protein RLP24 Proteins 0.000 description 1
- 101001090813 Homo sapiens Proteasome subunit alpha type-6 Proteins 0.000 description 1
- 101001089120 Homo sapiens Proteasome subunit beta type-3 Proteins 0.000 description 1
- 101001136981 Homo sapiens Proteasome subunit beta type-9 Proteins 0.000 description 1
- 101000704147 Homo sapiens Signal recognition particle 54 kDa protein Proteins 0.000 description 1
- 101000946860 Homo sapiens T-cell surface glycoprotein CD3 epsilon chain Proteins 0.000 description 1
- 101000596093 Homo sapiens Transcription initiation factor TFIID subunit 1 Proteins 0.000 description 1
- 101000596092 Homo sapiens Transcription initiation factor TFIID subunit 1-like Proteins 0.000 description 1
- 101000674742 Homo sapiens Transcription initiation factor TFIID subunit 5 Proteins 0.000 description 1
- 101000657366 Homo sapiens Transcription initiation factor TFIID subunit 7 Proteins 0.000 description 1
- 101000851370 Homo sapiens Tumor necrosis factor receptor superfamily member 9 Proteins 0.000 description 1
- 101000809243 Homo sapiens Ubiquitin carboxyl-terminal hydrolase 10 Proteins 0.000 description 1
- 101000748137 Homo sapiens Ubiquitin carboxyl-terminal hydrolase 31 Proteins 0.000 description 1
- 101000748141 Homo sapiens Ubiquitin carboxyl-terminal hydrolase 32 Proteins 0.000 description 1
- 101000759988 Homo sapiens Ubiquitin carboxyl-terminal hydrolase 48 Proteins 0.000 description 1
- 101150017040 I gene Proteins 0.000 description 1
- 101150062179 II gene Proteins 0.000 description 1
- 102000037977 Immune checkpoint ligands Human genes 0.000 description 1
- 108091008029 Immune checkpoint ligands Proteins 0.000 description 1
- 102100039813 Inactive tyrosine-protein kinase 7 Human genes 0.000 description 1
- 102100036981 Interferon regulatory factor 1 Human genes 0.000 description 1
- 108090000174 Interleukin-10 Proteins 0.000 description 1
- 108050003558 Interleukin-17 Proteins 0.000 description 1
- 108090000978 Interleukin-4 Proteins 0.000 description 1
- 108010002616 Interleukin-5 Proteins 0.000 description 1
- 108010002335 Interleukin-9 Proteins 0.000 description 1
- 102000042838 JAK family Human genes 0.000 description 1
- 108091082332 JAK family Proteins 0.000 description 1
- 238000010824 Kaplan-Meier survival analysis Methods 0.000 description 1
- 102100020880 Kit ligand Human genes 0.000 description 1
- 101710177504 Kit ligand Proteins 0.000 description 1
- 238000001276 Kolmogorov–Smirnov test Methods 0.000 description 1
- 102100031413 L-dopachrome tautomerase Human genes 0.000 description 1
- 101710093778 L-dopachrome tautomerase Proteins 0.000 description 1
- 102000017578 LAG3 Human genes 0.000 description 1
- 101150030213 Lag3 gene Proteins 0.000 description 1
- 206010023825 Laryngeal cancer Diseases 0.000 description 1
- 206010024291 Leukaemias acute myeloid Diseases 0.000 description 1
- 206010058467 Lung neoplasm malignant Diseases 0.000 description 1
- 208000031422 Lymphocytic Chronic B-Cell Leukemia Diseases 0.000 description 1
- 102100035133 Lysosome-associated membrane glycoprotein 1 Human genes 0.000 description 1
- 108700005089 MHC Class I Genes Proteins 0.000 description 1
- 102000043129 MHC class I family Human genes 0.000 description 1
- 108091054437 MHC class I family Proteins 0.000 description 1
- 238000000585 Mann–Whitney U test Methods 0.000 description 1
- 102100022430 Melanocyte protein PMEL Human genes 0.000 description 1
- 108010071463 Melanoma-Specific Antigens Proteins 0.000 description 1
- 102000007557 Melanoma-Specific Antigens Human genes 0.000 description 1
- 108010052285 Membrane Proteins Proteins 0.000 description 1
- 102100027382 Membrane-bound transcription factor site-2 protease Human genes 0.000 description 1
- 102000003735 Mesothelin Human genes 0.000 description 1
- 108090000015 Mesothelin Proteins 0.000 description 1
- 102100028192 Mitogen-activated protein kinase kinase kinase kinase 2 Human genes 0.000 description 1
- 208000034578 Multiple myelomas Diseases 0.000 description 1
- 241000699666 Mus <mouse, genus> Species 0.000 description 1
- 208000033776 Myeloid Acute Leukemia Diseases 0.000 description 1
- 206010028729 Nasal cavity cancer Diseases 0.000 description 1
- 208000001894 Nasopharyngeal Neoplasms Diseases 0.000 description 1
- 102100032870 Natural cytotoxicity triggering receptor 1 Human genes 0.000 description 1
- 102100027347 Neural cell adhesion molecule 1 Human genes 0.000 description 1
- 101100385413 Neurospora crassa (strain ATCC 24698 / 74-OR23-1A / CBS 708.71 / DSM 1257 / FGSC 987) csm-3 gene Proteins 0.000 description 1
- 208000015914 Non-Hodgkin lymphomas Diseases 0.000 description 1
- 102100032028 Non-receptor tyrosine-protein kinase TYK2 Human genes 0.000 description 1
- 238000000636 Northern blotting Methods 0.000 description 1
- 208000010505 Nose Neoplasms Diseases 0.000 description 1
- 206010030155 Oesophageal carcinoma Diseases 0.000 description 1
- 206010033128 Ovarian cancer Diseases 0.000 description 1
- 206010061535 Ovarian neoplasm Diseases 0.000 description 1
- 108700005081 Overlapping Genes Proteins 0.000 description 1
- 206010061902 Pancreatic neoplasm Diseases 0.000 description 1
- 229930182555 Penicillin Natural products 0.000 description 1
- JGSARLDLIJGVTE-MBNYWOFBSA-N Penicillin G Chemical compound N([C@H]1[C@H]2SC([C@@H](N2C1=O)C(O)=O)(C)C)C(=O)CC1=CC=CC=C1 JGSARLDLIJGVTE-MBNYWOFBSA-N 0.000 description 1
- 208000009565 Pharyngeal Neoplasms Diseases 0.000 description 1
- 108091000080 Phosphotransferase Proteins 0.000 description 1
- 206010035226 Plasma cell myeloma Diseases 0.000 description 1
- 101710089372 Programmed cell death protein 1 Proteins 0.000 description 1
- 206010060862 Prostate cancer Diseases 0.000 description 1
- 208000000236 Prostatic Neoplasms Diseases 0.000 description 1
- 229940124158 Protease/peptidase inhibitor Drugs 0.000 description 1
- 102100034664 Proteasome subunit alpha type-6 Human genes 0.000 description 1
- 102100033755 Proteasome subunit beta type-3 Human genes 0.000 description 1
- 102100035764 Proteasome subunit beta type-9 Human genes 0.000 description 1
- 102000018471 Proto-Oncogene Proteins B-raf Human genes 0.000 description 1
- 108010091528 Proto-Oncogene Proteins B-raf Proteins 0.000 description 1
- 101710156592 Putative TATA-binding protein pB263R Proteins 0.000 description 1
- 230000004570 RNA-binding Effects 0.000 description 1
- 239000012980 RPMI-1640 medium Substances 0.000 description 1
- 208000015634 Rectal Neoplasms Diseases 0.000 description 1
- 102000012950 SOXE Transcription Factors Human genes 0.000 description 1
- 108010090206 SOXE Transcription Factors Proteins 0.000 description 1
- 230000021194 SRP-dependent cotranslational protein targeting to membrane Effects 0.000 description 1
- 240000004808 Saccharomyces cerevisiae Species 0.000 description 1
- 101100501193 Schizosaccharomyces pombe (strain 972 / ATCC 24843) moe1 gene Proteins 0.000 description 1
- 108700032475 Sex-Determining Region Y Proteins 0.000 description 1
- 102100022978 Sex-determining region Y protein Human genes 0.000 description 1
- 101710173693 Short transient receptor potential channel 1 Proteins 0.000 description 1
- 101710173694 Short transient receptor potential channel 2 Proteins 0.000 description 1
- 101710140204 Signal transducer and transcription activator Proteins 0.000 description 1
- 208000032383 Soft tissue cancer Diseases 0.000 description 1
- 208000005718 Stomach Neoplasms Diseases 0.000 description 1
- 108010090804 Streptavidin Proteins 0.000 description 1
- 108091027544 Subgenomic mRNA Proteins 0.000 description 1
- 101800001271 Surface protein Proteins 0.000 description 1
- 230000006044 T cell activation Effects 0.000 description 1
- 230000020385 T cell costimulation Effects 0.000 description 1
- 229940126547 T-cell immunoglobulin mucin-3 Drugs 0.000 description 1
- 102100035794 T-cell surface glycoprotein CD3 epsilon chain Human genes 0.000 description 1
- 102100040296 TATA-box-binding protein Human genes 0.000 description 1
- 101710145783 TATA-box-binding protein Proteins 0.000 description 1
- 102100033078 TNF receptor-associated factor 1 Human genes 0.000 description 1
- 208000024313 Testicular Neoplasms Diseases 0.000 description 1
- 206010057644 Testis cancer Diseases 0.000 description 1
- 208000024770 Thyroid neoplasm Diseases 0.000 description 1
- 101710176133 Transcription factor Sox-10 Proteins 0.000 description 1
- 102100035222 Transcription initiation factor TFIID subunit 1 Human genes 0.000 description 1
- 102100035238 Transcription initiation factor TFIID subunit 1-like Human genes 0.000 description 1
- 102100021230 Transcription initiation factor TFIID subunit 5 Human genes 0.000 description 1
- 102100034748 Transcription initiation factor TFIID subunit 7 Human genes 0.000 description 1
- LVTKHGUGBGNBPL-UHFFFAOYSA-N Trp-P-1 Chemical compound N1C2=CC=CC=C2C2=C1C(C)=C(N)N=C2C LVTKHGUGBGNBPL-UHFFFAOYSA-N 0.000 description 1
- 102000004142 Trypsin Human genes 0.000 description 1
- 108090000631 Trypsin Proteins 0.000 description 1
- 102000000852 Tumor Necrosis Factor-alpha Human genes 0.000 description 1
- 102100033732 Tumor necrosis factor receptor superfamily member 1A Human genes 0.000 description 1
- 101710187743 Tumor necrosis factor receptor superfamily member 1A Proteins 0.000 description 1
- 102100022153 Tumor necrosis factor receptor superfamily member 4 Human genes 0.000 description 1
- 101710165473 Tumor necrosis factor receptor superfamily member 4 Proteins 0.000 description 1
- 102100039094 Tyrosinase Human genes 0.000 description 1
- 108060008724 Tyrosinase Proteins 0.000 description 1
- 102100038426 Ubiquitin carboxyl-terminal hydrolase 10 Human genes 0.000 description 1
- 102100040049 Ubiquitin carboxyl-terminal hydrolase 31 Human genes 0.000 description 1
- 208000023915 Ureteral Neoplasms Diseases 0.000 description 1
- 206010046392 Ureteric cancer Diseases 0.000 description 1
- 208000007097 Urinary Bladder Neoplasms Diseases 0.000 description 1
- 208000006105 Uterine Cervical Neoplasms Diseases 0.000 description 1
- 208000004354 Vulvar Neoplasms Diseases 0.000 description 1
- 230000004913 activation Effects 0.000 description 1
- 230000001154 acute effect Effects 0.000 description 1
- 230000004075 alteration Effects 0.000 description 1
- 206010065867 alveolar rhabdomyosarcoma Diseases 0.000 description 1
- 229940043376 ammonium acetate Drugs 0.000 description 1
- 235000019257 ammonium acetate Nutrition 0.000 description 1
- 210000002255 anal canal Anatomy 0.000 description 1
- 201000007696 anal canal cancer Diseases 0.000 description 1
- 229940124650 anti-cancer therapies Drugs 0.000 description 1
- 230000006023 anti-tumor response Effects 0.000 description 1
- 230000005904 anticancer immunity Effects 0.000 description 1
- 230000030819 antigen processing and presentation of endogenous antigen Effects 0.000 description 1
- 230000005177 antigen processing and presentation of endogenous peptide antigen Effects 0.000 description 1
- 230000025399 antigen processing and presentation of endogenous peptide antigen via MHC class I Effects 0.000 description 1
- 230000025378 antigen processing and presentation of exogenous antigen Effects 0.000 description 1
- 230000011013 antigen processing and presentation of exogenous peptide antigen Effects 0.000 description 1
- 230000014102 antigen processing and presentation of exogenous peptide antigen via MHC class I Effects 0.000 description 1
- 230000007961 antigen processing and presentation of exogenous peptide antigen via MHC class I, TAP-dependent Effects 0.000 description 1
- 230000024306 antigen processing and presentation of peptide antigen Effects 0.000 description 1
- 230000007183 antigen processing and presentation of peptide antigen via MHC class I Effects 0.000 description 1
- 238000003782 apoptosis assay Methods 0.000 description 1
- 230000006907 apoptotic process Effects 0.000 description 1
- 150000001491 aromatic compounds Chemical class 0.000 description 1
- 230000027455 binding Effects 0.000 description 1
- 230000033228 biological regulation Effects 0.000 description 1
- 239000000090 biomarker Substances 0.000 description 1
- 238000001574 biopsy Methods 0.000 description 1
- 229960002685 biotin Drugs 0.000 description 1
- 235000020958 biotin Nutrition 0.000 description 1
- 239000011616 biotin Substances 0.000 description 1
- 210000001185 bone marrow Anatomy 0.000 description 1
- 210000000481 breast Anatomy 0.000 description 1
- 230000008777 canonical pathway Effects 0.000 description 1
- 150000001720 carbohydrates Chemical class 0.000 description 1
- 238000004113 cell culture Methods 0.000 description 1
- 230000030833 cell death Effects 0.000 description 1
- 230000003833 cell viability Effects 0.000 description 1
- 230000035289 cell-matrix adhesion Effects 0.000 description 1
- 210000003570 cell-matrix junction Anatomy 0.000 description 1
- 230000006800 cellular catabolic process Effects 0.000 description 1
- 230000015312 cellular component disassembly Effects 0.000 description 1
- 230000010237 cellular component organization Effects 0.000 description 1
- 230000023500 cellular component organization or biogenesis Effects 0.000 description 1
- 230000028818 cellular macromolecule localization Effects 0.000 description 1
- 230000033077 cellular process Effects 0.000 description 1
- 230000033862 cellular protein localization Effects 0.000 description 1
- 230000011994 cellular protein metabolic process Effects 0.000 description 1
- 230000005754 cellular signaling Effects 0.000 description 1
- 201000010881 cervical cancer Diseases 0.000 description 1
- 229910052804 chromium Inorganic materials 0.000 description 1
- 239000011651 chromium Substances 0.000 description 1
- 230000001684 chronic effect Effects 0.000 description 1
- 208000032852 chronic lymphocytic leukemia Diseases 0.000 description 1
- 210000004081 cilia Anatomy 0.000 description 1
- 108010044493 collagen type XVII Proteins 0.000 description 1
- 208000029742 colonic neoplasm Diseases 0.000 description 1
- 230000000295 complement effect Effects 0.000 description 1
- 239000002299 complementary DNA Substances 0.000 description 1
- 150000001875 compounds Chemical class 0.000 description 1
- 101150055601 cops2 gene Proteins 0.000 description 1
- 238000012937 correction Methods 0.000 description 1
- 238000010219 correlation analysis Methods 0.000 description 1
- 230000028731 cotranslational protein targeting to membrane Effects 0.000 description 1
- 150000001923 cyclic compounds Chemical class 0.000 description 1
- 230000001351 cycling effect Effects 0.000 description 1
- 230000021040 cytoplasmic transport Effects 0.000 description 1
- 230000001086 cytosolic effect Effects 0.000 description 1
- 230000006378 damage Effects 0.000 description 1
- 238000012350 deep sequencing Methods 0.000 description 1
- 230000007123 defense Effects 0.000 description 1
- 230000012969 defense response to bacterium Effects 0.000 description 1
- 238000010586 diagram Methods 0.000 description 1
- 238000010790 dilution Methods 0.000 description 1
- 239000012895 dilution Substances 0.000 description 1
- BFMYDTVEBKDAKJ-UHFFFAOYSA-L disodium;(2',7'-dibromo-3',6'-dioxido-3-oxospiro[2-benzofuran-1,9'-xanthene]-4'-yl)mercury;hydrate Chemical compound O.[Na+].[Na+].O1C(=O)C2=CC=CC=C2C21C1=CC(Br)=C([O-])C([Hg])=C1OC1=C2C=C(Br)C([O-])=C1 BFMYDTVEBKDAKJ-UHFFFAOYSA-L 0.000 description 1
- 210000000959 ear middle Anatomy 0.000 description 1
- 210000003162 effector t lymphocyte Anatomy 0.000 description 1
- 101150001367 eif3d gene Proteins 0.000 description 1
- 230000008519 endogenous mechanism Effects 0.000 description 1
- 238000010201 enrichment analysis Methods 0.000 description 1
- 201000004101 esophageal cancer Diseases 0.000 description 1
- 238000011156 evaluation Methods 0.000 description 1
- 230000017188 evasion or tolerance of host immune response Effects 0.000 description 1
- 238000011985 exploratory data analysis Methods 0.000 description 1
- 230000034725 extrinsic apoptotic signaling pathway Effects 0.000 description 1
- 208000024519 eye neoplasm Diseases 0.000 description 1
- 230000001605 fetal effect Effects 0.000 description 1
- 238000001914 filtration Methods 0.000 description 1
- 239000012530 fluid Substances 0.000 description 1
- 230000006870 function Effects 0.000 description 1
- 210000000232 gallbladder Anatomy 0.000 description 1
- 201000007487 gallbladder carcinoma Diseases 0.000 description 1
- 229940044627 gamma-interferon Drugs 0.000 description 1
- 206010017758 gastric cancer Diseases 0.000 description 1
- 238000010199 gene set enrichment analysis Methods 0.000 description 1
- 238000010363 gene targeting Methods 0.000 description 1
- 230000002068 genetic effect Effects 0.000 description 1
- 210000003714 granulocyte Anatomy 0.000 description 1
- 239000003102 growth factor Substances 0.000 description 1
- 238000003306 harvesting Methods 0.000 description 1
- 208000014829 head and neck neoplasm Diseases 0.000 description 1
- 230000036541 health Effects 0.000 description 1
- 210000002443 helper t lymphocyte Anatomy 0.000 description 1
- 125000000623 heterocyclic group Chemical group 0.000 description 1
- 238000009396 hybridization Methods 0.000 description 1
- 201000006866 hypopharynx cancer Diseases 0.000 description 1
- 238000003384 imaging method Methods 0.000 description 1
- 230000016788 immune system process Effects 0.000 description 1
- 230000001024 immunotherapeutic effect Effects 0.000 description 1
- 238000002513 implantation Methods 0.000 description 1
- 230000006872 improvement Effects 0.000 description 1
- 230000008595 infiltration Effects 0.000 description 1
- 238000001764 infiltration Methods 0.000 description 1
- 108091008042 inhibitory receptors Proteins 0.000 description 1
- 239000007924 injection Substances 0.000 description 1
- 238000002347 injection Methods 0.000 description 1
- 230000008611 intercellular interaction Effects 0.000 description 1
- 230000010468 interferon response Effects 0.000 description 1
- 230000019697 interleukin-15 production Effects 0.000 description 1
- 108010074109 interleukin-22 Proteins 0.000 description 1
- 230000027056 interspecies interaction between organisms Effects 0.000 description 1
- 230000029225 intracellular protein transport Effects 0.000 description 1
- 210000003228 intrahepatic bile duct Anatomy 0.000 description 1
- 230000002601 intratumoral effect Effects 0.000 description 1
- 206010023841 laryngeal neoplasm Diseases 0.000 description 1
- 201000004962 larynx cancer Diseases 0.000 description 1
- 208000021601 lentivirus infection Diseases 0.000 description 1
- 210000000265 leukocyte Anatomy 0.000 description 1
- 150000002632 lipids Chemical class 0.000 description 1
- 201000007270 liver cancer Diseases 0.000 description 1
- 208000014018 liver neoplasm Diseases 0.000 description 1
- 238000011068 loading method Methods 0.000 description 1
- 238000001325 log-rank test Methods 0.000 description 1
- 201000005202 lung cancer Diseases 0.000 description 1
- 208000020816 lung neoplasm Diseases 0.000 description 1
- 210000001165 lymph node Anatomy 0.000 description 1
- 210000004698 lymphocyte Anatomy 0.000 description 1
- 230000000527 lymphocytic effect Effects 0.000 description 1
- 239000012139 lysis buffer Substances 0.000 description 1
- 230000026528 macromolecular complex subunit organization Effects 0.000 description 1
- 208000006178 malignant mesothelioma Diseases 0.000 description 1
- 208000015486 malignant pancreatic neoplasm Diseases 0.000 description 1
- 208000025848 malignant tumor of nasopharynx Diseases 0.000 description 1
- 208000026037 malignant tumor of neck Diseases 0.000 description 1
- 239000003550 marker Substances 0.000 description 1
- 238000004949 mass spectrometry Methods 0.000 description 1
- 230000035800 maturation Effects 0.000 description 1
- 238000005259 measurement Methods 0.000 description 1
- 210000003071 memory t lymphocyte Anatomy 0.000 description 1
- 210000000713 mesentery Anatomy 0.000 description 1
- MYWUZJCMWCOHBA-VIFPVBQESA-N methamphetamine Chemical compound CN[C@@H](C)CC1=CC=CC=C1 MYWUZJCMWCOHBA-VIFPVBQESA-N 0.000 description 1
- 108091070501 miRNA Proteins 0.000 description 1
- 210000003632 microfilament Anatomy 0.000 description 1
- 201000003956 middle ear cancer Diseases 0.000 description 1
- 230000005012 migration Effects 0.000 description 1
- 238000013508 migration Methods 0.000 description 1
- 230000000394 mitotic effect Effects 0.000 description 1
- 210000001616 monocyte Anatomy 0.000 description 1
- 210000000214 mouth Anatomy 0.000 description 1
- 230000017034 multi-organism metabolic process Effects 0.000 description 1
- 230000016557 multi-organism process Effects 0.000 description 1
- 210000003928 nasal cavity Anatomy 0.000 description 1
- 201000007425 nasal cavity carcinoma Diseases 0.000 description 1
- 201000011216 nasopharynx carcinoma Diseases 0.000 description 1
- 229910017464 nitrogen compound Inorganic materials 0.000 description 1
- 150000002830 nitrogen compounds Chemical class 0.000 description 1
- 229960003301 nivolumab Drugs 0.000 description 1
- 201000008106 ocular cancer Diseases 0.000 description 1
- 230000009437 off-target effect Effects 0.000 description 1
- 210000002747 omentum Anatomy 0.000 description 1
- 210000003463 organelle Anatomy 0.000 description 1
- 201000002528 pancreatic cancer Diseases 0.000 description 1
- 208000008443 pancreatic carcinoma Diseases 0.000 description 1
- 229960002621 pembrolizumab Drugs 0.000 description 1
- 229940049954 penicillin Drugs 0.000 description 1
- 239000000137 peptide hydrolase inhibitor Substances 0.000 description 1
- 210000004976 peripheral blood cell Anatomy 0.000 description 1
- 210000004303 peritoneum Anatomy 0.000 description 1
- 201000008006 pharynx cancer Diseases 0.000 description 1
- XEBWQGVWTUSTLN-UHFFFAOYSA-M phenylmercury acetate Chemical compound CC(=O)O[Hg]C1=CC=CC=C1 XEBWQGVWTUSTLN-UHFFFAOYSA-M 0.000 description 1
- 102000020233 phosphotransferase Human genes 0.000 description 1
- 210000004224 pleura Anatomy 0.000 description 1
- 201000003437 pleural cancer Diseases 0.000 description 1
- 238000001556 precipitation Methods 0.000 description 1
- 239000002243 precursor Substances 0.000 description 1
- 210000004986 primary T-cell Anatomy 0.000 description 1
- 230000002250 progressing effect Effects 0.000 description 1
- 230000035755 proliferation Effects 0.000 description 1
- 230000001737 promoting effect Effects 0.000 description 1
- 238000003133 propidium iodide exclusion Methods 0.000 description 1
- 230000010327 protein complex subunit organization Effects 0.000 description 1
- 230000026447 protein localization Effects 0.000 description 1
- 230000024128 protein localization in endoplasmic reticulum Effects 0.000 description 1
- 230000017515 protein localization to organelle Effects 0.000 description 1
- 230000022558 protein metabolic process Effects 0.000 description 1
- 230000018883 protein targeting Effects 0.000 description 1
- 230000009609 protein targeting to ER Effects 0.000 description 1
- 230000019866 protein targeting to membrane Effects 0.000 description 1
- 238000000746 purification Methods 0.000 description 1
- 230000005855 radiation Effects 0.000 description 1
- 238000010814 radioimmunoprecipitation assay Methods 0.000 description 1
- 230000009257 reactivity Effects 0.000 description 1
- 206010038038 rectal cancer Diseases 0.000 description 1
- 201000001275 rectum cancer Diseases 0.000 description 1
- 235000003499 redwood Nutrition 0.000 description 1
- 230000012121 regulation of immune response Effects 0.000 description 1
- 230000014176 regulation of innate immune response Effects 0.000 description 1
- 230000007076 release of cytoplasmic sequestered NF-kappaB Effects 0.000 description 1
- 230000008439 repair process Effects 0.000 description 1
- 238000012827 research and development Methods 0.000 description 1
- 108010056030 retronectin Proteins 0.000 description 1
- 238000012552 review Methods 0.000 description 1
- 230000028710 ribosome assembly Effects 0.000 description 1
- 238000003118 sandwich ELISA Methods 0.000 description 1
- 238000013515 script Methods 0.000 description 1
- 238000013207 serial dilution Methods 0.000 description 1
- 210000002966 serum Anatomy 0.000 description 1
- 230000019491 signal transduction Effects 0.000 description 1
- 230000037432 silent mutation Effects 0.000 description 1
- 201000002314 small intestine cancer Diseases 0.000 description 1
- 239000000243 solution Substances 0.000 description 1
- 210000000952 spleen Anatomy 0.000 description 1
- 238000007619 statistical method Methods 0.000 description 1
- 210000000130 stem cell Anatomy 0.000 description 1
- 201000011549 stomach cancer Diseases 0.000 description 1
- 230000009211 stress pathway Effects 0.000 description 1
- 239000000126 substance Substances 0.000 description 1
- 239000000758 substrate Substances 0.000 description 1
- 238000001356 surgical procedure Methods 0.000 description 1
- 230000031068 symbiosis, encompassing mutualism through parasitism Effects 0.000 description 1
- 208000024891 symptom Diseases 0.000 description 1
- 210000000225 synapse Anatomy 0.000 description 1
- 201000003120 testicular cancer Diseases 0.000 description 1
- 230000001225 therapeutic effect Effects 0.000 description 1
- 210000001541 thymus gland Anatomy 0.000 description 1
- 201000002510 thyroid cancer Diseases 0.000 description 1
- 230000005026 transcription initiation Effects 0.000 description 1
- 238000013519 translation Methods 0.000 description 1
- 230000014621 translational initiation Effects 0.000 description 1
- 239000012588 trypsin Substances 0.000 description 1
- 238000010798 ubiquitination Methods 0.000 description 1
- 238000012762 unpaired Student’s t-test Methods 0.000 description 1
- 201000011294 ureter cancer Diseases 0.000 description 1
- 201000005112 urinary bladder cancer Diseases 0.000 description 1
- GPXBXXGIAQBQNI-UHFFFAOYSA-N vemurafenib Chemical group CCCS(=O)(=O)NC1=CC=C(F)C(C(=O)C=2C3=CC(=CN=C3NC=2)C=2C=CC(Cl)=CC=2)=C1F GPXBXXGIAQBQNI-UHFFFAOYSA-N 0.000 description 1
- 229960003862 vemurafenib Drugs 0.000 description 1
- 108700026220 vif Genes Proteins 0.000 description 1
- 230000006648 viral gene expression Effects 0.000 description 1
- 230000007484 viral process Effects 0.000 description 1
- 230000017613 viral reproduction Effects 0.000 description 1
- 230000006490 viral transcription Effects 0.000 description 1
Images












Classifications
-
- C—CHEMISTRY; METALLURGY
- C12—BIOCHEMISTRY; BEER; SPIRITS; WINE; VINEGAR; MICROBIOLOGY; ENZYMOLOGY; MUTATION OR GENETIC ENGINEERING
- C12Q—MEASURING OR TESTING PROCESSES INVOLVING ENZYMES, NUCLEIC ACIDS OR MICROORGANISMS; COMPOSITIONS OR TEST PAPERS THEREFOR; PROCESSES OF PREPARING SUCH COMPOSITIONS; CONDITION-RESPONSIVE CONTROL IN MICROBIOLOGICAL OR ENZYMOLOGICAL PROCESSES
- C12Q1/00—Measuring or testing processes involving enzymes, nucleic acids or microorganisms; Compositions therefor; Processes of preparing such compositions
- C12Q1/68—Measuring or testing processes involving enzymes, nucleic acids or microorganisms; Compositions therefor; Processes of preparing such compositions involving nucleic acids
- C12Q1/6876—Nucleic acid products used in the analysis of nucleic acids, e.g. primers or probes
- C12Q1/6883—Nucleic acid products used in the analysis of nucleic acids, e.g. primers or probes for diseases caused by alterations of genetic material
- C12Q1/6886—Nucleic acid products used in the analysis of nucleic acids, e.g. primers or probes for diseases caused by alterations of genetic material for cancer
-
- C—CHEMISTRY; METALLURGY
- C12—BIOCHEMISTRY; BEER; SPIRITS; WINE; VINEGAR; MICROBIOLOGY; ENZYMOLOGY; MUTATION OR GENETIC ENGINEERING
- C12Q—MEASURING OR TESTING PROCESSES INVOLVING ENZYMES, NUCLEIC ACIDS OR MICROORGANISMS; COMPOSITIONS OR TEST PAPERS THEREFOR; PROCESSES OF PREPARING SUCH COMPOSITIONS; CONDITION-RESPONSIVE CONTROL IN MICROBIOLOGICAL OR ENZYMOLOGICAL PROCESSES
- C12Q2600/00—Oligonucleotides characterized by their use
- C12Q2600/106—Pharmacogenomics, i.e. genetic variability in individual responses to drugs and drug metabolism
-
- C—CHEMISTRY; METALLURGY
- C12—BIOCHEMISTRY; BEER; SPIRITS; WINE; VINEGAR; MICROBIOLOGY; ENZYMOLOGY; MUTATION OR GENETIC ENGINEERING
- C12Q—MEASURING OR TESTING PROCESSES INVOLVING ENZYMES, NUCLEIC ACIDS OR MICROORGANISMS; COMPOSITIONS OR TEST PAPERS THEREFOR; PROCESSES OF PREPARING SUCH COMPOSITIONS; CONDITION-RESPONSIVE CONTROL IN MICROBIOLOGICAL OR ENZYMOLOGICAL PROCESSES
- C12Q2600/00—Oligonucleotides characterized by their use
- C12Q2600/156—Polymorphic or mutational markers
-
- C—CHEMISTRY; METALLURGY
- C12—BIOCHEMISTRY; BEER; SPIRITS; WINE; VINEGAR; MICROBIOLOGY; ENZYMOLOGY; MUTATION OR GENETIC ENGINEERING
- C12Q—MEASURING OR TESTING PROCESSES INVOLVING ENZYMES, NUCLEIC ACIDS OR MICROORGANISMS; COMPOSITIONS OR TEST PAPERS THEREFOR; PROCESSES OF PREPARING SUCH COMPOSITIONS; CONDITION-RESPONSIVE CONTROL IN MICROBIOLOGICAL OR ENZYMOLOGICAL PROCESSES
- C12Q2600/00—Oligonucleotides characterized by their use
- C12Q2600/158—Expression markers
Definitions
- Somatic gene mutations in cancer may influence anti-cancer immunity.
- somatic gene mutations in cancer cells may give rise to neoantigens capable of eliciting T cell mediated cytolysis of the cancer cells.
- somatic gene mutations in cancer cells may also contribute to the ability of the cancer cells to evade T cell mediated cytolysis. Evasion of T cell mediated cytolysis by the cancer cells may impair the effectiveness of immunotherapies.
- immunotherapies Despite advancements in the immunotherapeutic treatment of cancer, there exists a need for improved methods of identifying genetic mutations which may impair T cell mediated cytolysis of cancer cells.
- An embodiment of the invention provides a method of selecting a therapy for a cancer patient, the method comprising: detecting a mutation in one or more genes in a cancer cell from the patient which is not present in a noncancerous cell, wherein the mutation decreases one or both of expression and activity of polypeptide(s) encoded by the one or more genes; and wherein the one or more genes is selected from the group consisting of PTCD2, TWF1, DEFB134, BBS1, SOX10, APLNR, CD58, COL17A1, CRKL, hsa-mir-101-2, hsa-mir-548s, MAD2L1, MLANA, PSMB5, RNPS1, RPL10A, RPL23, SRP54, TAF3, TAP1, TAP2, TAPBP, TBXAS1, GMIP, OTOA, LAIR1, CLEC1, GPSM3, TRAF1, JAK2, TAPBPL, ICAM1, LILRA1, LILRA3, STAT1, and HLA-F; selecting the patient
- An embodiment of the invention provides a method of selecting a therapy for a cancer patient, the method comprising: detecting a mutation in one or more polypeptides in a cancer cell from the patient which is not present in a noncancerous cell, wherein the mutation decreases activity of the polypeptide; and wherein the one or more polypeptides is encoded by a gene selected from the group consisting of PTCD2, TWF1, DEFB134, BBS1, SOX10, APLNR, CD58, COL17A1, CRKL, hsa-mir-101-2, hsa-mir-548s, MAD2L1, MLANA, PSMB5, RNPS1, RPL10A, RPL23, SRP54, TAF3, TAP1, TAP2, TAPBP, TBXAS1, GMIP, OTOA, LAIR1, CLEC1, GPSM3, TRAF1, JAK2, TAPBPL, ICAM1, LILRA1, LILRA3, STAT1, and HLA-F; selecting the patient for a therapy
- Still another embodiment of the invention provides a method of selecting a therapy for a cancer patient, the method comprising: measuring a level of one or both of (i) mRNA and (ii) polypeptide expressed from one or more genes in a cancer cell from the patient, wherein the one or more genes is selected from the group consisting of PTCD2, TWF1, DEFB134, BBS1, SOX10, APLNR, CD58, COL17A1, CRKL, hsa-mir-101-2, hsa-mir-548s, MAD2L1, MLANA, PSMB5, RNPS1, RPL10A, RPL23, SRP54, TAF3, TAP1, TAP2, TAPBP, TBXAS1, GMIP, OTOA, LAIR1, CLEC1, GPSM3, TRAF1, JAK2, TAPBPL, ICAM1, LILRA1, LILRA3, STAT1, and HLA-F; measuring the level of one or both of (i) mRNA and (ii) polypeptide expressed from the
- Still another embodiment of the invention provides a method of screening for one or more genes, the mutation of which confers resistance to T cell-mediated cytolytic activity, the method comprising: introducing a nucleic acid encoding a Cas endonuclease and a nucleic acid encoding a single guide RNA (sgRNA) molecule into a target cell, wherein the sgRNA hybridizes to a test gene in the target cell, forming a complex between the sgRNA and Cas endonuclease so that the Cas endonuclease introduces a double strand break in the test gene; deleting all or a portion of the test gene to decrease expression of the test gene; co-culturing the target cell having decreased expression of the test gene with an effector cell; co-culturing a negative control cell with the effector cell, wherein the negative control cell is identical to the target cell except that it does not comprise the nucleic acid encoding a Cas endonuclease and the nucle
- a mutation in, or a reduction in expression of, one or more of certain genes described herein renders a cancer cell resistant to T cell-mediated cytolysis. Accordingly, the presence of the mutation in, or the reduction of expression of, the one or more genes in a cancer cell of a patient may decrease the effectiveness of T cell anti-cancer therapies. Conversely, the absence of the mutation in, or a lack of a decrease of expression of, the one or more genes in a cancer cell of a patient may indicate that a T cell anti-cancer therapy may be effective for treating the cancer in the patient. Accordingly, detection of the presence or absence of the mutation in, or detection of a decrease or lack of decrease in the expression of, the one or more genes may be useful for selecting a type of therapy which may be more effective for treating the patient's cancer.
- An embodiment of the invention provides a method of selecting a therapy for a cancer patient.
- the method may comprise detecting a mutation in one or more genes in a cancer cell from the patient which is not present in a noncancerous cell.
- the one or more genes is selected from the group consisting of PTCD2, TWF1, DEFB134, BBS1, SOX10, APLNR, CD58, COL17A1, CRKL, hsa-mir-101-2, hsa-mir-548s, MAD2L1, MLANA, PSMB5, RNPS1, RPL10A, RPL23, SRP54, TAF3, TAP1, TAP2, TAPBP, TBXAS1, GMIP, OTOA, LAIR1, CLEC1, GPSM3, TRAF1, JAK2, TAPBPL, ICAM1, LILRA1, LILRA3, STAT1, and HLA-F.
- Nucleotide and amino acid sequences for the above genes in humans are accessible from publicly available databases, e.g., in the NCBI Entrez database accession numbers shown in Table I below. TABLE I Gene Full name Entrez gene ID No. APLNR Apelin Receptor 187 BBS1 Bardet-Biedl Syndrome 1 582 CD58 CD58 Molecule 965 CLEC1 C-Type Lectin Domain Family 1 Member A 51267 COL17A1 Collagen Type XVII Alpha 1 1308 CRKL V-Crk Avian Sarcoma Virus CT10 Oncogene Homolog-Like 1399 DEFB134 Defensin Beta 134 613211 GMIP GEM Interacting Protein 51291 GPSM3 G-Protein Signaling Modulator 3 63940 HLA-F Major Histocompatibility Complex, Class I, F 3134 hsa-mir-101-2 MicroRNA 101-2 406894 hsa-mir-548s MicroRNA 548s 100422862 ICAM1
- the cancer cell may be obtained from any bodily sample derived from a patient which contains or is expected to contain tumor or cancer cells.
- the noncancerous (normal, healthy) cell may be obtained from any bodily sample which does not contain tumor or cancer cells.
- the bodily sample may be any tissue sample such as blood, a tissue sample obtained from the primary tumor or from tumor metastases, or any other sample containing tumor or cancer cells.
- the normal, noncancerous cell may be obtained from the patient or a different individual.
- Genetic material may be obtained directly from the patient, or the genetic material can be copied or amplified from genetic material within the patient's cells (e.g., via polymerase chain reaction (PCR), reverse transcription polymerase chain reaction (RT-PCR), or other suitable technique).
- PCR polymerase chain reaction
- RT-PCR reverse transcription polymerase chain reaction
- the genetic material may be amplified from cells obtained from the patient, and the amplified genetic material is assayed in accordance with the inventive method.
- a PCR or RT-PCR strategy is employed using primers flanking all or a portion of a gene set forth in Table I, so as to amplify this sequence from the patient for the assay.
- the method may comprise amplifying and assaying one copy of a gene in Table I, preferably, the method comprises amplifying both copies of the gene from the patient, so that both can be assayed in accordance with the inventive method.
- the method may comprise assaying the genetic material to detect a mutation in one or more of the genes set forth in Table I (e.g., a mutation at least one of the two alleles of any gene in Table I) in a cancer cell of the patient which is not present in a noncancerous cell.
- Any test able to detect mutations appropriate to the type of genetic material e.g., genomic DNA (gDNA), cDNA, RNA
- the assaying may comprise obtaining, from the cancer cell and from the noncancerous cell, the sequence of at least a portion of the genetic sequence of one or more genes set forth in Table I or obtaining the sequence of substantially all of the genetic sequence of one or more genes set forth in Table I.
- the method may further comprise comparing the sequence of the gene of a cancer cell from the patient to the sequence of the corresponding gene in the noncancerous cell (e.g., the wild type genetic sequence) and identifying any differences between the sequence of the gene in the cancer cell from the patient and the corresponding gene in the noncancerous cell (e.g., the wild type genetic sequence) to detect any mutations.
- the method may comprise sequencing nucleic acid such as DNA or RNA of the one or more genes in the cancer cell.
- the method may further comprise sequencing nucleic acid such as DNA or RNA of the one or more genes in the noncancerous cell.
- the method comprises detecting a mutation in 1 or more, 2 or more, 3 or more, 4 or more, 5 or more, 6 or more, 7 or more, 8 or more, 9 or more, 10 or more, 11 or more, 12 or more, 13 or more, 14 or more, 15 or more, 16 or more,
- the method comprises detecting a mutation in all 36 of these genes in a cancer cell from the patient.
- the mutation may be any mutation which decreases one or both of (i) the expression of and (ii) the activity of the polypeptide(s) encoded by the one or more genes.
- the gene with the mutation may encode a mutated amino acid sequence.
- the mutation may be a "non-silent mutation.”
- Non-limiting examples of mutations that may be detected in the inventive methods include missense, nonsense, insertion, deletion, duplication, frameshift, and repeat expansion mutations.
- the mutation may be a loss-of-function mutation. A loss-of-function mutation decreases or eliminates expression or activity of the encoded polypeptide.
- One or more mutations may be detected in a given gene in accordance with the invention.
- the mutation may be any mutation which decreases the expression of one or both of the mRNA and the polypeptide encoded by the gene.
- a cell with the mutation expresses a lower amount of one or both of mRNA and polypeptide encoded by the gene as compared to the noncancerous cell.
- the amount of one or both of mRNA and polypeptide expressed by the cell with the mutation may be, for example, about 10% lower, about 20% lower, about 30% lower, about 40% lower, about 50% lower, about 60% lower, about 70% lower, about 80% lower, about 90% lower as compared to that expressed by the noncancerous cell.
- a cell with the mutation exhibits no detectable expression of one or both of mRNA and polypeptide encoded by the gene.
- Methods of measuring the level of mRNA expression are known in the art and may include, for example, quantitative polymerase chain reaction (qPCR), RNA sequencing (RNAseq), Northern blot, immunohistochemistry, fluorescence insitu hybridization (FISH), and other methods utilizing sequence probes which are complementary to the RNA of interest.
- Methods of measuring the level of polypeptide expression are known in the art and may include, for example, Western blot, immunohistochemistry, PROTEINSIMPLE protein quantitation, Edman peptide sequencing, and mass spectrometry.
- the mutation may be any mutation which decreases the biological activity of the polypeptide(s) encoded by the one or more genes.
- a cell with the mutation exhibits a decreased biological activity of the polypeptide(s) as compared to the noncancerous cell.
- the biological activity of the polypeptide(s) expressed by the cell with the mutation may be, for example, about 10% lower, about 20% lower, about 30% lower, about 40% lower, about 50% lower, about 60% lower, about 70% lower, about 80% lower, about 90% lower as compared to that of the noncancerous cell.
- a cell with the mutation exhibits no detectable biological activity of the polypeptide encoded by the gene.
- the method may further comprise selecting the patient for a therapy which is not a T cell therapy when the mutation in one or more genes is present in the cancer cell and selecting the patient for a T cell therapy when the mutation in one or more genes of Table I is not present in the cancer cell.
- the method comprises selecting the patient for a T cell therapy when a mutation which decreases one or both of expression and activity of the encoded polypeptide is not present in all of the 36 genes listed in Table I.
- the presence of a mutation in one or more genes of Table I indicates that the cancer cells in the patient are resistant to T cell-mediated cytolysis and, consequently, that T cell therapy may be less effective in treating the cancer in the patient.
- the absence of a mutation in one or more of (or all of) the genes of Table I indicates that the cancer cells in the patient are sensitive to T cell-mediated cytolysis and, consequently, that T cell therapy may be effective in treating the cancer in the patient.
- Another embodiment of the invention provides a method of selecting a therapy for a cancer patient and treating cancer in the patient.
- the method may comprise selecting a therapy for the cancer patient by detecting a mutation in one or more genes in a cancer cell by any of the methods described herein with respect to other aspects of the invention.
- the method may further comprise treating the patient by administering a therapy which is not a T cell therapy to the patient in an amount effective to treat cancer in the patient when the mutation in the one or more genes is present in the cancer cell and treating the patient by administering a T cell therapy to the patient in an amount effective to treat cancer in the patient when the mutation in the one or more genes is not present in the cancer cell.
- the method comprises treating the patient by administering a T cell therapy to the patient in an amount effective to treat cancer in the patient when the mutation in all 36 of the genes set forth in Table I is not present in the cancer cell.
- a mutation may be detected in a polypeptide encoded by one or more of the genes set forth in Table I.
- another embodiment of the invention provides a method of selecting a therapy for a cancer patient, the method comprising detecting a mutation in one or more polypeptides in a cancer cell from the patient which is not present in a noncancerous cell, wherein the one or more polypeptides is encoded by a gene selected from the group consisting of PTCD2, TWF1, DEFB134, BBS1, SOX10, APLNR, CD58, COL17A1, CRKL, hsa-mir-101-2, hsa-mir-548s, MAD2L1, MLANA, PSMB5, RNPS1, RPL10A, RPL23, SRP54, TAF3, TAP1, TAP2, TAPBP, TBXAS1, GMIP, OTOA, LAIR1, CLEC1, GPSM3, TRAF1, JAK2, TAPBPL, ICAM1, LILRA1, L
- the cancer cell and the noncancerous cell may be as described herein with respect to other aspects of the invention.
- the mutation may decrease the activity of the polypeptide, as described herein with respect to other aspects of the invention.
- the polypeptide with the mutation may be encoded by a gene set forth in Table I including any of the types of mutations described herein with respect to other aspects of the invention.
- the method may comprise assaying a sample comprising cancer cells from the patient to detect a mutation in a polypeptide encoded by one or more genes set forth in Table I.
- the polypeptide can be purified from the sample (either partially or substantially and assayed via immunohistological techniques (e.g., Western blotting, ELISA, immunoprecipitation, etc.) using one or more antibodies recognizing the mutated polypeptide but not the corresponding polypeptide from the noncancerous cell (e.g., the wild type polypeptide).
- the assaying may comprise contacting the sample with an antibody that specifically binds to the mutated polypeptide and does not bind to the corresponding polypeptide from the noncancerous cell (e.g., the wild type polypeptide), thereby forming a complex, and detecting the complex.
- the sample from the patient can be assayed using one or more antibodies recognizing the polypeptide from the noncancerous cell (e.g., the wild type polypeptide) but not the corresponding mutated polypeptide.
- the assaying may comprise contacting the sample with an antibody that specifically binds to the polypeptide from the noncancerous cell and does not bind to the corresponding mutated polypeptide, thereby forming a complex, and detecting the complex.
- the method may further comprise selecting the patient for a therapy which is not a T cell therapy when the mutation is present in the cancer cell, as described herein with respect to other aspects of the invention.
- the method may comprise selecting the patient for a T cell therapy when the mutation is not present in the cancer cell, as described herein with respect to other aspects of the invention.
- the method comprises selecting the patient for a T cell therapy when the mutation which decreases activity of the encoded polypeptide is not present in the polypeptides encoded by all of the 36 genes listed in Table I.
- Another embodiment of the invention provides a method of selecting a therapy for a cancer patient and treating the cancer in the patient.
- the method may comprise selecting a therapy for the cancer patient by detecting a mutation in one or more polypeptides in a cancer cell by any of the methods described herein with respect to other aspects of the invention.
- the method may further comprise treating the cancer in the patient by administering a therapy which is not a T cell therapy to the patient in an amount effective to treat cancer in the patient when the mutation in the one or more polypeptides is present in the cancer cell and treating the cancer in the patient by administering a T cell therapy to the patient in an amount effective to treat cancer in the patient when the mutation in the one or more polypeptides is not present in the cancer cell.
- the method comprises treating the cancer in the patient by administering a T cell therapy to the patient in an amount effective to treat cancer in the patient when the mutation in the polypeptides encoded by all of the genes set forth in Table I is not present in the cancer cell.
- the cancer cell with the mutation in one or both of the gene and the polypeptide encoded by the gene may be more resistant to T cell-mediated cytolysis as compared to a control cell which is identical to the cancer cell except that it lacks the mutation.
- the mutation confers resistance to T cell-mediated cytolysis to the cancer cell.
- T cell-mediated cytolysis refers in general to the cytolysis carried out by T cells, e.g., the mediation of the targeted destruction of cells by T cells. In the context of the present invention, the term typically refers to the capacity of T cells to kill cancer cells, e.g. via cytotoxic T cell activity.
- T cell-mediated cytolysis may be determined by measuring the expression by T cells of one or more markers which mediate cytolysis, e.g., one or more of granzyme A, perforin, interferon (IFN) gamma, IL-2, and tumor necrosis factor alpha (TNF- ⁇ ) , granulocyte/monocyte colony stimulating factor (GM-CSF), IL-4, IL-5, IL-9, IL-10, IL-17, IL-22, PD-1, LAG-3, TIM-3, 4-1BB, OX40, and CD107a, upon co-culture with target cancer cells.
- T cell-mediated cytolysis may be determined using one or more of a chromium release assay and an apoptosis assay measuring target cell lysis.
- an embodiment of the invention provides a method of selecting a therapy for a cancer patient, the method comprising measuring a level of one or both of (i) mRNA and (ii) polypeptide expressed from one or more genes in a cancer cell from the patient, wherein the one or more genes is selected from the group consisting of PTCD2, TWF1, DEFB134, BBS1, SOX10, APLNR, CD58, COL17A1, CRKL, hsa-mir-101-2, hsa-mir-548s, MAD2L1, MLANA, PSMB5, RNPS1, RPL10A, RPL23, SRP54, TAF3, TAP1, TAP2, TAPBP, TBXAS1, GMIP, OTOA, LAIR1, CLEC1, GPSM3, TRAF1, JAK2, TAPBPL, ICAM1, LILRA1, LILRA3, STAT1, and HLA-F
- the method further comprises measuring the level of one or both of (i) mRNA and (ii) polypeptide expressed from the same one or more genes in a noncancerous cell.
- the cancerous cell and the noncancerous cell may be as described herein with respect to other aspects of the invention.
- Measuring the level of one or both of (i) mRNA and (ii) polypeptide expressed may be as described herein with respect to other aspects of the invention.
- the method may further comprise comparing the level of one or both of (i) mRNA and (ii) polypeptide measured in the cancer cell with the level of one or both of (i) mRNA and (ii) polypeptide, respectively, measured in the noncancerous cell.
- the method may further comprise selecting the patient for a therapy which is not a T cell therapy when the level of one or both of (i) mRNA and (ii) polypeptide measured in the cancer cell is decreased as compared to the level of one or both of (i) mRNA and (ii) polypeptide, respectively, measured in the noncancerous cell and selecting the patient for a T cell therapy when the level of one or both of (i) mRNA and (ii) polypeptide measured in the cancer cell is not decreased as compared to the level of one or both of (i) mRNA and (ii) polypeptide, respectively, measured in the noncancerous cell.
- the method comprises selecting the patient for a T cell therapy when the level of one or both of (i) mRNA and (ii) polypeptide encoded by all of the 36 genes listed in Table I is not decreased.
- the amount of one or both of mRNA and polypeptide encoded by one or more genes set forth in Table I expressed by the cancer cell may be, for example, about 10% lower, about 20% lower, about 30% lower, about 40% lower, about 50% lower, about 60% lower, about 70% lower, about 80% lower, about 90% lower as compared to that expressed by the noncancerous cell.
- the cancer cell exhibits no detectable expression of one or both of mRNA and polypeptide encoded by the gene. Methods of measuring the level of mRNA expression and the level of polypeptide expression may be as described herein with respect to other aspects of the invention.
- the decrease in the level of one or both of (i) mRNA and (ii) polypeptide confers resistance to T cell-mediated cytolysis to the cancer cell.
- Resistance to T cell-mediated cytolysis may be as described herein with respect to other aspects of the invention.
- Another embodiment of the invention provides a method of selecting a therapy for a cancer patient and treating cancer in the patient, the method comprising selecting a therapy for the cancer patient by measuring a level of one or both of (i) mRNA and (ii) polypeptide expressed from one or more genes in Table I as described herein with respect to other aspects of the invention.
- the method further comprises treating the patient by administering a therapy which is not a T cell therapy to the patient in an amount effective to treat cancer in the patient when the level of one or both of (i) mRNA and (ii) polypeptide measured in the cancer cell is decreased as compared to the level of one or both of (i) mRNA and (ii) polypeptide, respectively, measured in the noncancerous cell and treating the patient by administering a T cell therapy to the patient in an amount effective to treat cancer in the patient when the level of one or both of (i) mRNA and (ii) polypeptide measured in the cancer cell is not decreased as compared to the level of one or both of (i) mRNA and (ii) polypeptide, respectively, measured in the noncancerous cell.
- a therapy which is not a T cell therapy to the patient in an amount effective to treat cancer in the patient when the level of one or both of (i) mRNA and (ii) polypeptide measured in the cancer cell is decreased as compared to the level of one
- the method comprises administering a T cell therapy to the patient in an amount effective to treat cancer in the patient when the level of one or both of (i) mRNA and (ii) polypeptide encoded by all of the genes set forth in Table I measured in the cancer cell is not decreased as compared to the level of one or both of (i) mRNA and (ii) polypeptide, respectively, measured in the noncancerous cell.
- the T cell therapy employed in the inventive methods is not limited and may comprise any therapy comprising one or both of (i) one or more T cells and (ii) one or more cells which have been modified to express a T cell receptor.
- the one or more cells which have been modified to express a T cell receptor may be a T cell prior to being modified to express a T cell receptor or may be a cell other than a T cell which has been modified to express a T cell receptor.
- the T cell can be any T cell, such as a cultured T cell, e.g., a primary T cell, or a T cell from a cultured T cell line, e.g., Jurkat, SupT1, etc., or a T cell obtained from a mammal. If obtained from a mammal, the T cell can be obtained from numerous sources, including but not limited to blood, bone marrow, lymph node, thymus, spleen, or other tissues or fluids. Cells can also be enriched for or purified. Preferably, the T cell is a human T cell.
- the T cell can be any type of T cell and can be of any developmental stage, including but not limited to, CD4 + /CD8 + double positive T cells, CD4 + helper T cells, e.g., Thi and Th 2 cells, CD4 + T cells, CD8 + T cells (e.g., cytotoxic T cells), tumor infiltrating cells (TILs), memory T cells, naive T cells, and the like.
- CD4 + /CD8 + double positive T cells CD4 + helper T cells, e.g., Thi and Th 2 cells
- CD4 + T cells CD8 + T cells (e.g., cytotoxic T cells), tumor infiltrating cells (TILs), memory T cells, naive T cells, and the like.
- CD4 + /CD8 + double positive T cells CD4 + helper T cells, e.g., Thi and Th 2 cells
- CD4 + T cells e.g., CD4 + T cells
- CD8 + T cells e.g.,
- the therapy which is not a T cell therapy employed in the inventive methods is not limited and may include any therapy which does not comprise both of (i) one or more T cells and (ii) one or more cells which have been modified to express a T cell receptor.
- therapies which are not a T cell therapy include, but are not limited to, surgical resection, chemotherapy, radiotherapy, NK cell therapy, B cell therapy, gene therapy, anti-cancer vaccine therapy, targeted drug inhibitor therapy, or any combination thereof.
- Tumorted drug inhibitor therapy refers to therapies which employ an inhibitor of a cancer protein.
- An example of a targeted drug inhibitor therapy is vemurafenib, which targets mutated B-RAF.
- cancer protein refers to any molecule (e.g., protein, polypeptide, peptide, lipid, carbohydrate, etc.) solely or predominantly expressed or over-expressed by a tumor cell or cancer cell, such that the protein is associated with the tumor or cancer.
- the cancer protein can additionally be expressed by normal, non-tumor, or non-cancerous cells. However, in such cases, the expression of the cancer protein by normal, non-tumor, or non-cancerous cells is not as robust as the expression by tumor or cancer cells.
- the tumor or cancer cells can over-express the protein or express the protein at a significantly higher level, as compared to the expression of the protein by normal, non-tumor, or non-cancerous cells.
- the cancer protein can additionally be expressed by cells of a different state of development or maturation.
- the cancer protein can be additionally expressed by cells of the embryonic or fetal stage, which cells are not normally found in an adult host.
- the cancer protein can be additionally expressed by stem cells or precursor cells, which cells are not normally found in an adult host.
- Cancer proteins include, for instance, mesothelin, CD19, CD22, CD276 (B7H3), gp100, MART-1, Epidermal Growth Factor Receptor Variant III (EGFRVIII), TRP-1, TRP-2, tyrosinase, NY-ESO-1 (also known as CAG-3), MAGE-1, MAGE-3, etc.
- Another embodiment of the invention provides a method of screening for one or more genes, the mutation of which confers resistance to T cell-mediated cytolytic activity.
- the inventive screening method may provide advantages over in vitro single cell-type screens or in vivo screens including, for example, any one or more of (1) the providing of information about how genetic manipulations in one cell type can affect a complex interaction between cell types; (2) the ability to perform the pooled screen with a much higher library representation than can typically be achieved in vivo; and (3) the ability to identify genes and pathways which may not be detected by in vitro single cell-type screens or the uncontrolled environment of in vivo screens.
- the inventive screening method may employ the CRISPR/Cas system.
- the CRISPR/Cas system is described at, for example, Cheng et al., Cell Res., 23: 1163-71 (2013 ). Briefly, the CRISPR/Cas system involves creating specific double-stranded breaks (DSBs) at targeted locations in the genome using the Cas endonuclease. Endogenous mechanisms in the cell are used to repair the induced break by homologous recombination (HR) and nonhomologous end-joining (NHEJ). The CRISPR/Cas system may be used to knockout expression of a gene of interest.
- the inventive method may comprise introducing a nucleic acid encoding a Cas endonuclease and a nucleic acid encoding a single guide RNA (sgRNA) molecule into a target cell, wherein the sgRNA hybridizes to a test gene in the target cell, and forming a complex between the sgRNA and Cas endonuclease so that the Cas endonuclease introduces a double strand break in the test gene.
- sgRNA single guide RNA
- Cas endonucleases include Casl B, Cas2, Cas3, Cas4, Cas5, Cas6, Cas7, Cas8, Cas9 (also known as Csnl and Csxl2), CaslO, Csyl, Csy2, Csy3, Csel, Cse2, Cscl, Csc2, Csa5, Csn2, Csm2, Csm3, Csm4, Csm5, Csm6, Cmrl, Cmr3, Cmr4, Cmr5, Cmr6, Csbl, Csb2, Csb3, and Csxl7.
- the Cas endonuclease is Cas9.
- the sgRNA specifically hybridizes to the test gene such that the sgRNA hybridizes to the test gene and does not hybridize to any other gene that is not the test gene.
- the method may further comprise deleting all or a portion of the test gene to decrease expression of the test gene.
- the expression of the test gene may be decreased by any amount, for example, by about 10%, about 20%, about 30%, about 40%, about 50%, about 60%, about 70%, about 80%, or about 90%.
- expression of the test gene is decreased so that there is no detectable expression of the test gene.
- the method may further comprise co-culturing the target cell having decreased expression of the test gene with an effector cell and co-culturing a negative control cell with the effector cell, wherein the negative control cell is identical to the target cell except that it does not comprise the nucleic acid encoding a Cas endonuclease and the nucleic acid encoding a single guide RNA (sgRNA) molecule and does not have decreased expression of the test gene.
- the co-culture may be carried out in any suitable manner known in the art that facilitates interaction of the target cell with the effector cell.
- the co-culture may comprise culturing the target cell and the effector cell so that they are in direct physical contact with one another.
- the method may further comprise measuring a level of lysis of the target cell by the effector cell and measuring a level of lysis of the negative control cell by the effector cell.
- the level of lysis may be determined by any suitable manner known in the art. For example, when the effector cell is a T cell, measuring the level of lysis may be carried out by measuring the expression by the T cells of one or more markers which mediate cytolysis, as described herein with respect to other aspects of the invention.
- the method may further comprise comparing the level of lysis of the target cell to the level of lysis of the negative control cell.
- a decrease in the level of lysis of the target cell as compared to the level of lysis of the negative control cell indicates that mutation of the test gene confers resistance to T cell-mediated cytolytic activity to the target cell.
- a lack of a decrease in the level of lysis of the target cell as compared to the level of lysis of the negative control cell indicates that mutation of the test gene does not confer resistance to T cell-mediated cytolytic activity to the target cell.
- the mutation may be as described herein with respect to other aspects of the invention.
- the decrease in the level of lysis of the target cell as compared to the level of lysis of the negative control cell may be a decrease of any amount.
- the decrease in the level of lysis of the target cell may be a decrease of about 10%, about 20%, about 30%, about 40%, about 50%, about 60%, about 70%, about 80%, about 90% as compared to the level of lysis of the negative control cell.
- the test gene may be any gene of interest.
- the test gene may be any gene which is suspected or known to be involved in the interaction of the target cell with the effector cell.
- the test gene is any one of the genes set forth in Table I.
- the target cell may be any cell of interest.
- the target cell may be any cell which is suspected or known to interact with the effector cell.
- the target cell is a cancer cell.
- the cancer cell may be as described herein with respect to other aspects of the invention.
- the effector cell may be any effector cell of interest.
- the effector cell is a T cell.
- the cell is a cell which has been modified to express a T cell receptor.
- the T cell, and the cell which has been modified to express a T cell receptor may be as described herein with respect to other aspects of the invention.
- the cancer may be any cancer, including any of acute lymphocytic cancer, acute myeloid leukemia, alveolar rhabdomyosarcoma, bone cancer, brain cancer, breast cancer, cancer of the anus, anal canal, or anorectum, cancer of the eye, cancer of the intrahepatic bile duct, cancer of the joints, cancer of the neck, gallbladder, or pleura, cancer of the nose, nasal cavity, or middle ear, cancer of the oral cavity, cancer of the vulva, chronic lymphocytic leukemia, chronic myeloid cancer, colon cancer, esophageal cancer, cervical cancer, gastrointestinal carcinoid tumor, Hodgkin lymphoma, hypopharynx cancer, kidney cancer, larynx cancer, liver cancer, lung cancer, malignant mesothelioma, melanoma, multiple myeloma, nasopharynx cancer, non-Hodgkin lymphoma, ovarian cancer, pancreatic cancer,
- inventive methods can provide any amount of any level of treatment of cancer in a patient.
- treatment provided by the inventive method can include treatment of one or more conditions or symptoms of the cancer being treated.
- treatment can include promoting the regression of a tumor.
- PBMC samples peripheral blood mononuclear cell (PBMC) samples were derived from patients with melanoma or healthy donors with consents and procedures approved by the institutional-review board (IRB) of the National Cancer Institute (NCI).
- IRB institutional-review board
- NCI National Cancer Institute
- the melanoma cell lines HLA-A2 + /MART-1 + / NY-ESO-1 + (Mel624.38, Mel1300), HLA-A2 - (Mel938) and HLA-A2 + / NY-ESO-1 - (Mel526) were isolated from surgically resected metastases as described ( Johnson et al., J. Immunol., 177: 6548-6559 (2006 )) and were cultured in RPMI 1640 (Invitrogen, Carlsbad, CA) medium supplemented with 10% fetal bovine serum (FBS, Hyclone, Logan, UT).
- FBS fetal bovine serum
- the A375 (HLA-A2 + /NY-ESO-1 + ) and SK23 (NY-ESO-1 - ) cell lines were obtained from the American Type Culture Collection (Manassas, VA).
- the SK23 cell-line transduced with retrovirus containing NY-ESO-1 expressing vector was obtained from Ken-ichi Hanada (NCI). All melanoma cell lines were cultured in D10 medium containing DMEM supplemented 10% FBS, 2 mM L-glutamine, and 1% penicillin-streptomycin.
- T cell medium which is: AIM-V medium (Invitrogen) supplemented with 5% human AB serum (Valley Biomedical, Winchester, VA), 100 U/ml penicillin and 100 ⁇ g/ml streptomycin, 2 mM L-glutamine and 12.5 mM HEPES (Life Technologies).
- Retroviral vectors for TCRs recognizing the HLA-A ⁇ 02-restricted melanoma antigens NY-ESO-1 (NY-ESO-1:157-165 epitope) and MART-1 (MART-1:27-35 epitope, DMF5) were generated as previously described ( Johnson et al., J. Immunol., 177: 6548-6559 (2006 ); Robbins et al., J. Immunol., 180: 6116-6131 (2008 )). Clinical grade cGMP-quality retroviral supernatants were produced by the National Gene Vector Laboratories at Indiana University.
- peripheral blood lymphocytes PBLs (2 ⁇ 10 6 cell/mL) were stimulated with IL-2 (300 IU/mL) and anti-CD3 antibody OKT3 (300 IU/ mL) on Day 0.
- PBLs peripheral blood lymphocytes
- IL-2 300 IU/mL
- OKT3 300 IU/ mL
- Non-tissue culture treated six-well plates were coated with 2 mL/well of 10 ⁇ g/mL RetroNectin (Takara Bio, Otsu, Japan) on day 1 and stored overnight at 4 °C.
- Serial dilutions of vector supernatant (4 mL/well, diluted with D10 media) were applied to plates on day 2 followed by centrifugation at 2000 ⁇ g for 2h at 32 °C.
- cells After harvest, cells underwent a rapid expansion protocol (REP) in the presence of soluble OKT3 (300 IU/mL), IL-2 (6000 IU/mL) and irradiated feeders as previously described ( Johnson et al., J. Immunol., 177: 6548-6559 (2006 )). After day 5 of the REP, cells were maintained in culture at 0.7-1.0 ⁇ 10 6 cell/mL until harvested for testing on day 7-10 or frozen down for co-culture later.
- REP rapid expansion protocol
- HEK293FT cells (Invitrogen) were cultured in D10 medium. One day prior to transfection, HEK293FT cells were seeded in T-225 flasks at 60% confluency. One to two hours before transfection, DMEM media was replaced with 13 mL of pre-warmed serum-free OptiMEM media (Invitrogen). Cells were transfected using LIPOFECTAMINE 2000 reagent and PLUS reagent (Invitrogen).
- OptiMEM For each flask, 4 mL of OptiMEM was mixed with 200 ⁇ L of PLUS reagent, 20 ⁇ g of LENTICRISPRV2 plasmid or pooled plasmid human GeCKOv2 (Genome-scale CRISPR Knock-Out) library, 15 ⁇ g psPAX2 (Addgene, Cambridge, MA) and 10 ⁇ g pMD2.G (Addgene). 100 uL LIPOFECTAMINE 2000 reagent was diluted with 4 mL of OPTIMEM medium and was combined to the mixture of plasmids and PLUS reagent. This transfection mixture was incubated for 20 minutes and then added dropwise to the cells.
- viral supernatants were concentrated by centrifugation at 4,000 rcf and 4 °C for 35 min in AMICON ULTRA-15 filters (Millipore Ultracel-100K). Concentrated viral supernatants were stored in aliquots at - 80 °C.
- T cell tumor cell
- TCRs T cell receptors
- NY-ESO-1 NY-ESO1:157-165 epitope
- Mel624 heterogeneous melanoma cell line
- Mel624 WT patient-derived Mel624 cells which express both NY-ESO-1 and MART-1 antigens in an HLA-A ⁇ 02-restricted manner were selected allowing targeting of these cells with either low-avidity NY-ESO-1 T cells or high-avidity MART-1 T cells during co-culture experiments.
- the selection pressure of T cells was reduced by modulating the length of co-incubation time and E:T ratios such that ⁇ 20% of cells survived after 24 hours of co-culture at an E:T ratio of 0.5.
- gamma-interferon (IFN ⁇ ) release was measured with control cell-lines (Table 1), and cell survival post co-incubation of NY-ESO-1 T cells with non-NY-ESO-1 expressing SK23 and NY-ESO-1 expressing SK23 and Mel624 cells ( Fig 1B ).
- ⁇ 2M (encoded by B2M ) is upregulated on tumor cells upon interaction with T cells in an IFN ⁇ dependent manner. It was found that after co-incubation in as little as 6 hours, tumor cells interact sufficiently with T cells to achieve an increase in ⁇ 2M expression.
- Mel624 cells were transduced with the human GeCKOv2 library virus using spinfection. To determine the functional titer and achieve a target MOI (multiplicity of infection) of 0.3-0.4, a test transduction was carried out. Specifically, Mel624 cells were infected in 12-well plate format with different viral volumes (10, 30, 50, 100 and 150 ⁇ L) of each library in D10 media supplemented with 6 ⁇ g/mLpolybrene (Sigma-Aldrich, Saint Louis, MO). Spinfection was carried out by centrifugation at 1,000 rcf for 1 h at 30 °C.
- infected cells were reseeded into 2 wells of a 12-well plate each with D10 media; one well was supplemented with 1 ⁇ g/ml puromycin. Cells were counted at day 5 post-selection to calculate the infection efficiency by comparing survival with and without puromycin selection. The highest viral volume yielding an MOI ⁇ 0.4 was used for large-scale screening.
- Screening scale spinfection was performed with enough Mel624 cells in 12-well plate format to achieve minimum representation of ⁇ 300 cells per sgRNA in the library. Cells were trypsinized 12 hours after spinfection and seeded in T-flasks. Twenty-four hours post-spinfection, cells were selected with 1 ⁇ g/mL puromycin for 5-7 days to eliminate uninfected cells.
- T cells were used for co-culture assays. Two days prior to co-culture, cells were thawed in T cell media containing 3 U/mL DNAse (Genentech Inc., South San Francisco, CA) overnight. Tumor cells were seeded at a specific density on this day in the same media as the T cells. T cells were then cultured in T cell media containing 300 IU/mL interleukin-2 (IL2) for 24 hours. T cells were co-cultured with tumor cells at various Effector: Target (E:T ratios) for varying time periods.
- E:T ratios Effector: Target
- T cells were removed by careful 2x phosphate buffered saline (PBS) washes following the addition of D10 media without IL2.
- PBS phosphate buffered saline
- tumor cells were detached using trypsin (Invitrogen) and washed twice with PBS. Tumor cells were then stained with fixable LIVE/DEAD dye (Invitrogen) followed by human anti-CD3 antibody (SK7, BD) in FACS staining buffer (PBS + 0.2% BSA). Cell counts were measured using COUNTBRIGHT Absolute Counting Beads (Invitrogen) by flow cytometry.
- gDNA extraction from harvested tumor cells minimum 3 ⁇ 10 7 control cells
- frozen cell pellets were thawed.
- An ammonium acetate and alcohol precipitation procedure was used to isolate gDNA as previously described ( Chen et al., Cell, 160: 1246-1260 (2015 )).
- the first step of extraction protocol was modified to use AL buffer (Qiagen) for cell lysis.
- PCR1 included amplification of the region containing sgRNA cassette using v2Adaptor _F and v2Adaptor_R primers
- PCR2 included amplification using uniquely barcoded P7 and P5 adaptor-containing primers to allow multiplexing of samples in a single HISEQ run. All PCR1 and PCR2 primer sequences, including full barcodes, are listed on the GeCKO website (genome-engineering.org/gecko/).
- PCR1 products for each sample were pooled and used for amplification with barcoded second step PCR primers. Seven PCR2 reactions were performed using 5 ⁇ L of the pooled PCR1 product per PCR2 reaction.
- Second PCR products were pooled and then normalized for each biological sample before combining uniquely-barcoded separate biological samples.
- the pooled product was then gel-purified from a 2% E-GEL EX (Life Technologies, Carlsbad, CA) using the QIAQUICK kit (Qiagen, Hilden, Germany).
- the purified, pooled library was then quantified with TAPESTATION 4200 instrument (Agilent Technologies, Santa Clara, CA). Diluted libraries with 5%-20% PhiX were sequenced with HISEQ 2000 system.
- Sequencing reads were demultiplexed using custom LINUX shell scripts, allowing for a maximum of 1 mismatch in either forward or reverse barcodes.
- Read alignment was performed with parameters -m 1 -v 1 -norc, which allows up to 1 mismatch and discards any reads that do not align in the forward orientation or that have multiple possible alignments. Aligned counts of library sgRNAs were imported into R/RStudio. Counts were first normalized by the total reads for each sample and then log-transformed. A gene ranking was computed using the second most enriched sgRNA for each gene. This ranking is robust to outlier/off-target effects that enrich/deplete a single sgRNA by requiring at least 2 enriched sgRNAs targeting the same gene.
- lentiCRISPRs Individual lentiCRISPRs were produced as above except that viral supernatants were not concentrated.
- 3-4 sgRNA guide sequences were used, where 2 sgRNAs sequences were designed de novo and other 2 sgRNAs were from GeCKOv2 library. These sgRNAs were cloned into the lentiCRISPRv2 vector (Addgene) as previously described ( Fig. 9 ).
- HEK293FT cells were seeded and transfected in 6-well plates where each well received a different lentiCRISPR plasmid.
- the lentiviral production protocol was the same as the one described above for GeCKOv2 library lentivirus production.
- Mel624 and A375 cells with unique gene perturbation were generated using these viral supernatants. Typically, 500 ul of lentiCRISPRv2 virus per 5 ⁇ 10 4 cells for Mel624 and A375 was used. Puromycin selection was applied to these cells for 5-7 days, which is the time period needed to completely kill an untransduced control for both Mel624 and A375.
- Cells were split and one half were frozen for analysis of insertion-deletion (indel) mutations after non-homologous end-joining repair and the remainder were normalized to seed 1 ⁇ 10 4 cells/well in 96-well plates.
- each cell line was co-cultured with appropriate T cells (either NY-ESO-1 or MART-1) in a 96-well plate format at an E:T ratio of 1:3 for 12 hours in T cell media.
- gentle 2x PBS washes were performed to remove the T cells.
- Mel624 or A375 cells were collected after a recovery phase culture of 48 hours for high-throughput flow cytometry analysis.
- Tumor cell counts were measured using a FACS-based COUNTBRIGHT bead method. Variability was noticed in proliferation and survival rates across cells depending on the sgRNA received. To account for this variability, a relative percent change was calculated for each sgRNA: (% ⁇ , 2CT vs noT) in tumor cells co-cultured with T cells (2CT) compared to tumor cell counts without T cells (noT).
- APLNR_sgRNA_1 TCTGGACCGTGTTTCGGAG (SEQ ID NO: 65) ACGCTGGCGTACATGTTGA (SEQ ID NO: 82) APLNR_sgRNA_3 CACTGGCCCTGTGACTTTGA (SEQ ID NO: 66) GTAGCTGGCTGACTTCTCCC (SEQ ID NO: 83) BBS1_sgRNA_2 AGAGGGTCAGTGGAGAGGTC (SEQ ID NO: 67) CTCCATGAGGAAGGTGGCAG (SEQ ID NO: 84) BBS1_sgRNA_4 AGCCTGGACTTGTACCCAGA (SEQ ID NO: 68) GGACCATTGTCTGACTCCCC (SEQ ID NO: 85) CD58_sgRNA_1 CGTAGGCGGTGCTTGAACTTA (SEQ ID NO: 69) CGTCTCTGATCGGCAACCG (SEQ ID NO: 86
- paired-end reads were trimmed for quality using trimmomatic with parameters SLIDINGWINDOW: 5 : 25 ( Bolger et al., Bioinformatics, (2014 )). Reads with surviving mate pairs were then aligned to their targeted amplicon sequence using Bowtie2 ( Langmead et al., Nat. Meth., 9: 357-59 (2012 )). To determine indel sizes, the size difference between observed reads and predicted read size based on the genomic reference sequence was calculated. If observed read size was equal to the predicted size, these reads were scored as no indels. The size difference was used to detect insertions or deletions.
- CD4 RPA-T4, BD, Franklin Lakes, NJ
- CD8 SK1, BD
- CD3e SK7, BD
- HLA-A2/MART-1 HLA-A2/MART-1:27-35 tetramer
- DMF5 Beckman Coulter Immunotech, Monrovia, CA
- NY-ESO-1 tetramer NIH Tetramer Core Facility
- PD1-L1 MIH1, eBiosciences, San Diego, CA
- PD1-L2 24F.10C12, Biolegend, San Diego, CA
- beta-Galectin 9M1-3, Biolegend
- CD58 (1C3, BD)
- b2M 2M2, Biolegend
- Flow cytometric data were acquired using either a FACSCANTO II or LSRII FORTESSA cytometer (BD), and data were analyzed with FLOWJO version 7.5 software (FlowJo LLC, Ashland, OR).
- FLOWJO version 7.5 software FlowJo LLC, Ashland, OR.
- the amount of IFN ⁇ release by T cells after co-culture with tumor cells was measured by Sandwich ELISA assay using anti-IFN ⁇ (Thermo Scientific M700A) coated 96-well plates, biotin-labeled anti-IFNy (M701B), HRP-conjugated streptavidin (N100) and TMB substrate solution (N301).
- Total protein was extracted with 1X RIPA lysis buffer (Millipore, Billerica, MA) with 1X protease inhibitor (Roche, Basel, Switzerland). Protein concentration was determined using the BCA assay (Thermo/Pierce). Cell lysates were resolved on 4-20% Tris-Glycine gels (Invitrogen), transferred to PVDF membranes (Millipore), and incubated overnight at 4 °C with the appropriate primary antibodies: Anti-APLNR (1:500, Santa Cruz Biotechnology H-300 sc-33823), Anti-BBS1 (1:500, Santa Cruz Biotechnology F-1 sc-365138), Anti-SOX10 (1:1000, Cell Signaling D5V9L 89356) and Anti-BETA ACTIN (1:1000, Santa Cruz Biotechnology C4 sc-47778).
- HRP-conjugated secondary antibodies Santa Cruz Biotechnology
- SUPERSIGNAL WEST FEMTO Chemiluminescent Substrate Thermo/Pierce. Images were captured using CHEMIDOC TOUCH imaging system (Bio-Rad, Hercules, CA).
- RNAseq data were obtained from published work by Van Allen et al. (Levi Garraway group) and Reads Per Kilobase of transcript per Million mapped reads (RPKM) values were calculated with the same filters and criteria as described ( Van Allen et al., Science, 350: 207-211 (2015 )).
- RPKM Reads Per Kilobase of transcript per Million mapped reads
- TCGA RNA-seq data from multiple cancer data sets was downloaded from the Firehose Broad GDAC (gdac.broadinstitute.org/, DOI for data release: 10.7908/C11G0KM9) using the TCGA2STAT package for R ( Wan et al., Bioinformatics, 32: 952-54 (2016 )) and used to find overlap between TCGA gene expression indicative of cytolytic activity and genes from the pooled screen where loss-of-function create resistance to T cell killing.
- GZMA granzyme A
- PRF1 perforin 1
- a 'two cell-type' (2CT) CRISPR assay system including human T cells as effectors and tumor cells as targets was developed ( Fig. 1A ).
- the 2CT system uniquely allows one to: 1) understand how genetic manipulations in one cell type can affect a complex interaction between cell types; 2) perform the pooled screen with much higher library representation than cannot typically be achieved in vivo; and 3) identify novel genes and pathways which may not be detected by in vitro single cell-type screens or the uncontrolled environment of in vivo screens.
- T cell receptor (TCR) engineered human T cells that can specifically recognize and lyse melanoma cells expressing NY-ESO-1 antigen (NY-ESO1:157-165 epitope) in an HLA-A ⁇ 02-restricted fashion (ESO T cells) were utilized ( Fig. 1B and Table 1) ( Robbins et al., J. Immunol., 180: 6116-131 (2008 ); Johnson et al., J. Immunol., 177: 6548-59 (2006 )).
- TCR T cell receptor
- the 2CT assay was designed to control selection pressure, alloreactivity and bystander killing (Spiotto et al., 10: 294-298 (2004)) exerted by T cells via modulation of effector to target (E:T) ratio and length of co-incubation (Table 1 and Figs. 5A-5D ).
- E:T effector to target
- Table 1 and Figs. 5A-5D A FACS-based determination of live, PI (propidium iodine)-negative CD3 - tumor cell counts after co-culture of patient ESO T cells with Mel624 cells at an E:T ratio of 100 for 24 hr was carried out.
- the percentages of CD3-/PI- cells measured was as follows: DMEM (89.7) (control), Tcell media (92.2) (control), Patient 1 (1.3), Patient 2 (1.9), and Patient 3 (3.6).
- LMP2 , TAP2 and B2M known to be involved in MHC-I dependent antigen presentation were targeted ( Neefjes et al., Nat. Rev., Imunol., 11: 823-36 (2011 )).
- This example demonstrates that a 2CT GeCKOv2 screen in Mel624 melanoma cells identifies genes that confer resistance to T cell-mediated cytolysis.
- the Mel624 cells were independently infected with two human genome-scale libraries: Library A containing ⁇ 65,000 sgRNAs (3 sgRNAs per gene or microRNA) and Library B containing ⁇ 55,000 sgRNAs (3 different sgRNAs per gene).
- Library A containing ⁇ 65,000 sgRNAs (3 sgRNAs per gene or microRNA)
- Library B containing ⁇ 55,000 sgRNAs (3 different sgRNAs per gene.
- deep sequencing analysis was used to count sgRNA reads.
- the sgRNA reads from transduced cells 5-7 days post-puromycin selection showed high concordance with the reads from GeCKO plasmid pool ( Fig. 2B ), demonstrating that sgRNA library representation was maintained during transduction and puromycin selection.
- sgRNA enrichment was analyzed at the individual gene level by multiple methods: 1) top ranked genes by the second most enriched sgRNA ( Figs. 2D and 6A-6B ); and 2) the percentage of sgRNAs enriched in the top 5% of all sgRNAs for each gene. Both methods showed a high degree of overlap ( Figs. 2E and 6A-6B ).
- Known T cell response genes including HLA-A, B2M, TAP1, TAP2 and TAPBP, ranked amongst the top 20 genes enriched in the HiSelect screens ( Figs. 2D and 2E ), indicating that CRISPR mediated perturbations in MHC-I pathway rendered these cells resistant to T cell-mediated cytolysis.
- the loss of a significant number of genes involved in EIF2 signaling, SRP-dependent peptide targeting to membrane, assembly of RNA polymerase II, and protein ubiquitination pathways conferred resistance to T cell-mediated cytolysis (Tables 2 and 3), emphasizing the role of these pathways in modulating T cell response to tumor cells.
- Table 2 shows the gene set enrichment analysis output for top 100 ranked genes from HiSelect screens.
- Table 3 shows the pathway enrichment analysis of the top 500 ranked genes from HiSelect screens.
- TABLE 2 GO biological process complete Homo sapiens - REFLIST (20814) Genes Uploaded (90) Bonferroni corrected (P-value) antigen processing and presentation of endogenous peptide antigen via MHC class I (GO:0019885) 11 5 1.36E-05 antigen processing and presentation of endogenous peptide antigen (GO:0002483) 12 5 2.09E-05 antigen processing and presentation of endogenous antigen (GO:0019883) 14 5 4.49E-05 antigen processing and presentation of exogenous peptide antigen via MHC class I, TAP-dependent (GO:0002479) 75 9 4.32E-07 antigen processing and presentation of exogenous peptide antigen via MHC class I (GO:0042590) 79 9 6.81E-07 SRP-dependent cotranslational protein
- This example demonstrates the validation of the most enriched genes from LoSelect and Hi Select screens.
- the 2CT CRISPR assay was performed using multiple individual sgRNAs ( Fig. 9 ). Seventeen genes were selected based on two criteria. First, the gene must be present in the top 20 ranked genes in either the HiSelect or LoSelect screen ( Figs. 2E and 7A-7B ). Second, the gene must be frequently mutated in patients with multiple cancer types curated in cBioPortal ( Gao et al., Science Signaling, 6: p11 (2013 ); Cerami et al., Cancer Discovery, 2: 401-404 (2012 )) (Table 4). CTAG1B (encoding NY-ESO-1) was also included as a positive control.
- sgRNA_Name Spacer sequence SEQ ID NO: for spacer sequence APLNR_sgRNA_1 GTACGTGTAGGTAGCCCACA 1. APLNR_sgRNA_2 GTAGCGGTCGAAGCTGAGGC 2.
- COL17A1_sgRNA_1 TTTTTATCCAGACCCAGCCA 13.
- COL17A1_sgRNA_2 TCAGGAGAAGAAAGAGAG 14.
- COL17A1_sgRNA_3 ACCAAGAAAAACAAACGAGA 15.
- COL17A1_sgRNA_4 TAGTTACTTACTTGGTGGTA 16.
- CTAG1 B_sgRNA_2 GAACAGAATACAACTCAAGC 18.
- CTAG1 B_sgRNA_3 CATGCCTTTCGCGACACCCA 19.
- DHX9_sgRNA_2 GCTTTGAGAGCCAGATGTGG 25.
- MLANA_sgRNA_1 GCACGGCCACTCTTACACCA 32.
- RPL23_sgRNA_1 A TTTCCTTGGGTCTTCCGGT 45.
- RPL23_sgRNA_2 GCGAAATTCCGGATTTCCTT 46.
- RPL23_sgRNA_3 CAATTGATTACAGCTCCTAC 47.
- RPL23_sgRNA_4 TCTCTCAGTACATCCAGCAG 48.
- SOX10_sgRNA_2 GTTCCCCGTGTGCATCCGCG 50.
- SOX10_sgRNA_4 TGACAAGCGCCCCTTCATCG 52.
- TWF1_sgRNA_2 GGTTGTTTGTCCTCCAACAG 62.
- TWF1_sgRNA_3 TTACTTACATGAGAATGATC 63.
- TWF1_sgRNA_4 ATCTTTGCCAGAGCCAGAAA 64.
- APLNR apelin receptor
- BBS1 Bardet-Biedl Syndrome 1
- CD58 lymphocyte function-associated antigen 3
- SOX10 sex determining region Y box 10
- Interferon gamma (IFN ⁇ ) secretion is a marker of effector T cell activation and also itself an effective means of tumor cell lysis.
- IFN ⁇ Interferon gamma
- its release in the supernatants after a co-culture assay was measured.
- CD58 perturbations in tumor cells significantly reduced secretion of IFN ⁇ from T cells, however a consistent effect with APLNR and SOX10 modifications on IFN ⁇ secretion was not observed ( Fig. 13 ). None of the BBS1 targeting sgRNAs reduced IFN ⁇ secretion significantly implying that an alternate mechanism underlies their T cell resistance phenotype ( Figs. 3F, 3G , and 13 ).
- This example demonstrates the association of top ranked genes from HiSelect screens with cytolytic activity in human cancers.
- Genes associated with cytolytic activity in TCGA cancer types included TBXAS1, GMIP, OTOA, LAIR1, CLEC1, GPSM3, TRAF1, JAK2, TAPBP, TAPBPL, ICAM1, LILRA1, LILRA3, STAT1, HLA-A, B2M, HLA-F, TAP1, and TAP2. It was also found that these genes do not distinguish between immunogenic (melanomas) and non-immunogenic (breast) cancer types.
- T cell-response genes included the T cell antigen itself, co-stimulatory molecules like CD58 and regulators of antigen presentation, antigen expression or extrinsic apoptosis pathways, and validated novel candidates like APLNR, COL17A1 and RPL23.
- HLA-A2+ RCC cells were transduced with a retrovirus encoding NY-ESO-1.
- the NY-ESO-1+/HLA-A2+ RCC cells were transduced with a CRISPR lentivrus encoding control, APLNR, BBS1, or CD58 sgRNA to produce gene-perturbed NY-ESO-1+/HLA-A2+ RCC cells.
- the gene-perturbed NY-ESO-1+/HLA-A2+ RCC cells were co-cultured with NY-ESO-1-specific T cells.
- the resistance of the RCC cells to CYT expression was determined and normalized. The results are shown in Figure 16 . As shown in Figure 16 , knockout of APLNR, BBS1, or CD58 in RCC cells confers resistance to T cell mediated cytolysis.
- Tumor cells were treated with anti-Aplnr short hairpin RNA (shRNA). Control tumor cells were treated with irrelevant shRNA (scramble). B6 mice were implanted with 5 ⁇ 10 5 tumor cells per mouse. The mice were treated with 1 ⁇ 10 6 Pmel T cells, IL-2, and radiation (IR) on day 10 following tumor impanation. Control mice were treated with IR and IL-2 only. Tumor area and survival were measured. The results are shown in Figures 17A and 17B . As shown in Figures 17A and 17B , knockout of Aplnr in melanoma tumor cells reduced the anti-tumor efficacy of adoptive transfer of Pmel T cells.
- This example demonstrates that apelin ligand is produced by T cells and that apelin localizes in T cells during immune-synapse formation.
- apelin localized at the immune synapse.
- This example demonstrates that APLNR loss-of-function mutations were detected in tumor lesions which were refractory to immunotherapies.
- Tumor cells were untreated or treated with APLNR sg RNA (sg1) followed by rescue with WT APLNR RNA or APLNR RNA with one of the mutations indicated in Figure 18B .
- the tumor cells were co-cultured with T cells, and cytolysis was measured. The results are shown in Figure 18B .
- the second-most-enriched sgRNA score in the CRISPR screens for 96 APLNR-interacting proteins from the BIOGRID database is shown in Figure 19A .
- JAK1 was identified as a candidate for interacting with APLNR.
- JAK1 was isolated from A375 cell lysates by immunoprecipitation. Immunoprecipitation pull-down of IgG antibodies served as a control. The pull-down samples were tested for the presence of APLNR or JAK1. As a positive control, the pull-down samples were tested for the presence of actin.
- the results are shown in Figure 19B . As shown in Figure 19B , APLNR interacts with JAK1.
- This example demonstrates that APLNR enhances IFN ⁇ signaling in tumor cells.
- This example demonstrates that APLNR loss reduces ⁇ 2M induction and recognition by T cells.
- Tumor cells were CRISPR-edited using control sgRNA, anti-APLNR sg1 RNA or anti-APLNR sg2 RNA.
- the treated cells were co-cultured with anti-NY-ESO-1 T cells.
- Surface expression of ⁇ 2M by T cells was measured by fluorescence-activated cell sorting (FACS). The results are shown in Figure 21A .
- APLNR loss reduced ⁇ 2M induction.
- A375 tumor cells were CRISPR-edited using control sgRNA, anti-APLNR sg1 RNA, anti-APLNR sg2 RNA, anti-NY-ESO-1 sg1 RNA, or anti-NY-ESO-1 sg1RNA.
- the treated cells were co-cultured with anti-NY-ESO-1 T cells overnight.
- IFN ⁇ secretion was measured using ELISA.
- Figure 21B As shown in Figure 21B , APLNR loss reduced recognition of the tumor cells by the T cells.
- B16 melanoma tumor cells were edited using CRISPR to knockout expression of B2m or APLNR.
- the CRISPR-edited B16 tumor cells were subcutaneously transplanted into mice. After 10 days, tumor-bearing mice were treated with adoptive cell transfer of Pmel T cells. Tumor growth and survival was measured. The results are shown in Figures 22A-22C .
- B2905 melanoma tumor cells (derived from C57BL/6-HGF mice) were edited using CRISPR to knockout expression of APLNR.
- the CRISPR-edited B2905 melanoma cells were subcutaneously implanted into mice.
- the mice were treated with four doses of 250 ⁇ g of IgG control or anti-CTLA4 antibodies on days 10, 13, 16, and 19 post-implantation. Change in tumor area was measured. The results are shown in Figures 23A and 23B .
Landscapes
- Chemical & Material Sciences (AREA)
- Life Sciences & Earth Sciences (AREA)
- Health & Medical Sciences (AREA)
- Organic Chemistry (AREA)
- Proteomics, Peptides & Aminoacids (AREA)
- Engineering & Computer Science (AREA)
- Immunology (AREA)
- Pathology (AREA)
- Analytical Chemistry (AREA)
- Zoology (AREA)
- Genetics & Genomics (AREA)
- Wood Science & Technology (AREA)
- Physics & Mathematics (AREA)
- Biotechnology (AREA)
- Microbiology (AREA)
- Molecular Biology (AREA)
- Hospice & Palliative Care (AREA)
- Biophysics (AREA)
- Oncology (AREA)
- Biochemistry (AREA)
- Bioinformatics & Cheminformatics (AREA)
- General Engineering & Computer Science (AREA)
- General Health & Medical Sciences (AREA)
- Measuring Or Testing Involving Enzymes Or Micro-Organisms (AREA)
Abstract
Description
- This patent application claims the benefit of
U.S. Provisional Patent Application No. 62/418,461, filed November 7, 2016 - This invention was made with Government support under project number ZIABC010763-12 by the National Institutes of Health, National Cancer Institute. The Government has certain rights in the invention.
- Incorporated by reference in its entirety herein is a computer-readable nucleotide/amino acid sequence listing submitted concurrently herewith and identified as follows: One 18,151 Byte ASCII (Text) file named "735955_ST25.TXT," created October 25, 2017.
- Somatic gene mutations in cancer may influence anti-cancer immunity. For example, somatic gene mutations in cancer cells may give rise to neoantigens capable of eliciting T cell mediated cytolysis of the cancer cells. Conversely, somatic gene mutations in cancer cells may also contribute to the ability of the cancer cells to evade T cell mediated cytolysis. Evasion of T cell mediated cytolysis by the cancer cells may impair the effectiveness of immunotherapies. Despite advancements in the immunotherapeutic treatment of cancer, there exists a need for improved methods of identifying genetic mutations which may impair T cell mediated cytolysis of cancer cells.
- An embodiment of the invention provides a method of selecting a therapy for a cancer patient, the method comprising: detecting a mutation in one or more genes in a cancer cell from the patient which is not present in a noncancerous cell, wherein the mutation decreases one or both of expression and activity of polypeptide(s) encoded by the one or more genes; and wherein the one or more genes is selected from the group consisting of PTCD2, TWF1, DEFB134, BBS1, SOX10, APLNR, CD58, COL17A1, CRKL, hsa-mir-101-2, hsa-mir-548s, MAD2L1, MLANA, PSMB5, RNPS1, RPL10A, RPL23, SRP54, TAF3, TAP1, TAP2, TAPBP, TBXAS1, GMIP, OTOA, LAIR1, CLEC1, GPSM3, TRAF1, JAK2, TAPBPL, ICAM1, LILRA1, LILRA3, STAT1, and HLA-F; selecting the patient for a therapy which is not a T cell therapy when the mutation in one or more genes is present in the cancer cell; and selecting the patient for a T cell therapy when the mutation in one or more genes is not present in the cancer cell.
- An embodiment of the invention provides a method of selecting a therapy for a cancer patient, the method comprising: detecting a mutation in one or more polypeptides in a cancer cell from the patient which is not present in a noncancerous cell, wherein the mutation decreases activity of the polypeptide; and wherein the one or more polypeptides is encoded by a gene selected from the group consisting of PTCD2, TWF1, DEFB134, BBS1, SOX10, APLNR, CD58, COL17A1, CRKL, hsa-mir-101-2, hsa-mir-548s, MAD2L1, MLANA, PSMB5, RNPS1, RPL10A, RPL23, SRP54, TAF3, TAP1, TAP2, TAPBP, TBXAS1, GMIP, OTOA, LAIR1, CLEC1, GPSM3, TRAF1, JAK2, TAPBPL, ICAM1, LILRA1, LILRA3, STAT1, and HLA-F; selecting the patient for a therapy which is not a T cell therapy when the mutation is present in the cancer cell; and selecting the patient for a T cell therapy when the mutation is not present in the cancer cell.
- Still another embodiment of the invention provides a method of selecting a therapy for a cancer patient, the method comprising: measuring a level of one or both of (i) mRNA and (ii) polypeptide expressed from one or more genes in a cancer cell from the patient, wherein the one or more genes is selected from the group consisting of PTCD2, TWF1, DEFB134, BBS1, SOX10, APLNR, CD58, COL17A1, CRKL, hsa-mir-101-2, hsa-mir-548s, MAD2L1, MLANA, PSMB5, RNPS1, RPL10A, RPL23, SRP54, TAF3, TAP1, TAP2, TAPBP, TBXAS1, GMIP, OTOA, LAIR1, CLEC1, GPSM3, TRAF1, JAK2, TAPBPL, ICAM1, LILRA1, LILRA3, STAT1, and HLA-F; measuring the level of one or both of (i) mRNA and (ii) polypeptide expressed from the same one or more genes in a noncancerous cell; comparing the level of one or both of (i) mRNA and (ii) polypeptide measured in the cancer cell with the level of one or both of (i) mRNA and (ii) polypeptide, respectively, measured in the noncancerous cell; selecting the patient for a therapy which is not a T cell therapy when the level of one or both of (i) mRNA and (ii) polypeptide measured in the cancer cell is decreased as compared to the level of one or both of (i) mRNA and (ii) polypeptide, respectively, measured in the noncancerous cell; and selecting the patient for a T cell therapy when the level of one or both of (i) mRNA and (ii) polypeptide measured in the cancer cell is not decreased as compared to the level of one or both of (i) mRNA and (ii) polypeptide, respectively, measured in the noncancerous cell.
- Still another embodiment of the invention provides a method of screening for one or more genes, the mutation of which confers resistance to T cell-mediated cytolytic activity, the method comprising: introducing a nucleic acid encoding a Cas endonuclease and a nucleic acid encoding a single guide RNA (sgRNA) molecule into a target cell, wherein the sgRNA hybridizes to a test gene in the target cell, forming a complex between the sgRNA and Cas endonuclease so that the Cas endonuclease introduces a double strand break in the test gene; deleting all or a portion of the test gene to decrease expression of the test gene; co-culturing the target cell having decreased expression of the test gene with an effector cell; co-culturing a negative control cell with the effector cell, wherein the negative control cell is identical to the target cell except that it does not comprise the nucleic acid encoding a Cas endonuclease and the nucleic acid encoding a single guide RNA (sgRNA) molecule and does not have decreased expression of the test gene; measuring a level of lysis of the target cell by the effector cell; measuring a level of lysis of the negative control cell by the effector cell; and comparing the level of lysis of the target cell to the level of lysis of the negative control cell; wherein a decrease in the level of lysis of the target cell as compared to the level of lysis of the negative control cell indicates that mutation of the test gene confers resistance to T cell-mediated cytolytic activity to the target cell; and wherein a lack of a decrease in the level of lysis of the target cell as compared to the level of lysis of the negative control cell indicates that mutation of the test gene does not confer resistance to T cell-mediated cytolytic activity to the target cell.
- Further embodiments of the invention provide related methods of selecting a therapy for a cancer patient and treating cancer in the patient.
-
-
Figure 1A is a schematic representation of a 2CT CRISPR-Cas9 assay system to identify loss-of-function resistant genes against T cell-mediated target cell lysis. -
Figure 1B is a graph showing the NY-ESO-1 antigen specific lysis of melanoma cells after 24 h of co-culture of engineered ESO T cells (shaded bars) or no T cells (control) (unshaded bars) with NY-ESO-1- SK23, NY-ESO-1+ SK23 and NY-ESO-1+ Mel624 cells (n = 3 replicates) at E:T ratio of 1. -
Figure 1C is a representative FACS plot showing highly efficient perturbation of B2M in Mel624 cells using human GeCKOv2 lentiviral vector system. -
Figure 1D includes a timeline showing 12 h of co-culture of ESO T cells with individual gene edited Mel624 cells at E:T ratio of 0.5. Live cell survival (%) was calculated from control cells unexposed to T cell selection. Each dot in the plot represents independent gene-specific CRISPR lentivirus infection replicate (n = 3). -
Figure 1E is a graph showing the improvement in CRISPR edited cell yields at 60 h timepoint compared to 36 h after 2CT assay. Error bar denotes mean ± S.E.M. -
Figure 2A is a schematic showing the design of genome-wide 2CT CRISPR screen to identify loss-of-function genes conferring resistance to T cell-mediated target cell lysis. Mel624 cells transduced with GeCKOv2 libraries were selected with puromycin for 5-7 days. Screens with T-cell based selection at E:T of 0.3 are termed as 'LoSelect' screens and at E:T of 0.5 is termed as 'HiSelect' screens. -
Figure 2B shows a comparison of sgRNA representation between the plasmid pools to early timepoint transduced cells post puromycin selection. -
Figure 2C is a scatterplot showing the effect of LoSelect and HiSelect co-culture conditions on the global distribution of sgRNAs. -
Figure 2D is a scatterplot showing the enrichment of the most versus the second most enriched sgRNAs after T cell-based selection. The top 100 genes were magnified from the inset showing all the sgRNAs pooled from HiSelect screens using both A and B libraries. -
Figure 2E is a graph showing the consistency of multiple sgRNA enrichment fortop 20 ranked genes by second-best score in HiSelect screens. Frequency of unique sgRNAs targeting each gene in top 5% of most abundant sgRNAs is plotted. -
Figure 3A is a schematic illustrating a Mel624 cell and a ESO T cell. -
Figure 3B is a bar-plot showing the average survival of individually edited cells for 16 genes and 1 miR targeted with 2-4 different sgRNAs subjected to 2CT CRISPR assay at E:T ratio of 0.5 using Mel624 cells and ESO T cells. Data shown as an average of tested 2-4 sgRNAs per gene. Error bar denotes mean ± S.E.M. -
Figure 3C is a bar-plot showing the number of genes validated in arrayed screen with 0, 1, 2 or 3 sgRNAs showing significant resistance phenotype for that gene. Genes with >2 sgRNAs displaying resistance against T cell-mediated lysis are listed above the bar plot. -
Figure 3D is a schematic illustrating a Mel624 cell and a MART1 T cell. -
Figure 3E is a bar-plot of the LoF genes showing resistance against high avidity MART1 T cell-mediated lysis. Mel624 cells subjected to 2CT CRISPR assay using MART1 T cells from healthy donors at E:T ratio of 1. All listed genes are significantly resistant, P < 0.05 compared to non-target control sgRNA. Data shown as an average of tested 2-4 sgRNAs per gene. Error bar denotes mean ± S.E.M. -
Figure 3F is a schematic illustrating a ESO T cell and a A375 cell. -
Figure 3G is a bar-plot showing the genes validated with another melanoma cell line A375 that expresses NY-ESO-1 antigen in HLA-A2 restricted fashion. All listed genes are significantly resistant, P < 0.05 compared to non-target control sgRNA. n = 3 replicates. Data shown as an average of tested 2-4 sgRNAs per gene. Error bar denotes mean ± S.E.M. -
Figure 4A and Figure 4B show that the intratumoral expression (RPKM) of the antigen presentation genes, B2M (A) and TAP1 (B), are associated with survival of melanoma patients treated with T cell-based immunotherapy of CTLA4 blockade with ipilimumab. Based on Kaplan-Meier survival analysis for each gene where patients were initially grouped according to quartile values of gene expression, patients were split into two groups with differing survival outcomes by indicated RPKM values for each gene. The log-rank p-values shown are after adjustment for the evaluations done on the quartile groupings to arrive at the final, significant split presented. -
Figure 4C shows that the expression of cytolytic genes (geometric mean of RPKM values of PRF1 and GZMA), T cell signature genes (CD3E, CD8A and CD4) and natural killer cells (NCAM1 and NCR1) correlates with expression of antigen presentation pathway genes functionally validated with the 2CT CRISPR assay. APLNR expression shows a unique, weak to moderately strong correlation similar to B2M with cytolytic activity (p = 0.43, P = 0.005) and T cell markers (p = 0.48, P = 0.001) while not with NK cell markers (p = 0.22, P = 0.167). n = 42 melanoma patient biopsies. -
Figures 4D and 4E show the gene expression from RNAseq data for 36 human cancers obtained from TCGA database. Genes found positively correlated with cytolytic activity (P < 0.05) were intersected with CRISPR genes from the HiSelect screen to yield gene lists for each cancer type shown inFigure 4E . The number of genes correlated with CYT (D) and the overlap of CRISPR screen with CYT correlated genes (E) are shown. -
Figure 4F is a bubble plot depicting the number of overlapping genes fromFigures 4D and 4E correlated across multiple cancers. Previously known genes B2M, CASP7 and CASP8, and novel validated genes from CRISPR screen are highlighted according to their correlation to the cytolytic activity in the number of different cancer-types. Size of each bubble represents the number of genes in each dataset. -
Figure 5A is a barplot showing the the cytolysis efficiency of T cells upon co-culture of patient ESO T cells with Mel624 cells at an E:T ratio of 100 for 24 hr. -
Figure 5B shows the design of selection pressure exerted by ESO T cells on Mel624 cells at variable timings of co-culture and E:T ratios. Numbers in the grid represent approximate tumor cell survival (%) after co-culture. Data pooled from 3 independent experiments. n = 3 replicates for each culture condition. -
Fig. 5C shows the effect of cell to cell interaction timing on Mel624 cells determined by the upregulation of β2M expression at variable timings after co-culture with ESO T cells at E:T ratio of 0.5. Shown is a representative FACS plot showing distribution of β 2M expressing tumor cells. -
Fig. 5D shows the effect of cell to cell interaction timing on Mel624 cells determined by the upregulation of β2M expression at variable timings after co-culture with ESO T cells at E:T ratio of 0.5. Shown is a bar plot depicting mean fluorescence intensities of n = 3 replicates. -
Figure 6A is a scatterplot showing enrichment of most versus second most enriched sgRNAs after T cell-based selection among the top 100 genes enriched in LoSelect screens. -
Figure 6B is a graph showing the consistency of multiple sgRNA enrichments for top 20-ranked genes by the second most enriched sgRNA in LoSelect screens. Frequency of unique sgRNAs targeting each gene in top 5% of all sgRNAs is plotted. -
Figure 7A shows Venn diagrams depicting shared and unique most enriched candidates in top 5% of the second most enriched sgRNA across HiSelect and LoSelect screens. -
Figure 7B shows common enriched genes across all screens within the top 500 genes ranked by the second most enriched sgRNA. -
Figures 8A and 8B show the distribution of the enriched sgRNA targeting genes (Genes) as compared to non-target controls (Non-target) from both LoSelect (A) and HiSelect (B) screens. Data from library A and library B from each screen were pooled. This distribution was used to determine the false discovery rate (FDR) at 0.5 cutoff, and select genes for the downstream pathway and the TCGA data correlation analyses. Peaks a and c correspond to non-target controls. Peaks b and d correspond to target genes. -
Figure 9 is a schematic representation of individually-arrayed CRISPR screens used for validation of the highest-ranking genes. -
Figures 10A and 10B show the characteristics of NY-ESO-1 and MART1 TCR transduced T cells from healthy donors used in validation studies. Boxed population represents the percentage of transduced T cells expressing NY-ESO-1 (A) or MART1 (B) TCRs on the cell surface as determined by flow cytometry. -
Figure 11A shows the total indel frequencies detected for each lentiviral CRISPR. -
Figure 11B shows the distribution of types of indel mutations. -
Figures 11C-11K show representative indel plots for data shown inFigure 11B . Each subpanel shows the distribution of indel sizes for a single sgRNA at its intended genomic target locus: APLNR (C), COL17A1 (D), RPL23 (E), BBS1 (F), CTAG1B (G), SOX10 (H), CD58 (I), MLANA (4), and TAPBP (K). Negative values indicate deletions and positive values indicate insertions. -
Figure 12A shows the results of a Western blot analysis of CRISPR mediated gene perturbations in A375 cells after 4-5 days of puromycin selection. -
Figure 12B is a representative FACS plot of CRISPR mediated gene perturbations at the CD58 locus in A375 cells. The numbers shown in the box are as follows: sgRNA1: 59.4 (left) and 32.2 (right). sgRNA2: 57.5 (left) and 37.1 (right). sgRNA3: 82.1 (left) and 12.1 (right). -
Figure 13 is a bar graph showing the results of an IFNγ ELISA assay performed on supernatants 24 h post co-culture of CRISPR edited A375 cells with ESO T cells. CD58 edited cells resist T cell mediated cytolysis by limiting IFNγ release from T cells while BBS1 edited cells does not alter IFNγ release. Gray bar denotes average of 3-4 sgRNAs targeting a gene. ∗∗∗ P < 0.001 ∗ P < 0.05, n = 3 co-culture replicates. Error bar denotes mean ± S.E.M. -
Figures 14A-14D show bar graphs showing the results of a FACS analysis of surface phenotypic characteristics of APLNR, BBS1, CD58 and SOX10 edited A375 cells post 24 hr of coculture with ESO T cells. Untransduced A375 cells are represented as 'WT'. The loss of these four genes, APLNR, BBS1, CD58 and SOX10, neither significantly reduced the expression of antigen presentation gene β2M (D) nor increased the expression of checkpoint ligands, PD-L1 (A), PD-L2 (B) and galectin-9 (C), after 24 hours of co-culture with ESO T cells. n = 3 replicates. Data shown as an average of tested 3-4 sgRNAs per gene. Error bar denotes mean ± S.E.M. -
Figures 15A, 15C, and 15D show the results of an initial exploratory analysis in which data were divided into quartiles based on RPKM values of each individual gene and the four groups were evaluated for their association with survival. The global p-values shown indicate the overall association of the quartiles of gene expression levels with survival; a small p-value suggests a difference in the groups with respect to survival. For these three genes, a final division at either the lower quartile, the median, or the upper quartile was made which resulted in the most significant prognostic split of the data with respect to association with survival (P < 0.0001 for B2M (A) and P = 0.032 for TAP1 (C) as shown inFigures 4A-4B , and P = 0.05 for TAP2 (D) shown here). Since P ≤ 0.10 for each difference in outcome between two groups after adjustment in the univariate analyses shown, a Cox proportional hazards model analysis was performed including these three genes (plus BBS, adjusted P = 0.075, data not shown) to assess whether they had a joint impact on survival. By backward selection, the final Cox model indicated that only the lower quartile of B2M levels was significantly associated with poorer survival, and the other genes did not contribute significantly to the model when the four genes were considered jointly (Hazard Ratio (HR) = 5.72; 95% CI for HR: 2.41-13.58; P < 0.0001) -
Figure 15B shows the results of an analysis data were split into two groups by indicated RPKM values for each gene based on the trends from global analysis of survival probability inFigures 15A, 15C, and 15D according to the quartiles of expression levels. The association between TAP2 expression levels and survival is shown here. -
Figure 16 is a graph showing the normalized percentage of RCC cells resistant to T cell mediated cytolysis when the RCC cells are modified with control sgRNA or are modified to knock out APLNR, BBS1, or CD8. -
Figures 17A and 17B are graphs showing the tumor area (A) and survival (B) over time (days) measured in mice bearing tumors grown from cells, wherein the cells were modified with irrelevant (scramble) shRNA and the mice were treated with IR and IL-2 alone (dashed line) or treated with IR, IL-2, and T cells (grey line) or wherein the cells were treated with anti-Aplnr shRNA and treated with IR and IL-2 (black line). -
Figure 18A is a schematic illustrating the extracellular (EC), 7-transmembrane, and cytoplasmic signaling (CS) domains of the 380-amino acid (AA) residues of the APLNR protein. The positions of various non-synonymous mutations are indicated. -
Figure 18B is a graph showing the percentage of tumor cells lysed by T cells. Tumor cells were treated (+) or untreated (-) with APLNR sg RNA (sg1) and were further treated with wild type (WT) rescue APLNR RNA or APLNR RNA with the indicated mutation. NS=not statically significant. -
Figure 19A is a graph which plots the CRISPR screen score against the BIOGRID database score for APLNR interaction. JAK1 is indicated. -
Figure 19B is a photographic image of a Western blot (immunoblot (IB)) probed for APLNR after immunoprecipitation (IP) pull-down of JAK1 from A375 cell lysates. IP of IgG served as a negative control. Actin served as a positive control. -
Figure 20 is a heat map showing the fold change in expression of the indicatedgenes -
Figure 21A is a graph showing the percentage of tumor cells with surface β2M expression upon co-culture with anti-NY-ESO-1 T cells as measured by FACS. The tumor cells were CRISPR-edited using control sgRNA, anti-APLNR sg1 RNA, or anti-APLNR sg2 RNA (n = 3 biological replicates). -
Figure 21B is a graph showing IFNγ secretion (pg ml-1) by T cells following co-culture with tumor cells which had been CRISPR-edited using anti-NY-ESO-1 sg1 RNA, anti-NY-ESO-1 sg2 RNA, APLNR sg1 RNA, or anti-APLNR sg2 RNA (n = 3 biological replicates). -
Figures 22A and 22B are graphs showing the tumor area (mm2) in mice receiving no treatment (A) or treatment with Pmel ACT (B) at various time points (days) (d) after adoptive cell transfer. The tumors in the mice were grown from unmanipulated tumor cells (control; circles) or tumor cells CRISPR-edited to knockout b2M (open triangles) or APLNR (closed triangles) expression. Significance for tumor growth kinetics was calculated by Wilcoxon rank-sum test. For 'Pmel ACT' groups, n = 9 mice in control group, n = 10 mice per B2m-sg and Aplnr-sg groups. All values are mean ± s.e.m. ∗∗∗∗ P < 0.0001, ∗∗ P< 0.01, ∗ P < 0.05. Data are representative of two independent experiments. -
Figure 22C is a graph showing the probability of survival of mice receiving treatment with Pmel ACT at various time points (days) (d) after adoptive cell transfer. The tumors in the mice were grown from unmanipulated tumor cells (control; circles) or tumor cells CRISPR-edited to knockout b2M (open triangles) or APLNR (closed triangles) expression. Survival significance was assessed by a log-rank Mantel-Cox test (n = 5 mice per 'no treatment' groups). For 'Pmel ACT' groups, n = 9 mice in control group, n = 10 mice per B2m-sg and Aplnr-sg groups. All values are mean ± s.e.m. ∗∗∗∗ P<0.0001, ∗∗ P<0.01, ∗ P < 0.05. Data are representative of two independent experiments. -
Figures 23A-23B are waterfall plots showing the percent change in tumor area from baseline (tumor measurements from the first day of antibody injections) to tumors measured ondays - It has been discovered that a mutation in, or a reduction in expression of, one or more of certain genes described herein renders a cancer cell resistant to T cell-mediated cytolysis. Accordingly, the presence of the mutation in, or the reduction of expression of, the one or more genes in a cancer cell of a patient may decrease the effectiveness of T cell anti-cancer therapies. Conversely, the absence of the mutation in, or a lack of a decrease of expression of, the one or more genes in a cancer cell of a patient may indicate that a T cell anti-cancer therapy may be effective for treating the cancer in the patient. Accordingly, detection of the presence or absence of the mutation in, or detection of a decrease or lack of decrease in the expression of, the one or more genes may be useful for selecting a type of therapy which may be more effective for treating the patient's cancer.
- An embodiment of the invention provides a method of selecting a therapy for a cancer patient. The method may comprise detecting a mutation in one or more genes in a cancer cell from the patient which is not present in a noncancerous cell.
- The one or more genes is selected from the group consisting of PTCD2, TWF1, DEFB134, BBS1, SOX10, APLNR, CD58, COL17A1, CRKL, hsa-mir-101-2, hsa-mir-548s, MAD2L1, MLANA, PSMB5, RNPS1, RPL10A, RPL23, SRP54, TAF3, TAP1, TAP2, TAPBP, TBXAS1, GMIP, OTOA, LAIR1, CLEC1, GPSM3, TRAF1, JAK2, TAPBPL, ICAM1, LILRA1, LILRA3, STAT1, and HLA-F. Nucleotide and amino acid sequences for the above genes in humans are accessible from publicly available databases, e.g., in the NCBI Entrez database accession numbers shown in Table I below.
TABLE I Gene Full name Entrez gene ID No. APLNR Apelin Receptor 187 BBS1 Bardet-Biedl Syndrome 1 582 CD58 CD58 Molecule 965 CLEC1 C-Type Lectin Domain Family 1 Member A 51267 COL17A1 Collagen Type XVII Alpha 1 1308 CRKL V-Crk Avian Sarcoma Virus CT10 Oncogene Homolog-Like 1399 DEFB134 Defensin Beta 134 613211 GMIP GEM Interacting Protein 51291 GPSM3 G-Protein Signaling Modulator 3 63940 HLA-F Major Histocompatibility Complex, Class I, F 3134 hsa-mir-101-2 MicroRNA 101-2 406894 hsa-mir-548s MicroRNA 548s 100422862 ICAM1 Intercellular Adhesion Molecule 1 3383 JAK2 Janus Kinase 2 3717 LAIR1 Leukocyte Associated Immunoglobulin Like Receptor 1 3903 LILRA1 Leukocyte Immunoglobulin Like Receptor A1 11024 LILRA3 Leukocyte Immunoglobulin Like Receptor A3 11026 MAD2L1 MAD2 Mitotic Arrest Deficient-Like 1 (Yeast) 4085 MLANA Melan-A 2315 OTOA Otoancorin 146183 PSMB5 Proteasome Subunit Beta 5 5693 PTCD2 Pentatricopeptide Repeat Domain 2 79810 RNPS1 RNA Binding Protein With Serine Rich Domain 1 10921 RPL10A Ribosomal Protein L10a 4736 RPL23 Ribosomal Protein L23 9349 SOX10 SRY-Box 10 6663 SRP54 Signal Recognition Particle 54kDa 6729 STAT1 Signal Transducer And Activator Of Transcription 1 6772 TAF3 TATA-Box Binding Protein Associated Factor 3 83860 TAP1 Transporter 1, ATP-Binding Cassette, Sub-Family B (MDR/TAP) 6890 TAP2 Transporter 2, ATP-Binding Cassette, Sub-Family B (MDR/TAP) 6891 TAPBP TAP Binding Protein (Tapasin) 6892 TAPBPL TAP Binding Protein Like 55080 TBXAS1 Thromboxane A Synthase 1 6916 TRAF1 TNF Receptor Associated Factor 1 7185 TWF1 Twinfilin Actin Binding Protein 1 5756 - The cancer cell may be obtained from any bodily sample derived from a patient which contains or is expected to contain tumor or cancer cells. The noncancerous (normal, healthy) cell may be obtained from any bodily sample which does not contain tumor or cancer cells. The bodily sample may be any tissue sample such as blood, a tissue sample obtained from the primary tumor or from tumor metastases, or any other sample containing tumor or cancer cells. The normal, noncancerous cell may be obtained from the patient or a different individual.
- Genetic material (such as DNA or RNA) may be obtained directly from the patient, or the genetic material can be copied or amplified from genetic material within the patient's cells (e.g., via polymerase chain reaction (PCR), reverse transcription polymerase chain reaction (RT-PCR), or other suitable technique). To ensure that a sufficient quantity of genetic material is available for testing, the genetic material may be amplified from cells obtained from the patient, and the amplified genetic material is assayed in accordance with the inventive method. Preferably, a PCR or RT-PCR strategy is employed using primers flanking all or a portion of a gene set forth in Table I, so as to amplify this sequence from the patient for the assay. While the method may comprise amplifying and assaying one copy of a gene in Table I, preferably, the method comprises amplifying both copies of the gene from the patient, so that both can be assayed in accordance with the inventive method.
- However obtained, the method may comprise assaying the genetic material to detect a mutation in one or more of the genes set forth in Table I (e.g., a mutation at least one of the two alleles of any gene in Table I) in a cancer cell of the patient which is not present in a noncancerous cell. Any test able to detect mutations appropriate to the type of genetic material (e.g., genomic DNA (gDNA), cDNA, RNA) may be employed. The assaying may comprise obtaining, from the cancer cell and from the noncancerous cell, the sequence of at least a portion of the genetic sequence of one or more genes set forth in Table I or obtaining the sequence of substantially all of the genetic sequence of one or more genes set forth in Table I. In an embodiment, the method may further comprise comparing the sequence of the gene of a cancer cell from the patient to the sequence of the corresponding gene in the noncancerous cell (e.g., the wild type genetic sequence) and identifying any differences between the sequence of the gene in the cancer cell from the patient and the corresponding gene in the noncancerous cell (e.g., the wild type genetic sequence) to detect any mutations. In order to detect a mutation, the method may comprise sequencing nucleic acid such as DNA or RNA of the one or more genes in the cancer cell. The method may further comprise sequencing nucleic acid such as DNA or RNA of the one or more genes in the noncancerous cell.
- In an embodiment of the invention, the method comprises detecting a mutation in 1 or more, 2 or more, 3 or more, 4 or more, 5 or more, 6 or more, 7 or more, 8 or more, 9 or more, 10 or more, 11 or more, 12 or more, 13 or more, 14 or more, 15 or more, 16 or more,
- 17 or more, 18 or more, 19 or more, 20 or more, 21 or more, 22 or more, 23 or more, 24 or more, 25 or more, 26 or more, 27 or more, 28 or more, 29 or more, 30 or more, 31 or more, 32 or more, 33 or more, 34 or more, or 35 or more of the genes in Table I in a cancer cell from the patient. In an embodiment of the invention, the method comprises detecting a mutation in all 36 of these genes in a cancer cell from the patient.
- The mutation may be any mutation which decreases one or both of (i) the expression of and (ii) the activity of the polypeptide(s) encoded by the one or more genes. The gene with the mutation may encode a mutated amino acid sequence. In this regard, the mutation may be a "non-silent mutation." Non-limiting examples of mutations that may be detected in the inventive methods include missense, nonsense, insertion, deletion, duplication, frameshift, and repeat expansion mutations. The mutation may be a loss-of-function mutation. A loss-of-function mutation decreases or eliminates expression or activity of the encoded polypeptide. One or more mutations may be detected in a given gene in accordance with the invention.
- In an embodiment of the invention, the mutation may be any mutation which decreases the expression of one or both of the mRNA and the polypeptide encoded by the gene. In this regard, a cell with the mutation expresses a lower amount of one or both of mRNA and polypeptide encoded by the gene as compared to the noncancerous cell. The amount of one or both of mRNA and polypeptide expressed by the cell with the mutation may be, for example, about 10% lower, about 20% lower, about 30% lower, about 40% lower, about 50% lower, about 60% lower, about 70% lower, about 80% lower, about 90% lower as compared to that expressed by the noncancerous cell. In an embodiment of the invention, a cell with the mutation exhibits no detectable expression of one or both of mRNA and polypeptide encoded by the gene. Methods of measuring the level of mRNA expression are known in the art and may include, for example, quantitative polymerase chain reaction (qPCR), RNA sequencing (RNAseq), Northern blot, immunohistochemistry, fluorescence insitu hybridization (FISH), and other methods utilizing sequence probes which are complementary to the RNA of interest. Methods of measuring the level of polypeptide expression are known in the art and may include, for example, Western blot, immunohistochemistry, PROTEINSIMPLE protein quantitation, Edman peptide sequencing, and mass spectrometry.
- In an embodiment of the invention, the mutation may be any mutation which decreases the biological activity of the polypeptide(s) encoded by the one or more genes. In this regard, a cell with the mutation exhibits a decreased biological activity of the polypeptide(s) as compared to the noncancerous cell. The biological activity of the polypeptide(s) expressed by the cell with the mutation may be, for example, about 10% lower, about 20% lower, about 30% lower, about 40% lower, about 50% lower, about 60% lower, about 70% lower, about 80% lower, about 90% lower as compared to that of the noncancerous cell. In an embodiment of the invention, a cell with the mutation exhibits no detectable biological activity of the polypeptide encoded by the gene. Exemplary biological activities of genes set forth in Table I are set forth in Table II.
TABLE II Gene Exemplary Biological Activity APLNR G-protein-coupled receptor (GPCR) BBS1 A coat complex protein required for the sorting of specific membrane proteins to the primary cilia CD58 T cell co-stimulation CLEC1 C-type lectin-like receptor 1 (defense protein) COL17A1 Cell structure CRKL Kinase DEFB134 Defense response to bacterium GMIP GEM-interacting protein GPSM3 Interacts with subunit of G(i) alpha proteins and regulates the activation of G(i) alpha proteins HLA-F Antigen Presentation: Folding, assembly and peptide loading of class I MHC hsa-mir-101-2 microRNA regulates expression of other RNAs hsa-mir-548s microRNA regulates expression of other RNAs ICAM1 Adhesion molecule for leukocyte migration JAK2 Interferon signaling transducer LAIR1 Regulation of immune response; Inhibitory receptor LILRA1 May act as receptor for class I MHC antigens LILRA3 Acts as soluble receptor for class I MHC antigens MAD2L1 Mitotic assembly MLANA Melanoma antigen OTOA Cell matrix adhesion PSMB5 Ubiquitination PTCD2 PolyA RNA binding RNPS1 Eukaryotic Initiation Factor 2 (EIF2) signaling RPL10A EIF2 signaling RPL23 EIF2 signaling SOX10 Transcription factor SRP54 Signal related peptide STAT1 Signal transducer and transcription activator that mediates cellular responses to interferons (IFNs), cytokine KITLG/SCF, other cytokines, and other growth factors TAF3 Transcription initiation TAP1 MHC Class I TAP2 MHC Class I TAPBP MHC Class I TAPBPL MHC Class I TBXAS1 12-hydroxyheptadecatrienoic acid synthase activity TRAF1 Adapter molecule that regulates the activation of NF-kappa-B and JNK TWF1 Barbed-end actin filament capping - The method may further comprise selecting the patient for a therapy which is not a T cell therapy when the mutation in one or more genes is present in the cancer cell and selecting the patient for a T cell therapy when the mutation in one or more genes of Table I is not present in the cancer cell. Preferably, the method comprises selecting the patient for a T cell therapy when a mutation which decreases one or both of expression and activity of the encoded polypeptide is not present in all of the 36 genes listed in Table I. The presence of a mutation in one or more genes of Table I indicates that the cancer cells in the patient are resistant to T cell-mediated cytolysis and, consequently, that T cell therapy may be less effective in treating the cancer in the patient. The absence of a mutation in one or more of (or all of) the genes of Table I indicates that the cancer cells in the patient are sensitive to T cell-mediated cytolysis and, consequently, that T cell therapy may be effective in treating the cancer in the patient.
- Another embodiment of the invention provides a method of selecting a therapy for a cancer patient and treating cancer in the patient. The method may comprise selecting a therapy for the cancer patient by detecting a mutation in one or more genes in a cancer cell by any of the methods described herein with respect to other aspects of the invention. The method may further comprise treating the patient by administering a therapy which is not a T cell therapy to the patient in an amount effective to treat cancer in the patient when the mutation in the one or more genes is present in the cancer cell and treating the patient by administering a T cell therapy to the patient in an amount effective to treat cancer in the patient when the mutation in the one or more genes is not present in the cancer cell. Preferably, the method comprises treating the patient by administering a T cell therapy to the patient in an amount effective to treat cancer in the patient when the mutation in all 36 of the genes set forth in Table I is not present in the cancer cell.
- Alternatively or additionally, a mutation may be detected in a polypeptide encoded by one or more of the genes set forth in Table I. Accordingly, another embodiment of the invention provides a method of selecting a therapy for a cancer patient, the method comprising detecting a mutation in one or more polypeptides in a cancer cell from the patient which is not present in a noncancerous cell, wherein the one or more polypeptides is encoded by a gene selected from the group consisting of PTCD2, TWF1, DEFB134, BBS1, SOX10, APLNR, CD58, COL17A1, CRKL, hsa-mir-101-2, hsa-mir-548s, MAD2L1, MLANA, PSMB5, RNPS1, RPL10A, RPL23, SRP54, TAF3, TAP1, TAP2, TAPBP, TBXAS1, GMIP, OTOA, LAIR1, CLEC1, GPSM3, TRAF1, JAK2, TAPBPL, ICAM1, LILRA1, LILRA3, STAT1, and HLA-F. The cancer cell and the noncancerous cell may be as described herein with respect to other aspects of the invention. The mutation may decrease the activity of the polypeptide, as described herein with respect to other aspects of the invention. The polypeptide with the mutation may be encoded by a gene set forth in Table I including any of the types of mutations described herein with respect to other aspects of the invention.
- The method may comprise assaying a sample comprising cancer cells from the patient to detect a mutation in a polypeptide encoded by one or more genes set forth in Table I. For example, the polypeptide can be purified from the sample (either partially or substantially and assayed via immunohistological techniques (e.g., Western blotting, ELISA, immunoprecipitation, etc.) using one or more antibodies recognizing the mutated polypeptide but not the corresponding polypeptide from the noncancerous cell (e.g., the wild type polypeptide). In this regard, the assaying may comprise contacting the sample with an antibody that specifically binds to the mutated polypeptide and does not bind to the corresponding polypeptide from the noncancerous cell (e.g., the wild type polypeptide), thereby forming a complex, and detecting the complex. Alternatively, or in conjunction, the sample from the patient can be assayed using one or more antibodies recognizing the polypeptide from the noncancerous cell (e.g., the wild type polypeptide) but not the corresponding mutated polypeptide. In this regard, the assaying may comprise contacting the sample with an antibody that specifically binds to the polypeptide from the noncancerous cell and does not bind to the corresponding mutated polypeptide, thereby forming a complex, and detecting the complex.
- The method may further comprise selecting the patient for a therapy which is not a T cell therapy when the mutation is present in the cancer cell, as described herein with respect to other aspects of the invention. The method may comprise selecting the patient for a T cell therapy when the mutation is not present in the cancer cell, as described herein with respect to other aspects of the invention. Preferably, the method comprises selecting the patient for a T cell therapy when the mutation which decreases activity of the encoded polypeptide is not present in the polypeptides encoded by all of the 36 genes listed in Table I.
- Another embodiment of the invention provides a method of selecting a therapy for a cancer patient and treating the cancer in the patient. The method may comprise selecting a therapy for the cancer patient by detecting a mutation in one or more polypeptides in a cancer cell by any of the methods described herein with respect to other aspects of the invention. The method may further comprise treating the cancer in the patient by administering a therapy which is not a T cell therapy to the patient in an amount effective to treat cancer in the patient when the mutation in the one or more polypeptides is present in the cancer cell and treating the cancer in the patient by administering a T cell therapy to the patient in an amount effective to treat cancer in the patient when the mutation in the one or more polypeptides is not present in the cancer cell. Preferably, the method comprises treating the cancer in the patient by administering a T cell therapy to the patient in an amount effective to treat cancer in the patient when the mutation in the polypeptides encoded by all of the genes set forth in Table I is not present in the cancer cell.
- The cancer cell with the mutation in one or both of the gene and the polypeptide encoded by the gene may be more resistant to T cell-mediated cytolysis as compared to a control cell which is identical to the cancer cell except that it lacks the mutation. In this regard, the mutation confers resistance to T cell-mediated cytolysis to the cancer cell. The term "T cell-mediated cytolysis" refers in general to the cytolysis carried out by T cells, e.g., the mediation of the targeted destruction of cells by T cells. In the context of the present invention, the term typically refers to the capacity of T cells to kill cancer cells, e.g. via cytotoxic T cell activity. For example, in some embodiments, T cell-mediated cytolysis may be determined by measuring the expression by T cells of one or more markers which mediate cytolysis, e.g., one or more of granzyme A, perforin, interferon (IFN) gamma, IL-2, and tumor necrosis factor alpha (TNF-α), granulocyte/monocyte colony stimulating factor (GM-CSF), IL-4, IL-5, IL-9, IL-10, IL-17, IL-22, PD-1, LAG-3, TIM-3, 4-1BB, OX40, and CD107a, upon co-culture with target cancer cells. Alternatively or additionally, T cell-mediated cytolysis may be determined using one or more of a chromium release assay and an apoptosis assay measuring target cell lysis.
- Alternatively or additionally, the method may comprise measuring the level of expression of one or more genes set forth in Table I. In this regard, an embodiment of the invention provides a method of selecting a therapy for a cancer patient, the method comprising measuring a level of one or both of (i) mRNA and (ii) polypeptide expressed from one or more genes in a cancer cell from the patient, wherein the one or more genes is selected from the group consisting of PTCD2, TWF1, DEFB134, BBS1, SOX10, APLNR, CD58, COL17A1, CRKL, hsa-mir-101-2, hsa-mir-548s, MAD2L1, MLANA, PSMB5, RNPS1, RPL10A, RPL23, SRP54, TAF3, TAP1, TAP2, TAPBP, TBXAS1, GMIP, OTOA, LAIR1, CLEC1, GPSM3, TRAF1, JAK2, TAPBPL, ICAM1, LILRA1, LILRA3, STAT1, and HLA-F. The method further comprises measuring the level of one or both of (i) mRNA and (ii) polypeptide expressed from the same one or more genes in a noncancerous cell. The cancerous cell and the noncancerous cell may be as described herein with respect to other aspects of the invention. Measuring the level of one or both of (i) mRNA and (ii) polypeptide expressed may be as described herein with respect to other aspects of the invention.
- The method may further comprise comparing the level of one or both of (i) mRNA and (ii) polypeptide measured in the cancer cell with the level of one or both of (i) mRNA and (ii) polypeptide, respectively, measured in the noncancerous cell.
- The method may further comprise selecting the patient for a therapy which is not a T cell therapy when the level of one or both of (i) mRNA and (ii) polypeptide measured in the cancer cell is decreased as compared to the level of one or both of (i) mRNA and (ii) polypeptide, respectively, measured in the noncancerous cell and selecting the patient for a T cell therapy when the level of one or both of (i) mRNA and (ii) polypeptide measured in the cancer cell is not decreased as compared to the level of one or both of (i) mRNA and (ii) polypeptide, respectively, measured in the noncancerous cell. Preferably, the method comprises selecting the patient for a T cell therapy when the level of one or both of (i) mRNA and (ii) polypeptide encoded by all of the 36 genes listed in Table I is not decreased.
- The amount of one or both of mRNA and polypeptide encoded by one or more genes set forth in Table I expressed by the cancer cell may be, for example, about 10% lower, about 20% lower, about 30% lower, about 40% lower, about 50% lower, about 60% lower, about 70% lower, about 80% lower, about 90% lower as compared to that expressed by the noncancerous cell. In an embodiment of the invention, the cancer cell exhibits no detectable expression of one or both of mRNA and polypeptide encoded by the gene. Methods of measuring the level of mRNA expression and the level of polypeptide expression may be as described herein with respect to other aspects of the invention.
- The decrease in the level of one or both of (i) mRNA and (ii) polypeptide confers resistance to T cell-mediated cytolysis to the cancer cell. Resistance to T cell-mediated cytolysis may be as described herein with respect to other aspects of the invention.
- Another embodiment of the invention provides a method of selecting a therapy for a cancer patient and treating cancer in the patient, the method comprising selecting a therapy for the cancer patient by measuring a level of one or both of (i) mRNA and (ii) polypeptide expressed from one or more genes in Table I as described herein with respect to other aspects of the invention.
- The method further comprises treating the patient by administering a therapy which is not a T cell therapy to the patient in an amount effective to treat cancer in the patient when the level of one or both of (i) mRNA and (ii) polypeptide measured in the cancer cell is decreased as compared to the level of one or both of (i) mRNA and (ii) polypeptide, respectively, measured in the noncancerous cell and treating the patient by administering a T cell therapy to the patient in an amount effective to treat cancer in the patient when the level of one or both of (i) mRNA and (ii) polypeptide measured in the cancer cell is not decreased as compared to the level of one or both of (i) mRNA and (ii) polypeptide, respectively, measured in the noncancerous cell. Preferably, the method comprises administering a T cell therapy to the patient in an amount effective to treat cancer in the patient when the level of one or both of (i) mRNA and (ii) polypeptide encoded by all of the genes set forth in Table I measured in the cancer cell is not decreased as compared to the level of one or both of (i) mRNA and (ii) polypeptide, respectively, measured in the noncancerous cell.
- The T cell therapy employed in the inventive methods is not limited and may comprise any therapy comprising one or both of (i) one or more T cells and (ii) one or more cells which have been modified to express a T cell receptor. The one or more cells which have been modified to express a T cell receptor may be a T cell prior to being modified to express a T cell receptor or may be a cell other than a T cell which has been modified to express a T cell receptor.
- The T cell can be any T cell, such as a cultured T cell, e.g., a primary T cell, or a T cell from a cultured T cell line, e.g., Jurkat, SupT1, etc., or a T cell obtained from a mammal. If obtained from a mammal, the T cell can be obtained from numerous sources, including but not limited to blood, bone marrow, lymph node, thymus, spleen, or other tissues or fluids. Cells can also be enriched for or purified. Preferably, the T cell is a human T cell. The T cell can be any type of T cell and can be of any developmental stage, including but not limited to, CD4+/CD8+ double positive T cells, CD4+ helper T cells, e.g., Thi and Th2 cells, CD4+ T cells, CD8+ T cells (e.g., cytotoxic T cells), tumor infiltrating cells (TILs), memory T cells, naive T cells, and the like.
- The therapy which is not a T cell therapy employed in the inventive methods is not limited and may include any therapy which does not comprise both of (i) one or more T cells and (ii) one or more cells which have been modified to express a T cell receptor. Examples of therapies which are not a T cell therapy include, but are not limited to, surgical resection, chemotherapy, radiotherapy, NK cell therapy, B cell therapy, gene therapy, anti-cancer vaccine therapy, targeted drug inhibitor therapy, or any combination thereof.
- "Targeted drug inhibitor therapy" refers to therapies which employ an inhibitor of a cancer protein. An example of a targeted drug inhibitor therapy is vemurafenib, which targets mutated B-RAF. The term "cancer protein," as used herein, refers to any molecule (e.g., protein, polypeptide, peptide, lipid, carbohydrate, etc.) solely or predominantly expressed or over-expressed by a tumor cell or cancer cell, such that the protein is associated with the tumor or cancer. The cancer protein can additionally be expressed by normal, non-tumor, or non-cancerous cells. However, in such cases, the expression of the cancer protein by normal, non-tumor, or non-cancerous cells is not as robust as the expression by tumor or cancer cells. In this regard, the tumor or cancer cells can over-express the protein or express the protein at a significantly higher level, as compared to the expression of the protein by normal, non-tumor, or non-cancerous cells. Also, the cancer protein can additionally be expressed by cells of a different state of development or maturation. For instance, the cancer protein can be additionally expressed by cells of the embryonic or fetal stage, which cells are not normally found in an adult host. Alternatively, the cancer protein can be additionally expressed by stem cells or precursor cells, which cells are not normally found in an adult host. Cancer proteins are known in the art and include, for instance, mesothelin, CD19, CD22, CD276 (B7H3), gp100, MART-1, Epidermal Growth Factor Receptor Variant III (EGFRVIII), TRP-1, TRP-2, tyrosinase, NY-ESO-1 (also known as CAG-3), MAGE-1, MAGE-3, etc.
- Another embodiment of the invention provides a method of screening for one or more genes, the mutation of which confers resistance to T cell-mediated cytolytic activity. The inventive screening method may provide advantages over in vitro single cell-type screens or in vivo screens including, for example, any one or more of (1) the providing of information about how genetic manipulations in one cell type can affect a complex interaction between cell types; (2) the ability to perform the pooled screen with a much higher library representation than can typically be achieved in vivo; and (3) the ability to identify genes and pathways which may not be detected by in vitro single cell-type screens or the uncontrolled environment of in vivo screens.
- The inventive screening method may employ the CRISPR/Cas system. The CRISPR/Cas system is described at, for example, Cheng et al., Cell Res., 23: 1163-71 (2013). Briefly, the CRISPR/Cas system involves creating specific double-stranded breaks (DSBs) at targeted locations in the genome using the Cas endonuclease. Endogenous mechanisms in the cell are used to repair the induced break by homologous recombination (HR) and nonhomologous end-joining (NHEJ). The CRISPR/Cas system may be used to knockout expression of a gene of interest.
- Accordingly, the inventive method may comprise introducing a nucleic acid encoding a Cas endonuclease and a nucleic acid encoding a single guide RNA (sgRNA) molecule into a target cell, wherein the sgRNA hybridizes to a test gene in the target cell, and forming a complex between the sgRNA and Cas endonuclease so that the Cas endonuclease introduces a double strand break in the test gene. Non-limiting examples of Cas endonucleases include Casl B, Cas2, Cas3, Cas4, Cas5, Cas6, Cas7, Cas8, Cas9 (also known as Csnl and Csxl2), CaslO, Csyl, Csy2, Csy3, Csel, Cse2, Cscl, Csc2, Csa5, Csn2, Csm2, Csm3, Csm4, Csm5, Csm6, Cmrl, Cmr3, Cmr4, Cmr5, Cmr6, Csbl, Csb2, Csb3, and Csxl7. Preferably, the Cas endonuclease is Cas9. Preferably, the sgRNA specifically hybridizes to the test gene such that the sgRNA hybridizes to the test gene and does not hybridize to any other gene that is not the test gene.
- The method may further comprise deleting all or a portion of the test gene to decrease expression of the test gene. The expression of the test gene may be decreased by any amount, for example, by about 10%, about 20%, about 30%, about 40%, about 50%, about 60%, about 70%, about 80%, or about 90%. Preferably, expression of the test gene is decreased so that there is no detectable expression of the test gene.
- The method may further comprise co-culturing the target cell having decreased expression of the test gene with an effector cell and co-culturing a negative control cell with the effector cell, wherein the negative control cell is identical to the target cell except that it does not comprise the nucleic acid encoding a Cas endonuclease and the nucleic acid encoding a single guide RNA (sgRNA) molecule and does not have decreased expression of the test gene. The co-culture may be carried out in any suitable manner known in the art that facilitates interaction of the target cell with the effector cell. For example, the co-culture may comprise culturing the target cell and the effector cell so that they are in direct physical contact with one another.
- The method may further comprise measuring a level of lysis of the target cell by the effector cell and measuring a level of lysis of the negative control cell by the effector cell. The level of lysis may be determined by any suitable manner known in the art. For example, when the effector cell is a T cell, measuring the level of lysis may be carried out by measuring the expression by the T cells of one or more markers which mediate cytolysis, as described herein with respect to other aspects of the invention.
- The method may further comprise comparing the level of lysis of the target cell to the level of lysis of the negative control cell. A decrease in the level of lysis of the target cell as compared to the level of lysis of the negative control cell indicates that mutation of the test gene confers resistance to T cell-mediated cytolytic activity to the target cell. A lack of a decrease in the level of lysis of the target cell as compared to the level of lysis of the negative control cell indicates that mutation of the test gene does not confer resistance to T cell-mediated cytolytic activity to the target cell. The mutation may be as described herein with respect to other aspects of the invention.
- The decrease in the level of lysis of the target cell as compared to the level of lysis of the negative control cell may be a decrease of any amount. For example, the decrease in the level of lysis of the target cell may be a decrease of about 10%, about 20%, about 30%, about 40%, about 50%, about 60%, about 70%, about 80%, about 90% as compared to the level of lysis of the negative control cell.
- The test gene may be any gene of interest. The test gene may be any gene which is suspected or known to be involved in the interaction of the target cell with the effector cell. In an embodiment of the invention, the test gene is any one of the genes set forth in Table I.
- The target cell may be any cell of interest. The target cell may be any cell which is suspected or known to interact with the effector cell. In an embodiment of the invention, the target cell is a cancer cell. The cancer cell may be as described herein with respect to other aspects of the invention.
- The effector cell may be any effector cell of interest. In an embodiment of the invention, the effector cell is a T cell. In another embodiment of the invention, the cell is a cell which has been modified to express a T cell receptor. The T cell, and the cell which has been modified to express a T cell receptor, may be as described herein with respect to other aspects of the invention.
- The cancer may be any cancer, including any of acute lymphocytic cancer, acute myeloid leukemia, alveolar rhabdomyosarcoma, bone cancer, brain cancer, breast cancer, cancer of the anus, anal canal, or anorectum, cancer of the eye, cancer of the intrahepatic bile duct, cancer of the joints, cancer of the neck, gallbladder, or pleura, cancer of the nose, nasal cavity, or middle ear, cancer of the oral cavity, cancer of the vulva, chronic lymphocytic leukemia, chronic myeloid cancer, colon cancer, esophageal cancer, cervical cancer, gastrointestinal carcinoid tumor, Hodgkin lymphoma, hypopharynx cancer, kidney cancer, larynx cancer, liver cancer, lung cancer, malignant mesothelioma, melanoma, multiple myeloma, nasopharynx cancer, non-Hodgkin lymphoma, ovarian cancer, pancreatic cancer, peritoneum, omentum, and mesentery cancer, pharynx cancer, prostate cancer, rectal cancer, renal cancer (e.g., renal cell carcinoma (RCC)), small intestine cancer, soft tissue cancer, stomach cancer, testicular cancer, thyroid cancer, ureter cancer, and urinary bladder cancer. In certain preferred embodiments, the cancer is melanoma.
- The term "treat," as well as words stemming therefrom, as used herein, does not necessarily imply 100% or complete treatment. Rather, there are varying degrees of treatment of which one of ordinary skill in the art recognizes as having a potential benefit or therapeutic effect. In this respect, the inventive methods can provide any amount of any level of treatment of cancer in a patient. Furthermore, the treatment provided by the inventive method can include treatment of one or more conditions or symptoms of the cancer being treated. For example, treatment can include promoting the regression of a tumor.
- The following examples further illustrate the invention but, of course, should not be construed as in any way limiting its scope.
- The following materials and methods were employed in the experiments described in Examples 1-4.
- All peripheral blood mononuclear cell (PBMC) samples were derived from patients with melanoma or healthy donors with consents and procedures approved by the institutional-review board (IRB) of the National Cancer Institute (NCI).
- The melanoma cell lines HLA-A2+/MART-1+ / NY-ESO-1+(Mel624.38, Mel1300), HLA-A2-(Mel938) and HLA-A2+ / NY-ESO-1-(Mel526) were isolated from surgically resected metastases as described (Johnson et al., J. Immunol., 177: 6548-6559 (2006)) and were cultured in RPMI 1640 (Invitrogen, Carlsbad, CA) medium supplemented with 10% fetal bovine serum (FBS, Hyclone, Logan, UT). The A375 (HLA-A2+/NY-ESO-1+) and SK23 (NY-ESO-1-) cell lines were obtained from the American Type Culture Collection (Manassas, VA). The SK23 cell-line transduced with retrovirus containing NY-ESO-1 expressing vector (SK23 NY-ESO-1+) was obtained from Ken-ichi Hanada (NCI). All melanoma cell lines were cultured in D10 medium containing DMEM supplemented 10% FBS, 2 mM L-glutamine, and 1% penicillin-streptomycin.
- All PBMCs and lymphocytes used for transduction and as feeder cells were obtained from aphereses of NCI Surgery Branch patients on IRB-approved protocols. They were cultured in T cell medium, which is: AIM-V medium (Invitrogen) supplemented with 5% human AB serum (Valley Biomedical, Winchester, VA), 100 U/ml penicillin and 100 µg/ml streptomycin, 2 mM L-glutamine and 12.5 mM HEPES (Life Technologies).
- Retroviral vectors for TCRs recognizing the HLA-A∗02-restricted melanoma antigens NY-ESO-1 (NY-ESO-1:157-165 epitope) and MART-1 (MART-1:27-35 epitope, DMF5) were generated as previously described (Johnson et al., J. Immunol., 177: 6548-6559 (2006); Robbins et al., J. Immunol., 180: 6116-6131 (2008)). Clinical grade cGMP-quality retroviral supernatants were produced by the National Gene Vector Laboratories at Indiana University. For virus titer determinations, peripheral blood lymphocytes (PBLs) (2 × 10⁶ cell/mL) were stimulated with IL-2 (300 IU/mL) and anti-CD3 antibody OKT3 (300 IU/ mL) on
Day 0. Non-tissue culture treated six-well plates were coated with 2 mL/well of 10 µg/mL RetroNectin (Takara Bio, Otsu, Japan) onday 1 and stored overnight at 4 °C. Serial dilutions of vector supernatant (4 mL/well, diluted with D10 media) were applied to plates onday 2 followed by centrifugation at 2000×g for 2h at 32 °C. Half the volume was aspirated and PBLs were added (0.25-0.5 × 10⁶cell/mL, 4 mL/well), centrifuged for 10 min at 1000×g, and incubated at 37 °C / 5% CO2. Vector titers were calculated as follows: [(% tetramer positive cells × total cell number × dilution factor)] ÷ supernatant volume. A second transduction onday 3 was performed as described above. Cells were maintained in culture at 0.7-1.0 × 10⁶ cell/mL. After harvest, cells underwent a rapid expansion protocol (REP) in the presence of soluble OKT3 (300 IU/mL), IL-2 (6000 IU/mL) and irradiated feeders as previously described (Johnson et al., J. Immunol., 177: 6548-6559 (2006)). Afterday 5 of the REP, cells were maintained in culture at 0.7-1.0 × 10⁶cell/mL until harvested for testing on day 7-10 or frozen down for co-culture later. - To generate lentivirus, HEK293FT cells (Invitrogen) were cultured in D10 medium. One day prior to transfection, HEK293FT cells were seeded in T-225 flasks at 60% confluency. One to two hours before transfection, DMEM media was replaced with 13 mL of pre-warmed serum-free OptiMEM media (Invitrogen). Cells were transfected using
LIPOFECTAMINE 2000 reagent and PLUS reagent (Invitrogen). For each flask, 4 mL of OptiMEM was mixed with 200 µL of PLUS reagent, 20 µg of LENTICRISPRV2 plasmid or pooled plasmid human GeCKOv2 (Genome-scale CRISPR Knock-Out) library, 15 µg psPAX2 (Addgene, Cambridge, MA) and 10 µg pMD2.G (Addgene). 100uL LIPOFECTAMINE 2000 reagent was diluted with 4 mL of OPTIMEM medium and was combined to the mixture of plasmids and PLUS reagent. This transfection mixture was incubated for 20 minutes and then added dropwise to the cells. 6-8 h post transfection, the media was replaced to 20 mL of DMEM supplemented with 10% FBS and 1% BSA (Sigma). Virus containing media was harvested 48 h post-transfection. The sufficiency of viral titers was confirmed with LENTI-X GOSTIX test (Clontech, Mountain View, CA). Cell debris were removed by centrifugation of media at 3,000 rcf and 4 °C for 10 minutes followed by filtration of the supernatant through a 0.45 µm low-protein binding membrane (Millipore Steriflip HV/PVDF). For individual LENTICRISPRV2 plasmids, viral supernatants were frozen in aliquots at -80 °C. For pooled library plasmids, viral supernatants were concentrated by centrifugation at 4,000 rcf and 4 °C for 35 min in AMICON ULTRA-15 filters (Millipore Ultracel-100K). Concentrated viral supernatants were stored in aliquots at - 80 °C. - To devise a 2CT (T cell: tumor cell) assay system (
Fig. 1A ), melanoma patient-derived T cells retrovirally transduced with T cell receptors (TCRs) recognizing the HLA-A∗02-restricted melanoma antigen NY-ESO-1 (NY-ESO1:157-165 epitope) (NY-ESO-1T cells) and a heterogeneous melanoma cell line (Mel624) were used with the goal of achieving TCR-specific cytolysis under co-culture conditions. It is of clinical interest to identify genes which confer sensitivity to T cell cytolytic activity to cancer cells that are not restricted to specific antigen and TCR avidity. With this in mind, patient-derived Mel624 cells (Mel624WT) which express both NY-ESO-1 and MART-1 antigens in an HLA-A∗02-restricted manner were selected allowing targeting of these cells with either low-avidity NY-ESO-1 T cells or high-avidity MART-1 T cells during co-culture experiments. - To minimize the effect of alloreactivity and bystander cell lysis exhibited by T cells in this assay system, the selection pressure of T cells was reduced by modulating the length of co-incubation time and E:T ratios such that ~20% of cells survived after 24 hours of co-culture at an E:T ratio of 0.5. To ensure NY-ESO-1 and HLA-A∗02-specific reactivity of NY-ESO-1 T cells, gamma-interferon (IFNγ) release was measured with control cell-lines (Table 1), and cell survival post co-incubation of NY-ESO-1 T cells with non-NY-ESO-1 expressing SK23 and NY-ESO-1 expressing SK23 and Mel624 cells (
Fig 1B ). β2M (encoded by B2M) is upregulated on tumor cells upon interaction with T cells in an IFNγ dependent manner. It was found that after co-incubation in as little as 6 hours, tumor cells interact sufficiently with T cells to achieve an increase in β2M expression. Collectively, with these experiments, the selection pressure, specificity and duration of co-incubation in the 2CT assay system were designed.TABLE 1 Melanoma Cell Line H LA-A2-ESO+ H LA-A2+ ESO- HLA-A2+ ESO+ None Mel938 Mel526 Mel624 Mel1300 Patient1 PBMC 2 26 1 15 60 ESO TCR Td 3 31 0 1168 >1200 Patient2 PBMC 3 4 12 13 ESO TCR Td 13 241 89 >1200 >1200 Patient3 PBMC 6 13 12 15 8 ESO TCR Td 7 11 47 >950 >950 - Mel624 cells were transduced with the human GeCKOv2 library virus using spinfection. To determine the functional titer and achieve a target MOI (multiplicity of infection) of 0.3-0.4, a test transduction was carried out. Specifically, Mel624 cells were infected in 12-well plate format with different viral volumes (10, 30, 50, 100 and 150 µL) of each library in D10 media supplemented with 6 µg/mLpolybrene (Sigma-Aldrich, Saint Louis, MO). Spinfection was carried out by centrifugation at 1,000 rcf for 1 h at 30 °C. Twenty-four hour post spinfection, infected cells were reseeded into 2 wells of a 12-well plate each with D10 media; one well was supplemented with 1 µg/ml puromycin. Cells were counted at
day 5 post-selection to calculate the infection efficiency by comparing survival with and without puromycin selection. The highest viral volume yielding an MOI < 0.4 was used for large-scale screening. - Screening scale spinfection was performed with enough Mel624 cells in 12-well plate format to achieve minimum representation of ~300 cells per sgRNA in the library. Cells were trypsinized 12 hours after spinfection and seeded in T-flasks. Twenty-four hours post-spinfection, cells were selected with 1 µg/mL puromycin for 5-7 days to eliminate uninfected cells.
- NY-ESO-1 and MART-1 T cells were used for co-culture assays. Two days prior to co-culture, cells were thawed in T cell media containing 3 U/mL DNAse (Genentech Inc., South San Francisco, CA) overnight. Tumor cells were seeded at a specific density on this day in the same media as the T cells. T cells were then cultured in T cell media containing 300 IU/mL interleukin-2 (IL2) for 24 hours. T cells were co-cultured with tumor cells at various Effector: Target (E:T ratios) for varying time periods. To reduce T cell killing activity and enrich for resistant tumor cells during the recovery phase, T cells were removed by careful 2x phosphate buffered saline (PBS) washes following the addition of D10 media without IL2. At the end of recovery phase of co-culture, tumor cells were detached using trypsin (Invitrogen) and washed twice with PBS. Tumor cells were then stained with fixable LIVE/DEAD dye (Invitrogen) followed by human anti-CD3 antibody (SK7, BD) in FACS staining buffer (PBS + 0.2% BSA). Cell counts were measured using COUNTBRIGHT Absolute Counting Beads (Invitrogen) by flow cytometry.
- Cell-cell interaction genome-wide screens were performed using Mel624 cells transduced independently with both A and B GeCKOv2 libraries. In the initial screen, two sets of 5 × 10⁷ transduced Mel624 cells were split. Cells from one set were co-cultured with 1.67 × 10⁷ patient-derived NY-ESO-1 T cells (E:T ratio of 1:3) for each library. Tumor cells from another set were used as controls, which were cultured under the same density and conditions, but without T cells. The co-culture phase was maintained for 12 hours after which the T cells were removed as described above. The recovery phase was maintained for another 48 hours. Cells from co-culture flasks and from control flasks were harvested for genomic DNA (gDNA) extraction. In this initial screen, NY-ESO-1 T cells lysed ~76% of tumor cells, and the surviving cells were frozen to evaluate sgRNA enrichment later. This was termed the low selection pressure (LoSelect) screen. In the second screen, again two sets of 5 × 10⁷ transduced Mel624 cells were provided. For one set, the E:T ratio was increased to 1:2 by co-culture of 2.5 × 10⁷ NY-ESO-1 T cells with 5 × 10⁷ transduced Mel624 cells for each library while keeping all other conditions similar. As before, the second set of Mel624 cells were used as controls, which were cultured under the same density and conditions, but without T cells. By increasing the selection pressure, it was observed that T cells killed ~90% of Mel624 cells. Therefore, this was termed the high selection pressure (HiSelect) screen. To evaluate sgRNA enrichment in surviving resistant tumor cells, cells were harvested and frozen.
- For gDNA extraction from harvested tumor cells (minimum 3 × 10⁷ control cells), frozen cell pellets were thawed. An ammonium acetate and alcohol precipitation procedure was used to isolate gDNA as previously described (Chen et al., Cell, 160: 1246-1260 (2015)). The first step of extraction protocol was modified to use AL buffer (Qiagen) for cell lysis.
- To determine sgRNA abundance as the readout of library screens, two-step PCR amplifications were performed on gDNA using TAKARA EX-TAQ polymerase (Clontech). The first PCR step (PCR1) included amplification of the region containing sgRNA cassette using v2Adaptor _F and v2Adaptor_R primers, and the second step PCR (PCR2) included amplification using uniquely barcoded P7 and P5 adaptor-containing primers to allow multiplexing of samples in a single HISEQ run. All PCR1 and PCR2 primer sequences, including full barcodes, are listed on the GeCKO website (genome-engineering.org/gecko/). Assuming 6.6 pg of gDNA per cell, 150 µg of gDNA was used per sample (> 300 cells per library sgRNA representation), and 15 PCR1 reactions were performed for each biological sample. Ten µg gDNA were used as input in each 100 uL PCR1 reaction performed under cycling conditions: 95 °C for 5 min, 18 cycles of (95 °C for 30 s, 62 °C for 30 s, 72 °C for 30 s), and 72 °C for 3 min. PCR1 products for each sample were pooled and used for amplification with barcoded second step PCR primers. Seven PCR2 reactions were performed using 5 µL of the pooled PCR1 product per PCR2 reaction. Second PCR products were pooled and then normalized for each biological sample before combining uniquely-barcoded separate biological samples. The pooled product was then gel-purified from a 2% E-GEL EX (Life Technologies, Carlsbad, CA) using the QIAQUICK kit (Qiagen, Hilden, Germany). The purified, pooled library was then quantified with TAPESTATION 4200 instrument (Agilent Technologies, Santa Clara, CA). Diluted libraries with 5%-20% PhiX were sequenced with
HISEQ 2000 system. - Sequencing reads were demultiplexed using custom LINUX shell scripts, allowing for a maximum of 1 mismatch in either forward or reverse barcodes. Demultiplexed reads were trimmed by CUTADAPT tool using 12 bp flanking sequences around the 20 bp guide sequence (Martin, EMBnet J., 17 (2011)). Trimmed reads were aligned using BOWTIE aligner (Langmead et al., Genome Biol., 10: 1-10 (2009)) to the GeCKOv2 indexes created from library CSV files downloaded from the GeCKO website (genome-engineering.org/gecko/?page_id=15). Read alignment was performed with parameters -m 1 -v 1 -norc, which allows up to 1 mismatch and discards any reads that do not align in the forward orientation or that have multiple possible alignments. Aligned counts of library sgRNAs were imported into R/RStudio. Counts were first normalized by the total reads for each sample and then log-transformed. A gene ranking was computed using the second most enriched sgRNA for each gene. This ranking is robust to outlier/off-target effects that enrich/deplete a single sgRNA by requiring at least 2 enriched sgRNAs targeting the same gene.
- Individual lentiCRISPRs were produced as above except that viral supernatants were not concentrated. For each gene, 3-4 sgRNA guide sequences were used, where 2 sgRNAs sequences were designed de novo and other 2 sgRNAs were from GeCKOv2 library. These sgRNAs were cloned into the lentiCRISPRv2 vector (Addgene) as previously described (
Fig. 9 ). To produce virus in a high-throughput format, HEK293FT cells were seeded and transfected in 6-well plates where each well received a different lentiCRISPR plasmid. The lentiviral production protocol was the same as the one described above for GeCKOv2 library lentivirus production. - Mel624 and A375 cells with unique gene perturbation were generated using these viral supernatants. Typically, 500 ul of lentiCRISPRv2 virus per 5 × 10⁴ cells for Mel624 and A375 was used. Puromycin selection was applied to these cells for 5-7 days, which is the time period needed to completely kill an untransduced control for both Mel624 and A375.
- Cells were split and one half were frozen for analysis of insertion-deletion (indel) mutations after non-homologous end-joining repair and the remainder were normalized to seed 1 × 10⁴ cells/well in 96-well plates. During the arrayed screen, each cell line was co-cultured with appropriate T cells (either NY-ESO-1 or MART-1) in a 96-well plate format at an E:T ratio of 1:3 for 12 hours in T cell media. As in the pooled screen, gentle 2x PBS washes were performed to remove the T cells. Mel624 or A375 cells were collected after a recovery phase culture of 48 hours for high-throughput flow cytometry analysis. Tumor cell counts were measured using a FACS-based COUNTBRIGHT bead method. Variability was noticed in proliferation and survival rates across cells depending on the sgRNA received. To account for this variability, a relative percent change was calculated for each sgRNA: (%Δ, 2CT vs noT) in tumor cells co-cultured with T cells (2CT) compared to tumor cell counts without T cells (noT). The normalized resistance was calculated by the following formula:

- Frozen cell pellets were thawed for genomic DNA extractions. DNA was extracted with a Blood & Cell Culture MIDI kit (Qiagen). SgRNA target site PCR amplifications were performed for each genomic loci using conditions as described (Chen et al., Cell, 160: 1246-1260 (2015)), pooled together and then sequenced in a single ILLUMINA MISEQ. All primer sequences for indel detection can be found in Table A.
TABLE A sgRNA_Name Forward primer (5'-3') Reverse primer (5'-3') APLNR_sgRNA_1 TCTGGACCGTGTTTCGGAG (SEQ ID NO: 65) ACGCTGGCGTACATGTTGA (SEQ ID NO: 82) APLNR_sgRNA_3 CACTGGCCCTGTGACTTTGA (SEQ ID NO: 66) GTAGCTGGCTGACTTCTCCC (SEQ ID NO: 83) BBS1_sgRNA_2 AGAGGGTCAGTGGAGAGGTC (SEQ ID NO: 67) CTCCATGAGGAAGGTGGCAG (SEQ ID NO: 84) BBS1_sgRNA_4 AGCCTGGACTTGTACCCAGA (SEQ ID NO: 68) GGACCATTGTCTGACTCCCC (SEQ ID NO: 85) CD58_sgRNA_1 CGTAGGCGGTGCTTGAACTTA (SEQ ID NO: 69) CGTCTCTGATCGGCAACCG (SEQ ID NO: 86) CD58_sgRNA_2 CTACTTCTGGCCGACCGC (SEQ ID NO: 70) ACCCGTCTCTGATCGGCAA (SEQ ID NO: 87) CD58_sgRNA_3 CATGTACCAAGCAATGTGCCTTTA (SEQ ID NO: 71) TGGAATACTCACCAAGCACATA (SEQ ID NO: 88) COL17A1_sgRNA_1 AGTTTGATTCCTGGAGGCAG (SEQ ID NO: 72) CCTGGTTTGAGGTTTTGAAGGA (SEQ ID NO: 89) COL17A1_sgRNA_2 ATCCAGAGGTGTCAGTGCATTA (SEQ ID NO: 73) AGCTCCCATGGAAAAGGTTACAG (SEQ ID NO: 90) MLANA_sgRNA_1 GTGCCCTGACCCTACAAGATG (SEQ ID NO: 74) AGGCATGTACTGGTGGAAGTC (SEQ ID NO: 91) MLANA_sgRNA_2 GTGCCCTGACCCTACAAGATG (SEQ ID NO: 75) AGGCATGTACTGGTGGAAGTC (SEQ ID NO: 92) RPL23_sgRNA_1 CATGTGCGGTGAATTACAGCTT (SEQ ID NO: 76) TTCACTCTCCCCTTTCTTGACG (SEQ ID NO: 93) RPL23_sgRNA_3 CATGTGCGGTGAATTACAGCTT (SEQ ID NO: 77) TTCACTCTCCCCTTTCTTGACG (SEQ ID NO: 94) SOX10_sgRNA_3 AATCATAGGGCACAGCCCCC (SEQ ID NO: 78) TACTTGTAGTCCGGGTGGTCT (SEQ ID NO: 95) TAPBP_sgRNA_3 TGAAGTTCCCCGAACGCTG (SEQ ID NO: 79) AAGAGGCTGGAGAGGCTGAG (SEQ ID NO: 96) TAPBP_sgRNA_4 CACCAGACATACAAACCGCTC (SEQ ID NO: 80) ACTGAGATAGAGCTCAGGGTCG (SEQ ID NO: 97) CTAG1B_sgRNA_1 AACTTCCTGCAGCCTCTCTG (SEQ ID NO: 81) CCCTGGGCCATCAGGAATG (SEQ ID NO: 98) - To analyze the data from the MISEQ run, paired-end reads were trimmed for quality using trimmomatic with parameters SLIDINGWINDOW: 5 : 25 (Bolger et al., Bioinformatics, (2014)). Reads with surviving mate pairs were then aligned to their targeted amplicon sequence using Bowtie2 (Langmead et al., Nat. Meth., 9: 357-59 (2012)). To determine indel sizes, the size difference between observed reads and predicted read size based on the genomic reference sequence was calculated. If observed read size was equal to the predicted size, these reads were scored as no indels. The size difference was used to detect insertions or deletions.
- Tumor cells or T cells suspended in FACS staining buffer were stained with fluorochrome-conjugated antibodies against combinations of the following surface human antigens: CD4 (RPA-T4, BD, Franklin Lakes, NJ), CD8 (SK1, BD), CD3e (SK7, BD), HLA-A2/MART-1:27-35 tetramer (DMF5, Beckman Coulter Immunotech, Monrovia, CA); NY-ESO-1 tetramer (NIH Tetramer Core Facility); PD1-L1 (MIH1, eBiosciences, San Diego, CA); PD1-L2 (24F.10C12, Biolegend, San Diego, CA); beta-Galectin (9M1-3, Biolegend), CD58 (1C3, BD) and b2M (2M2, Biolegend). Cell viability was determined using propidium iodide exclusion or fixable live/dead (Invitrogen). Flow cytometric data were acquired using either a FACSCANTO II or LSRII FORTESSA cytometer (BD), and data were analyzed with FLOWJO version 7.5 software (FlowJo LLC, Ashland, OR). The amount of IFNγ release by T cells after co-culture with tumor cells was measured by Sandwich ELISA assay using anti-IFNγ (Thermo Scientific M700A) coated 96-well plates, biotin-labeled anti-IFNy (M701B), HRP-conjugated streptavidin (N100) and TMB substrate solution (N301).
- Total protein was extracted with 1X RIPA lysis buffer (Millipore, Billerica, MA) with 1X protease inhibitor (Roche, Basel, Switzerland). Protein concentration was determined using the BCA assay (Thermo/Pierce). Cell lysates were resolved on 4-20% Tris-Glycine gels (Invitrogen), transferred to PVDF membranes (Millipore), and incubated overnight at 4 °C with the appropriate primary antibodies: Anti-APLNR (1:500, Santa Cruz Biotechnology H-300 sc-33823), Anti-BBS1 (1:500, Santa Cruz Biotechnology F-1 sc-365138), Anti-SOX10 (1:1000, Cell Signaling D5V9L 89356) and Anti-BETA ACTIN (1:1000, Santa Cruz Biotechnology C4 sc-47778). Signals were detected using HRP-conjugated secondary antibodies (Santa Cruz Biotechnology) and SUPERSIGNAL WEST FEMTO Chemiluminescent Substrate (Thermo/Pierce). Images were captured using CHEMIDOC TOUCH imaging system (Bio-Rad, Hercules, CA).
- RNAseq data were obtained from published work by Van Allen et al. (Levi Garraway group) and Reads Per Kilobase of transcript per Million mapped reads (RPKM) values were calculated with the same filters and criteria as described (Van Allen et al., Science, 350: 207-211 (2015)). For each of the genes explored, expression levels were divided into quartiles and the resulting categories were used to determine if there was an association between the expression level and overall survival (OS). The probability of OS as a function of time was estimated by the Kaplan-Meier method, and the statistical significance of the difference among curves was determined by the log-rank test. When the initial analysis of Kaplan-Meier curves suggested that there could be a difference between two pooled sets of categories, the resulting division into two groups was made and the significance was reported using an adjusted p-value equal to three times the unadjusted p-value to account for the number of implicit tests done to arrive at the final grouping. Those genes whose expression levels were potentially associated with OS with unadjusted p-values <0.10 by univariate analyses were evaluated for their joint significance using Cox proportional hazards models.
- For pathway analysis, all genes in the genome-scale CRISPR pooled screen with a second-best sgRNA score above the FDR threshold (log2(enrichment) > 0.5) were first identified. This yielded a list of 554 genes. In this list, gene category over-representation was looked for using Ingenuity Pathway Analysis (QIAGEN Redwood City, qiagen.com/ingenuity). The analysis criteria were set as follows: 1) querying for molecules with Ingenuity Knowledge Base as a reference set, 2) restricted to human species, and 3) experimentally observed findings as a confidence level. Fisher's Exact Test (p < 0.05) was used to compute significance for over-representation of genes in a particular pathway/biological process.
- TCGA RNA-seq data from multiple cancer data sets was downloaded from the Firehose Broad GDAC (gdac.broadinstitute.org/, DOI for data release: 10.7908/C11G0KM9) using the TCGA2STAT package for R (Wan et al., Bioinformatics, 32: 952-54 (2016)) and used to find overlap between TCGA gene expression indicative of cytolytic activity and genes from the pooled screen where loss-of-function create resistance to T cell killing.
- The genes correlated with a previously identified cytolytic activity signature, namely expression of granzyme A (GZMA) and perforin 1 (PRF1) were first identified (Rooney et al., Cell, 160: 48-61 (2015)). To identify these genes in the TCGA data, the geometric mean of GZMA and PRF1 was calculated in each data set and any genes with a positive correlation to this quantity across patients were searched for (Pearson's r > 0, p < 0.05).
- The intersection between genes whose expression was correlated with cytolytic activity (TCGA datasets) and the enriched genes found the CRISPR screen (cutoff >0.5 on second most enriched guide score, 554 genes) was then examined. This method resulted in the genes correlated with CYT in many cancers, which formed
Cluster 1 andCluster 2. Individual heatmaps for the two sets of clustered genes were regenerated for each cancer type. - Data between two groups were compared using a two-tailed unpaired Student's t test or the Mann-Whitney test as appropriate for the type of data (depending on normality of the distribution). Unless otherwise indicated, a P value less than or equal to 0.05 was considered statistically significant for all analyses, and not corrected for multiple comparisons. To compare multiple groups, an analysis of variance (ANOVA) with the Bonferroni correction was used. Prism (GraphPad Software Inc., La Jolla, CA) was used for these analyses.
- This example demonstrates that CRISPR-Cas9 mediated perturbation of genes in cancer cells resist engineered T-cell mediated lysis.
- To identify the genes which confer sensitivity to T cell-mediated cytolysis to tumor cells, a 'two cell-type' (2CT) CRISPR assay system including human T cells as effectors and tumor cells as targets was developed (
Fig. 1A ). Unlike in vitro single cell-type screens or in vivo screens, the 2CT system uniquely allows one to: 1) understand how genetic manipulations in one cell type can affect a complex interaction between cell types; 2) perform the pooled screen with much higher library representation than cannot typically be achieved in vivo; and 3) identify novel genes and pathways which may not be detected by in vitro single cell-type screens or the uncontrolled environment of in vivo screens. - To develop the 2CT assay, T cell receptor (TCR) engineered human T cells that can specifically recognize and lyse melanoma cells expressing NY-ESO-1 antigen (NY-ESO1:157-165 epitope) in an HLA-A∗02-restricted fashion (ESO T cells) were utilized (
Fig. 1B and Table 1) (Robbins et al., J. Immunol., 180: 6116-131 (2008); Johnson et al., J. Immunol., 177: 6548-59 (2006)). The 2CT assay was designed to control selection pressure, alloreactivity and bystander killing (Spiotto et al., 10: 294-298 (2004)) exerted by T cells via modulation of effector to target (E:T) ratio and length of co-incubation (Table 1 andFigs. 5A-5D ). A FACS-based determination of live, PI (propidium iodine)-negative CD3-tumor cell counts after co-culture of patient ESO T cells with Mel624 cells at an E:T ratio of 100 for 24 hr was carried out. The percentages of CD3-/PI- cells measured was as follows: DMEM (89.7) (control), Tcell media (92.2) (control), Patient 1 (1.3), Patient 2 (1.9), and Patient 3 (3.6). - To test whether the loss of antigen presentation genes can directly compromise T cell-mediated cell lysis of human cancer cells using the 2CT CRISPR assay, LMP2, TAP2 and B2M known to be involved in MHC-I dependent antigen presentation were targeted (Neefjes et al., Nat. Rev., Imunol., 11: 823-36 (2011)). Three unique single guide RNAs (sgRNAs) for each of these three genes were designed and cloned into a lentiviral CRISPR vector (lentiCRISPRv2), and NY-ESO-1+ Mel624 cells were transduced at a low multiplicity of infection (MOI = 0.5). FACS analysis confirmed that B2M targeting lentiviral CRISPRs were able to achieve at least 95% allele modifications in these cells (
Fig. 1C ). Upon co-culture of the gene modified NY-ESO-1+ Mel624 cells with ESO T cells, significant cytolysis resistance was detected in cells transduced with B2M sgRNAs (72 ± 5%) and with TAP2 sgRNAs (13 ± 2%) (Figs. 1D and 1E ). These results suggest that the dynamic range (Fig. 1E ) of the 2CT assay platform was sufficient to perform a positive selection screen. - This example demonstrates that a 2CT GeCKOv2 screen in Mel624 melanoma cells identifies genes that confer resistance to T cell-mediated cytolysis.
- To identify the tumor intrinsic genes which confer sensitivity to T cell mediated cytolysis to cancer cells, a Genome-Scale CRISPR Knock-Out (GeCKO) screen was performed using the 2CT assay platform with different ratios of T cells to tumor cells (
Fig. 2A ). Specifically, transduced Mel624 cells were exposed to ESO T cells at E:T ratios that resulted in less than complete T cell-mediated tumor cell death after a 12 hour exposure (Fig. 5B ). These screens with different E:T ratios were termed as 'LoSelect' (E:T = 0.3) and 'HiSelect' (E:T = 0.5) conditions. In each screen, the Mel624 cells were independently infected with two human genome-scale libraries: Library A containing ~65,000 sgRNAs (3 sgRNAs per gene or microRNA) and Library B containing ~55,000 sgRNAs (3 different sgRNAs per gene). To examine the sgRNA library representation through each step of the screen, deep sequencing analysis was used to count sgRNA reads. The sgRNA reads from transduced cells 5-7 days post-puromycin selection showed high concordance with the reads from GeCKO plasmid pool (Fig. 2B ), demonstrating that sgRNA library representation was maintained during transduction and puromycin selection. It was observed that the distribution of sgRNA reads in T cell-treated samples versus controls was significantly different only in the HiSelect screens (Fig. 2C , Kolmogorov-Smirnov test, P = 7.5 × 10⁻⁵), and not in the LoSelect screens (P = 0.07), indicating that the efficiency of this 2CT CRISPR platform depends mainly on the selection pressure applied by T cells. - For both screens, sgRNA enrichment was analyzed at the individual gene level by multiple methods: 1) top ranked genes by the second most enriched sgRNA (
Figs. 2D and6A-6B ); and 2) the percentage of sgRNAs enriched in the top 5% of all sgRNAs for each gene. Both methods showed a high degree of overlap (Figs. 2E and6A-6B ). Known T cell response genes, including HLA-A, B2M, TAP1, TAP2 and TAPBP, ranked amongst the top 20 genes enriched in the HiSelect screens (Figs. 2D and2E ), indicating that CRISPR mediated perturbations in MHC-I pathway rendered these cells resistant to T cell-mediated cytolysis. Further analyses of these data showed enrichment of several genes not previously implicated in orchestrating T cell anti-tumor responses. Consistent enrichment between multiple, independent sgRNAs targeting the same gene was looked for. Two genes (SOX10 and CD58) had 5 out of 6 sgRNAs and three genes (MLANA, PSMB5 and RPL23) had 4 out of 6 sgRNAs enriched in top 5% of most enriched sgRNAs (Fig. 2E ). Despite the disparity in the enriched sgRNA distributions between LoSelect and HiSelect screens, which is most likely due to differential T cell selection pressures (Fig. 2C ), ~10% of genes ranked amongst top 5% most enriched were overlapped across both screens (Fig. 7A-7B ). - The top 554 ranked genes were further selected from HiSelect screens with the second most enriched sgRNA score > 0.5 (estimated FDR = 0.1% based on 1000 non-target control sgRNAs;
Figs. 8A-8B ) for ontology and pathway enrichment analyses to discover groups of genes underlying T cell resistance. The loss of a significant number of genes involved in EIF2 signaling, SRP-dependent peptide targeting to membrane, assembly of RNA polymerase II, and protein ubiquitination pathways (F-test, Bonferroni corrected P < 0.05) conferred resistance to T cell-mediated cytolysis (Tables 2 and 3), emphasizing the role of these pathways in modulating T cell response to tumor cells. Table 2 shows the gene set enrichment analysis output for top 100 ranked genes from HiSelect screens. Table 3 shows the pathway enrichment analysis of the top 500 ranked genes from HiSelect screens.TABLE 2 GO biological process complete Homo sapiens - REFLIST (20814) Genes Uploaded (90) Bonferroni corrected (P-value) antigen processing and presentation of endogenous peptide antigen via MHC class I (GO:0019885) 11 5 1.36E-05 antigen processing and presentation of endogenous peptide antigen (GO:0002483) 12 5 2.09E-05 antigen processing and presentation of endogenous antigen (GO:0019883) 14 5 4.49E-05 antigen processing and presentation of exogenous peptide antigen via MHC class I, TAP-dependent (GO:0002479) 75 9 4.32E-07 antigen processing and presentation of exogenous peptide antigen via MHC class I (GO:0042590) 79 9 6.81E-07 SRP-dependent cotranslational protein targeting to membrane (GO:0006614) 109 12 6.21E-1 0 cotranslational protein targeting to membrane (GO:0006613) 112 12 8.52E-10 protein targeting to ER (GO:0045047) 113 12 9.44E-10 establishment of protein localization to endoplasmic reticulum (GO:0072599) 117 12 1.41E-09 ribosome assembly (GO:0042255) 51 5 2.54E-02 protein localization to endoplasmic reticulum (GO:0070972) 136 12 8.05E-09 antigen processing and presentation of peptide antigen via MHC class I (GO:0002474) 104 9 7.41E-06 nuclear-transcribed mRNA catabolic process, nonsense-mediated decay (GO:0000184) 119 10 1.09E-06 viral transcription (GO:0019083) 111 9 1.30E-05 viral gene expression (GO:0019080) 121 9 2.73E-05 multi-organism metabolic process (GO:0044033) 127 9 4.13E-05 protein targeting to membrane (GO:0006612) 186 12 2.90E-07 tumor necrosis factor-mediated signaling pathway (GO:0033209) 115 7 6.12E-03 antigen processing and presentation of exogenous peptide antigen (GO:0002478) 171 10 3.43E-05 antigen processing and presentation of exogenous antigen (GO:0019884) 178 10 4.99E-05 nuclear-transcribed mRNA catabolic process (GO:0000956) 181 10 5.84E-05 antigen processing and presentation of peptide antigen (GO:0048002) 188 10 8.33E-05 translational termination (GO:0006415) 171 9 5.14E-04 mRNA catabolic process (GO:0006402) 193 10 1.06E-04 translational elongation (GO:0006414) 200 10 1.48E-04 viral life cycle (GO:0019058) 241 11 7.00E-05 RNA catabolic process (GO:0006401) 222 10 3.90E-04 cellular protein complex disassembly (GO:0043624) 200 9 1.90E-03 antigen processing and presentation (GO:0019882) 225 10 4.41E-04 establishment of protein localization to membrane (GO:0090150) 273 12 2.14E-05 protein complex disassembly (GO:0043241) 220 9 4.18E-03 cellular response to tumor necrosis factor (GO:0071356) 203 8 2.42E-02 macromolecular complex disassembly (GO:0032984) 229 9 5.81E-03 translational initiation (GO:0006413) 232 9 6.47E-03 establishment of protein localization to organelle (GO:0072594) 348 12 3.03E-04 viral process (GO:0016032) 674 23 8.12E-11 multi-organism cellular process (GO:0044764) 678 23 9.19E-11 protein localization to membrane (GO:0072657) 388 13 1.10E-04 nucleobase-containing compound catabolic process (GO:0034655) 344 11 2.45E-03 interspecies interaction between organisms (GO:0044419) 749 23 7.25E-10 symbiosis, encompassing mutualism through parasitism (GO:0044403) 749 23 7.25E-10 translation (GO:0006412) 397 12 1.24E-03 peptide biosynthetic process (GO:0043043) 420 12 2.25E-03 cellular nitrogen compound catabolic process (GO:0044270) 386 11 7.50E-03 heterocycle catabolic process (GO:0046700) 386 11 7.50E-03 protein targeting (GO:0006605) 423 12 2.43E-03 aromatic compound catabolic process (GO:0019439) 396 11 9.60E-03 regulation of innate immune response (GO:0045088) 368 10 3.66E-02 peptide metabolic process (GO:0006518) 517 14 4.05E-04 protein localization to organelle (GO:0033365) 528 14 5.24E-04 organic cyclic compound catabolic process (GO:1901361) 427 11 1.97E-02 amide biosynthetic process (GO:0043604) 480 12 9.08E-03 cellular macromolecule catabolic process (GO:0044265) 764 19 4.87E-06 cellular component disassembly (GO:0022411) 493 12 1.20E-02 mRNA metabolic process (GO:0016071) 564 13 7.71E-03 single-organism membrane organization (GO:0044802) 715 16 5.58E-04 macromolecule catabolic process (GO:0009057) 899 19 6.82E-05 cytoplasmic transport (GO:0016482) 713 15 3.27E-03 cellular amide metabolic process (GO:0043603) 666 14 8.38E-03 membrane organization (GO:0061024) 877 17 1.58E-03 intracellular protein transport (GO:0006886) 727 14 2.31E-02 cellular protein localization (GO:0034613) 1138 18 1.25E-02 cellular macromolecule localization (GO:0070727) 1146 18 1.38E-02 organic substance catabolic process (GO:1901575) 1509 22 2.72E-03 protein complex subunit organization (GO:0071822) 1406 20 1.52E-02 cellular catabolic process (GO:0044248) 1448 20 2.38E-02 catabolic process (GO:0009056) 1764 24 2.46E-03 multi-organism process (GO:0051704) 2169 29 1.35E-04 macromolecular complex subunit organization (GO:0043933) 2074 27 8.65E-04 immune system process (GO:0002376) 2163 25 2.64E-02 gene expression (GO:0010467) 3825 40 9.26E-05 RNA biosynthetic process (GO:0032774) 2680 28 4.02E-02 cellular protein metabolic process (GO:0044267) 3575 35 6.72E-03 cellular component organization (GO:0016043) 5066 45 1.00E-03 protein metabolic process (GO:0019538) 4241 37 4.70E-02 cellular component organization or biogenesis (GO:0071840) 5188 45 2.09E-03 cellular macromolecule metabolic process 6753 51 1.50E-02 (GO:0044260) macromolecule metabolic process (GO:0043170) 7438 55 6.68E-03 metabolic process (GO:0008152) 9928 64 4.46E-02 Unclassified (UNCLASSIFIED) 4272 7 0.00E+00 TABLE 3 Ingenuity® Canonical Pathways -log(p-value) Ratio Molecules EIF2 Signaling 1.26E+01 1.44E-01 RPL24, RPLP1, RPL22L1, RPL35A, EIF2S1, RPL7A, RPL13, RPL18A, EIF3D, RPL23A, RPL21, RPL18, RPS19, RPL34, RPL3, RPS10, RPL23, RPS29, RPL10A, RPL9, RPL15, RPL8, RPL10, EIF3L, RPLP0, RPL38 Antigen Presentation Pathway 5.65E+00 2.16E-01 B2M, CALR, PSMB5, HLA-A, HLA-F, TAP1, TAP2, TAPBP Endoplasmic Reticulum Stress Pathway 3.93E+00 2.38E-01 CALR, MAP3K5, EIF2S1, CASP7, MBTPS2 Assembly of RNA Polymerase II Complex 3.73E+00 1.40E-01 TAF1, TAF5, TBP, GTF2H5, TAF3, TAF7, TAF1L Cytotoxic T Lymphocyte-mediated Apoptosis of Target Cells 3.03E+00 1.56E-01 B2M, FADD, HLA-A, CASP8, CASP7 Interferon Signaling 2.79E+00 1.39E-01 JAK1, IFNGR2, JAK2, STAT1, TAP1 Role of JAK1, JAK2 and TYK2 in Interferon Signaling 2.62E+00 1.67E-01 JAK1, IFNGR2, JAK2, STAT1 IL-15 Production 2.42E+00 1.48E-01 JAK1, JAK2, STAT1, PTK7 TNFR1 Signaling 2.23E+00 1.04E-01 MAP4K2, FADD, RIPK1, CASP8, CASP7 Protein Ubiquitination Pathway 2.03E+00 5.10E-02 USP31, B2M, PSMB3, PSMA6, PSMB5, HLA-A, USP10, PSMC4, PSMD14, PSMC2, TAP2, TAP1, VHL Role of JAK family kinases in IL-6-type Cytokine Signaling 1.67E+00 1.20E-01 JAK1, JAK2, STAT1 Death Receptor Signaling 1.62E+00 6.52E-02 FADD, RIPK1, MAP3K5, CASP8, ACTG1, CASP7 - This example demonstrates the validation of the most enriched genes from LoSelect and Hi Select screens.
- To validate top candidates, the 2CT CRISPR assay was performed using multiple individual sgRNAs (
Fig. 9 ). Seventeen genes were selected based on two criteria. First, the gene must be present in the top 20 ranked genes in either the HiSelect or LoSelect screen (Figs. 2E and7A-7B ). Second, the gene must be frequently mutated in patients with multiple cancer types curated in cBioPortal (Gao et al., Science Signaling, 6: p11 (2013); Cerami et al., Cancer Discovery, 2: 401-404 (2012)) (Table 4). CTAG1B (encoding NY-ESO-1) was also included as a positive control. Using ESO T cells and Mel624 cells, it was found that 15 out of 17 genes had at least one sgRNA that showed greater than 25% resistant cell survival against T cell-mediated killing (Figs. 3A-3C ). Without being bound to a particular theory or mechanism, it is believed that loss-of-function mutations in these genes may lead to resistance to T cell-mediated lysis by altering MHC-I presentation of specifically the NY-ESO-1 antigen or possibly via other more general mechanisms. To address this question, the resistance of eight of these genes was re-assessed in MART1+ Mel624 cells using MART-1 antigen specific T cells (Mart1 T cells) with high avidity TCRs (Robbins et al., J. Immuno., 180: 6116-131 (2008); Johnson et al., J. Immunol., 177: 6548-59 (2006)) (Fig. 10A-10B ), and observed phenotypic consistency (Figs. 3D-3E ). The efficiency of sgRNAs to form indels at the target loci in Mel624 cells was also verified (Fig. 11A-11K ).TABLE 4 List of genes and sgRNA spacers used in validation screens. sgRNA_Name Spacer sequence SEQ ID NO: for spacer sequence APLNR_sgRNA_1 GTACGTGTAGGTAGCCCACA 1. APLNR_sgRNA_2 GTAGCGGTCGAAGCTGAGGC 2. APLNR_sgRNA_3 TTTCGACCCCCGCTTCCGCC 3. APLNR_sgRNA_4 CTTCCGCAAGGAACGCATCG 4. BBS1_sgRNA_1 TCATGGAGCAACATGAGCCC 5. BBS1_sgRNA_2 CCTTTGAGCACCTTCAGGCG 6. BBS1_sgRNA_3 CGCATCCAACCACTTCGAAT 7. BBS1_sgRNA_4 GCAATGAGGCCAATTCGAAG 8. CD58_sgRNA_1 TGGTTGCTGGGAGCGACGCG 9. CD58_sgRNA_2 GACCACGCTGAGGACCCCCA 10. CD58_sgRNA_3 ATGTTAAGTTGTAGATAGTG 11. CD58_sgRNA_4 CATGTTGTAATTACTGCTAA 12. COL17A1_sgRNA_1 TTTTTATCCAGACCCAGCCA 13. COL17A1_sgRNA_2 TCAGGAGAAGAAAGAGAGAG 14. COL17A1_sgRNA_3 ACCAAGAAAAACAAACGAGA 15. COL17A1_sgRNA_4 TAGTTACTTACTTGGTGGTA 16. CTAG1 B_sgRNA_1 TCCGGAGCCATGCAGGCCGA 17. CTAG1 B_sgRNA_2 GAACAGAATACAACTCAAGC 18. CTAG1 B_sgRNA_3 CATGCCTTTCGCGACACCCA 19. DEFB134_sgRNA_1 CTAGTGGCAGGGTCTGACAT 20. DEFB134_sgRNA_2 TGTTAAGGAGGCTAGTGGCA 21. DEFB134_sgRNA_3 AAAGAAAGACAAACACAACA 22. DEFB134_sgRNA_4 CACAAGAAATGCTATAAAAA 23. DHX9_sgRNA_1 GGAGTATCAGTAAGTGGGGG 24. DHX9_sgRNA_2 GCTTTGAGAGCCAGATGTGG 25. DHX9_sgRNA_3 CCTCGGTCCCAGGTGGGCCC 26. DHX9_sgRNA_4 CTCCGGACTTACAAAGAAGA 27. KHDRBS3_sgRNA_1 CGCTTCAGAGAATTGCCACG 28. KHDRBS3_sgRNA_2 GGGACTGGCGGGGATCGCCG 29. KHDRBS3_sgRNA_3 TCCCGTAAAACAGTTCCCTA 30. KHDRBS3_sgRNA_4 AAACCCACCTTGCGTACAAG 31. MLANA_sgRNA_1 GCACGGCCACTCTTACACCA 32. MLANA_sgRNA_2 TCTATGGTTACCCCAAGAAG 33. MLANA_sgRNA_3 CTGGGAGTCTTACTGCTCAT 34. MLANA_sgRNA_4 TTGAACTTACTCTTCAGCCG 35. Nontargeting_Control TCCCCGAGACCATCTTAGGG 36. PSMB5_sgRNA_1 GCAAGCGCCATGTCTAGTGT 37. PSMB5_sgRNA_2 TGAGAACGCCTAGCAAAGAT 38. PSMB5_sgRNA_3 TTTGTACTGATACACCATGT 39. PSMB5_sgRNA_4 CTTTCCAGGCCTCTACTACG 40. PTCD2_sgRNA_1 TGCAGGAGAACTCGATTCGA 41. PTCD2_sgRNA_2 AGAATTTCAACAAAAGAAAG 42. PTCD2_sgRNA_3 ATTCATGATTTGAGAAAAAA 43. PTCD2_sgRNA_4 AGCTAATGCCACAGCGAAAC 44. RPL23_sgRNA_1 A TTTCCTTGGGTCTTCCGGT 45. RPL23_sgRNA_2 GCGAAATTCCGGATTTCCTT 46. RPL23_sgRNA_3 CAATTGATTACAGCTCCTAC 47. RPL23_sgRNA_4 TCTCTCAGTACATCCAGCAG 48. SOX10_sgRNA_1 GGCTCAGCTCCACCTCCGAT 49. SOX10_sgRNA_2 GTTCCCCGTGTGCATCCGCG 50. SOX10_sgRNA_3 CCGCTCAGCCTCCTCGATGA 51. SOX10_sgRNA_4 TGACAAGCGCCCCTTCATCG 52. SRP54_sgRNA_1 GGTGACGTTTCCTCATTGGG 53. SRP54_sgRNA_2 ACCGCCGCGTTCCTTCTACG 54. SRP54_sgRNA_3 GTAACCTACCTTCCATAAAA 55. SRP54_sgRNA_4 AGCTAGCATATTATTACCAG 56. TAPBP_sgRNA_1 GGTGCACTGCTGTTGCGCCA 57. TAPBP_sgRNA_2 GAACCAACACTCGATCACCG 58. TAPBP_sgRNA_3 AAGCGGCTCATCTCGCAGTG 59. TAPBP_sgRNA_4 GAACCAACACTCGATCACCG 60. TWF1_sgRNA_1 TTAGATTCTCAGAATGCCCA 61. TWF1_sgRNA_2 GGTTGTTTGTCCTCCAACAG 62. TWF1_sgRNA_3 TTACTTACATGAGAATGATC 63. TWF1_sgRNA_4 ATCTTTGCCAGAGCCAGAAA 64. - To better understand the effect of genetic background, the consistency of validated hits in A375, an unrelated NY-ESO-1+ melanoma cell line, was examined. Multiple sgRNAs targeting apelin receptor (APLNR), (Bardet-Biedl Syndrome 1 (BBS1), lymphocyte function-associated antigen 3 (CD58) and sex determining region Y box 10 (SOX10) in A375 cells also showed resistance against T cell activity (
Fig. 3F-3G ), confirming these genes as resistance mechanisms in 2 different melanoma cell lines. Using flow cytometry and immunoblot analysis, that these sgRNAs efficiently reduced the protein levels of the targeted genes in A375 cells was also confirmed (Figs. 12A-12B ). - Interferon gamma (IFNγ) secretion is a marker of effector T cell activation and also itself an effective means of tumor cell lysis. To test if the resistance mechanism of any of these genes was dependent on alteration of IFNy secretion, its release in the supernatants after a co-culture assay was measured. CD58 perturbations in tumor cells significantly reduced secretion of IFNγ from T cells, however a consistent effect with APLNR and SOX10 modifications on IFNγ secretion was not observed (
Fig. 13 ). None of the BBS1 targeting sgRNAs reduced IFNγ secretion significantly implying that an alternate mechanism underlies their T cell resistance phenotype (Figs. 3F, 3G , and13 ). These validated genes were further characterized to address whether T cell resistance was due to the loss of expression of β2M or up-regulation of the immune checkpoint ligands PD-L1, PD-L2 and galectin-9 on the cell surface. None of these markers were altered significantly in APLNR, BBS1, CD58 or SOX10 edited cells treated with ESO T cells for 24 hours (Figs. 14A-14D ). Broadly, these results indicate that multiple gene products involved in the regulation of the target cell lysis by T cells yet remain to be characterized. - This example demonstrates the association of top ranked genes from HiSelect screens with cytolytic activity in human cancers.
- To determine the implications of enriched gene targets from the 2CT screen on immunotherapy studies, it was examined whether expression levels of these genes were associated with survival in melanoma patients after CTLA4 blockade with ipilimumab (Van Allen et al., Science, 350: 207-211 (2015)). It was found that the expression levels of two MHC class I genes, B2M and TAP1, were associated with overall survival of patients in response to ipilimumab, while TAP2 levels were marginally associated with overall survival (
Figs. 4A-4B and15A-15B ). Any significant associations of other 2CT validated genes with overall survival in this small cohort (n = 42 patients) were not found. Multiple studies have established that clinical outcomes of CTLA4 blockade with ipilimumab depend predominantly on tumor infiltration and cytolytic activity of T cells (Van Allen et al., Science, 350: 207-211 (2015); Kvistborg et al., Science Transl. Med., 6: 254ra128-254ra128 (2014); Egen et al., Nat. Immunol., 3: 611-618 (2002)). A hallmark of cytolytic activity is the expression of cytolytic molecules perforin (PRF1) and granzyme A (GZMA) in the tumor microenvironment ("CYT expression") (Rooney et al., Cell, 160: 48-61 (2015). B2M, TAP1 and TAP2 were strongly correlated with CYT expression in the tumor microenvironment (Spearman p ≥ 0.6,Fig. 4C ). Interestingly, it was observed that APLNR expression was moderately correlated with CYT expression (p = 0.43, P = 0.005) and T cell signature genes (p = 0.48, P = 0.001) but not with NK cell signature genes (Fig. 4C ). Based on these correlative findings in a small cohort of melanoma patients, the correlation analysis was expanded across multiple cancer types in TCGA datasets. - It has been previously shown that genes which confer survival in cancers are cancer-type and cell-type dependent, but the majority of context independent genes belong to core biological processes (Hart et al., Cell, 163: 1515-26). It was attempted to apply the same principle to T cell responsive processes in tumor cells. Genes that correlate with CYT across different Cancer Genome Atlas (TCGA) datasets were searched for in order to obtain cancer-type independent genes which could be involved in core processes in cancer cell necessary for T cell-mediated killing. A dataset was generated from each cancer type containing genes that positively correlated with CYT expression (threshold P ≤ 0.05) and overlapped each of these datasets with the top 554 ranked genes from HiSelect screens (
Figs. 4D-4E ). This strategy was effective as it was found that the expression of B2M was positively associated with CYT expression across all 36 tumor types (Fig. 4F ). Additionally, it was observed that the expression of APLNR and CD58 correlated with cytolytic activity in 30 and 19 different tumor types, respectively (Fig. 4F ). It was also found that along with known antigen presentation and interferon response genes (JAK2, STAT1), genes in cancer cells likely involved in adhesion (ICAM1) and co-stimulation (CLECL1, LILRA1, LILRA3, HLA-F) of T cells were strikingly correlated across majority of cancer types (Fig. 4F ). Genes associated with cytolytic activity in TCGA cancer types included TBXAS1, GMIP, OTOA, LAIR1, CLEC1, GPSM3, TRAF1, JAK2, TAPBP, TAPBPL, ICAM1, LILRA1, LILRA3, STAT1, HLA-A, B2M, HLA-F, TAP1, and TAP2. It was also found that these genes do not distinguish between immunogenic (melanomas) and non-immunogenic (breast) cancer types. - The positive correlation of CRISPR screen candidates with CYT expression across several cancer types emphasizes that the loss of these T cell-response genes in tumor is very likely associated with the loss of cytolytic activity in tumor microenvironment implying that one of the possible mechanisms of how many cancers evade inherent T cell-mediated immune selection pressure is via loss of these response genes. These genes included the T cell antigen itself, co-stimulatory molecules like CD58 and regulators of antigen presentation, antigen expression or extrinsic apoptosis pathways, and validated novel candidates like APLNR, COL17A1 and RPL23.
- Using an unbiased functional genomic screen, genes in melanoma that confer the ability to elicit a T cell response were identified, including several previously not known to play a role in anti-tumor function of T cells. Although these experiments were only in melanoma models, further analysis of 2CT screen targets in TCGA expression data suggests that a subset of targets may be involved in immune evasion across different cancer types. With many different cancer models now available, future 2CT CRISPR screens may enable the discovery of novel clinical targets and biomarkers for immune- and cell-based therapies.
- This example demonstrates the validation of genes which confer the ability of renal cell carcinoma (RCC) cells to elicit CYT expression.
- HLA-A2+ RCC cells were transduced with a retrovirus encoding NY-ESO-1. The NY-ESO-1+/HLA-A2+ RCC cells were transduced with a CRISPR lentivrus encoding control, APLNR, BBS1, or CD58 sgRNA to produce gene-perturbed NY-ESO-1+/HLA-A2+ RCC cells. The gene-perturbed NY-ESO-1+/HLA-A2+ RCC cells were co-cultured with NY-ESO-1-specific T cells. The resistance of the RCC cells to CYT expression was determined and normalized. The results are shown in
Figure 16 . As shown inFigure 16 , knockout of APLNR, BBS1, or CD58 in RCC cells confers resistance to T cell mediated cytolysis. - This example demonstrates that Aplnr-knockdown in mhgp100-B16 tumors reduces anti-tumor efficacy of adoptive transfer of Pmel T cells.
- Tumor cells were treated with anti-Aplnr short hairpin RNA (shRNA). Control tumor cells were treated with irrelevant shRNA (scramble). B6 mice were implanted with 5×10⁵ tumor cells per mouse. The mice were treated with 1×10⁶ Pmel T cells, IL-2, and radiation (IR) on
day 10 following tumor impanation. Control mice were treated with IR and IL-2 only. Tumor area and survival were measured. The results are shown inFigures 17A and 17B . As shown inFigures 17A and 17B , knockout of Aplnr in melanoma tumor cells reduced the anti-tumor efficacy of adoptive transfer of Pmel T cells. - This example demonstrates that apelin ligand is produced by T cells and that apelin localizes in T cells during immune-synapse formation.
- The fold change in APELIN mRNA expression by bulk human anti-NY-ESO-1 T cells upon stimulation with OKT3 antibody for various time periods was measured. The results are shown in Table 5.
TABLE 5 Fold change in APELIN mRNA expression Duration of stimulation with OKT3 (time in hours) 1 0 (control) 1.5 16 3.5 24 - Bulk human anti-NY-ESO-1 T cells (effector cells) were co-cultured with A375 cells (target cells) at various effector:target ratios and for various time periods. The fold change in apelin released by the T cells upon co-culture was measured by ELISA. The results are shown in Table 6.
TABLE 6 Apelin release (pg/ml) Effector:target ratio Duration of co-culture (hours) 80 Tumor alone None 60 0.5 4 70 1.0 4 150 0.5 8 160 1.0 8 - As shown in Tables 5 and 6, apelin ligand is produced by T cells.
- The localization of apelin in human anti-NY-ESO T cells was examined under a microscope. It was observed that apelin localized in the leading edge at the pole opposite to the CD3 cluster in the T cells cultured alone.
- The localization of apelin in human anti-NY-ESO T cells which were co-cultured with A375 cells was also examined under a microscope. In the co-cultured cells, apelin localized at the immune synapse.
- This example demonstrates that APLNR loss-of-function mutations were detected in tumor lesions which were refractory to immunotherapies.
- Tumor lesions which were refractory to the immunotherapies shown in Table 7 were tested for expression of non-synonymous APLNR mutations. The results are shown in Table 7.
Figure 18A shows the location of the mutations on the APLNR protein.TABLE 7 APLNR mutation Immunotherapies T44S or C181S Ipilimumab (Ipi), nivolumab (nivo), and adoptive cell therapy (ACT) D184N, R236C, or W261X Ipi and pembrolizumab (Pembro) P292L, G349E, or E367K Ipi G349W Pembro - Tumor cells were untreated or treated with APLNR sg RNA (sg1) followed by rescue with WT APLNR RNA or APLNR RNA with one of the mutations indicated in
Figure 18B . The tumor cells were co-cultured with T cells, and cytolysis was measured. The results are shown inFigure 18B . As shown inFigure 18B , cells treated with rescue APLNR RNA with a mutation encoding G349E or T44S resist the restoration of T-cell-mediated cytolysis in APLNR-perturbed tumor cells (n = 3 biological replicates). - This example demonstrates that APLNR interacts with JAK1.
- The second-most-enriched sgRNA score in the CRISPR screens for 96 APLNR-interacting proteins from the BIOGRID database is shown in
Figure 19A . JAK1 was identified as a candidate for interacting with APLNR. JAK1 was isolated from A375 cell lysates by immunoprecipitation. Immunoprecipitation pull-down of IgG antibodies served as a control. The pull-down samples were tested for the presence of APLNR or JAK1. As a positive control, the pull-down samples were tested for the presence of actin. The results are shown inFigure 19B . As shown inFigure 19B , APLNR interacts with JAK1. - This example demonstrates that APLNR enhances IFN γ signaling in tumor cells.
- APLNR-edited (knockout) tumor cells were treated with 1 µg ml-1IFNγ (n = 3 biological replicates). Control tumor cells were treated with off-target sgRNA. At 0, 8, and 24 hours post-treatment, the cells underwent quantitative PCR analysis of JAK1-STAT1 pathway-induced genes. The results are shown in
Figure 20 . As shown inFigure 20 , APLNR knockout tumor cells showed less of a change in expression of IFI30, JAK1, TAP1, TAP2, TAPBP, andIRF1 24 hours after treatment as compared to control tumor cells. - This example demonstrates that APLNR loss reduces β2M induction and recognition by T cells.
- Tumor cells were CRISPR-edited using control sgRNA, anti-APLNR sg1 RNA or anti-APLNR sg2 RNA. The treated cells were co-cultured with anti-NY-ESO-1 T cells. Surface expression of β2M by T cells was measured by fluorescence-activated cell sorting (FACS). The results are shown in
Figure 21A . As shown inFigure 21A , APLNR loss reduced β2M induction. - A375 tumor cells were CRISPR-edited using control sgRNA, anti-APLNR sg1 RNA, anti-APLNR sg2 RNA, anti-NY-ESO-1 sg1 RNA, or anti-NY-ESO-1 sg1RNA. The treated cells were co-cultured with anti-NY-ESO-1 T cells overnight. IFNγ secretion was measured using ELISA. The results are shown in
Figure 21B . As shown inFigure 21B , APLNR loss reduced recognition of the tumor cells by the T cells. - This example demonstrates that functional loss of APLNR reduces the efficacy of adoptive cell transfer immunotherapy.
- B16 melanoma tumor cells were edited using CRISPR to knockout expression of B2m or APLNR. The CRISPR-edited B16 tumor cells were subcutaneously transplanted into mice. After 10 days, tumor-bearing mice were treated with adoptive cell transfer of Pmel T cells. Tumor growth and survival was measured. The results are shown in
Figures 22A-22C . - As shown in
Figures 22A-22C , the functional loss of APLNR reduced the efficacy of the adoptive cell transfer immunotherapy. - This example demonstrates that the functional loss of APLNR reduces the efficacy of anti-CTLA4 blockade immunotherapy.
- B2905 melanoma tumor cells (derived from C57BL/6-HGF mice) were edited using CRISPR to knockout expression of APLNR. The CRISPR-edited B2905 melanoma cells were subcutaneously implanted into mice. The mice were treated with four doses of 250 µg of IgG control or anti-CTLA4 antibodies on
days Figures 23A and 23B . - As shown in
Figures 23A-23B , the functional loss of APLNR reduced the efficacy of anti-CTLA4 blockade immunotherapy. - All references, including publications, patent applications, and patents, cited herein are hereby incorporated by reference to the same extent as if each reference were individually and specifically indicated to be incorporated by reference and were set forth in its entirety herein.
- The use of the terms "a" and "an" and "the" and "at least one" and similar referents in the context of describing the invention (especially in the context of the following claims) are to be construed to cover both the singular and the plural, unless otherwise indicated herein or clearly contradicted by context. The use of the term "at least one" followed by a list of one or more items (for example, "at least one of A and B") is to be construed to mean one item selected from the listed items (A or B) or any combination of two or more of the listed items (A and B), unless otherwise indicated herein or clearly contradicted by context. The terms "comprising," "having," "including," and "containing" are to be construed as open-ended terms (i.e., meaning "including, but not limited to,") unless otherwise noted. Recitation of ranges of values herein are merely intended to serve as a shorthand method of referring individually to each separate value falling within the range, unless otherwise indicated herein, and each separate value is incorporated into the specification as if it were individually recited herein. All methods described herein can be performed in any suitable order unless otherwise indicated herein or otherwise clearly contradicted by context. The use of any and all examples, or exemplary language (e.g., "such as") provided herein, is intended merely to better illuminate the invention and does not pose a limitation on the scope of the invention unless otherwise claimed. No language in the specification should be construed as indicating any non-claimed element as essential to the practice of the invention.
- Preferred embodiments of this invention are described herein, including the best mode known to the inventors for carrying out the invention. Variations of those preferred embodiments may become apparent to those of ordinary skill in the art upon reading the foregoing description. The inventors expect skilled artisans to employ such variations as appropriate, and the inventors intend for the invention to be practiced otherwise than as specifically described herein. Accordingly, this invention includes all modifications and equivalents of the subject matter recited in the claims appended hereto as permitted by applicable law. Moreover, any combination of the above-described elements in all possible variations thereof is encompassed by the invention unless otherwise indicated herein or otherwise clearly contradicted by context.
- Further embodiments of the invention are disclosed herein:
- 1. A method of selecting a therapy for a cancer patient, the method comprising:
- detecting a mutation in one or more genes in a cancer cell from the patient which is not present in a noncancerous cell,
- wherein the mutation decreases one or both of expression and activity of polypeptide(s) encoded by the one or more genes; and
- wherein the one or more genes is selected from the group consisting of PTCD2, TWF1, DEFB134, BBS1, SOX10, APLNR, CD58, COL17A1, CRKL, hsa-mir-101-2, hsa-mir-548s, MAD2L1, MLANA, PSMB5, RNPS1, RPL10A, RPL23, SRP54, TAF3, TAP1, TAP2, TAPBP, TBXAS1, GMIP, OTOA, LAIR1, CLEC1, GPSM3, TRAF1, JAK2, TAPBPL, ICAM1, LILRA1, LILRA3, STAT1, and HLA-F;
- selecting the patient for a therapy which is not a T cell therapy when the mutation in one or more genes is present in the cancer cell; and
- selecting the patient for a T cell therapy when the mutation in one or more genes is not present in the cancer cell.
- 2. The method of selecting a therapy for a cancer patient according to
item 1, further comprising:- a therapy which is not a T cell therapy for use in the treatment of cancer in the patient when the mutation in the one or more genes is present in the cancer cell; and
- a T cell therapy for use in the treatment of cancer in the patient when the mutation in the one or more genes is not present in the cancer cell.
- 3. The method according to
item - 4. The method according to
item - 5. The method according to any one of items 1-4, wherein the mutation is a missense, nonsense, insertion, deletion, duplication, frameshift, or repeat expansion mutation.
- 6. A method of selecting a therapy for a cancer patient, the method comprising:
- detecting a mutation in one or more polypeptides in a cancer cell from the patient which is not present in a noncancerous cell,
- wherein the mutation decreases activity of the polypeptide; and
- wherein the one or more polypeptides is encoded by a gene selected from the group consisting of PTCD2, TWF1, DEFB134, BBS1, SOX10, APLNR, CD58, COL17A1, CRKL, hsa-mir-101-2, hsa-mir-548s, MAD2L1, MLANA, PSMB5, RNPS1, RPL10A, RPL23, SRP54, TAF3, TAP1, TAP2, TAPBP, TBXAS1, GMIP, OTOA, LAIR1, CLEC1, GPSM3, TRAF1, JAK2, TAPBPL, ICAM1, LILRA1, LILRA3, STAT1, and HLA-F;
- selecting the patient for a therapy which is not a T cell therapy when the mutation is present in the cancer cell; and
- selecting the patient for a T cell therapy when the mutation is not present in the cancer cell.
- 7. The method of selecting a therapy for a cancer patient according to
item 6, further comprising:- a therapy which is not a T cell therapy for use in the treatment of cancer in the patient when the mutation in the one or more polypeptides is present in the cancer cell; and
- a T cell therapy for use in the treatment of cancer in the patient when the mutation in the one or more polypeptides is not present in the cancer cell.
- 8. The method according to any one of items 1-7, wherein the mutation confers resistance to T cell-mediated cytolysis to the cancer cell.
- 9. A method of selecting a therapy for a cancer patient, the method comprising:
- measuring a level of one or both of (i) mRNA and (ii) polypeptide expressed from one or more genes in a cancer cell from the patient, wherein the one or more genes is selected from the group consisting of PTCD2, TWF1, DEFB134, BBS1, SOX10, APLNR, CD58, COL17A1, CRKL, hsa-mir-101-2, hsa-mir-548s, MAD2L1, MLANA, PSMB5, RNPS1, RPL10A, RPL23, SRP54, TAF3, TAP1, TAP2, TAPBP, TBXAS1, GMIP, OTOA, LAIR1, CLEC1, GPSM3, TRAF1, JAK2, TAPBPL, ICAM1, LILRA1, LILRA3, STAT1, and HLA-F;
- measuring the level of one or both of (i) mRNA and (ii) polypeptide expressed from the same one or more genes in a noncancerous cell;
- comparing the level of one or both of (i) mRNA and (ii) polypeptide measured in the cancer cell with the level of one or both of (i) mRNA and (ii) polypeptide, respectively, measured in the noncancerous cell;
- selecting the patient for a therapy which is not a T cell therapy when the level of one or both of (i) mRNA and (ii) polypeptide measured in the cancer cell is decreased as compared to the level of one or both of (i) mRNA and (ii) polypeptide, respectively, measured in the noncancerous cell; and
- selecting the patient for a T cell therapy when the level of one or both of (i) mRNA and (ii) polypeptide measured in the cancer cell is not decreased as compared to the level of one or both of (i) mRNA and (ii) polypeptide, respectively, measured in the noncancerous cell.
- 10. The method of selecting a therapy for a cancer patient according to
item 9, further comprising:- a therapy which is not a T cell therapy for use in the treatment of cancer in the patient when the level of one or both of (i) mRNA and (ii) polypeptide measured in the cancer cell is decreased as compared to the level of one or both of (i) mRNA and (ii) polypeptide, respectively, measured in the noncancerous cell; and
- a T cell therapy for use in the treatment of cancer in the patient when the level of one or both of (i) mRNA and (ii) polypeptide measured in the cancer cell is not decreased as compared to the level of one or both of (i) mRNA and (ii) polypeptide, respectively, measured in the noncancerous cell.
- 11. The method according to
item - 12. The method according to any one of items 1-11, wherein the therapy which is not a T cell therapy is surgical resection, chemotherapy, radiotherapy, NK cell therapy, B cell therapy, gene therapy, anti-cancer vaccine therapy, targeted drug inhibitor therapy, or any combination thereof.
- 13. The method according to any one of items 1-11, wherein the T cell therapy comprises one or more T cells or one or more cells which have been modified to express a T cell receptor.
- 14. A method of screening for one or more genes, the mutation of which confers resistance to T cell-mediated cytolytic activity, the method comprising:
- introducing a nucleic acid encoding a Cas endonuclease and a nucleic acid encoding a single guide RNA (sgRNA) molecule into a target cell, wherein the sgRNA hybridizes to a test gene in the target cell,
- forming a complex between the sgRNA and Cas endonuclease so that the Cas endonuclease introduces a double strand break in the test gene;
- deleting all or a portion of the test gene to decrease expression of the test gene;
- co-culturing the target cell having decreased expression of the test gene with an effector cell;
- co-culturing a negative control cell with the effector cell, wherein the negative control cell is identical to the target cell except that it does not comprise the nucleic acid encoding a Cas endonuclease and the nucleic acid encoding a single guide RNA (sgRNA) molecule and does not have decreased expression of the test gene;
- measuring a level of lysis of the target cell by the effector cell;
- measuring a level of lysis of the negative control cell by the effector cell; and
- comparing the level of lysis of the target cell to the level of lysis of the negative control cell;
- wherein a decrease in the level of lysis of the target cell as compared to the level of lysis of the negative control cell indicates that mutation of the test gene confers resistance to T cell-mediated cytolytic activity to the target cell; and
- wherein a lack of a decrease in the level of lysis of the target cell as compared to the level of lysis of the negative control cell indicates that mutation of the test gene does not confer resistance to T cell-mediated cytolytic activity to the target cell.
- 15. The method of
item 14, wherein the target cell is a cancer cell. - 16. The method of
item

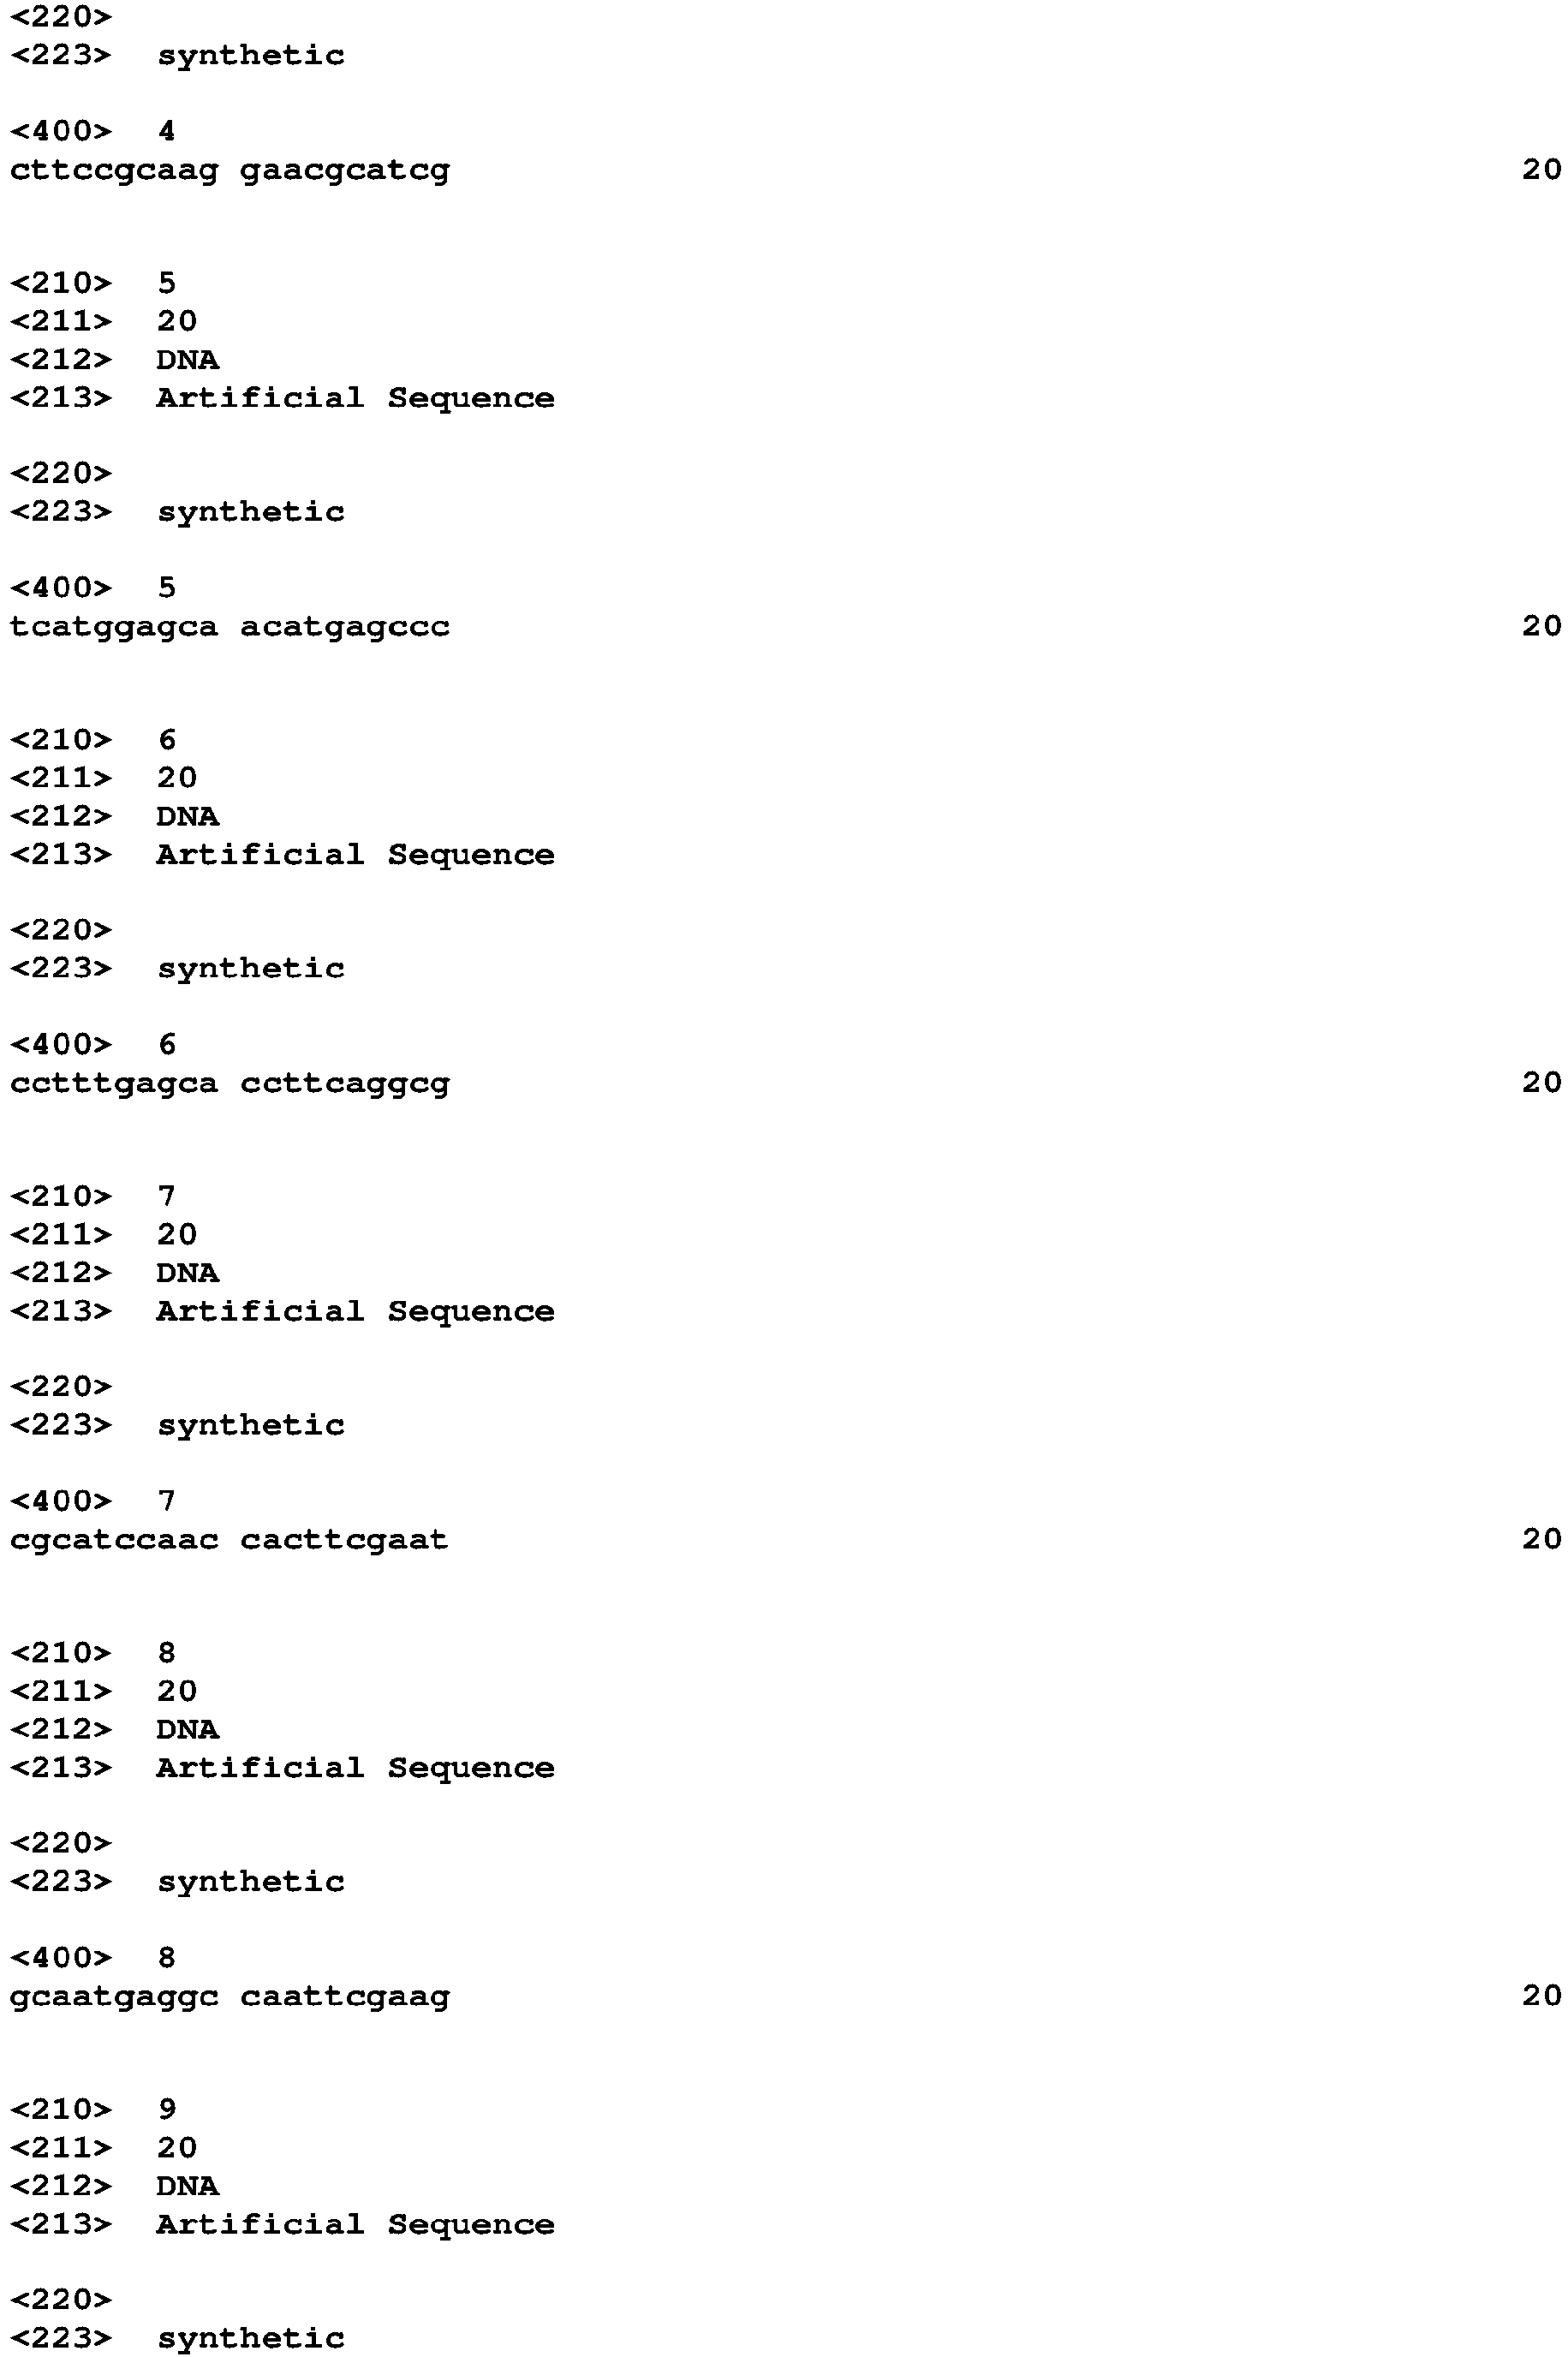
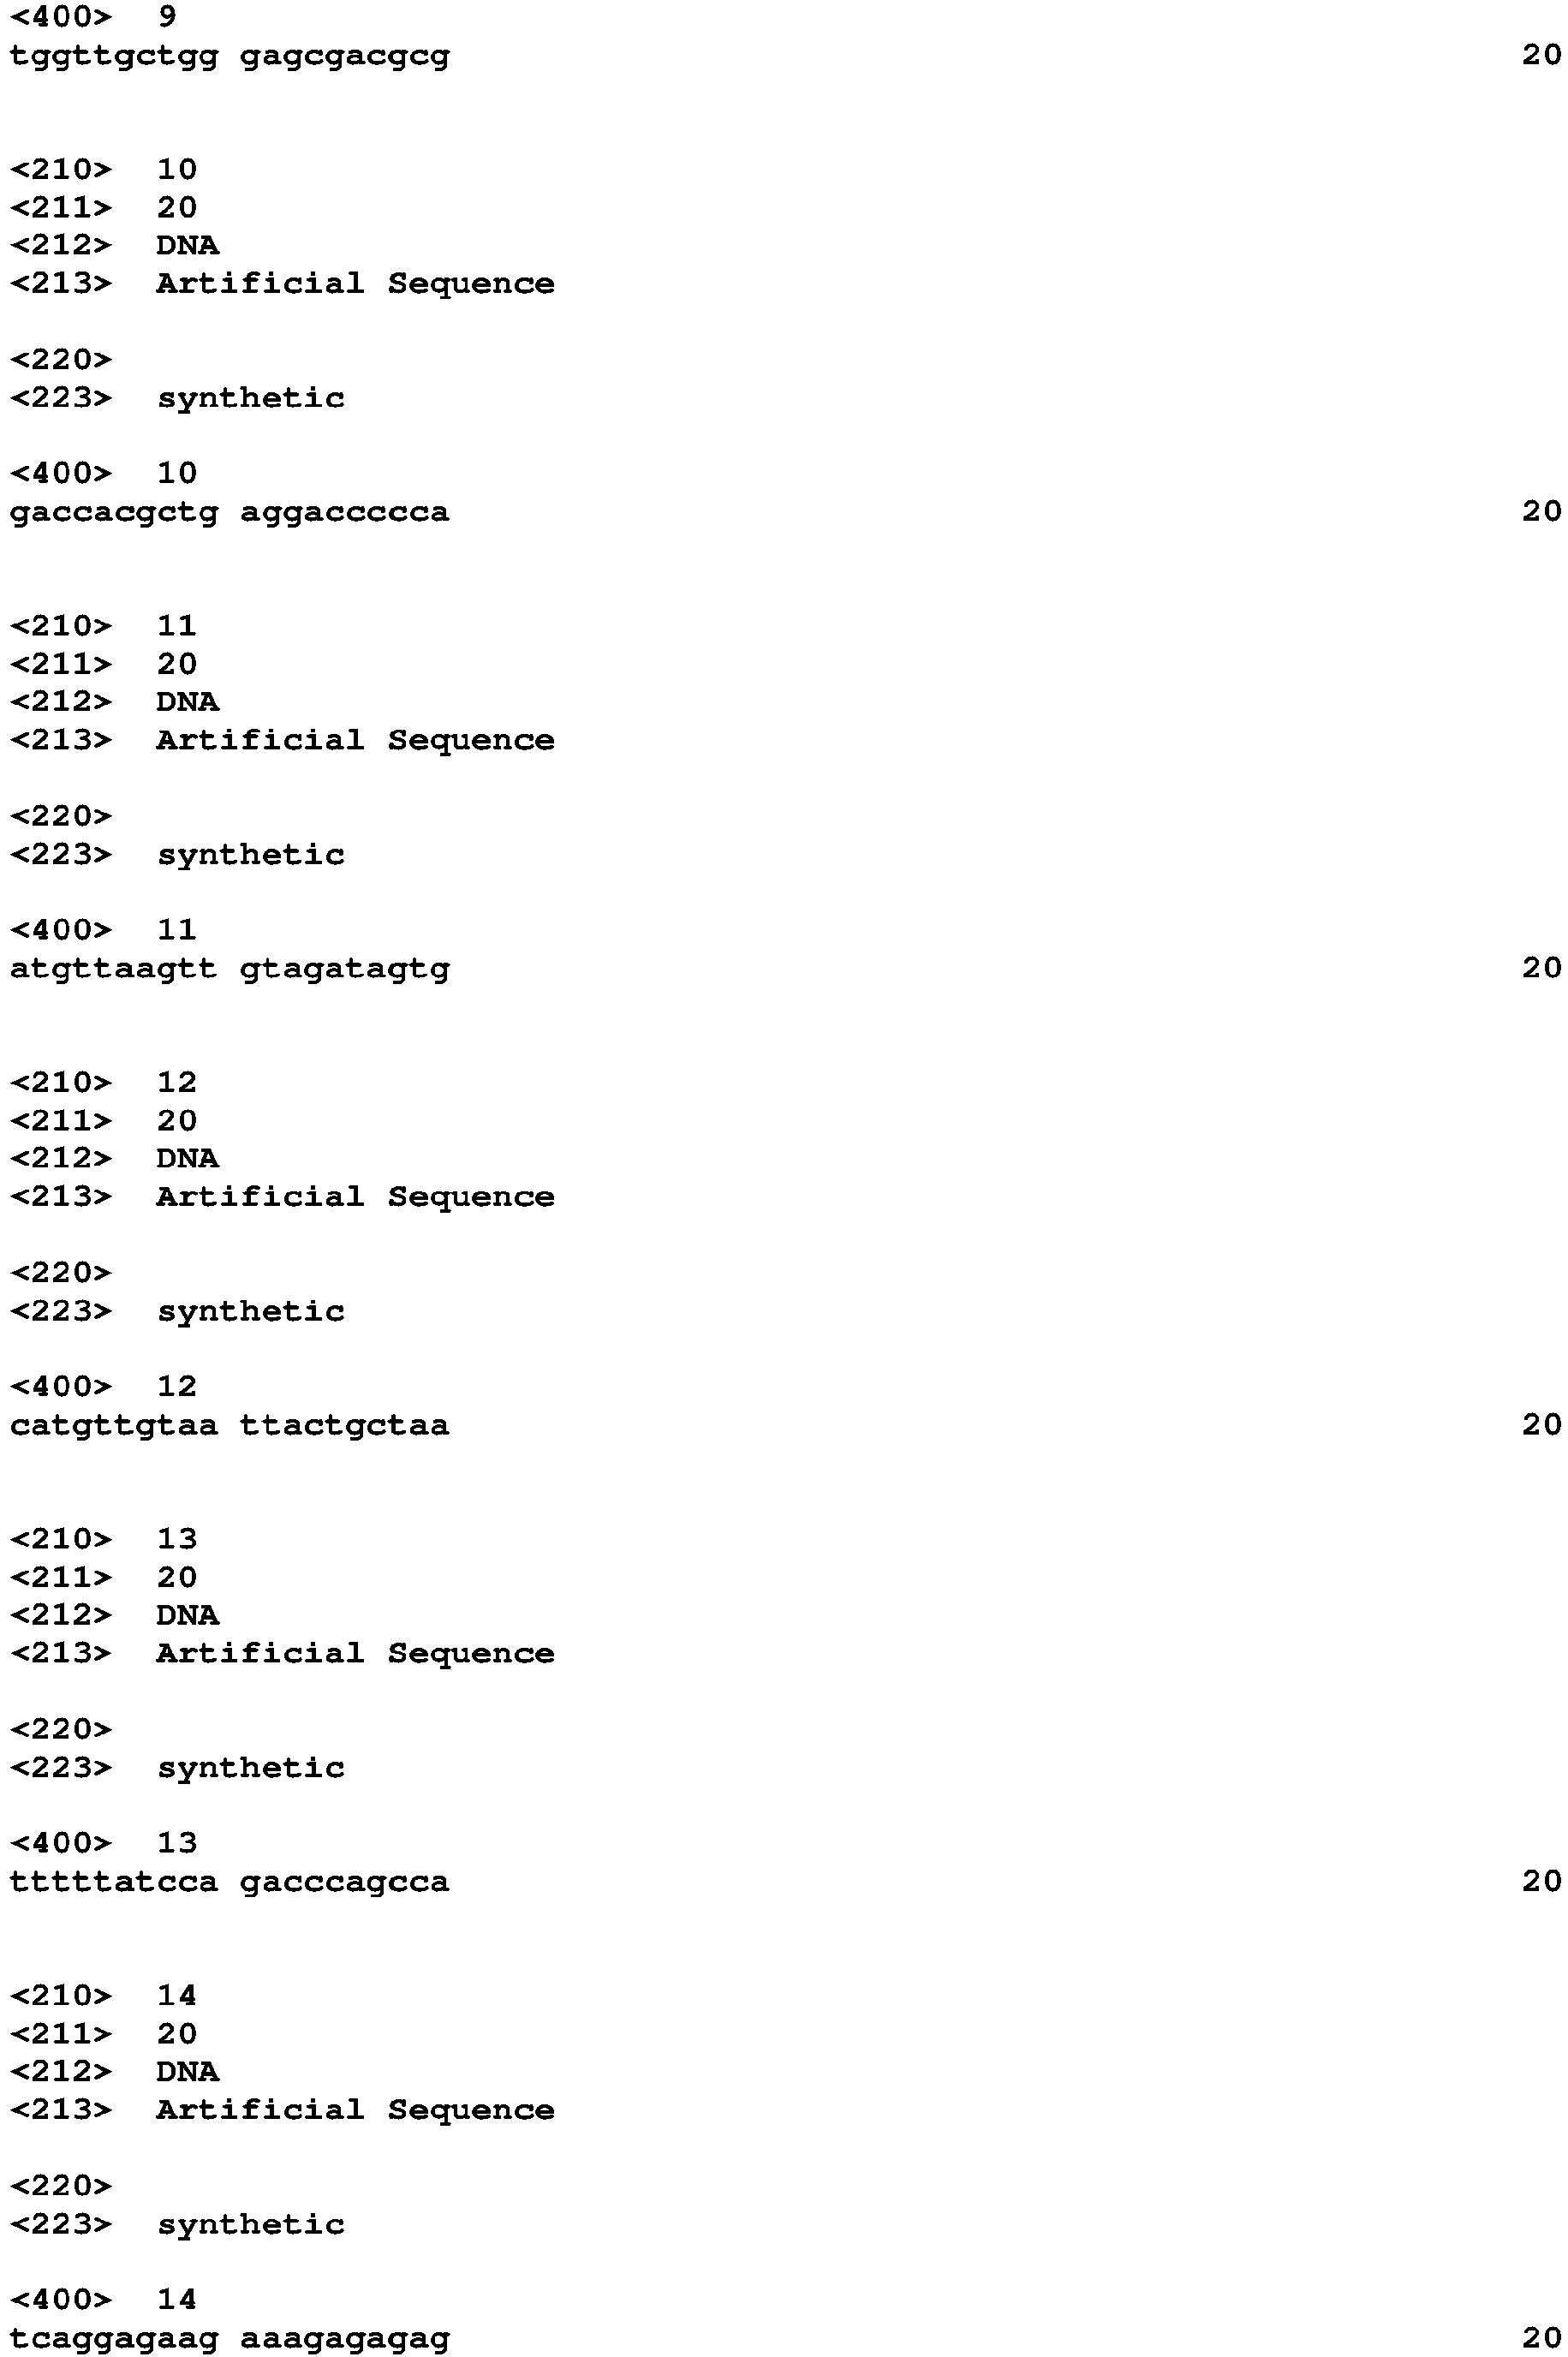


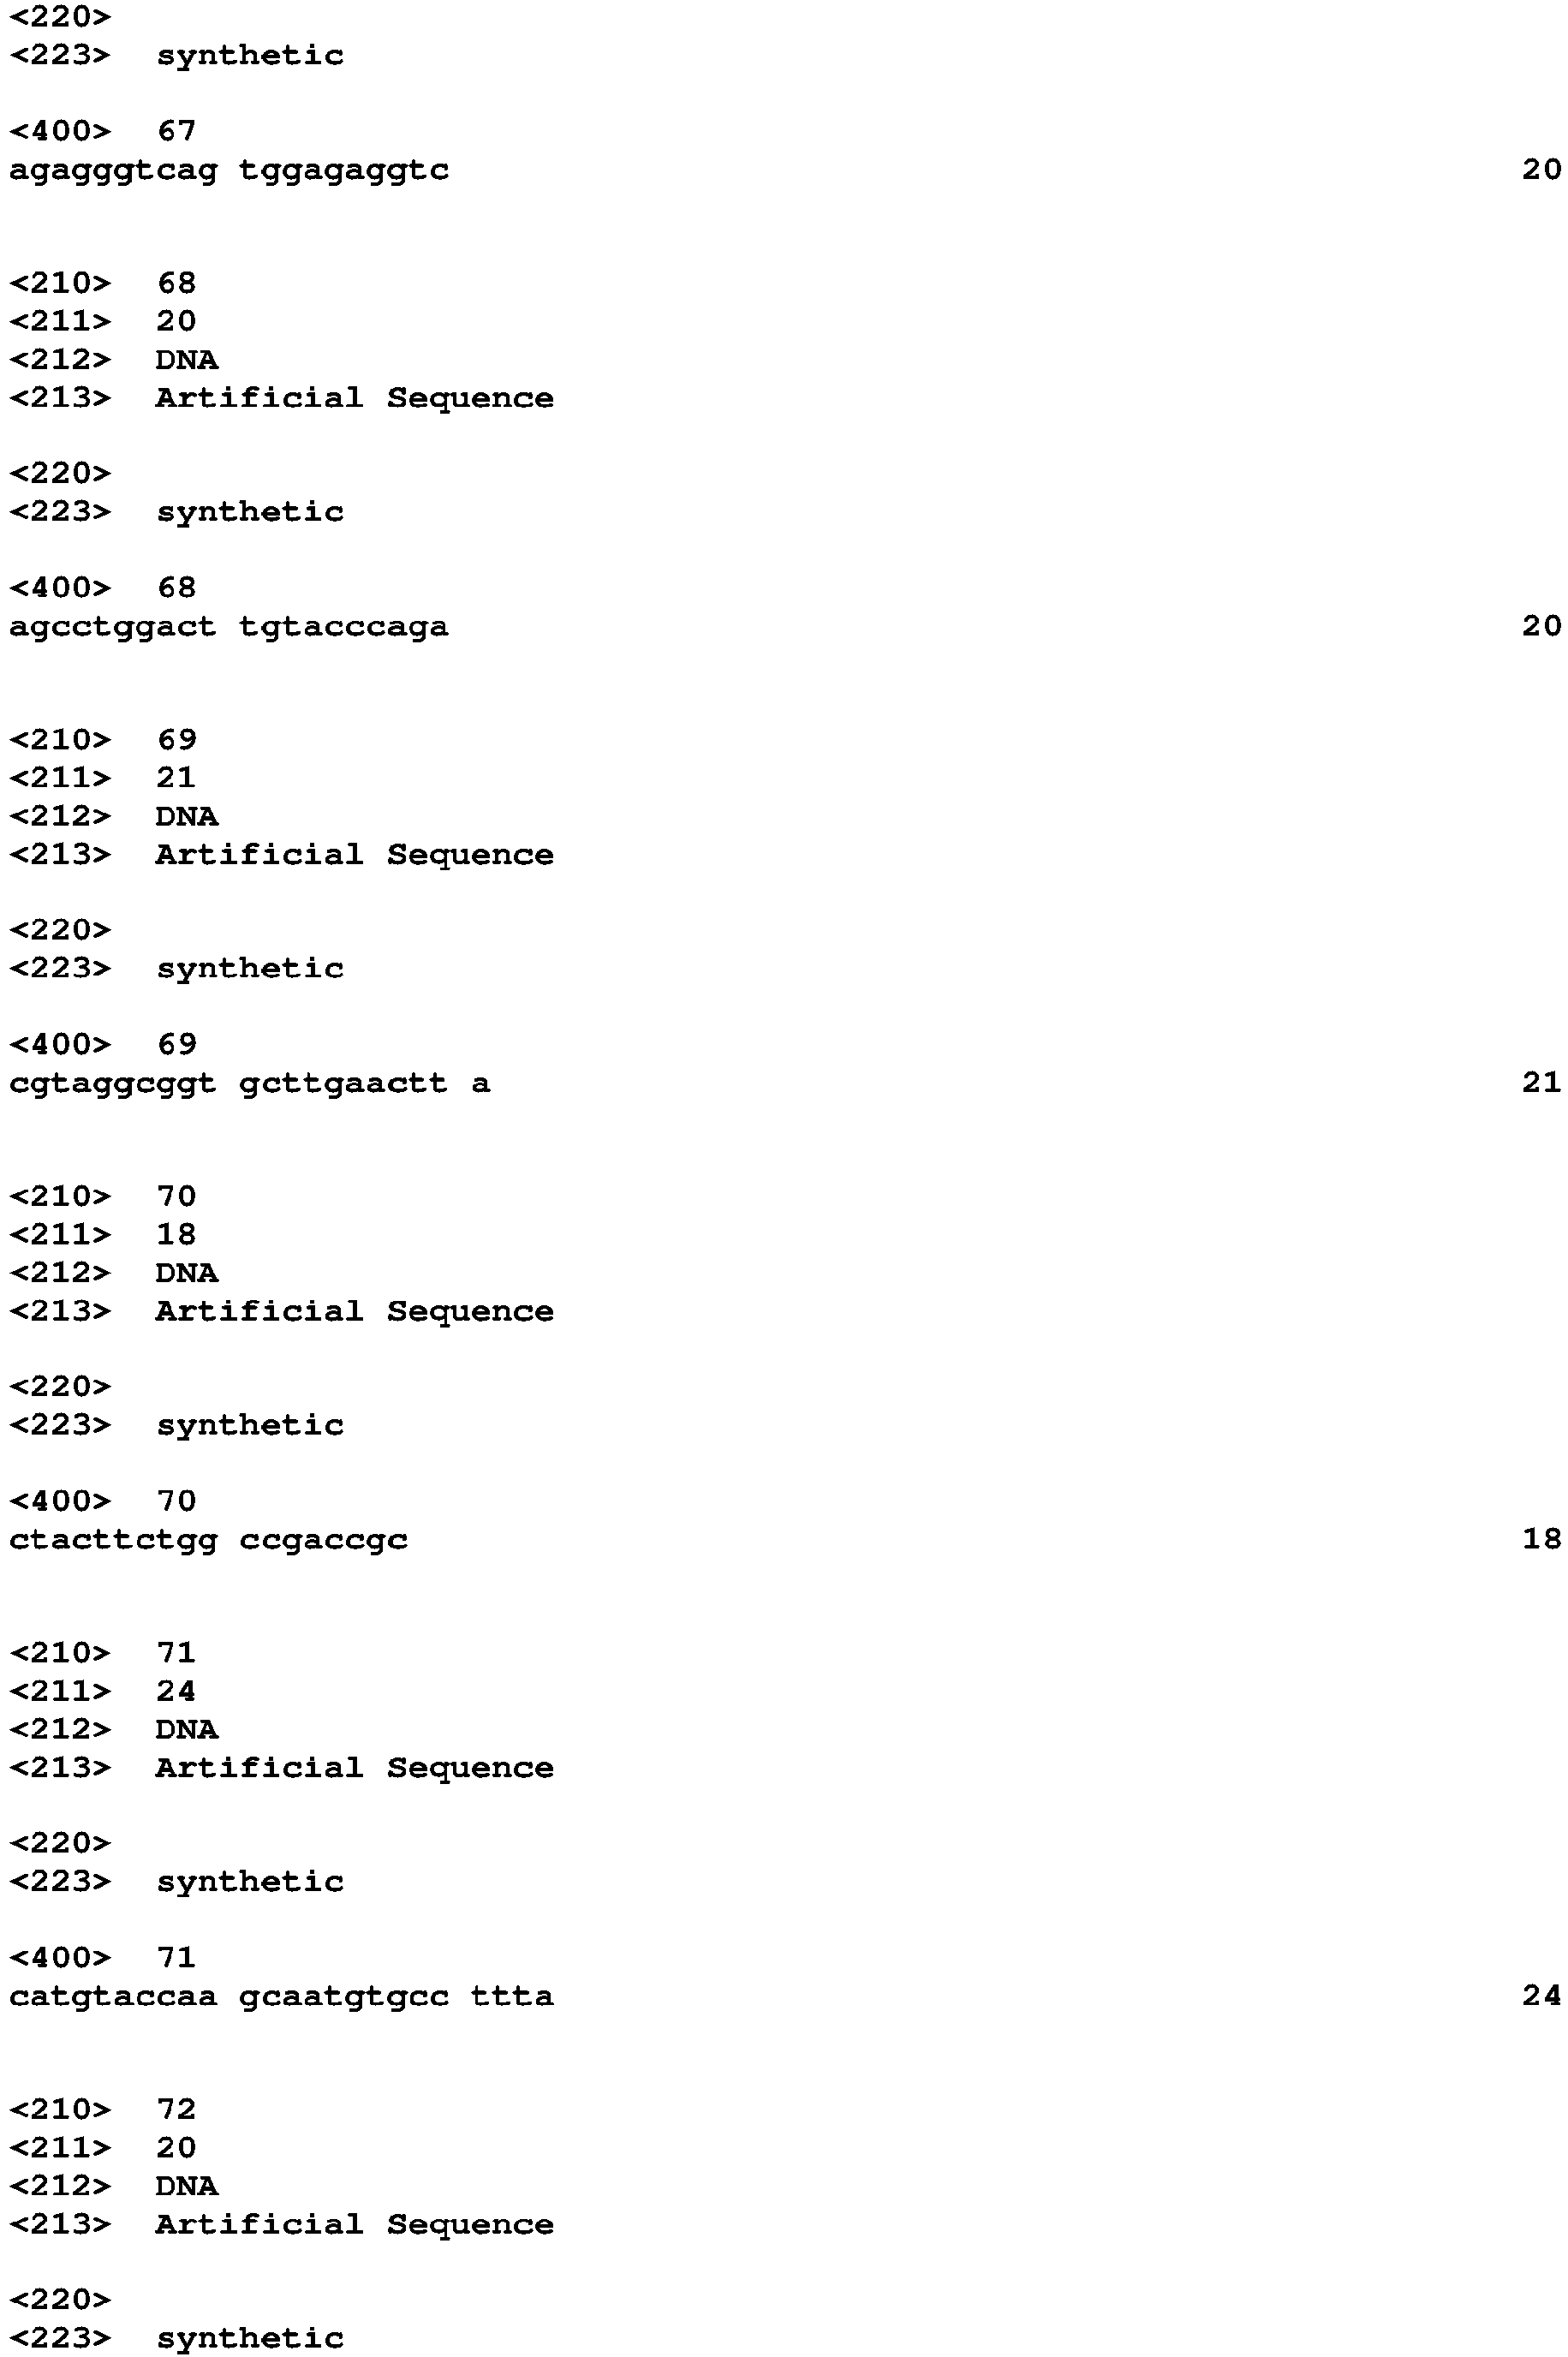


Claims (11)
- A method of selecting a T cell based immunotherapy for a cancer patient, the method comprising:detecting a loss-of-function mutation in one or more genes in a cancer cell from the patient which is not present in a noncancerous cell,wherein the mutation renders the cancer cell resistant to T cell mediated cytolysis; andwherein the one or more genes is selected from the group consisting of PTCD2, TWF1, DEFB134, BBS1, SOX10, CD58, COL17A1, CRKL, hsa-mir-101-2, hsa-mir-548s, MAD2L1, MLANA, PSMB5, RNPS1, RPL10A, RPL23, SRP54, TAF3, TAP1, TAP2, TAPBP, TBXAS1, GMIP, OTOA, LAIR1, CLEC1, GPSM3, TRAF1, JAK2, TAPBPL, ICAM1, LILRA1, LILRA3, STAT1, and HLA-F;selecting the patient for a therapy which is not a T cell based immunotherapy when the mutation in one or more genes is present in the cancer cell; andselecting the patient for a T cell based immunotherapy when the mutation in one or more genes is not present in the cancer cell.
- The method of selecting a T cell based immunotherapy for a cancer patient according to claim 1, further comprising:a therapy which is not a T cell therapy for use in the treatment of cancer in the patient when the mutation in the one or more genes is present in the cancer cell; anda T cell therapy for use in the treatment of cancer in the patient when the mutation in the one or more genes is not present in the cancer cell.
- The method according to claim 1 or 2, wherein detecting the mutation in one or more genes in a cancer cell from the patient comprises sequencing RNA of the one or more genes from the cancer cell.
- The method according to claim 1 or 2, wherein detecting the mutation in one or more genes in a cancer cell from the patient comprises sequencing DNA of the one or more genes from the cancer cell.
- The method according to any one of claims 1-4, wherein the mutation is a missense, nonsense, insertion, deletion, duplication, frameshift, or repeat expansion mutation.
- The method according to any one of claims 1-5, wherein the mutation confers resistance to T cell-mediated cytolysis to the cancer cell.
- A method of selecting a T cell based immunotherapy for a cancer patient, the method comprising:measuring a level of one or both of (i) mRNA and (ii) polypeptide expressed from one or more genes in a cancer cell from the patient, wherein the one or more genes is selected from the group consisting of PTCD2, TWF1, DEFB134, BBS1, SOX10, CD58, COL17A1, CRKL, hsa-mir-101-2, hsa-mir-548s, MAD2L1, MLANA, PSMB5, RNPS1, RPL10A, RPL23, SRP54, TAF3, TAP1, TAP2, TAPBP, TBXAS1, GMIP, OTOA, LAIR1, CLEC1, GPSM3, TRAF1, JAK2, TAPBPL, ICAM1, LILRA1, LILRA3, STAT1, and HLA-F;measuring the level of one or both of (i) mRNA and (ii) polypeptide expressed from the same one or more genes in a noncancerous cell;comparing the level of one or both of (i) mRNA and (ii) polypeptide measured in the cancer cell with the level of one or both of (i) mRNA and (ii) polypeptide, respectively, measured in the noncancerous cell;selecting the patient for a therapy which is not a T cell based immunotherapy when the level of one or both of (i) mRNA and (ii) polypeptide measured in the cancer cell is decreased as compared to the level of one or both of (i) mRNA and (ii) polypeptide, respectively, measured in the noncancerous cell; andselecting the patient for a T cell based immunotherapy when the level of one or both of (i) mRNA and (ii) polypeptide measured in the cancer cell is not decreased as compared to the level of one or both of (i) mRNA and (ii) polypeptide, respectively, measured in the noncancerous cell.
- The method of selecting a T cell based immunotherapy for a cancer patient according to claim 7, further comprising:a therapy which is not a T cell based immunotherapy for use in the treatment of cancer in the patient when the level of one or both of (i) mRNA and (ii) polypeptide measured in the cancer cell is decreased as compared to the level of one or both of (i) mRNA and (ii) polypeptide, respectively, measured in the noncancerous cell; anda T cell based immunotherapy for use in the treatment of cancer in the patient when the level of one or both of (i) mRNA and (ii) polypeptide measured in the cancer cell is not decreased as compared to the level of one or both of (i) mRNA and (ii) polypeptide, respectively, measured in the noncancerous cell.
- The method according to claim 7 or 8, wherein the decrease in the level of one or both of (i) mRNA and (ii) polypeptide confers resistance to T cell-mediated cytolysis to the cancer cell.
- The method according to any one of claims 1-9, wherein the therapy which is not a T cell based immunotherapy is surgical resection, chemotherapy, radiotherapy, NK cell therapy, B cell therapy, gene therapy, anti-cancer vaccine therapy, targeted drug inhibitor therapy, or any combination thereof.
- The method according to any one of claims 1-9, wherein the T cell based immunotherapy comprises one or more T cells or one or more cells which have been modified to express a T cell receptor.
Applications Claiming Priority (3)
| Application Number | Priority Date | Filing Date | Title |
|---|---|---|---|
| US201662418461P | 2016-11-07 | 2016-11-07 | |
| PCT/US2017/060304 WO2018085802A1 (en) | 2016-11-07 | 2017-11-07 | Methods for selecting therapy for a cancer patient |
| EP17805342.7A EP3535423B1 (en) | 2016-11-07 | 2017-11-07 | Methods for selecting therapy for a cancer patient |
Related Parent Applications (1)
| Application Number | Title | Priority Date | Filing Date |
|---|---|---|---|
| EP17805342.7A Division EP3535423B1 (en) | 2016-11-07 | 2017-11-07 | Methods for selecting therapy for a cancer patient |
Publications (1)
| Publication Number | Publication Date |
|---|---|
| EP4001437A1 true EP4001437A1 (en) | 2022-05-25 |
Family
ID=60484474
Family Applications (2)
| Application Number | Title | Priority Date | Filing Date |
|---|---|---|---|
| EP21217161.5A Withdrawn EP4001437A1 (en) | 2016-11-07 | 2017-11-07 | Methods for selecting therapy for a cancer patient |
| EP17805342.7A Active EP3535423B1 (en) | 2016-11-07 | 2017-11-07 | Methods for selecting therapy for a cancer patient |
Family Applications After (1)
| Application Number | Title | Priority Date | Filing Date |
|---|---|---|---|
| EP17805342.7A Active EP3535423B1 (en) | 2016-11-07 | 2017-11-07 | Methods for selecting therapy for a cancer patient |
Country Status (3)
| Country | Link |
|---|---|
| US (1) | US11312998B2 (en) |
| EP (2) | EP4001437A1 (en) |
| WO (1) | WO2018085802A1 (en) |
Families Citing this family (9)
| Publication number | Priority date | Publication date | Assignee | Title |
|---|---|---|---|---|
| US11312998B2 (en) | 2016-11-07 | 2022-04-26 | The United States Of America, As Represented By The Secretary, Department Of Health And Human Services | Methods for selecting therapy for a cancer patient |
| CN109406467B (en) * | 2018-10-16 | 2021-01-29 | 商丘师范学院 | Split aptamer sensor for ATP detection and its application |
| CN109797217A (en) * | 2019-03-27 | 2019-05-24 | 河北医科大学第二医院 | Parkinson's biomarker and its application in preparation testing product |
| CN110331164B (en) * | 2019-08-05 | 2021-04-06 | 北京大学人民医院(北京大学第二临床医学院) | Targeting vector for mouse with LILRA3 gene knock-in and construction method of mouse with LILRA3 gene knock-in |
| IL295421A (en) * | 2020-02-14 | 2022-10-01 | Univ Leland Stanford Junior | Chimeric antigen receptors with cd2 activation |
| CN117120062A (en) * | 2021-02-24 | 2023-11-24 | 宾夕法尼亚大学董事会 | In vivo CRISPR screening system for discovery of therapeutic targets in CD8 T cells |
| CN114480623A (en) * | 2022-02-10 | 2022-05-13 | 江苏博嘉生物医学科技有限公司 | Kit for detecting stroke-related TBXAS1 gene based on CRISPR (clustered regularly interspaced short palindromic repeats) |
| WO2024023804A2 (en) * | 2022-07-29 | 2024-02-01 | Crispr Therapeutics Ag | Genetically engineered immune cells having disrupted transporter associated with antigen processing binding protein (tapbp) gene |
| GB202314087D0 (en) | 2023-09-14 | 2023-11-01 | Macomics Ltd | Biomarker for cancer |
Citations (2)
| Publication number | Priority date | Publication date | Assignee | Title |
|---|---|---|---|---|
| WO2014168874A2 (en) * | 2013-04-07 | 2014-10-16 | The Broad Institute, Inc. | Compositions and methods for personalized neoplasia vaccines |
| WO2016100975A1 (en) * | 2014-12-19 | 2016-06-23 | Massachsetts Institute Ot Technology | Molecular biomarkers for cancer immunotherapy |
Family Cites Families (3)
| Publication number | Priority date | Publication date | Assignee | Title |
|---|---|---|---|---|
| KR20110052627A (en) * | 2008-07-16 | 2011-05-18 | 다나-파버 캔서 인스티튜트 인크. | Signature and PC Determinants Related to Prostate Cancer and Methods of Use thereof |
| AU2015216875B2 (en) * | 2014-02-14 | 2021-02-25 | Cellectis | Cells for immunotherapy engineered for targeting antigen present both on immune cells and pathological cells |
| US11312998B2 (en) | 2016-11-07 | 2022-04-26 | The United States Of America, As Represented By The Secretary, Department Of Health And Human Services | Methods for selecting therapy for a cancer patient |
-
2017
- 2017-11-07 US US16/347,778 patent/US11312998B2/en active Active
- 2017-11-07 EP EP21217161.5A patent/EP4001437A1/en not_active Withdrawn
- 2017-11-07 WO PCT/US2017/060304 patent/WO2018085802A1/en not_active Ceased
- 2017-11-07 EP EP17805342.7A patent/EP3535423B1/en active Active
Patent Citations (2)
| Publication number | Priority date | Publication date | Assignee | Title |
|---|---|---|---|---|
| WO2014168874A2 (en) * | 2013-04-07 | 2014-10-16 | The Broad Institute, Inc. | Compositions and methods for personalized neoplasia vaccines |
| WO2016100975A1 (en) * | 2014-12-19 | 2016-06-23 | Massachsetts Institute Ot Technology | Molecular biomarkers for cancer immunotherapy |
Non-Patent Citations (23)
| Title |
|---|
| BOLGER ET AL., BIOINFORMATICS, 2014 |
| CERAMI ET AL., CANCER DISCOVERY,, vol. 2, 2012, pages 401 - 404 |
| CHENG ET AL., CELL RES., vol. 23, 2013, pages 1163 - 71 |
| EGEN ET AL., NAT. IMMUNOL., vol. 3, 2002, pages 611 - 618 |
| GAO ET AL., SCIENCE SIGNALING, vol. 6, 2013 |
| HART ET AL., CELL, vol. 163, pages 1515 - 26 |
| JESSE M. ZARETSKY ET AL: "Mutations Associated with Acquired Resistance to PD-1 Blockade in Melanoma", NEW ENGLAND JOURNAL OF MEDICINE, THE - NEJM -, vol. 375, no. 9, 1 September 2016 (2016-09-01), US, pages 819 - 829, XP055443416, ISSN: 0028-4793, DOI: 10.1056/NEJMoa1604958 * |
| JOHNSON ET AL., J. IMMUNOL., vol. 177, 2006, pages 6548 - 6559 |
| KVISTBORG ET AL., SCIENCE TRANSL. MED.,, vol. 6 |
| LANGMEAD ET AL., GENOME BIOL., vol. 10, 2009, pages 1 - 10 |
| LANGMEAD ET AL., NAT. METH., vol. 9, 2012, pages 357 - 59 |
| MARTIN, EMBNET J., vol. 17, 2011 |
| MICHAEL S. ROONEY ET AL: "Molecular and Genetic Properties of Tumors Associated with Local Immune Cytolytic Activity", CELL, vol. 160, no. 1-2, 1 January 2015 (2015-01-01), pages 48 - 61, XP055170803, ISSN: 0092-8674, DOI: 10.1016/j.cell.2014.12.033 * |
| N. MCGRANAHAN ET AL: "Clonal neoantigens elicit T cell immunoreactivity and sensitivity to immune checkpoint blockade", SCIENCE, vol. 351, no. 6280, 25 March 2016 (2016-03-25), pages 1463 - 1469, XP055283414, ISSN: 0036-8075, DOI: 10.1126/science.aaf1490 * |
| NEEFJES ET AL., NAT. REV., IMUNOL., vol. 11, 2011, pages 823 - 36 |
| ROBBINS ET AL., J. IMMUNO., vol. 180, 2008, pages 6116 - 131 |
| ROBBINS ET AL., J. IMMUNOL., vol. 180, 2008, pages 6116 - 6131 |
| ROONEY ET AL., CELL, vol. 160, 2015, pages 1246 - 1260 |
| S. D. BROWN ET AL: "Neo-antigens predicted by tumor genome meta-analysis correlate with increased patient survival", GENOME RESEARCH, vol. 24, no. 5, 29 April 2014 (2014-04-29), US, pages 743 - 750, XP055262143, ISSN: 1088-9051, DOI: 10.1101/gr.165985.113 * |
| T. WANG ET AL: "Genetic Screens in Human Cells Using the CRISPR-Cas9 System", SCIENCE, vol. 343, no. 6166, 12 December 2013 (2013-12-12), pages 80 - 84, XP055115509, ISSN: 0036-8075, DOI: 10.1126/science.1246981 * |
| VAN ALLEN ET AL., SCIENCE, vol. 350, 2015, pages 207 - 211 |
| WAN ET AL., BIOINFORMATICS, vol. 32, 2016, pages 952 - 54 |
| YANG YANJIE ET AL: "Apelin/APJ system and cancer", CLINICA CHIMICA ACTA, ELSEVIER BV, AMSTERDAM, NL, vol. 457, 13 April 2016 (2016-04-13), pages 112 - 116, XP029539696, ISSN: 0009-8981, DOI: 10.1016/J.CCA.2016.04.001 * |
Also Published As
| Publication number | Publication date |
|---|---|
| US11312998B2 (en) | 2022-04-26 |
| EP3535423A1 (en) | 2019-09-11 |
| WO2018085802A1 (en) | 2018-05-11 |
| US20190316206A1 (en) | 2019-10-17 |
| EP3535423B1 (en) | 2022-01-05 |
Similar Documents
| Publication | Publication Date | Title |
|---|---|---|
| EP3535423B1 (en) | Methods for selecting therapy for a cancer patient | |
| Mowat et al. | Anti-tumor immunity in mismatch repair-deficient colorectal cancers requires type I IFN–driven CCL5 and CXCL10 | |
| JP7219254B2 (en) | Methods and compositions for reducing immunosuppression by tumor cells | |
| US12049643B2 (en) | Methods and compositions for modulating cytotoxic lymphocyte activity | |
| US20230108584A1 (en) | Methods for activation and expansion of tumor infiltrating lymphocytes | |
| US20230258635A1 (en) | T cell phenotypes associated with response to adoptive cell therapy | |
| US20210040558A1 (en) | Method to isolate tcr genes | |
| US20230138309A1 (en) | Methods of isolating t-cells and t-cell receptors from tumor by single-cell analysis for immunotherapy | |
| WO2022256620A1 (en) | Novel targets for enhancing anti-tumor immunity | |
| US20210015866A1 (en) | Tissue resident memory cell profiles, and uses thereof | |
| WO2024073775A2 (en) | Compositions and methods for enhancing adoptive t cell therapeutics | |
| US20220033464A1 (en) | Methods and compositons for modulations of immune response | |
| Perales-Linares et al. | Parkin deficiency suppresses antigen presentation to promote tumor immune evasion and immunotherapy resistance | |
| US20240307444A1 (en) | Methods and compositions for improved immunotherapies | |
| US20220105135A1 (en) | Methods and compositions for the modulation of opioid signaling in the tumor microenvironment | |
| Zhang et al. | Chimeric MHC class I–and II–restricted non-self epitopes broaden antitumor T cell reactions | |
| Patel | A genome-scale crispr screen to identify essential genes for the effector function of cytotoxic T lymphocytes | |
| Bag et al. | The immunomodulatory properties of the HDAC6 inhibitor ACY241 supports robust anti-tumor response in NSCLC when coupled with the chemotherapy drug Oxaliplatin | |
| Gandolfi | Landscape of molecular events regulating multiple myeloma cell responses to natural killer cells | |
| Ma et al. | In vivo CRISPR screens identify CBX4 as an epigenetic regulator for cancer immunotherapy | |
| Park | Discovery of Novel Cancer Immunotherapy Targets with Next Generation Genome Engineering Methods | |
| Dinter et al. | PD-1 blockade during T cell priming enhances long-term protection against metastatic tumors by epigenetically tuning T cell exhaustion | |
| Beavis et al. | Overexpression of FOXO1 enhances CAR T cell polyfunctionality, metabolic fitness and efficacy against solid tumors | |
| Zhu et al. | Mi-2β-targeted inhibition induces immunotherapy response in melanoma | |
| WO2024156006A2 (en) | Targeting mhc-i antigen presentation modulators for immunotherapy for cancer and autoimmune disorders |
Legal Events
| Date | Code | Title | Description |
|---|---|---|---|
| PUAI | Public reference made under article 153(3) epc to a published international application that has entered the european phase |
Free format text: ORIGINAL CODE: 0009012 |
|
| STAA | Information on the status of an ep patent application or granted ep patent |
Free format text: STATUS: THE APPLICATION HAS BEEN PUBLISHED |
|
| AC | Divisional application: reference to earlier application |
Ref document number: 3535423 Country of ref document: EP Kind code of ref document: P |
|
| AK | Designated contracting states |
Kind code of ref document: A1 Designated state(s): AL AT BE BG CH CY CZ DE DK EE ES FI FR GB GR HR HU IE IS IT LI LT LU LV MC MK MT NL NO PL PT RO RS SE SI SK SM TR |
|
| STAA | Information on the status of an ep patent application or granted ep patent |
Free format text: STATUS: THE APPLICATION IS DEEMED TO BE WITHDRAWN |
|
| 18D | Application deemed to be withdrawn |
Effective date: 20221126 |