EP3996008A1 - Information processing device - Google Patents
Information processing device Download PDFInfo
- Publication number
- EP3996008A1 EP3996008A1 EP21194563.9A EP21194563A EP3996008A1 EP 3996008 A1 EP3996008 A1 EP 3996008A1 EP 21194563 A EP21194563 A EP 21194563A EP 3996008 A1 EP3996008 A1 EP 3996008A1
- Authority
- EP
- European Patent Office
- Prior art keywords
- sub
- linear regression
- module
- library
- regression equation
- Prior art date
- Legal status (The legal status is an assumption and is not a legal conclusion. Google has not performed a legal analysis and makes no representation as to the accuracy of the status listed.)
- Granted
Links
Images




Classifications
-
- G—PHYSICS
- G06—COMPUTING OR CALCULATING; COUNTING
- G06N—COMPUTING ARRANGEMENTS BASED ON SPECIFIC COMPUTATIONAL MODELS
- G06N20/00—Machine learning
-
- G—PHYSICS
- G06—COMPUTING OR CALCULATING; COUNTING
- G06F—ELECTRIC DIGITAL DATA PROCESSING
- G06F30/00—Computer-aided design [CAD]
- G06F30/20—Design optimisation, verification or simulation
- G06F30/27—Design optimisation, verification or simulation using machine learning, e.g. artificial intelligence, neural networks, support vector machines [SVM] or training a model
-
- G—PHYSICS
- G06—COMPUTING OR CALCULATING; COUNTING
- G06F—ELECTRIC DIGITAL DATA PROCESSING
- G06F1/00—Details not covered by groups G06F3/00 - G06F13/00 and G06F21/00
- G06F1/16—Constructional details or arrangements
- G06F1/20—Cooling means
- G06F1/206—Cooling means comprising thermal management
-
- G—PHYSICS
- G06—COMPUTING OR CALCULATING; COUNTING
- G06F—ELECTRIC DIGITAL DATA PROCESSING
- G06F2111/00—Details relating to CAD techniques
- G06F2111/08—Probabilistic or stochastic CAD
-
- G—PHYSICS
- G06—COMPUTING OR CALCULATING; COUNTING
- G06F—ELECTRIC DIGITAL DATA PROCESSING
- G06F2111/00—Details relating to CAD techniques
- G06F2111/10—Numerical modelling
Definitions
- the present disclosure relates to an information processing device.
- an object of an arrangement is to generate a model of an appropriate physical phenomenon.
- an information processing device includes a library storage unit, a detection result acquisition module, a regression equation generation module, a correction module, a regression equation regeneration module, and an output control module.
- the library storage unit is configured to store therein a plurality of types of sub-libraries including respective nonlinear basis functions based on a dependent variable or an independent variable, and generation probabilities of the nonlinear basis functions included in the sub-libraries.
- the detection result acquisition module is configured to acquire a detection result of a sensor.
- the regression equation generation module is configured to perform calculation by using the detection result and the nonlinear basis functions of the sub-libraries, extract nonlinear basis functions from the sub-libraries including the nonlinear basis functions on a basis of the generation probabilities, generate a plurality of linear regression equations, in which the nonlinear basis functions of the plurality of types of sub-libraries are combined, for calculating the dependent variable, estimate coefficients of the linear regression equations by machine learning, and calculate loss functions of the linear regression equations by using a result of the calculation.
- the correction module is configured to correct the generation probabilities and a hyperparameter of the machine learning on a basis of the loss functions of the linear regression equations when a predetermined condition is not met.
- the regression equation regeneration module is configured to extract nonlinear basis functions on a basis of the corrected generation probabilities from the sub-libraries including the nonlinear basis functions, generate linear regression equations, in which the nonlinear basis functions of the plurality of types of sub-libraries are combined, estimate coefficients of the linear regression equations by machine learning using the corrected hyperparameter, and calculate loss functions of the linear regression equations.
- the output control module is configured to output, to an output unit, a linear regression equation selected from the linear regression equations generated by the regression equation generation module or the regression equation regeneration module when the condition is met.
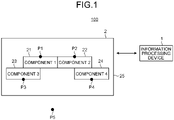
- FIG. 1 is a schematic diagram illustrating an example of an information processing system 100.
- the information processing system 100 includes an information processing device 1 and an electronic apparatus 2.
- the information processing device 1 and the electronic apparatus 2 are connected to be able to exchange data or signals.
- the electronic apparatus 2 is equipment including one or a plurality of components and driven by supplied electric power.
- the electronic apparatus 2 is applied to, for example, various apparatuses in which one or a plurality of electronic components are mounted in one rack.
- the electronic apparatus 2 is applied to various electronic apparatuses such as a digital broadcasting transmitter, a data relay apparatus, a computer, and a server.
- the electronic apparatus 2 includes a housing 25 for housing various components and the like.
- the housing 25 is a main body portion of the electronic apparatus 2, and is an exterior for housing various components and devices.
- the housing 25 is a box-like member having a hollow inside will be described as an example.
- a plurality of components and a plurality of sensors are arranged in the housing 25.
- an arrangement in which the components and the sensors are arranged in the housing 25 will be described as an example.
- a component 21 and a component 22 are electronic components.
- the electronic component is, for example, a component that is driven according to the supplied electric power.
- the electronic components include heat-generating components that generate heat when driven according to the supplied electric power.
- drive includes both an electric drive and a mechanical drive.
- the electric drive includes, for example, processing by a processor such as a central processing unit (CPU).
- the mechanical drive includes, for example, drive of a motor.
- the component 21 and the component 22 are heat-generating components.
- the component 21 and the component 22 serving as heat generating components are, for example, processors such as the CPU and a graphics processing unit (GPU).
- processors such as the CPU and a graphics processing unit (GPU).
- the component 21 and the component 22 may be any desired component that generates heat by being driven according to the supplied electric power, and are not limited to the CPU and the GPU.
- the component 21 and the component 22 may be a field effect transistor (FET), an intelligent power module (IPM), the motor, an electronic circuit, and the like.
- FET field effect transistor
- IPM intelligent power module
- the motor an electronic circuit, and the like.
- a component 23 and a component 24 are metal blocks such as aluminum.
- the component 23 and the component 24 have a cooling function.
- the sensors are arranged in the electronic apparatus 2.
- the sensors measure, for example, physical quantities of environmental changes at positions P1 to P5.
- the sensors detect the physical quantities of temperature, current, voltage, and wind speed at the positions P1 to P5, and output detection results as detection values.
- the physical quantity and the detected value are represented by numerical values indicating, for example, temperature, current, voltage, wind speed, and the like. Note that pressure, rotation speed of an air cooling fan, and the like may be included.
- the sensors described above are, for example, a temperature sensor, a flow rate sensor, a current sensor, a voltage sensor, and the like.
- the sensors may be arranged at positions inside the housing 25 or outside the housing 25 where the environmental changes can be measured.
- the sensors may be built in as a product or may be externally attached only at the time of measurement.
- the information processing device 1 is an apparatus that generates a model for predicting the temperature of the electronic apparatus on the basis of a state of the electronic apparatus 2.
- the information processing device 1 and each of the sensors provided in the electronic apparatus 2 are connected to be able to exchange data or signals.
- the information processing device 1 may be further connected to an electronic apparatus including various information processing devices other than the sensor mounted on the electronic apparatus 2 so that data or signals can be exchanged.
- the information processing device 1 may be connected to the sensors and at least one of the components so that data or signals can be exchanged.
- the information processing device 1 is, for example, a server, a workstation, or the like.
- the information processing device 1 may collectively transmit data acquired from the sensors to a remote information processing device by a storage medium or a cloud.
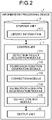
- FIG. 2 is a block diagram illustrating the example of the functional configuration of the information processing device 1.
- the information processing device 1 and the sensors are connected so that data or signals can be exchanged.
- the information processing device 1 may be connected to various kinds of electronic apparatus other than the sensors so that data or signals can be exchanged.
- the information processing device 1 of the present arrangement is an apparatus that generates a model based on a thermal network method.
- the information processing device 1 outputs a linear regression equation capable of outputting the temperature of the electronic apparatus 2, as the model.
- the information processing device 1 includes a storage unit 10, a controller 11, and an output unit 12.
- the controller 11 is connected to the storage unit 10 and the output unit 12 so that data or signals can be exchanged.
- the storage unit 10 stores therein various types of data.
- the storage unit 10 is, for example, a storage medium such as a known hard disk drive (HDD).
- HDD hard disk drive
- the storage unit 10 stores therein library information 101 in advance.
- the library information 101 is information including sub-library definition information that is information in which a plurality of types of sub-libraries including nonlinear basis functions are defined, and generation probability information that is information on generation probability of each of the nonlinear basis functions included in each sub-library.
- Each sub-library is a sub-library for generating linear regression equation that represents a thermal model.
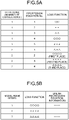
- FIG. 3A is a diagram illustrating sub-library definition information. As illustrated in FIG. 3A , the sub-libraries include a heat conduction sub-library, a radiation sub-library, a forced convection sub-library, a natural convection sub-library, and a heat generation sub-library. Each sub-library includes one or a plurality of nonlinear basis functions. Note that the sub-library is not limited to one illustrated in FIG. 3A , and a phase-change sub-library that considers a phase change may be defined.
- Ti and Tj illustrated in FIG. 3A are temperatures at any of the positions P1 to P5. Furthermore, ⁇ T and ⁇ T i-j are temperature differences between two points. V is a velocity (wind speed). V is a voltage. i 1 and i 2 are currents. Thus, the sub-libraries include nonlinear basis functions based on a dependent variable (temperature) and independent variables (velocity, current and voltage).
- each sub-library contains one or more nonlinear basis functions.
- the forced convection sub-library and the natural convection sub-library include the nonlinear basis functions having different exponents.
- R thermal resistance
- T temperature
- Q calorific value
- ⁇ t time interval
- m is a subscript of time.
- the library information 101 further includes the information on the generation probability, which is a probability of being selected from the nonlinear basis functions included in the same sub-library.
- FIG. 3B is a diagram illustrating the generation probability information. As illustrated in FIG. 3B , the sub-library, the exponent, and the generation probability are associated with each other.
- the output unit 12 outputs various information.
- the output unit 12 outputs information on the model for predicting the temperature of the electronic apparatus. Details of the information on the model for predicting the temperature of the electronic apparatus will be described later.
- the output unit 12 includes at least one of a display function for displaying various information and a communication function for communicating data with an external apparatus.
- the external apparatus is an apparatus provided outside the electronic apparatus 2.
- the electronic apparatus 2 and the external apparatus may be able to communicate with each other via a network or the like.
- the output unit 12 is configured by combining at least one of a known display device and a known communication device.
- the controller 30 includes a detection result acquisition module 111, a regression equation generation module 112, a correction module 113, a regression equation regeneration module 114, and an output control module 115.
- the detection result acquisition module 111, the regression equation generation module 112, the correction module 113, the regression equation regeneration module 114, and the output control module 115 are implemented by, for example, one or a plurality of processors.
- each of the above components may be implemented by causing the processor such as the CPU to execute a computer program, that is, by software.
- Each of the above components may be implemented by the processor such as a dedicated IC, that is, by hardware.
- Each of the above components may be implemented by using software and hardware in combination.
- each processor may implement one of the components, or may implement two or more of the components.
- the detection result acquisition module 111 acquires the detection results detected by the sensors. For example, the detection result acquisition module 111 acquires the detection results of measuring at predetermined time intervals the temperatures at the positions P1 to P5, the wind speed at the position P5, the currents at the positions P1 and P2, and the voltage at the position P1 illustrated in FIG. 1 . Note that the detection result acquisition module 111 may acquire information on the rotation speed and voltage of the air cooling fan, and calculate the wind speed on the basis of the information.
- FIG. 4 is a diagram illustrating an example of sensor information. As illustrated in FIG. 4 , for example, the data measured every 0.5 seconds is acquired. Temp1 to Temp5 illustrated in FIG. 4 are the temperatures at the positions P1 to P5. V illustrated in FIG. 4 is the wind speed at the position P5. i 1 and i 2 are the currents at the positions P1 and P2. V illustrated in FIG. 4 is the voltage at the position P1. Note that the detection result acquisition module 111 may register the acquired detection result in the storage unit 10.
- the regression equation generation module 112 generates a plurality of regression equations. Specifically, the regression equation generation module 112 first differentiates each of Temp1 to Temp5 acquired at the corresponding time, by time. Furthermore, the regression equation generation module 112 generates matrix data in which each piece of data acquired by the detection result acquisition module 111 is input to the nonlinear basis function in each sub-library. In this way, the regression equation generation module 112 calculates using the detection result of the sensor and the nonlinear basis functions.
- the regression equation generation module 112 extracts nonlinear basis functions from the sub-libraries including the nonlinear basis functions on the basis of the generation probabilities, and generates the linear regression equations for calculating each of Temp1 to Temp5 by combining the nonlinear basis functions of the plurality of types of sub-libraries.
- the regression equation generation module 112 When extracting a nonlinear basis function from the sub-library including the nonlinear basis functions on the basis of the generation probability, the regression equation generation module 112 preferentially extracts the exponent having a high generation probability of the generation probability information.
- the regression equation generation module 112 determines coefficients of the linear regression equations by sparse estimation of a known technique. For example, the regression equation generation module 112 determines the coefficients by the least squares method, and then sets the coefficient equal to or less than a predetermined threshold value (hyperparameter) to 0. Furthermore, the regression equation generation module 112 updates the coefficient by performing the least squares method again with a candidate function (nonlinear basis function) having the remaining non-zero coefficient, and sets the coefficient equal to or less than the predetermined threshold value to 0. Note that the regression equation generation module 112 repeats a plurality of times a process of updating the coefficient by performing the least squares method again with the candidate function and of setting the coefficient equal to or less than the threshold value to 0.
- the regression equation generation module 112 may determine a coefficient by other known machine learning in addition to determining the coefficients by sparse estimation.
- the regression equation generation module 112 calculates loss functions using the linear regression equations and a result of the above calculation.
- a method for calculating the loss functions is implement by a known method.
- the regression equation generation module 112 generates the loss functions based on an error between a result of inputting the matrix data, which is obtained by inputting each piece of data acquired by the detection result acquisition module 111 to the nonlinear basis function in each sub-library, to the generated linear regression equations, and a result of differentiating each of Temp1 to Temp5 at the corresponding time, by time.
- the regression equation generation module 112 may calculate the loss functions based on not only the above-described error but also a degree of simplicity of the equation.
- the correction module 113 corrects the hyperparameter and the generation probabilities used when determining the coefficients of the linear regression equations on the basis of the loss functions of the linear regression equations.
- the method for correcting the hyperparameter may be a method of the related art (for example, a method described in S. L. Brunton, J. L. Proctor, J. N. Kutz, "Discovering governing equations from data by sparse identification of nonlinear dynamical systems", Proc. Natl. Acad. Sci., 113 (2016), pp. 3932-3937 ).
- the correction module 113 adds a value to the hyperparameter when the loss function of each linear regression equation falls below a predetermined threshold value. In contrast, the correction module 113 subtracts a value from the hyperparameter when the loss function of each linear regression equation is equal to or more than the threshold value.
- the correction module 113 increases the generation probability of the sub-library that constitutes the linear regression equation of the smallest loss function among the loss functions of the linear regression equations generated by the same hyperparameter, and reduces the generation probability of other sub-libraries.
- the generation probability of the sub-library having a high generation probability may be further increased. That is, the generation probability may be corrected so as to narrow down the nonlinear basis function to be extracted.
- the regression equation regeneration module 114 extracts nonlinear basis functions from the sub-libraries including the nonlinear basis functions on the basis of the generation probabilities after correction by the correction module 113, generates linear regression equations obtained by combining the nonlinear functions of the plurality of types of sub-libraries, estimates coefficients of the linear regression equations by sparse estimation using the hyperparameter corrected by the correction module 113, and calculates loss functions of the linear regression equations.
- the correction module 113 corrects the hyperparameter and the generation probabilities again. Then, the regression equation regeneration module 114 calculates the loss functions of the linear regression equations on the basis of the hyperparameter and the generation probabilities that have been corrected again. In this way, the controller 11 corrects the hyperparameter and the generation probabilities for the predetermined number of times, and calculates the loss functions using the hyperparameter and the generation probabilities that have been corrected.
- the output control module 115 outputs a linear regression equation selected from the linear regression equations to the output unit 12 if a predetermined condition is met. Examples of this condition include the number of times the regression equation regeneration module 114 has generated the linear regression equations. Furthermore, the above condition may be that the loss functions of the linear regression equations calculated by the regression equation generation module 112 or the loss functions of the linear regression equations calculated by the regression equation regeneration module 114 is equal to or less than the threshold value.
- the output control module 115 outputs information on the linear regression equations selected by a rank order based on the loss functions of the linear regression equations to the output unit.
- the output control module 115 outputs the linear regression equations will be described with reference to FIGS. 5A and 5B .
- FIG. 5A is a diagram illustrating a state of internal processing. Specifically, FIG. 5A is a diagram in which the number of iterations (number of corrections) for the linear regression equations generated by the regression equation regeneration module 114, a regression equation No. indicating an identification number of the linear regression equation, and the loss function are associated with each other.
- the loss function " ⁇ " of the linear regression equation in which "the number of iterations” is “2" and the “regression equation No.” is “2” is the first place (a value indicated by the loss function is the smallest)
- the loss function " ⁇ ” of the linear regression equation in which "the number of iterations” is “2” and the “regression equation No.” is "3” is the second place
- the loss function " ⁇ ” of the linear regression equation in which "the number of iterations” is "2” and the “regression equation No.” is "4" is the third place.
- FIG. 5B is a diagram illustrating an output example of the information on the linear regression equation.
- the output control module 115 outputs the loss function and linear regression equation information to the output unit 12 on the basis of the rank order of the loss function illustrated in FIG. 5A .
- the linear regression equation information is information indicating the linear regression equation, such as information indicating a simultaneous equation of nodes and a linear combination of the basis functions. Note that the output control module 115 may output the linear regression equation information on a separate screen.
- the output control module 115 may select the linear regression equation having the smallest loss function among the linear regression equations.
- the output control module 115 may transmit and output the selected linear regression equation to another information processing device.
- the other information processing device can perform temperature prediction calculation using the linear regression equation.
- FIG. 6 is a flowchart illustrating an example of the flow of the information processing performed by the information processing device 1.
- the detection result acquisition module 111 acquires the detection results of the sensors (Step S1). Subsequently, the regression equation generation module 112 uses the detection results of the sensors to differentiate each of Temp1 to Temp5 acquired at the corresponding time, by time, and to generate the matrix data in which each piece of data acquired by the detection result acquisition module 111 is input to the nonlinear basis function in each sub-library. In this way, the regression equation generation module 112 performs arithmetic processing of the nonlinear basis function using the detection results of the sensors (Step S2) .
- the regression equation generation module 112 extracts the nonlinear basis function from the sub-library including the nonlinear basis functions on the basis of the generation probability, and generates the linear regression equations for calculating each of Temp1 to Temp5 by combining the nonlinear basis functions of the plurality of types of sub-libraries. Furthermore, the regression equation generation module 112 determines the coefficients of the linear regression equations by sparse estimation (Step S3).
- the regression equation generation module 112 calculates the loss function using the linear regression equations and the result of the above calculation (Step S4). If the linear regression equation has not been generated for the predetermined number of times (No at Step S5), the correction module 113 corrects the generation probability and the hyperparameter on the basis of the loss function of the linear regression equation (Step S6). For example, the correction module 113 adds a value to the hyperparameter when the loss function of each linear regression equation falls below the predetermined threshold value. The correction module 113 increases the generation probability of the sub-library that constitutes the linear regression equation of the smallest loss function among the loss functions of the linear regression equations generated by the same hyperparameter, and reduces the generation probability of the other sub-libraries.
- the regression equation regeneration module 114 extracts the nonlinear basis function from the sub-library including the nonlinear basis functions on the basis of the generation probability after correction by the correction module 113, generates the linear regression equations combining the nonlinear functions of the plurality of types of sub-libraries, and estimates the coefficients of the linear regression equations by sparse estimation using the hyperparameter corrected by the correction module 113 (Step S7). Furthermore, the regression equation regeneration module 114 calculates the loss functions of the linear regression equations (Step S8), and proceeds to Step S5.
- Step S5 when the regression equation regeneration module 114 generates the linear regression equation for the predetermined number of times, the output control module 115 outputs the linear regression equation selected from the linear regression equations to the output unit 12 (Step S9). Then, this routine is terminated.
- the information processing device 1 of the present arrangement includes the storage unit 10 for storing the library information, the detection result acquisition module 111, the regression equation generation module 112, the correction module 113, and the regression equation regeneration module 114, and the output control module 115.
- the storage unit 10 stores therein the library information 101 including the sub-library definition information that is the information on the plurality of types of sub-libraries including nonlinear basis functions based on the dependent variable or the independent variable, and the generation probability information that is the information on the generation probability of each of the nonlinear basis functions included in each sub-library.
- the detection result acquisition module 111 acquires the detection results of the sensors.
- the regression equation generation module 112 calculates the non-linear base function of the sub-library using the detection results, extracts the nonlinear basis function from the sub-library including the nonlinear basis functions on the basis of the generation probability, generates the linear regression equations combining the nonlinear basis functions of the plurality of types of sub-libraries, estimates the coefficients of the linear regression equations by machine learning, and calculates the loss functions of the linear regression equations using the calculated result.
- the correction module 113 corrects the generation probability and the hyperparameter of machine learning on the basis of the loss function of the linear regression equation.
- the regression equation regeneration module 114 extracts the nonlinear basis function from the sub-library including the nonlinear basis functions on the basis of the corrected generation probability, generates the linear regression equations combining the nonlinear basis functions of the plurality of types of sub-libraries, estimates the coefficients of the linear regression equations by machine learning using the corrected hyperparameter, and calculates the loss functions of the linear regression equations.
- the output control module 115 outputs the linear regression equation selected from the linear regression equations to the output unit 12 if the predetermined condition is met.
- the information processing device 1 extracts the nonlinear basis function from the sub-library including the nonlinear basis functions on the basis of the generation probability, generates the linear regression equations combining the nonlinear basis functions of the plurality of types of sub-libraries, and regenerates the linear regression equation while tuning the generation probability and the hyperparameter of machine learning until the predetermined condition is met.
- the information processing device 1 regenerates the linear regression equation while tuning the generation probability and the hyperparameter of machine learning, and narrows down the linear regression equation to be generated by changing the generation probability.
- the information processing device 1 can output an appropriate linear regression equation while reducing a search space. That is, the information processing device 1 can generate a model of an appropriate physical phenomenon.
- FIG. 7A is a diagram illustrating an example of temperature prediction by machine learning without considering a physical model.
- FIG. 7A includes a graph G1 and a graph G2.
- the graph G1 is a prediction graph of a temperature Temp1 predicted by a result of deep learning with the measurement data by the sensor.
- the graph G2 is a graph of correct answer data of the temperature Temp1.
- the vertical axis is temperature and the horizontal axis is time. As illustrated in FIG. 7A , there is a difference between the prediction graph and the graph of the correct answer data.
- FIG. 7B is a diagram illustrating an example of temperature prediction by a machine learning model considering a known physical model.
- FIG. 7B includes a graph G3 and a graph G4.
- the graph G3, although not including a sub-library as in the present arrangement, is a graph predicting the temperature Temp1 on the basis of the physical model.
- the graph G4 is the graph of the correct answer data of the temperature Temp1.
- there is a difference between the prediction graph and the graph of the correct answer data although not as much as in FIG. 7A .
- the difference increases with the passage of time, indicating that it is not suitable for long-term prediction.
- FIG. 7C is a diagram illustrating an example of temperature prediction based on the linear regression equation generated by the present arrangement.
- FIG. 7C includes a graph G5 and a graph G6.
- the graph G5 is a graph predicting the temperature Temp1 on the basis of the sub-library as in the present arrangement.
- the graph G6 is the graph of the correct answer data of the temperature Temp1. As illustrated in FIG. 7C , the prediction graph and the graph of the correct answer data are almost the same.
- the information processing device 1 of the present arrangement can output the linear regression equation that can be predicted more appropriately by generating the linear regression equation using the sub-library.
- the information processing device 1 estimates the coefficients of the linear regression equations by sparse estimation.
- the linear regression equation includes many basis functions, most of which have zero coefficients, and thus the coefficients can be appropriately estimated by using sparse estimation.
- the information processing device 1 generates the linear regression equation that is an equation for calculating the temperature using the temperature as the dependent variable.
- the linear regression equation is generated/regenerated using the library information 101, so that an appropriate model of a thermal phenomenon can be generated.
- the information processing device 1 stores therein the plurality of types of sub-libraries including the nonlinear basis functions of independent variables corresponding to velocity, current and voltage. In this way, the information processing device 1 stores therein the nonlinear basis functions related to velocity, current and voltage that are highly related to temperature, and generates the linear regression equation using the nonlinear basis functions, so that the appropriate model of the thermal phenomenon can be generated.
- the information processing device 1 Since the information processing device 1 stores therein, as the plurality of types of sub-libraries, the nonlinear basis functions of the heat conduction sub-library, the radiation sub-library, the forced convection sub-library, the natural convection sub-library, and the heat generation sub-library, the information processing device 1 stores therein the sub-library corresponding to the node equation, so that the appropriate model of the thermal phenomenon can be generated.
- the output control module 115 of the information processing device 1 outputs the information on the selected linear regression equations to the output unit 12 according to the rank order based on the loss function of each of the linear regression equations. In this way, the information processing device 1 can output the information on the linear regression equations selected according to the rank order based on the loss function, thereby outputting pieces of information that can be compared and examined by a user of the information processing device 1.
- the linear regression equation of a model of another physical phenomenon for example, electric resistance or physical deformation amount
Landscapes
- Engineering & Computer Science (AREA)
- Theoretical Computer Science (AREA)
- Evolutionary Computation (AREA)
- Physics & Mathematics (AREA)
- Software Systems (AREA)
- General Engineering & Computer Science (AREA)
- Medical Informatics (AREA)
- Computer Vision & Pattern Recognition (AREA)
- General Physics & Mathematics (AREA)
- Artificial Intelligence (AREA)
- Computer Hardware Design (AREA)
- Geometry (AREA)
- Computing Systems (AREA)
- Data Mining & Analysis (AREA)
- Mathematical Physics (AREA)
- Feedback Control In General (AREA)
- Testing Or Calibration Of Command Recording Devices (AREA)
Abstract
Description
- The present disclosure relates to an information processing device.
- As a technique for modeling a physical phenomenon, there is a technique for acquiring a mathematical model that describes the physical phenomenon from time-series data by applying a symbolic regression problem, which is a kind of machine learning.
- For example, when considering generating a thermal network model as a physical phenomenon model by using the conventional technique, because heat transfer phenomena are diverse, there is a possibility that a model of an appropriate physical phenomenon cannot be generated, for reasons that, for example, a search space is increased and the learning is not stable.
- Therefore, an object of an arrangement is to generate a model of an appropriate physical phenomenon.
-
-
FIG. 1 is a schematic diagram illustrating an example of an information processing system; -
FIG. 2 is a block diagram illustrating an example of a functional configuration of an information processing device; -
FIG. 3A is a diagram illustrating sub-library definition information; -
FIG. 3B is a diagram illustrating generation probability information; -
FIG. 4 is a diagram illustrating an example of sensor information; -
FIG. 5A is a diagram illustrating a state of internal processing; -
FIG. 5B is a diagram illustrating an output example of information on a linear regression equation; -
FIG. 6 is a flowchart illustrating an example of flow of information processing performed by the information processing device; -
FIG. 7A is a diagram illustrating an example of temperature prediction by a machine learning model without considering a physical model; -
FIG. 7B is a diagram illustrating an example of temperature prediction by a machine learning model considering the physical model; and -
FIG. 7C is a diagram illustrating an example of temperature prediction based on the linear regression equation generated by the present arrangement. - According to an arrangement, an information processing device includes a library storage unit, a detection result acquisition module, a regression equation generation module, a correction module, a regression equation regeneration module, and an output control module. The library storage unit is configured to store therein a plurality of types of sub-libraries including respective nonlinear basis functions based on a dependent variable or an independent variable, and generation probabilities of the nonlinear basis functions included in the sub-libraries. The detection result acquisition module is configured to acquire a detection result of a sensor. The regression equation generation module is configured to perform calculation by using the detection result and the nonlinear basis functions of the sub-libraries, extract nonlinear basis functions from the sub-libraries including the nonlinear basis functions on a basis of the generation probabilities, generate a plurality of linear regression equations, in which the nonlinear basis functions of the plurality of types of sub-libraries are combined, for calculating the dependent variable, estimate coefficients of the linear regression equations by machine learning, and calculate loss functions of the linear regression equations by using a result of the calculation. The correction module is configured to correct the generation probabilities and a hyperparameter of the machine learning on a basis of the loss functions of the linear regression equations when a predetermined condition is not met. The regression equation regeneration module is configured to extract nonlinear basis functions on a basis of the corrected generation probabilities from the sub-libraries including the nonlinear basis functions, generate linear regression equations, in which the nonlinear basis functions of the plurality of types of sub-libraries are combined, estimate coefficients of the linear regression equations by machine learning using the corrected hyperparameter, and calculate loss functions of the linear regression equations. The output control module is configured to output, to an output unit, a linear regression equation selected from the linear regression equations generated by the regression equation generation module or the regression equation regeneration module when the condition is met.
- Hereinafter, an information processing device according to an arrangement will be described in detail with reference to the accompanying drawings. The present disclosure is not limited to the arrangement.
-
FIG. 1 is a schematic diagram illustrating an example of aninformation processing system 100. - The
information processing system 100 includes aninformation processing device 1 and anelectronic apparatus 2. Theinformation processing device 1 and theelectronic apparatus 2 are connected to be able to exchange data or signals. - The
electronic apparatus 2 is equipment including one or a plurality of components and driven by supplied electric power. Theelectronic apparatus 2 is applied to, for example, various apparatuses in which one or a plurality of electronic components are mounted in one rack. Specifically, theelectronic apparatus 2 is applied to various electronic apparatuses such as a digital broadcasting transmitter, a data relay apparatus, a computer, and a server. - The
electronic apparatus 2 includes ahousing 25 for housing various components and the like. - The
housing 25 is a main body portion of theelectronic apparatus 2, and is an exterior for housing various components and devices. In the present arrangement, a case where thehousing 25 is a box-like member having a hollow inside will be described as an example. - A plurality of components and a plurality of sensors are arranged in the
housing 25. In the present arrangement, an arrangement in which the components and the sensors are arranged in thehousing 25 will be described as an example. - A
component 21 and acomponent 22 are electronic components. The electronic component is, for example, a component that is driven according to the supplied electric power. The electronic components include heat-generating components that generate heat when driven according to the supplied electric power. Note that "drive" includes both an electric drive and a mechanical drive. The electric drive includes, for example, processing by a processor such as a central processing unit (CPU). The mechanical drive includes, for example, drive of a motor. Note that thecomponent 21 and thecomponent 22 are heat-generating components. - The
component 21 and thecomponent 22 serving as heat generating components are, for example, processors such as the CPU and a graphics processing unit (GPU). Note that thecomponent 21 and thecomponent 22 may be any desired component that generates heat by being driven according to the supplied electric power, and are not limited to the CPU and the GPU. For example, thecomponent 21 and thecomponent 22 may be a field effect transistor (FET), an intelligent power module (IPM), the motor, an electronic circuit, and the like. - A
component 23 and acomponent 24 are metal blocks such as aluminum. Thecomponent 23 and thecomponent 24 have a cooling function. - The sensors are arranged in the
electronic apparatus 2. The sensors measure, for example, physical quantities of environmental changes at positions P1 to P5. For example, the sensors detect the physical quantities of temperature, current, voltage, and wind speed at the positions P1 to P5, and output detection results as detection values. The physical quantity and the detected value are represented by numerical values indicating, for example, temperature, current, voltage, wind speed, and the like. Note that pressure, rotation speed of an air cooling fan, and the like may be included. - The sensors described above are, for example, a temperature sensor, a flow rate sensor, a current sensor, a voltage sensor, and the like.
- The sensors may be arranged at positions inside the
housing 25 or outside thehousing 25 where the environmental changes can be measured. The sensors may be built in as a product or may be externally attached only at the time of measurement. - The
information processing device 1 is an apparatus that generates a model for predicting the temperature of the electronic apparatus on the basis of a state of theelectronic apparatus 2. Theinformation processing device 1 and each of the sensors provided in theelectronic apparatus 2 are connected to be able to exchange data or signals. Note that theinformation processing device 1 may be further connected to an electronic apparatus including various information processing devices other than the sensor mounted on theelectronic apparatus 2 so that data or signals can be exchanged. For example, theinformation processing device 1 may be connected to the sensors and at least one of the components so that data or signals can be exchanged. Furthermore, theinformation processing device 1 is, for example, a server, a workstation, or the like. - For example, the
information processing device 1 may collectively transmit data acquired from the sensors to a remote information processing device by a storage medium or a cloud. - Next, an example of a functional configuration of the
information processing device 1 will be described. -
FIG. 2 is a block diagram illustrating the example of the functional configuration of theinformation processing device 1. - The
information processing device 1 and the sensors are connected so that data or signals can be exchanged. Note that, as described above, theinformation processing device 1 may be connected to various kinds of electronic apparatus other than the sensors so that data or signals can be exchanged. Theinformation processing device 1 of the present arrangement is an apparatus that generates a model based on a thermal network method. Theinformation processing device 1 outputs a linear regression equation capable of outputting the temperature of theelectronic apparatus 2, as the model. - The
information processing device 1 includes astorage unit 10, a controller 11, and anoutput unit 12. The controller 11 is connected to thestorage unit 10 and theoutput unit 12 so that data or signals can be exchanged. - The
storage unit 10 stores therein various types of data. Thestorage unit 10 is, for example, a storage medium such as a known hard disk drive (HDD). In the present arrangement, thestorage unit 10 stores thereinlibrary information 101 in advance. - The
library information 101 is information including sub-library definition information that is information in which a plurality of types of sub-libraries including nonlinear basis functions are defined, and generation probability information that is information on generation probability of each of the nonlinear basis functions included in each sub-library. - First, the sub-library will be described with reference to
FIG. 3A . Each sub-library is a sub-library for generating linear regression equation that represents a thermal model.FIG. 3A is a diagram illustrating sub-library definition information. As illustrated inFIG. 3A , the sub-libraries include a heat conduction sub-library, a radiation sub-library, a forced convection sub-library, a natural convection sub-library, and a heat generation sub-library. Each sub-library includes one or a plurality of nonlinear basis functions. Note that the sub-library is not limited to one illustrated inFIG. 3A , and a phase-change sub-library that considers a phase change may be defined. - Ti and Tj illustrated in
FIG. 3A are temperatures at any of the positions P1 to P5. Furthermore, ΔT and ΔTi-j are temperature differences between two points. V is a velocity (wind speed). V is a voltage. i1 and i2 are currents.
Thus, the sub-libraries include nonlinear basis functions based on a dependent variable (temperature) and independent variables (velocity, current and voltage). - As illustrated in
FIG. 3A , each sub-library contains one or more nonlinear basis functions. Furthermore, the forced convection sub-library and the natural convection sub-library include the nonlinear basis functions having different exponents. - In the above thermal model, an energy conservation law that holds for a node (temperature measurement point) is expressed by a node equation illustrated in the following equation (1).

- In the above equation (1), R is thermal resistance, T is temperature, Q is calorific value, and Δt is time interval. Furthermore, m is a subscript of time.
- When the above equation (1) is transformed, the following equation (2) is obtained.

- As shown by the right side of the equation (2), if a nonlinear basis function indicating Q/C and ΔT/RC can be prepared, an appropriate linear regression equation can be derived. When dimensions and physical properties do not change, such as in maintenance operations, the nonlinear basis functions of the heat conduction sub-library, the radiation sub-library, the forced convection sub-library, and the natural convection sub-library are proportional to ΔT/RC. Furthermore, the heat generation sub-library is proportional to Q/C. The
information processing device 1 of the present arrangement generates the linear regression equation according to the thermal model by using the sub-libraries defined in the sub-library definition information. - The
library information 101 further includes the information on the generation probability, which is a probability of being selected from the nonlinear basis functions included in the same sub-library. - Subsequently, the generation probability will be described with reference to
FIG. 3B. FIG. 3B is a diagram illustrating the generation probability information. As illustrated inFIG. 3B , the sub-library, the exponent, and the generation probability are associated with each other. - Returning to
FIG. 2 , theoutput unit 12 outputs various information. In the present arrangement, theoutput unit 12 outputs information on the model for predicting the temperature of the electronic apparatus. Details of the information on the model for predicting the temperature of the electronic apparatus will be described later. - The
output unit 12 includes at least one of a display function for displaying various information and a communication function for communicating data with an external apparatus. The external apparatus is an apparatus provided outside theelectronic apparatus 2. Theelectronic apparatus 2 and the external apparatus may be able to communicate with each other via a network or the like. For example, theoutput unit 12 is configured by combining at least one of a known display device and a known communication device. - Next, a
controller 30 will be described. - The
controller 30 includes a detectionresult acquisition module 111, a regression equation generation module 112, a correction module 113, a regressionequation regeneration module 114, and anoutput control module 115. - The detection
result acquisition module 111, the regression equation generation module 112, the correction module 113, the regressionequation regeneration module 114, and theoutput control module 115 are implemented by, for example, one or a plurality of processors. For example, each of the above components may be implemented by causing the processor such as the CPU to execute a computer program, that is, by software. Each of the above components may be implemented by the processor such as a dedicated IC, that is, by hardware. Each of the above components may be implemented by using software and hardware in combination. When the processors are used, each processor may implement one of the components, or may implement two or more of the components. - The detection
result acquisition module 111 acquires the detection results detected by the sensors. For example, the detectionresult acquisition module 111 acquires the detection results of measuring at predetermined time intervals the temperatures at the positions P1 to P5, the wind speed at the position P5, the currents at the positions P1 and P2, and the voltage at the position P1 illustrated inFIG. 1 . Note that the detectionresult acquisition module 111 may acquire information on the rotation speed and voltage of the air cooling fan, and calculate the wind speed on the basis of the information. - Here, an example of data acquired by the detection
result acquisition module 111 is illustrated inFIG. 4. FIG. 4 is a diagram illustrating an example of sensor information. As illustrated inFIG. 4 , for example, the data measured every 0.5 seconds is acquired. Temp1 to Temp5 illustrated inFIG. 4 are the temperatures at the positions P1 to P5. V illustrated inFIG. 4 is the wind speed at the position P5. i1 and i2 are the currents at the positions P1 and P2. V illustrated inFIG. 4 is the voltage at the position P1. Note that the detectionresult acquisition module 111 may register the acquired detection result in thestorage unit 10. - Returning to
FIG. 2 , the regression equation generation module 112 generates a plurality of regression equations. Specifically, the regression equation generation module 112 first differentiates each of Temp1 to Temp5 acquired at the corresponding time, by time. Furthermore, the regression equation generation module 112 generates matrix data in which each piece of data acquired by the detectionresult acquisition module 111 is input to the nonlinear basis function in each sub-library. In this way, the regression equation generation module 112 calculates using the detection result of the sensor and the nonlinear basis functions. - Subsequently, the regression equation generation module 112 extracts nonlinear basis functions from the sub-libraries including the nonlinear basis functions on the basis of the generation probabilities, and generates the linear regression equations for calculating each of Temp1 to Temp5 by combining the nonlinear basis functions of the plurality of types of sub-libraries.
- When extracting a nonlinear basis function from the sub-library including the nonlinear basis functions on the basis of the generation probability, the regression equation generation module 112 preferentially extracts the exponent having a high generation probability of the generation probability information.
- Subsequently, the regression equation generation module 112 determines coefficients of the linear regression equations by sparse estimation of a known technique. For example, the regression equation generation module 112 determines the coefficients by the least squares method, and then sets the coefficient equal to or less than a predetermined threshold value (hyperparameter) to 0. Furthermore, the regression equation generation module 112 updates the coefficient by performing the least squares method again with a candidate function (nonlinear basis function) having the remaining non-zero coefficient, and sets the coefficient equal to or less than the predetermined threshold value to 0. Note that the regression equation generation module 112 repeats a plurality of times a process of updating the coefficient by performing the least squares method again with the candidate function and of setting the coefficient equal to or less than the threshold value to 0.
- Note that the regression equation generation module 112 may determine a coefficient by other known machine learning in addition to determining the coefficients by sparse estimation.
- Furthermore, the regression equation generation module 112 calculates loss functions using the linear regression equations and a result of the above calculation. A method for calculating the loss functions is implement by a known method. For example, the regression equation generation module 112 generates the loss functions based on an error between a result of inputting the matrix data, which is obtained by inputting each piece of data acquired by the detection
result acquisition module 111 to the nonlinear basis function in each sub-library, to the generated linear regression equations, and a result of differentiating each of Temp1 to Temp5 at the corresponding time, by time. Note that the regression equation generation module 112 may calculate the loss functions based on not only the above-described error but also a degree of simplicity of the equation. - If conditions described later are not met, the correction module 113 corrects the hyperparameter and the generation probabilities used when determining the coefficients of the linear regression equations on the basis of the loss functions of the linear regression equations. The method for correcting the hyperparameter may be a method of the related art (for example, a method described in S. L. Brunton, J. L. Proctor, J. N. Kutz, "Discovering governing equations from data by sparse identification of nonlinear dynamical systems", Proc. Natl. Acad. Sci., 113 (2016), pp. 3932-3937). The correction module 113 adds a value to the hyperparameter when the loss function of each linear regression equation falls below a predetermined threshold value. In contrast, the correction module 113 subtracts a value from the hyperparameter when the loss function of each linear regression equation is equal to or more than the threshold value.
- The correction module 113 increases the generation probability of the sub-library that constitutes the linear regression equation of the smallest loss function among the loss functions of the linear regression equations generated by the same hyperparameter, and reduces the generation probability of other sub-libraries. Note that as a method for correcting the generation probability, for example, the generation probability of the sub-library having a high generation probability may be further increased. That is, the generation probability may be corrected so as to narrow down the nonlinear basis function to be extracted.
- The regression
equation regeneration module 114 extracts nonlinear basis functions from the sub-libraries including the nonlinear basis functions on the basis of the generation probabilities after correction by the correction module 113, generates linear regression equations obtained by combining the nonlinear functions of the plurality of types of sub-libraries, estimates coefficients of the linear regression equations by sparse estimation using the hyperparameter corrected by the correction module 113, and calculates loss functions of the linear regression equations. - If the regression
equation regeneration module 114 has not generated the linear regression equation for a predetermined number of times, the correction module 113 corrects the hyperparameter and the generation probabilities again. Then, the regressionequation regeneration module 114 calculates the loss functions of the linear regression equations on the basis of the hyperparameter and the generation probabilities that have been corrected again. In this way, the controller 11 corrects the hyperparameter and the generation probabilities for the predetermined number of times, and calculates the loss functions using the hyperparameter and the generation probabilities that have been corrected. - The
output control module 115 outputs a linear regression equation selected from the linear regression equations to theoutput unit 12 if a predetermined condition is met. Examples of this condition include the number of times the regressionequation regeneration module 114 has generated the linear regression equations. Furthermore, the above condition may be that the loss functions of the linear regression equations calculated by the regression equation generation module 112 or the loss functions of the linear regression equations calculated by the regressionequation regeneration module 114 is equal to or less than the threshold value. - Furthermore, the
output control module 115 outputs information on the linear regression equations selected by a rank order based on the loss functions of the linear regression equations to the output unit. Here, an example in which theoutput control module 115 outputs the linear regression equations will be described with reference toFIGS. 5A and 5B . -
FIG. 5A is a diagram illustrating a state of internal processing. Specifically,FIG. 5A is a diagram in which the number of iterations (number of corrections) for the linear regression equations generated by the regressionequation regeneration module 114, a regression equation No. indicating an identification number of the linear regression equation, and the loss function are associated with each other. - As illustrated in
FIG. 5A , the loss function "○○○○" of the linear regression equation in which "the number of iterations" is "2" and the "regression equation No." is "2" is the first place (a value indicated by the loss function is the smallest), the loss function "××××" of the linear regression equation in which "the number of iterations" is "2" and the "regression equation No." is "3" is the second place, and the loss function "ΔΔΔΔ" of the linear regression equation in which "the number of iterations" is "2" and the "regression equation No." is "4" is the third place. -
FIG. 5B is a diagram illustrating an output example of the information on the linear regression equation. Theoutput control module 115 outputs the loss function and linear regression equation information to theoutput unit 12 on the basis of the rank order of the loss function illustrated inFIG. 5A . Here, the linear regression equation information is information indicating the linear regression equation, such as information indicating a simultaneous equation of nodes and a linear combination of the basis functions. Note that theoutput control module 115 may output the linear regression equation information on a separate screen. - Note that the
output control module 115 may select the linear regression equation having the smallest loss function among the linear regression equations. - Note that the
output control module 115 may transmit and output the selected linear regression equation to another information processing device. Thus, the other information processing device can perform temperature prediction calculation using the linear regression equation. - Next, a flow of information processing performed by the
information processing device 1 will be described. -
FIG. 6 is a flowchart illustrating an example of the flow of the information processing performed by theinformation processing device 1. - The detection
result acquisition module 111 acquires the detection results of the sensors (Step S1). Subsequently, the regression equation generation module 112 uses the detection results of the sensors to differentiate each of Temp1 to Temp5 acquired at the corresponding time, by time, and to generate the matrix data in which each piece of data acquired by the detectionresult acquisition module 111 is input to the nonlinear basis function in each sub-library. In this way, the regression equation generation module 112 performs arithmetic processing of the nonlinear basis function using the detection results of the sensors (Step S2) . - The regression equation generation module 112 extracts the nonlinear basis function from the sub-library including the nonlinear basis functions on the basis of the generation probability, and generates the linear regression equations for calculating each of Temp1 to Temp5 by combining the nonlinear basis functions of the plurality of types of sub-libraries. Furthermore, the regression equation generation module 112 determines the coefficients of the linear regression equations by sparse estimation (Step S3).
- The regression equation generation module 112 calculates the loss function using the linear regression equations and the result of the above calculation (Step S4). If the linear regression equation has not been generated for the predetermined number of times (No at Step S5), the correction module 113 corrects the generation probability and the hyperparameter on the basis of the loss function of the linear regression equation (Step S6). For example, the correction module 113 adds a value to the hyperparameter when the loss function of each linear regression equation falls below the predetermined threshold value. The correction module 113 increases the generation probability of the sub-library that constitutes the linear regression equation of the smallest loss function among the loss functions of the linear regression equations generated by the same hyperparameter, and reduces the generation probability of the other sub-libraries.
- The regression
equation regeneration module 114 extracts the nonlinear basis function from the sub-library including the nonlinear basis functions on the basis of the generation probability after correction by the correction module 113, generates the linear regression equations combining the nonlinear functions of the plurality of types of sub-libraries, and estimates the coefficients of the linear regression equations by sparse estimation using the hyperparameter corrected by the correction module 113 (Step S7). Furthermore, the regressionequation regeneration module 114 calculates the loss functions of the linear regression equations (Step S8), and proceeds to Step S5. - In Step S5, when the regression
equation regeneration module 114 generates the linear regression equation for the predetermined number of times, theoutput control module 115 outputs the linear regression equation selected from the linear regression equations to the output unit 12 (Step S9). Then, this routine is terminated. - As described above, the
information processing device 1 of the present arrangement includes thestorage unit 10 for storing the library information, the detectionresult acquisition module 111, the regression equation generation module 112, the correction module 113, and the regressionequation regeneration module 114, and theoutput control module 115. - The
storage unit 10 stores therein thelibrary information 101 including the sub-library definition information that is the information on the plurality of types of sub-libraries including nonlinear basis functions based on the dependent variable or the independent variable, and the generation probability information that is the information on the generation probability of each of the nonlinear basis functions included in each sub-library. - The detection
result acquisition module 111 acquires the detection results of the sensors. The regression equation generation module 112 calculates the non-linear base function of the sub-library using the detection results, extracts the nonlinear basis function from the sub-library including the nonlinear basis functions on the basis of the generation probability, generates the linear regression equations combining the nonlinear basis functions of the plurality of types of sub-libraries, estimates the coefficients of the linear regression equations by machine learning, and calculates the loss functions of the linear regression equations using the calculated result. - The correction module 113 corrects the generation probability and the hyperparameter of machine learning on the basis of the loss function of the linear regression equation. The regression
equation regeneration module 114 extracts the nonlinear basis function from the sub-library including the nonlinear basis functions on the basis of the corrected generation probability, generates the linear regression equations combining the nonlinear basis functions of the plurality of types of sub-libraries, estimates the coefficients of the linear regression equations by machine learning using the corrected hyperparameter, and calculates the loss functions of the linear regression equations. - The
output control module 115 outputs the linear regression equation selected from the linear regression equations to theoutput unit 12 if the predetermined condition is met. - In this way, the
information processing device 1 extracts the nonlinear basis function from the sub-library including the nonlinear basis functions on the basis of the generation probability, generates the linear regression equations combining the nonlinear basis functions of the plurality of types of sub-libraries, and regenerates the linear regression equation while tuning the generation probability and the hyperparameter of machine learning until the predetermined condition is met. - In this case, the
information processing device 1 regenerates the linear regression equation while tuning the generation probability and the hyperparameter of machine learning, and narrows down the linear regression equation to be generated by changing the generation probability. As a result, theinformation processing device 1 can output an appropriate linear regression equation while reducing a search space. That is, theinformation processing device 1 can generate a model of an appropriate physical phenomenon. - Here, an example of predicting the temperature on the basis of the information acquired from the sensor will be described with reference to graphs of
FIGS. 7A to 7C. FIG. 7A is a diagram illustrating an example of temperature prediction by machine learning without considering a physical model.FIG. 7A includes a graph G1 and a graph G2. The graph G1 is a prediction graph of a temperature Temp1 predicted by a result of deep learning with the measurement data by the sensor. The graph G2 is a graph of correct answer data of the temperature Temp1. The vertical axis is temperature and the horizontal axis is time. As illustrated inFIG. 7A , there is a difference between the prediction graph and the graph of the correct answer data. -
FIG. 7B is a diagram illustrating an example of temperature prediction by a machine learning model considering a known physical model.FIG. 7B includes a graph G3 and a graph G4. The graph G3, although not including a sub-library as in the present arrangement, is a graph predicting the temperature Temp1 on the basis of the physical model. The graph G4 is the graph of the correct answer data of the temperature Temp1. As illustrated inFIG. 7B , there is a difference between the prediction graph and the graph of the correct answer data, although not as much as inFIG. 7A . Furthermore, as illustrated inFIG. 7B , the difference increases with the passage of time, indicating that it is not suitable for long-term prediction. -
FIG. 7C is a diagram illustrating an example of temperature prediction based on the linear regression equation generated by the present arrangement.FIG. 7C includes a graph G5 and a graph G6. The graph G5 is a graph predicting the temperature Temp1 on the basis of the sub-library as in the present arrangement. The graph G6 is the graph of the correct answer data of the temperature Temp1. As illustrated inFIG. 7C , the prediction graph and the graph of the correct answer data are almost the same. As described above, theinformation processing device 1 of the present arrangement can output the linear regression equation that can be predicted more appropriately by generating the linear regression equation using the sub-library. - The
information processing device 1 estimates the coefficients of the linear regression equations by sparse estimation. The linear regression equation includes many basis functions, most of which have zero coefficients, and thus the coefficients can be appropriately estimated by using sparse estimation. - The
information processing device 1 generates the linear regression equation that is an equation for calculating the temperature using the temperature as the dependent variable. In order to calculate the temperature, since there are wide variety of heat transfer phenomena, the search space tends to be increased, however, thelibrary information 101 as described above is stored, and the linear regression equation is generated/regenerated using thelibrary information 101, so that an appropriate model of a thermal phenomenon can be generated. - The
information processing device 1 stores therein the plurality of types of sub-libraries including the nonlinear basis functions of independent variables corresponding to velocity, current and voltage. In this way, theinformation processing device 1 stores therein the nonlinear basis functions related to velocity, current and voltage that are highly related to temperature, and generates the linear regression equation using the nonlinear basis functions, so that the appropriate model of the thermal phenomenon can be generated. - Since the
information processing device 1 stores therein, as the plurality of types of sub-libraries, the nonlinear basis functions of the heat conduction sub-library, the radiation sub-library, the forced convection sub-library, the natural convection sub-library, and the heat generation sub-library, theinformation processing device 1 stores therein the sub-library corresponding to the node equation, so that the appropriate model of the thermal phenomenon can be generated. - The
output control module 115 of theinformation processing device 1 outputs the information on the selected linear regression equations to theoutput unit 12 according to the rank order based on the loss function of each of the linear regression equations. In this way, theinformation processing device 1 can output the information on the linear regression equations selected according to the rank order based on the loss function, thereby outputting pieces of information that can be compared and examined by a user of theinformation processing device 1. - In the above-described arrangement, while a case where the
information processing device 1 generates the linear regression equation of the thermal model has been described, the linear regression equation of a model of another physical phenomenon (for example, electric resistance or physical deformation amount) may be generated. - While certain arrangements have been described, these arrangements have been presented by way of example only, and are not intended to limit the scope of the claims. Indeed, the devices described herein may be embodied in a variety of other forms; furthermore various omissions, substitutions and changes in the form of the devices described herein may be made.
Claims (6)
- An information processing device (1) comprising:a library storage unit (10) configured to store therein a plurality of types of sub-libraries including respective nonlinear basis functions based on a dependent variable or an independent variable, and generation probabilities of the nonlinear basis functions included in the sub-libraries;a detection result acquisition module (111) configured to acquire a detection result of a sensor;a regression equation generation module (112) configured to perform calculation by using the detection result and the nonlinear basis functions of the sub-libraries, extract nonlinear basis functions from the sub-libraries including the nonlinear basis functions on a basis of the generation probabilities, generate a plurality of linear regression equations, in which the nonlinear basis functions of the plurality of types of sub-libraries are combined, for calculating the dependent variable, estimate coefficients of the linear regression equations by machine learning, and calculate loss functions of the linear regression equations by using a result of the calculation;a correction module (113) configured to correct the generation probabilities and a hyperparameter of the machine learning on a basis of the loss functions of the linear regression equations when a predetermined condition is not met;a regression equation regeneration module (114) configured to extract nonlinear basis functions on a basis of the corrected generation probabilities from the sub-libraries including the nonlinear basis functions, generate linear regression equations, in which the nonlinear basis functions of the plurality of types of sub-libraries are combined, estimate coefficients of the linear regression equations by machine learning using the corrected hyperparameter, and calculate loss functions of the linear regression equations; andan output control module (115) configured to output, to an output unit (12), a linear regression equation selected from the linear regression equations generated by the regression equation generation module or the regression equation regeneration module when the condition is met.
- The information processing device (1) according to claim 1, wherein the coefficients of the linear regression equations are estimated by sparse estimation.
- The information processing device (1) according to claim 1, wherein the dependent variable includes a variable corresponding to temperature.
- The information processing device (1) according to claim 3, wherein the independent variable includes variables corresponding to velocity, current, and voltage.
- The information processing device (1) according to claim 3, wherein the plurality of types of sub-libraries include two or more of a heat conduction sub-library, a radiation sub-library, a forced convection sub-library, a natural convection sub-library, and a heat generation sub-library.
- The information processing device (1) according to claim 1, wherein the output control module (115) is configured to output, to the output unit (12), information on linear regression equations selected according to a rank order based on the loss functions of the linear regression equations.
Applications Claiming Priority (1)
| Application Number | Priority Date | Filing Date | Title |
|---|---|---|---|
| JP2020185856A JP7451378B2 (en) | 2020-11-06 | 2020-11-06 | information processing equipment |
Publications (2)
| Publication Number | Publication Date |
|---|---|
| EP3996008A1 true EP3996008A1 (en) | 2022-05-11 |
| EP3996008B1 EP3996008B1 (en) | 2026-03-18 |
Family
ID=77910539
Family Applications (1)
| Application Number | Title | Priority Date | Filing Date |
|---|---|---|---|
| EP21194563.9A Active EP3996008B1 (en) | 2020-11-06 | 2021-09-02 | Information processing device |
Country Status (3)
| Country | Link |
|---|---|
| US (1) | US20220147671A1 (en) |
| EP (1) | EP3996008B1 (en) |
| JP (2) | JP7451378B2 (en) |
Cited By (1)
| Publication number | Priority date | Publication date | Assignee | Title |
|---|---|---|---|---|
| CN115865711A (en) * | 2022-11-11 | 2023-03-28 | 西北工业大学 | Method for maximizing reliability of infrastructure network based on nonlinear heat conduction model |
Families Citing this family (4)
| Publication number | Priority date | Publication date | Assignee | Title |
|---|---|---|---|---|
| JP7476136B2 (en) * | 2021-04-22 | 2024-04-30 | 株式会社東芝 | Information processing device, information processing method, and program |
| JP7789022B2 (en) * | 2023-01-10 | 2025-12-19 | 株式会社東芝 | Information processing device, information processing method, and program |
| JP7746315B2 (en) * | 2023-01-10 | 2025-09-30 | 株式会社東芝 | Information processing device, information processing method, and program |
| JP2025066538A (en) * | 2023-10-11 | 2025-04-23 | 株式会社日立製作所 | Information processing device, information processing system, and information processing method |
Family Cites Families (8)
| Publication number | Priority date | Publication date | Assignee | Title |
|---|---|---|---|---|
| JP2001236338A (en) | 2000-02-24 | 2001-08-31 | Kobe Steel Ltd | Device and method for searching for relevant function |
| JP5017941B2 (en) | 2006-06-27 | 2012-09-05 | オムロン株式会社 | Model creation device and identification device |
| JP5573443B2 (en) | 2010-07-14 | 2014-08-20 | ソニー株式会社 | Information processing apparatus, information processing method, and program |
| WO2019050994A1 (en) * | 2017-09-05 | 2019-03-14 | Gritstone Oncology, Inc. | Neoantigen identification for t-cell therapy |
| JP6947981B2 (en) * | 2017-12-21 | 2021-10-13 | 富士通株式会社 | Estimating method, estimation device and estimation program |
| US10531415B2 (en) * | 2018-03-02 | 2020-01-07 | DeepSig Inc. | Learning communication systems using channel approximation |
| US11210965B2 (en) * | 2018-05-17 | 2021-12-28 | Pearson Education, Inc. | Diagnostic analyzer for visual-spatial content |
| CA3133639A1 (en) * | 2019-03-22 | 2020-10-01 | Inflammatix, Inc. | Systems and methods for deriving and optimizing classifiers from multiple datasets |
-
2020
- 2020-11-06 JP JP2020185856A patent/JP7451378B2/en active Active
-
2021
- 2021-09-01 US US17/446,639 patent/US20220147671A1/en active Pending
- 2021-09-02 EP EP21194563.9A patent/EP3996008B1/en active Active
-
2024
- 2024-03-06 JP JP2024033965A patent/JP7661556B2/en active Active
Non-Patent Citations (5)
| Title |
|---|
| BRUNTON STEVEN L. ET AL: "Discovering governing equations from data by sparse identification of nonlinear dynamical systems", PROCEEDINGS OF THE NATIONAL ACADEMY OF SCIENCES, vol. 113, no. 15, 12 April 2016 (2016-04-12), pages 3932 - 3937, XP055895143, ISSN: 0027-8424, [retrieved on 20220224], DOI: 10.1073/pnas.1517384113 * |
| HARSHA VADDIREDDY ET AL: "Feature engineering and symbolic regression methods for detecting hidden physics from sparse sensors", ARXIV.ORG, CORNELL UNIVERSITY LIBRARY, 201 OLIN LIBRARY CORNELL UNIVERSITY ITHACA, NY 14853, 13 November 2019 (2019-11-13), XP081531485 * |
| KATHLEEN CHAMPION ET AL: "Data-driven discovery of coordinates and governing equations", ARXIV.ORG, CORNELL UNIVERSITY LIBRARY, 201 OLIN LIBRARY CORNELL UNIVERSITY ITHACA, NY 14853, 30 March 2019 (2019-03-30), XP081164555 * |
| S. L. BRUNTONJ. L. PROCTORJ. N. KUTZ: "Discovering governing equations from data by sparse identification of nonlinear dynamical systems", PROC. NATL. ACAD. SCI., vol. 113, 2016, pages 3932 - 3937 |
| SONG ZHIHANG ET AL: "Long-term transient thermal analysis using compact models for data center applications", INTERNATIONAL JOURNAL OF HEAT AND MASS TRANSFER, ELSEVIER, AMSTERDAM, NL, vol. 71, 28 December 2013 (2013-12-28), pages 69 - 78, XP028608796, ISSN: 0017-9310, DOI: 10.1016/J.IJHEATMASSTRANSFER.2013.12.007 * |
Cited By (1)
| Publication number | Priority date | Publication date | Assignee | Title |
|---|---|---|---|---|
| CN115865711A (en) * | 2022-11-11 | 2023-03-28 | 西北工业大学 | Method for maximizing reliability of infrastructure network based on nonlinear heat conduction model |
Also Published As
| Publication number | Publication date |
|---|---|
| JP2022075213A (en) | 2022-05-18 |
| JP7661556B2 (en) | 2025-04-14 |
| EP3996008B1 (en) | 2026-03-18 |
| US20220147671A1 (en) | 2022-05-12 |
| JP7451378B2 (en) | 2024-03-18 |
| JP2024056009A (en) | 2024-04-19 |
Similar Documents
| Publication | Publication Date | Title |
|---|---|---|
| EP3996008B1 (en) | Information processing device | |
| JP6562883B2 (en) | Characteristic value estimation device and characteristic value estimation method | |
| TWI444844B (en) | Simulation parameter correction technique | |
| US20220366101A1 (en) | Information processing device, information processing method, and computer program product | |
| EP3195068B1 (en) | Bias estimation apparatus and method and failure diagnosis apparatus and method | |
| WO2018138880A1 (en) | Model parameter value estimation device and estimation method, program, recording medium with program recorded thereto, and model parameter value estimation system | |
| US12007753B2 (en) | System and method for predicting industrial equipment motor behavior | |
| US20230351218A1 (en) | Information processing device, information processing method, and computer program product | |
| JP7476136B2 (en) | Information processing device, information processing method, and program | |
| JPWO2018150798A1 (en) | Model estimation system, method and program | |
| JP6919856B2 (en) | Reinforcement learning programs, reinforcement learning methods, and reinforcement learning devices | |
| US20240220849A1 (en) | Thermal predictive modeling of physical assets | |
| JP7746315B2 (en) | Information processing device, information processing method, and program | |
| CN118228182B (en) | Method and device for evaluating working state of measuring object by using temperature measurement point | |
| Reis et al. | Implementing the Hamiltonian Monte Carlo sampling algorithm in stochastic assessment of power systems | |
| US20240232288A1 (en) | Information processing device, information processing method, and computer program product | |
| TW202441336A (en) | Information processing method, computer program and information processing device | |
| JP7710965B2 (en) | Information processing device, information processing method, and program | |
| Rauh et al. | Linear matrix inequality techniques for the optimization of interval observers for spatially distributed heating systems | |
| JP2021193497A (en) | Relearning necessity determination program, relearning necessity determination method, and information processing apparatus | |
| Bergonzi et al. | Activity homogeneity: a measure for comparing time discretization and state quantization in ODE simulation | |
| US20260118861A1 (en) | Information processing method, computer program, and information processing apparatus | |
| Yan et al. | A novel noise-assisted prognostic method for linear analog circuits | |
| JP2025173366A (en) | Parameter adjustment method for simulation calculation and information processing device for executing parameter adjustment | |
| CN119514300A (en) | A method, device, electronic equipment and storage medium for measuring oil well production |
Legal Events
| Date | Code | Title | Description |
|---|---|---|---|
| PUAI | Public reference made under article 153(3) epc to a published international application that has entered the european phase |
Free format text: ORIGINAL CODE: 0009012 |
|
| STAA | Information on the status of an ep patent application or granted ep patent |
Free format text: STATUS: REQUEST FOR EXAMINATION WAS MADE |
|
| 17P | Request for examination filed |
Effective date: 20210902 |
|
| AK | Designated contracting states |
Kind code of ref document: A1 Designated state(s): AL AT BE BG CH CY CZ DE DK EE ES FI FR GB GR HR HU IE IS IT LI LT LU LV MC MK MT NL NO PL PT RO RS SE SI SK SM TR |
|
| STAA | Information on the status of an ep patent application or granted ep patent |
Free format text: STATUS: EXAMINATION IS IN PROGRESS |
|
| 17Q | First examination report despatched |
Effective date: 20250303 |
|
| GRAP | Despatch of communication of intention to grant a patent |
Free format text: ORIGINAL CODE: EPIDOSNIGR1 |
|
| STAA | Information on the status of an ep patent application or granted ep patent |
Free format text: STATUS: GRANT OF PATENT IS INTENDED |
|
| RIC1 | Information provided on ipc code assigned before grant |
Ipc: G06N 20/00 20190101AFI20250918BHEP Ipc: G06F 1/20 20060101ALN20250918BHEP |
|
| RIC1 | Information provided on ipc code assigned before grant |
Ipc: G06N 20/00 20190101AFI20250924BHEP Ipc: G06F 1/20 20060101ALN20250924BHEP |
|
| RIC1 | Information provided on ipc code assigned before grant |
Ipc: G06N 20/00 20190101AFI20251001BHEP Ipc: G06F 1/20 20060101ALN20251001BHEP |
|
| INTG | Intention to grant announced |
Effective date: 20251008 |
|
| GRAS | Grant fee paid |
Free format text: ORIGINAL CODE: EPIDOSNIGR3 |
|
| GRAA | (expected) grant |
Free format text: ORIGINAL CODE: 0009210 |
|
| STAA | Information on the status of an ep patent application or granted ep patent |
Free format text: STATUS: THE PATENT HAS BEEN GRANTED |
|
| AK | Designated contracting states |
Kind code of ref document: B1 Designated state(s): AL AT BE BG CH CY CZ DE DK EE ES FI FR GB GR HR HU IE IS IT LI LT LU LV MC MK MT NL NO PL PT RO RS SE SI SK SM TR |
|
| REG | Reference to a national code |
Ref country code: CH Ref legal event code: F10 Free format text: ST27 STATUS EVENT CODE: U-0-0-F10-F00 (AS PROVIDED BY THE NATIONAL OFFICE) Effective date: 20260318 Ref country code: GB Ref legal event code: FG4D |
|
| REG | Reference to a national code |
Ref country code: IE Ref legal event code: FG4D |
|
| REG | Reference to a national code |
Ref country code: DE Ref legal event code: R096 Ref document number: 602021050066 Country of ref document: DE |