EP3985390A1 - Biomarker for predicting or classifying severity of rheumatoid arthritis using metabolite analysis - Google Patents
Biomarker for predicting or classifying severity of rheumatoid arthritis using metabolite analysis Download PDFInfo
- Publication number
- EP3985390A1 EP3985390A1 EP20825796.4A EP20825796A EP3985390A1 EP 3985390 A1 EP3985390 A1 EP 3985390A1 EP 20825796 A EP20825796 A EP 20825796A EP 3985390 A1 EP3985390 A1 EP 3985390A1
- Authority
- EP
- European Patent Office
- Prior art keywords
- rheumatoid arthritis
- severity
- disease activity
- group
- kit
- Prior art date
- Legal status (The legal status is an assumption and is not a legal conclusion. Google has not performed a legal analysis and makes no representation as to the accuracy of the status listed.)
- Pending
Links
Images



Classifications
-
- G—PHYSICS
- G01—MEASURING; TESTING
- G01N—INVESTIGATING OR ANALYSING MATERIALS BY DETERMINING THEIR CHEMICAL OR PHYSICAL PROPERTIES
- G01N33/00—Investigating or analysing materials by specific methods not covered by groups G01N1/00 - G01N31/00
- G01N33/48—Biological material, e.g. blood, urine; Haemocytometers
- G01N33/50—Chemical analysis of biological material, e.g. blood, urine; Testing involving biospecific ligand binding methods; Immunological testing
-
- G—PHYSICS
- G01—MEASURING; TESTING
- G01N—INVESTIGATING OR ANALYSING MATERIALS BY DETERMINING THEIR CHEMICAL OR PHYSICAL PROPERTIES
- G01N33/00—Investigating or analysing materials by specific methods not covered by groups G01N1/00 - G01N31/00
- G01N33/48—Biological material, e.g. blood, urine; Haemocytometers
- G01N33/50—Chemical analysis of biological material, e.g. blood, urine; Testing involving biospecific ligand binding methods; Immunological testing
- G01N33/68—Chemical analysis of biological material, e.g. blood, urine; Testing involving biospecific ligand binding methods; Immunological testing involving proteins, peptides or amino acids
- G01N33/6893—Chemical analysis of biological material, e.g. blood, urine; Testing involving biospecific ligand binding methods; Immunological testing involving proteins, peptides or amino acids related to diseases not provided for elsewhere
-
- G—PHYSICS
- G01—MEASURING; TESTING
- G01N—INVESTIGATING OR ANALYSING MATERIALS BY DETERMINING THEIR CHEMICAL OR PHYSICAL PROPERTIES
- G01N30/00—Investigating or analysing materials by separation into components using adsorption, absorption or similar phenomena or using ion-exchange, e.g. chromatography or field flow fractionation
- G01N30/02—Column chromatography
- G01N30/62—Detectors specially adapted therefor
- G01N30/72—Mass spectrometers
-
- G—PHYSICS
- G01—MEASURING; TESTING
- G01N—INVESTIGATING OR ANALYSING MATERIALS BY DETERMINING THEIR CHEMICAL OR PHYSICAL PROPERTIES
- G01N30/00—Investigating or analysing materials by separation into components using adsorption, absorption or similar phenomena or using ion-exchange, e.g. chromatography or field flow fractionation
- G01N30/02—Column chromatography
- G01N30/88—Integrated analysis systems specially adapted therefor, not covered by a single one of the groups G01N30/04 - G01N30/86
-
- G—PHYSICS
- G01—MEASURING; TESTING
- G01N—INVESTIGATING OR ANALYSING MATERIALS BY DETERMINING THEIR CHEMICAL OR PHYSICAL PROPERTIES
- G01N33/00—Investigating or analysing materials by specific methods not covered by groups G01N1/00 - G01N31/00
- G01N33/48—Biological material, e.g. blood, urine; Haemocytometers
- G01N33/50—Chemical analysis of biological material, e.g. blood, urine; Testing involving biospecific ligand binding methods; Immunological testing
- G01N33/68—Chemical analysis of biological material, e.g. blood, urine; Testing involving biospecific ligand binding methods; Immunological testing involving proteins, peptides or amino acids
- G01N33/6803—General methods of protein analysis not limited to specific proteins or families of proteins
- G01N33/6848—Methods of protein analysis involving mass spectrometry
-
- G—PHYSICS
- G01—MEASURING; TESTING
- G01N—INVESTIGATING OR ANALYSING MATERIALS BY DETERMINING THEIR CHEMICAL OR PHYSICAL PROPERTIES
- G01N30/00—Investigating or analysing materials by separation into components using adsorption, absorption or similar phenomena or using ion-exchange, e.g. chromatography or field flow fractionation
- G01N30/02—Column chromatography
- G01N30/88—Integrated analysis systems specially adapted therefor, not covered by a single one of the groups G01N30/04 - G01N30/86
- G01N2030/8809—Integrated analysis systems specially adapted therefor, not covered by a single one of the groups G01N30/04 - G01N30/86 analysis specially adapted for the sample
- G01N2030/8813—Integrated analysis systems specially adapted therefor, not covered by a single one of the groups G01N30/04 - G01N30/86 analysis specially adapted for the sample biological materials
-
- G—PHYSICS
- G01—MEASURING; TESTING
- G01N—INVESTIGATING OR ANALYSING MATERIALS BY DETERMINING THEIR CHEMICAL OR PHYSICAL PROPERTIES
- G01N2800/00—Detection or diagnosis of diseases
- G01N2800/10—Musculoskeletal or connective tissue disorders
- G01N2800/101—Diffuse connective tissue disease, e.g. Sjögren, Wegener's granulomatosis
- G01N2800/102—Arthritis; Rheumatoid arthritis, i.e. inflammation of peripheral joints
-
- G—PHYSICS
- G01—MEASURING; TESTING
- G01N—INVESTIGATING OR ANALYSING MATERIALS BY DETERMINING THEIR CHEMICAL OR PHYSICAL PROPERTIES
- G01N2800/00—Detection or diagnosis of diseases
- G01N2800/56—Staging of a disease; Further complications associated with the disease
Definitions
- the present invention relates to metabolite biomarkers for predicting or classifying the severity of rheumatoid arthritis using the analysis of a synovial fluid metabolite.
- Rheumatoid arthritis is a representative chronic disease which occurs due to inflammation in tissue such as the synovial membrane surrounding the joint, and is estimated to affect 1% of the total population in Korea ( McInnes I. B. and Schett G. The pathogenesis of rheumatoid arthritis (2011) N Engl J Med vol. 365, pp. 2205-2219 ).
- Synovial fluid does not only act as a biological lubricant in joints, but also acts as a fluid through which nutrients and various cytokines pass. Therefore, inflammation in the joint synovial membrane and cartilage or enzyme-mediated degradation causes a change in chemical composition of the synovial fluid.
- synovial fluid is considered as a sample that best reflects the etiological condition of inflammatory arthritis ( O'Connel J. X. Pathology of the synovium (2000) Am J Clin Pathol vol. 114, pp. 773-784 ).
- the analysis of synovial fluid in a rheumatoid arthritis patient may be applied to clinical practice by providing a biomarker for diagnosis, or helping to understand the etiology of rheumatoid arthritis.
- a drug treatment method in which an analgesic/anti-inflammatory is administered in combination with various anti-rheumatoid drugs is generally used; a biotherapeutic agent has been recently developed, and is being used in combination therapy with an anti-rheumatoid drug; and when a disease has high severity, surgery is performed.
- a treatment method may have persistent joint deformation and difficulty in appropriate treatment due to drug side effects.
- Metabolomics is a study that examines a change in overall metabolites according to a metabolic change in the body, and is used to identify various physiological and pathological conditions ( Johnson C. H. et. al. Metabolomics: beyond biomarkers and towards mechanisms (2016) Nat Rev Mol Cell Biol vol. 17, pp. 451-459 ). Since RA is caused by the action of various factors including genetic and environmental factors, a change in metabolic material may be induced, and metabolomics may be useful for revealing physiological and pathological changes.
- a biomarker capable of differentiating between other arthritis patients and a rheumatoid arthritis patient has been reported in the non-patent literature ( Kim S. et. al. Global metabolite profiling of synovial fluid for the specific diagnosis of rheumatoid arthritis from other inflammatory arthritis (2014) PLOS ONE vol. 9(6), e97501 ), but the present invention is characterized in that it relates to a biomarker for predicting or classifying the severity of a RA patient.
- the inventors examined how a metabolic profile changes according to severity in the synovial fluid of a rheumatoid arthritis patient through metabolomics, suggested a metabolite marker indicating severity, and discovered a novel biomarker capable of more specifically classifying the severity of patients.
- the synovial fluid of a rheumatoid arthritis patient was collected, and a total of 125 metabolites were detected by the analysis of metabolites in the synovial fluid of the rheumatoid arthritis patient by GC/TOF MS. Based on this, the analysis was correlated with the patient's severity level (DAS28-ESR).
- the severity of each patient was calculated by DAS28-ESR, and metabolites that statistically significantly increase or decrease according to the increase in severity were found by obtaining the Spearman's rank correlation coefficient, which is a non-parametric correlation analysis.
- 14 metabolites with a p-value of less than 0.05 were selected as candidates for novel biomarkers.
- a multivariate statistical method-based orthogonal partial least squares discriminant analysis (OPLS-DA) model was made using the 14 candidates for novel biomarkers indicating the severity of the rheumatoid arthritis patients, thereby making it possible to distinguish between a high disease activity group and a moderate disease activity group.
- OPLS-DA orthogonal partial least squares discriminant analysis
- a severity diagnostic model can be also applied to diagnose the severity of an external sample, it was confirmed that the severity can be exactly determined by analyzing metabolites in synovial fluid samples obtained from 10 patients and applying them to the model, and the model was verified.
- the present invention is directed to providing a kit for classifying rheumatoid arthritis patients into a high disease activity group and a moderate disease activity group.
- the present invention is also directed to providing a kit for predicting the severity of a rheumatoid arthritis patient.
- the present invention provides a kit for classifying rheumatoid arthritis patients into a high disease activity group and a moderate disease activity group, which includes a quantification device for one or more synovial fluid metabolites selected from the group consisting of indole-3-lactate, glucose-6-phosphate, fucose, isothreonate, 3-phenyllactate, guaiacol, glycocyamine, adipate, phenylalanine, arabitol, cholic acid and tryptophan.
- a quantification device for one or more synovial fluid metabolites selected from the group consisting of indole-3-lactate, glucose-6-phosphate, fucose, isothreonate, 3-phenyllactate, guaiacol, glycocyamine, adipate, phenylalanine, arabitol, cholic acid and tryptophan.
- the present invention provides a kit for predicting the severity of a rheumatoid arthritis patient, which includes a quantification device for one or more synovial fluid metabolites selected from the group consisting of indole-3-lactate, glucose-6-phosphate, fucose, isothreonate, 3-phenyllactate, guaiacol, glycocyamine, adipate, phenylalanine, arabitol, cholic acid and tryptophan.
- a quantification device for one or more synovial fluid metabolites selected from the group consisting of indole-3-lactate, glucose-6-phosphate, fucose, isothreonate, 3-phenyllactate, guaiacol, glycocyamine, adipate, phenylalanine, arabitol, cholic acid and tryptophan.
- a biomarker that can specifically predict or classify the severity of rheumatoid arthritis using metabolomics was identified.
- Such a biomarker for predicting or classifying severity can be applied in various forms, such as a severity classification kit for predicting severity or classifying into high disease activity and moderate disease activity.
- the present invention can be applied in novel drug development targeting a biomarker specific for the severity of rheumatoid arthritis, and by using a biomarker specific for the severity of rheumatoid arthritis, the pathogenesis of rheumatoid arthritis can be more accurately identified, and based on this, can be used in novel drug development and as a tool for screening novel drug candidates.
- severity can be determined with the concentration of a specific metabolite for a patient suspected of or diagnosed with rheumatoid arthritis so it can be applied in customized early treatment for rheumatoid arthritis.
- the present invention relates to a kit for predicting the severity of rheumatoid arthritis patients and/or a kit for classifying rheumatoid arthritis patients into a high disease activity group and a moderate disease activity group.
- DAS Disease Activity Score
- DAS28 modified form Disease Activity Score 28
- DAS28 is a comprehensive index consisting of the number of joints with tenderness and the number of joints with swelling among 28 joints of a patient, an erythrocyte sedimentation rate and a patient's systemic evaluation, and the 28 joints include both shoulder joints, elbow and wrist joints, metacarpophalangeal joints, proximal interphalangeal joints and knee joints.
- the discrimination of the severity of a disease using DAS28 is performed by a DAS28-ESR score based on an erythrocyte sedimentation rate and a DAS28-CRP score calculated based on the activity index of a C-reactive protein, and particularly, a DAS28-ESR(3) score calculating the severity of a disease using a DAS28-ESR score, a tender joint count and a swollen joint count, omitting other comprehensive examinations on a patient, is widely used (https://www.mdcalc.com/disease-activity-score-28-rheumatoid-arthritis-esr-das28-esr).
- the rheumatoid arthritis disease activity investigated by the DAS28-ESR(3) score may be calculated from 0 to a maximum of 9.4, and generally, when the DAS28 score is less than 2.6, it is defined as remission, when the score is 2.6 or more and less than 3.2, it is defined as low disease activity (mild), when the score is 3.2 or more and less than 5.1, it is defined as moderate disease activity (moderate), and when the score is 5.1 or more, it is defined as high disease activity (high).
- the present invention can easily predict the future severity of a disease of a patient, and it may be decided to use an additionally required therapeutic method so it can be used as information for delaying, alleviating and/or curing a disease after the onset of rheumatoid arthritis.
- a metabolite sampling step including extracting a metabolite by mixing pure methanol with synovial fluid, strongly vortexing the mixture and then performing centrifugation is included.
- methanol As a solvent used for extraction of the metabolite, methanol may be used, but the present invention is not particularly limited thereto.
- the 125 metabolites include amines, amino acids, sugars, sugar alcohols, fatty acids, phosphates and organic acids.
- the metabolite extracted in the metabolite sampling step undergoes the following analysis steps:
- the total analysis time is divided by a unit time interval, and the largest value of the areas or heights of chromatogram peaks shown during the unit time is determined as a representative value during the unit time.
- PLS-DA partial least squares discriminant analysis
- a positive loading value of PLS-DA is determined as an increasing tendency of a metabolite biomarker, and a negative loading value thereof is determined as a decreasing tendency of a metabolite biomarker.
- a biomarker for distinguishing metabolites of a high rheumatoid arthritis activity group and a moderate rheumatoid arthritis activity group one or more metabolites selected from the group consisting of indole-3-lactate, glucose-6-phosphate, fucose, isothreonate, 3-phenyllactate, guaiacol, glycocyamine, adipate, phenylalanine, arabitol, cholic acid and tryptophan may be used.
- one or more metabolites selected from the group consisting of indole-3-lactate, glucose-6-phosphate, fucose, isothreonate, 3-phenyllactate, guaiacol, glycocyamine, adipate, phenylalanine, arabitol, cholic acid and tryptophan show an increasing tendency, and citrate and asparagine show a decreasing tendency.
- the moderate disease activity group among the biomarkers, one or more metabolites selected from the group consisting of indole-3-lactate, glucose-6-phosphate, fucose, isothreonate, 3-phenyllactate, guaiacol, glycocyamine, adipate, phenylalanine, arabitol, cholic acid and tryptophan show a decreasing tendency, and citrate and asparagine show an increasing tendency.
- the increasing or decreasing tendency means an increase or decrease in metabolite concentration
- the term "increase in metabolite concentration” means that the metabolite concentration in the high disease activity group of rheumatoid arthritis patients, compared to the moderate disease activity group, or in the moderate disease activity group of rheumatoid arthritis patients, compared to the high disease activity is significantly increased to a measurable degree
- the term "decrease in metabolite concentration” used herein means that the metabolite concentration is significantly decreased in the high disease activity group of rheumatoid arthritis patients, compared to the moderate disease activity group thereof, or in the moderate disease activity group of rheumatoid arthritis patients, compared to the high disease activity group thereof.
- the present invention provides a kit for classifying rheumatoid arthritis patients into a high disease activity group and a moderate disease activity group, which includes a quantification device for one or more metabolites selected from the group consisting of indole-3-lactate, citrate, glucose-6-phosphate, fucose, isothreonate, 3-phenyllactate, guaiacol, glycocyamine, adipate, phenylalanine, arabitol, asparagine, cholic acid, and tryptophan
- a metabolite biomarker showing a statistically significant increase/decrease is selected, analyzed and verified by analysis using Spearman's rank correlation coefficient (Spearman R), which is a nonparametric statistical analysis method for correlation between two variables for obtaining the correlation between the DAS-28 ESR (3) score and the intensity of a metabolite obtained in Example 1.
- Spearman R Spearman's rank correlation coefficient
- a positive Spearman R value shows the tendency of increasing the intensity of a metabolite biomarker according to the increase in disease severity
- a negative Spearman R value shows the tendency of decreasing the intensity of a metabolite biomarker according to the increase in disease severity
- one or more metabolites selected from the group consisting of indole-3-lactate, citrate, glucose-6-phosphate, fucose, isothreonate, 3-phenyllactate, guaiacol, glycocyamine, adipate, phenylalanine, arabitol, asparagine, cholic acid and tryptophan may be used.
- one or more selected from the group consisting of citrate and asparagine show a decreasing tendency according to an increase in severity
- one or more selected from the group consisting of indole-3-lactate, citrate, glucose-6-phosphate, fucose, isothreonate, 3-phenyllactate, guaiacol, glycocyamine, adipate, phenylalanine, arabitol, asparagine, cholic acid and tryptophan show an increasing tendency.
- the increasing or decreasing tendency means an increase or decrease in metabolite concentration
- the term “increase in metabolite concentration” means that the metabolite concentration is significantly increased to a measurable level according to the increase in the severity of a rheumatoid arthritis patient
- the term “decrease in metabolite concentration” used herein means that the metabolite concentration is significantly decreased to a measurable level according to the increase in the severity of a rheumatoid arthritis patient.
- the quantification device included in the kit of the present invention may be an instrument for chromatography/mass spectrometry.
- gas chromatography liquid-solid chromatography (LSC), paper chromatography (PC), thin-layer chromatography (TLC), gas-solid chromatography (GSC), liquid-liquid chromatography (LLC), foam chromatography (FC), emulsion chromatography (EC), gas-liquid chromatography (GLC), ion chromatography (IC), gel filtration chromatography (GFC) or gel permeation chromatography (GPC)
- the instrument may be an instrument for gas chromatography/time-of-flight mass spectrometry (GC/TOF MS).
- Each component of the metabolite of the present invention is isolated by gas chromatography, and using information obtained by TOF MS, the components are identified not only through exact molecular weight data but also elemental composition.
- Example 1 Identification of metabolite of synovial fluid from rheumatoid arthritis patient using GC/TOF MS
- Synovial fluids were collected from 30 rheumatoid arthritis patients, 900 ⁇ l of pure methanol was added to 100 ⁇ l of each synovial fluid sample and strongly vortexed, and then metabolites were extracted from 40 different samples by centrifugation.
- a column used in analysis was an RTX-5Sil MS capillary column (length: 30 m, film thickness: 0.25 mm, and inner diameter: 25 mm), and a GC column temperature condition included maintenance at 50 °C for 5 minutes, an increase in temperature to 330 °C, and then maintenance for 1 minute.
- 1 ⁇ L of a sample was injected into GC in splitless mode.
- a transfer line temperature and an ion source temperature were maintained at 280 °C and 250 °C, respectively.
- 125 metabolites were identified from a library containing GC/TOF MS results (Table 1).
- the metabolites were classified by group, such as organic acids (20.8%), amino acids (21.6%), sugars (18.4%), fatty acids (14.4%), amines (11.2%), phosphates (5.6%), and miscellaneous (7.9%).
- Example 2 Analysis of correlation between rheumatoid arthritis severity and metabolites using Spearman's rank correlation coefficient and suggestion of biomarker for classifying potential severity
- a DAS-28 ESR (3) score indicating severity was calculated from 30 rheumatoid arthritis patients, and how this score correlated with the metabolite intensity of each patient was analyzed using Spearman's rank correlation coefficient (Table 2).
- the Spearman's rank correlation coefficient is a statistical method for analyzing the correlation between two different variables, and here, it was applied to examine whether the metabolite which was at a high or low level in patients with moderate disease activity was statistically significantly increased or decreased in patients with high disease activity.
- t(N-2) represents a relative value statistically calculated in correlation analysis using Spearman R
- the p-value represents the confidence interval showing how much each metabolite statistically significantly increased or decreased according to the increase in DAS-28 ESR (3) score.
- the increase/decrease of metabolites according to the increase in DAS-28 ESR (3) score is statistically significant when the p-value is at a level of less than 0.05.
- Example 3 Establishment of diagnostic models for severity classification based on OPLS-DA multivariate models created using 14 potential biomarkers
- samples were divided into a high disease activity group and a moderate disease activity group according to the DAS28-ESR(3) score of each patient.
- the DAS-ESR(3) score was 5.1 or more, the sample was classified as a high disease activity group, and when the DAS-ESR(3) score was less than 5.1, the sample was classified as a moderate disease activity group.
- FIG. 1A is a PLS-DA score plot, in which a patient of the moderate disease activity group has a positive value for PC1, and a patient of the high disease activity group has a negative value for PC2, showing that synovial fluid samples from patients were clearly classified according to the intensity of 14 metabolites except one sample from the patient with moderate disease activity.
- FIG. 1A is a PLS-DA score plot, in which a patient of the moderate disease activity group has a positive value for PC1, and a patient of the high disease activity group has a negative value for PC2, showing that synovial fluid samples from patients were clearly classified according to the intensity of 14 metabolites except one sample from the patient with moderate disease activity.
- FIG. 1B is an OPLS-DA loading plot, showing the contributions of each metabolite to model formation as a positive or negative value.
- FIG. 1C shows the result of permutation tests for OPLS-DA models, showing that an OPLS-DA model differentiating between a high disease activity group and a moderate disease activity group is statistically significant.
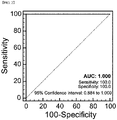
- ROC receiver operating characteristic
- the sensitivity was 100%
- the 1-specificity was 100%
- the AUC value was 1.000, showing that the model is very suitable for diagnosis of the severity of rheumatoid arthritis patients ( FIG. 2 ).
- the model of FIG. 1 is an OPLS-DA model showing a negative value based on PC1 in the case of a patient with high disease activity and a positive value based on PC1 in the case of a patient with moderate disease activity when the intensity of the 14 metabolites extracted from the synovial fluid samples of the rheumatoid arthritis patients were input.
- 10 external samples show negative or positive values based on PC1 according to the severity, and may be determined to have the high disease activity or moderate disease activity.
Landscapes
- Life Sciences & Earth Sciences (AREA)
- Health & Medical Sciences (AREA)
- Engineering & Computer Science (AREA)
- Immunology (AREA)
- Chemical & Material Sciences (AREA)
- Physics & Mathematics (AREA)
- Molecular Biology (AREA)
- General Health & Medical Sciences (AREA)
- Pathology (AREA)
- General Physics & Mathematics (AREA)
- Biochemistry (AREA)
- Analytical Chemistry (AREA)
- Hematology (AREA)
- Biomedical Technology (AREA)
- Urology & Nephrology (AREA)
- Food Science & Technology (AREA)
- Medicinal Chemistry (AREA)
- Cell Biology (AREA)
- Biotechnology (AREA)
- Microbiology (AREA)
- Proteomics, Peptides & Aminoacids (AREA)
- Bioinformatics & Cheminformatics (AREA)
- Bioinformatics & Computational Biology (AREA)
- Spectroscopy & Molecular Physics (AREA)
- Biophysics (AREA)
- Investigating Or Analysing Biological Materials (AREA)
- Other Investigation Or Analysis Of Materials By Electrical Means (AREA)
Abstract
Description
- The present invention relates to metabolite biomarkers for predicting or classifying the severity of rheumatoid arthritis using the analysis of a synovial fluid metabolite.
- Rheumatoid arthritis (RA) is a representative chronic disease which occurs due to inflammation in tissue such as the synovial membrane surrounding the joint, and is estimated to affect 1% of the total population in Korea (McInnes I. B. and Schett G. The pathogenesis of rheumatoid arthritis (2011) N Engl J Med vol. 365, pp. 2205-2219). Synovial fluid does not only act as a biological lubricant in joints, but also acts as a fluid through which nutrients and various cytokines pass. Therefore, inflammation in the joint synovial membrane and cartilage or enzyme-mediated degradation causes a change in chemical composition of the synovial fluid. In addition, the synovial fluid is considered as a sample that best reflects the etiological condition of inflammatory arthritis (O'Connel J. X. Pathology of the synovium (2000) Am J Clin Pathol vol. 114, pp. 773-784).
- Therefore, the analysis of synovial fluid in a rheumatoid arthritis patient may be applied to clinical practice by providing a biomarker for diagnosis, or helping to understand the etiology of rheumatoid arthritis.
- In addition, as a therapeutic method for rheumatoid arthritis, in order to minimize joint damage, prevent loss of function and reduce pain, a drug treatment method in which an analgesic/anti-inflammatory is administered in combination with various anti-rheumatoid drugs is generally used; a biotherapeutic agent has been recently developed, and is being used in combination therapy with an anti-rheumatoid drug; and when a disease has high severity, surgery is performed. However, despite a very excellent effect, such a treatment method may have persistent joint deformation and difficulty in appropriate treatment due to drug side effects. Moreover, since there is a disadvantage of incurring a high cost due to an increase in drug price according to the cost of developing a new drug, there is an urgent need to develop a kit capable of predicting or classifying the severity of rheumatoid arthritis.
- Metabolomics is a study that examines a change in overall metabolites according to a metabolic change in the body, and is used to identify various physiological and pathological conditions (Johnson C. H. et. al. Metabolomics: beyond biomarkers and towards mechanisms (2016) Nat Rev Mol Cell Biol vol. 17, pp. 451-459). Since RA is caused by the action of various factors including genetic and environmental factors, a change in metabolic material may be induced, and metabolomics may be useful for revealing physiological and pathological changes.
- A biomarker capable of differentiating between other arthritis patients and a rheumatoid arthritis patient has been reported in the non-patent literature (Kim S. et. al. Global metabolite profiling of synovial fluid for the specific diagnosis of rheumatoid arthritis from other inflammatory arthritis (2014) PLOS ONE vol. 9(6), e97501), but the present invention is characterized in that it relates to a biomarker for predicting or classifying the severity of a RA patient.
- The inventors examined how a metabolic profile changes according to severity in the synovial fluid of a rheumatoid arthritis patient through metabolomics, suggested a metabolite marker indicating severity, and discovered a novel biomarker capable of more specifically classifying the severity of patients.
- The synovial fluid of a rheumatoid arthritis patient was collected, and a total of 125 metabolites were detected by the analysis of metabolites in the synovial fluid of the rheumatoid arthritis patient by GC/TOF MS. Based on this, the analysis was correlated with the patient's severity level (DAS28-ESR).
- First, the severity of each patient was calculated by DAS28-ESR, and metabolites that statistically significantly increase or decrease according to the increase in severity were found by obtaining the Spearman's rank correlation coefficient, which is a non-parametric correlation analysis. Here, 14 metabolites with a p-value of less than 0.05 were selected as candidates for novel biomarkers.
- A multivariate statistical method-based orthogonal partial least squares discriminant analysis (OPLS-DA) model was made using the 14 candidates for novel biomarkers indicating the severity of the rheumatoid arthritis patients, thereby making it possible to distinguish between a high disease activity group and a moderate disease activity group.
- In addition, to confirm whether a severity diagnostic model can be also applied to diagnose the severity of an external sample, it was confirmed that the severity can be exactly determined by analyzing metabolites in synovial fluid samples obtained from 10 patients and applying them to the model, and the model was verified.
- Therefore, the present invention is directed to providing a kit for classifying rheumatoid arthritis patients into a high disease activity group and a moderate disease activity group.
- The present invention is also directed to providing a kit for predicting the severity of a rheumatoid arthritis patient.
- The present invention provides a kit for classifying rheumatoid arthritis patients into a high disease activity group and a moderate disease activity group, which includes a quantification device for one or more synovial fluid metabolites selected from the group consisting of indole-3-lactate, glucose-6-phosphate, fucose, isothreonate, 3-phenyllactate, guaiacol, glycocyamine, adipate, phenylalanine, arabitol, cholic acid and tryptophan.
- In addition, the present invention provides a kit for predicting the severity of a rheumatoid arthritis patient, which includes a quantification device for one or more synovial fluid metabolites selected from the group consisting of indole-3-lactate, glucose-6-phosphate, fucose, isothreonate, 3-phenyllactate, guaiacol, glycocyamine, adipate, phenylalanine, arabitol, cholic acid and tryptophan.
- Through the present invention, a biomarker that can specifically predict or classify the severity of rheumatoid arthritis using metabolomics was identified. Such a biomarker for predicting or classifying severity can be applied in various forms, such as a severity classification kit for predicting severity or classifying into high disease activity and moderate disease activity.
- Therefore, the present invention can be applied in novel drug development targeting a biomarker specific for the severity of rheumatoid arthritis, and by using a biomarker specific for the severity of rheumatoid arthritis, the pathogenesis of rheumatoid arthritis can be more accurately identified, and based on this, can be used in novel drug development and as a tool for screening novel drug candidates.
- In addition, since customized early treatment is possible according to classification and prediction of rheumatoid arthritis, severity can be determined with the concentration of a specific metabolite for a patient suspected of or diagnosed with rheumatoid arthritis so it can be applied in customized early treatment for rheumatoid arthritis.
-
-
FIG. 1 shows diagnostic models (a: score plot; b: loading plot; c: permutation tests) by comparing rheumatoid arthritis patients between a high disease activity group (RA_high) and a moderate disease activity group (RA_moderate) using OPLS-DA generated based on 14 potential biomarkers for distinguishing severity. -
FIG. 2 shows statistical verification on an OPLS-DA model for diagnosing the severity of rheumatoid arthritis patients using an ROC curve. -
FIG. 3 shows severity diagnosis verification of an OPLS-DA model for diagnosing the severity of rheumatoid arthritis patients using foreign specimens. - Hereinafter, the present invention will be described in further detail.
- The present invention relates to a kit for predicting the severity of rheumatoid arthritis patients and/or a kit for classifying rheumatoid arthritis patients into a high disease activity group and a moderate disease activity group.
- The term "prediction of the prognosis of the severity of rheumatoid arthritis" used herein is associated with the possibility of bone destruction or joint deformation due to high disease activity when the overall degree of inflammation, bone destruction in rheumatoid arthritis patients, or the progression of rheumatoid arthritis was evaluated. Disease Activity Score (DAS) or its modified form Disease Activity Score 28 (DAS28), which are representative methods for measuring disease severity of rheumatoid arthritis in conventional clinical practices, are score calculation-based index assessment methods, and assess subjective factors evaluated by patients and doctors along with objective factors such as inflammation marker tests or radiographic findings. DAS28 is a comprehensive index consisting of the number of joints with tenderness and the number of joints with swelling among 28 joints of a patient, an erythrocyte sedimentation rate and a patient's systemic evaluation, and the 28 joints include both shoulder joints, elbow and wrist joints, metacarpophalangeal joints, proximal interphalangeal joints and knee joints.
- The discrimination of the severity of a disease using DAS28 is performed by a DAS28-ESR score based on an erythrocyte sedimentation rate and a DAS28-CRP score calculated based on the activity index of a C-reactive protein, and particularly, a DAS28-ESR(3) score calculating the severity of a disease using a DAS28-ESR score, a tender joint count and a swollen joint count, omitting other comprehensive examinations on a patient, is widely used (https://www.mdcalc.com/disease-activity-score-28-rheumatoid-arthritis-esr-das28-esr).
- The rheumatoid arthritis disease activity investigated by the DAS28-ESR(3) score may be calculated from 0 to a maximum of 9.4, and generally, when the DAS28 score is less than 2.6, it is defined as remission, when the score is 2.6 or more and less than 3.2, it is defined as low disease activity (mild), when the score is 3.2 or more and less than 5.1, it is defined as moderate disease activity (moderate), and when the score is 5.1 or more, it is defined as high disease activity (high).
- The present invention can easily predict the future severity of a disease of a patient, and it may be decided to use an additionally required therapeutic method so it can be used as information for delaying, alleviating and/or curing a disease after the onset of rheumatoid arthritis.
- According to one embodiment of the present invention, a metabolite sampling step including extracting a metabolite by mixing pure methanol with synovial fluid, strongly vortexing the mixture and then performing centrifugation is included.
- As a solvent used for extraction of the metabolite, methanol may be used, but the present invention is not particularly limited thereto.
- The 125 metabolites include amines, amino acids, sugars, sugar alcohols, fatty acids, phosphates and organic acids.
- The metabolite extracted in the metabolite sampling step undergoes the following analysis steps:
- analyzing the extracted metabolite using a gas chromatography/time-of-flight mass spectrometry (GC/TOF) instrument;
- converting the GC/TOF MS analysis result into a statistically processable value; and
- statistically verifying the distinction between the two biological sample groups using the converted value.
- That is, in the step of converting the GC/TOF MS analysis result into a statistically processable value, the total analysis time is divided by a unit time interval, and the largest value of the areas or heights of chromatogram peaks shown during the unit time is determined as a representative value during the unit time.
- Subsequently, to compare the profiling difference between metabolites, partial least squares discriminant analysis (PLS-DA) is performed to select, analyze and verify a metabolite biomarker showing a significant difference between two biological sample groups.
- A positive loading value of PLS-DA is determined as an increasing tendency of a metabolite biomarker, and a negative loading value thereof is determined as a decreasing tendency of a metabolite biomarker.
- According to one embodiment of the present invention, as a biomarker for distinguishing metabolites of a high rheumatoid arthritis activity group and a moderate rheumatoid arthritis activity group, one or more metabolites selected from the group consisting of indole-3-lactate, glucose-6-phosphate, fucose, isothreonate, 3-phenyllactate, guaiacol, glycocyamine, adipate, phenylalanine, arabitol, cholic acid and tryptophan may be used.
- In the high disease activity group, among the biomarkers, one or more metabolites selected from the group consisting of indole-3-lactate, glucose-6-phosphate, fucose, isothreonate, 3-phenyllactate, guaiacol, glycocyamine, adipate, phenylalanine, arabitol, cholic acid and tryptophan show an increasing tendency, and citrate and asparagine show a decreasing tendency.
- On the other hand, in the moderate disease activity group, among the biomarkers, one or more metabolites selected from the group consisting of indole-3-lactate, glucose-6-phosphate, fucose, isothreonate, 3-phenyllactate, guaiacol, glycocyamine, adipate, phenylalanine, arabitol, cholic acid and tryptophan show a decreasing tendency, and citrate and asparagine show an increasing tendency.
- The increasing or decreasing tendency means an increase or decrease in metabolite concentration, and the term "increase in metabolite concentration" means that the metabolite concentration in the high disease activity group of rheumatoid arthritis patients, compared to the moderate disease activity group, or in the moderate disease activity group of rheumatoid arthritis patients, compared to the high disease activity is significantly increased to a measurable degree, and the term "decrease in metabolite concentration" used herein means that the metabolite concentration is significantly decreased in the high disease activity group of rheumatoid arthritis patients, compared to the moderate disease activity group thereof, or in the moderate disease activity group of rheumatoid arthritis patients, compared to the high disease activity group thereof.
- Therefore, the present invention provides a kit for classifying rheumatoid arthritis patients into a high disease activity group and a moderate disease activity group, which includes a quantification device for one or more metabolites selected from the group consisting of indole-3-lactate, citrate, glucose-6-phosphate, fucose, isothreonate, 3-phenyllactate, guaiacol, glycocyamine, adipate, phenylalanine, arabitol, asparagine, cholic acid, and tryptophan
- Subsequently, to find a metabolite which significantly increases/decreases depending on an increase in the severity of rheumatoid arthritis, a metabolite biomarker showing a statistically significant increase/decrease is selected, analyzed and verified by analysis using Spearman's rank correlation coefficient (Spearman R), which is a nonparametric statistical analysis method for correlation between two variables for obtaining the correlation between the DAS-28 ESR (3) score and the intensity of a metabolite obtained in Example 1.
- A positive Spearman R value shows the tendency of increasing the intensity of a metabolite biomarker according to the increase in disease severity, and a negative Spearman R value shows the tendency of decreasing the intensity of a metabolite biomarker according to the increase in disease severity.
- According to one embodiment of the present invention, as a biomarker for predicting the severity of rheumatoid arthritis, one or more metabolites selected from the group consisting of indole-3-lactate, citrate, glucose-6-phosphate, fucose, isothreonate, 3-phenyllactate, guaiacol, glycocyamine, adipate, phenylalanine, arabitol, asparagine, cholic acid and tryptophan may be used.
- Among the biomarkers, one or more selected from the group consisting of citrate and asparagine show a decreasing tendency according to an increase in severity, and one or more selected from the group consisting of indole-3-lactate, citrate, glucose-6-phosphate, fucose, isothreonate, 3-phenyllactate, guaiacol, glycocyamine, adipate, phenylalanine, arabitol, asparagine, cholic acid and tryptophan show an increasing tendency.
- The increasing or decreasing tendency means an increase or decrease in metabolite concentration, the term "increase in metabolite concentration" means that the metabolite concentration is significantly increased to a measurable level according to the increase in the severity of a rheumatoid arthritis patient, and the term "decrease in metabolite concentration" used herein means that the metabolite concentration is significantly decreased to a measurable level according to the increase in the severity of a rheumatoid arthritis patient.
- The quantification device included in the kit of the present invention may be an instrument for chromatography/mass spectrometry. Specifically, gas chromatography, liquid-solid chromatography (LSC), paper chromatography (PC), thin-layer chromatography (TLC), gas-solid chromatography (GSC), liquid-liquid chromatography (LLC), foam chromatography (FC), emulsion chromatography (EC), gas-liquid chromatography (GLC), ion chromatography (IC), gel filtration chromatography (GFC) or gel permeation chromatography (GPC) may be used, but the present invention is not limited thereto, and thus any chromatography for quantification, which is conventionally used in the art, may be used. More specifically, the instrument may be an instrument for gas chromatography/time-of-flight mass spectrometry (GC/TOF MS).
- Each component of the metabolite of the present invention is isolated by gas chromatography, and using information obtained by TOF MS, the components are identified not only through exact molecular weight data but also elemental composition.
- Hereinafter, the present invention will be described in further detail with reference to examples according to the present invention, but the scope of the present invention is not limited by the following examples .
- Synovial fluids were collected from 30 rheumatoid arthritis patients, 900 µl of pure methanol was added to 100 µl of each synovial fluid sample and strongly vortexed, and then metabolites were extracted from 40 different samples by centrifugation.
- A derivatization process for GC/TOF MS analysis is as follows.
- After drying the extracted sample with a speed bag, 5 µl of 40%(w/v) O-methylhydroxylamine hydrochloride in pyridine was added, and reacted at 30 °C and 200 rpm for 90 minutes. In addition, 45 µl of N-methyl-N-(trimethylsilyl)trifluoroacetamide was added, and reacted at 37 °C and 200 rpm for 30 minutes.
- Conditions for an instrument for GC/TOF MS analysis are as follows.
- A column used in analysis was an RTX-5Sil MS capillary column (length: 30 m, film thickness: 0.25 mm, and inner diameter: 25 mm), and a GC column temperature condition included maintenance at 50 °C for 5 minutes, an increase in temperature to 330 °C, and then maintenance for 1 minute. 1 µL of a sample was injected into GC in splitless mode. A transfer line temperature and an ion source temperature were maintained at 280 °C and 250 °C, respectively. 125 metabolites were identified from a library containing GC/TOF MS results (Table 1).
- As shown in Table 1 below, the metabolites were classified by group, such as organic acids (20.8%), amino acids (21.6%), sugars (18.4%), fatty acids (14.4%), amines (11.2%), phosphates (5.6%), and miscellaneous (7.9%).
- Confirmation of 125 metabolites extracted from synovial fluid of rheumatoid arthritis patients
Amines 2-hydroxypyridine 3-hydroxypyridine 5'-deoxy-5'-methylthioadenosine glycocyamine Guanosine hypoxanthine inosine O-phosphorylethanolamine thymine uracil Urea uric acid uridine Xanthine Amino acids alanine Asparagine asparagine dehydrated aspartate cyano- L-alanine glutamate glutamine Glycine histidine isoleucine L-citrulline L-cysteine leucine L-homoserine lysine methionine N -methylalanine ornithine oxoproline phenylalanine proline serine Threonine tryptophan tyrosine Valine β-alanine Fatty acids 1-monopalmitin 1-monostearin 2-ketoisocaproic acid arachidonic acid behenic acid capric acid heptadecanoic acid lauric acid lignoceric acid linoleic acid linolenic acid myristic acid oleic acid palatinitol palmitic acid palmitoleic acid pelargonic acid stearic acid Organic acids 2-hydroxyhexanoate 2-hydroxyvalerate 2-ketoadipic acid 3-phenyllactate adipate citramalate citrate DL-3-aminoisobutyrate fumarate galactonate glycerate glycolate guaiacol hexonate indole-3-lactate isothreonate malate malonate oxalate phenylacetate pyrrole-2-carboxylate pyruvate succinate terephthalate α-ketoglutarate β-hydroxybutyrate Sugars and sugar alcohols 1,5-anhydroglucitol 3,6-anhydro-D-galactose arabitol fructose fucose galactose glucose glycerol lactose lyxose maltotriose mannitol mannose melezitose melibiose myo-inositol ribose sucrose threitol threose trehalose xylose β-gentiobiose Phosphates adenosine-5-monophosphate glucose-6-phosphate glycerol-1-phosphate mannose-6-phosphate phosphogluconic acid pyrophosphate β-glycerolphosphate Miscellaneous 1,2,4-benzenetriol benzoate cholic acid nicotinamide phthalic acid salicylaldehyde salicylic acid sulfuric acid taurine α-tocopherol - To examine metabolic materials significantly increasing/decreasing according to an increase in severity of rheumatoid arthritis, a DAS-28 ESR (3) score indicating severity was calculated from 30 rheumatoid arthritis patients, and how this score correlated with the metabolite intensity of each patient was analyzed using Spearman's rank correlation coefficient (Table 2). The Spearman's rank correlation coefficient is a statistical method for analyzing the correlation between two different variables, and here, it was applied to examine whether the metabolite which was at a high or low level in patients with moderate disease activity was statistically significantly increased or decreased in patients with high disease activity. As a result, the correlation between the DAS-28 ESR (3) scores and the intensity of the detected 125 metabolites in the 30 patients was obtained, and among the 125 metabolites, there were 14 metabolites showing that the p-value was less than 0.05 when the DAS-28 ESR (3) score, which is the severity of a patient, increased, indicating a statistically significantly increasing or decreasing correlation (Table 2). In Table 2, N represents the number of samples, and Spearman R represents a degree of decreasing or increasing the intensity of a metabolite according to an increase in DAS-28 ESR (3) score, that is, severity. t(N-2) represents a relative value statistically calculated in correlation analysis using Spearman R, and the p-value represents the confidence interval showing how much each metabolite statistically significantly increased or decreased according to the increase in DAS-28 ESR (3) score. In the correlation analysis using Spearman R, it was suggested that the increase/decrease of metabolites according to the increase in DAS-28 ESR (3) score is statistically significant when the p-value is at a level of less than 0.05.
[Table 2] Correlation between DAS28-ESR(3) score and intensity of metabolic material of rheumatoid arthritis patient using Spearman's rank correlation coefficient Metabolite N Spearman R (ESR vs. intensity t(N-2) p value citrate 30 -0.58 -3.81 7.01.E-04 asparagine 30 -0.38 -2.16 3.97.E-02 tryptophan 30 0.37 2.08 4.72.E-02 cholic acid 30 0.38 2.15 3.99.E-02 arabitol 30 0.39 2.22 3.44.E-02 phenylalanine 30 0.41 2.38 2.43.E-02 adipate 30 0.42 2.42 2.22.E-02 glycocyamine 30 0.43 2.55 1.63.E-02 guaiacol 30 0.46 2.72 1.11.E-02 3-phenyllactate 30 0.48 2.87 7.68.E-03 isothreonate 30 0.52 3.19 3.48.E-03 fucose 30 0.53 3.30 2.62.E-03 glucose-6-phosphate 30 0.53 3.34 2.36.E-03 indole-3-lactate 30 0.60 3.96 4.70.E-04 - To establish a diagnostic model for severity classification, samples were divided into a high disease activity group and a moderate disease activity group according to the DAS28-ESR(3) score of each patient. When the DAS-ESR(3) score was 5.1 or more, the sample was classified as a high disease activity group, and when the DAS-ESR(3) score was less than 5.1, the sample was classified as a moderate disease activity group.
- When the 14 potential metabolites for diagnosing severity suggested in Example 2 were examined through a multivariate statistics and modeling OPLS-DA technique to see whether patients with high disease activity and patients with moderate disease activity can be distinguished based on their intensity, it was confirmed that there was a clear difference between metabolite profiles (
FIG. 1 ).FIG. 1A is a PLS-DA score plot, in which a patient of the moderate disease activity group has a positive value for PC1, and a patient of the high disease activity group has a negative value for PC2, showing that synovial fluid samples from patients were clearly classified according to the intensity of 14 metabolites except one sample from the patient with moderate disease activity.FIG. 1B is an OPLS-DA loading plot, showing the contributions of each metabolite to model formation as a positive or negative value.FIG. 1C shows the result of permutation tests for OPLS-DA models, showing that an OPLS-DA model differentiating between a high disease activity group and a moderate disease activity group is statistically significant. - To examine whether an OPLS-DA model, which is a metabolite biomarker for diagnosing the severity of a rheumatoid arthritis patient using a synovial fluid sample prepared in Example 3, was suitable for diagnosis, a receiver operating characteristic (ROC) curve was plotted using the PC1 score of each sample in the model.
- As a result, the sensitivity was 100%, the 1-specificity was 100%, and the AUC value was 1.000, showing that the model is very suitable for diagnosis of the severity of rheumatoid arthritis patients (
FIG. 2 ). - In addition, to examine whether this model is suitable for diagnosis of the severity of rheumatoid arthritis patients using an external sample, metabolites were extracted from three synovial fluid samples from rheumatoid arthritis patients in the high disease activity group and seven synovial fluid samples from rheumatoid arthritis patients in the moderate disease activity group, and then 14 metabolites were screened by the method described in Example 1, and put into the model to examine that they can distinguish between the high disease activity group and the moderate disease activity group.
- The model of
FIG. 1 is an OPLS-DA model showing a negative value based on PC1 in the case of a patient with high disease activity and a positive value based on PC1 in the case of a patient with moderate disease activity when the intensity of the 14 metabolites extracted from the synovial fluid samples of the rheumatoid arthritis patients were input. Likewise, when the intensity data of the extracted 14 metabolites was input to the model, 10 external samples show negative or positive values based on PC1 according to the severity, and may be determined to have the high disease activity or moderate disease activity. As a result, among the 10 samples, three samples from the patients with high disease activity showed negative values based on PC1, and six of the 7 samples from the patients with moderate disease activity showed positive values based on PC1, and the last one showed a negative value based on PC1. Therefore, since the severity of 9 samples of a total of the 10 samples was accurately predicted, it was able to be seen that the 14-metabolite biomarkers, OPLS-DA models, are suitable for diagnosis of the severity of external samples (FIG. 3 ).
Claims (12)
- A kit for classifying rheumatoid arthritis patients into a high disease activity group and a moderate disease activity group, comprising:
a quantification device for one or more synovial fluid metabolites selected from the group consisting of indole-3-lactate, citrate, glucose-6-phosphate, fucose, isothreonate, 3-phenyllactate, guaiacol, glycocyamine, adipate, phenylalanine, arabitol, asparagine, cholic acid, and tryptophan. - The kit of claim 1, wherein the quantification device is an instrument for chromatography/mass spectroscopy.
- The kit of claim 1, wherein, when the concentration(s) of one or more selected from indole-3-lactate, glucose-6-phosphate, fucose, isothreonate, 3-phenyllactate, guaiacol, glycocyamine, adipate, phenylalanine, arabitol, cholic acid and tryptophan show(s) an increasing tendency, the patient(s) correspond(s) to the high disease activity group.
- The kit of claim 1, wherein, when the concentration(s) of one or more selected from the group consisting of citrate and asparagine show(s) a decreasing tendency, the patient(s) correspond(s) to the high disease activity group.
- The kit of claim 1, wherein, when the concentration(s) of one or more selected from the group consisting of citrate and asparagine show(s) increasing tendency, the patient(s) is/are assigned to the moderate disease activity group.
- The kit of claim 1, wherein, when the concentration(s) of one or more selected from the group consisting of indole-3-lactate, glucose-6-phosphate, fucose, isothreonate, 3-phenyllactate, guaiacol, glycocyamine, adipate, phenylalanine, arabitol, cholic acid and tryptophan show(s) a decreasing tendency, the patient(s) correspond(s) to the moderate disease activity group.
- The kit of claim 1, wherein the rheumatoid arthritis patient with high disease activity satisfies a DAS28-ESR score, which is the severity level of a rheumatoid arthritis patient, of 5.1 or more.
- The kit of claim 1, wherein the rheumatoid arthritis patient with moderate disease activity satisfies a DAS28-ESR score, which is the severity level of a rheumatoid arthritis patient, of less than 5.1.
- A kit for predicting the severity of a rheumatoid arthritis patient, comprising:
a quantification device for one or more synovial fluid metabolites selected from the group consisting of indole-3-lactate, citrate, glucose-6-phosphate, fucose, isothreonate, 3-phenyllactate, guaiacol, glycocyamine, adipate, phenylalanine, arabitol, asparagine, cholic acid, and tryptophan. - The kit of claim 9, wherein the quantification device is an instrument for chromatography/mass spectroscopy.
- The kit of claim 9, wherein the concentration(s) of one or more metabolites selected from the group consisting of citrate and asparagine decrease(s) according to the increase in the severity of a rheumatoid arthritis patient.
- The kit of claim 9, wherein the concentration(s) of one or more metabolite(s) selected from the group consisting of indole-3-lactate, glucose-6-phosphate, fucose, isothreonate, 3-phenyllactate, guaiacol, glycocyamine, adipate, phenylalanine, arabitol, cholic acid and tryptophan show(s) an increasing tendency according to the increase in the severity of a rheumatoid arthritis patient.
Applications Claiming Priority (2)
| Application Number | Priority Date | Filing Date | Title |
|---|---|---|---|
| KR1020190071462A KR102333499B1 (en) | 2019-06-17 | 2019-06-17 | Biomarkers for prediction or classification of rheumatoid arthritis severity using metabolite analysis |
| PCT/KR2020/007646 WO2020256351A1 (en) | 2019-06-17 | 2020-06-12 | Biomarker for predicting or classifying severity of rheumatoid arthritis using metabolite analysis |
Publications (2)
| Publication Number | Publication Date |
|---|---|
| EP3985390A1 true EP3985390A1 (en) | 2022-04-20 |
| EP3985390A4 EP3985390A4 (en) | 2023-07-05 |
Family
ID=74037368
Family Applications (1)
| Application Number | Title | Priority Date | Filing Date |
|---|---|---|---|
| EP20825796.4A Pending EP3985390A4 (en) | 2019-06-17 | 2020-06-12 | BIOMARKERS FOR PREDICTING OR CLASSIFYING THE SEVERITY OF RHEUMATOID ARTHRITIS USING METABOLIC ANALYSIS |
Country Status (4)
| Country | Link |
|---|---|
| US (1) | US20220244273A1 (en) |
| EP (1) | EP3985390A4 (en) |
| KR (2) | KR102333499B1 (en) |
| WO (1) | WO2020256351A1 (en) |
Families Citing this family (3)
| Publication number | Priority date | Publication date | Assignee | Title |
|---|---|---|---|---|
| EP3992967B1 (en) | 2020-11-02 | 2024-10-30 | Samsung Electronics Co., Ltd. | Memory package, storage device including memory package, and storage device operating method |
| CN115541556A (en) * | 2022-10-27 | 2022-12-30 | 北京大学人民医院 | A biomarker for predicting or assisting diagnosis of rheumatoid arthritis |
| CN116381072B (en) * | 2023-01-16 | 2024-05-31 | 苏州艾麦锶生命科技有限公司 | Biomarker for identifying sporadic gout and frequent gout and application thereof |
Family Cites Families (8)
| Publication number | Priority date | Publication date | Assignee | Title |
|---|---|---|---|---|
| ES2385330T3 (en) * | 2003-12-19 | 2012-07-23 | MAX-PLANCK-Gesellschaft zur Förderung der Wissenschaften e.V. | Procedure to analyze metabolites |
| JPWO2007100058A1 (en) * | 2006-03-02 | 2009-07-23 | 国立大学法人 千葉大学 | Rheumatoid arthritis examination method and treatment method |
| GB0704764D0 (en) * | 2007-03-12 | 2007-04-18 | Electrophoretics Ltd | Isobarically labelled reagents and methods of their use |
| EP2488659B1 (en) * | 2009-10-15 | 2019-12-11 | Crescendo Bioscience, Inc. | Biomarkers and methods for measuring and monitoring inflammatory disease activity |
| US20120040383A1 (en) * | 2010-08-12 | 2012-02-16 | Wei Jia | Methods and Kits Relating To Metabolite Biomarkers For Colorectal Cancer |
| US20160274106A1 (en) * | 2013-06-21 | 2016-09-22 | Catholic University Industry-Academic Cooperation Foundation | Biomarker for rheumatoid arthritis diagnosis or activity evaluation |
| CA2945165A1 (en) * | 2014-04-08 | 2015-10-15 | Metabolon, Inc. | Small molecule biochemical profiling of individual subjects for disease diagnosis and health assessment |
| WO2018021624A1 (en) * | 2016-07-29 | 2018-02-01 | 가톨릭대학교 산학협력단 | Biomarkers for diagnosis of rheumatoid arthritis |
-
2019
- 2019-06-17 KR KR1020190071462A patent/KR102333499B1/en active Active
-
2020
- 2020-06-12 US US17/619,290 patent/US20220244273A1/en active Pending
- 2020-06-12 EP EP20825796.4A patent/EP3985390A4/en active Pending
- 2020-06-12 WO PCT/KR2020/007646 patent/WO2020256351A1/en not_active Ceased
-
2021
- 2021-11-03 KR KR1020210149631A patent/KR102332309B1/en active Active
Also Published As
| Publication number | Publication date |
|---|---|
| WO2020256351A1 (en) | 2020-12-24 |
| KR20200144173A (en) | 2020-12-29 |
| KR102333499B1 (en) | 2021-12-01 |
| KR102332309B1 (en) | 2021-12-01 |
| EP3985390A4 (en) | 2023-07-05 |
| KR20210134580A (en) | 2021-11-10 |
| US20220244273A1 (en) | 2022-08-04 |
Similar Documents
| Publication | Publication Date | Title |
|---|---|---|
| US10539575B2 (en) | Biomarkers related to kidney function and methods using the same | |
| EP2227689B1 (en) | Biomarkers for fatty liver disease and methods using the same | |
| EP3129909B1 (en) | Small molecule biochemical profiling of individual subjects for disease diagnosis and health assessment | |
| KR102332309B1 (en) | Biomarkers for prediction or classification of rheumatoid arthritis severity using metabolite analysis | |
| KR102094802B1 (en) | Method for diagnosing Behcet's disease by using urine metabolomics | |
| Kim et al. | A sensitive and specific liquid chromatography–tandem mass spectrometry method for the determination of intracellular and extracellular uric acid | |
| CN114373510A (en) | Metabolic marker for lung cancer diagnosis or monitoring and screening method and application thereof | |
| Ahn et al. | Potential metabolomic biomarkers for reliable diagnosis of Behcet's disease using gas chromatography/time-of-flight-mass spectrometry | |
| US10983127B2 (en) | Device for diagnosing colorectal cancer and method for providing colorectal cancer diagnosis information | |
| Barco et al. | Plasma free metanephrines for diagnosis of neuroblastoma patients | |
| CN118471335B (en) | Device, method, system for diagnosing cervical cancer lymphatic metastasis and application thereof | |
| Hsu et al. | Simultaneous detection of diagnostic biomarkers of alkaptonuria, ornithine carbamoyltransferase deficiency, and neuroblastoma disease by high-performance liquid chromatography/tandem mass spectrometry | |
| CN110546505A (en) | Method for diagnosing Behcet's disease using metabolome analysis | |
| KR102253363B1 (en) | A Novel Metabolite Marker for Tuberculosis and A Method for Diagnosing Tuberculosis Using the Same | |
| KR101806136B1 (en) | Method for diagnosing Behcet's disease with arthritis by using metabolomics | |
| CN113125615B (en) | Application of three metabolic markers in preparation of kit for diagnosing Systemic Lupus Erythematosus (SLE) independently or jointly | |
| WO2020066162A1 (en) | Method for detecting non-alcoholic fatty liver disease, kit for detecting non-alcoholic fatty liver disease, and biomarker for use in detection of non-alcoholic fatty liver disease | |
| Siddiqui et al. | Airways disease: phenotyping heterogeneity using measures of airway inflammation | |
| CN111537629B (en) | Lipid in feces for detecting active tuberculosis and detection system thereof | |
| CN117110617A (en) | A set of markers associated with the frequent acute exacerbation phenotype of COPD and their applications | |
| CN121324513A (en) | Metabolomics-based diagnostic biomarkers for generalized pustular psoriasis and their applications | |
| WO2019083220A1 (en) | Method for diagnosing behcet's disease by using urinary metabolome analysis | |
| EP4679082A1 (en) | Method for improved determination of the acylcarnitine profile in biological material | |
| Pignatti et al. | Airway inflammatory phenotypes: Making sputum cell evaluation more accessible for clinical use | |
| US20240219390A1 (en) | Cancer biomarkers |
Legal Events
| Date | Code | Title | Description |
|---|---|---|---|
| STAA | Information on the status of an ep patent application or granted ep patent |
Free format text: STATUS: THE INTERNATIONAL PUBLICATION HAS BEEN MADE |
|
| PUAI | Public reference made under article 153(3) epc to a published international application that has entered the european phase |
Free format text: ORIGINAL CODE: 0009012 |
|
| STAA | Information on the status of an ep patent application or granted ep patent |
Free format text: STATUS: REQUEST FOR EXAMINATION WAS MADE |
|
| 17P | Request for examination filed |
Effective date: 20220113 |
|
| AK | Designated contracting states |
Kind code of ref document: A1 Designated state(s): AL AT BE BG CH CY CZ DE DK EE ES FI FR GB GR HR HU IE IS IT LI LT LU LV MC MK MT NL NO PL PT RO RS SE SI SK SM TR |
|
| DAV | Request for validation of the european patent (deleted) | ||
| DAX | Request for extension of the european patent (deleted) | ||
| RAP1 | Party data changed (applicant data changed or rights of an application transferred) |
Owner name: SAMSUNG MEDICAL CENTER Owner name: SAMSUNG LIFE PUBLIC WELFARE FOUNDATION Owner name: KOREA UNIVERSITY RESEARCH AND BUSINESS FOUNDATION |
|
| A4 | Supplementary search report drawn up and despatched |
Effective date: 20230607 |
|
| RIC1 | Information provided on ipc code assigned before grant |
Ipc: G01N 33/50 20060101ALI20230601BHEP Ipc: G01N 33/68 20060101ALI20230601BHEP Ipc: G01N 30/88 20060101ALI20230601BHEP Ipc: G01N 30/72 20060101AFI20230601BHEP |