EP3977397B1 - Quantitative bestimmung des phänotyps einer fibrose aus bildern von biologischen gewebeproben - Google Patents
Quantitative bestimmung des phänotyps einer fibrose aus bildern von biologischen gewebeproben Download PDFInfo
- Publication number
- EP3977397B1 EP3977397B1 EP20729254.1A EP20729254A EP3977397B1 EP 3977397 B1 EP3977397 B1 EP 3977397B1 EP 20729254 A EP20729254 A EP 20729254A EP 3977397 B1 EP3977397 B1 EP 3977397B1
- Authority
- EP
- European Patent Office
- Prior art keywords
- collagen
- fibrosis
- cut
- phenotypes
- parameters
- Prior art date
- Legal status (The legal status is an assumption and is not a legal conclusion. Google has not performed a legal analysis and makes no representation as to the accuracy of the status listed.)
- Active
Links
Images


Classifications
-
- G—PHYSICS
- G06—COMPUTING OR CALCULATING; COUNTING
- G06T—IMAGE DATA PROCESSING OR GENERATION, IN GENERAL
- G06T7/00—Image analysis
- G06T7/0002—Inspection of images, e.g. flaw detection
- G06T7/0012—Biomedical image inspection
-
- G—PHYSICS
- G06—COMPUTING OR CALCULATING; COUNTING
- G06F—ELECTRIC DIGITAL DATA PROCESSING
- G06F18/00—Pattern recognition
- G06F18/20—Analysing
- G06F18/25—Fusion techniques
- G06F18/253—Fusion techniques of extracted features
-
- G—PHYSICS
- G06—COMPUTING OR CALCULATING; COUNTING
- G06F—ELECTRIC DIGITAL DATA PROCESSING
- G06F18/00—Pattern recognition
- G06F18/20—Analysing
- G06F18/25—Fusion techniques
- G06F18/254—Fusion techniques of classification results, e.g. of results related to same input data
-
- G—PHYSICS
- G06—COMPUTING OR CALCULATING; COUNTING
- G06T—IMAGE DATA PROCESSING OR GENERATION, IN GENERAL
- G06T7/00—Image analysis
- G06T7/40—Analysis of texture
- G06T7/41—Analysis of texture based on statistical description of texture
-
- G—PHYSICS
- G06—COMPUTING OR CALCULATING; COUNTING
- G06T—IMAGE DATA PROCESSING OR GENERATION, IN GENERAL
- G06T7/00—Image analysis
- G06T7/60—Analysis of geometric attributes
- G06T7/62—Analysis of geometric attributes of area, perimeter, diameter or volume
-
- G—PHYSICS
- G06—COMPUTING OR CALCULATING; COUNTING
- G06V—IMAGE OR VIDEO RECOGNITION OR UNDERSTANDING
- G06V10/00—Arrangements for image or video recognition or understanding
- G06V10/70—Arrangements for image or video recognition or understanding using pattern recognition or machine learning
- G06V10/77—Processing image or video features in feature spaces; using data integration or data reduction, e.g. principal component analysis [PCA] or independent component analysis [ICA] or self-organising maps [SOM]; Blind source separation
- G06V10/80—Fusion, i.e. combining data from various sources at the sensor level, preprocessing level, feature extraction level or classification level
- G06V10/806—Fusion, i.e. combining data from various sources at the sensor level, preprocessing level, feature extraction level or classification level of extracted features
-
- G—PHYSICS
- G06—COMPUTING OR CALCULATING; COUNTING
- G06V—IMAGE OR VIDEO RECOGNITION OR UNDERSTANDING
- G06V10/00—Arrangements for image or video recognition or understanding
- G06V10/70—Arrangements for image or video recognition or understanding using pattern recognition or machine learning
- G06V10/77—Processing image or video features in feature spaces; using data integration or data reduction, e.g. principal component analysis [PCA] or independent component analysis [ICA] or self-organising maps [SOM]; Blind source separation
- G06V10/80—Fusion, i.e. combining data from various sources at the sensor level, preprocessing level, feature extraction level or classification level
- G06V10/809—Fusion, i.e. combining data from various sources at the sensor level, preprocessing level, feature extraction level or classification level of classification results, e.g. where the classifiers operate on the same input data
-
- G—PHYSICS
- G06—COMPUTING OR CALCULATING; COUNTING
- G06V—IMAGE OR VIDEO RECOGNITION OR UNDERSTANDING
- G06V20/00—Scenes; Scene-specific elements
- G06V20/60—Type of objects
- G06V20/69—Microscopic objects, e.g. biological cells or cellular parts
- G06V20/695—Preprocessing, e.g. image segmentation
-
- G—PHYSICS
- G06—COMPUTING OR CALCULATING; COUNTING
- G06V—IMAGE OR VIDEO RECOGNITION OR UNDERSTANDING
- G06V20/00—Scenes; Scene-specific elements
- G06V20/60—Type of objects
- G06V20/69—Microscopic objects, e.g. biological cells or cellular parts
- G06V20/698—Matching; Classification
-
- A—HUMAN NECESSITIES
- A61—MEDICAL OR VETERINARY SCIENCE; HYGIENE
- A61B—DIAGNOSIS; SURGERY; IDENTIFICATION
- A61B2576/00—Medical imaging apparatus involving image processing or analysis
-
- A—HUMAN NECESSITIES
- A61—MEDICAL OR VETERINARY SCIENCE; HYGIENE
- A61B—DIAGNOSIS; SURGERY; IDENTIFICATION
- A61B5/00—Measuring for diagnostic purposes; Identification of persons
- A61B5/42—Detecting, measuring or recording for evaluating the gastrointestinal, the endocrine or the exocrine systems
- A61B5/4222—Evaluating particular parts, e.g. particular organs
- A61B5/4244—Evaluating particular parts, e.g. particular organs liver
-
- G—PHYSICS
- G01—MEASURING; TESTING
- G01N—INVESTIGATING OR ANALYSING MATERIALS BY DETERMINING THEIR CHEMICAL OR PHYSICAL PROPERTIES
- G01N2333/00—Assays involving biological materials from specific organisms or of a specific nature
- G01N2333/435—Assays involving biological materials from specific organisms or of a specific nature from animals; from humans
- G01N2333/78—Connective tissue peptides, e.g. collagen, elastin, laminin, fibronectin, vitronectin, cold insoluble globulin [CIG]
-
- G—PHYSICS
- G01—MEASURING; TESTING
- G01N—INVESTIGATING OR ANALYSING MATERIALS BY DETERMINING THEIR CHEMICAL OR PHYSICAL PROPERTIES
- G01N33/00—Investigating or analysing materials by specific methods not covered by groups G01N1/00 - G01N31/00
- G01N33/48—Biological material, e.g. blood, urine; Haemocytometers
- G01N33/483—Physical analysis of biological material
- G01N33/4833—Physical analysis of biological material of solid biological material, e.g. tissue samples, cell cultures
-
- G—PHYSICS
- G06—COMPUTING OR CALCULATING; COUNTING
- G06T—IMAGE DATA PROCESSING OR GENERATION, IN GENERAL
- G06T2207/00—Indexing scheme for image analysis or image enhancement
- G06T2207/10—Image acquisition modality
- G06T2207/10056—Microscopic image
-
- G—PHYSICS
- G06—COMPUTING OR CALCULATING; COUNTING
- G06T—IMAGE DATA PROCESSING OR GENERATION, IN GENERAL
- G06T2207/00—Indexing scheme for image analysis or image enhancement
- G06T2207/30—Subject of image; Context of image processing
- G06T2207/30004—Biomedical image processing
- G06T2207/30024—Cell structures in vitro; Tissue sections in vitro
-
- G—PHYSICS
- G06—COMPUTING OR CALCULATING; COUNTING
- G06T—IMAGE DATA PROCESSING OR GENERATION, IN GENERAL
- G06T2207/00—Indexing scheme for image analysis or image enhancement
- G06T2207/30—Subject of image; Context of image processing
- G06T2207/30004—Biomedical image processing
- G06T2207/30056—Liver; Hepatic
Definitions
- This disclosure relates generally to quantitative assessment of fibrosis including, without limitation, computerized systems and methods that analyze a digital image taken of a biological tissue sample to quantitatively evaluate selected parameters that correlate with the phenotype of fibrosis, to quantify traits of the fibrosis phenotype in the biological tissue sample.
- Fibrosis refers to the accumulation of collagen-based fibrous tissue in an organ when the organ attempts to repair and replace damaged cells but creates non-functioning scar tissue in place of functional tissue. There are different stages of fibrosis, and in its most severe form, the scar tissue destroys the organ's internal structure and, in the case of the liver, impairs its ability to regenerate. In the liver, this is referred to as cirrhosis and can cause portal hypertension, which can result in painful swelling and bleeding.
- fibrotic conditions there are a variety of fibrotic conditions in multiple organs, such as liver, lung, kidney, heart, skin, uterus, muscle, adipose tissues, tissue from the gastric intestinal tract, and cancerous tissues in both human and animals.
- organs such as liver, lung, kidney, heart, skin, uterus, muscle, adipose tissues, tissue from the gastric intestinal tract, and cancerous tissues in both human and animals.
- Some in-vitro models and meso-biological systems such as spheroids or printed organs can also develop fibrotic conditions.
- the collagen-rich fibrous tissue fibrosis
- NASH Non-Alcoholic SteatoHepatitis
- NASH non-alcoholic fatty liver disease
- NASH is closely related to obesity, prediabetes, and diabetes
- its symptoms are often non-specific to NASH, which makes it difficult to diagnose.
- NASH patients are unaware of their condition until late stages of the disease. There are currently no medical treatments for NASH yet, but drug discovery efforts against NASH are ongoing.
- Idiopatic Pulmonary Fibrosis is a type of chronic scarring of the lungs characterized by an irreversible progression of fibrosis resulting in a decline in lung function and death by suffocation.
- IFF Idiopatic Pulmonary Fibrosis
- Scleroderma is a group of diseases that cause abnormal growth of the connective tissues due to excessive collagen (fibrosis) generation.
- Symptoms of scleroderma include calcium deposits in connective tissues, narrowing of blood vessels in the hands or feet, swelling of the esophagus, thick, tight skin on the fingers, and red spots on hands and face, all creating significant patient discomfort and handicaps.
- the causes of scleroderma are unknown, and there is no cure for scleroderma. However, various treatments can control and/or slow symptoms and complications. Drug discovery efforts against Scleroderma are ongoing.
- tissue damage due to fibrosis physicians can perform noninvasive testing such as blood tests and imaging tests, but the gold standard is to perform a biopsy by removing a tissue sample from the organ and using histopathology methods to evaluate the sample. This includes (1) fixing the tissue from the biopsy; (2) embedding the tissue in paraffin blocks; (3) sectioning the paraffin blocks to obtain thin sections of the tissue (typically 5 microns); (4) staining the sections with pathology stains; (5) imaging the stained tissues/sections by white light microscopy or digital white light microscopy; (6) quantifying specific tissue features, either by a pathologist, an automated image analysis, or both.
- Pathologists use categorical scoring systems to assess the tissue biopsy and determine the extent of fibrosis.
- the METAVIR scoring system is commonly used to assess the liver biopsy to determine the extent of fibrosis in patients with hepatitis C.
- the NAKANUMA system is used to quantify the severity of fibrosis in Primary biliary cholangitis, another liver disease with no treatment.
- the ASHCROFT scale is used for determining the degree of fibrosis in lung specimens.
- the NASH-CRN Fibrosis system classifies liver fibrosis in NASH patients into five stages, ranging from F0 to F4 (as indicated in the table below) and representing different amounts of fibrosis or scarring.
- F2 Significant fibrosis, scarring has occurred and extends outside the liver area
- F3 Sever fibrosis fibrosis spreading and forming bridges with other fibrotic liver areas
- numerous septa without cirrhosis F4 Advanced scarring cirrhosis
- the NASH-CRN Fibrosis scoring system is coarse in that it only defines five categories that range from no fibrosis (F0) to cirrhosis (F4).
- the scoring system is unable to distinguish between patients that are in one stage (e.g., F3), but are on opposite ends of that stage (e.g., closer to F2 or F4).
- the plan for treatment may be different.
- a computer-implemented method as defined by appended claim 1 there is provided a computer-implemented method as defined by appended claim 1.
- a computer program as defined by appended claim 14.
- a system as defined by appended claim 15.
- the present disclosure provides systems and methods for tracking fibrotic disease progression on small time-scales, can be used to track the regression of fibrosis in response to a therapeutic compound or change in diet, and are suitable for describing the effect of investigational compounds in pre-clinical or clinical studies.
- the present disclosure's phenotypic continuous scoring system distinguishes between the fibrosis phenotypes between two genetically different pools of animals or patients, and can distinguish between fibrosis conditions that have different aetiologies (for instance, liver fibrosis can be seen as a complication of obesity, diabetes, alcoholic steatosis, non-alcoholic steatosis, Hepatitis (B or C), etc.).
- fibrosis is expressed as multiple forms and features across multiple organs and biological tissues, it is appropriate to describe and quantify fibrosis in a phenotypic way, using its composite observable characteristics or traits.
- the present disclosure provides a way to measure fibrosis that has a wide dynamic range and fine resolution, because it has a continuous scale and a very high signal to noise ratio. Because the present disclosure incorporates a large number of selected quantifiable parameters to establish a composite score, the composite score provides a very high signal-to-noise ratio, resulting in high detection thresholds, improved sensitivity, and large dynamic ranges. As a result, the present disclosure is less prone to errors due to sources of noise from tissue processing or image acquisition. The quantitative nature of the present disclosure also ensures the system for measuring fibrosis is automated and not prone to large intra- and inter-operator variability. Moreover, the present disclosure is optimized for specific populations, such as pediatric versus adult patient populations, or specific animal models, and can even further be optimized for a specific organ in humans or a specific type of animal or biological tissue
- the phenotypic fibrosis scoring systems and methods presented herein can be used to do any of the following: quantify the severity and progression of fibrosis in a patient (or in another biological system), assess the response (or lack of thereof) of a patient (or any other biological system) to a therapeutic compound on short time-scales, and quantify the phenotype of fibrosis and its differences across species and genetic phenotypes, diseases conditions, stages, groups and sub-groups and aetiologies, treatments and response,
- fibrosis includes all kinds of collagen-based structures, regardless of the chemical nature of the collagen.
- collagen includes different types of collagens creating fibrosis, including collagen I, collagen III, etc.
- collagen object corresponds to a representation of collagen, as depicted in a digital image. Identification of the collagen object in a digital image may result from preprocessing the digital image to indicate adjacent pixels or regions of the digital image that correspond to collagen.
- the collagen object may reflect adjacent pixels or regions of the digital image that correspond to the same type of collagen, and may be extracted from the digital image.
- collagens corresponds to one or more collagen objects represented in a digital image, and may include the same or different types of collagen.
- Described herein are systems and methods for quantifying a fibrosis phenotype.
- One aspect relates to computer aided phenotyping of fibrosis-related conditions.
- a digital image of a biological tissue sample is received, wherein the digital image indicates presence of collagens in the biological tissue sample.
- the image is processed to quantify a plurality of parameters, each parameter describing a feature of the collagens in the biological tissue sample that is expected to be different for different phenotypes of fibrosis.
- At least some of the features are selected from at least two of the group consisting of: (1) tissue level features that describe macroscopic characteristics of the collagens depicted in the digital image of the biological tissue sample; (2) morphometric level features that describe morphometric characteristics of the collagens depicted in the digital image of the biological tissue sample; and (3) texture level features that describe an organization of the collagens depicted in the digital image of the biological tissue sample.
- At least some of the plurality of parameters are statistics associated with histograms corresponding to distributions of the associated parameters across at least some of the digital image. At least some of the plurality of parameters in (b) are combined to obtain one or more composite scores that quantify a phenotype of fibrosis for the biological tissue sample.
- At least one of the features is a tissue level feature
- at least another feature in the features is a morphometric level feature
- at least another feature in the features is a texture level feature.
- At least two of the features may be tissue level features
- at least another two features in the features may be morphometric level features
- at least another two features in the features may be texture level feature.
- the at least some of the plurality of parameters that are combined corresponds to all of the plurality of parameters.
- a first composite score of the one or more composite scores is specific to a feature type selected from the group consisting of tissue level, morphometric level, and texture level.
- a second composite score of the one or more composite scores may be specific to another feature type selected from the group consisting of tissue level, morphometric level, and texture level. The first and second composite scores may be combined to quantify the phenotype of fibrosis for the biological tissue sample.
- the systems and methods are compatible with any modality of imaging that distinguishes between a presence and absence of collagens in the biological tissue sample.
- the systems and methods may be compatible with at least stained histopathology slides, two photon microscopy, fluorescence imaging, structured imaging, polarized imaging, CARS, OCT images, fresh tissue imaging, and endoscopy.
- the depiction of collagens in the biological tissue sample results from an optical marker that is specific to any form of collagen.
- the optical marker may be selected from at least one of the group consisting of: (1) a collagen-specific stain used in a histopathology method; and (2) an intrinsic bio-optical marker specific to one or more collagens that is intrinsic to a modality of the digital image.
- pixels of the digital image indicate presence and quantity of collagens in corresponding volumes of the biological tissue sample.
- each of the texture level features characterizes different regions of the digital image by describing the collagen of each region.
- the different regions may correspond to non-overlapping or overlapping sample windows of the digital image.
- Quantifying a parameter describing a texture level feature may comprise: obtaining a sample value for each sample window, to obtain a plurality of sample values; generating a histogram of the plurality of sample values; and computing a statistic of the histogram as the parameter describing the texture level feature.
- the sample windows have the same or different sizes for different texture level features.
- At least some of the parameters describing a morphometric level feature or a texture level feature is one of the statistics associated with histograms.
- no parameters describing tissue level features are statistics associated with histograms.
- Sample values of the histograms for morphometric level features may correspond to individual fibers or bundles of fibers.
- Sample values of the histograms for texture level features may correspond to sample windows that identify subsets of the image. At least some of the plurality of parameters may result from processing the histograms.
- the statistics associated with histograms are selected from the group consisting of (1) trend statistics including mean, median, mode, and normalized count, (2) distortion statistics including skew, (3) variance statistics including standard deviation, variance, outliers, and kurtosis, and (4) transition statistics related to cut-off values.
- the cut-off values may split the associated histogram into subsets of sample values, and each transition statistic is for a single subset of sample values. At least one of the histograms may be split by multiple cut-off values.
- the cut-off values may be determined by a user. The cutoff values may be different for different tissues.
- At least some statistics associated with histograms may be selected from the group consisting of trend statistics, distortion statistics, and variance statistics of individual subsets of sample values.
- Statistics associated with histograms may include normalized counts of individual subsets of sample values, wherein the normalized counts represent the number of sample values within the respective individual subset, normalized by the unit surface area of the digital image.
- quantifying at least some of the plurality of parameters associated with histograms comprises processing the histograms to identify multiple modes of the histograms. Processing a histogram to identify multiple modes may comprise deconvoluting the histogram. Some modes of the histograms may correspond to phenotypic signatures of the fibrosis-related conditions, wherein deconvoluting the histogram comprises filtering the histogram to determine whether the histogram exhibits a phenotypic signature and to quantify the exhibited phenotypic signature.
- the parameters that describe tissue level features include at least one selected from the group consisting of: collagen area ratio, large collagen object normalized density, small collagen object normalized density, and collagen network reticulation index.
- the parameters that describe morphometric level features include at least one selected from the group consisting of: length, skeleton length, eccentricity, solidity, curvature ration, area, perimeter, and collagen density.
- the parameters that describe texture level features include at least one relating to a collagen image pixel intensity level co-occurrence matrix, including at least one of the group consisting of: energy, homogeneity, correlation, inertia, entropy, skewness, and kurtosis.
- each of the plurality of parameters used to obtain at least one of the one or more composite scores may correspond to one class of collagen.
- the collagen classes may include one or more of fine collagen, assembled collagen, and tissue regions.
- Each of the plurality of parameters used to obtain the at least one of the one or more composite scores may correspond to the collagen class of fine collagen.
- Each of the plurality of parameters used to obtain the at least one of the one or more composite scores may correspond to the collagen class of assembled collagen.
- the plurality of parameters used to obtain the at least one of the one or more composite scores may correspond to both collagen classes of fine collagen and assembled collagen.
- the collagen classes may include one or more of long collagens and short collagens.
- the collagen classes may include one or more of high textured regions and low textured regions.
- the collagen classes may represent different levels of complexity in collagen skeleton.
- At least some of the parameters describing morphometric features relate to one collagen class. In some implementations, at least some of the parameters describing tissue level features relate to one collagen class. In some implementations, the collagen classes distinguish different stages of fibrosis.
- different features are selected to quantify different phenotypes of fibrosis.
- parameters describing features of fine collagen fibers may be used to distinguish Fibrosis 0, Fibrosis 1, and Fibrosis 2.
- Parameters describing features of assembled collagen fibers may be used to distinguish Fibrosis 2, Fibrosis 3, and Fibrosis 4.
- the plurality of parameters that are combined are selected from a list of candidate parameters.
- the plurality of parameters that are combined may be selected from the list of candidate parameters by identifying parameters that distinguish between different phenotypes of fibrosis.
- the identified parameters that distinguish between different phenotypes of fibrosis may be selected based on a calibration technique.
- the calibration technique involves a calibration data set of calibration digital images taken from biological samples having known phenotypes of fibrosis.
- the calibration technique involves principal component analysis to identify the selected parameters.
- the selected parameters have less variance across the calibration data set for a given phenotype of fibrosis than unselected parameters.
- the known phenotypes of fibrosis may correspond to different outcomes of fibrosis disease.
- the known phenotypes of fibrosis may correspond to disease severity.
- the known phenotypes of fibrosis may correspond to NASH-CRN F disease stage, which include F0, FI, F2, F3, and F4.
- the known phenotypes of fibrosis correspond to different values or ranges of a fibrosis-related biomarker.
- the fibrosis-related biomarker may be indicative of progression of fibrosis and/or may be indicative of regression of fibrosis in response to treatment.
- the known phenotypes of fibrosis may correspond to different classes of fibrosis.
- the different classes of fibrosis may include NASH 1 and NASH 2.
- the calibration technique selects parameters that have higher signal-to-noise than parameters that are not selected. Compared to the unselected parameters, the selected parameters may exhibit higher absolute differences for different phenotypes of fibrosis for the calibration data set. Compared to the unselected parameters, the selected parameters may exhibit lower standard deviations for the same phenotype of fibrosis for the calibration data set.
- the combining of parameters may comprise assigning a weight to each parameter, wherein the absolute weight is higher for selected parameters that have lower standard deviation for the same phenotype of fibrosis for the calibration data set than other selected parameters.
- the weight may be negative for parameters that are negatively correlated with progression of fibrosis.
- the list of candidate parameters includes over 300 candidate parameters, and the selected plurality of parameters consists of fewer than 35 parameters, fewer than 25 parameters, fewer than 15 parameters, 5 to 7 parameters, 2 to 5 parameters.
- the calibration digital images are taken from biological samples of humans, wherein the calibration technique is specific to humans.
- the biological samples of humans may be taken from the same type of organ, wherein the calibration technique is specific to the same type of organ.
- the calibration digital images are taken from biological samples of the same type of animal, wherein the calibration technique is specific to the same type of animal.
- the biological samples of the same type of animal may be taken from the same type of organ, wherein the calibration technique is specific to the same type of organ.
- the organ may be selected from the group consisting of the liver, lung, kidney, heart, skin, uterus, eye, gut, muscle, adipose tissue, tissue from the gastric intestinal tract, cancerous tissues both in human and animals, or any other organ or portion of the body that is susceptible to fibrosis.
- the fibrosis-related conditions are selected from the group consisting of Hepatitis A, B or C, Non Alcoholic Steatosis Hepatitis (NASH), Alcoholic Steatosis Hepatitis (ASH), Cirrhosis, Primary Biliary Cholangitis and Primary biliary Cirrhosis, Idiopathic Pulmonary Fibrosis, Kidney Chronic Disease, Renal Disease, Scleroderma and Scaring, Duchenne muscular dystrophy, Myocardial infarction and repair, Macular Degeneracies, Glaucoma Uterine, and any manifestation of fibrosis in cancer.
- NASH Non Alcoholic Steatosis Hepatitis
- ASH Alcoholic Steatosis Hepatitis
- Cirrhosis Primary Biliary Cholangitis
- Primary biliary Cirrhosis Idiopathic Pulmonary Fibrosis
- Kidney Chronic Disease Renal Disease
- Scleroderma and Scaring Duchenne muscular dystrophy
- the biological tissue sample is taken from a subject.
- the biological tissue sample may be tissue sampled from an organ of the subject that is susceptible to fibrosis.
- the organ may be a liver, lung, kidney, heart, skin, uterus, muscle, adipose tissues, tissue from the gastric intestinal track, cancerous tissues both in human and animals, or any other organ or portion of the body that is susceptible to fibrosis.
- the subject may be a human, an animal, or a meso-biological system.
- the meso-biological system includes one or more spheroids, one or more printed organs, or a phenotypically relevant biosystem that is susceptible to fibrosis.
- the digital image is taken of a biological cellular sample in vitro.
- the severity of fibrosis of the biological tissue sample is quantified on a continuous scale.
- the progression of fibrosis for the subject is quantified on a continuous scale.
- the regression of fibrosis for the subject in response to a therapy is quantified on a continuous scale.
- the type of fibrosis for the subject is quantified on a continuous scale.
- effectiveness of a therapy or a drug candidate is evaluated.
- the therapy or drug candidate may be determined to be effective in a subject from which the biological tissue sample was taken.
- the therapy or drug candidate may be determined to be effective when it is determined that the therapy or drug candidate prevents progression of fibrosis in the subject.
- the effectiveness of a drug candidate or a combination of drug candidates in a plurality of drug candidates is evaluated.
- the derivation of the one or more composite scores may be repeated for each sample in a plurality of samples, wherein at least some of the samples are treated with one of the drug candidates in the plurality of drug candidates.
- a rank may be assigned to each drug candidate in the plurality of drug candidates based on the one or more composite scores for the plurality of samples. The drug candidate with the highest rank may be selected as an effective drug candidate.
- a subject with a fibrosis-related condition is treated, by determining one or more composite scores indicative of a phenotype of fibrosis for a biological tissue sample taken from the subject, using any of the systems and methods described herein; classifying the patient according to the phenotype in to select a treatment plan involving a therapeutic drug; determining an effective type and amount of the therapeutic drug based on the one or more composite scores; and administering the determined amount of the therapeutic drug to the subject.
- the aforementioned steps are repeated a number of times to track progression of the fibrosis-related condition during treatment.
- the amount of the therapeutic drug may be adjusted based on whether the patient responds to treatment, as determined by the one or more composite scores.
- a therapeutic drug is identified for use in treatment of a fibrosis-related condition, by determining one or more composite scores indicative of a predicted phenotype of fibrosis for a biological tissue sample taken from the subject, using any of the systems and methods described herein; administering a candidate drug to the subject; repeating the determining step to determine a fibrosis progression score of the subject over a period of time; and determining if the candidate drug is an effective therapeutic drug from the fibrosis progression score.
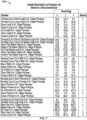
- the plurality of parameters are selected from one or more, 10 or more, 50 or more, 100 or more, 150 or more, 200 or more, 250 or more, or 300 or more of the quantifiable fibrosis parameters listed in Appendix A.
- the computerized systems described herein may comprise one or more engines, which include a processor or devices, such as a computer, microprocessor, logic device or other device or processor that is configured with hardware, firmware, and software to carry out one or more of the computerized methods described herein.
- the present disclosure relates to systems and methods for quantifying the phenotype of fibrosis (corresponding to the fibrosis observable traits) from a digital image of any tissue.
- the digital image reflects an optical biomarker that is specific to the collagens present in the tissue.
- the systems and methods for quantifying the fibrosis phenotype may be automated, and provide a continuous quantification of fibrosis in any kind of biological tissue from any digital image that depicts collagens in the biological tissue.
- the digital image is generally an image of a biological tissue prepared and stained for collagen and digitally acquired by Whole Slide Imaging (WSI) methods.
- the present disclosure is not limited to any specific tissue imaging method, so long as the digital image includes a distinguishing marker specific to one or multiple collagen molecules versus non-collagen molecules.
- the biological tissue could be from a human, animal or from any other biological system, and may be taken from the liver, lung, heart, muscle, skin, kidney, gut, uterus, eye, adipose tissue, tissue from the gastric intestinal tract, cancerous tissues in humans or animals, or any other organ or portion of the body or phenotypically relevant biosystem that is susceptible to fibrosis.
- the digital image may include a two-dimensional digital image(s), a three-dimensional digital image(s), a digital image stack(s), a static digital image(s), a time-course series of digital images, a digital movie(s), or any suitable combination thereof.
- the digital image includes an optical marker specific to collagen, either from collagen-specific stains used in histopathology methods, or from intrinsic bio-optical markers specific to collagen (and fibrosis) intrinsic to the optical imaging method (such as second harmonic generation) fibrosis, or in more general terms to any kind of collagen.
- an organ includes any of the aforementioned bodies or body portions, or it may include meso-biological systems such as spheroids or printed organs that can also develop fibrotic conditions.
- an organ can include any phenotypically relevant biosystem that is susceptible to fibrosis.
- an approach that uses continuous quantification uses a continuous scale to quantify the fibrosis.
- the continuous scale allows for precise tracking of fibrosis progression even on short timescales, and allows for tracking of response to treatment or treatment candidates of fibrosis.
- the present disclosure provides a scoring system for fibrosis that is continuous, and offers improved signal-to-noise ratio, detection threshold and dynamic range so that it can precisely quantify the fibrosis phenotype.
- the present disclosure has clinical applications in quantifying fibrosis of human patients, but also has pre-clinical applications in animal and other biological models.
- the fibrosis phenotypes correspond to fibrosis-related conditions having different outcomes of fibrosis disease.
- the fibrosis phenotypes correspond to disease severity, and may correspond to NASH-CRN F disease stages, which include F0, FI, F2, F3, and F4.
- the fibrosis phenotypes correspond to different values or ranges of a fibrosis-related biomarker that is indicative of progression (or regression) of fibrosis, severity of fibrosis, response to treatment, or any combination thereof.
- the fibrosis phenotypes correspond to different classes of fibrosis, such as NASH 1 versus NASH 2 in pediatric populations with NASH. Any of these examples of fibrosis phenotypes may be present in human and animal biological tissues and accordingly have both clinical and pre-clinical applications.
- a digital image of a biological tissue sample is assessed for multiple fibrosis phenotypes at the same time. Specifically, different composite scores may be assessed on the same digital image, where each composite score represents a different fibrosis phenotype.
- a fibrosis severity composite score, a fibrosis progression composite score, and a fibrosis type composite score may be assessed in parallel from the same digital image of a biopsy to determine how severe the disease is, how fibrosis is progression in the subject, and to classify the type of fibrosis in the subject, respectively.
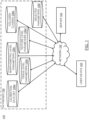
- FIGS. 1-2 depict a representative system 100 ( FIG. 1 ) and a high level flow diagram 200 ( FIG. 2 ) for implementing the systems and methods of the present disclosure, for quantifying the phenotype of fibrosis.
- FIGS. 3-9 show exemplary ways to extract various data from digital images taken of biological tissue samples having differing severity of fibrosis as defined by pathologists and widely proven by patient outcomes.
- the present disclosure relates to at least three levels of quantitatively characterizing fibrosis from an image.
- different levels of quantitatively characterizing fibrosis from an image correspond to different ways of characterizing the appearance and organization of collagens in the image.
- the different levels of the present disclosure relate to macroscopic characteristics of the collagens (tissue level), morphometric characteristics of the collagens (morphometric level), and organizational characteristics of the collagens (texture level).
- tissue level tissue level features that describe macroscopic characteristics of the collagens depicted in the digital image.
- FIGS. 5-7 relate to morphometric level features that describe morphometric characteristics of the collagens depicted in the digital image, and their relative histogram distributions from which several quantitative parameters are extracted.
- FIGS. 8-9 relate to texture level features that describe collective and regional organizations and shapes of the collagens depicted in the digital image, and their relative histogram distributions from which several quantitative parameters are extracted.
- FIGS. 3-4 tissue level features that describe macroscopic characteristics of the collagens depicted in the digital image.
- FIGS. 5-7 relate to morphometric level features that describe morphometric characteristics of the collagens depicted in the digital image, and their relative histogram distributions from which several quantitative parameters are extracted.
- FIGS. 10-12 relate to an illustrative method and example histogram plots for selecting which of the various quantitative parameters representing the features described in relation to FIGS. 3-9 to include in the generation of a composite score for representing the phenotype of fibrosis on a continuous scale.
- FIGS. 15-17 show that the phenotypic composite score of the present disclosure is able to track severity of fibrosis as well as regression of fibrosis, in response to treatment for instance, and improves upon known coarse categorical approaches to defining the fibrosis phenotype.
- FIG. 19 indicate that the phenotypic composite score of the present disclosure is able to classify patients as NASH 1 versus NASH 2.
- FIG. 1 depicts an exemplary system 100 for quantifying the phenotype of fibrosis from a digital image containing collagen-specific information in tissue, according to an illustrative implementation.
- the system 100 includes a server 104 and a user device 108 connected over a network 102.
- the server 104 and the user device 108 each include one or more processors to perform any of the methods or functions described herein.
- the term "processor” or “computing device” refers to one or more computers, microprocessors, logic devices, servers, or other devices configured with hardware, firmware, and software to carry out one or more of the computerized techniques described herein.
- Processors and processing devices may also include one or more memory devices for storing inputs, outputs, and data that is currently being processed.
- the user device 108 may include, without limitation, any suitable combination of one or more devices configured with hardware, firmware, and software to carry out one or more of the computerized techniques described herein.
- Examples of user devices include, without limitation, personal computers, laptops, and mobile devices (such as smartphones, blackberries, PDAs, tablet computers, etc.).
- the user device 108 includes a user interface, that includes, without limitation, any suitable combination of one or more input devices (e g., keypads, touch screens, trackballs, voice recognition systems, etc.) and/or one or more output devices (e g., visual displays, speakers, tactile displays, printing devices, etc.). While only one server and one user device are shown in FIG. 1 to avoid complicating the drawing, the system 100 can support multiple servers and multiple user devices.
- the user device 108 is a mobile device such as a smartphone or tablet.
- a mobile device such as a smartphone or tablet.
- one benefit of the systems and methods of the present disclosure is that they do not require particularly high resolution digital images. Even digital images with relatively low resolution, such as those captured on a device such as a smartphone or tablet, are able to be used with the techniques of the present disclosure, to quantify the fibrosis phenotype in a subject.
- the user device 108 may be capable of receiving a small plug-in device having a receptacle or a slot that holds a glass slide, such as a microscope slide containing the biological tissue sample, in place.
- the plug-in device may be configured to ensure uniform lighting for the slide, so that a camera on the user device 108 adequately captures the collagens in the tissue sample in a reproducible manner.
- FIG. 1 depicts system 100 as a network-based system for quantifying the phenotype of fibrosis
- the functional components of the system 100 may be implemented as one or more components included with or local to the user device 108, that includes a processor, a user interface, and an electronic database.
- the processor of the user device 108 may be configured to perform any or all of the functions of the processors of the server 102.
- the electronic database of the user device 108 may be configured to store any or all of the data stored in database 106 of FIG. 1 .
- the functions performed by the components of the system 100 may be rearranged.
- the server 104 may perform some or all of the functions of the user device 108, and vice versa.
- the database 106 is a distributed system of databases that includes a "calibration data set' database 106a, candidate parameter databases including "tissue level parameters” database 106b, “morphometric level parameters” database 106c,”texture level parameters” database 106d,”collagen classes” database 106e, and “selected parameters” database 106f.
- each database is a separate database, but any of the databases shown in FIG. 1 may be combined into a common database.
- the candidate parameter databases 106bd may be combined together into a single database, which may further be combined with the collagen classes database 106e, the calibration data set database 106a, or both.
- the calibration data set database 106a includes a set of calibration digital images taken from biological samples having known phenotypes of fibrosis, which may be stored in metadata corresponding to the digital images. Multiple sets of calibration digital images may be stored in the calibration data set database 106a, where die different sets of images correspond to different fibrosis phenotypes, such as severity of fibrosis, type of fibrosis, or different stages of progression or regression of fibrosis.
- the digital image is generally an image of a biological tissue prepared and stained for collagen and digitally acquired by Whole Slide Imaging (WSI) methods.
- WSI Whole Slide Imaging
- the biological tissue could be from a human, animal or from any other biological system, and may be taken from the liver, lung, heart, muscle, skin, kidney, gut, uterus, eye, adipose tissue, tissue from the gastric intestinal tract, cancerous tissues in human or animals, or any other organ or portion of the body or phenotypically relevant biosystem that is susceptible to fibrosis.
- Each calibration digital image is accompanied by metadata associated with the image, such as data regarding the patient or animal (e.g., species, age, gender, genotype, race, blood or genetic biomarker data,), the nature, characteristics, locations of the collagen biomarker (e.g.
- Second Harmonic Generation channel or type and color of the histopathology collagen specific marker
- image annotations on the image e.g., regions of the image to exclude from the analysis
- the fibrosis phenotype or severity stage of fibrosis as assessed by a physician, pathologist, or any other expert, body region or organ that is depicted in the image, whether the patient or animal has been treated for fibrosis or another medical condition and the corresponding treatment protocol, or any oilier suitable patient data
- data regarding the image e.g., when the image was taken, the imaging modality, image dimensions, or any other suitable image data.
- the set of calibration digital images stored in the calibration data set database 106a may-include multiple subsets of calibration digital images, corresponding to different patient or animal populations, which may be further grouped according to specific sub-populations.
- the sub-populations may include control groups having no disease and one or more disease states. and test groups having variable treatment plans, such as different dosages of a drug or therapy.
- the sub-populations correspond to wild-type and genetically modified animal models such as knock-out animals, so that the present disclosure can be used to study the physiological mechanisms of fibrosis, its progression, and response to treatment, or to identify and quantify traits of fibrosis that are different from such two genetic models, or to establish a scoring technique that can be used to classify such two models in a blinded way.
- the candidate parameter databases 106b-d include candidate parameters, each of which is a quantitative measurement that characterizes the calibration digital images in the calibration data set 106a.
- the candidate parameters and examples of how they are derived from individual digital images are described in detail below, with reference to FIGS. 3-9 .
- the candidate parameters quantitatively assess the digital images at three different levels. Specifically, for the collagens depicted in a digital image, tissue level parameters quantify macroscopic characteristics of the collagens, morphometric level parameters quantify morphometric (e.g., shape and size) characteristics of the collagens, and texture level parameters quantify an organization of the collagens.
- parameters at any one level may sometimes be sufficient for characterizing the fibrosis phenotype in a subject
- combining parameters from different levels generally results in a robust and accurate method to quantify phenotype of fibrosis.
- the collagen classes database 106e represent various classes of collagen that may be depicted in the calibration digital images.
- the collagen class corresponds to a specific type of collagen that is depicted in the image, which may exhibit differently for different fibrosis phenotypes.
- using quantitative parameters e.g., any of the candidate parameters described in relation to 106b-d
- any of the candidate parameters in databases 106b-d may reflect total collagen depicted in an image, one specific collagen class depicted in the image, or multiple, but not all, collagen classes depicted in the image.
- Example collagen classes include single collagen fibers, bundles of collagen fibers, diffuse collagen tissue regions, fine collagen, assembled collagen, tissue regions, long collagens, short collagens, high textured regions, low textured regions, highly complex collagen skeleton, less complex collagen skeleton, any other suitable type of collagen, or any combination thereof.
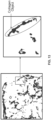
- FIGS. 13 , 14 , and 18 depict example representations of how the system identifies different collagen objects in an image, and how the system distinguishes between different collagen classes such as fine collagen and assembled collagen, respectively.
- the system may perform image processing on the raw digital image to identify certain regions of the digital image as being representative of collagen or a specific form of collagen. In o titer words, the digital image may be masked to identify specific regions as collagen.
- Different collagen classes may be useful for distinguishing different fibrosis phenotypes. For example, quantitative parameters for fine collagen may be used for distinguishing less severe fibrosis stages (e g., F0, FI, F2), while quantitative parameters for assembled collagen may be used for distinguishing more severe fibrosis stages (e.g., F2, F3, F4).
- the selected parameters database 106f corresponds to the set of quantitative parameters from databases 106b-d (and optionally 106e) that are selected for inclusion in a composite score that quantifies phenotype of fibrosis.
- An example process for selecting tire parameters in database 106f from the candidate parameters and calibration data set is described in detail in relation to FIGS. 10-12 .
- the selected parameters correspond to those that distinguish between fibrosis phenotypes for a target subject population, that may reflect a specific species, age, race, gender, disease state, any other suitable characteristics, or a combination thereof.
- the selected parameters may be those that, for the digital images in the calibration data set corresponding to the relevant target subject population, are able to distinguish across different fibrosis phenotypes without introducing a large amount of noise.
- the selected parameters stored in the selected parameters database 106f may be different for different objectives. For example, a first set of parameters are selected for characterizing disease severity (e g., to derive a composite score that provides a continuous scale for F0-F4). A second set of parameters may be selected for characterizing progression of fibrosis. A third set of parameters may be selected for characterizing regression of fibrosis in response to treatment, such as a drug. A fourth set of parameters may be selected for classifying the type of fibrosis (e g., to derive a composite score that provides a continuous scale and is thresholded by a cut-off value to classify the subject as a type of fibrosis, such as NASH 1 versus NASH 2).
- a first set of parameters are selected for characterizing disease severity (e g., to derive a composite score that provides a continuous scale for F0-F4).
- a second set of parameters may be selected for characterizing progression of fibrosis.
- a third set of parameters may be selected for characterizing
- any of the parameters selected for the first, second, third, and fourth sets may overlap with one another, but generally, each of the described sets of parameters may include one or more parameters that are unique to that set, or that are not included in every other set.
- Each set of selected parameters is used to compute a different composite score, with a specific objective. In this manner, for a single digital image of a biological tissue sample, different sets of selected parameters may be applied to derive different composite scores, to reflect multiple objectives (e g., characterizing the disease severity and type of fibrosis) at the same time.
- the selected parameters stored in the selected parameters database 106f may be specific to a certain set of calibration digital images that share similar metadata, such as patients of a specific population (e.g., age, race, gender, symptoms, blood test data), and different sets of selected parameters may be applicable to different populations.
- the parameter's distribution of values (across the relevant calibration digital images for a specific fibrosis phenotype) is evaluated for its mean and standard deviation, and the mean and standard deviation are evaluated for different fibrosis phenotypes. If the mean value changes for different fibrosis phenotypes, and the standard deviation for the individual phenotypes is not too large, then the parameter is selected. As is described in more detail below, die selected parameters are combined to provide one or more composite scores that quantify the fibrosis phenotype of the human or animal in tire digital image. It should be understood that the techniques and examples described in relation to FIGS. 10-12 are shown for illustrative purposes only, other methods of selecting informative parameters from a set of candidate parameters may be used without departing from the scope of the present disclosure.
- the user device 108 provides a digital image taken of a histopathology tissue section, to the server 104 over the network 102.
- the digital image may include a two-dimensional digital image(s), a three-dimensional digital image(s), a digital image stack(s), a static digital image(s), a time-course series of digital images, a digital movie(s), or any suitable combination thereof.
- the digital image includes an optical marker specific to collagen, either from collagen-specific stains used in histopathology methods, or from intrinsic bio-optical markers specific to collagen (and fibrosis) intrinsic to the optical imaging method (such as second harmonic generation) fibrosis, or in more general terms to any kind of collagen.
- the digital image from the user device 108 may not be associated with a known phenotype of fibrosis.
- the fibrosis phenotype may be known, or already assessed by a pathologist or clinician, but the present disclosure is used to validate that assessed phenotype.
- other metadata may accompany the digital image, such as any of the other metadata described in relation to database 106a. That metadata may be used to determine which parameters to include in the composite score calculation. For example, the metadata may inform which subset of calibration digital images should be applied, and therefore which selected parameters to use to compute the composite score.
- the server 104 performs a computational analysis on the digital image to obtain a score (or scores) that quantify the entire fibrosis phenotype, or a subset of the phenotype. That score can be used to describe the severity, progression, regression, or type of the fibrosis in the tissue sample.
- tire server 104 performs the method 200 described in relation to FIG. 2 , which is based on a set of quantitative parameters that are described in relation to FIGS. 3-9 , which are selected based on a calibration technique, such as the one described in relation to FIGS. 10-12 .
- the server 104 computes only a single score that characterizes the fibrosis in the digital image received from the user device 108.
- the server 104 computes multiple composite scores, each of which characterizes the fibrosis in the digital image.
- different composite scores may be computed for the same digital image, including one composite score that quantifies the disease severity (e.g., F0-F4), optionally another composite score that quantifies the progression of fibrosis, optionally another composite score that quantifies the regression of fibrosis in response to treatment, and optionally another composite score that quantifies the type of fibrosis (e.g., NASH 1 versus NASH 2).
- different quantitative parameters are selected to be specific to the objective (e.g., to quantify severity, progression, regression, or type of fibrosis), as is discussed in more detail in relation to FIG. 10 .
- different composite scores are computed for different levels of features. Specifically, a separate composite score may be computed for tissue level parameters, morphometric level parameters, and texture level parameters, or for any combination of two levels (e.g., tissue and morphometric, morphometric and texture, or tissue and texture). Then, the resulting composite scores may be combined into a single value, or combined as a vector to represent the fibrosis phenotype. In some implementations, using different composite scores for different levels of features is one way to remove potential biases that may be introduced as a result of one level having significantly more selected parameters than another level. Generally, the composite scores may be normalized by the number of selected parameters in a particular group, such as the level.
- the server 104 may save the composite score(s), the original digital image, any metadata associated with the digital image (e.g., patient information such as race, gender, age, blood test data, or image information such as imaging modality, resolution, when the sample or image was taken) and any indication of the extracted features of the digital image to produce the composite score(s) into database 106, or any other suitable database accessible to the server 104.
- Saved data may further include the parameters calculated from the digital image, and any processed versions of the digital image, such as those that indicate locations of specific collagen objects ( FIG. 13 ) or certain collagen classes ( FIG. 14 ).
- the imaging method to take the digital image of the biological tissue sample involves an optical marker specific to collagen.
- That optical marker may be from collagen-specific stains used in histopathology methods, from intrinsic bio-optical markers specific to collagens (and fibrosis) intrinsic to the optical imaging method (such as second harmonic generation) fibrosis, or in more general terms to any kind of collagen.
- the server 104 performs some pre-processing of the digital image when the digital image is received. Such pre-processing may include identification of the collagens that appear in the digital image, examples of which are depicted in FIGS. 13-14 and 18 .
- FIG. 13 depicts an example of detection of a collagen object in a digital image, from a set of adjacent pixels that represent an amount of collagen.
- FIG. 13 depicts an example of detection of a collagen object in a digital image, from a set of adjacent pixels that represent an amount of collagen.
- FIG. 13 depicts an example of detection of a collagen object in a digital image, from a set of adjacent pixels that represent an amount
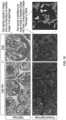
- FIG. 14 depicts a preprocessed digital image in which different collagen classes are identified, including steatosis, fine collagen, and assembled collagen.
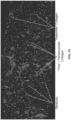
- FIG. 18 depicts another example of a raw, unprocessed digital image (top row) and the processed version (bottom row), depicting identification of different collagen objects of different types, indicated by grayscale intensity.
- pre-processing may include color-based segmentation, thresholding, filtering, enhancement, texture analysis, binarization, edge detection, region analysis, Fourier transformation, object detection, object analysis segmentation, skeletonization, machine learning, deep learning for image processing, 2D and 3D variants of any of these techniques, and any other computational technique that can enrich the extraction of collagens from an image.
- the server 104 processes the image received at step 220, to quantify a plurality of parameters, each parameter describing a feature of the collagens in the biological tissue sample that is expected to be different for different phenotypes of fibrosis.
- the quantitative parameters represent various features of collagens appearing in the digital image, either individually or as a group, and are the same parameters described above, selected from the set of candidate parameters stored in databases 106b-d and described below in detail in relation to FIGS. 3-9 .
- the quantitative parameters are generally sorted into three levels and are described in detail in relation to FIGS. 3-9 .
- these quantitative parameters can be categorized into at least three distinct levels: (1) the tissue level, in which collagen is measured macroscopically as an aggregation of collagens across the image; (2) the morphometric level, which quantifies the shape and size of individual collagens (or collagen objects); and (3) the texture level, which quantifies the organization of the collagens with respect to one another across the image.
- FIGS. 3-9 depict how different types of parameters are used to quantify fibrosis in digital image.
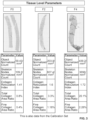
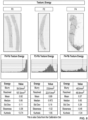
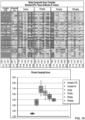
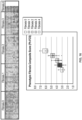
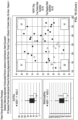
- FIGS. 3 , 5-6 , and 8 depicts a set of three exemplary digital images of tissue samples (included in the calibration data set, for example) having different known fibrosis phenotypes (e.g., F0, F2, and F4). The same three digital images are repeated in each of FIGS. 3 , 5-6 , and 8 .
- Below each image in each of these figures is a table that lists example quantitative parameters that represent tissue level features ( FIG. 3 ), morphometric level features ( FIGS. 5-6 ), or texture level features ( FIG. 8 ) for each fibrosis phenotype of F0, F2, and F4.
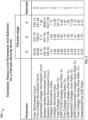
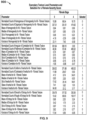
- FIGS. 4 , 7 , and 9 show data structures that summarize the tissue level features ( FIG. 4 ), morphometric level features ( FIG. 7 ), and texture level features ( FIG. 9 ) and indicate whether each parameter is selected to be included in the generation of the composite score.
- FIGS. 5-9 morphometric level and texture level
- the quantitative parameters are based on histogram analysis, as is described in detail below.
- the figures only indicate exemplary quantitative parameters, and are for illustrative purposes only. For simplicity of the figures, not all possible parameters are shown, and it should be understood that different parameters could be used without departing from the scope of the present disclosure.
- the appendix includes another exemplary list of quantitative parameters that may be used, but different parameters could also be included, such as different metrics and statistics, including those of different cut-off values than indicated.
- each quantitative parameter described herein may be representative of the collagen as a whole (e.g., total collagen represented in the digital image), or may otherwise only represent a portion of the depicted collagen.
- the parameters may be computed only on specific area of the tissue (e.g., border, portal region, around glomeruli in the kidney, or any other suitable specific area), in subgroups or classes of the collagen, such as large versus small collagen (as defined by the form factors of their skeleton), faint versus dense collagen (as defined by the average optical/pixel/intensity value), individual versus bundles of collagen fibers, fine versus assembled collagen (see FIG. 14 ), other suitable classes of collagen, or any suitable combination thereof. Limiting certain quantitative parameters to specific areas or subgroups of the total collagen depicted in the digital image may lead to more precision for quantifying fibrosis phenotype in the final scoring system.
- tissue level parameters relate to a single value characterization of the collagen depicted in the digital image (e.g., tissue level parameters).
- Other parameters relate to multiple value characterization, and involve statistics (e.g., computed from histograms) to account for trends (e.g., mean), transition (e.g., statistics limited to above or below cut-off values, or ranges in between cut-off values), or variability (e.g., standard deviation, kurtosis).
- trends e.g., mean
- transition e.g., statistics limited to above or below cut-off values, or ranges in between cut-off values
- variability e.g., standard deviation, kurtosis
- morphometric level parameters and/or texture level parameters relate to single value characterization.
- the cut-off values segment a distribution into multiple sections, so as to create different statistics for the sections. For example, long versus short collagen fibers may be defined by a cut-off value separating long versus short. Similarly, another cut-off value may define low versus high texture entropy.
- the selection of cut-off values may be performed by a user, and optimized for specific tissues. For example, a low cut-off value for length may be used for rodents, while a higher cut-off value for length may be used for larger animals.
- the user may select the cut-off value depending on the phenotyping objective, such as detection of a fibrosis phenotype with low severity (e.g., FO, FI, F2) compared to higher severity (e.g., F2, F3, F4)
- a fibrosis phenotype with low severity e.g., FO, FI, F2
- higher severity e.g., F2, F3, F4
- tissue level parameters include the object normalized count, skeleton nodes normalized count, collagen reticulation index, total collagen area ratio, the large collagen object normalized density (count per area of surface), the small collagen object normalized density, and others.
- some parameters correspond to transformations of one or more other parameters.
- total collagen area ratio is one parameter listed in FIG. 4 , and so is its square root.
- the assembled/fine CAR ratio is a parameter that corresponds to a transformation of two other parameters: the assembled CAR and fine CAR.
- these features describe the morphometric characteristics (or the shape and dimensions) of the collagens in the digital image. Because there is generally more than a single collagen (e g., one fiber) depicted in the digital image, and in severe cases, that could be many collagens or collagen objects (e.g., multiple fibers, bundles of fibers, or tissue regions) depicted in the image. Rather than including a different value characterizing each individual collagen fiber as a parameter, the approach described herein uses a histogram analysis to analyze the distribution of morphometric values across the collagens or collagen objects appearing in the image.
- the quantitative parameters describing morphometric level features correspond to statistics that can be derived from the histogram (or distribution of values), such as normalized count, mean, median, standard deviation, skew, kurtosis, and any other suitable statistic.
- Example morphometric characteristics that are used to generate the histograms include length, skeleton length, width, eccentricity, solidity, curvature ration, area, perimeter, collagen density, color intensity, form factors such as area to perimeter ratio, or color to curvature ratio, and any other relevant parameter that describes the shape, dimensions, or appearance of collagens.
- these features describe the organization, or distribution, of the collagens in the digital image.
- the approach described herein uses a histogram analysis, similar to the morphometric level analysis described above in relation to FIGS. 5-7 .
- the texture level features involve a distribution of values across different regions of the digital image. For example, a sample value may be measured from a sample window (having size smaller than the size of the overall digital image) of the digital image.
- a set of sample values are derived as the sample window is shifted (in a overlapping or non-overlapping maimer) in both dimensions (x- and y-directions) across the digital image. That set of sample values corresponds to a sample distribution for the texture level analysis, which generates a histogram of the sample values for a digital image.
- the quantitative parameters describing texture level features correspond to statistics that can be derived from the histogram (or distribution of values), such as normalized count, mean, medium, standard deviation, skew, kurtosis, and any other suitable statistic.
- Example texture characteristics that are used to generate the histograms include second order statistics including the collagen image pixel intensity level co-occurrence matrix and subsequent calculation of parameters such as energy, homogeneity, correlation, inertia, entropy, skewness, kurtosis, related GLCM parameters, and any other relevant parameter that describes the organization of collagens in an image.
- the server 104 combines the plurality of parameters quantified at step 222, to obtain one or more composite scores indicative of a phenotype of fibrosis for the biological tissue sample.
- the composite score may be derived based on a mathematical transfer function that combines some or all of the quantitative parameters computed at step 222, such as a sum of the selected quantitative parameters, where the sum can be a normalized sum or a weighted sum.
- the composite score precisely quantifies the fibrosis phenotype (generally along a continuous scale so that it improves upon the coarse, categorical approaches of the prior art by providing wide dynamic range and high resolution), and can be used to describe the state of fibrosis in the biological tissue sample, progression of fibrosis in the sample, or regression of fibrosis in the sample in response to treatment.
- Derivation of the method to compute the composite score may involve manual and/or automated methods that reduce the dimension of the calibration data set (by identifying candidate parameters that have the best signal-to-noise and are validated by existing models of fibrosis (such as METAVIR), as described below with reference to FIGS. 10-12 ), identify correlations and/or principal components, or any combination thereof.
- multiple composite scores may be computed, where each composite score is specific to a particular level (e.g., tissue, morphometric, or texture) and/or collagen class (e.g., fine or assembled). For example, a Tissue-Level Fibrosis Composite Score, a Morphometric-Level Composite Score, a Texture-Level Composite Score, and/or a phenotypic composite score may be calculated. Then, the resulting composite scores may be combined to obtain a single value for quantifying the fibrosis phenotype. Alternatively, the multiple composite scores may remain separate as a vector of a small set of numbers that describe the fibrosis phenotype. The composite score may be referred to herein as the Fibrosis Composite Score.
- FIGS. 10-12 provide ways to select specific parameters from the list of candidate quantifiable parameters, for inclusion in the computation of the composite score.
- the calibration process 1000 selects parameters from a set of candidate parameters that are computed based on a set (or a relevant subset) of calibration digital images.
- the selected parameters are included in the calculation of a composite score that quantifies phenotype of fibrosis, so the selected parameters should distinguish between fibrosis phenotypes for a specific target subject population (e.g., corresponding to the subject of the digital image that is uploaded by the user device 108, for example).
- the selected parameters are those that, for the digital images in the calibration data set corresponding to the relevant target subject population, are able to distinguish across different fibrosis phenotypes without introducing a large amount of noise.
- the server 104 receives the calibration digital images 1030 (described in relation to the calibration data set database 106a), and separates the calibration digital images 1030 according to fibrosis phenotype.
- the fibrosis phenotypes correspond to fibrosis-related conditions having different outcomes of fibrosis disease. Those different outcomes may correspond to different disease severity (e.g., NASH-CRN F disease stages, which include F0, F 1 , F2, F3, and F4), different values or ranges of a fibrosis-related biomarker that is indicative of progression of fibrosis, regression of fibrosis in response to treatment, or both, or different classes of fibrosis (e.g., NASH 1 versus NASH 2).
- the fibrosis phenotypes of the digital images are known, and are as evaluated by a physician or pathologist (e.g., F0, FI, F2, F3, F4, NASH 1, NASH 2, etc.).
- the calibration digital images 1030 are separated into different categories according to their corresponding known fibrosis phenotypes.
- the calibration digital images 1030 may be further separated according to other metadata associated with the images 1030.
- the calibration digital images 1030 may be separated according to specific population data, such as race, gender, age, organ, or any other known data associated with the calibration digital images 1030.
- a fibrosis phenotype iterative parameter i is initialized to one.
- the server 104 receives three sets of candidate parameters (e.g., candidate tissue level parameters 1036, candidate morphometric level parameters 1038, and candidate texture level parameters 1040) are received, and for the i-th fibrosis phenotype, processes the corresponding calibration digital images 1030 to obtain mean and standard deviation of each candidate parameter.
- candidate parameters e.g., candidate tissue level parameters 1036, candidate morphometric level parameters 1038, and candidate texture level parameters 1040
- the digital images When the digital images are evaluated for the quantitative parameters, all of the image may be processed, or just some of the image may be processed, such as regions of the image corresponding to a specific target location of the biological tissue sample.
- the collagens in the image may be located in the septal region, the portal region, the peri-vascular region, the collagen capsule, or structural collagen regions. Any of these regions or a combination thereof may be included for assessment. An understanding of these regions may also inform the selection of candidate parameters.
- anatomically relevant collagens may include septal bridges in liver or glomeruli in kidney, that have expected sizes, shapes, and arrangements.
- the digital images may be preprocessed to identify certain collagen objects (see FIG. 13 ) or to identify certain collagen classes (see FIG. 14 ).
- some of the candidate parameters 1036, 1038, and 1040 may correspond to the total collagens in the image, or a subset of the collagens, such as those of a particular collagen class or classes. If the i-th fibrosis phenotype is not the last fibrosis phenotype to be considered (decision block 1044), the iterative parameter i is incremented (step 1046) and the process 1000 returns to block 1042 to evaluate the mean and standard deviation of each candidate parameter for the next fibrosis phenotype. This process is repeated until all fibrosis phenotypes are considered (e.g., the i-th fibrosis phenotype is the last fibrosis phenotype..
- the corresponding calibration digital images 1030 are identified (having known fibrosis phenotypes corresponding to the i-th fibrosis phenotype).
- the set of candidate parameters across the three levels (1036, 1038, and 1040) are evaluated, to generate an NxM matrix, where N corresponds to the total number of candidate parameters, and M corresponds to the number of calibration digital images for the i-th fibrosis phenotype.
- the mean and standard deviation of the M corresponding values are evaluated.
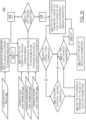
- the process 1000 evaluates the means and standard deviations of each candidate parameter to determine whether the respective candidate parameter has a signal (e.g., distinguishes between different fibrosis phenotypes of the calibration data set) without introducing much noise (e.g., low standard deviation within a given fibrosis phenotype of the calibration data set).
- the server 104 proceeds to step 1048 to initialize a candidate parameter j to one.
- the server 104 assesses the rate of change of the mean for different fibrosis phenotypes, to determine whether the j-th candidate parameter distinguishes between different fibrosis phenotypes.
- the rate of change may be assessed across different types of fibrosis so as to determine whether the j-th candidate parameter can distinguish between types, or across different stages of fibrosis progression, so as to determine whether the j-th candidate parameter can distinguish between different severities of fibrosis.
- the server 104 determines whether the rate of change evaluated at step 1050 is above a first threshold, to determine whether the j-th candidate parameter distinguishes between fibrosis phenotypes. If so, the server 104 proceeds to step 1054 to determine whether the standard deviation for the j-th candidate parameter is below a second threshold. If so, the server 104 proceeds to step 1056 to add the j-th candidate parameter to a set of selected parameters. Then, if the j-th parameter is not the last candidate parameter (decision block 1058), then the iterative candidate parameter) is incremented (step 1062), and the server 104 returns to block 1050 to consider the next j-th candidate parameter.
- the server 104 For any j-th parameter for which the rate of change is below (or equal to) the first threshold (decision block 1052) or the standard deviation is above (or equal to) the second threshold (decision block 1052), the server 104 skips step 1056, does not add the j-th parameter to the set of selected parameters, and proceeds to the next parameter. These steps (1050, 1052, 1054, 1056, 1058, and 1062) are repeated until all M candidate parameters have been considered and are either selected or not selected. At step 1060, the server 104 outputs the set of selected parameters.
- FIG. 11 depicts four plots of exemplary mean values of normalized candidate parameters (y-axes) for different fibrosis phenotypes (x-axes, representing fibrosis progression with increasing disease severity). As depicted in FIG. 11 , many candidate parameters do not change much for different fibrosis phenotypes, and thus have relatively flat slopes. These candidate parameters with flat slopes (e.g., rate of change around zero) are generally not selected because they do not distinguish between the different fibrosis phenotypes (decision block 1052).
- candidate parameters exhibit moderate or large rates of changes and have positive, significant slopes. These candidates are more likely to be selected because they correlate in a positive manner with the different fibrosis phenotypes (e.g., they increase with increasing disease severity or fibrosis progression). However, if these candidate parameters are associated with large standard deviations (decision block 1054), in either one or more fibrosis phenotypes, then that candidate parameter is not selected because it would introduce undesirable noise to the composite score calculation that could outweigh the benefit of being able to distinguish between fibrosis phenotypes.
- the present disclosure allows for different parameters to be selected for distinguishing between different sets of fibrosis phenotypes. For example, a first set of parameters may be selected to distinguish between F0 and F2, and a second set of parameters (with potential for overlap with the first set of parameters) may be selected to distinguish between F2 and F4.
- the system may take an adaptive approach that generates a first composite score for the first set of parameters, and a second composite score for the second set of parameters, and then align the two composite scores (e.g., by adding an offset to one or both of the scores) so that they have the same value where they meet (i.e., for the F2 phenotype).
- the system may align the derivatives of the two composite scores so that the slopes are the same for the F2 phenotype.
- FIG. 12 depicts an exemplary plot showing the noise versus rate of change of various quantitative parameters in a calibration data set for a specific population, according to an illustrative implementation.
- the x-axis of FIG. 12 corresponds to an absolute value of the rate of change of the mean of a candidate parameter across different fibrosis phenotypes of the calibration data set, while the y-axis corresponds to the noise of the candidate parameter (e.g., represented by standard deviation).
- Each dot corresponds to a different candidate parameter.
- the vertical line at a rate of change of about 2 corresponds to the first threshold (decision block 1052), and the horizontal line corresponds to the second threshold (decision block 1054).
- the candidate parameters corresponding to dots below and to the right of the threshold lines have low signal-to-noise ratios, and are selected for inclusion in computation of the composite score.
- the other candidate parameters above or to the left of the threshold lines are not selected.
- the rate of change and standard deviations are simply compared to first and second thresholds, respectively, but in general, more complex calculations may be used.
- PC A principal component analysis
- an input matrix may be provided, that includes the parameter values for the set of candidate parameters, for the different known fibrosis phenotypes (e.g., F0-F4).
- the output of the PCA corresponds to the parameters that account for the variation in collagen features for the different fibrosis phenotypes.
- steps of the process 1000 are depicted in FIG. 10 in a particular order, but it should be understood that the order of any step of the process 1000 is not necessarily dependent on a previous step. For example, any of the steps of process 1000 may be reversed, or performed in parallel with other steps, without departing from the scope of the present disclosure, as long as any steps that depend on other steps are performed subsequent to those steps. Moreover, the process 1000 is described as being performed by the server 104, but any of the steps, including all of them, could be performed locally on the user device 108 or any other suitable device capable of receiving the digital image directly or indirectly from the user device 108.
- the present disclosure provides several advantages over known categorical approaches to phenotyping fibrosis. Several advantages are applicable to patients. Specifically, for the patient having a fibrosis-related condition, the present disclosure improves to improve the evaluation and follow up of fibrotic disease conditions such as IPF, Inflammatory Bowel Disease (IBD), Hepatitis (A, B, or C), Chronic Kidney Disease, scleroderma, Macular degeneracies, NASH, Alcoholic Steatosis Hepatitis (ASH), Cirrhosis, Primary Biliary Cholangitis and Primarily Biliary Cirrhosis, renal disease, scarring, Duchenne muscular dystrophy, myocardial infarction and repair, glaucoma uterine, all kinds of manifestation of fibrosis in cancers, among others by providing a robust and accurate way to evaluate both severity of fibrosis and phenotype of fibrosis progression and presenting the patient's fibrosis phenotype in a simple score.
- the scoring systems and methods disclosed herein provide a continuous scale that has a high detection threshold and wide dynamic range to quantify fibrosis phenotype of the biological tissue with sensitivity and precision. Due to its very high signal-to-noise, the present disclosure is sensitive to even slight changes in fibrosis progression in a patient, on shorter time scales than previously allowed with coarse systems. In other words, the scoring systems and methods disclosed herein improve upon earlier fibrosis phenotyping approaches because they do not require waiting for long periods of time before detecting a change in the progression of fibrosis. The robustness of the fibrosis scoring systems and methods disclosed herein also improve the efficiency of development and approval of new therapeutics, by being able to detect small changes in both progression and regression of fibrosis in response to treatment.
- the present disclosure also provides scoring systems and methods that are specific to a particular fibrosis phenotype of the patient or expressed in the image of the biological tissue. For example, the scoring systems and methods could distinguish between to pediatric NASH type I versus pediatric NASH type P. Other fibrosis phenotypes may exist, such as T2-diabetes induced NASH versus obesity induced NASH.
- the present disclosure improves the personalized management of fibrotic disease therapeutic regimens, such as treatments for IPF, Inflammatory Bowel Disease (IBD), Hepatitis (A, B, or C), Chronic Kidney Disease, scleroderma, Macular degeneracies, NASH, Alcoholic Steatosis Hepatitis (ASH), Cirrhosis, Primary Biliary Cholangitis and Primarily Biliary Cirrhosis, renal disease, scarring, Duchenne muscular dystrophy, myocardial infarction and repair, glaucoma uterine, all kinds of manifestation of fibrosis in cancers, among others.
- IPF Inflammatory Bowel Disease
- Hepatitis A, B, or C
- Chronic Kidney Disease scleroderma
- Macular degeneracies Macular degeneracies
- NASH Alcoholic Steatosis Hepatitis
- ASH Alcoholic Steatosis Hepatitis
- Cirrhosis Primary Biliary Cholangitis and Primari
- the present disclosure has no such issue.
- the present disclosure provides a robust, sensitive, accurate, and reproducible way to evaluate fibrosis, which allows for an improved monitoring of patients during clinical trials.
- the systems and methods disclosed herein can also be fully automated, meaning that throughput is high, and a pathologist is not needed for scoring.
- the present disclosure is also fully compatible with existing workflows in the pathology labs, as images can be processed in real time.
- the present disclosure may be used to identify biomarkers or other characteristics that correlate with fibrosis, that may not have been otherwise identified.
- the systems and methods of the present disclosure provide an efficient and robust way of analyzing and phenotyping digital images of tissue samples, such as those in the calibration data set described above.
- the calibration data set further includes metadata corresponding clinical data, such as blood test data
- the present disclosure may be used to identify certain biomarkers in the blood test data (or any other characteristic of the subject, such as age, race, gender) that correlate with the severity, progression, regression, or type of fibrosis. For example, male and female subjects may exhibit fibrosis differently from one another, and may respond to treatment differently. These differences can be assessed and characterized with the systems and methods of the present disclosure.
- the present disclosure improves translational research and product launches by gathering comprehensive high quality data related to animal and/or patient reaction to investigational compounds, hence increasing the likelihood of successfully developing new anti-fibrotic drugs, and/or minimize or reduce the fibrosis-related side effects of new or existing drugs. Because the scoring systems and methods can be automated, they are suitable for mid-throughput and even high-throughput workflows, which are more likely to accelerate the discovery of new therapeutic compounds. Moreover, the present disclosure is translational and applies both to pre-clinical models and clinical, across all kinds of fibrotic diseases and oncology (stromae).
- the continuous, robust, sensitive, accurate and reproducible scoring methods and systems disclosed herein provide an efficient, quantitative, unbiased, and automated way to evaluate fibrosis during pre-clinical trials (see FIG. 15 ) and clinical trials (see FIG. 16 ).
- the present disclosure reduces the number of animals (or patients) required to obtain statistically relevant data.
- the systems and methods disclosed herein examine multiple quantitative parameters that describe fibrosis stages, progression, and regression, which can be used to support a detailed understanding of the effect of investigational compounds, and optionally the mechanism of action of those compounds.
- FIG. 15 depicts on the left, a heat map of a set of selected quantitative parameters (y-axis) describing collagen features in a calibration data set for different populations, including control, untreated, vehicle, and treated at different doses (10, 30, and 100 mg/kg), and on the right, a bar graph showing the fibrosis composite score is able to track the different stages of disease, including response to treatment, according to an illustrative implementation.
- FIG. 16 depicts on top, a heat map of a set of selected quantitative parameters (y-axis) describing collagen features in a calibration data set for different populations, including F0, FI, F2, F3, and F4 (x-axis), and on the bottom, a bar graph showing the fibrosis composite score is able to track the different stages of the disease, according to an illustrative implementation.
- FIG. 19 depicts two heat maps of a set of candidate quantitative parameters (y-axes) describing collagen features in a calibration data set for different NASH 1 and NASH 2 populations, for F0, FI, and F2 patients.
- the fibrosis composite score is able to correctly classify the patients as NASH 1 versus NASH 2 about 85% of the time, according to an illustrative implementation.
- the present disclosure can be specific to the fibrosis phenotype of its patient: for instance pediatric NASH type 1 vs pediatric NASH type 2, or T2-diabetes induced NASH versus obesity induced NASH, the scoring systems and methods can be used to better understand the response of the patient to treatment, or the lack thereof.
- the present disclosure may be developed into an automatic diagnostic tool for patient, hence accelerating the access to important patient information while reducing the cost of the diagnostic.
- the scoring systems and methods of the present disclosure are consistent with existing methods of characterizing fibrosis (see FIG. 17 ), but improves upon those categorical methods by providing a wide dynamic range and fine resolution for quantifying fibrosis.
- FIG. 17 depicts data indicating the fibrosis composite score correlates with the Nakanuma fibrosis stages, and provides improved dynamic range relative to the Nakanuma system, according to an illustrative implementation.
- NASH tissues tend to include fat vacuoles, and the systems and methods of the present disclosure may be used to characterize tissue features such as fat vacuoles.
- a machine learning technique may be used without departing from the scope of the present disclosure, that analyzes a training data set with user-defined feature classification criteria, to learn the optimal combination of image features that best distinguish between fibrosis phenotypes.
- artificial intelligence and machine learning techniques may be applied to reduce the dimension of the set of candidate parameters, identify correlations between parameters and fibrosis phenotypes, and identify principal components to establish meaningful composite scores.
Landscapes
- Engineering & Computer Science (AREA)
- Theoretical Computer Science (AREA)
- Physics & Mathematics (AREA)
- Computer Vision & Pattern Recognition (AREA)
- General Physics & Mathematics (AREA)
- Health & Medical Sciences (AREA)
- General Health & Medical Sciences (AREA)
- Multimedia (AREA)
- Medical Informatics (AREA)
- Artificial Intelligence (AREA)
- Evolutionary Computation (AREA)
- Life Sciences & Earth Sciences (AREA)
- Software Systems (AREA)
- Databases & Information Systems (AREA)
- Computing Systems (AREA)
- Data Mining & Analysis (AREA)
- Biomedical Technology (AREA)
- Molecular Biology (AREA)
- Quality & Reliability (AREA)
- Nuclear Medicine, Radiotherapy & Molecular Imaging (AREA)
- Radiology & Medical Imaging (AREA)
- Bioinformatics & Computational Biology (AREA)
- Evolutionary Biology (AREA)
- General Engineering & Computer Science (AREA)
- Bioinformatics & Cheminformatics (AREA)
- Probability & Statistics with Applications (AREA)
- Geometry (AREA)
- Investigating Or Analysing Biological Materials (AREA)
Claims (15)
- Ein computerimplementiertes Verfahren zur Phänotypisierung von Fibrose, umfassend:a) Empfangen eines digitalen Bildes einer Whole-Slide-Imaging-Aufnahme eines histopathologischen Präparats einer biologischen Gewebeprobe, wobei das digitale Bild das Vorhandensein von Kollagenen in der biologischen Gewebeprobe anzeigt, die mit einem kollagenspezifischen Farbstoff markiert sind;b) Vorverarbeitung des digitalen Bildes, wobei die Vorverarbeitung Kollagenobjekte im digitalen Bild identifiziert, wobei ein Kollagenobjekt einer Darstellung von Kollagen im digitalen Bild entspricht, und die Vorverarbeitung umfasst die Durchführung einer farbbasierten Bildsegmentierung, um benachbarte Pixel oder Regionen des digitalen Bildes zu kennzeichnen, die die Kollagenobjekte bilden und den Kollagenen in der biologischen Gewebeprobe entsprechen;c) Verarbeitung des vorverarbeiteten Bildes zur Quantifizierung einer Vielzahl von Parametern, wobei jeder Parameter ein Merkmal der Kollagenobjekte beschreibt, welches geeignet ist, verschiedene Phänotypen der Fibrose in einem Kalibrierungsdatensatz, der für die biologische Gewebeprobe relevant ist, zu unterscheiden,wobei die Merkmale mindestens ein Gewebeebenen-Merkmal, das eine makroskopische Eigenschaft der Kollagenobjekte beschreibt, mindestens ein morphometrisches Merkmal, das morphometrische Eigenschaften der Kollagenobjekte beschreibt, und mindestens ein Texturebenen-Merkmal, das die Organisation der Kollagenobjekte beschreibt, umfassen; undwobei die Quantifizierung der Vielzahl von Parametern umfasst:für einen Parameter, der ein morphometrisches Merkmal beschreibt:Ermitteln einer ersten Verteilung von Werten für das mindestens eine morphometrische Merkmal durch Bestimmen eines jeweiligen Wertes für das durch den Parameter beschriebene Merkmal für jedes Kollagenobjekt; undBerechnen eines ersten Statistikwerts aus der ersten Verteilung von Werten, wobei der Statistikwert eine der folgenden ist: (i) eine Verzerrungsstatistik, einschließlich Schiefe, (ii) eine Varianzstatistik, einschließlich Standardabweichung, Varianz, Ausreißer und Kurtosis, oder (iii) eine Übergangsstatistik, die durch Aufteilung der ersten Verteilung in Teilverteilungen basierend auf einem oder mehreren Schwellenwerten und Berechnung der Statistik aus einer Teilverteilung erhalten wird;für einen Parameter, der ein Texturebenen-Merkmal beschreibt:Ermitteln einer zweiten Verteilung von Werten für das Merkmal durch Bestimmen eines jeweiligen Wertes für das mindestens eine Texturebenen-Merkmal für jede Region einer Vielzahl von Regionen des digitalen Bildes, wobei die Regionen unabhängig von den Kollagenobjekten definiert sind; undBerechnen eines zweiten Statistikwerts aus der zweiten Verteilung von Werten, wobei der Statistikwert eine der folgenden ist: (i) eine Verzerrungsstatistik, einschließlich Schiefe, (ii) eine Varianzstatistik, einschließlich Standardabweichung, Varianz, Ausreißer und Kurtosis, oder (iii) eine Übergangsstatistik, die durch Aufteilung der zweiten Verteilung in Teilverteilungen basierend auf einem oder mehreren Schwellenwerten und Berechnung der Statistik aus einer Teilverteilung erhalten wird;d) Kombinieren von mindestens einigen der Parameter aus c), um einen oder mehrere kontinuierliche zusammengesetzte Scores zu erhalten, die einen Phänotyp der Fibrose für die biologische Gewebeprobe quantifizieren.
- Das Verfahren nach Anspruch 1, wobei:
der eine oder die mehreren kontinuierliche(n) zusammengesetzte(n) Score(s) einen ersten zusammengesetzten Score und einen zweiten zusammengesetzten Score umfassen, wobei der erste und der zweite Score spezifisch für unterschiedliche Merkmale auf Gewebeebene, morphometrischer Ebene und Texturebene sind. - Das Verfahren nach Anspruch 1 oder 2, wobei die in d) kombinierten Parameter aus einer Liste von Kandidatenparametern mithilfe einer Kalibrierungstechnik ausgewählt werden, die einen Kalibrierungsdatensatz aus digitalen Kalibrierungsbildern verwendet, die von biologischen Proben mit bekannten Fibrose-Phänotypen stammen.
- Das Verfahren nach Anspruch 1, 2 oder 3, wobei:
die Vielzahl von Regionen nicht überlappende oder überlappende Probenfenster des digitalen Bildes umfasst. - Das Verfahren nach Anspruch 4, wobei:
die Quantifizierung des Parameters, der das mindestens eine Texturebenen-Merkmal beschreibt, umfasst:
Ermitteln eines Probenwerts für jedes Probenfenster, um eine Vielzahl von Probenwerten zu erhalten, wobei die zweite Verteilung von Werten aus der Vielzahl von Probenwerten erhalten wird. - Das Verfahren nach einem der vorhergehenden Ansprüche, wobei die Quantifizierung von mindestens einigen der Parameter das Ableiten von Histogrammen aus einer Verteilung von Werten, die für jedes Kollagenobjekt gemessen wurden, und die Verarbeitung der Histogramme zur Identifikation mehrerer Modi der Histogramme umfasst, wobei die Verarbeitung eines Histogramms zur Identifikation mehrerer Modi das Dekonvolutieren des Histogramms umfasst.
- Das Verfahren nach Anspruch 6, wobei einige Modi der Histogramme phänotypischen Signaturen fibrosebedingter Zustände entsprechen, und das Dekonvolutieren des Histogramms umfasst das Filtern des Histogramms, um festzustellen, ob das Histogramm eine phänotypische Signatur aufweist, und die identifizierte Signatur zu quantifizieren.
- Das Verfahren nach einem der vorhergehenden Ansprüche, weiterhin umfassend die Verarbeitung des digitalen Bildes zur Unterscheidung zwischen Kollagenen in der biologischen Gewebeprobe, die im digitalen Bild dargestellt werden.
- Das Verfahren nach Anspruch 8, wobei jeder der in d) verwendeten Parameter einer Klasse von Kollagen entspricht.
- Das Verfahren nach Anspruch 9, wobei:die Klasse von Kollagen feines Kollagen, aggregiertes Kollagen oder Geweberegionen umfasst; und/oderdie Klasse von Kollagen eine von mehreren Kollagenklassen ist, die verschiedene Stadien der Fibrose unterscheiden.
- Das Verfahren nach einem der vorhergehenden Ansprüche, wobei das Verfahren eines oder mehrere der folgenden quantifiziert:den Schweregrad der Fibrose der biologischen Gewebeprobe auf einer kontinuierlichen Skala;die Progression der Fibrose beim Subjekt auf einer kontinuierlichen Skala;die Regression der Fibrose beim Subjekt in Reaktion auf eine Therapie auf einer kontinuierlichen Skala.
- Das Verfahren nach einem der vorhergehenden Ansprüche, wobei die Parameter, die Texturebenen-Merkmale beschreiben, mindestens einen statistischen Parameter umfassen, der die Verteilung einer oder mehrerer Eigenschaften der Kollagen-spezifischen Bildpixelintensitäts-Grauwert-Kooccurenzmatrix über eine Region des Kollagenbildes beschreibt, wobei die Matrixeigenschaften mindestens eines der folgenden umfassen: Energie, Homogenität, Kontrast, Korrelation, Trägheit, Entropie, Schiefe und Kurtosis.
- Das Verfahren nach einem der vorhergehenden Ansprüche, wobei die in d) kombinierten Parameter aus einer Menge von Kandidatenparametern ausgewählt werden, um die Dimension der Menge der Kandidatenparameter zu reduzieren.
- Ein Computerprogramm, umfassend computerlesbare Anweisungen, die, wenn sie von einem oder mehreren Prozessoren ausgeführt werden, die Ausführung des Verfahrens nach einem der vorhergehenden Ansprüche durch die Prozessoren bewirken.
- Ein System, das angepasst ist, eines der Verfahren nach den Ansprüchen 1-13 auszuführen.
Applications Claiming Priority (2)
| Application Number | Priority Date | Filing Date | Title |
|---|---|---|---|
| US201962852745P | 2019-05-24 | 2019-05-24 | |
| PCT/US2020/028813 WO2020242630A1 (en) | 2019-05-24 | 2020-04-17 | Quantitative phenotyping of fibrosis from images of biological tissue samples |
Publications (3)
| Publication Number | Publication Date |
|---|---|
| EP3977397A1 EP3977397A1 (de) | 2022-04-06 |
| EP3977397C0 EP3977397C0 (de) | 2025-02-26 |
| EP3977397B1 true EP3977397B1 (de) | 2025-02-26 |
Family
ID=73457062
Family Applications (1)
| Application Number | Title | Priority Date | Filing Date |
|---|---|---|---|
| EP20729254.1A Active EP3977397B1 (de) | 2019-05-24 | 2020-04-17 | Quantitative bestimmung des phänotyps einer fibrose aus bildern von biologischen gewebeproben |
Country Status (5)
| Country | Link |
|---|---|
| US (2) | US11430112B2 (de) |
| EP (1) | EP3977397B1 (de) |
| ES (1) | ES3016815T3 (de) |
| SG (1) | SG11202112935YA (de) |
| WO (1) | WO2020242630A1 (de) |
Families Citing this family (5)
| Publication number | Priority date | Publication date | Assignee | Title |
|---|---|---|---|---|
| US20240029247A1 (en) * | 2019-05-24 | 2024-01-25 | PharmaNest LLC | Systems and methods for quantitative phenotyping of biological fibrilar structures |
| CN115944276B (zh) * | 2023-02-22 | 2024-07-05 | 武汉大学人民医院(湖北省人民医院) | 胆总管纤维化等级确定方法、装置及其相关设备 |
| CN116245850B (zh) * | 2023-03-10 | 2025-01-28 | 复旦大学 | 一种肝脏病理切片图像的脂肪含量分析装置和方法 |
| JP2024128350A (ja) * | 2023-03-10 | 2024-09-24 | 株式会社Screenホールディングス | 生体試料の線維化評価方法 |
| GB2631590A (en) * | 2024-06-17 | 2025-01-08 | Histoindex Pte Ltd | Method and system for predicting a clinical outcome of metabolic dysfunction-associated steatotic liver disease |
Citations (1)
| Publication number | Priority date | Publication date | Assignee | Title |
|---|---|---|---|---|
| US20180075600A1 (en) * | 2013-03-01 | 2018-03-15 | Universite D'angers | Automatic measurement of lesions on medical images |
Family Cites Families (14)
| Publication number | Priority date | Publication date | Assignee | Title |
|---|---|---|---|---|
| US20050261180A1 (en) * | 1997-05-28 | 2005-11-24 | Pilon Aprile L | Use of recombinant human uteroglobin in treatment of inflammatory and fibrotic conditions |
| US6975894B2 (en) * | 2001-04-12 | 2005-12-13 | Trustees Of The University Of Pennsylvania | Digital topological analysis of trabecular bone MR images and prediction of osteoporosis fractures |
| US7461048B2 (en) * | 2003-07-21 | 2008-12-02 | Aureon Laboratories, Inc. | Systems and methods for treating, diagnosing and predicting the occurrence of a medical condition |
| CA2575859A1 (en) * | 2004-08-11 | 2006-02-23 | Aureon Laboratories, Inc. | Systems and methods for automated diagnosis and grading of tissue images |
| ATE474292T1 (de) * | 2006-06-05 | 2010-07-15 | Humanitas Mirasole Spa | In-vitro-diagnostikverfahren für menschliche oder tiergewebe beeinflussende krankheiten |
| SG184389A1 (en) * | 2010-03-31 | 2012-10-30 | Agency Science Tech & Res | A method and system for determining a stage of fibrosis in a liver |
| US8917464B2 (en) * | 2013-01-03 | 2014-12-23 | International Business Machines Corporation | Utilization of disk buffer for background replication processes |
| US9710908B2 (en) * | 2013-01-08 | 2017-07-18 | Agency For Science, Technology And Research | Method and system for assessing fibrosis in a tissue |
| GB201315486D0 (en) * | 2013-08-30 | 2013-10-16 | Ucb Pharma Sa | Antibodies |
| ES2872553T3 (es) * | 2015-03-06 | 2021-11-02 | Pharmakea Inc | Inhibidores de lisil oxidasa tipo-2 y usos de los mismos |
| US11094058B2 (en) * | 2015-08-14 | 2021-08-17 | Elucid Bioimaging Inc. | Systems and method for computer-aided phenotyping (CAP) using radiologic images |
| JP7245051B2 (ja) * | 2016-03-08 | 2023-03-23 | エンスペクトラ・ヘルス・インコーポレイテッド | 皮膚の疾患の非侵襲的な検出 |
| US11120888B2 (en) * | 2016-08-15 | 2021-09-14 | Imaging Endpoints II LLC | Systems and methods for predicting lung cancer immune therapy responsiveness using quantitative textural analysis |
| CN120014640A (zh) * | 2018-03-30 | 2025-05-16 | 加利福尼亚大学董事会 | 生成数字染色显微图像的方法 |
-
2020
- 2020-04-17 ES ES20729254T patent/ES3016815T3/es active Active
- 2020-04-17 US US16/851,881 patent/US11430112B2/en active Active
- 2020-04-17 SG SG11202112935YA patent/SG11202112935YA/en unknown
- 2020-04-17 WO PCT/US2020/028813 patent/WO2020242630A1/en not_active Ceased
- 2020-04-17 EP EP20729254.1A patent/EP3977397B1/de active Active
-
2022
- 2022-07-21 US US17/870,332 patent/US11798163B2/en active Active
Patent Citations (1)
| Publication number | Priority date | Publication date | Assignee | Title |
|---|---|---|---|---|
| US20180075600A1 (en) * | 2013-03-01 | 2018-03-15 | Universite D'angers | Automatic measurement of lesions on medical images |
Non-Patent Citations (1)
| Title |
|---|
| CALÈS PAUL ET AL: "Automated morphometry provides accurate and reproducible virtual staging of liver fibrosis in chronic hepatitis C", JOURNAL OF PATHOLOGY INFORMATICS, vol. 6, no. 1, 28 May 2015 (2015-05-28), IN, pages 20, XP093065255, ISSN: 2153-3539, Retrieved from the Internet <URL:https://www.sciencedirect.com/science/article/pii/S2153353922004758> DOI: 10.4103/2153-3539.157782 * |
Also Published As
| Publication number | Publication date |
|---|---|
| WO2020242630A1 (en) | 2020-12-03 |
| EP3977397C0 (de) | 2025-02-26 |
| ES3016815T3 (en) | 2025-05-09 |
| EP3977397A1 (de) | 2022-04-06 |
| SG11202112935YA (en) | 2021-12-30 |
| US11430112B2 (en) | 2022-08-30 |
| US11798163B2 (en) | 2023-10-24 |
| US20200372640A1 (en) | 2020-11-26 |
| US20230019599A1 (en) | 2023-01-19 |
Similar Documents
| Publication | Publication Date | Title |
|---|---|---|
| US20220237788A1 (en) | Multiple instance learner for tissue image classification | |
| US11901077B2 (en) | Multiple instance learner for prognostic tissue pattern identification | |
| KR102583103B1 (ko) | 계산 검출 방법들을 위해 전자 이미지들을 처리하기 위한 시스템들 및 방법들 | |
| EP3977397B1 (de) | Quantitative bestimmung des phänotyps einer fibrose aus bildern von biologischen gewebeproben | |
| Xu et al. | Colorectal cancer detection based on deep learning | |
| CN114600155B (zh) | 用于细胞检测和分割的弱监督多任务学习 | |
| Roy et al. | Deep-learning-based accurate hepatic steatosis quantification for histological assessment of liver biopsies | |
| US12354012B2 (en) | Histopathology classification through machine self-learning of “tissue fingerprints” | |
| Ionescu et al. | Prediction of reader estimates of mammographic density using convolutional neural networks | |
| Teramoto et al. | Computer-aided classification of hepatocellular ballooning in liver biopsies from patients with NASH using persistent homology | |
| Xu et al. | Using transfer learning on whole slide images to predict tumor mutational burden in bladder cancer patients | |
| Unnersjö-Jess et al. | Deep learning–based segmentation and quantification of podocyte foot process morphology suggests differential patterns of foot process effacement across kidney pathologies | |
| US20240029247A1 (en) | Systems and methods for quantitative phenotyping of biological fibrilar structures | |
| CN109800820A (zh) | 一种基于超声造影图像均匀程度的分类方法 | |
| Loménie et al. | Can AI predict epithelial lesion categories via automated analysis of cervical biopsies: The TissueNet challenge? | |
| EP4627523A1 (de) | Systeme und verfahren zum nachweis tertiärer lymphoidstrukturen | |
| CN109840564A (zh) | 一种基于超声造影图像均匀程度的分类系统 | |
| Dey et al. | Precise segmentation and classification of epithelial rete-pegs signature in assessing lower limb wound healing progression | |
| Chai | Using machine learning techniques on digitised histopathological images to distinguish lipoma (LP) from atypical lipomatous tumours (ALT) | |
| Kronberg | Applications of Supervised Deep (Transfer) Learning for Medical Image Classification | |
| Mukherjee | Pattern Recognition and Machine Learning as a Morphology Characterization Tool for Assessment of Placental Health | |
| Yu | A machine learning based diagnostic study of chronic liver disease using staining techniques | |
| Hayat et al. | Deep Learning Architecture with Attention-Enhanced U-Net for Analyzing Cell Nuclei in H&E-Stained Tissue Slides | |
| Doiphode et al. | Advancing volumetric breast density segmentation: a deep learning approach with digital breast tomosynthesis | |
| Kothari | Developing Image Informatics Methods for Histopathological Computer-Aided Decision Support Systems |
Legal Events
| Date | Code | Title | Description |
|---|---|---|---|
| STAA | Information on the status of an ep patent application or granted ep patent |
Free format text: STATUS: UNKNOWN |
|
| STAA | Information on the status of an ep patent application or granted ep patent |
Free format text: STATUS: THE INTERNATIONAL PUBLICATION HAS BEEN MADE |
|
| PUAI | Public reference made under article 153(3) epc to a published international application that has entered the european phase |
Free format text: ORIGINAL CODE: 0009012 |
|
| STAA | Information on the status of an ep patent application or granted ep patent |
Free format text: STATUS: REQUEST FOR EXAMINATION WAS MADE |
|
| 17P | Request for examination filed |
Effective date: 20211216 |
|
| AK | Designated contracting states |
Kind code of ref document: A1 Designated state(s): AL AT BE BG CH CY CZ DE DK EE ES FI FR GB GR HR HU IE IS IT LI LT LU LV MC MK MT NL NO PL PT RO RS SE SI SK SM TR |
|
| DAV | Request for validation of the european patent (deleted) | ||
| DAX | Request for extension of the european patent (deleted) | ||
| STAA | Information on the status of an ep patent application or granted ep patent |
Free format text: STATUS: EXAMINATION IS IN PROGRESS |
|
| 17Q | First examination report despatched |
Effective date: 20230725 |
|
| GRAP | Despatch of communication of intention to grant a patent |
Free format text: ORIGINAL CODE: EPIDOSNIGR1 |
|
| STAA | Information on the status of an ep patent application or granted ep patent |
Free format text: STATUS: GRANT OF PATENT IS INTENDED |
|
| INTG | Intention to grant announced |
Effective date: 20240925 |
|
| GRAS | Grant fee paid |
Free format text: ORIGINAL CODE: EPIDOSNIGR3 |
|
| GRAA | (expected) grant |
Free format text: ORIGINAL CODE: 0009210 |
|
| STAA | Information on the status of an ep patent application or granted ep patent |
Free format text: STATUS: THE PATENT HAS BEEN GRANTED |
|
| AK | Designated contracting states |
Kind code of ref document: B1 Designated state(s): AL AT BE BG CH CY CZ DE DK EE ES FI FR GB GR HR HU IE IS IT LI LT LU LV MC MK MT NL NO PL PT RO RS SE SI SK SM TR |
|
| REG | Reference to a national code |
Ref country code: GB Ref legal event code: FG4D |
|
| REG | Reference to a national code |
Ref country code: CH Ref legal event code: EP |
|
| REG | Reference to a national code |
Ref country code: DE Ref legal event code: R096 Ref document number: 602020046729 Country of ref document: DE |
|
| REG | Reference to a national code |
Ref country code: IE Ref legal event code: FG4D |
|
| U01 | Request for unitary effect filed |
Effective date: 20250318 |
|
| U07 | Unitary effect registered |
Designated state(s): AT BE BG DE DK EE FI FR IT LT LU LV MT NL PT RO SE SI Effective date: 20250325 |
|
| REG | Reference to a national code |
Ref country code: ES Ref legal event code: FG2A Ref document number: 3016815 Country of ref document: ES Kind code of ref document: T3 Effective date: 20250509 |
|
| U20 | Renewal fee for the european patent with unitary effect paid |
Year of fee payment: 6 Effective date: 20250425 |
|
| PG25 | Lapsed in a contracting state [announced via postgrant information from national office to epo] |
Ref country code: RS Free format text: LAPSE BECAUSE OF FAILURE TO SUBMIT A TRANSLATION OF THE DESCRIPTION OR TO PAY THE FEE WITHIN THE PRESCRIBED TIME-LIMIT Effective date: 20250526 |
|
| PG25 | Lapsed in a contracting state [announced via postgrant information from national office to epo] |
Ref country code: PL Free format text: LAPSE BECAUSE OF FAILURE TO SUBMIT A TRANSLATION OF THE DESCRIPTION OR TO PAY THE FEE WITHIN THE PRESCRIBED TIME-LIMIT Effective date: 20250226 |
|
| PGFP | Annual fee paid to national office [announced via postgrant information from national office to epo] |
Ref country code: GB Payment date: 20250423 Year of fee payment: 6 Ref country code: ES Payment date: 20250528 Year of fee payment: 6 |
|
| PG25 | Lapsed in a contracting state [announced via postgrant information from national office to epo] |
Ref country code: IS Free format text: LAPSE BECAUSE OF FAILURE TO SUBMIT A TRANSLATION OF THE DESCRIPTION OR TO PAY THE FEE WITHIN THE PRESCRIBED TIME-LIMIT Effective date: 20250626 Ref country code: NO Free format text: LAPSE BECAUSE OF FAILURE TO SUBMIT A TRANSLATION OF THE DESCRIPTION OR TO PAY THE FEE WITHIN THE PRESCRIBED TIME-LIMIT Effective date: 20250526 |
|
| PG25 | Lapsed in a contracting state [announced via postgrant information from national office to epo] |
Ref country code: HR Free format text: LAPSE BECAUSE OF FAILURE TO SUBMIT A TRANSLATION OF THE DESCRIPTION OR TO PAY THE FEE WITHIN THE PRESCRIBED TIME-LIMIT Effective date: 20250226 |
|
| PG25 | Lapsed in a contracting state [announced via postgrant information from national office to epo] |
Ref country code: GR Free format text: LAPSE BECAUSE OF FAILURE TO SUBMIT A TRANSLATION OF THE DESCRIPTION OR TO PAY THE FEE WITHIN THE PRESCRIBED TIME-LIMIT Effective date: 20250527 |
|
| PGFP | Annual fee paid to national office [announced via postgrant information from national office to epo] |
Ref country code: CH Payment date: 20250501 Year of fee payment: 6 |
|
| PGFP | Annual fee paid to national office [announced via postgrant information from national office to epo] |
Ref country code: IE Payment date: 20250425 Year of fee payment: 6 |
|
| PG25 | Lapsed in a contracting state [announced via postgrant information from national office to epo] |
Ref country code: SM Free format text: LAPSE BECAUSE OF FAILURE TO SUBMIT A TRANSLATION OF THE DESCRIPTION OR TO PAY THE FEE WITHIN THE PRESCRIBED TIME-LIMIT Effective date: 20250226 |
|
| PG25 | Lapsed in a contracting state [announced via postgrant information from national office to epo] |
Ref country code: CZ Free format text: LAPSE BECAUSE OF FAILURE TO SUBMIT A TRANSLATION OF THE DESCRIPTION OR TO PAY THE FEE WITHIN THE PRESCRIBED TIME-LIMIT Effective date: 20250226 |
|
| PG25 | Lapsed in a contracting state [announced via postgrant information from national office to epo] |
Ref country code: SK Free format text: LAPSE BECAUSE OF FAILURE TO SUBMIT A TRANSLATION OF THE DESCRIPTION OR TO PAY THE FEE WITHIN THE PRESCRIBED TIME-LIMIT Effective date: 20250226 |
|
| PG25 | Lapsed in a contracting state [announced via postgrant information from national office to epo] |
Ref country code: MC Free format text: LAPSE BECAUSE OF FAILURE TO SUBMIT A TRANSLATION OF THE DESCRIPTION OR TO PAY THE FEE WITHIN THE PRESCRIBED TIME-LIMIT Effective date: 20250226 |
|
| PLBE | No opposition filed within time limit |
Free format text: ORIGINAL CODE: 0009261 |
|
| STAA | Information on the status of an ep patent application or granted ep patent |
Free format text: STATUS: NO OPPOSITION FILED WITHIN TIME LIMIT |
|
| 26N | No opposition filed |
Effective date: 20251127 |