EP3974646A1 - Verfahren und system zur windgeschwindigkeitsbestimmung unter verwendung von schwingungsdaten - Google Patents
Verfahren und system zur windgeschwindigkeitsbestimmung unter verwendung von schwingungsdaten Download PDFInfo
- Publication number
- EP3974646A1 EP3974646A1 EP20198710.4A EP20198710A EP3974646A1 EP 3974646 A1 EP3974646 A1 EP 3974646A1 EP 20198710 A EP20198710 A EP 20198710A EP 3974646 A1 EP3974646 A1 EP 3974646A1
- Authority
- EP
- European Patent Office
- Prior art keywords
- wind speed
- metric
- data
- machine learning
- learning model
- Prior art date
- Legal status (The legal status is an assumption and is not a legal conclusion. Google has not performed a legal analysis and makes no representation as to the accuracy of the status listed.)
- Withdrawn
Links
- 238000000034 method Methods 0.000 title claims abstract description 46
- 238000010801 machine learning Methods 0.000 claims description 80
- 238000012549 training Methods 0.000 claims description 24
- 238000004422 calculation algorithm Methods 0.000 claims description 20
- 230000006870 function Effects 0.000 claims description 9
- 230000001131 transforming effect Effects 0.000 claims description 8
- 238000004364 calculation method Methods 0.000 claims description 4
- 238000004590 computer program Methods 0.000 claims description 4
- 230000000875 corresponding effect Effects 0.000 description 18
- 239000011159 matrix material Substances 0.000 description 14
- 230000008901 benefit Effects 0.000 description 9
- 230000001133 acceleration Effects 0.000 description 7
- 238000009434 installation Methods 0.000 description 5
- 238000005259 measurement Methods 0.000 description 5
- 238000012360 testing method Methods 0.000 description 5
- 230000009466 transformation Effects 0.000 description 5
- 238000001514 detection method Methods 0.000 description 4
- 238000002372 labelling Methods 0.000 description 4
- 238000013459 approach Methods 0.000 description 3
- 238000013106 supervised machine learning method Methods 0.000 description 3
- 238000012795 verification Methods 0.000 description 3
- 238000004519 manufacturing process Methods 0.000 description 2
- 238000012544 monitoring process Methods 0.000 description 2
- 238000005070 sampling Methods 0.000 description 2
- 238000013107 unsupervised machine learning method Methods 0.000 description 2
- 238000010200 validation analysis Methods 0.000 description 2
- 238000012935 Averaging Methods 0.000 description 1
- 230000006399 behavior Effects 0.000 description 1
- 230000008859 change Effects 0.000 description 1
- 230000002596 correlated effect Effects 0.000 description 1
- 238000005516 engineering process Methods 0.000 description 1
- 239000000284 extract Substances 0.000 description 1
- 230000008569 process Effects 0.000 description 1
- 230000035945 sensitivity Effects 0.000 description 1
Images


Classifications
-
- F—MECHANICAL ENGINEERING; LIGHTING; HEATING; WEAPONS; BLASTING
- F03—MACHINES OR ENGINES FOR LIQUIDS; WIND, SPRING, OR WEIGHT MOTORS; PRODUCING MECHANICAL POWER OR A REACTIVE PROPULSIVE THRUST, NOT OTHERWISE PROVIDED FOR
- F03D—WIND MOTORS
- F03D7/00—Controlling wind motors
- F03D7/02—Controlling wind motors the wind motors having rotation axis substantially parallel to the air flow entering the rotor
- F03D7/04—Automatic control; Regulation
- F03D7/042—Automatic control; Regulation by means of an electrical or electronic controller
- F03D7/043—Automatic control; Regulation by means of an electrical or electronic controller characterised by the type of control logic
- F03D7/046—Automatic control; Regulation by means of an electrical or electronic controller characterised by the type of control logic with learning or adaptive control, e.g. self-tuning, fuzzy logic or neural network
-
- F—MECHANICAL ENGINEERING; LIGHTING; HEATING; WEAPONS; BLASTING
- F03—MACHINES OR ENGINES FOR LIQUIDS; WIND, SPRING, OR WEIGHT MOTORS; PRODUCING MECHANICAL POWER OR A REACTIVE PROPULSIVE THRUST, NOT OTHERWISE PROVIDED FOR
- F03D—WIND MOTORS
- F03D17/00—Monitoring or testing of wind motors, e.g. diagnostics
-
- F—MECHANICAL ENGINEERING; LIGHTING; HEATING; WEAPONS; BLASTING
- F05—INDEXING SCHEMES RELATING TO ENGINES OR PUMPS IN VARIOUS SUBCLASSES OF CLASSES F01-F04
- F05B—INDEXING SCHEME RELATING TO WIND, SPRING, WEIGHT, INERTIA OR LIKE MOTORS, TO MACHINES OR ENGINES FOR LIQUIDS COVERED BY SUBCLASSES F03B, F03D AND F03G
- F05B2260/00—Function
- F05B2260/82—Forecasts
- F05B2260/821—Parameter estimation or prediction
-
- F—MECHANICAL ENGINEERING; LIGHTING; HEATING; WEAPONS; BLASTING
- F05—INDEXING SCHEMES RELATING TO ENGINES OR PUMPS IN VARIOUS SUBCLASSES OF CLASSES F01-F04
- F05B—INDEXING SCHEME RELATING TO WIND, SPRING, WEIGHT, INERTIA OR LIKE MOTORS, TO MACHINES OR ENGINES FOR LIQUIDS COVERED BY SUBCLASSES F03B, F03D AND F03G
- F05B2270/00—Control
- F05B2270/30—Control parameters, e.g. input parameters
- F05B2270/32—Wind speeds
Definitions
- the present invention relates to a method of determining a wind speed experienced by a wind turbine generator.
- the method may comprise acts as described in the following. There is an act of collecting time series data (x i ) of a vibration signal from at least one blade of the wind turbine generator. There is an act of defining a metric point from a metric based on a sum of absolute changes between consecutive time series data (x i and x i+1 ). There is an act of determining a wind speed experienced by the at least one blade as a function of the metric.
- the present invention also relates to a method of operating a wind turbine.
- the present invention relates to a wind speed detector.
- wind turbine generators benefits from information concerning operational conditions. It would be obvious to state that wind characteristics such as wind speed and other wind characteristics are important operational and performance conditions and parameters to a wind turbine.
- Anemometers placed on site or on the nacelle are just examples.
- Lidar systems placed on site or on the wind turbine constitute other such examples.
- An objective is achieved by a method of determining a wind speed experienced by a wind turbine generator.
- the method may comprise acts as described in the following.
- vibration signals provide inherent information as actually experienced. Vibration signals may readily be available for this or other purposes.
- the method may reduce or eliminate the use of additional wind speed detection methods or systems.
- the method may provide additional information to verify or improve accuracy of determining wind speed.
- vibration data and the methods outlined may be used to determine other wind characteristics such as turbulence intensity.
- Vibration signals may be provided by installing vibration sensors as will be described.
- vibration signals and vibration sensors may readily be available as an installed part of say a Critical Components Condition Monitoring, fault detection and instant Alarm System (CCCMAS).
- CCCMAS Critical Components Condition Monitoring, fault detection and instant Alarm System
- Such monitoring technology may provide information based on data collected by 3-axis accelerometer sensors located inside the rotor.
- Three accelerometers may be installed inside of the individual wind turbine blades.
- Each sensor may be installed identically in each blade. That is, each sensor is placed with the same distance from the centre of rotation, with one sensor-axis aligned along the length of the blade, one sensor-axis aligned with the blade-flapwise axis, and the last sensor-axis aligned with the blade-edgewise axis.
- each sensor node may have its own algorithm for wind speed, and wind characteristics such as turbulence intensity detection. Since the data of two sensors are not intended to be compared against each other, this approach may compensate for any error of installation (orientation, distance from the centre%) or difference of measurement from one sensor to another.
- vibration signals may be provided.
- Alternative or equivalent vibration signals may be provided.
- Vibration signals for the sole purpose of determining wind speed or wind characteristics as will be described may be provided by simpler installations to provide sufficient data which simpler installation may be identified through simple experimentation.
- more accurate data may be provided by installing vibration sensors of higher resolution, higher sensitivity, more precise installation.
- This metric has shown to contain the information content required to establish a one to one relationship with wind speed characteristics.
- the metric or transformation is also simple to process and extracts information from a vibration signal sampled usually at a higher sampling rate than the wind speed sampling rate.
- the transformation in an information preserving way generates a metric point - absolute sum of changes - over a period of sampled vibration signals.
- a further advantage is that the transformation is particularly simple, does not require a memory, but can be generated as vibration signal samples are generated as a time series of consecutive samples e.g. x i .
- wind speed is distributed as a wind speed distribution.
- Such distribution may be a continuum, but often a histogram of the number of occurrences of a wind speed, hence binned over a period of time.
- a wind speed distribution may be represented by having the wind speed binned for every 1 m/s on the x-axis, and on the y-axis, the number of times this is binned, wind speed happens.
- Such wind speed distribution may be established empirically. Alternatively, the wind speed distribution may be approximated or fitted to a mathematical curve. The shape of a wind speed distribution follows a Weibull distribution.
- quantile of data are the values of data that divide the whole data into intervals. For example: quantile 0.1 is the value of the data where 10% of the whole data are below that number and 90% are above. For example: quantile 0.7: is the value of the data point where 70% of the whole data are below that number and 30% are above.
- a further aspect of preparing data may be that vibration data is provided from multiple axes sensors such as a 3D accelerometer.
- Such accelerometer may provide data in respective channels where e.g. acc ch 2 is the acceleration data from the second channel of the 3D accelerometer.
- vibration signals from a rotating blade will have a vibration bias from the rotational period as the blade rotates.
- the outlined changes between consecutive points eliminate or cancel this overall rotation.
- the "pure" vibrations allow the transformation into a suitable metric and thus generate a corresponding metric distribution.
- the metric is used for wind speed detection and the value correlates to the wind speed by 90 % since the higher the wind speed, the higher the vibrations.
- any channel data or combination of channel data can be used for this calculation of absolute sum of changes.
- the wind speed may be determined by collecting a period of time series data and transforming the collected time series data to a metric data point.
- the wind speed may be determined by interpolating the metric data point to a predetermined wind speed and metric distribution.
- the predetermined wind speed and metric distribution may be binned for the specific wind turbine blade and corresponding vibration sensor.
- the function of this method is to use the fact that pure vibrations are correlated to wind speed by 90% and a priori knowledge of the wind speed distribution experienced on the site.
- the method allows building a distribution using one metric of sensor data based on the wind speed distribution experienced by the wind turbine generator.
- the model is built as a sensor per sensor approach. That is, each sensor will have a corresponding transformation or metric distribution independent of others.
- the advantages of this method are that one accelerometer in one blade associated with the historical wind speed distribution of the wind turbine generator or farm is enough to predict wind speed so no other instruments are needed.
- a further advantage is that the method constantly improves as new data points, e.g. one new metric data from one minute, are generated and in order to fit as much as possible the historical wind speed distribution.
- a further advantage is that there is no over fitting.
- the method is easy and fast. In example, two years of metrics, i.e. data points of one minute, takes less than a minute to be transformed into the metric distribution.
- the methods described above may further comprise acts as described in the following.
- Labelling of data may generally be understood by a person skilled in the art. In the sense of the above described supervised machine learning labelling may be performed as here described. As will be outlined, then for the supervised machine learning labelled data is needed. Labelled data is data where the output value of the data is already known in advance, e.g. wind speed or turbulence intensity from a LiDAR for example, in order to train and test the system.
- this data is transformed into metrics (one or several metrics) which metrics may be associated to the real output value (wind speed or turbulence intensity) for this particular period of time e.g. a minute.
- metrics one or several metrics
- the period may be changed according to the quality or requirement of precision or computational resources.
- the result is labelled data points i.e. metric(s) and corresponding wind characteristic e.g. wind speed or turbulence intensity ready to train and test the supervised machine learning algorithm.
- the newly created associated values i.e. metrics and label, may be injected into the system that will train itself to associate the metrics with the labels.
- the described method of using a supervised machine learning algorithm may be realized using sensor data and LiDAR data to label the vibration data from the sensor.
- the input is the pure vibrational data extracted from the sensor: the sum of the absolute value is the difference of consecutive values over a period of time, in order to remove any influence from the rotational speed or turbine behavior dictated by any measurements instruments.
- the supervised machine learning has the advantage that it is very accurate and stable.
- the method of determining wind speed and e.g. turbulence intensity may be performed by the supervised machine learning algorithm using sensor data and LiDAR labels.
- the input data are pure vibrations, e.g. the absolute sum of absolute changes from vibration sensors and the wind speed or turbulence intensity may be from a nacelle-based LiDAR.
- the supervised machine learning model will train itself, i.e. "write its own algorithm", on data having a label.
- data where the outcome value is known is used to test the labelled data against the model and compare the outcome tested to the known label.
- the acts of training and verifying are performed on n-multiple vibration signals obtained by corresponding n-multiple vibration sensors.
- the act of training is performed based on n-multiple labels (Y 1..n ), whereas the act of verifying is performed based on a predetermined average measure of the n-multiple labels (Y 1..n ).
- the methods described above may comprise acts as described in the following. This may be referred to as unsupervised machine learning (USML). As for labelling, the previously outlined principles apply.
- the act of determining may be performed by inputting the metric point to the unsupervised machine learning model (USML) and outputting the wind characteristic data from the unsupervised machine learning model (USML).
- USML unsupervised machine learning model
- This method is an unsupervised machine learning method using sensor data and the knowledge of the wind speed distribution experienced by the wind turbine generator is used.
- the input extracted from the sensor may be the same pure vibrational data as in the supervised machine learning method previously described.
- the unsupervised machine learning algorithm will classify these vibrations into a predetermined number of groups. The algorithm will then pair the groups by size, with either the wind speed distribution.
- a corresponding unsupervised machine learning model may be constructed as follows.
- a K-Mean algorithm may be readily installed and given a predefined number of groups. The algorithm will automatically divide the metrics data points that are the closest to each other into this number of groups. The final data groups have significantly different sizes, and this is used to associate each data group with a wind speed bin of the corresponding size.
- data points with a known outcome value are used to test the labelled data against the model and compare the outcome tested to the known label.
- the acts of training and verifying are performed on n-multiple vibration signals obtained by corresponding n-multiple vibration sensors.
- the act of training may be performed based on n-multiple labels (Y 1..n ), whereas the act of verifying may be performed based on a predetermined average measure of the n-multiple labels (Y 1..n ).
- the results of the outcome may be combined to find the best possible value.
- a there may be a method of operating a wind turbine generator as a function of the wind speed as previously outlined.
- Having a wind speed determined as outlined or a wind characteristic such as turbulence intensity allows for improved operation of the wind turbine experiencing the wind speed or wind characteristics.
- An objective is achieved by a wind speed detector and/or turbulence intensity detector comprising at least one vibration sensor configured to be installed in a wind turbine blade.
- the means to perform the acts may be any one or more of the previously outlined methods.
- the detector wherein the vibration sensor is an accelerometer arranged in a sensor node may further comprise a computational unit configured to collect vibration data and to perform the calculation of sum of absolute changes.
- the accelerometer may be a 3-D axis accelerometer co
- the detector may comprise multiple vibration sensors, each configured to independently determine the wind characteristics.
- the detector may be further configured to determine the wind characteristic as a function of multiple independent determined wind characteristics.
- a wind turbine generator may comprise a wind characteristic detector wherein the least one vibration sensor is in at least one blade.
- a computer program product comprising instructions to cause the detector as described.
- the program may also execute the acts as disclosed.
- a computer-readable medium may have stored the computer program as previously outlined.
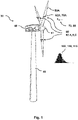
- FIG. 1 illustrates a wind turbine generator (WTG) 30 comprising a tower 46 supporting a nacelle 48 with blades 50 rotatable connected and forming a rotor 51.
- the wind turbine generator 30 is here shown with a set of blade sensors 60 where each blade has a blade sensor 62 that in this case may be vibration sensor 70 providing a vibration signal 72 as a time series 80 (time series data 80).
- a specific blade 50A has a specific vibration sensor 72A that generates specific vibration signals 72A as a specific time series 80A.
- the wind turbine generator 30 is experiencing wind conditions with wind characteristics 100 such as wind speed 110 characterised by wind speed distribution 115.
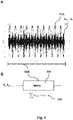
- Figure 2 illustrates a method of determining 1000 a wind speed 110 experienced by a wind turbine generator 30.
- Figure 3A illustrates a time series of a period of vibration time series data 80 x i from a vibration signal 72 obtained from an accelerometer on a blade 50 of a wind turbine generator. Also shown is the change between consecutive data points x i and x i+1 being consecutive time series data from the vibration signal 72.
- Figure 3B illustrates a metric 200 applied to time series x i .
- the metric 200 may be a specific metric being the sum of absolute changes 210 between consecutive time series data (x i ).
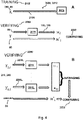
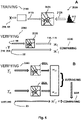
- Fig. 4 illustrates supervised machine learning 2000 model of a single vibration signal 72 from a single vibration sensor 70 and for vibration signals 72 form multiple vibration sensors 70.
- Figure 4A illustrates machine learning 2000 as a supervised machine learning 2010.
- Actual training 2100 is based on sum of absolute changes 210 with data that are labelled 85.
- the training 2100 may associated data metrics with respect to wind speed.
- the training 2100 may associate data metrics with respect to turbulence intensity. Training results in a supervised machine learning model (SML) 2015.
- the act of determining 1300 may be the upper path of the verification is performed by inputting the metric point 280 to the supervised machine learning model (SML) 2015 and outputting the wind speed data 110 from the supervised machine learning model (SML) 2015.
- the supervised machine learning model 2015 will train itself ("write its own algorithm") on data with a label 85. As is apparent and to verify the quality of the algorithm or model, data where the outcome result is know is used to test the labelled data 85 against the model 2015 to compare the outcome to the known label.
- Figure 4B illustrates the supervised machine learning model 2015 as outlined where the acts of training 2100 is performed on respective n-vibration signals 72 i,...,n . (Not shown) generating respective 2015 supervised machine learning models 2015 i, ..., n .
- the acts of verifying 2200 i,...n is performed on respective n-multiple vibration signals 72 1 , ...,72 n obtained by corresponding n-multiple vibration sensors 70 1 ,... 70 n .
- the act of training 2100 is performed based on n-multiple labels (Y 1..n ).
- the act of verifying 2200 comprises an is performed based on a predetermined average measure of the n-multiple labels (Y 1..n ) and finally by comparing 2220 the average with labeled 210, 85 data.
- the averaging may be a mean-average or similar average measures.
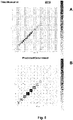
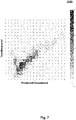
- Fig. 5 illustrates a confusion matrix for the supervised machine learning model 2015. Validation of this method is done with or seen from the confusion matrix which must be as diagonal as possible, which is observed in this case.
- Figure 5A represents a confusion matrix based on data as outlined in connection with the description of figure 4 .
- the x-axis in this case represents the detected wind speed 115 value using the supervised machine learning method 2010.
- vibration signals 72 are transformed to the metric, where each point is one minute of data transformed into the metric, which here is the sum of absolute changes.
- the metric point is inputted to the supervised machine learning model 2015 outputting the detected wind speed 115 along the x-axis and plotted aligning with an otherwise measured wind speed 110.
- the y-axis represents the actual wind speed as measured by a nacelle based LiDAR system.
- the x-axis represents the detected turbulence intensity (TI) value using the disclosed supervised machine learning method 2010.
- the metric 200 i.e. the sum of absolute changes 210, is associated with turbulence intensity during training.
- Fig. 6 illustrates a machine learning 2000 implementation of the method as an unsupervised machine learning 2020 resulting in an un-supervised machine learning model 2025 based on vibration signals 72.
- Figure 6 A illustrates model generation from a single vibration sensor 72 and figure 6B for multiple vibration sensors 72.
- Figure 6A illustrates the act of training (2100) using an unsupervised machine learning (USML) 2020 with metric points 280 of unlabeled data points (86) and building an unsupervised machine learning model (USML) 2025.
- USML unsupervised machine learning
- the building of the model is based on grouping 2110 metric data points 280 using a K-mean algorithm to a number of metric groups. There is an act of associating 2120 the formed metric groups with a wind speed distribution 112 based on vibrations of specific wind turbine blade 50 and corresponding vibration sensor 70.
- Verification is performed by inputting a metric point 280 to the unsupervised machine learning model (USML) 2025 and outputting the wind speed data 110 from the unsupervised machine learning model (USML) 2025.
- the act of determining 1300 may be the upper path of the verification is performed by inputting the metric point 280 to the unsupervised machine learning model (USML) 2025 and outputting the wind speed data 110 from the unsupervised machine learning model (USML) 2025.
- USML unsupervised machine learning model
- Figure 6B illustrates in continuation of the unsupervised machine learning model 2025 in figure 6A outlined where the acts of training 2100 is performed on respective n-vibration signals 72 i,...,n . (Not shown) generating respective unsupervised machine learning models 2025 i, ..., n . The act of training 2100 is performed based on n-multiple labels (Y 1..n ).
- the acts of verifying 2200 are performed on n-multiple vibration signals 72 obtained by corresponding n-multiple vibration sensors 70.
- the act of verifying 2200 is performed based on a predetermined average measure of the n-multiple labels (Y 1..n ).
- the average may be a median.
- each vibration sensor 70 has a respective unsupervised machine learning model 2025 associated.
- the model is based on a K-Mean algorithm.
- the K-Mean algorithm is given a predefined number of groups and will automatically divide the metric data points, i.e. vibration data transformed into one single metric which is here the sum of absolute changes that are the closest to each other into this number of groups.
- the final data groups have significantly different sizes which are used to associate each data group with the wind speed bin of the wind speed distribution 112 and of the corresponding size.
- Figure 7 illustrates a confusion matrix for the unsupervised machine learning model 2025. The quality of the algorithm is verified as before with LiDAR measurement.
- the x-axis represents the detected Wind Speed value using this Unsupervised Machine learning model 2025 against the y-axis with wind speed LiDAR measured independently.
- Each point is one minute of data transformed into the metric, which here is the sum of absolute changes.
- Figure 8 illustrates a wind speed distribution 202 and an interpolation of binned metric 200 data based on said wind speed distribution 202.
- the wind speed determined 115, 110 is by collecting 1100 a period of time series data 80 and transforming 1220 the collected time series data 80 to a metric data point 280.
- the act of determining 1300 the wind speed 110,115 is by interpolating 1320 the metric data point 280 to a predetermined wind speed 110 and metric distribution 202.
- the predetermined wind speed 110 and metric distribution 202 is binned for the specific wind turbine blade 50 and a corresponding specific vibration sensor 70.
- figure 8A represents the number of time a wind speed occurs over a period of time.
- the wind speeds are binned per 1 m/s.
- the working assumption made is that it is possible to build a similar distribution for pure vibrations and match this to the wind speed distribution 112. That is assuming a 90 % correlation between the raw data of both wind speed 110 and the metric 200 here the sum of absolute changes 210 of pure vibrations. It is seen how the metric 200 increases as the value of the wind speed bin increases.
- association between the wind speed distribution 112 and the metric distribution 202 i.e. the sum of absolute changes 212 is performed as follows.
- Wind speeds of 0.0 - 0.5 m/s happens 0.1% of the time. Find quantiles of the data for 0.0% and 0.1%. The mean value between these quantiles is 14. This value will be associated with the 0 m/s bin.
- This procedure is performed until the whole wind speed distribution 112 is converted to a metric distribution 112 based on transforming vibration data.
- Figure 8B displays an example of the metric distribution 202 as the sum of absolute changes distribution 212.
- the wind speed distribution 112 is actually the horizontal wind speed 110.
- a specific vibration sensor 70 has its own vibration distribution i.e. metric distribution 202 built this way. In order to detect or determined what wind speed 115 the wind turbine is currently experiencing the following is performed.
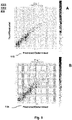
- Figure 9 illustrates a confusion matrix for the result by interpolation of binned metric data using the method 1000 of interpolating 1320 the metric distribution 202 described in figure 8 .
- Figure 9 A illustrates a confusion matrix with predicted or determined wind speed 115 against measured or true wind speed data 110.
- the confusion matrix is for metric distribution 202 established based on 0.5 m/s bins based on data from 15 months of data.
- Predicted or determined wind speed data 115 is for 6 other months of data as tested.
- Figure 9 B illustrates a confusion matrix with predicted or determined wind speed 115 against measured or true wind speed data 110 from another and different wind turbine generator.
- the confusion matrix is for metric distribution 202 established based on 0.5 m/s bins based on data from one month of data.
- Predicted or determined wind speed data 115 is for another one months of data as tested.
Landscapes
- Engineering & Computer Science (AREA)
- Mechanical Engineering (AREA)
- Sustainable Development (AREA)
- Sustainable Energy (AREA)
- Chemical & Material Sciences (AREA)
- Combustion & Propulsion (AREA)
- Life Sciences & Earth Sciences (AREA)
- General Engineering & Computer Science (AREA)
- Physics & Mathematics (AREA)
- Artificial Intelligence (AREA)
- Evolutionary Computation (AREA)
- Fuzzy Systems (AREA)
- Mathematical Physics (AREA)
- Software Systems (AREA)
- Wind Motors (AREA)
Priority Applications (2)
| Application Number | Priority Date | Filing Date | Title |
|---|---|---|---|
| EP20198710.4A EP3974646A1 (de) | 2020-09-28 | 2020-09-28 | Verfahren und system zur windgeschwindigkeitsbestimmung unter verwendung von schwingungsdaten |
| PCT/EP2021/076507 WO2022064038A1 (en) | 2020-09-28 | 2021-09-27 | Method and system for wind speed determination using vibration data |
Applications Claiming Priority (1)
| Application Number | Priority Date | Filing Date | Title |
|---|---|---|---|
| EP20198710.4A EP3974646A1 (de) | 2020-09-28 | 2020-09-28 | Verfahren und system zur windgeschwindigkeitsbestimmung unter verwendung von schwingungsdaten |
Publications (1)
| Publication Number | Publication Date |
|---|---|
| EP3974646A1 true EP3974646A1 (de) | 2022-03-30 |
Family
ID=72665127
Family Applications (1)
| Application Number | Title | Priority Date | Filing Date |
|---|---|---|---|
| EP20198710.4A Withdrawn EP3974646A1 (de) | 2020-09-28 | 2020-09-28 | Verfahren und system zur windgeschwindigkeitsbestimmung unter verwendung von schwingungsdaten |
Country Status (2)
| Country | Link |
|---|---|
| EP (1) | EP3974646A1 (de) |
| WO (1) | WO2022064038A1 (de) |
Cited By (1)
| Publication number | Priority date | Publication date | Assignee | Title |
|---|---|---|---|---|
| CN115013258A (zh) * | 2022-07-06 | 2022-09-06 | 华北电力大学 | 一种风电机组机前风速智能软测量方法、装置及服务器 |
Citations (5)
| Publication number | Priority date | Publication date | Assignee | Title |
|---|---|---|---|---|
| US20110137586A1 (en) * | 2009-07-06 | 2011-06-09 | Yong Jiang | Wind turbine monitoring and adjusting |
| US20150086362A1 (en) * | 2013-09-23 | 2015-03-26 | General Electric Company | Control system and method for mitigating rotor imbalance on a wind turbine |
| US20180223814A1 (en) * | 2017-02-07 | 2018-08-09 | International Business Machines Corporation | Reducing curtailment of wind power generation |
| US20200063710A1 (en) * | 2018-08-23 | 2020-02-27 | BluWave Inc. | System and methods for hyper short-term wind power prediction using real-time wind parameter measurements |
| EP3702613A1 (de) * | 2019-02-28 | 2020-09-02 | General Electric Company | System und verfahren zur vorhersage von windturbinenabschaltungen aufgrund übermässiger vibration |
Family Cites Families (1)
| Publication number | Priority date | Publication date | Assignee | Title |
|---|---|---|---|---|
| US10393093B2 (en) * | 2013-11-21 | 2019-08-27 | General Electric Company | System and method for assessing the performance impact of wind turbine upgrades |
-
2020
- 2020-09-28 EP EP20198710.4A patent/EP3974646A1/de not_active Withdrawn
-
2021
- 2021-09-27 WO PCT/EP2021/076507 patent/WO2022064038A1/en active Application Filing
Patent Citations (5)
| Publication number | Priority date | Publication date | Assignee | Title |
|---|---|---|---|---|
| US20110137586A1 (en) * | 2009-07-06 | 2011-06-09 | Yong Jiang | Wind turbine monitoring and adjusting |
| US20150086362A1 (en) * | 2013-09-23 | 2015-03-26 | General Electric Company | Control system and method for mitigating rotor imbalance on a wind turbine |
| US20180223814A1 (en) * | 2017-02-07 | 2018-08-09 | International Business Machines Corporation | Reducing curtailment of wind power generation |
| US20200063710A1 (en) * | 2018-08-23 | 2020-02-27 | BluWave Inc. | System and methods for hyper short-term wind power prediction using real-time wind parameter measurements |
| EP3702613A1 (de) * | 2019-02-28 | 2020-09-02 | General Electric Company | System und verfahren zur vorhersage von windturbinenabschaltungen aufgrund übermässiger vibration |
Cited By (2)
| Publication number | Priority date | Publication date | Assignee | Title |
|---|---|---|---|---|
| CN115013258A (zh) * | 2022-07-06 | 2022-09-06 | 华北电力大学 | 一种风电机组机前风速智能软测量方法、装置及服务器 |
| US11789034B1 (en) | 2022-07-06 | 2023-10-17 | North China Electric Power University | Intelligent soft measurement method for wind speed in front of wind turbine |
Also Published As
| Publication number | Publication date |
|---|---|
| WO2022064038A1 (en) | 2022-03-31 |
Similar Documents
| Publication | Publication Date | Title |
|---|---|---|
| CN113836762B (zh) | 一种风力机及风电场数字镜像模拟展示系统 | |
| CN112304613B (zh) | 一种基于特征融合的风电机组发电机轴承预警方法 | |
| US4435770A (en) | Vibration diagnosing method and apparatus for a rotary machine | |
| JP6906354B2 (ja) | 風車発電機の疲労損傷量算出装置、風力発電システム、及び風車発電機の疲労損傷量算出方法 | |
| CN109655200B (zh) | 一种风力发电机组风轮不平衡的诊断方法及系统 | |
| US20090039650A1 (en) | Event monitoring via combination of signals | |
| JP6849446B2 (ja) | 振動監視システム | |
| CN110905732B (zh) | 风电机组风轮不平衡的辨识方法、系统及储存介质 | |
| CN111946559B (zh) | 一种风机基础和塔架结构检测方法 | |
| CN107850513A (zh) | 异常诊断设备和传感器分离检测方法 | |
| CN111125895B (zh) | 一种风力发电机整机服役功率特性在线评估方法 | |
| CN104074687A (zh) | 一种用于兆瓦级风电机组的载荷及性能测试方法及装置 | |
| JPH01267436A (ja) | 振動部材の疲れ測定方法および装置 | |
| CN112267972A (zh) | 一种风电机组功率曲线异常智能判定方法 | |
| CN110398384A (zh) | 旋转机械的机器健康监测 | |
| EP3974646A1 (de) | Verfahren und system zur windgeschwindigkeitsbestimmung unter verwendung von schwingungsdaten | |
| KR102226971B1 (ko) | 복합 조건을 고려한 진동 기반 고장 진단 방법 및 이러한 방법을 수행하는 장치 | |
| CN116105885A (zh) | 一种核电用电气设备状态监测方法及系统 | |
| EP4100646B1 (de) | Nachlaufüberwachung, nachlaufmanagement und zugehörige sensoranordnungen | |
| JP6801144B2 (ja) | 診断装置および診断方法 | |
| CN107327367B (zh) | 风力发电机组变桨异常的识别方法及装置 | |
| CN110578659A (zh) | 一种用于对风电机组scada数据进行处理的系统和方法 | |
| CN116085212B (zh) | 一种新能源风电机组的运行状态实时监测方法及系统 | |
| CN116557230A (zh) | 一种风电场机组功率异常在线评估方法及系统 | |
| CN107218180B (zh) | 一种基于振动加速度测量的风力发电机组传动系统故障报警方法 |
Legal Events
| Date | Code | Title | Description |
|---|---|---|---|
| PUAI | Public reference made under article 153(3) epc to a published international application that has entered the european phase |
Free format text: ORIGINAL CODE: 0009012 |
|
| STAA | Information on the status of an ep patent application or granted ep patent |
Free format text: STATUS: REQUEST FOR EXAMINATION WAS MADE |
|
| 17P | Request for examination filed |
Effective date: 20210527 |
|
| AK | Designated contracting states |
Kind code of ref document: A1 Designated state(s): AL AT BE BG CH CY CZ DE DK EE ES FI FR GB GR HR HU IE IS IT LI LT LU LV MC MK MT NL NO PL PT RO RS SE SI SK SM TR |
|
| STAA | Information on the status of an ep patent application or granted ep patent |
Free format text: STATUS: EXAMINATION IS IN PROGRESS |
|
| 17Q | First examination report despatched |
Effective date: 20220511 |
|
| GRAP | Despatch of communication of intention to grant a patent |
Free format text: ORIGINAL CODE: EPIDOSNIGR1 |
|
| STAA | Information on the status of an ep patent application or granted ep patent |
Free format text: STATUS: GRANT OF PATENT IS INTENDED |
|
| INTG | Intention to grant announced |
Effective date: 20221121 |
|
| STAA | Information on the status of an ep patent application or granted ep patent |
Free format text: STATUS: THE APPLICATION IS DEEMED TO BE WITHDRAWN |
|
| 18D | Application deemed to be withdrawn |
Effective date: 20230404 |