EP3971910B1 - Verfahren zur vorhersage von markern, die für mindestens eine medizinische probe und/oder für einen patienten charakteristisch sind - Google Patents
Verfahren zur vorhersage von markern, die für mindestens eine medizinische probe und/oder für einen patienten charakteristisch sind Download PDFInfo
- Publication number
- EP3971910B1 EP3971910B1 EP21197992.7A EP21197992A EP3971910B1 EP 3971910 B1 EP3971910 B1 EP 3971910B1 EP 21197992 A EP21197992 A EP 21197992A EP 3971910 B1 EP3971910 B1 EP 3971910B1
- Authority
- EP
- European Patent Office
- Prior art keywords
- pred
- predictive model
- values
- spectra
- train
- Prior art date
- Legal status (The legal status is an assumption and is not a legal conclusion. Google has not performed a legal analysis and makes no representation as to the accuracy of the status listed.)
- Active
Links
Images



Classifications
-
- G—PHYSICS
- G16—INFORMATION AND COMMUNICATION TECHNOLOGY [ICT] SPECIALLY ADAPTED FOR SPECIFIC APPLICATION FIELDS
- G16H—HEALTHCARE INFORMATICS, i.e. INFORMATION AND COMMUNICATION TECHNOLOGY [ICT] SPECIALLY ADAPTED FOR THE HANDLING OR PROCESSING OF MEDICAL OR HEALTHCARE DATA
- G16H50/00—ICT specially adapted for medical diagnosis, medical simulation or medical data mining; ICT specially adapted for detecting, monitoring or modelling epidemics or pandemics
- G16H50/20—ICT specially adapted for medical diagnosis, medical simulation or medical data mining; ICT specially adapted for detecting, monitoring or modelling epidemics or pandemics for computer-aided diagnosis, e.g. based on medical expert systems
Definitions
- the invention provides a method to predict markers which are characteristic for at least one medical sample and /or for a patient, preferably for a subject wherein the method comprises the steps of measuring at least one spectrum of at least one medical sample of a patient with at least one spectroscopic method, preferably with Raman spectroscopy and/or with IR spectroscopy.
- a value for at least one marker is calculated.
- bioinformatics processing of the measured spectra multiple values which are characteristic for said sample can be calculated for certain markers.
- These predicted values can be compared with results of conventional routine laboratory medical diagnostic and/or interpreted in the context of reference intervals, preferably of a reference range, and/or clinical decision limits.
- a report including recommended further actions for a user is created and due to the results, further diagnostic steps can be initiated by the user, which allows accelerated, more specific treatment of a patient, preferably of a subject and avoids missed and delayed diagnostic findings.
- laboratory diagnostics For diagnosis, choosing adequate therapy and monitoring the course of the treatment and disease, the majority of patients require laboratory diagnostics. 60 - 70 % of all therapeutic decisions in medicine are based on laboratory diagnostics (Regan & Forsman 2006). Thus, almost 7 billion laboratory tests are performed annually in the USA (Makary & Daniel 2016). The analysis of laboratory medical patient diagnostics is quality-assured at the highest level and is regarded as very precise.
- laboratory diagnostics for medical care is characterized by single biomarker analysis. These parameters are requested individually by physicians according to the suspected diagnosis of the patient.
- the sample is usually taken at the clinic or doctor's office and send to the medical laboratory.
- the requested parameters are analyzed with different methods. These different methods, mainly each for one biomarker, are usually performed in parallel on huge and expensive analyzers. Each biomarker determination is billed separately, which also leads to considerable costs.
- a minimum amount of the medical sample is necessary. The whole amount of required sample volume is the sum of these individual amounts needed for each of the different methods, which sometimes limits the number of tests that can be performed.
- troponin is released from the heart muscle in case of myocardial infarction. It can be detected using highly specific antibodies and a very sensitive detection system in a so-called immune assay. The production of suitable detection antibodies is complex and costly. For myoglobin, another important biomarker if a myocardial infarction is suspected, the detection requires different methods with different detection antibodies. The methods are processed in parallel on large mechanized analyzers in different reaction vials, but are not measured simultaneously in the same assay. The most important methods in a medical laboratory are clinical chemistry reactions, immune assays, clotting assays for coagulation diagnostics and flow cytometry for cell analysis.
- laboratory medical diagnostics is carried out depending on the clinical picture and the medical question according to the principle of the specific request of individual diagnostic parameters (targeted diagnostics).
- the practitioner must therefore already define a suspected diagnosis at the time of the laboratory request. This is accompanied by the risk of inadequate diagnostics.
- he or she must have knowledge of the appropriate diagnostic laboratory medical parameters and select them - a precondition that is not always given.
- pre-analytical influencing factors and interfering factors are the therapy with different drugs and food supplements (e.g. antibiotics, biotin), dilutions with infusion solutions, analyte concentrations above the measuring range of the method (Hook effect), material inhomogeneities (e.g. air bubbles and clots) as well as sample ageing.
- drugs and food supplements e.g. antibiotics, biotin
- Hook effect e.g. air bubbles and clots
- Biomarkers are measurable indicators of a biological state or condition.
- Spectrometric methods are of particular interest in this context, since they in principle provide an extensive diagnostic spectrum for a wide range of diseases.
- spectrometric, untargeted methods have considerable limitations.
- biomarkers in laboratory medicine are often very complex proteins that require spectra that are difficult to interpret.
- biomarkers Due to the complexity of biosamples containing several thousand biomarkers in various physiological concentrations ranging from less than ng/l to several g/l, specific detection and quantification of individual analytes whose spectra overlap during measurement is not possible with diagnostic certainty.
- a further, fundamental problem with low-concentration biomarkers is the weak signal especially in relation to strong noise.
- Raman spectroscopy the substance-specific spectra, which can be measured in dry form and which can be clearly assigned, largely disappear in the noise and fluorescence when the substances are brought into solution.
- the obtained information should be suitable to perform validity and quality checks and to complement conventional targeted routine laboratory medical diagnostic of a medical sample. It also allows a screening diagnostic prior to the specific and sensitive targeted standard diagnostics. Especially the method allows for diagnosing at least one disease of a subject, the medical sample has been taken from.
- the present invention provides a method according to claim 1.
- the method according to the invention or the device according to the invention are used for validity and quality check of conventional targeted routine laboratory medical diagnostic, for performing untargeted diagnostics, to obtain a rapid diagnosis of suspicion and/or for monitoring of laboratory values and/or clinical features of e.g. a patient at home, in a doctor's practice or in the clinic.
- the present invention provides a method to predict markers which are characteristic for at least one medical sample and/or for a patient.
- the marker is calculated by either a mathematical model, which is called predictive model or a machine learning algorithm. Therefore, the term ⁇ prediction of a marker' refers to the calculation of that marker.
- the present invention provides a method for diagnosing at least one disease in a subject, wherein the value of at least one marker is calculated. All features described below for a patient apply as well for a subject, since a suitable subject according to the invention is for example a patient.
- a medical sample is passed to at least one spectrometer by a user.
- the medical sample is passed to a Raman and/or a IR spectrometer.
- a user can be generally every person able to operate a spectrometer and able to work with medical samples, these include in particular clinicians, general practitioner and laboratory specialists. Since, at least some spectroscopic methods are implementable in easy operable tools, in one embodiment of the invention also a patient can be a user according to the invention.
- Medical samples suitable for the present invention are selected from the group comprising blood, blood plasma, blood serum, cerebrospinal fluid (CSF), urine, saliva and exhaled breath condensate.
- the medical sample of the present invention is a liquid medical sample, accordingly in a further preferred embodiment the liquid medical sample is selected from the group comprising blood, blood plasma, blood serum, cerebrospinal fluid (CSF), urine and saliva.
- one medical sample of one patient is used in the method of the invention.
- more than one medical sample of one patient is used in the method of the invention, wherein the medical samples are of different types, for example blood plasma, urine and CSF could be used.
- the number of medical samples from one patient is not limited and according to the invention every combination of types of medical samples can be used. This has the advantage, that information contained in different types of medical samples can be evaluated with the present method leading to a more precise prediction.
- At least one spectrum of the at least one medical sample with at least one spectroscopic method is measured, wherein said at least one spectroscopic method is Raman and/or IR spectroscopy.
- at least one Raman spectrum and/or at least one IR spectrum of a liquid medical sample is measured.
- more than one spectrum is measured with the at least one spectroscopic method of the at least one medical sample.
- not only one spectrum of the at least one medical sample is measured but a multiple of spectra, wherein each spectrum is measured with another spectroscopic method. Since the physical background of different spectroscopic methods is fundamentally different, the information contained in the spectra of different spectroscopic methods differs as well. The physical background of the spectroscopic method used according to the invention are well known to the person skilled in the art and will not be explained in this context further. Accordingly, spectra obtained by different spectroscopic methods often contain information about the medical sample which complement each other. The combination of spectra obtained by different spectroscopic methods in the predictive model according to the invention therefore significantly increases the quality of the predictive model.
- At least one spectrum of the liquid medical sample is measured by 1 to 2 spectroscopic methods.
- Raman spectroscopy and/or IR spectroscopy are used.
- Raman spectroscopy and IR-spectroscopy are used in combination to measure spectra of the medical sample.
- At least two spectra are measured with the same spectroscopic method using different measurement settings.
- measurement settings are defined as settings which are specific for a certain method and which may influence the information obtained in the spectra.
- Raman spectroscopy spectra can be obtained with different Raman excitation frequencies and different optical settings. Analogous to using different spectroscopic method the information contained in the spectra can complement each other and therefore can increase the quality of the prediction.
- Raman spectroscopy is used as one spectroscopic method. In a further preferred embodiment Raman spectroscopy is used with two different Raman excitation frequencies.
- spectroscopic methods need just small amounts of samples to be carried out. Accordingly, in one embodiment of the invention between 1 ⁇ l and 150 ⁇ l, preferably between 30 ⁇ l and 100 ⁇ l, most preferably 50 ⁇ l of medical sample, preferably of liquid medical sample are used to measure all spectra used in the method according to the invention. Since medical samples have a limited volume, it is of great benefit that just a small part of the medical sample, preferably of liquid medical samples is necessary to carry out the method according to the invention. It allows a general untargeted screening diagnostic for all samples prior to or in parallel to targeted conventional laboratory diagnostic. Still a dominant part of a medical sample, preferably of a liquid medical sample is available to carry out further diagnostics such as routine laboratory medical diagnostic.
- values m pred are calculated by bioinformatic processing of at least one spectrum of at least one medical sample using a predictive model.
- the values m pred are predictions for markers which are characteristic for the at least one medical sample or for the status of a patient, wherein these characteristic values are selected from the group comprising laboratory values, clinical features and sample characteristics.
- laboratory values comprise concentrations of single substances and combinations of such, wherein combinations of single concentrations of substances are called scores.
- Clinical features are selected from the group comprising:
- sample characteristics can be for example the sample-age.
- Some of these markers have numerical values per se, such as laboratory values. However, a part of the markers, e.g. clinical features and sample characteristics are not represented by numerical values per se. According to the invention the information of these markers is translated into numerical values, e.g. "0:no", "1:yes” or '0:dead', '1:alive'. Hence, every marker has a numerical representation.
- m pred is a prediction of a numerical representation of a certain marker.
- m pred is a prediction of a numerical representation of a certain marker.
- a separate predictive model is used for each marker.
- a predictive model must be derived for every value m pred which is used to predict a certain marker which is characteristic for the medical sample, preferably for the liquid sample or for the status of a patient.
- the optimal predictive model to calculate a value m pred or a vector m pred is generated by a model based or a model-free approach.
- an optimal predictive model is used or a machine learning algorithm.
- model free learning algorithm such as ,deep learning ⁇
- a successful application of model-free approaches depends on cohorts above 1000, preferably 10000 patients being available.
- machine learning one distinguishes classification and regression problems. Classifications are assignments to distinct classes such as ,healthy ⁇ and ,ill ⁇ . Regressions predict continuous range of values such as molecular concentrations.
- Main classes of machine learning algorithms are linear and logistic regression, artificial neural networks, support vector machines, decision trees, as well as Bayesian networks.
- the applied method depends therefore on the nature of the marker, whether it is binary, discrete or continuous.
- artificial intelligence or more precisely supervised machine learning is applied to predict markers from spectral data.
- the machine learning algorithm is selected from the group comprising convolutional neural networks, graph neural networks, recurrent neural networks, support vector machines and random forests.
- predictions of markers are derived in a complex model-based learning approach.
- Model based means in this context that the algorithm is based on knowledge about the nature of the data, that it is targeted towards solving that specific problem.
- Learning means that the algorithm contains free parameters, which are adjusted such that the calculated values match the expected values best.
- the model-based implementation has the advantage to reach correlations above 0.7 for independent verification test data sets when only a medium number of spectra and according marker are available, ranging from 100 to 1000.
- an optimal predictive model F opt ( s ) to calculate a value m pred or a vector m pred is calculated and optimized by a method comprising the steps:
- At least one spectrum of each medical sample is measured with at least one spectroscopic method. Suitable spectroscopic methods are already described above.
- at least 100 medical samples are passed to a Raman spectrometer and/or an IR spectrometer.
- One value m ref which is a numerical representation of a certain marker is read for every of the at least 100 medical samples.
- every value m ref of the at least one measured spectrum is assigned to a certain medical sample.
- m ref are characteristic values collected in the medical context, which are used during the derivation and/or optimization of the prediction method.
- Each of the above mentioned markers which are characteristic for the medical sample or for a patient may serve as reference values m ref , and are used for the optimization of an according m pred .
- a pair m ref , m pred relates to the same type of marker which is characteristic for the medical sample or the patient.
- this information is translated into numerical values, e.g. "0:no", "Eyes” or '0:dead', '1:alive'.
- m ref is a numerical representation of a marker.
- At least 100 medical samples are used to derive the predictive model.
- the at least 100 medical samples are each from different sources e.g. patients and could have the same nature, e.g. all samples are urea or they could have different nature, e.g. a part is urea and a part is blood plasma. It is quite obvious that also more than 100 medical samples can be used to derive the predictive model.
- at least one spectrum is measured for each of 100 to 100.000 medical samples, preferably at least one spectrum is measured for each of 200 to 50.000 medical samples, most preferably at least one spectrum is measured for each of 400 to 10.000 medical samples.
- At least one spectrum is measured with at least one spectroscopic method.
- more than one spectrum can be measured with the at least one spectroscopic method for each medical sample. Suitable numbers of spectra are already described above. Further, more than one spectrum can be measured for each medical sample with at least one spectroscopic method using different measurement settings. Suitable spectroscopic methods are already described above.
- At least one spectrum can be measured for each medical sample utilizing different spectroscopic methods and/or different measurement settings. Preferable combinations are already described above.
- temporal changes in the spectra of the medical sample and/or the background signals of the spectroscopic methods are used in the bioinformatic processing, preferably in the processing as additional information.
- Measurements and processing time have an impact on some markers such as biomarkers or other properties of the sample.
- Raman spectroscopy a high energy laser beam is applied to the sample, which causes bleaching of some components in the sample.
- following the time dependence of fluorescence and Raman spectra reveal altered spectral information that add additional information and can improve the predictive model and thus the quality of the calculation of m pred .
- difference spectra are exploited, based on changes in biochemical conditions such as pH and/or physical conditions such as temperature. Each change will lead to differences in the spectra. These changes may add further information and improve the predictive model.
- the spectra obtained for each of the at least 100 medical samples together build a set of spectra. Pre-Processing is done for all spectra of the set of spectra in the following way.
- pre-processing is done for every spectrum of the set of spectra comprising the steps of calibration, background filtering and optionally normalization and/or adding of derived spectra.
- Background filtering has to be done depending on the spectroscopic method used to measure the spectrum on which background filtering is applied. Generally, background signals are extraneous signals that can be mixed up with the phenomenon to be observed or measured. The phenomenon is well known to persons skilled in the art and background filtering is one of the crucial steps to reveal the information content of the spectrum. Background filtering according to the invention comprises at least one of the following steps:
- one, two or all steps of background filtering are applied to the spectrum.
- Fitting algorithms to filter background signals as well as noise filters are known to the persons skilled in the art. Suitable fitting algorithms can be tuned to which degree they follow local fluctuations of the spectrum. These parameters are often considered the 'stiffness' and 'flexibility' of the smoothing curve.
- the signal arising from water in the sample or material of the sample carrier can be removed. This is done by subtracting a signal of a reference sample.
- the reference sample can be for example water.
- the background signal arising from fluorescence is handled, by filtering out the background signal by a fitting algorithm.
- the difference between a peak arising from Raman Spectroscopy (a so-called Raman peak) and a peak arising from fluorescence (a so-called fluorescence peak) is their width.
- Raman peaks have a width of a few wavenumbers, while a fluorescence peak covers a broad range of the spectrum. Therefore, one can filter them out by a fitting algorithm that clings to the part of the spectrum arising from fluorescence and due to its stiffness does not follow local fluctuations or peaks arising from Raman spectroscopy.
- the fluorescence spectrum is extracted and can be used as a further spectrum obtained by a further method (fluorescence spectroscopy) to increases the quality of the predictive model.
- the fluorescence spectrum extracted from the spectrum obtained by Raman spectroscopy is used as further spectrum in the method of the invention.
- a noise filter can be applied.
- Two averaging methods are usually used. One method averages over a triangular window and the other method averages over a window with a Gaussian shape, having tails in the negative range (Savitzky-Golay-filter).
- noise filtering is applied depending on the value m ref and/or the spectroscopic method used to obtain the spectrum, meaning for some values m ref and/or some spectroscopic methods noise filtering is done while for other values m ref and/or some spectroscopic methods no noise filtering is applied. Also, noise filtered and not noise filtered spectra can be used both together as two spectra for the same value m ref .
- the spectra obtained after background filtering are normalized.
- the spectra obtained after background filtering are normalized.
- normalization of the spectrum can be performed in multiple ways, wherein normalization procedures are well known to persons skilled in the art. For example, normalization can be done using the boundaries of the spectral values as reference or alternatively their mean value and standard deviation. In one embodiment of the invention normalization involves centering the spectra. In a further embodiment of the invention normalization does not involve centering the spectra.
- the spectrum is further evaluated using a spectrum which is not normalized.
- Derived spectra are spectra selected from the group comprising:
- the fluorescence spectrum contained as background signal in the at least one spectrum can be used as derived spectra.
- At least one derived spectrum is added to the at least one spectrum.
- the derived spectra can contain spectral information which complement the information of the measured spectra.
- the spectral information stands out more clearly in a derived spectra in comparison to the measured spectra due to mathematical operations applied to the measured spectra to obtain the derived spectra (e.g. mathematical derivative, differential spectrum).
- the set of pre-processed spectra is divided into a training data set, a test data set and a validation data set, wherein each of the pre-processed spectra is assigned to exactly one of the data sets. For example, 1/3 of the pre-processed spectra can be assigned to the training data set, 1/3 of the pre-processed spectra can be assigned to the test data set and 1/3 of the pre-processed spectra can be assigned to the validation data set.
- a value m ref is read which represents a reference value for m pred .
- the values m ref which belong to medical samples whose spectra are assigned to the training data set are represented by a vector m ⁇ ref train .
- the values m ref which belong to medical samples whose spectra are assigned to the test data set are represented by a vector m ⁇ ref test and further values m ref which belong to medical samples whose spectra are assigned to the validation data set are represented by a m ⁇ ref val .
- a first predictive model to calculate a vector m ⁇ pred , 1 train is generated by bioinformatic processing using the spectra of the training data set, wherein the bioinformatic processing comprises the steps of
- n frequencies f n with n ⁇ N is selected from the set of pre-processed spectra of the training data set which are suspected to contain the most information about a given value m ref .
- 5 to 1000 frequencies f n are selected from the set of pre-processed spectra of the training data set, preferably 5 to 100 frequencies f n are selected from the set of pre-processed spectra of the training data set, most preferably 5 to 50 frequencies f n are selected from the set of pre-processed spectra of the training data set.
- frequencies which are selected must not belong to resonances in the spectra belonging directly to a certain molecule and e.g. its concentration, but can also be an indirect indicator of complex physical and physiological processes in the sample or the patient reflected not only by a single molecule concentration.
- the selection of the frequencies is arbitrary.
- the frequencies are selected by a pre-selection to find the best candidates. For example, the correlation of the frequencies with the marker can be checked and frequencies with the highest correlation are taken.
- the selected frequencies are represented by the spectral matrix S which considers the number of medical samples n and the total number of selected frequencies k which were selected for the spectra available for each medical sample.
- S s 1 f 1 ⁇ s 1 f k ⁇ ⁇ ⁇ s n f 1 ⁇ s n f k .
- m pred S ⁇ w
- the calculated vector m pred is called m ⁇ pred , 1 train .
- the weights w are optimized by standard algebraic methods to minimize the error between m pred and m ref .
- the user of the method according to the invention can define for any kind of spectrum that is involved, how many of the n selected f n frequencies are considered by defining the weights which are non-zero. More frequencies or weights will generally improve the quality of the prediction, but also increase the danger of over-fitting.
- the first predictive model F 1 ( S ) is optimized.
- a quality score d 1 train is calculated utilizing the vectors m ⁇ pred , 1 train and m ⁇ ref train .
- the larger the difference d 1 train the larger the error and accordingly the lower the quality of the prediction.
- the spectra of the training data set are used and wherein the same number n of frequencies is selected as in the first step.
- the n selected frequencies are iteratively altered compared to the frequencies selected in any of the steps before.
- Steps a. to c. of the bioinformatic processing are already explained in the context of deriving the first predictive model.
- the spectra of the training data set were used, but the frequencies selected in step a. are iteratively altered compared to the frequencies selected for generating the first predictive model and to the frequencies selected in any of the steps before.
- the quality scores are compared and only if d 2 train ⁇ d 1 train and d 2 test ⁇ d 1 test the further predictive model is taken as optimal predictive model and the first predictive model is discarded. If the condition d 2 train ⁇ d 1 train and d 2 test ⁇ d 1 test is not fulfilled the first predictive model continuous to be taken as optimal predictive model and the further predictive model is discarded.
- the quality scores of the optimal predictive model are renamed as d opt train and d opt test , wherein d opt train is the quality score calculated using the spectra of the training data set and d opt test is the quality score calculated for the spectra of the test data set.
- step x Further steps x to xii of the method are repeated, thereby obtaining again a further predictive model.
- the spectra of the training data set are used, but the n frequencies selected in step x are iteratively altered compared to the frequencies selected for generating any predictive model before.
- the quality scores of the optimal predictive model and the further predictive model are compared and if d 2 train ⁇ d opt train and d 2 test ⁇ d opt test the further predictive model is taken as optimal predictive model. If the condition d 2 train ⁇ d opt train and d 2 test ⁇ d opt test is not fulfilled the optimal predictive model is unchanged and the further predictive model is discarded.
- the quality scores of the predictive model taken as optimal predictive model are renamed as d opt train and d opt test if necessary.
- d opt train is the quality score calculated using the spectra of the training data set
- d opt test is the quality score calculated for the spectra of the test data set.
- the immediate measure that drives the optimization process is the difference between the vectors m ref and m pred , which is mathematically described by the quality score d.
- Generating a further predictive model and comparing the quality scores as described to find the optimal predictive model is driven by the selection of frequencies.
- step xiv) is repeated for all possible combinations of n frequencies. That means, while the number of frequencies selected is constant n, with n ⁇ N , the n frequencies which are selected to generate a predictive model are iteratively altered for generating different predictive models.
- two measures are taken to reduce computational effort without losing crucial information.
- the correlation of each frequency vector s f with m ⁇ ref train is calculated. Sorting by correlation allows selecting most relevant frequencies. Dependent on the spectra type 100 to 5000 frequencies are selected, preferably 200 to 2000 frequencies are selected, most preferably 500 to 1000 frequencies are.
- the second measure is to split the search for combinations into two distinct phases.
- all possible combinations are evaluated for a selected number of frequencies. Between 2 and 100 frequencies are selected, preferably between 3 and 20 frequencies are selected, most preferably between 5 and 10 frequencies are selected. As this is the most time-consuming part, the maximum number that is feasible depends on available resources.
- the remaining frequencies are evaluated linearly, by adding them only if they improve the score significantly. What significant means depends on the range of values of the marker. Assuming a normalized m ⁇ ref train with values ⁇ 1 ⁇ m ⁇ ref , i train ⁇ 1 , a significant improvement would mean in one implementation 1 ⁇ 10 -10 - 1 ⁇ 10 -1 , in a preferred implementation 1 ⁇ 10 -5 - 1 ⁇ 10 -2 .
- the quality of the predictive model to predict a certain value m ref or a vector m ref is evaluated.
- m ⁇ pred val is calculated with the pre-processed spectra of the validation data set, which was not involved in generating the predictive model, utilizing the optimal predictive model as independent test.
- the correlation coefficient of m ⁇ pred val and m ⁇ ref val is calculated. In one embodiment of the invention this is done using the Pearson, Spearman, Kendall or other correlation coefficient. This has the advantage, of helping the user to understand the quality of the predictive model in an easy way. Furthermore, especially when working with spectra that are not normalized, the correlation coefficient helps to compare the quality for different predictive models and also the quality of the prediction between different types of markers.
- a z-score is calculated using the spectra of the validation data set to evaluate the trustworthiness of the correlation coefficient.
- the z-score utilizes a random distribution of m ⁇ ref random as reference. For a given number n of spectra and a given number k of frequencies f a random distribution for the m ⁇ ref random is created and a predictive model is derived by the method according to the invention as described. m pred values are calculated with the predictive model and the correlation coefficient q rand is calculated. This process is repeated several thousand times and the resulting correlation coefficients q rand are collected.
- the correlation coefficient q pred of the calculated m ⁇ pred val is one standard deviation better than the average random quality, this would result in a z-score of 1. Up to a z-score of ⁇ 2 there is a significant chance to obtain a given quality measure by chance - which would render the value more or less meaningless. The larger the z-score, the more reliable a given quality measure can be considered.
- the spectra of the validation data set are used to validate the optimal predictive model.
- the spectra of the validation data sat are not involved in the steps of generating the optimal predictive model and represent therefore an independent data set.
- the predictive model is considered to be stable and thus overfitting is excluded if the correlation coefficient is higher or equal 0.7 and if the z-score is larger than 2. In this case the predictive model is considered to have a good enough quality for a reliable prediction of a certain marker.
- the correlation coefficient of each optimal predictive model is equal to or higher than 0.7 and the z-score of each optimal predictive model is higher than 2.
- the correlation coefficient is higher than or equal 0.7, preferably higher than or equal 0.8, most preferably higher than or equal 0.9. Wherein predicting models with a correlation coefficient higher than or equal 0.9 can be considered as very good, predicting models with a correlation coefficient higher than or equal 0.8 can be considered as good and predicting models with a correlation coefficient higher than or equal 0.7 can be considered as satisfactory.
- the number of non-zero weights can be defined individually for every type of spectra. This gives the opportunity to define the relative importance of every type of spectrum. Therefore, it is possible to take into account to what degree a further spectrum can add new information to an already existing model.
- the predicting model derived by a certain spectral matrix S does not predict values m ⁇ pred val with a satisfying quality, the following can be done:
- pre-processing steps are performed in a different way compared to the pre-processing done to derive the predictive model which has an unsatisfying quality.
- the newly pre-processed set of spectra is again used to derive a predictive model by the steps already described.
- a new predictive model is derived by the steps explained above, wherein other frequency components are selected for the spectral vector or the spectral matrix.
- the pre-processing of the measured spectra can be left unchanged or can be done in a different way compared to the pre-processing done to derive the predictive model which has an unsatisfying quality.
- a predictive model which is able to calculate the value m pred for a given m ref with a satisfying quality. Accordingly, a predictive model is obtained iteratively to calculate a certain value m pred which is a prediction for a value m ref .
- the relative importance of every non-zero weighting factor w i is estimated by checking how much the calculated value m pred changes when switching this weighting factor to zero. In this way the number of free variables can be reduced by identifying weight factors w i which are not necessary to derive a satisfying predictive model for a certain marker. Thereby, the risk of overfitting can be further reduced.
- a predictive model is obtained in this way for every marker, which shall be predicted by the method according to the invention.
- a multiple number of predictive models is generated, wherein every predictive model is suited to calculate a value m pred which is a prediction for a certain marker.
- At least one optimal predictive model or at least one machine learning algorithm is used to calculate the value of at least one marker in a method for diagnosing at least one disease in a subject.
- the method comprises the steps:
- the bioinformatic processing to generate the predictive model comprises pre-processing of the utilized spectra, frequency selection, weight optimization, estimation of a quality measure and detecting and correction of overfitting.
- pre-processing is also done with the at least one spectrum used for calculating multiple m pred values according to the method of the invention. Pre-processing is done in the same way as already described above for deriving the predicting model.
- Latter comprises the selection of the frequencies (including non-linear terms) and the multiplication with the weight-vector.
- the timeframe required to operate the method according to the invention is determined by the transport of the medical sample and by the time needed to measure the spectra.
- the calculation of a multiple of m pred values is very fast.
- At least one optimal predictive model or at least one machine learning algorithm is provided. Further, in one embodiment at least one value m pred is calculated from the at least one Raman spectrum and/or the at least one IR spectrum in the liquid medical sample using the at least one optimal predictive model F opt ( s ) which was provided, wherein the calculation comprises the steps
- n frequencies selected from the at least one Raman spectrum and/or IR spectrum in step a. are predetermined by the provided optimal predictive model.
- At least one value m pred is calculated from the at least one Raman spectrum and/or the at least one IR spectrum in said liquid medical sample using the machine learning algorithm provided.
- the at least one calculated value m pred is compared with a reference range value for the marker, whereby a positive indicator for the at least one disease exists if the calculated value m pred is outside the reference range for the at least one marker.
- a reference range is defined.
- the "reference range” is the value range of a certain marker in a medical sample of the same type, that is obtained from a representative population with no subjects included with a history of a disease which influence the reference range of the marker.
- the boundaries of the reference range are defined as the lower limit of normal (LLN) and the upper limit of normal (ULN).
- a marker is considered to be outside the reference range if the value m pred is below the LLN or if the value m pred is above the ULN.
- a threshold is defined depending on the marker, the type of liquid sample investigated. If the at least one calculated value m pred is outside the reference range for the at least one marker a positive indicator for at least one disease exists.
- the following table comprises which diseases are linked to which marker, further reference ranges and thresholds are given for the markers. Table 1: Description of markers, material for spectral analysis and medical consequences if calculated results are beyond the defined threshold.
- S Serum
- P Plasma
- U Urine
- LLN Lower limit of normal
- ULN Upper limit of Normal
- MELD Model of end-stage liver disease
- MELDNa Model of end-stage liver disease (UNOS definition)
- LCAT Primary lecithin-cholesterol acyltransferase
- INR International normalized ratio
- D.m. Diabetes mellitus
- NT-proBNP N-terminal prohormone of brain natriuretic peptide.
- Bilirubin S/P/U S/P/U ⁇ 17.1 ⁇ mol/l > 2x ULN bile duct obstruction
- Bilirubin indirect S/P/U S/P/U ⁇ 15.4 ⁇ mol/l > 2x ULN liver failure
- hemolysis Sonography of the abdomen exclusion Hemolytic crisis
- Bilirubin direct S/P/U S/P/U ⁇ 6.5 ⁇ mol/l > 2x ULN bile duct obstruction
- lipid lowering drugs HDL-Cholesterol S/P > 1.03 mmol/l
- the at least one calculated value m pred is compared to at least one threshold value, whereby the at least one calculated marker m pred is assigned to a distinct class.
- the distinct class is an indicator for a clinical feature, a sample feature or a positive indicator for at least one disease.
- the calculated values m pred are classified in terms of defined thresholds.
- the thresholds to classify the calculated values m pred are defined using m pred and m ref values utilized in the method of generating the predictive model.
- Binary classification means a certain value or a certain statement like "healthy” or “having a certain disease”. If the reference value m ref is binary as well, this is inherently obtained. Which means by comparing m ref and m pred values a threshold can be defined for m pred , which separates two defined statuses (e.g. "healthy” and “having a certain disease”).
- a classification can be obtained in terms of a threshold for the calculated value m pred and thus for the marker.
- a suitable threshold for a certain marker can be derived utilizing the m pred , m ref pairs used to generate the predictive model. Therefore, m pred , m ref pairs are presented in a confusion matrix, containing true positive, false positive, true negative and false negative values.
- the threshold for a certain marker is determined individually for the marker and hence can advantageously be adapted to the characteristics of the marker. Accordingly, the classification of the calculated values according to the invention enables the classification of the calculated values and therefore of the predicted markers in terms of reference intervals and/or cut-offs and/or probabilities of diagnoses, events and medical complications, which supports the clinical assignment and the initiation of the further necessary treatment steps.
- a report is created which includes recommended actions for the user.
- the report includes the marker predicted by the calculated values m pred optionally in context with the values of conventional routine laboratory medical diagnostic if available and/or a classification.
- the markers predicted by the calculated values m pred are compared with results of conventional routine laboratory medical diagnostic and/or interpreted in the context of a classification, describing reference intervals preferably reference ranges and/or cut-offs and/or probabilities of diagnoses, events and medical complications.
- a part of the medical sample is therefore examined in parallel or prior to performing of the method according to the invention by targeted routine laboratory medical diagnostics.
- the medical sample is examined by targeted routine laboratory medical diagnostics after performing the method according to the invention. Since the medical sample may change some of its properties due to storage conditions or aging effects, additional information can be obtained depending on the point in time the routine laboratory medical diagnostics is performed.
- the report makes clearly visible significant differences between markers predicted by the calculated values m pred and values obtained by conventional routine laboratory medical diagnostic or the exceeding of a threshold for example by a color code.
- the exceeding of a threshold of a marker predicted by a calculated value m pred and/or differences between markers predicted by the calculated values m pred and values obtained by conventional routine laboratory medical diagnostic can also be made visible and/or transmitted to the laboratory information system and/or physician/pathologist to trigger re-measurements or other medical procedures.
- Analogues due to the markers like clinical features, diagnosis, events or complications predicted by the calculated values m pred , further actions are recommended to the user. Further actions include further diagnostic steps such as re-measuring certain values measured by conventional routine laboratory medical diagnostic, detailed medical validation of the medical report, blocking or withdrawal of the results and reports, propose further diagnostic steps to complement the values already obtained, exclusion of sample confusion, request for a new patient's sample and consultation with the patient and/or sample sender. The user reviews the recommendations given and takes any further diagnostic steps or action that seem necessary.
- the method according to the invention is based on measuring at least one spectrum obtained by a spectroscopic method the medical sample is examined in an untargeted manner. Which means many different markers such as laboratory values, clinical features and sample characteristics are measured simultaneously.
- a user has not to decide beforehand for a suspected diagnosis and the appropriate diagnostic laboratory medical parameters which have to be evaluated.
- a multiple of markers is calculated.
- the values of 2 to 500 markers are calculated, more preferably the values of 3 to 200 markers are calculated, most preferably the values of 4 to 100 markers are calculated. This includes that the value of 4, 6, 8, 10, 20, 30, 40, 50, 60, 70, 80 or 90 markers is calculated.
- a separate optimal predictive model or a machine learning algorithm has to be provided for each marker, which shall be calculated.
- m pred values are calculated, preferably between 20 and 500 m pred values are calculated, most preferably between 50 and 250 m pred values are calculated.
- one calculated value m pred is used to predict one certain marker.
- the marker which are calculated are selected from a group comprising: Bilirubin Bilirubin indirect Bilirubin direct Cholesterol LDL-Cholesterol HDL- Cholesterol Unesterified Cholesterol Total protein Albumin Prealbumin MELD Score MELDNa Score L-lactate dehydrogenase (LDH) Quick-value INR Cholinesterase (CHE) Aspartate transaminase (ASAT) Alanine transaminase (ALAT) Gamma-glutamyltransferase (gGT) Alkaline phosphatase (AP) HBA1c Glucose Alpha fetoprotein (AFP) GFR Creatinine Cystatin C Urea Ferritin Transferrin Iron Sodium Calcium Phosphate Citrate Uric acid C-reactive protein (CRP) Procalcitonin (PCT) Interleukin 6 (IL-6) Partial thromboplastin time (PTT) Fibrinogen Thyrotropin (TSH)
- the marker which are calculated are selected from a group comprising: Bilirubin Bilirubin indirect Bilirubin direct Cholesterol LDL-Cholesterol HDL- Cholesterol Unesterified Cholesterol Total protein Albumin Prealbumin MELD Score MELDNa Score L-lactate dehydrogenase (LDH) Quick-value INR Cholinesterase (CHE) Aspartate transaminase (ASAT) Alanine transaminase (ALAT) Gamma-glutamyltransferase (gGT) Alkaline phosphatase (AP) HBA1c Glucose Alpha fetoprotein (AFP) GFR Creatinine Cystatin C Urea Ferritin Transferrin Iron Sodium Calcium Phosphate Citrate Uric acid C-reactive protein (CRP) Procalcitonin (PCT) Interleukin 6 (IL-6) Partial thromboplastin time (PTT) Fibrinogen Thyrotropin (TS), a group comprising:
- the marker which are calculated are selected from a group comprising: Bilirubin Bilirubin indirect Bilirubin direct Cholesterol LDL-Cholesterol HDL- Cholesterol Unesterified Cholesterol Total protein Albumin Prealbumin MELD Score MELDNa Score L-lactate dehydrogenase (LDH) Quick-value INR Cholinesterase (CHE) Aspartate transaminase (ASAT) Alanine transaminase (ALAT) Gamma-glutamyltransferase (gGT) Alkaline phosphatase (AP) HBA1c Glucose Alpha fetoprotein (AFP) GFR Creatinine Cystatin C Urea Ferritin Transferrin Iron Sodium Calcium Citrate Clinical and sample features as markers Risk of Mortality in critical ill patients hepatic encephalopathy Identification of blood samples with improper storage Hepatocellular carcinoma (HCC) Hemodialysis (of the patient within the last 7 days) Gender prediction of blood samples with improper storage Hepato
- the method comprises the step of permanently further optimizing the predictive model. Since during performing the method according to the invention spectra are measured for new medical samples as well as routine laboratory diagnostic is performed for these medical samples according to one embodiment of the invention, additional data is available to improve the predictive model. In one embodiment of the invention the continuous improvement of the prediction model will be performed by repeating the same procedure as described for deriving the predictive model, using the growing database (meaning the larger number of medical samples available). In another implementation learning algorithms will be trained to improve the given predictions. Updating of the predictive model can be performed both locally (no transfer of patient related data) or anonymized and encrypted on a server.
- the frequencies selected for the predictive model do not necessarily belong directly to a certain molecule and e.g. its concentration but can also be an indirect indicator of a complex situation reflected not only by a single molecule concentration, it is possible to calculate values m pred which are predictions of concentrations of molecules in the medical sample with a concentration below the detection limit of the spectroscopic methods used to measure the at least one spectrum. For instance, if troponin T is elevated in blood in case of myocardial infarction, it has been released from damaged heart muscle cells. Analogous to troponin other molecules have also been released by these cells und are now elevated in the blood sample.
- Some of these molecules are already used as additional biomarkers for myocardial infarction as myoglobin, troponin I and heart muscle specific creatine kinase. However, there are many more molecules released by the damaged cells as Heart-type Fatty Acid-Binding Protein, orthophosphate d-glucosyltransferase, S100A0 and others. These and further biomarkers as ischemia-modified albumin or Copeptin also show a correlation with troponin as they belong to corresponding metabolic networks and are all elevated when heart muscle cells are damaged [ Aydin, S Vase Health Risk Manag. (2019 )].
- the correlation between biomarkers allow to estimate the concentration of the desired biomarker, in this case troponin, although this cannot be measured directly with sufficient accuracy by conventional Raman spectrometry or another described methods.
- This feature broadens the application of the method and provides useful additional information for a user. Further, this is a feature which is not provided by routine laboratory diagnostics.
- At least one marker in the medical sample can be predicted due to relationships in metabolic networks, even if it is not detectable in the sample with routine laboratory methods.
- the predictive model is permanently further optimized it is possible to obtain more m pred values or maybe m pred values having a better quality, meaning higher precision and therefore are a more precisely prediction of a certain marker.
- the medical sample is passed to the at least one spectrometer on a foil tape.
- the medical sample is applied on a foil tape and the foil tape is passed to the at least one spectrometer.
- several medical samples are spaced from each other applied on a foil tape, thereby the same foil tape can be used to investigate several medical samples.
- a substance used as control and/or calibration substance is also applied on the foil tape.
- the control and calibration substance allows mechanical adjustment of the measuring equipment and verification of the measuring conditions such as the laser power, frequency, detector precision and detector sensitivity.
- the calibration substance allows additional preprocessing of the spectra of the medical samples, e.g. normalization and specific background correction. With this application the precision and validity of the prediction can be improved and spectrometer defects as well as measurement problems can be identified immediately. This minimizes the risk of incorrect diagnostic results.
- the invention provides a device adapted to perform the method steps
- the device is adapted to perform the method according to the invention.
- the at least one spectrometer is suited to measure the at least one spectrum of a medical sample.
- a Raman spectrometer and/or an IR spectrometer is used.
- the device comprises at least one data processing device which can be a PC or a tablet.
- the data processing device should be suited to perform the bioinformatic processing according to the invention.
- the device comprises at least one user interface.
- user interface can be a touchscreen of a PC or a tablet, also suitable is a touchscreen of a smartphone.
- the interface should be suitable to display the report created by the method of the present invention.
- the device further comprises a foil tape.
- the device comprises a foil tape and optionally a CCD-camera.
- the foil tape is used to transport at least one medical sample to at least one spectrometer.
- the foil tape transports more than one medical sample to more than one spectrometer.
- the foil tape can further comprise at least one substance for calibration and/or control purposes.
- a CCD camera investigates the medical samples and/or the substance for calibration and/or control purposes by performing an air bubble check and/or a drop evaluation. This is necessary because, despite highly standardized application of the medical samples, artifacts such as air bubbles cannot be reliably excluded and further information as the color of the sample can be detected.
- the device further comprises a CCD-camera for investigation of the liquid medical samples for calibration and/or control purposes by performing an air bubble check and/or a drop evaluation.
- the foil tape is wound on a roll, from which it is unwound and guided over several rolls. In this manner a medical sample and/or a substance for calibration and/or control purposes can be transported to several spectrometers and/or CCD-cameras.
- the foil tape preferably comprises a material which does not interact with any kind of medical sample.
- the foil tape comprises Polyethylene (PE).
- the method according to the invention or the device according to the invention can be used for validity and quality check of conventional targeted routine laboratory medical diagnostic, for performing untargeted diagnostics, to obtain a rapid diagnosis of suspicion and/or to for monitoring of laboratory values and/or clinical features of a patient at home, in a doctor's practice or in the clinic.
- Rapid diagnosis of suspicions could be useful for general practitioners to have a hint which further diagnostic steps should be initiated.
- some spectroscopic methods can already be performed from untrained persons it is possible that the method and the device according to the invention are performed by patients at home. In this case patients are enabled to monitor laboratory values and/or clinical features regularly. Results can be on the one hand reported to the general practitioners and on the other hand a warning can be given to the patient to consult a doctor if a certain marker is predicted which is above a certain threshold.
- liver related markers Table 3 Liver related biomarkers Albumin (ALB S) Serum albumin as a liver synthesis parameter International normalized ratio of prothrombin time (INRVOR C) Clotting test (Prothrombin time as INR) dependent of coagulation factors synthesized by the liver. This parameter is measured in another material (citrate plasma) and not measurable in the analyzed material by routine diagnostics. Cholinesterase (CHE_S) A liver synthesis parameter. Due to its very low concentrations in serum, the enzyme activity in routine diagnostics depends on the detection of substrate turnover while this invention allows direct approximation of the activity.
- Bilirubin Liver function and detoxification parameter in serum alanine amino- transferase (ALAT_S) Results of enzymatic tests indicating liver damage. Due to their very low concentrations in serum, the enzyme activity in routine diagnostics depends on the detection of substrate turnover while this invention allows direct approximation of the activity. Aspartate aminotransferase (ASAT_S) ⁇ -Glutamyltranspeptidase (GGT S) Total cholesterol (CHOL_S) Total serum cholesterol. Reduced serum concentrations are often detected in patients with end-stage liver disease Alpha fetoprotein (AFP_S) Tumor marker for the detection of hepatocellular cancer.
- ASAT_S Aspartate aminotransferase
- GTT S ⁇ -Glutamyltranspeptidase
- T S Total cholesterol
- AFP_S Alpha fetoprotein Tumor marker for the detection of hepatocellular cancer.
- Alpha fetoprotein concentration in serum is usually very low and routine laboratory diagnostics has to be based on highly sensitive immunological detection.
- CRP_S c-reactive protein An indicator of infections and or inflammation in the patients. Very low serum concentrations.
- MELD ber MELD score without sodium
- Pre-analytical Quality Indicators Hemolysis index (INDH_S) Laboratory medical indicator of hemolysis Icterus-Index (INDI S) Laboratory medical indicator of icterus Lipemia Index INDL_S Laboratory medical indicator of lipemia
- the samples were divided into three subgroups: the train data, test data and validation data set.
- the training data set is driving the optimization primarily as described above.
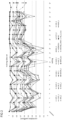
- Figure 1 illustrates the correlation coefficient of several markers for different predictive models using the training data set. Different predictive models are labelled as setting numbers on the x axis.
- the test data set is used as verification during the optimization and is therefore integral part of the optimization as well.
- the correlations of test and training data set indicate the information content which can be expected from a dataset. Raman measurements were performed in serum samples.
- AFP_S alpha fetoprotein
- ALAT_S alanine transaminase
- ALB_S albumin
- ASAT_S aspartate transaminase
- BILI_S bilirubin
- B-PLT_E platelets (measured in whole blood by flow cytometry to generate the predictive model)
- CHE_S cholinesterase
- CHOL_S total cholesterol
- CRE_S creatinine
- CRP_S c-reactive protein
- GGT_S gamma-glutamyltransferase
- HAEMODIA Hemodialysis of the patient within the last 7 days
- HCC Hepatocellular carcinoma
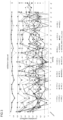
- both figures show correlation coefficients obtained for the training data set and the test data set using different predictive models.
- the figures plot the correlation coefficients with reference data (represented by laboratory diagnostics, medical scores, clinical features) as y-axis and the different predictive models used as x-axis.
- reference data represented by laboratory diagnostics, medical scores, clinical features
- values for different predictive models of the same marker are connected for convenience, it has to be noted that there is no continuity in a mathematical sense between different points on the x-axis.
- figure 3 illustrates the correlation coefficient of several markers for different predictive models using the validation data set.
- the method of the present invention has an inherent tendency to find best solutions and overfitting which could occur is counterbalanced by an averaging of weights determined in different iterations.
- markers show significant peaks. And that different markers have these peaks for different predictive models. On the one hand this shows that different predictive models provide different correlation coefficients, as expected. Thus, for many markers the optimal predictive model which reveals the full predictive potential will only be obtained by certain preprocessing steps according to the invention. On the other hand, it is clear that optimization of the predictive model has to be performed for each marker individually.
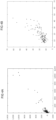
- Figure 4 (A) illustrates the correlation between the reference values of BILI_S (total bilirubin concentration) and the values calculated by the method according to the invention for this marker.
- the y-axis shows the reference values and the x-axis the values calculated by the method according to the invention. Best correlation is given if the data-points are approximating a diagonal line, worst correlation and thus a bad quality of the method of the invention would result in a broadly distributed scatter plot.
- figure 4 (B) illustrates the correlation between the reference values of the MELD score and the values calculated by the method according to the invention for this marker.
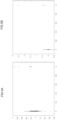
- FIG. 5 (A) illustrates the correlation between the reference values of HAEMODIA and the values calculated by the method according to the invention for this marker.
- HAEMODIA is the Hemodialysis which corresponds to a status of a patient. Reference values cannot be obtained with standard routine laboratory diagnostics, but has to be entered by the attending physicians and is checked against the dialysis protocols of the patient. Since HAEMODIA has no numerical representation per se, the information of this marker is translated into numerical values. 0 is equivalent to the status: no HAEMODIA, and 1 is equivalent to the status: yes HAEMODIA. As can be seen a threshold of the value on the y-axis of the marker becomes evident at which the status of the HAEMODIA switches from 0 to 1.
- FIG. 5 (B) illustrates the correlation between the reference values of HCC and the values calculated by the method according to the invention for this marker.
- HCC indicates whether the patient is suffering from hepatocellular carcinoma. This is not directly detectable with standard routine laboratory diagnostics, but usually has to be diagnosed on the basis of different imaging and sometimes tumor biopsy. Like HAEMIDIA HCC has no numerical representation per se, therefore the information of this marker is translated into numerical values. 0 is equivalent to the status: no HCC, and 1 is equivalent to the status: yes HCC.
- a threshold at which the status changes can be clearly seen in figure 5 (B) and is between 0.4 and 0.5.
- Figure 6 illustrates the application of the present invention parallel to standard routine diagnostics.
- a laboratory sample is provided 200 and a batch of 50 ⁇ l of the medical sample is provided to be investigated by the method according to the invention 400 while the rest of the sample is provided to be investigated by standard routine diagnostics 300.
- an order entry 301 is required which requests a number of certain laboratory values. Based on the order entry 301 the sample is investigated by corresponding routine standard diagnostic methods 500.
- the batch of 50 ⁇ l provided to be investigated by the method according to the invention 400 is investigated independent of any order entry since the sample is investigated by untargeted spectroscopic methods according to the invention.
- standard routine diagnostic steps and the investigations of the sample according to the invention can be processed in parallel.
- routine analyzers 500 such as clinical chemistry, haematology analyzer, coagulation analyzer, urine analyzer, immunology analyzer and so on.
- a routine laboratory report 600 is provided by standard routine diagnostics. If there are significant discrepancies between targeted and non-targeted diagnostics 401, the results of routine diagnostics should be critically reviewed to rule out incorrect diagnostics. There may be problems with the measuring instruments or the sample material. Re-measurement of controls can help to identify corresponding problems of routine instruments. Problems with the sample material can be due to pre-analytical influencing and interfering factors. For example, blood coagulation may have led to insufficient sample aspiration or the patient may have taken medication that may interfere with routine methods. Consequently, diagnostic errors with possible medical consequences can be avoided.
- the standard laboratory report can furthermore provide a further data base to improve the predictive models according to the invention by a feedback loop 601. If the routine laboratory report or the markers calculated by the invention give a hint that a potential live threatening condition is probable an immediate alert is given to a user like a technician or a medical doctor. Furthermore, the results of the routine laboratory report and the markers calculated by the method of the invention are combined in an extended laboratory report 700. This provides several advantages, first the markers calculated by the method of the present invention can give a hint that other laboratory values except of those which were already requested by the initial order entry should be investigated by standard routine diagnostics. Further the quality of the laboratory values measured by standard routine diagnostics can be evaluated by comparing calculated markers and laboratory values measured by standard routine diagnostics.
- the report is given to a user 800 like a technician or a medical doctor which is able to initiates further investigations by standard laboratory diagnostics based on the markers calculated by the present invention and on the laboratory values measured. Accordingly, the extended laboratory report 700 includes for example recommendations for further diagnostic proceedings and identification of invalid results.
- Figure 7 (A) illustrates an embodiment of the invention, wherein a medical sample 20 is applied to a foil tape 10.
- the foil tape 10 can be wound on a roll 11, from which it is unwound and guided over several rolls 15.
- the foil tape preferably comprises a material which does not interact with any kind of medical sample.
- the foil tape comprises Polyethylene (PE).
- the sample is applied to the foil tape 10 in step 20 and afterwards in a first investigation step 30 the sample can be investigated by a CCD-camera to perform an air bubble check and drop evaluation.
- a next investigation step 40 multiple measurements with spectroscopic methods like NIR-, VIS- and/or UV-spectroscopy can be performed.
- multiple Raman spectroscopy measurements can be performed.
- step 60 and step 70 spectroscopic measurements analogous to steps 40 and 50 can be performed. This has the advantage, that spectroscopic measurements from different time points can be provided. The chance of the results of the spectroscopic methods due to bleaching and other physical processes adds additional information to the calculated markers.
- steps 60 and 70 different spectroscopic methods compared to steps 40 and 50 are applied to the medical sample. Combination of different spectroscopic methods will also add new information to the calculated markers as already explained.
- the medical sample is again investigated by a CCD-camera to perform a final drop evaluation, which can be used as process control parameter.
- the foil tape is finally given to a waste container 12.
- a medical sample 110 is applied to the foil tape 10 but also a calibration or control substance 100.
- the medical sample 110 and the calibration or control substance 100 can be applied alternately as shown in figure 7 (B) or the calibration or control substance 100 can be applied after a certain number of medical samples have been applied, e.g. after 2 to 10 medical samples have been applied to the foil tape 10.
- the calibration or control substance 100 can serve for example to calibrate the x-y-position on the surface of the foil tape to make sure that the medical samples 110 are positioned in the right manner to apply spectroscopic methods.
- Figure 8 illustrates a flow chart of the method of the present invention.
- a liquid medical sample is passed to a Raman spectrometer and/or to an IR spectrometer.
- At least one Raman spectrum and/or at least one IR spectrum is measured and according to the invention at least one value m pred is calculated which is a calculation of a certain marker. The calculation is either done by using an optimal predictive model for the certain marker or by using a machine learning algorithm.
- the at least one value m pred is compared to a reference range of the at least one marker, wherein the LLN and the ULN of the reference range define thresholds for the marker, which are positive indicators for a certain disease. Accordingly, if m pred is outside the reference range and thus greater or smaller than ULN or the LLN this is a positive indicator for a certain disease. If there is a positive indicator for a certain disease, the following medical consequences follow:
- the method of the present invention effects immediately the treatment of a patient.
- Figure 9 illustrates a table for calculations of the concentration of the marker albumin for different solutions using the method of the invention.
- Figures 9 to 11 are published in (Staritzbichler et al. 2021).
- an optimal predictive model for the marker albumin was used to calculate the concentrations of different dilutions of an albumin infusion solution.
- the predictive model was generated and optimized beforehand with Raman spectra obtained from 234 serum samples. The results are shown in Figure 9 .
- the first column shows the substance used, wherein Ringer and de-ionized water can be considered to contain 0% albumin.
- the second column lists the value calculated from the spectra using the optimal predictive model.
- the third column lists the normalized value, which should reflect the albumin concentration.
- Figure 10 illustrates laboratory values vs. values calculated by the inventive method of the marker bilirubin.
- the sera of 11 patients were analyzed regarding the marker bilirubin.
- An optimal predictive model was used for calculating the value of the marker bilirubin. It should be noted that the sera of the 11 patients were not included in generation and optimization of the optimal predictive model.
- Raman spectra were measured for all 11 samples.
- Figure 10 shows laboratory values obtained by routine standard methods against the values of bilirubin calculated by the method of the invention. A reasonable correlation was observed for most of the markers. However, one value of the marker can be considered an outlier of all calculated markers. Interestingly this spectrum was identified as a problem case from the beginning.
- the serum sample contained a visible residuum, probably from a blood clot.
- Figure 11 illustrates the validation of the method of the invention using Raman spectra of sera of 328 specimen taken from an evaluation study for liver transplantation in which retention samples were collected for quality assurance.
- 25 Markers were calculated using an optimal predictive model for each marker.
- the optimal predictive models for each marker were derived beforehand by using 234 serum samples from a cohort of patients with different stages of liver disease.
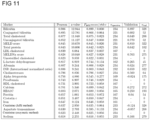
- the table in figure 11 lists in the 'Validation' column the correlations between calculated markers and laboratory values, together with the number of specimen for which laboratory values were available.
- Several markers reached correlations comparable to the ones reported from the generation and optimization of the optimal predictive model used in each case in the 'Pearson' column. This clearly proves the diagnostic value of the method of the invention. However, for other markers, the prediction did not reach similar quality.
- the separation of well validated markers those that could not be validated may in turn aid analyzing the z-values that were reported in the table for the generation and optimization of the optimal predictive model.
- the z-values represent a statistical significance estimation for the correlations that should be reflected by the validation in the sense that high z-values should be associated with high correlations in both generation and optimization of the optimal predictive model and validation of the optimal predictive model.
- the markers HBA1C calcium, L-lactate dehydrogenase, alpha fetoprotein, HDL cholesterol and creatinine the drop in validation correlations is nicely reflected by low z-scores.
- the table of figure 11 shows the results of a performance analyses for highly correlating markers.
- the data is background filtered, with a minimum correlation of 0.6.
- the significance of the correlation is reported as z-value.
- the consistency is estimated by the mean value and the standard deviation of the Pearson score for an ensemble of random subsets of 40% size.
- the correlation of the values calculated from 238 spectra from an independent cohort with laboratory data is listed, followed by the number of spectra in the validation set.
Landscapes
- Health & Medical Sciences (AREA)
- Engineering & Computer Science (AREA)
- Biomedical Technology (AREA)
- Medical Informatics (AREA)
- Public Health (AREA)
- Data Mining & Analysis (AREA)
- Databases & Information Systems (AREA)
- Pathology (AREA)
- Epidemiology (AREA)
- General Health & Medical Sciences (AREA)
- Primary Health Care (AREA)
- Investigating, Analyzing Materials By Fluorescence Or Luminescence (AREA)
Claims (13)
- Verfahren zur Durchführung einer Qualitätsprüfung einer labormedizinischen Routinediagnostik basierend auf Laborwerten einer flüssigen medizinischen Probe eines Subjekts, wobei der Wert von mindestens einem Marker mit den folgenden Schritten berechnet wird:• Geben eines Teils der flüssigen medizinischen Probe des Subjekts in mindestens ein Raman-Spektrometer und/oder IR-Spektrometer;• Messen von mindestens einem Raman-Spektrum und/oder einem IR-Spektrum der flüssigen medizinischen Probe;• Bereitstellen von mindestens einem optimalen Vorhersagemodell Fopt(
s ) zum Berechnen des mindestens einen Wertes mpred, was eine Berechnung des mindestens einen Markers ist, wobei das mindestens eine optimale Vorhersagemodell Fopt(s ) definiert ist als Fopt(s ) = mpred =s ·w ; wobeis ein Vektor mit n Frequenzen des mindestens einen Raman-Spektrums und/oder des mindestens einen IR-Spektrums undw ein Gewichtungsvektor mit einem Gewichtungsfaktor für jede der n Frequenzen des mindestens einen Raman-Spektrums und/oder des mindestens einen IR-Spektrums ist, oder Bereitstellen eines Algorithmus des maschinellen Lernens;• Berechnen von mindestens einem Wert mpred aus dem mindestens einen Raman-Spektrum und/oder dem mindestens einen IR-Spektrum in der flüssigen medizinischen Probe mithilfe des mindestens einen optimalen Vorhersagemodells Fopt(s ), wobei die Berechnung die Schritte umfassta. Auswählen der n Frequenzen mit n ∈ N aus dem mindestens einen Raman-Spektrum und/oder dem mindestens einen IR-Spektrum;b. Darstellen der n ausgewählten Frequenzen in einem Vektors ;c. Berechnen eines Wertes mpred mit dem bereitgestellten optimalen Vorhersagemodell Fopt(oder Berechnen von mindestens einem Wert mpred aus dem mindestens einen Raman-Spektrum und/oder dem mindestens einen IR-Spektrum in der flüssigen medizinischen Probe mithilfe des Algorithmus des maschinellen Lernens;s );• Messen des Wertes des mindestens einen Markers durch Untersuchen eines weiteren Teils der flüssigen medizinischen Probe durch labormedizinische Routinediagnostik und/oder Definieren eines Bezugsbereiches und einer Schwelle für den mindestens einen Marker;• Vergleichen des mindestens einen berechneten Wertes mpred mit dem Wert des mindestens einen durch labormedizinische Routinediagnostik erhaltenen Wertes und/oder Vergleichen des mindestens einen berechneten Wertes mpred mit der Schwelle;wobei eine Differenz zwischen dem mindestens einen berechneten Wert mpred und dem Wert des mindestens einen durch labormedizinische Routinediagnostik erhaltenen Markers ein Indikator für ungültige Ergebnisse ist, die mit labormedizinischer Routinediagnostik gemessen wurden, was dazu führt, dass eine Empfehlung an einen Benutzer ausgegeben wird, die durch labormedizinische Routinediagnostik erhaltenen Ergebnisse zu prüfen oder die durch labormedizinische Routinediagnostik erhaltenen Werte erneut zu messen und/oder wobei das Übersteigen der Schwelle ein Indikator für mindestens eine Krankheit ist, was in der Empfehlung für weitere Maßnahmen resultiert, die aus erneutem Messen von durch herkömmliche Labordiagnostik gemessenen Werten, ausführliche medizinische Validierung eines medizinischen Berichtes, Sperren oder Zurücknehmen des Ergebnisses und des Berichtes, Vorschlagen weiterer Diagnoseschritte, um die bereits erhaltenen Werte zu ergänzen, Anfordern einer neuen Probe des Patienten und Beraten eines Patienten und/oder Probensenders ausgewählt werden;und wobei das optimale Vorhersagemodell Fopt(S) zum Berechnen eines Wertes mpred oder eines Vektors mpred berechnet und optimiert wird mittels eines Verfahrens, das die Schritte umfasst:i. Geben von mindestens 100 flüssigen medizinischen Proben in ein Raman-Spektrometer und/oder ein IR-Spektrometer;ii. Messen von mindestens einem Raman-Spektrum und/oder einem IR-Spektrum von jeder der mindestens 100 flüssigen medizinischen Proben;iii. Vorverarbeitung aller Raman-Spektren und/oder aller IR-Spektren;iv. Auslesen eines Wertes mref, der mittels Routinelaborverfahren bestimmt wurde, der einen Bezugswert für mpred für jede der mindestens 100 flüssigen medizinischen Proben darstellt;v. Aufteilen aller vorverarbeiteten Raman-Spektren und/oder IR-Spektren in einen Trainingsdatensatz, einen Testdatensatz und einen Validierungsdatensatz;vi. Darstellen der Werte mref, die zu dem Trainingsdatensatz gehören, durch einen Vektor

 vii. Berechnen eines ersten Vorhersagemodells F 1(S), um einen Vektor
 a. Auswählen von n Frequenzen mit n ∈ N und Darstellen der n Frequenzen der Spektren, die dem Trainingsdatensatz zugewiesen sind, in einer Spektralmatrix S;b. Berechnen optimaler Gewichtungswerte für jede ausgewählte Frequenz und Darstellen der Gewichtungswerte in einem Gewichtungsvektor
w und dadurch Berechnen des ersten Vorhersagemodells F 1(S) = S ·w ;c. Berechnen des Vektors viii. Berechnen eines Qualitätsfaktors

 ix. Verwenden des ersten Vorhersagemodells F 1(S), um einen Vektor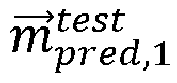


 x. Berechnen eines weiteren Vorhersagemodells F 2(S), um einen Vektor
 a. Auswählen von n Frequenzen mit n ∈ N und Darstellen der n Frequenzen der Spektren, die dem Trainingsdatensatz zugewiesen sind, in einer Spektralmatrix S;b. Berechnen optimaler Gewichtungswerte für jede ausgewählte Frequenz und Darstellen der Gewichtungswerte in einem Gewichtungsvektor
w und dadurch Berechnen des weiteren Vorhersagemodells F 2(S) = S ·w ;c. Berechnen des Vektorsmithilfe der Spektren des Trainingsdatensatzes, wobei die in Schritt a. ausgewählten n Frequenzen schrittweise verändert werden, verglichen mit den in einem der vorherigen Schritte ausgewählten Frequenzen; xi. Berechnen eines Qualitätsfaktors

 xii. Verwenden des weiteren Vorhersagemodells F 2(S), um einen Vektor


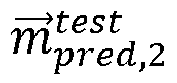 xiii. Vergleichen der Qualitätsfaktoren und nur wenn


 xiv. Wiederholen der Schritte x. bis xii. und Vergleichen der Qualitätsfaktoren des optimalen Vorhersagemodells Fopt(S) und des weiteren Vorhersagemodells F 2(S) und nur wenn


 xv. Wiederholen des Schrittes xiv. für alle möglichen Kombinationen von n Frequenzen;xvi. Verwenden des optimalen Vorhersagemodells Fopt(S), um einen Vektor
 xvii. Validieren des optimalen Vorhersagemodells Fopt(S) durch Berechnen eines Korrelationskoeffizienten und eines Z-Wertes unter Verwendung des Vektors
 wobei die Werte des Vektors


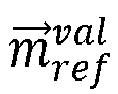
- Verfahren nach einem der vorhergehenden Ansprüche, dadurch gekennzeichnet, dass der Korrelationskoeffizient jedes optimierten Vorhersagemodells Fopt(
s ) gleich oder höher ist als 0,7 und der Z-Wert jedes optimalen Vorhersagemodells höher ist als 2. - Verfahren nach einem der vorhergehenden Ansprüche, dadurch gekennzeichnet, dass der Wert von mehr als einem Marker berechnet wird, vorzugsweise die Werte von 2 bis 500 Markern berechnet werden, noch bevorzugter die Werte von 3 bis 200 Markern berechnet werden, am bevorzugtesten die Werte von 4 bis 100 Markern berechnet werden.
- Verfahren nach einem der vorhergehenden Ansprüche, dadurch gekennzeichnet, dass der Algorithmus des maschinellen Lernens aus der Gruppe bestehend aus faltenden neuronalen Netzen, grafischen neuronalen Netzen, rekurrenten neuronalen Netzen, Stützvektormaschinen und Zufallswäldern ausgewählt wird.
- Verfahren nach einem der vorhergehenden Ansprüche, dadurch gekennzeichnet, dass ein Bericht, der mindestens einen berechneten Wert mpred umfasst, erzeugt wird.
- Verfahren nach einem der vorhergehenden Ansprüche, dadurch gekennzeichnet, dass die flüssige medizinische Probe aus der Gruppe bestehend aus Blut, Blutplasma, Blutserum, Zerebrospinalflüssigkeit (CSF), Urin und Speichel ausgewählt wird.
- Verfahren nach einem der vorhergehenden Ansprüche, dadurch gekennzeichnet, dass das Verfahren ferner den Schritt des weiteren Optimierens des Vorhersagemodells umfasst.
- Verfahren nach einem der vorhergehenden Ansprüche, dadurch gekennzeichnet, dass mindestens ein Marker mit einer Konzentration in der flüssigen medizinischen Probe unterhalb der spektralen Nachweisgrenze der Raman-Spektroskopie und/oder IR-Spektroskopie berechnet wird.
- Verfahren nach einem der vorhergehenden Ansprüche, dadurch gekennzeichnet, dass mindestens ein Marker in der flüssigen medizinischen Probe aufgrund der Verhältnisse in metabolischen Netzwerken berechnet werden kann, selbst wenn er in der Probe mit Routinelaborverfahren nicht nachweisbar ist.
- Verfahren nach einem der vorhergehenden Ansprüche, dadurch gekennzeichnet, dass die flüssige medizinische Probe auf einem Folienband in das Raman-Spektrometer und/oder den IR-Spektrometer gegeben wird.
- Vorrichtung, die dazu angepasst ist, die Verfahrensschritte durchzuführen• Geben einer flüssigen medizinischen Probe in das Raman-Spektrometer und/oder das IR-Spektrometer;• Messen von mindestens einem Raman-Spektrum der flüssigen medizinischen Probe;• Berechnen von mindestens einem Wert mpred mit einem Raman-Spektrum und/oder dem mindestens einen IR-Spektrum der flüssigen medizinischen Probe mithilfe eines optimalen Vorhersagemodells oder Lernalgorithmus;• Vergleichen des mindestens einen berechneten Wertes mpred mit einem Wertebereich einer normalen Kontrolle für den mindestens einen Marker;wobei ein positiver Indikator für die mindestens eine Krankheit existiert, wenn der mindestens eine berechnete Wert mpred außerhalb des Bezugsbereiches für den mindestens einen Marker liegt;umfassend∘ mindestens ein Spektrometer;∘ mindestens eine Datenverarbeitungsvorrichtung;∘ mindestens eine Benutzeroberfläche.
- Vorrichtung nach Anspruch 11, dadurch gekennzeichnet, dass die Vorrichtung ferner ein Folienband umfasst.
- Vorrichtung nach Anspruch 11 oder 12, dadurch gekennzeichnet, dass die Vorrichtung ferner eine CCD-Kamera zur Untersuchung der flüssigen medizinischen Proben für Kalibrierungs- und/oder Kontrollzwecke durch Durchführen einer Luftblasenprüfung und/oder einer Tropfenevaluierung umfasst.
Applications Claiming Priority (1)
| Application Number | Priority Date | Filing Date | Title |
|---|---|---|---|
| EP20197251.0A EP3971909A1 (de) | 2020-09-21 | 2020-09-21 | Verfahren zur vorhersage markern, die für mindestens eine medizinische probe und/oder für einen patienten charakteristisch sind |
Publications (2)
| Publication Number | Publication Date |
|---|---|
| EP3971910A1 EP3971910A1 (de) | 2022-03-23 |
| EP3971910B1 true EP3971910B1 (de) | 2024-11-13 |
Family
ID=72613815
Family Applications (2)
| Application Number | Title | Priority Date | Filing Date |
|---|---|---|---|
| EP20197251.0A Withdrawn EP3971909A1 (de) | 2020-09-21 | 2020-09-21 | Verfahren zur vorhersage markern, die für mindestens eine medizinische probe und/oder für einen patienten charakteristisch sind |
| EP21197992.7A Active EP3971910B1 (de) | 2020-09-21 | 2021-09-21 | Verfahren zur vorhersage von markern, die für mindestens eine medizinische probe und/oder für einen patienten charakteristisch sind |
Family Applications Before (1)
| Application Number | Title | Priority Date | Filing Date |
|---|---|---|---|
| EP20197251.0A Withdrawn EP3971909A1 (de) | 2020-09-21 | 2020-09-21 | Verfahren zur vorhersage markern, die für mindestens eine medizinische probe und/oder für einen patienten charakteristisch sind |
Country Status (1)
| Country | Link |
|---|---|
| EP (2) | EP3971909A1 (de) |
Families Citing this family (4)
| Publication number | Priority date | Publication date | Assignee | Title |
|---|---|---|---|---|
| WO2024054890A1 (en) * | 2022-09-07 | 2024-03-14 | Siemens Healthcare Diagnostics Inc. | Systems and methods for determining test result accuracies in diagnostic laborabory systems |
| CN116047074B (zh) * | 2022-11-08 | 2024-08-30 | 兰州大学第一医院 | 一种用于诊断和/或预测肺癌的标志物、诊断模型及其构建方法 |
| CN117373585B (zh) * | 2023-10-31 | 2024-07-02 | 华脉汇百通信息技术(北京)有限公司 | 一种基于人工智能的血液透析模型的构建方法 |
| WO2025183579A1 (en) * | 2024-02-29 | 2025-09-04 | Ramalhete Lus Manuel Pires | Prognostic method for determining a probability of allograft rejection |
Family Cites Families (8)
| Publication number | Priority date | Publication date | Assignee | Title |
|---|---|---|---|---|
| US20080046224A1 (en) * | 2006-03-29 | 2008-02-21 | Cangen Biotechnologies, Inc. | Apparatus and method for predicting disease |
| EP2494364A1 (de) * | 2009-10-29 | 2012-09-05 | Tethys Bioscience, Inc. | Protein- und lipidbiomarker mit konsistenter verbesserung der prognose von typ-2-diabetes |
| AU2010328019A1 (en) * | 2009-12-09 | 2012-06-28 | Aviir, Inc. | Biomarker assay for diagnosis and classification of cardiovascular disease |
| US10006922B2 (en) * | 2011-12-22 | 2018-06-26 | Massachusetts Institute Of Technology | Raman spectroscopy for detection of glycated analytes |
| CN103364389A (zh) * | 2012-04-05 | 2013-10-23 | 上海市食品药品检验所 | 快速检测和判断白蛋白制品分析方法 |
| GB201512869D0 (en) * | 2015-07-21 | 2015-09-02 | Almac Diagnostics Ltd | Gene signature for minute therapies |
| MA44511A (fr) * | 2016-03-31 | 2019-02-06 | Discerndx Inc | Génération et utilisation de bases de données de biomarqueurs |
| CN111370061A (zh) * | 2019-06-20 | 2020-07-03 | 深圳思勤医疗科技有限公司 | 基于蛋白标记物与人工智能的癌症筛查方法 |
-
2020
- 2020-09-21 EP EP20197251.0A patent/EP3971909A1/de not_active Withdrawn
-
2021
- 2021-09-21 EP EP21197992.7A patent/EP3971910B1/de active Active
Also Published As
| Publication number | Publication date |
|---|---|
| EP3971910A1 (de) | 2022-03-23 |
| EP3971909A1 (de) | 2022-03-23 |
Similar Documents
| Publication | Publication Date | Title |
|---|---|---|
| EP3971910B1 (de) | Verfahren zur vorhersage von markern, die für mindestens eine medizinische probe und/oder für einen patienten charakteristisch sind | |
| LaBaer | So, you want to look for biomarkers (introduction to the special biomarkers issue) | |
| Allardet-Servent et al. | Point-of-care versus central laboratory measurements of hemoglobin, hematocrit, glucose, bicarbonate and electrolytes: a prospective observational study in critically ill patients | |
| Rocktaeschel et al. | Unmeasured anions in critically ill patients: can they predict mortality? | |
| Xie et al. | Integration of artificial intelligence in clinical laboratory medicine: Advancements and challenges | |
| Killeen et al. | Recent trends in performance and current state of creatinine assays | |
| Duhalde et al. | Point-of-care hemolysis detection in blood gas specimens directly at the emergency department | |
| Almond et al. | Current parathyroid hormone immunoassays do not adequately meet the needs of patients with chronic kidney disease | |
| Korpi-Steiner et al. | Comparison of three whole blood creatinine methods for estimation of glomerular filtration rate before radiographic contrast administration | |
| KR20130105301A (ko) | 예상되는 분석물 상관성의 평가에 의한 현장 시험 결과의 타당성 판정 방법 | |
| Tan et al. | Optimized delta check rules for detecting misidentified specimens in children | |
| Marija et al. | Blood-gas vs. Central-Laboratory analyzers: interchangeability and reference intervals for sodium, potassium, glucose, lactate and hemoglobin | |
| Verbakel et al. | Clinical reliability of point-of-care tests to support community based acute ambulatory care | |
| Ercan | Comparison of test results obtained from lithium heparin gel tubes and serum gel tubes | |
| US20250166758A1 (en) | Method of Early Detection, Risk Stratification, and Outcomes Prediction of a Medical Disease or Condition with Machine Learning and Routinely Taken Patient Data | |
| Von Holle | Assessment of iron status | |
| Cochrane Infectious Diseases Group et al. | Accuracy of routine laboratory tests to predict mortality and deterioration to severe or critical COVID‐19 in people with SARS‐CoV‐2 | |
| Li et al. | Integrating clinical and biochemical markers: a novel nomogram for predicting lacunes in cerebral small vessel disease | |
| Sánchez et al. | Analytical evaluation of ABL90 Flex Plus blood gas analyzer for urea and creatinine: multicenter method comparison | |
| EP4539053A1 (de) | Extraktion von labor-, klinischen oder diagnostischen informationen aus einem klinischen test | |
| Kim Skala | Best practices in preanalytical sample quality: managing and preventing in vitro hemolysis in the emergency department | |
| Bahar et al. | Investigation of falsely decreased creatinine results observed from the abbott i-Stat point-of-care device in use for testing specimens from ambulatory oncology patients | |
| Haklar | Plenary Lecture Abstracts | |
| Guo et al. | Construction and Validation of a Clinical Prediction Model for Sepsis Based on Peripheral Perfusion Index: In-Hospital and 28-Day Mortality Risk Prediction | |
| Butler et al. | A-321 Rethinking the Role of Race in Prenatal AFP Screening for Open Neural Tube Defects |
Legal Events
| Date | Code | Title | Description |
|---|---|---|---|
| PUAI | Public reference made under article 153(3) epc to a published international application that has entered the european phase |
Free format text: ORIGINAL CODE: 0009012 |
|
| STAA | Information on the status of an ep patent application or granted ep patent |
Free format text: STATUS: THE APPLICATION HAS BEEN PUBLISHED |
|
| AK | Designated contracting states |
Kind code of ref document: A1 Designated state(s): AL AT BE BG CH CY CZ DE DK EE ES FI FR GB GR HR HU IE IS IT LI LT LU LV MC MK MT NL NO PL PT RO RS SE SI SK SM TR |
|
| STAA | Information on the status of an ep patent application or granted ep patent |
Free format text: STATUS: REQUEST FOR EXAMINATION WAS MADE |
|
| 17P | Request for examination filed |
Effective date: 20220923 |
|
| RBV | Designated contracting states (corrected) |
Designated state(s): AL AT BE BG CH CY CZ DE DK EE ES FI FR GB GR HR HU IE IS IT LI LT LU LV MC MK MT NL NO PL PT RO RS SE SI SK SM TR |
|
| P01 | Opt-out of the competence of the unified patent court (upc) registered |
Effective date: 20230517 |
|
| GRAP | Despatch of communication of intention to grant a patent |
Free format text: ORIGINAL CODE: EPIDOSNIGR1 |
|
| STAA | Information on the status of an ep patent application or granted ep patent |
Free format text: STATUS: GRANT OF PATENT IS INTENDED |
|
| INTG | Intention to grant announced |
Effective date: 20240612 |
|
| GRAS | Grant fee paid |
Free format text: ORIGINAL CODE: EPIDOSNIGR3 |
|
| GRAA | (expected) grant |
Free format text: ORIGINAL CODE: 0009210 |
|
| STAA | Information on the status of an ep patent application or granted ep patent |
Free format text: STATUS: THE PATENT HAS BEEN GRANTED |
|
| AK | Designated contracting states |
Kind code of ref document: B1 Designated state(s): AL AT BE BG CH CY CZ DE DK EE ES FI FR GB GR HR HU IE IS IT LI LT LU LV MC MK MT NL NO PL PT RO RS SE SI SK SM TR |
|
| REG | Reference to a national code |
Ref country code: GB Ref legal event code: FG4D |
|
| REG | Reference to a national code |
Ref country code: CH Ref legal event code: EP |
|
| REG | Reference to a national code |
Ref country code: IE Ref legal event code: FG4D |
|
| REG | Reference to a national code |
Ref country code: DE Ref legal event code: R096 Ref document number: 602021021721 Country of ref document: DE |
|
| REG | Reference to a national code |
Ref country code: CH Ref legal event code: PK Free format text: BERICHTIGUNGEN |
|
| REG | Reference to a national code |
Ref country code: LT Ref legal event code: MG9D |
|
| REG | Reference to a national code |
Ref country code: NL Ref legal event code: MP Effective date: 20241113 |
|
| RAP4 | Party data changed (patent owner data changed or rights of a patent transferred) |
Owner name: STARITZBICHLER, RENE Owner name: KAISER, THORSTEN |
|
| RIN2 | Information on inventor provided after grant (corrected) |
Inventor name: STARITZBICHLER, RENE Inventor name: KAISER, THORSTEN |
|
| PG25 | Lapsed in a contracting state [announced via postgrant information from national office to epo] |
Ref country code: PT Free format text: LAPSE BECAUSE OF FAILURE TO SUBMIT A TRANSLATION OF THE DESCRIPTION OR TO PAY THE FEE WITHIN THE PRESCRIBED TIME-LIMIT Effective date: 20250313 Ref country code: HR Free format text: LAPSE BECAUSE OF FAILURE TO SUBMIT A TRANSLATION OF THE DESCRIPTION OR TO PAY THE FEE WITHIN THE PRESCRIBED TIME-LIMIT Effective date: 20241113 Ref country code: IS Free format text: LAPSE BECAUSE OF FAILURE TO SUBMIT A TRANSLATION OF THE DESCRIPTION OR TO PAY THE FEE WITHIN THE PRESCRIBED TIME-LIMIT Effective date: 20250313 |
|
| PG25 | Lapsed in a contracting state [announced via postgrant information from national office to epo] |
Ref country code: FI Free format text: LAPSE BECAUSE OF FAILURE TO SUBMIT A TRANSLATION OF THE DESCRIPTION OR TO PAY THE FEE WITHIN THE PRESCRIBED TIME-LIMIT Effective date: 20241113 Ref country code: NL Free format text: LAPSE BECAUSE OF FAILURE TO SUBMIT A TRANSLATION OF THE DESCRIPTION OR TO PAY THE FEE WITHIN THE PRESCRIBED TIME-LIMIT Effective date: 20241113 |
|
| REG | Reference to a national code |
Ref country code: AT Ref legal event code: MK05 Ref document number: 1742337 Country of ref document: AT Kind code of ref document: T Effective date: 20241113 |
|
| PG25 | Lapsed in a contracting state [announced via postgrant information from national office to epo] |
Ref country code: BG Free format text: LAPSE BECAUSE OF FAILURE TO SUBMIT A TRANSLATION OF THE DESCRIPTION OR TO PAY THE FEE WITHIN THE PRESCRIBED TIME-LIMIT Effective date: 20241113 |
|
| PG25 | Lapsed in a contracting state [announced via postgrant information from national office to epo] |
Ref country code: ES Free format text: LAPSE BECAUSE OF FAILURE TO SUBMIT A TRANSLATION OF THE DESCRIPTION OR TO PAY THE FEE WITHIN THE PRESCRIBED TIME-LIMIT Effective date: 20241113 |
|
| PG25 | Lapsed in a contracting state [announced via postgrant information from national office to epo] |
Ref country code: NO Free format text: LAPSE BECAUSE OF FAILURE TO SUBMIT A TRANSLATION OF THE DESCRIPTION OR TO PAY THE FEE WITHIN THE PRESCRIBED TIME-LIMIT Effective date: 20250213 |
|
| PG25 | Lapsed in a contracting state [announced via postgrant information from national office to epo] |
Ref country code: LV Free format text: LAPSE BECAUSE OF FAILURE TO SUBMIT A TRANSLATION OF THE DESCRIPTION OR TO PAY THE FEE WITHIN THE PRESCRIBED TIME-LIMIT Effective date: 20241113 Ref country code: AT Free format text: LAPSE BECAUSE OF FAILURE TO SUBMIT A TRANSLATION OF THE DESCRIPTION OR TO PAY THE FEE WITHIN THE PRESCRIBED TIME-LIMIT Effective date: 20241113 Ref country code: GR Free format text: LAPSE BECAUSE OF FAILURE TO SUBMIT A TRANSLATION OF THE DESCRIPTION OR TO PAY THE FEE WITHIN THE PRESCRIBED TIME-LIMIT Effective date: 20250214 |
|
| PG25 | Lapsed in a contracting state [announced via postgrant information from national office to epo] |
Ref country code: PL Free format text: LAPSE BECAUSE OF FAILURE TO SUBMIT A TRANSLATION OF THE DESCRIPTION OR TO PAY THE FEE WITHIN THE PRESCRIBED TIME-LIMIT Effective date: 20241113 |
|
| PG25 | Lapsed in a contracting state [announced via postgrant information from national office to epo] |
Ref country code: RS Free format text: LAPSE BECAUSE OF FAILURE TO SUBMIT A TRANSLATION OF THE DESCRIPTION OR TO PAY THE FEE WITHIN THE PRESCRIBED TIME-LIMIT Effective date: 20250213 |
|
| PG25 | Lapsed in a contracting state [announced via postgrant information from national office to epo] |
Ref country code: SM Free format text: LAPSE BECAUSE OF FAILURE TO SUBMIT A TRANSLATION OF THE DESCRIPTION OR TO PAY THE FEE WITHIN THE PRESCRIBED TIME-LIMIT Effective date: 20241113 |
|
| PG25 | Lapsed in a contracting state [announced via postgrant information from national office to epo] |
Ref country code: DK Free format text: LAPSE BECAUSE OF FAILURE TO SUBMIT A TRANSLATION OF THE DESCRIPTION OR TO PAY THE FEE WITHIN THE PRESCRIBED TIME-LIMIT Effective date: 20241113 |
|
| PG25 | Lapsed in a contracting state [announced via postgrant information from national office to epo] |
Ref country code: EE Free format text: LAPSE BECAUSE OF FAILURE TO SUBMIT A TRANSLATION OF THE DESCRIPTION OR TO PAY THE FEE WITHIN THE PRESCRIBED TIME-LIMIT Effective date: 20241113 |
|
| PG25 | Lapsed in a contracting state [announced via postgrant information from national office to epo] |
Ref country code: RO Free format text: LAPSE BECAUSE OF FAILURE TO SUBMIT A TRANSLATION OF THE DESCRIPTION OR TO PAY THE FEE WITHIN THE PRESCRIBED TIME-LIMIT Effective date: 20241113 |
|
| PG25 | Lapsed in a contracting state [announced via postgrant information from national office to epo] |
Ref country code: SK Free format text: LAPSE BECAUSE OF FAILURE TO SUBMIT A TRANSLATION OF THE DESCRIPTION OR TO PAY THE FEE WITHIN THE PRESCRIBED TIME-LIMIT Effective date: 20241113 |
|
| PG25 | Lapsed in a contracting state [announced via postgrant information from national office to epo] |
Ref country code: CZ Free format text: LAPSE BECAUSE OF FAILURE TO SUBMIT A TRANSLATION OF THE DESCRIPTION OR TO PAY THE FEE WITHIN THE PRESCRIBED TIME-LIMIT Effective date: 20241113 |
|
| PG25 | Lapsed in a contracting state [announced via postgrant information from national office to epo] |
Ref country code: IT Free format text: LAPSE BECAUSE OF FAILURE TO SUBMIT A TRANSLATION OF THE DESCRIPTION OR TO PAY THE FEE WITHIN THE PRESCRIBED TIME-LIMIT Effective date: 20241113 |
|
| REG | Reference to a national code |
Ref country code: DE Ref legal event code: R097 Ref document number: 602021021721 Country of ref document: DE |
|
| PG25 | Lapsed in a contracting state [announced via postgrant information from national office to epo] |
Ref country code: SE Free format text: LAPSE BECAUSE OF FAILURE TO SUBMIT A TRANSLATION OF THE DESCRIPTION OR TO PAY THE FEE WITHIN THE PRESCRIBED TIME-LIMIT Effective date: 20241113 |
|
| PLBE | No opposition filed within time limit |
Free format text: ORIGINAL CODE: 0009261 |
|
| STAA | Information on the status of an ep patent application or granted ep patent |
Free format text: STATUS: NO OPPOSITION FILED WITHIN TIME LIMIT |
|
| REG | Reference to a national code |
Ref country code: CH Ref legal event code: U11 Free format text: ST27 STATUS EVENT CODE: U-0-0-U10-U11 (AS PROVIDED BY THE NATIONAL OFFICE) Effective date: 20251001 |
|
| PGFP | Annual fee paid to national office [announced via postgrant information from national office to epo] |
Ref country code: DE Payment date: 20250919 Year of fee payment: 5 |
|
| PGFP | Annual fee paid to national office [announced via postgrant information from national office to epo] |
Ref country code: GB Payment date: 20250923 Year of fee payment: 5 |
|
| PGFP | Annual fee paid to national office [announced via postgrant information from national office to epo] |
Ref country code: FR Payment date: 20250926 Year of fee payment: 5 |
|
| 26N | No opposition filed |
Effective date: 20250814 |
|
| PGFP | Annual fee paid to national office [announced via postgrant information from national office to epo] |
Ref country code: CH Payment date: 20251001 Year of fee payment: 5 |