EP3948652B1 - Zytometriedatenanalyse - Google Patents
Zytometriedatenanalyse Download PDFInfo
- Publication number
- EP3948652B1 EP3948652B1 EP20714259.7A EP20714259A EP3948652B1 EP 3948652 B1 EP3948652 B1 EP 3948652B1 EP 20714259 A EP20714259 A EP 20714259A EP 3948652 B1 EP3948652 B1 EP 3948652B1
- Authority
- EP
- European Patent Office
- Prior art keywords
- marker
- particles
- sample
- measurement
- feature sets
- Prior art date
- Legal status (The legal status is an assumption and is not a legal conclusion. Google has not performed a legal analysis and makes no representation as to the accuracy of the status listed.)
- Active
Links
Images


Classifications
-
- G—PHYSICS
- G06—COMPUTING OR CALCULATING; COUNTING
- G06V—IMAGE OR VIDEO RECOGNITION OR UNDERSTANDING
- G06V20/00—Scenes; Scene-specific elements
- G06V20/60—Type of objects
- G06V20/69—Microscopic objects, e.g. biological cells or cellular parts
- G06V20/698—Matching; Classification
-
- G—PHYSICS
- G01—MEASURING; TESTING
- G01N—INVESTIGATING OR ANALYSING MATERIALS BY DETERMINING THEIR CHEMICAL OR PHYSICAL PROPERTIES
- G01N15/00—Investigating characteristics of particles; Investigating permeability, pore-volume or surface-area of porous materials
- G01N15/10—Investigating individual particles
- G01N15/14—Optical investigation techniques, e.g. flow cytometry
-
- G—PHYSICS
- G06—COMPUTING OR CALCULATING; COUNTING
- G06F—ELECTRIC DIGITAL DATA PROCESSING
- G06F18/00—Pattern recognition
- G06F18/20—Analysing
- G06F18/21—Design or setup of recognition systems or techniques; Extraction of features in feature space; Blind source separation
- G06F18/211—Selection of the most significant subset of features
- G06F18/2115—Selection of the most significant subset of features by evaluating different subsets according to an optimisation criterion, e.g. class separability, forward selection or backward elimination
-
- G—PHYSICS
- G06—COMPUTING OR CALCULATING; COUNTING
- G06F—ELECTRIC DIGITAL DATA PROCESSING
- G06F18/00—Pattern recognition
- G06F18/20—Analysing
- G06F18/24—Classification techniques
- G06F18/241—Classification techniques relating to the classification model, e.g. parametric or non-parametric approaches
- G06F18/2413—Classification techniques relating to the classification model, e.g. parametric or non-parametric approaches based on distances to training or reference patterns
- G06F18/24133—Distances to prototypes
- G06F18/24137—Distances to cluster centroïds
- G06F18/2414—Smoothing the distance, e.g. radial basis function networks [RBFN]
-
- G—PHYSICS
- G06—COMPUTING OR CALCULATING; COUNTING
- G06F—ELECTRIC DIGITAL DATA PROCESSING
- G06F18/00—Pattern recognition
- G06F18/20—Analysing
- G06F18/24—Classification techniques
- G06F18/243—Classification techniques relating to the number of classes
- G06F18/2431—Multiple classes
-
- G—PHYSICS
- G06—COMPUTING OR CALCULATING; COUNTING
- G06F—ELECTRIC DIGITAL DATA PROCESSING
- G06F18/00—Pattern recognition
- G06F18/40—Software arrangements specially adapted for pattern recognition, e.g. user interfaces or toolboxes therefor
-
- G—PHYSICS
- G06—COMPUTING OR CALCULATING; COUNTING
- G06N—COMPUTING ARRANGEMENTS BASED ON SPECIFIC COMPUTATIONAL MODELS
- G06N3/00—Computing arrangements based on biological models
- G06N3/02—Neural networks
- G06N3/04—Architecture, e.g. interconnection topology
- G06N3/0464—Convolutional networks [CNN, ConvNet]
-
- G—PHYSICS
- G06—COMPUTING OR CALCULATING; COUNTING
- G06N—COMPUTING ARRANGEMENTS BASED ON SPECIFIC COMPUTATIONAL MODELS
- G06N3/00—Computing arrangements based on biological models
- G06N3/02—Neural networks
- G06N3/08—Learning methods
- G06N3/09—Supervised learning
-
- G—PHYSICS
- G06—COMPUTING OR CALCULATING; COUNTING
- G06V—IMAGE OR VIDEO RECOGNITION OR UNDERSTANDING
- G06V10/00—Arrangements for image or video recognition or understanding
- G06V10/70—Arrangements for image or video recognition or understanding using pattern recognition or machine learning
- G06V10/82—Arrangements for image or video recognition or understanding using pattern recognition or machine learning using neural networks
-
- G—PHYSICS
- G06—COMPUTING OR CALCULATING; COUNTING
- G06V—IMAGE OR VIDEO RECOGNITION OR UNDERSTANDING
- G06V10/00—Arrangements for image or video recognition or understanding
- G06V10/70—Arrangements for image or video recognition or understanding using pattern recognition or machine learning
- G06V10/84—Arrangements for image or video recognition or understanding using pattern recognition or machine learning using probabilistic graphical models from image or video features, e.g. Markov models or Bayesian networks
-
- G—PHYSICS
- G06—COMPUTING OR CALCULATING; COUNTING
- G06N—COMPUTING ARRANGEMENTS BASED ON SPECIFIC COMPUTATIONAL MODELS
- G06N20/00—Machine learning
- G06N20/10—Machine learning using kernel methods, e.g. support vector machines [SVM]
-
- G—PHYSICS
- G06—COMPUTING OR CALCULATING; COUNTING
- G06N—COMPUTING ARRANGEMENTS BASED ON SPECIFIC COMPUTATIONAL MODELS
- G06N20/00—Machine learning
- G06N20/20—Ensemble learning
-
- G—PHYSICS
- G06—COMPUTING OR CALCULATING; COUNTING
- G06N—COMPUTING ARRANGEMENTS BASED ON SPECIFIC COMPUTATIONAL MODELS
- G06N3/00—Computing arrangements based on biological models
- G06N3/02—Neural networks
- G06N3/08—Learning methods
-
- G—PHYSICS
- G06—COMPUTING OR CALCULATING; COUNTING
- G06N—COMPUTING ARRANGEMENTS BASED ON SPECIFIC COMPUTATIONAL MODELS
- G06N5/00—Computing arrangements using knowledge-based models
- G06N5/01—Dynamic search techniques; Heuristics; Dynamic trees; Branch-and-bound
-
- G—PHYSICS
- G06—COMPUTING OR CALCULATING; COUNTING
- G06N—COMPUTING ARRANGEMENTS BASED ON SPECIFIC COMPUTATIONAL MODELS
- G06N7/00—Computing arrangements based on specific mathematical models
- G06N7/01—Probabilistic graphical models, e.g. probabilistic networks
Definitions
- a property of a cell or a particle can be measured by cytometry.
- a cytometry method can be used to measure a plurality of properties of a plurality of single cells.
- a property of a cell can for instance be a cell cycle phase, a DNA count, a concentration of an intracellular compound, in particular of an intracellular protein, a concentration of a surface protein, a cell size, a cell shape, or an impedance.
- the cells can be labelled with a fluorescent marker (also referred to as fluorescent label), in particular with a plurality of different fluorescent markers.
- a fluorescent marker also referred to as fluorescent label
- mass markers also known as mass labels.
- oligo markers that are based on short oligomers that allow a differentiation of the markers by means of the labelled oligomer.
- cytomics data For an analysis and visualisation of cytomics data, methods are known that reduce the dimensionality.
- previous approaches comprise a clustering method as an essential step of the algorithm. Such an approach is for instance PhenoGraph or CITRUS.
- Other approaches comprise a dimension reduction technique such as a t-distributed stochastic neighbour embedding (tSNE).
- a clustering-based method for example cannot be applied for analysing, in particular comparing and/or discriminating between, two samples comprising particles with similar characteristics, such as e. g. activated and non-activated T-cells.
- a disadvantage of a dimension reduction-based approach such as tSNE is that it takes artificial axes into account. These artificial axes render the obtained results difficult to interpret in a biological sense.
- a method is needed to analyse cytometry data in an efficient manner, wherein the results are easy to interpret in a biological manner, i.e. related to a biological context. Further, a method to visualise the cytometry data is of interest.
- a first aspect relates to a method for classifying selected marker signals from cytometric measurements comprising a first measurement and a second measurement.
- the first measurement comprises a cytometric measurement acquired from a first sample of N 1 particles.
- the second measurement comprises a cytometric measurement acquired from a second sample of N 2 particles.
- N 1 is the number of particles in the first sample and N 2 is the number of particles in the second sample.
- Each particle n N 1 i of the N 1 particles of the first sample is labelled with a number of L 1 fluorescent, mass or oligo markers l N 1 j
- each particle n N 2 i of the N 2 particles of second sample is labelled with a number of L 2 fluorescent, mass or oligo markers l N 2 j .
- each fluorescent, mass or oligo marker l N 1 j of the L 1 fluorescent, mass or oligo markers is associated to an entity of the respective particle n N 1 i , particularly to a different entity of the respective particle n N 1 i .
- Each fluorescent, mass or oligo marker l N 2 j of the L 2 fluorescent, mass or oligo markers can be associated to a different entity of the respective particle n N 2 i .
- the first measurement comprises for each particle n N 1 i a detected intensity p N 1 lj of each marker l N 1 j of the respective particle.
- the second measurement comprises for each particle n N 2 i a detected intensity p N 2 lj of each marker l N 2 j of the respective particle.
- the method comprises the steps of:
- the first sample of particles can comprise at least one of: an inorganic polymer particle, a cell, a microorganism, and an organelle.
- An organelle is a subunit of a cell having a specific cellular function.
- the second sample of particles can comprise at least one of: an inorganic polymer particle, a cell, a microorganism, and an organelle.
- a cytometric measurement is a flow-cytometric measurement.
- the cytometric measurement is a measurement by means of a fluorescence-activated cell sorting or screening (FACS).
- FACS fluorescence-activated cell sorting or screening
- a particle can be labelled with at least one fluorescent marker (also referred to as fluorescent label), i.e. a fluorophore or a fluorophore-coupled antibody.
- the cytometric measurement can be a mass cytometric measurement based on a mass spectrometry approach, in particular based on time of flight mass spectrometry (TOFMS) and inductively coupled plasma mass spectrometry (ICP-MS).
- a particle can be labelled with at least one mass marker (also referred to as mass label), i.e. a mass or a mass-coupled antibody.
- the first measurement and the second measurement can be determined by the same cytometry method.
- the first measurement and the second measurement is a flow-cytometric measurement.
- the first measurement and the second measurement is a mass-cytometric measurement.
- the first measurement can be acquired separately from the second measurement. In other words this means that the first and the second measurement can be performed independent of each other.
- a marker i.e. a fluorescent marker and/or a mass marker, can bind to a particular entity of the respective particle.
- Each marker can label a specific entity of the particle, in particular a specific entity of a cell.
- An entity of a particle can be a biomolecule, including an intracellular protein, a surface protein, a nucleic acid, and a carbohydrate of a cell.
- the detected intensity can be the fluorescence or signal intensity detected at a detector.
- the first and/or the second measurement can comprise a detected intensity of a marker associated to a specific entity for each single particle. By measuring the intensity of the marker associated to a certain entity, a concentration of the respective entity and/or a quantity related to the concentration, such as e.g. a fraction, can be determined.
- the detected intensity of a marker might also be referred to as marker intensity or signal intensity in the context of the current specification.
- the detected intensities p N 1 lj of a marker l N 1 j can be binned into a predefined number of B I1 bins, such that a binned marker intensity can be generated.
- the detected intensities of each marker can be binned. This means that with respect to each marker, a binned marker intensity can be generated.
- the predefined number of bins is equal for each marker.
- the predefined number of bins can be different for at least one marker.
- the number of bins is equal for all markers, wherein a bin size is either predefined or adjusted to the detected intensities of the marker (from the first and the second measurement).
- the detected intensities p N 2 lj of a marker l N 2 j can be binned into a predefined number of B I2 bins, generating a binned marker intensity.
- the detected intensities related each marker can be binned, such that with respect to each marker a binned marker intensity can be generated.
- the predefined number of bins can be equal for each marker. In an alternative embodiment, the predefined number of bins can be different for at least one marker.
- the predefined numbers of bins (B I1 , B I2 ) associated to the same entity in the first and in the second measurement are equal.
- the detected intensities p N 1 lj of a marker l N 1 j can be binned in a serial manner, such that a 2-dimensional bin is generated, i.e. the intensities of a first marker can be binned, and in a subsequent step, the intensities of a second marker can be binned.
- the combination of two binned marker intensities defines a two-dimensional bin.
- a 2-dimensional binning is performed in one step providing a plurality of two-dimensional bins.
- 2-dimensional binning a binning of a combination of two marker intensities is meant.
- the one-step 2-dimensional binning is performed by arranging the intensities related to a first and a second marker to each other and putting a grid comprising a plurality of equal sectors on that sorted intensities, wherein each sector of the grid represents each one two-dimensional bin.
- each particle can be related to a certain two-dimensional bin.
- a reduction of the dimensionality can advantageously be provided.
- a further reduction of the dimensionality is obtained by pooling a plurality of bins.
- At least one associated marker function can be determined for each bin, in particular for each two-dimensional bin.
- a marker function can be a ratio of intensities of two markers. In an embodiment, the marker function is a ratio of binned intensities of two markers.
- the marker function can be a number of particles per bin. According to an embodiment, the marker function is a statistical value with respect to a marker intensity of a bin, in particular one of a mean value, a median, a minimum value, a maximum value, a standard deviation, a variance, an inter quartile range, a distance, a range, a correlation, and coefficient of variation.
- a range can be an absolute range, which can be a difference between a maximum value and a minimum value per sample, per area and/or per quadrant. In an embodiment, the range is a relative range which is related to a maximum value and a minimum value of a total of all considered samples, in particular of the first and the second sample.
- the third marker intensity can particularly be a third binned marker intensity.
- a feature set relates a different combination of two binned marker intensities and at least one associated marker function to each other.
- a feature set relates a different combination of two binned marker intensities and a third marker intensity to each other.
- the third marker intensity is a binned marker intensity.
- a feature set can comprise three entries: a) a first binned marker intensity related to a first entity, b) a second binned marker intensity related to a second entity, and c) an associated marker function and/or a third marker intensity related to the bin determined by the first and the second binned marker intensity.
- a feature set can be generated with respect to the first measurement and is referred to as first feature set.
- a second feature set can be a feature set generated and with respect to the second measurement.
- a first feature set and a second feature set that comprise the same combination of markers intensities or functions form a pair of feature sets. In an embodiment, for each combination of binned marker intensities a pair of feature sets is generated. In an embodiment, for each combination of binned marker intensities and marker functions a pair of feature sets is generated.
- a plurality of pairs of feature sets can be provided to a machine learning method to identify at least one selected pair of feature sets showing the largest variation between the first feature set and the second feature set.
- all pairs of feature sets can be provided to a machine learning method. In other words this means that based on all pairs of feature sets the machine learning method can determine the selected pair of feature set showing the largest variation.
- a support vector machine approach is used to determine the largest variation between the first and the second feature set.
- a distance of the first and the second feature set to a hyperplane can be determined.
- the accumulated distance can be a measure characterising the similarity (or the dissimilarity) between the first and the second feature set.
- a statistical value such as a mean value, a variance, a range, a standard deviation and/or a cumulant can be determined for the first and the second feature set for each pair of feature sets, wherein the largest variation can be determined e.g. by a difference or ratio between the statistical value.
- An alternative embodiment is characterised in that an artificial neuronal network is used to determine the variation between the first and the second feature set.
- the variation between the first and the second feature set is determined by means of a correlation.
- the machine learning method can determine the marker combination with that the first sample can be distinguished best from the second sample.
- the markers are identified that characterise a sample, in particular the cells or the particles of the sample.
- An advantage of the method is that a most powerful marker combination to discriminate between different samples is identified.
- the most powerful marker combination is the marker combination whose associated pair of feature sets shows the largest variation between the first feature set and the second feature set. Additionally, the most powerful marker combination to characterise a specific type of particles can be determined. Further, the method can be used to characterise similarities between particles.
- a determination of a particular feature set i.e. a combination of two marker intensities and a marker function or a third marker intensity
- feature engineering A determination of a particular feature set (i.e. a combination of two marker intensities and a marker function or a third marker intensity) to discriminate between different particles (different samples) is also referred to as "feature engineering”.
- binning provides a grouping of particles, in particular a grouping of cells, based on the detected intensities, i.e. based on the properties of the particles, while maintaining the axes.
- the discrimination is based on the maintained axes and not on artificial axes. That means that the discrimination is based on the marker intensities, such that the obtained differences and/or similarities between the first and the second sample can be easily related to the respective marker intensities and the associated marker functions, such as a concentration of a specific biomolecule.
- the results are easy to interpret in a biological manner.
- each feature set is provided to the machine learning method in form of a graphical representation.
- each feature set of the pairs of features sets is provided to the machine learning method in form of a graphical representation.
- the method is not restricted in terms of the requirement that the first measurement and/or the second measurement, in particular the pairs of feature sets, have to be provided in form of numbers, but the method can also be used when a graphical representation is provided. This advantageously increases the field of applications of the method.
- An example is characterised in that prior to the cytometric measurement a first solution is applied to the first sample of particles and a second solution is applied to the second sample of particles.
- the first solution is a control medium or the first solution comprises one of a: first stimulating compound for stimulating the particles, a first inhibiting compound for inhibiting the particles or a first combination of a first stimulating and a first inhibiting compound.
- the second solution is a control medium or the second solution comprises one of a: second stimulating compound for stimulating the particles, a second inhibiting compound for inhibiting the particles or a second combination of a second stimulating and a second inhibiting compound.
- a control medium can be a basal medium without any supplemental additives.
- a first and/or a second stimulating compound can be an activator of intracellular cytokine production.
- a cytokine can be a chemokine, an interferon, an interleukin, a lymphokin or a tumour necrosis factor.
- a first and/or a second stimulating compound can be an activator of a kinase.
- the first and/or second stimulating compound is an activator of protein kinase C, in particular phorbol 12-myristate 13-acetate (PMA).
- An activator of intracellular cytokine production can be ionomycin or an anti-CD3/anti-CD28 antibody.
- a first and/or a second inhibiting compound can be a kinase inhibitor.
- a first and/or second inhibiting compound is a MEK inhibitor, in particular U0128.
- the first solution differs from the second solution.
- the difference can be that the first activating or inhibiting compound differs from the second activating or inhibiting compound, respectively.
- the first solution comprises a first activating compound and the second solution comprises a second inhibiting compound.
- the first activating (or inhibiting) compound is another chemical substance than the second activating (or inhibiting) compound.
- the first solution comprises a control medium while the second solution comprises one of a second stimulating compound, a second inhibiting compound, and a second combination of a second stimulating and a second inhibiting compound.
- the first activating (or inhibiting) compound can be the same as the second activating (or inhibiting) compound.
- the concentration or activity of the first activating (or inhibiting) compound differs from the concentration or activity of the second activating (or inhibiting) compound.
- the first solution is applied for a first time interval to the first sample.
- the second solution can be applied for a second time interval to the second sample.
- the first time interval can differ from the second time interval.
- the first time interval can be equal to the second time interval.
- the present invention can be used to analyse samples receiving stimuli of different durations, different strengths or different kinds, and the associated effects on the marker intensities can be compared.
- the first sample of particles comprises particles of a first type and the second sample of particles comprises particles of a second type.
- particles of the first type can differ in at least one property from particles of the second type.
- the first and the second sample of particles comprise cells.
- the particles of the first type and the particles of the second type are related to the same organism, but are associated to different tissues of that organism.
- the particles of the first type can comprise cells of a first organism and the particles of the second type can comprise cells of a second organism differing from the first organism.
- the particles of the first type comprise normal cells and the particles of the second type comprise abnormal cells.
- An abnormal cell can be a cancer cell.
- the particles of the first type can comprise cells of a first abnormal type and the particles of the second type can comprise cells of a second abnormal type, wherein the first abnormal type differs from the second abnormal type.
- the cells of the first abnormal type and cells of the second abnormal type are related to the same tissue.
- the first abnormal type is equal to the second abnormal type but the respective samples are related to different individuals.
- the most powerful marker combination can be determined to distinguish between different cell types.
- cells related to a specific tissue and/or a specific organism can be characterised by means of the most powerful marker combination.
- the most powerful marker combination that characterises a specific type of particles e.g. cells related to a specific disease, such as specific cancer cells, can be identified.
- a first solution can be applied to the first sample comprising cells of the first type and a second solution can be applied to the second sample comprising cells of the second type.
- the method can be used to distinguish between a type of particles that appropriately responds to a specific composition of the first and/or the second solution and another type of particles that does not respond.
- the specific composition of the first and/or the second solution can be based on a composition of a medical therapy, thus providing information, whether a specific therapy would be a promising target with respect to a specific type of particles.
- the method can be used to identify a modified cell type.
- the method can identify a cell type modified in case of a specific type of cancer.
- the machine learning method determines a selected plurality of pairs of feature sets, wherein each pair of feature sets of the selected plurality of pairs of feature sets exhibits a variation between the first and the second feature set larger than a predefined threshold.
- a plurality of features can be specified in that the first and the second sample differ. This can advantageously increase the accuracy of the respective prediction and/or characterisation of the particles of the samples.
- the pairs of feature sets are ranked with respect to the variation between the first and the second feature set.
- the pairs of feature sets can be ranked such that the selected pair of feature sets has a first rank. Pairs of feature sets with decreasing variation are ranked in decreasing order having a correspondingly lower rank.
- the plurality of selected pairs of feature sets comprises the pairs of feature sets related to rank one and rank two. This means that the plurality of selected pairs of feature sets comprises the pairs of feature sets exhibiting the largest and the second largest variation between the first and the second feature set.
- the plurality of selected pairs of feature sets comprises at least the pairs of feature sets related to rank one to rank five. In an example, the plurality of selected pairs of feature sets comprises at least the pairs of feature sets related to rank one to rank ten. Alternatively, the plurality of selected pairs of feature sets comprises at least the pairs of feature sets related to rank one to rank 20.
- a third measurement comprises a cytometric measurement acquired from a third sample of N 3 particles, wherein N 3 is the number of particles in the third sample.
- Each particle n N 3 i of the N 3 particles of the third sample is labelled with a number of L 3 fluorescent, mass or oligo markers, wherein each fluorescent, mass or oligo marker l N 3 j of the L 3 fluorescent, mass or oligo markers is associated to a different entity of the respective particle n N 3 i .
- the third measurement comprises for each particle n N 3 i the detected intensity p N 3 lj of each marker l N 3 j of the respective particle.
- the detected intensities of each marker l N 3 j of the third measurement are binned into an associated third number B I3 of bins. At least one associated marker function is generated. From the third measurement, a number of S 3 third feature sets are generated, each third feature set relating a different combination of two binned marker intensities and the at least one associated marker function and/or a third marker intensity to each other. The third feature sets are compared with the first and/or the second feature sets, and a weight measure is determined that gives a probability for particles of the third sample to be associated with the first sample or the second sample.
- a number of S 3 third feature sets based on the third measurement is generated in accordance with the number of first and/or second feature sets generated based on the first and/or the second measurement, respectively.
- the method is particularly configured to provide a probability for a particle of the third sample to be associated with the first or the second sample.
- the method can classify particles of the third sample to be associated with the first or the second sample.
- an unknown type of particles (third sample) can be analysed by means of the method and classified to be associated with particles of the first or the second sample.
- the method determines by means of classification whether particles of a third sample respond to a specific composition of the first and/or a second solution. In an example the method determines by means of classification, whether cells of a third sample respond to a specific therapy.
- the machine learning method is one of a naive Bayes classifier algorithm, a K means clustering algorithm, a support vector machine algorithm, a linear regression, a logistic regression, a random forest, a decision tree, a nearest neighbour algorithm, and/or an artificial neuronal network.
- the method can comprise a supervised machine learning algorithm.
- the method can comprise an unsupervised machine learning algorithm.
- the artificial neural network is a convolutional neural network (CNN).
- CNN convolutional neural network
- the artificial neural network is used to provide a probability for a particle of the third sample to be associated with the first or the second sample.
- the artificial neural network can be used to classify the third sample to be associated to the first or the second sample, wherein at least one selected pair of feature sets is determined to distinguish between the first and the second sample.
- a naive Bayes classifier algorithm is used to give a probability for a particle of the third sample to be associated with the first or the second sample, i.e. used to classify the third sample to be associated to the first or the second sample.
- a regression method can be used to classify the third sample to be associated to the first or the second sample. In an embodiment, the regression method is used to determine the at least one selected pair of feature sets.
- a regression method can be a linear regression. In an embodiment, the regression method is a logistic regression. Alternatively, the regression method can be a multinomial regression method, a lasso regression method, a ridge regression method or an elastic-net regression method.
- a decision tree is used to give a probability for a particle of the third sample to be associated with the first or the second sample.
- the decision tree is used to determine the at least one selected pair of feature sets.
- a random forest method determines the probability for a particle of the third sample to be associated with the first or the second sample.
- the random forest method determines the at least one selected pair of feature sets.
- the machine learning algorithm that selects the pair of feature sets that exhibits the largest variation between the first and the second feature set is a support vector machine method.
- the support vector machine method is used to classify the third sample to be associated to the first or the second sample.
- An example is characterised in that a wrapper method is applied to give a probability for a particle of the third sample to be associated with the first or the second sample.
- a wrapper method can be used to determine the at least one selected pair of feature sets.
- the wrapper method is a forward selection method, a backward selection method or an exhaustive search method.
- each feature set particularly of the feature sets comprised in the at least one selected pair of feature sets, comprises a coordinate system with an abscissa and an ordinate, wherein the two binned marker intensities of the feature set are plotted along the abscissa and the ordinate, and the at least one associated marker function and/or the third marker intensity is represented by a colour according to a predefined colour scale or a grey level according to a predefined grey scale.
- the graphical representation can be referred to as triplot.
- the graphical representation for the at least one selected pair of feature sets can be generated. For each feature set of the selected plurality of pairs of feature sets the graphical representation is generated.
- graphical representation for the first feature sets, the second feature sets and/or the third feature sets is generated.
- the at least one selected pair of feature sets is displayed by displaying a marker identifier of the entities related to the first and the second binned intensities and an identifier related to the associated marker function and/or a third marker.
- the names of the labelled biomolecules to that the first and the second binned intensities are related are displayed as well as the name of the associated marker function and/or a third marker.
- the two binned marker intensities and the at least one associated marker function and/or a third marker intensity associated to the at least one pair of feature sets can be displayed in terms of a table.
- the two binned marker intensities and the at least one associated marker function and/or a third marker intensity associated to the at least one pair of feature sets can be displayed in a matrix form.
- At least one triplot is displayed.
- the triplot of the selected feature set is displayed.
- the triplots related to the selected plurality of pairs of feature sets are displayed.
- the number of L 1 fluorescent, mass or oligo markers and/or the number of L 2 fluorescent, mass or oligo markers and/or the number of L 3 fluorescent, mass or oligo markers comprises at least three fluorescent, mass or oligo markers, in particular at least 10 fluorescent, mass or oligo markers, in particular at least 20 fluorescent, mass or oligo markers, in particular at least 50 fluorescent, mass or oligo markers, in particular at least 100 fluorescent, mass or oligo markers.
- the number of L 1 fluorescent, mass or oligo markers, the number of L 2 fluorescent, mass or oligo markers and the number of L 3 fluorescent, mass or oligo markers is equal.
- the respective fluorescent markers or the respective mass markers are equal in the first and the second measurement (and the third measurement). This means that the same entities of the particles can be labelled by the same markers in the different samples.
- the first number of bins and/or the second number of bins and/or the third number of bins is at least 4, is in particular at least 10, is in particular at least 20, is in particular at least 50, is in particular at least 100, is in particular at least 200, is in particular at least 300, is in particular at least 500.
- the first number of bins is equal to the second number of bins and/or the third number of bins.
- the intensities related to a certain marker are binned into the same number of bins for the first sample, the second sample and the third sample. This advantageously simplifies a comparison of the respective feature sets related to the first sample, the second sample and the third sample.
- the first number of bins and/or the second number of bins and/or the third number of bins are configured such that each two-dimensional bin defined by the first number of bins and/or the second number of bins and/or the third number of bins is of equal size.
- the intensities of each marker l N 1 j of the first measurement are binned into an equal first number of B I1 associated bins.
- the intensity of at least one marker is binned into a number of bins differing from the number of bins in that at least one other marker is binned.
- each first feature set and/or each second feature set is filtered, particularly by means of a noise filter.
- a bin comprising less than 20 entries is regarded or treated like a bin with no entries by the method. This means that any bin comprising less than 20 entries is considered in the subsequent analysis as an empty bin, i.e. a bin without an entry.
- An embodiment is characterised in that a bin with less than 10 entries is regarded as a bin without an entry.
- a bin with less than 5 entries can be regarded as a bin without an entry.
- a bin with less than 50 entries can be regarded as a bin without an entry.
- Another aspect of the invention is related to a computer program comprising instructions which, when the program is executed by a computer, cause the computer to carry out the steps a) - g) of the method of claim 1.
- Raw data can comprise data provided by flow cytometry.
- raw data can comprise data provided by mass cytometry.
- Raw data can comprise a plurality of particle data entries, wherein each particle data entry is related to a measured particle.
- a particle can be a cell.
- Each particle data entry can comprise a plurality of label entries, each being related to a particular fluorescent, mass or oligo marker.
- a label entry can be a raw intensity related to a marker detected for a particular particle.
- the method can comprise a pre-processing step of the raw data.
- a pre-processing step can be a removal of a particle data entry.
- a particle data entry is removed for example when the particle data entry relates to a dead cell or a cell aggregate.
- a particle data entry can be removed when it is a doublet.
- a pre-processing step can comprise a pre-gating on specific population/cell types, such as T cells, CD4+ T cells, NK cells, B cells, or monocytes.
- a pre-processing step is a transformation step.
- the transformation step can comprise a transformation of the plurality of label entries, i.e. a transformation of the raw intensities.
- the raw intensities can be transformed performing an inverse hyperbolic sine transformation, also referred to as asinh transformation, generating the associated detected intensities.
- the pre-processing step comprises a bi-exponential transformation step.
- An embodiment is characterised by a linear-logarithmic transformation step.
- a first measurement can comprise the detected intensities related to a first sample.
- a second measurement can comprise the detected intensities related to a second sample.
- the first sample can comprise cells of a first cell type.
- the second sample can comprise cells of a second cell type, differing from the first cell type in at least one property.
- the first sample can comprise cells treated with a first solution while the second sample can comprise cells treated with a second solution.
- the detected intensities of the first measurement can be binned, this means that pre-processed data can be binned, in particular the asinh transformed data.
- the detected intensities related to a marker are binned into binning intervals of equal size.
- the size of a binning interval can be 0.2, particularly if the asinh transformed data are used. In another embodiment, the size of a binning interval is 0.15.
- two-dimensional bins are generated via the binning.
- a two-dimensional bin can be generated by a binning of a combination of two marker intensities.
- binning provides a grouping of particles, in particular a grouping of cells, based on their properties.
- 2-dimensional bins of an interval size of 0.2x0.2 are generated.
- 2-dimensional bins of a size of 0.15x0.15 can be generated.
- the one-step 2-dimensional binning is performed by arranging the intensities related to a first and a second marker to each other and putting a grid comprising a plurality of sectors on that sorted intensities, wherein each sector of the grid represents each one two-dimensional bin.
- Each sector of the plurality of sectors can be identical.
- each sector has a square shape.
- Feature engineering can comprise the generation of at least one feature set, wherein the feature set relates a different combination of two binned marker intensities and the at least one associated marker function and/or a third marker intensity to each other.
- the feature sets related to the first (first feature set) and the second measurement (second feature set) can be generated.
- the first feature set and the second feature set can comprise the same combination of markers intensities or functions are generated, which form a pair of feature sets.
- the feature sets can be visualised, in particular the pairs of feature sets are visualised.
- the respective triplot is generated.
- the triplot can be displayed (see also Figs 2-4 ).
- the feature sets can be ranked.
- the pairs of feature sets can be ranked according to the variation between the first and the second feature set.
- the at least one selected pair of feature sets is determined that exhibits the largest variation between the first and the second feature set.
- the at least one selected pair of feature sets can be used to distinguish between the first and the second measurement.
- the at least one selected pair of feature sets can be used to characterise the first and/or the second measurement, in particular to characterise particles of the associated first and/or second sample.
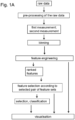
- the at least one selected pair of feature sets can provide a characterisation of the cells related to the first and/or the second sample ( Fig. 1A ).
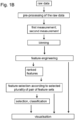
- Fig. 1B shows the workflow of the method in that a selected plurality of pairs of feature sets is determined, wherein each pair of feature sets of the selected plurality of pairs of feature sets exhibits a variation between the first and the second feature set larger than a predefined threshold.
- the predefined threshold can be set such that at least the pairs of feature sets are selected exhibiting the largest to fifth largest variation between the first and the second feature set.
- the selected plurality of feature sets can be used to distinguish between the first and the second measurement.
- the selected plurality can be used to characterise the particles of the associated first and/or second sample.
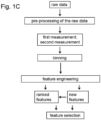
- Fig. 1C it is illustrated that new features can be generated.
- the triplot is subdivided in four quadrants.
- the bins of each quadrant can be merged, such that a further reduction of the dimensionality can be achieved.
- the new features can also be ranked and can be included in the feature selection.
- a triplot is a graphical representation.
- a triplot can comprise a coordinate system, wherein the first binned marker intensity of the combination of two binned marker intensities is associated to the abscissa, and the second binned marker intensity of the combination of two binned marker intensities is associated to the ordinate.
- the at least one associated marker function and/or the third marker intensity can be represented by a colour according to a predefined colour scale.
- the triplot can represent an analysis of a flow cytometry measurement.
- CD4 + T cells from NZBW mice are used.
- cells can be stimulated with 10ng/ml phorbol 12-myristate 13-acetate (PMA) and 1 ⁇ g/ml ionomycin (Sigma) for 1h followed by additional 3h in the presence of 5 ⁇ g/ml BFA (Sigma).
- PMA phorbol 12-myristate 13-acetate
- ionomycin Sigma
- Cell surfaces can be stained with antibodies in the presence of 100 ⁇ g/ml 2.4G2 (Fc ⁇ RII/III; purified from hybridoma supernatants) in order to reduce unspecific antibody binding.
- Cells can be fixed with 2% paraformaldehyde followed by an intracellular staining in 0.5% saponin.
- cells are fixed with Foxp3 fixation buffer (eBioscience), stained in Foxp3 permeabilization buffer (eBioscience).
- Foxp3 fixation buffer eBioscience
- Foxp3 permeabilization buffer eBioscience
- a fixable LIVE/DEAD stain (Life Technologies) can be used to discriminated between a living cell and a dead cell.
- the expression of phenotypic markers can be determined with a BD Fortessa (BD Biosciences) and analyzed with FlowJo (Treestar).
- a severity of a disease is determined by scoring the mice according to levels of proteinuria (Uristix, Siemens, #2857), weight and levels of anti-ds DNA antibodies.
- a flow cytometry measurement can provide raw data, comprising a plurality of raw intensities related to the respective markers each being associated to a specific entity of a cell.
- the raw intensities can be transformed, generating the associated detected intensities.
- the transformation can be an inverse hyperbolic sine transformation.
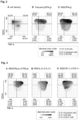
- the first binned marker intensity can be the binned marker intensity with respect to the cytokine tumour necrosis factor alpha (TNF- ⁇ ).
- the second binned marker intensity can be the binned marker intensity with respect to the lymphocyte homing receptor CD44 ( Fig. 2, Fig. 3 ).
- the associated marker function can be a cell density per bin ( Fig. 2A ).
- the marker function can be associated to the cytokine interferon- ⁇ (IFN- ⁇ ). It can be a frequency of IFN- ⁇ -producing cells ( Fig. 2B ).
- the marker function is a mean fluorescence intensity (MFI) of IFN- ⁇ ( Fig. 2C ).
- the triplots can be easily interpreted and compared with each other.
- the frequency of IFN- ⁇ -producing cells is low in the two lower quadrants which are related to a low binned CD44 intensity ( Fig. 2B ).
- the frequency of IFN- ⁇ -producing cells is highest ( Fig. 2B ).
- the region of the triplot showing the highest frequency of IFN- ⁇ -producing cells also shows the highest MFI of IFN- ⁇ ( Fig. 2C ).
- the highest cell density is present in the upper left quadrant which is related to a low TNF- ⁇ intensity and high CD44 intensity ( Fig. 2A ).
- the marker function is one of a mean fluorescence intensity of IFN- ⁇ only of IFN- ⁇ -producing cells (IFN- ⁇ + cells) ( Fig. 3A ), a mean fluorescence intensity of the cytokine interleukin 2 (IL-2) only of IL-2-producing cells (IL-2+ cells) ( Fig. 3B ), and a mean fluorescence intensity of the cell surface receptor programmed cell death protein-1 (PD-1) only of PD-1-producing cells (PD-1+ cells) ( Fig. 3C ).
- IFN- ⁇ + cells IFN- ⁇ + cells
- IL-2+ cells cytokine interleukin 2
- PD-1+ cells cell surface receptor programmed cell death protein-1
- a "pseudo-multiparametric viewing” can be provided, by indicating the area related to MFI of IFN- ⁇ ( Fig. 2C ). Bins in grey depict areas which contain ⁇ 10 cells positive for IFN- ⁇ or IL-2 or PD-1 ( Fig. 3 ). The bins in grey are overlaid by plotting an additional marker function on the same plane characterised by the first and the second binned intensities. This provides an easy characterisation of cells in certain bins.
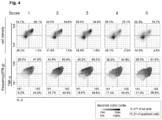
- Fig. 4 illustrates an embodiment in that the method is used to analyse feature sets related to different disease stages, indicated by a score number. It shows (upper row) that the cell density in the upper right quadrant (IL-2+TNF- ⁇ + double positive cytokine producing cells) decreases with increasing score number. It shows (lower row) that the frequencies of IFN- ⁇ + cells in the upper right quadrant (triple positive cytokine producing cells) and lower right quadrant (IL-2+ IFN- ⁇ + double positive cytokine producing cells) increases with increasing score number.
- Fig. 5 shows an example for the applicability of the method according to the invention, demonstrating that the method allows for automatically selecting and visualizing the feature set of labelled cells that exhibits the pronounced differences between two groups of cells.
- the example provides a means for comparison of patterns of peripheral B cells concerning patients with relapse vs. no relapse and basal (unstimulated) vs. B-cell receptor-stimulated blood samples.
- the original data has been acquired by Good et al..
- Triplots for visualization of the combinatorics of three parameters/labels show mean signal intensities (MSIs) of small bins (with at least 10 cells per bin) of a marker. The frequencies of the quadrants are given outside of the respective corner.
- the selected feature set comprises the marker combination of phosphorylated and thereby activated signaling molecules in cells: signal transducer and activator of transcription 5 (pStat5; y-axis), Phospholipase C gamma 1-2 (pPLCg1-2; x-axis) and the spleen tyrosine kinase (pSyk; z-axis) of the triplot.
- the triplot comprises the respective marker intensities.
- the marker intensities are binned as previously elaborated.
- the pSyk marker intensities per cell of relapsed patients are significantly higher and slightly shifted (indicated by a black rectangle in the lower left triplot).
- the marker intensity for pSyk is indicated by means of as a grey scale look-up table shown to the right of the triplots and indicated by an arrow.
- BCR B-cell receptor
- triplots generated by the method according to the invention allow for a clear differentiation between these two samples.
- FIG. 6 Another example of the applicability of the method according to the invention is shown in Fig. 6 , where triplots are used for identification and visualization of a tissue-specific T-helper cell subset.
- the example demonstrates the comparison of patterns of tissue resident memory T (Trm) cells in skin vs. lung.
- the data set has been taken from Wong et al. Specifically the triplots labeled with "lung4" and "skin3" refer to the corresponding data sets in Wong et al.
- Fig. 6 shows a variety of triplots.
- the x-axis shows the binned signal for markers labelled to the surface receptor cluster of differentiation 69 (CD 69) and the y-axis comprises binned signals for markers labelled to the surface receptor cluster of differentiation 103 (CD 103). If a bin contains the minimum number of 10 cells, a statistical feature is calculated such as cell density, or intensity of the color coded marker.
- triplots for density of the T cells are shown for lung (lower triplot) and skin (upper triplot) respectively.
- Cell densities having said marker combination are depicted according to a grey scale shown in the decimal color code.
- triplots are shown for mean signal intensities (MSIs) of a marker labeled to the C-X-C chemokine receptor type 4 (CXCR4) in grey scale according to the color code, again for skin (upper triplot) and lung (lower triplot).
- MSIs mean signal intensities
- MSIs mean signal intensities
- the boxed numbers associated to each quadrant of the triplot are the relative frequencies as detailed in the decimal color code, i.e. the percentage in the highest row indicates a number of Z+ cells in the quadrant, the number below indicates a number of Z+ cells per sample and the number in the lowest row indicates the percentage of Z+ cells per quadrant to all Z+ cells.
- Z+ refers to cells that exhibit the marker that is color coded, i.e. that is plotted along the z-axis.
- the triplots enable identification of differences in patterns of skin and lung tissue resident memory T (Trm) cells and show the following main results.
- CXCR4 negative or low-expressing population of cells in bins with CD103 high-expressing cells and CD69 low-/ intermediate expressing cells (CXCR3high) in the lung but not in skin tissue.
- Trm skin > lung
- Trm skin ⁇ lung
- No-Trm skin ⁇ lung
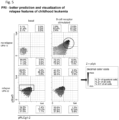
- Fig. 7 illustrates the PRI machine learning approach with a data set provided by Spitzer et al..
- Data processing of a given data set is the most important part of machine learning to create valuable features. It is called feature engineering (FE).
- FE in the method according to the invention uses and combines processes such as binning, variable transformation, and in particular combinatorial parameter extraction of three or more markers. All generated features are stored in a single table (each sample in one row with each column as an input feature) for the machine learning approach.
- Measurement data acquired from cells falling into a specific bin are captured and displayed if a minimum number of five cells is reached. This number can be user defined, and might be higher or lower for other instances.
- the number of cells in the bins are displayed in grey scale: low values are represented by grey, median values by darker grey and high values by black.
- the grid of bins can be extended with a statistical information such as cell density, standard deviation and relative standard error of the means, and other information about the third marker Z for each bin by the calculation of, for example, MSI, MSI(+) and frequency of marker Z+. Every cell having said marker is referred to Z+.
- this bin scaffold is used for further investigation.
- Fig.7 panel B Further feature engineering from bin plots
- FR feature ranking
- the range of the bins in a bin plot (here: MSI) is evenly divided into four rectangular sections.
- MSI range of the bin values in these bin plot sections.
- the feature table here: absolute range.
- values of section S1 are much less informative in this study because these areas contain double negative cells (X-Y-) and background signals from other markers, and are consequently filtered out.
- the feature table construction is similar to the bin plot matrix calculation.
- Fig. 7 panel C Section information as input variables in machine learning model
- Fig. 7 panel C shows an overview of the method according to the invention resulting in the final collected features which are highly differentiating between both groups (effective and ineffective treatment).
- the elastic-net regularized logistic regression as the machine learning approach was applied in two consecutive cross validation (CV) runs to tune the regularization parameters alpha and lambda.
- Alpha tunes the algorithm towards either L1 (LASSO) or L2 (ridge) regularizations, and lambda tunes the feature restriction of each CV.
- the error rates (deviances) of these models are determined.
- the tuning of both parameters is processed in two consecutive CVs.
- the folds are resampled and stratified in each CV iteration. In this way, each row is assigned to a random fold with both treatments integrated.
- the algorithm was applied in a nested CV with the final alpha and two additional measurements to evaluate the resulting model and features. 500 iterations were processed.
- the test set consists of only two samples, one representative from each condition. Hence, the test set is very small compared to the likewise small training set of ten samples. Root mean square error (RMSE) is used for this purpose.
- RMSE Root mean square error
- Features from each CV run are only collected if the difference from RMSE of the test and training set is lower than 0.05. This restricts to usage of the features of the model to only those that do not lead to overfitting, and the CV iteration is then termed successful.
- a final restriction is not applied to the model but to the selected features.
Landscapes
- Engineering & Computer Science (AREA)
- Theoretical Computer Science (AREA)
- Physics & Mathematics (AREA)
- General Physics & Mathematics (AREA)
- Evolutionary Computation (AREA)
- Artificial Intelligence (AREA)
- Data Mining & Analysis (AREA)
- Computer Vision & Pattern Recognition (AREA)
- Software Systems (AREA)
- Life Sciences & Earth Sciences (AREA)
- Health & Medical Sciences (AREA)
- General Health & Medical Sciences (AREA)
- General Engineering & Computer Science (AREA)
- Computing Systems (AREA)
- Multimedia (AREA)
- Medical Informatics (AREA)
- Molecular Biology (AREA)
- Biomedical Technology (AREA)
- Evolutionary Biology (AREA)
- Bioinformatics & Cheminformatics (AREA)
- Bioinformatics & Computational Biology (AREA)
- Databases & Information Systems (AREA)
- Mathematical Physics (AREA)
- Chemical & Material Sciences (AREA)
- Computational Linguistics (AREA)
- Biophysics (AREA)
- Probability & Statistics with Applications (AREA)
- Dispersion Chemistry (AREA)
- Analytical Chemistry (AREA)
- Biochemistry (AREA)
- Immunology (AREA)
- Pathology (AREA)
- Human Computer Interaction (AREA)
- Investigating Or Analysing Biological Materials (AREA)
Claims (13)
- Verfahren zum Klassifizieren ausgewählter Markersignale aus zytometrischen Messungen, umfassend eine erste Messung und eine zweite Messung,wobei die erste Messung eine zytometrische Messung umfasst, ermittelt aus einer ersten Probe von N1 Teilchen, und die zweite Messung eine zytometrische Messung umfasst, ermittelt aus einer zweiten Probe von N2 Teilchen, wobei N1 die Anzahl der Teilchen in der ersten Probe ist und N2 die Anzahl der Teilchen in der zweiten Probe ist,wobei jedes Teilchen


 wobei die erste Messung für jedes Teilchen


 das Verfahren umfassend die Schritte:a) Gruppieren der erfassten Intensitäten jedes Markers
 b) Erzeugen mindestens einer zugehörigen Markerfunktion, wie zum Beispiel eines Verhältnisses der Intensitäten, insbesondere eines Verhältnisses der gruppierten Intensitäten, von zwei Markern oder einer Anzahl von Partikeln pro Gruppe eines Markers,c) Erzeugen einer Anzahl von S1 ersten Merkmalssätzen aus der ersten Messung, wobei jeder erste Merkmalssatz eine andere Kombination von zwei gruppierten Marker-Intensitäten und der mindestens einen zugehörigen Markerfunktion und/oder einer dritten Marker-Intensität in Beziehung zueinander setzt,d) Gruppieren der erfassten Intensitäten jedes Markers
 e) Erzeugen mindestens einer zugehörigen Markerfunktion, wie zum Beispiel eines Verhältnisses der Intensitäten, insbesondere eines Verhältnisses der gruppierten Intensitäten, von zwei Markern oder einer Anzahl von Partikeln pro Gruppe eines Markers,f) Erzeugen einer Anzahl von zweiten S2 Merkmalssätzen aus der zweiten Messung, wobei jeder zweite Merkmalssatz eine unterschiedliche Kombination von zwei gruppierten Marker-Intensitäten und der mindestens einen zugehörigen Markerfunktion und/oder einer dritten Marker-Intensität zueinander in Beziehung setzt, wobei jeder erste Merkmalssatz und jeder zweite Merkmalssatz, der die gleiche Kombination von Marker-Intensitäten oder -Funktionen umfasst, ein Paar von Merkmalssätzen bilden, undg) Bereitstellen der Paare von Merkmalssätzen für ein maschinelles Lernverfahren, wobei das maschinelle Lernverfahren mindestens ein ausgewähltes Paar von Merkmalssätzen bestimmt, das die größte Variation zwischen dem ersten und dem zweiten Merkmalssatz aufweist.
- Verfahren gemäß Anspruch 1, dadurch gekennzeichnet, dass jeder Merkmalssatz dem maschinellen Lernverfahren in Form einer grafischen Darstellung zur Verfügung gestellt wird.
- Verfahren gemäß einem der Ansprüche 1 oder 2, dadurch gekennzeichnet, dass vor der zytometrischen Messung eine erste Lösung auf die erste Probe von Teilchen angewendet wird und eine zweite Lösung auf die zweite Probe von Teilchen angewendet wird, wobei die erste Lösung ein Kontrollmedium ist oder die erste Lösung eine umfasst aus: einer ersten stimulierenden Verbindung zur Stimulierung der Teilchen, einer ersten hemmenden Verbindung zur Hemmung der Teilchen oder einer ersten Kombination aus einer ersten stimulierenden und einer ersten hemmenden Verbindung, und wobei die zweite Lösung ein Kontrollmedium ist oder die zweite Lösung eine der folgenden Verbindungen umfasst: eine zweite stimulierende Verbindung zur Stimulierung der Teilchen, eine zweite hemmende Verbindung zur Hemmung der Teilchen oder eine zweite Kombination aus einer zweiten stimulierenden und einer zweiten hemmenden Verbindung.
- Verfahren gemäß einem der Ansprüche 1 bis 3, dadurch gekennzeichnet, dass die erste Probe von Teilchen Teilchen einer ersten Art umfasst und die zweite Probe von Teilchen Teilchen einer zweiten Art umfasst.
- Verfahren gemäß einem der Ansprüche 1 bis 4, dadurch gekennzeichnet, dass das maschinelle Lernverfahren eine ausgewählte Vielzahl von Paaren von Merkmalssätzen bestimmt, wobei jedes Paar von Merkmalssätzen der ausgewählten Vielzahl von Paaren von Merkmalssätzen eine Variation zwischen dem ersten und dem zweiten Merkmalssatz aufweist, die größer ist als ein vordefinierter Schwellenwert.
- Verfahren gemäß einem der Ansprüche 1 bis 5, dadurch gekennzeichnet, dass eine dritte Messung bereitgestellt istwobei die dritte Messung eine zytometrische Messung umfasst, die aus einer dritten Probe von N3 Teilchen gewonnen wurde, wobei N3 die Anzahl der Teilchen in der dritten Probe ist,wobei jedes Teilchen der N3 Teilchen der dritten Probe mit einer Anzahl von L3-Fluoreszenz-, Massen- oder Oligomarkern markiert ist, wobei jeder Fluoreszenz-, Massen- oderOligomarker

 wobei die dritte Messung für jedes Teilchen


 wobei die erfassten Intensitäten jedes Markers
 wobei mindestens eine zugehörige Markerfunktion erzeugt wird,wobei aus der dritten Messung eine Anzahl von S3 dritten Merkmalssätzen erzeugt wird, wobei jeder dritte Merkmalssatz eine andere Kombination von zwei gruppierten Marker-Intensitäten und der mindestens einen zugehörigen Markerfunktion und/oder einer dritten Marker-Intensität in Beziehung zueinander setzt,wobei die dritten Merkmalssätze mit den ersten und/oder den zweiten Merkmalssätzen verglichen werden, undwobei ein Gewichtungsmaß bestimmt wird, das eine Wahrscheinlichkeit dafür angibt, dass Partikel der dritten Probe mit der ersten Probe oder der zweiten Probe assoziiert sind.
- Verfahren gemäß einem der Ansprüche 1 bis 6, dadurch gekennzeichnet, dass das maschinelle Lernverfahren eines der folgenden ist:- einem Naive-Bayes-Klassifizierungsalgorithmus,- einem Kmeans-Clusteralgorithmus,- einem Support-Vektor-Maschinen-Algorithmus,- einer linearen Regression,- einer logistischen Regression,- einem Random Forest,- einem Decision Tree,- einem Nearest-Neighbour-Algorithmus,- einem künstlichen neuronalen Netz.
- Verfahren gemäß einem der Ansprüche 1 bis 7, dadurch gekennzeichnet, dass die grafische Darstellung jedes Merkmalsatzes, insbesondere der in dem mindestens einen ausgewählten Paar von Merkmalsätzen umfassten Merkmalsätze, ein Koordinatensystem mit einer Abszisse und einer Ordinate umfasst, wobei die beiden gruppierten Marker-Intensitäten des Merkmalsatzes entlang der Abszisse und der Ordinate aufgetragen werden und die mindestens eine zugehörige Marker-Funktion und/oder die dritte Marker-Intensität durch eine Farbe gemäß einer vorgegebenen Farbskala oder einen Grauwert gemäß einer vorgegebenen Grauskala dargestellt wird.
- Verfahren gemäß einem der Ansprüche 1 bis 8, dadurch gekennzeichnet, dass auf einem Display mindestens eines der folgenden angezeigt wird:- das mindestens eine ausgewählte Paar von Merkmalssätzen,- die grafischen Darstellungen der in dem mindestens einen ausgewählten Paar von Merkmalsätzen umfassten Merkmalsätze,- die beiden gruppierten Marker-Intensitäten und die mindestens eine zugehörige Markerfunktion und/oder eine dritte Marker-Intensität, die mit dem mindestens einen Paar von Merkmalssätzen assoziiert ist,- die ausgewählte Vielzahl von Paaren von Merkmalssätzen,- einer Vielzahl von graphischen Darstellungen der Merkmalsätze, die in der ausgewählten Vielzahl von Paaren von Merkmalsätzen enthalten sind, und/oder- die zwei gruppierten Marker-Intensitäten und die mindestens eine zugehörige Marker-Funktion und/oder eine dritte Marker-Intensität, die mit der Vielzahl ausgewählter Paare von Merkmalssätzen assoziiert ist.
- Verfahren gemäß einem der Ansprüche 1 bis 9, dadurch gekennzeichnet, dass die Anzahl der L1 Fluoreszenz-, Masse- oder Oligomarker und/oder die Anzahl der L2 Fluoreszenz-, Massen- oder Oligomarker und/oder die Anzahl der L3 Fluoreszenz-, Massen- oder Oligomarker mindestens drei Fluoreszenz-, Massen- oder Oligomarker, insbesondere mindestens zehn Fluoreszenz-, Masse- oder Oligomarker, insbesondere mindestens 20 Fluoreszenz-, Massen- oder Oligomarker, umfasst, insbesondere mindestens 50 Fluoreszenz-, Massen- oder Oligomarker, insbesondere mindestens 100 Fluoreszenz-, Massen- oder Oligomarker.
- Verfahren gemäß einem der Ansprüche 1 bis 10, dadurch gekennzeichnet, dass die vordefinierte erste Anzahl von Gruppen und/oder die vordefinierte zweite Anzahl von Gruppen und/oder die vordefinierte dritte Anzahl von Gruppen mindestens 4, insbesondere mindestens 10, insbesondere mindestens 20, insbesondere mindestens 50, insbesondere mindestens 100, insbesondere mindestens 200, insbesondere mindestens 300, insbesondere mindestens 500 beträgt.
- Verfahren gemäß einem der Ansprüche 1 bis 11, dadurch gekennzeichnet, dass vor Schritt g) jeder erste Merkmalssatz und/oder jeder zweite Merkmalssatz gefiltert wird, insbesondere mittels eines Störfilters.
- Ein Computerprogramm umfassend Instruktionen, die wenn das Programm durch einen Computer ausgeführt wird, den Computer dazu veranlasst die Schritte a)-g) des Verfahrens gemäß Anspruch 1 auszuführen.
Applications Claiming Priority (2)
| Application Number | Priority Date | Filing Date | Title |
|---|---|---|---|
| EP19166801 | 2019-04-02 | ||
| PCT/EP2020/059435 WO2020201443A1 (en) | 2019-04-02 | 2020-04-02 | Cytometry data analysis |
Publications (2)
| Publication Number | Publication Date |
|---|---|
| EP3948652A1 EP3948652A1 (de) | 2022-02-09 |
| EP3948652B1 true EP3948652B1 (de) | 2023-07-19 |
Family
ID=66091944
Family Applications (1)
| Application Number | Title | Priority Date | Filing Date |
|---|---|---|---|
| EP20714259.7A Active EP3948652B1 (de) | 2019-04-02 | 2020-04-02 | Zytometriedatenanalyse |
Country Status (3)
| Country | Link |
|---|---|
| US (1) | US12223753B2 (de) |
| EP (1) | EP3948652B1 (de) |
| WO (1) | WO2020201443A1 (de) |
Families Citing this family (3)
| Publication number | Priority date | Publication date | Assignee | Title |
|---|---|---|---|---|
| JP7663587B2 (ja) * | 2020-01-31 | 2025-04-16 | ベクトン・ディキンソン・アンド・カンパニー | 訓練ゲートを調整してフローサイトメータデータに適応させるための方法およびシステム |
| WO2023118575A1 (en) | 2021-12-23 | 2023-06-29 | Deutsches Rheuma-Forschungszentrum Berlin | Method for determining basophil activation in a sample |
| JP2025536933A (ja) * | 2022-10-17 | 2025-11-12 | ベクトン・ディキンソン・アンド・カンパニー | フィルタ処理層に基づき画像を用いて粒子を分類するための方法、並びに、このための機械学習モデル及びシステム |
Family Cites Families (3)
| Publication number | Priority date | Publication date | Assignee | Title |
|---|---|---|---|---|
| WO2013038224A1 (en) | 2011-09-12 | 2013-03-21 | Perkinelmer Cellular Technologies Germany Gmbh Eesti Filiaal | Methods and apparatus for fast identification of relevant features for classification or regression |
| US9488639B2 (en) | 2013-02-25 | 2016-11-08 | Flagship Biosciences, Inc. | Cell-based tissue analysis |
| US10037874B2 (en) * | 2014-12-03 | 2018-07-31 | Biodesix, Inc. | Early detection of hepatocellular carcinoma in high risk populations using MALDI-TOF mass spectrometry |
-
2020
- 2020-04-02 EP EP20714259.7A patent/EP3948652B1/de active Active
- 2020-04-02 WO PCT/EP2020/059435 patent/WO2020201443A1/en not_active Ceased
- 2020-04-02 US US17/600,131 patent/US12223753B2/en active Active
Also Published As
| Publication number | Publication date |
|---|---|
| US20220207895A1 (en) | 2022-06-30 |
| US12223753B2 (en) | 2025-02-11 |
| WO2020201443A1 (en) | 2020-10-08 |
| EP3948652A1 (de) | 2022-02-09 |
Similar Documents
| Publication | Publication Date | Title |
|---|---|---|
| US11954614B2 (en) | Systems and methods for visualizing a pattern in a dataset | |
| CN113674800B (zh) | 基于单细胞转录组测序数据的细胞聚类方法 | |
| US20180106787A1 (en) | System, method, and article for detecting abnormal cells using multi-dimensional analysis | |
| US12223753B2 (en) | Cytometry data analysis | |
| US11639936B2 (en) | System, method, and article for detecting abnormal cells using multi-dimensional analysis | |
| JPWO2005050479A1 (ja) | 類似パターン検索装置、類似パターン検索方法、類似パターン検索プログラム、および分画分離装置 | |
| Ananth et al. | An Advanced Low-cost Blood Cancer Detection System. | |
| Wang et al. | A rule-based computer scheme for centromere identification and polarity assignment of metaphase chromosomes | |
| Kaddi et al. | Multivariate hypergeometric similarity measure | |
| Chen et al. | Integration of spatial and single-cell data across modalities with weak linkage | |
| Lin et al. | Bayesian mixture models for cytometry data analysis | |
| Candia et al. | Understanding health and disease with multidimensional single-cell methods | |
| CN111383717B (zh) | 一种构建生物信息分析参照数据集的方法及系统 | |
| DeTomaso et al. | Identifying informative gene modules across modalities of single cell genomics | |
| Chang et al. | Multiplexed immunohistochemistry image analysis using sparse coding | |
| EP4605906A1 (de) | Erkennung von anomalien in probenbildern | |
| CN117153261A (zh) | 一种用于识别癌症miRNA标志物的方法 | |
| Nowosad et al. | Information-theoretical approach to measuring landscape complexity | |
| Millard et al. | Integrating spatial transcriptomics count data with Crescendo improves visualization and detection of spatial gene patterns | |
| Hoang et al. | PRI: Re-analysis of a public mass cytometry dataset reveals patterns of effective tumor treatments | |
| Mashford et al. | Superior batch alignment and hyper-dimensional cytometry representations allow ultra-sensitive classification of disease phenotypes | |
| Bombina et al. | scDIG: An R Shiny Application for Interactive Density-Based Gating of Single-Cell Proteomic and Transcriptomic Data | |
| Aybey | Comprehensive characterization of gene expression response to type-I and type-II interferon in healthy and diseased conditions | |
| Casella et al. | Comparative analysis of multiplex microscopy images of human renal biopsy tissue | |
| Ding | Multi-instance learning networks for flow cytometry data analysis |
Legal Events
| Date | Code | Title | Description |
|---|---|---|---|
| STAA | Information on the status of an ep patent application or granted ep patent |
Free format text: STATUS: UNKNOWN |
|
| STAA | Information on the status of an ep patent application or granted ep patent |
Free format text: STATUS: THE INTERNATIONAL PUBLICATION HAS BEEN MADE |
|
| PUAI | Public reference made under article 153(3) epc to a published international application that has entered the european phase |
Free format text: ORIGINAL CODE: 0009012 |
|
| STAA | Information on the status of an ep patent application or granted ep patent |
Free format text: STATUS: REQUEST FOR EXAMINATION WAS MADE |
|
| 17P | Request for examination filed |
Effective date: 20211101 |
|
| AK | Designated contracting states |
Kind code of ref document: A1 Designated state(s): AL AT BE BG CH CY CZ DE DK EE ES FI FR GB GR HR HU IE IS IT LI LT LU LV MC MK MT NL NO PL PT RO RS SE SI SK SM TR |
|
| DAV | Request for validation of the european patent (deleted) | ||
| DAX | Request for extension of the european patent (deleted) | ||
| REG | Reference to a national code |
Ref country code: DE Ref legal event code: R079 Free format text: PREVIOUS MAIN CLASS: G06K0009000000 Ipc: G06F0018000000 Ref country code: DE Ref legal event code: R079 Ref document number: 602020014061 Country of ref document: DE Free format text: PREVIOUS MAIN CLASS: G06K0009000000 Ipc: G06F0018000000 |
|
| GRAP | Despatch of communication of intention to grant a patent |
Free format text: ORIGINAL CODE: EPIDOSNIGR1 |
|
| STAA | Information on the status of an ep patent application or granted ep patent |
Free format text: STATUS: GRANT OF PATENT IS INTENDED |
|
| RIC1 | Information provided on ipc code assigned before grant |
Ipc: G06V 20/69 20220101ALI20230112BHEP Ipc: G06V 10/82 20220101ALI20230112BHEP Ipc: G06F 18/40 20230101ALI20230112BHEP Ipc: G06F 18/2431 20230101ALI20230112BHEP Ipc: G06F 18/2413 20230101ALI20230112BHEP Ipc: G06F 18/2115 20230101ALI20230112BHEP Ipc: G06F 18/00 20230101AFI20230112BHEP |
|
| INTG | Intention to grant announced |
Effective date: 20230131 |
|
| GRAS | Grant fee paid |
Free format text: ORIGINAL CODE: EPIDOSNIGR3 |
|
| GRAA | (expected) grant |
Free format text: ORIGINAL CODE: 0009210 |
|
| STAA | Information on the status of an ep patent application or granted ep patent |
Free format text: STATUS: THE PATENT HAS BEEN GRANTED |
|
| AK | Designated contracting states |
Kind code of ref document: B1 Designated state(s): AL AT BE BG CH CY CZ DE DK EE ES FI FR GB GR HR HU IE IS IT LI LT LU LV MC MK MT NL NO PL PT RO RS SE SI SK SM TR |
|
| REG | Reference to a national code |
Ref country code: GB Ref legal event code: FG4D |
|
| REG | Reference to a national code |
Ref country code: CH Ref legal event code: EP |
|
| P01 | Opt-out of the competence of the unified patent court (upc) registered |
Effective date: 20230629 |
|
| REG | Reference to a national code |
Ref country code: DE Ref legal event code: R096 Ref document number: 602020014061 Country of ref document: DE |
|
| REG | Reference to a national code |
Ref country code: IE Ref legal event code: FG4D |
|
| REG | Reference to a national code |
Ref country code: LT Ref legal event code: MG9D |
|
| REG | Reference to a national code |
Ref country code: NL Ref legal event code: MP Effective date: 20230719 |
|
| REG | Reference to a national code |
Ref country code: AT Ref legal event code: MK05 Ref document number: 1590181 Country of ref document: AT Kind code of ref document: T Effective date: 20230719 |
|
| PG25 | Lapsed in a contracting state [announced via postgrant information from national office to epo] |
Ref country code: NL Free format text: LAPSE BECAUSE OF FAILURE TO SUBMIT A TRANSLATION OF THE DESCRIPTION OR TO PAY THE FEE WITHIN THE PRESCRIBED TIME-LIMIT Effective date: 20230719 |
|
| PG25 | Lapsed in a contracting state [announced via postgrant information from national office to epo] |
Ref country code: GR Free format text: LAPSE BECAUSE OF FAILURE TO SUBMIT A TRANSLATION OF THE DESCRIPTION OR TO PAY THE FEE WITHIN THE PRESCRIBED TIME-LIMIT Effective date: 20231020 |
|
| PG25 | Lapsed in a contracting state [announced via postgrant information from national office to epo] |
Ref country code: IS Free format text: LAPSE BECAUSE OF FAILURE TO SUBMIT A TRANSLATION OF THE DESCRIPTION OR TO PAY THE FEE WITHIN THE PRESCRIBED TIME-LIMIT Effective date: 20231119 |
|
| PG25 | Lapsed in a contracting state [announced via postgrant information from national office to epo] |
Ref country code: SE Free format text: LAPSE BECAUSE OF FAILURE TO SUBMIT A TRANSLATION OF THE DESCRIPTION OR TO PAY THE FEE WITHIN THE PRESCRIBED TIME-LIMIT Effective date: 20230719 Ref country code: RS Free format text: LAPSE BECAUSE OF FAILURE TO SUBMIT A TRANSLATION OF THE DESCRIPTION OR TO PAY THE FEE WITHIN THE PRESCRIBED TIME-LIMIT Effective date: 20230719 Ref country code: PT Free format text: LAPSE BECAUSE OF FAILURE TO SUBMIT A TRANSLATION OF THE DESCRIPTION OR TO PAY THE FEE WITHIN THE PRESCRIBED TIME-LIMIT Effective date: 20231120 Ref country code: NO Free format text: LAPSE BECAUSE OF FAILURE TO SUBMIT A TRANSLATION OF THE DESCRIPTION OR TO PAY THE FEE WITHIN THE PRESCRIBED TIME-LIMIT Effective date: 20231019 Ref country code: LV Free format text: LAPSE BECAUSE OF FAILURE TO SUBMIT A TRANSLATION OF THE DESCRIPTION OR TO PAY THE FEE WITHIN THE PRESCRIBED TIME-LIMIT Effective date: 20230719 Ref country code: LT Free format text: LAPSE BECAUSE OF FAILURE TO SUBMIT A TRANSLATION OF THE DESCRIPTION OR TO PAY THE FEE WITHIN THE PRESCRIBED TIME-LIMIT Effective date: 20230719 Ref country code: IS Free format text: LAPSE BECAUSE OF FAILURE TO SUBMIT A TRANSLATION OF THE DESCRIPTION OR TO PAY THE FEE WITHIN THE PRESCRIBED TIME-LIMIT Effective date: 20231119 Ref country code: HR Free format text: LAPSE BECAUSE OF FAILURE TO SUBMIT A TRANSLATION OF THE DESCRIPTION OR TO PAY THE FEE WITHIN THE PRESCRIBED TIME-LIMIT Effective date: 20230719 Ref country code: GR Free format text: LAPSE BECAUSE OF FAILURE TO SUBMIT A TRANSLATION OF THE DESCRIPTION OR TO PAY THE FEE WITHIN THE PRESCRIBED TIME-LIMIT Effective date: 20231020 Ref country code: FI Free format text: LAPSE BECAUSE OF FAILURE TO SUBMIT A TRANSLATION OF THE DESCRIPTION OR TO PAY THE FEE WITHIN THE PRESCRIBED TIME-LIMIT Effective date: 20230719 Ref country code: AT Free format text: LAPSE BECAUSE OF FAILURE TO SUBMIT A TRANSLATION OF THE DESCRIPTION OR TO PAY THE FEE WITHIN THE PRESCRIBED TIME-LIMIT Effective date: 20230719 |
|
| PG25 | Lapsed in a contracting state [announced via postgrant information from national office to epo] |
Ref country code: PL Free format text: LAPSE BECAUSE OF FAILURE TO SUBMIT A TRANSLATION OF THE DESCRIPTION OR TO PAY THE FEE WITHIN THE PRESCRIBED TIME-LIMIT Effective date: 20230719 |
|
| REG | Reference to a national code |
Ref country code: DE Ref legal event code: R097 Ref document number: 602020014061 Country of ref document: DE |
|
| PG25 | Lapsed in a contracting state [announced via postgrant information from national office to epo] |
Ref country code: ES Free format text: LAPSE BECAUSE OF FAILURE TO SUBMIT A TRANSLATION OF THE DESCRIPTION OR TO PAY THE FEE WITHIN THE PRESCRIBED TIME-LIMIT Effective date: 20230719 |
|
| PG25 | Lapsed in a contracting state [announced via postgrant information from national office to epo] |
Ref country code: SM Free format text: LAPSE BECAUSE OF FAILURE TO SUBMIT A TRANSLATION OF THE DESCRIPTION OR TO PAY THE FEE WITHIN THE PRESCRIBED TIME-LIMIT Effective date: 20230719 Ref country code: RO Free format text: LAPSE BECAUSE OF FAILURE TO SUBMIT A TRANSLATION OF THE DESCRIPTION OR TO PAY THE FEE WITHIN THE PRESCRIBED TIME-LIMIT Effective date: 20230719 Ref country code: ES Free format text: LAPSE BECAUSE OF FAILURE TO SUBMIT A TRANSLATION OF THE DESCRIPTION OR TO PAY THE FEE WITHIN THE PRESCRIBED TIME-LIMIT Effective date: 20230719 Ref country code: EE Free format text: LAPSE BECAUSE OF FAILURE TO SUBMIT A TRANSLATION OF THE DESCRIPTION OR TO PAY THE FEE WITHIN THE PRESCRIBED TIME-LIMIT Effective date: 20230719 Ref country code: DK Free format text: LAPSE BECAUSE OF FAILURE TO SUBMIT A TRANSLATION OF THE DESCRIPTION OR TO PAY THE FEE WITHIN THE PRESCRIBED TIME-LIMIT Effective date: 20230719 Ref country code: CZ Free format text: LAPSE BECAUSE OF FAILURE TO SUBMIT A TRANSLATION OF THE DESCRIPTION OR TO PAY THE FEE WITHIN THE PRESCRIBED TIME-LIMIT Effective date: 20230719 Ref country code: SK Free format text: LAPSE BECAUSE OF FAILURE TO SUBMIT A TRANSLATION OF THE DESCRIPTION OR TO PAY THE FEE WITHIN THE PRESCRIBED TIME-LIMIT Effective date: 20230719 |
|
| PLBE | No opposition filed within time limit |
Free format text: ORIGINAL CODE: 0009261 |
|
| STAA | Information on the status of an ep patent application or granted ep patent |
Free format text: STATUS: NO OPPOSITION FILED WITHIN TIME LIMIT |
|
| PG25 | Lapsed in a contracting state [announced via postgrant information from national office to epo] |
Ref country code: IT Free format text: LAPSE BECAUSE OF FAILURE TO SUBMIT A TRANSLATION OF THE DESCRIPTION OR TO PAY THE FEE WITHIN THE PRESCRIBED TIME-LIMIT Effective date: 20230719 |
|
| 26N | No opposition filed |
Effective date: 20240422 |
|
| PG25 | Lapsed in a contracting state [announced via postgrant information from national office to epo] |
Ref country code: SI Free format text: LAPSE BECAUSE OF FAILURE TO SUBMIT A TRANSLATION OF THE DESCRIPTION OR TO PAY THE FEE WITHIN THE PRESCRIBED TIME-LIMIT Effective date: 20230719 |
|
| PG25 | Lapsed in a contracting state [announced via postgrant information from national office to epo] |
Ref country code: BG Free format text: LAPSE BECAUSE OF FAILURE TO SUBMIT A TRANSLATION OF THE DESCRIPTION OR TO PAY THE FEE WITHIN THE PRESCRIBED TIME-LIMIT Effective date: 20230719 |
|
| PG25 | Lapsed in a contracting state [announced via postgrant information from national office to epo] |
Ref country code: MC Free format text: LAPSE BECAUSE OF FAILURE TO SUBMIT A TRANSLATION OF THE DESCRIPTION OR TO PAY THE FEE WITHIN THE PRESCRIBED TIME-LIMIT Effective date: 20230719 |
|
| PG25 | Lapsed in a contracting state [announced via postgrant information from national office to epo] |
Ref country code: MC Free format text: LAPSE BECAUSE OF FAILURE TO SUBMIT A TRANSLATION OF THE DESCRIPTION OR TO PAY THE FEE WITHIN THE PRESCRIBED TIME-LIMIT Effective date: 20230719 Ref country code: BG Free format text: LAPSE BECAUSE OF FAILURE TO SUBMIT A TRANSLATION OF THE DESCRIPTION OR TO PAY THE FEE WITHIN THE PRESCRIBED TIME-LIMIT Effective date: 20230719 |
|
| PG25 | Lapsed in a contracting state [announced via postgrant information from national office to epo] |
Ref country code: LU Free format text: LAPSE BECAUSE OF NON-PAYMENT OF DUE FEES Effective date: 20240402 |
|
| REG | Reference to a national code |
Ref country code: BE Ref legal event code: MM Effective date: 20240430 |
|
| PG25 | Lapsed in a contracting state [announced via postgrant information from national office to epo] |
Ref country code: LU Free format text: LAPSE BECAUSE OF NON-PAYMENT OF DUE FEES Effective date: 20240402 |
|
| PG25 | Lapsed in a contracting state [announced via postgrant information from national office to epo] |
Ref country code: BE Free format text: LAPSE BECAUSE OF NON-PAYMENT OF DUE FEES Effective date: 20240430 |
|
| PG25 | Lapsed in a contracting state [announced via postgrant information from national office to epo] |
Ref country code: BE Free format text: LAPSE BECAUSE OF NON-PAYMENT OF DUE FEES Effective date: 20240430 |
|
| PG25 | Lapsed in a contracting state [announced via postgrant information from national office to epo] |
Ref country code: IE Free format text: LAPSE BECAUSE OF NON-PAYMENT OF DUE FEES Effective date: 20240402 |
|
| PG25 | Lapsed in a contracting state [announced via postgrant information from national office to epo] |
Ref country code: CY Free format text: LAPSE BECAUSE OF FAILURE TO SUBMIT A TRANSLATION OF THE DESCRIPTION OR TO PAY THE FEE WITHIN THE PRESCRIBED TIME-LIMIT; INVALID AB INITIO Effective date: 20200402 |
|
| PG25 | Lapsed in a contracting state [announced via postgrant information from national office to epo] |
Ref country code: HU Free format text: LAPSE BECAUSE OF FAILURE TO SUBMIT A TRANSLATION OF THE DESCRIPTION OR TO PAY THE FEE WITHIN THE PRESCRIBED TIME-LIMIT; INVALID AB INITIO Effective date: 20200402 |
|
| PG25 | Lapsed in a contracting state [announced via postgrant information from national office to epo] |
Ref country code: TR Free format text: LAPSE BECAUSE OF FAILURE TO SUBMIT A TRANSLATION OF THE DESCRIPTION OR TO PAY THE FEE WITHIN THE PRESCRIBED TIME-LIMIT Effective date: 20230719 |
|
| PGFP | Annual fee paid to national office [announced via postgrant information from national office to epo] |
Ref country code: GB Payment date: 20260324 Year of fee payment: 7 |
|
| REG | Reference to a national code |
Ref country code: CH Ref legal event code: U11 Free format text: ST27 STATUS EVENT CODE: U-0-0-U10-U11 (AS PROVIDED BY THE NATIONAL OFFICE) Effective date: 20260501 |
|
| PGFP | Annual fee paid to national office [announced via postgrant information from national office to epo] |
Ref country code: DE Payment date: 20260420 Year of fee payment: 7 |
|
| PGFP | Annual fee paid to national office [announced via postgrant information from national office to epo] |
Ref country code: CH Payment date: 20260501 Year of fee payment: 7 |
|
| PGFP | Annual fee paid to national office [announced via postgrant information from national office to epo] |
Ref country code: FR Payment date: 20260422 Year of fee payment: 7 |