EP3947598B1 - Tracer composition - Google Patents
Tracer composition Download PDFInfo
- Publication number
- EP3947598B1 EP3947598B1 EP20716554.9A EP20716554A EP3947598B1 EP 3947598 B1 EP3947598 B1 EP 3947598B1 EP 20716554 A EP20716554 A EP 20716554A EP 3947598 B1 EP3947598 B1 EP 3947598B1
- Authority
- EP
- European Patent Office
- Prior art keywords
- wavelength
- fluorescence
- image
- salt
- tracer
- Prior art date
- Legal status (The legal status is an assumption and is not a legal conclusion. Google has not performed a legal analysis and makes no representation as to the accuracy of the status listed.)
- Active
Links
Images






Classifications
-
- C—CHEMISTRY; METALLURGY
- C09—DYES; PAINTS; POLISHES; NATURAL RESINS; ADHESIVES; COMPOSITIONS NOT OTHERWISE PROVIDED FOR; APPLICATIONS OF MATERIALS NOT OTHERWISE PROVIDED FOR
- C09K—MATERIALS FOR MISCELLANEOUS APPLICATIONS, NOT PROVIDED FOR ELSEWHERE
- C09K11/00—Luminescent materials, e.g. electroluminescent or chemiluminescent
- C09K11/06—Luminescent materials, e.g. electroluminescent or chemiluminescent containing organic luminescent materials
-
- A—HUMAN NECESSITIES
- A01—AGRICULTURE; FORESTRY; ANIMAL HUSBANDRY; HUNTING; TRAPPING; FISHING
- A01N—PRESERVATION OF BODIES OF HUMANS OR ANIMALS OR PLANTS OR PARTS THEREOF; BIOCIDES, e.g. AS DISINFECTANTS, AS PESTICIDES OR AS HERBICIDES; PEST REPELLANTS OR ATTRACTANTS; PLANT GROWTH REGULATORS
- A01N25/00—Biocides, pest repellants or attractants, or plant growth regulators, characterised by their forms, or by their non-active ingredients or by their methods of application, e.g. seed treatment or sequential application; Substances for reducing the noxious effect of the active ingredients to organisms other than pests
-
- A—HUMAN NECESSITIES
- A01—AGRICULTURE; FORESTRY; ANIMAL HUSBANDRY; HUNTING; TRAPPING; FISHING
- A01N—PRESERVATION OF BODIES OF HUMANS OR ANIMALS OR PLANTS OR PARTS THEREOF; BIOCIDES, e.g. AS DISINFECTANTS, AS PESTICIDES OR AS HERBICIDES; PEST REPELLANTS OR ATTRACTANTS; PLANT GROWTH REGULATORS
- A01N25/00—Biocides, pest repellants or attractants, or plant growth regulators, characterised by their forms, or by their non-active ingredients or by their methods of application, e.g. seed treatment or sequential application; Substances for reducing the noxious effect of the active ingredients to organisms other than pests
- A01N25/02—Biocides, pest repellants or attractants, or plant growth regulators, characterised by their forms, or by their non-active ingredients or by their methods of application, e.g. seed treatment or sequential application; Substances for reducing the noxious effect of the active ingredients to organisms other than pests containing liquids as carriers, diluents or solvents
- A01N25/04—Dispersions, emulsions, suspoemulsions, suspension concentrates or gels
-
- C—CHEMISTRY; METALLURGY
- C09—DYES; PAINTS; POLISHES; NATURAL RESINS; ADHESIVES; COMPOSITIONS NOT OTHERWISE PROVIDED FOR; APPLICATIONS OF MATERIALS NOT OTHERWISE PROVIDED FOR
- C09K—MATERIALS FOR MISCELLANEOUS APPLICATIONS, NOT PROVIDED FOR ELSEWHERE
- C09K11/00—Luminescent materials, e.g. electroluminescent or chemiluminescent
- C09K11/02—Use of particular materials as binders, particle coatings or suspension media therefor
- C09K11/025—Use of particular materials as binders, particle coatings or suspension media therefor non-luminescent particle coatings or suspension media
-
- G—PHYSICS
- G01—MEASURING; TESTING
- G01N—INVESTIGATING OR ANALYSING MATERIALS BY DETERMINING THEIR CHEMICAL OR PHYSICAL PROPERTIES
- G01N21/00—Investigating or analysing materials by the use of optical means, i.e. using sub-millimetre waves, infrared, visible or ultraviolet light
- G01N21/62—Systems in which the material investigated is excited whereby it emits light or causes a change in wavelength of the incident light
- G01N21/63—Systems in which the material investigated is excited whereby it emits light or causes a change in wavelength of the incident light optically excited
- G01N21/64—Fluorescence; Phosphorescence
- G01N21/6428—Measuring fluorescence of fluorescent products of reactions or of fluorochrome labelled reactive substances, e.g. measuring quenching effects, using measuring "optrodes"
-
- C—CHEMISTRY; METALLURGY
- C09—DYES; PAINTS; POLISHES; NATURAL RESINS; ADHESIVES; COMPOSITIONS NOT OTHERWISE PROVIDED FOR; APPLICATIONS OF MATERIALS NOT OTHERWISE PROVIDED FOR
- C09K—MATERIALS FOR MISCELLANEOUS APPLICATIONS, NOT PROVIDED FOR ELSEWHERE
- C09K2211/00—Chemical nature of organic luminescent or tenebrescent compounds
- C09K2211/10—Non-macromolecular compounds
- C09K2211/1018—Heterocyclic compounds
-
- G—PHYSICS
- G01—MEASURING; TESTING
- G01N—INVESTIGATING OR ANALYSING MATERIALS BY DETERMINING THEIR CHEMICAL OR PHYSICAL PROPERTIES
- G01N21/00—Investigating or analysing materials by the use of optical means, i.e. using sub-millimetre waves, infrared, visible or ultraviolet light
- G01N21/62—Systems in which the material investigated is excited whereby it emits light or causes a change in wavelength of the incident light
- G01N21/63—Systems in which the material investigated is excited whereby it emits light or causes a change in wavelength of the incident light optically excited
- G01N21/64—Fluorescence; Phosphorescence
- G01N21/6428—Measuring fluorescence of fluorescent products of reactions or of fluorochrome labelled reactive substances, e.g. measuring quenching effects, using measuring "optrodes"
- G01N2021/6439—Measuring fluorescence of fluorescent products of reactions or of fluorochrome labelled reactive substances, e.g. measuring quenching effects, using measuring "optrodes" with indicators, stains, dyes, tags, labels, marks
Definitions
- the invention relates to a food safe tracer composition, and more specifically to a food safe tracer composition which may be used to determine spray deposition comprising the composition.
- the invention also extends to a method of assessing deposition of a spray using the tracer composition.
- Sprays are often used in agriculture to treat the surface of plants and soil with pesticides, feeds and other substances.
- a minimum deposit on the surface is required to be effective. Accordingly, to ensure that the minimum deposit has been obtained, methods have been developed to detect and analyse the extent and thoroughness of spray deposits.
- One way of determining coverage is to use water sensitive papers which are distributed amongst crops and which indicate where they have been wetted by the spray.
- This method has a number of limitations. In particular, the technique is broadly qualitative and gives little indication of the amount of spray on crop leaves. Furthermore, the papers are not deemed to be realistic proxy for leaves.
- the method requires the water sensitive paper to be dispersed within the crops. In practice, this requires the paper to either be attached directly to the crops or on a supporting structure. This would normally require the paper to be attached by hand, which is time consuming. Finally, the use of water sensitive papers requires completely dry conditions, which drastically effects when they may be used.
- Detectable tracers have been developed for crop sprays where the spray includes a visual or fluorescent tracer.
- a visual tracer is kaolin, which can be added to the spray and leaves a white residue on the surface of the leaves when the spray dries. Spray coverage can then be visually inspected. Alternatively, when fluorescent tracers are added to the spray the coverage can then be assessed in the dark with a UV light. While these methods offer improvements over water sensitive papers, they are still broadly qualitative. Furthermore, the tracers used often are not food safe, which may require the crop to be destroyed.
- Another way of assessing crop spray coverage is through laboratory testing.
- This technique requires spraying crops or artificial targets with a detectable substance, e.g. a detectable pesticide, a colourant, or a fluorescent marker.
- the deposits can be photographed to allow the cover to be analysed. After that the deposits can be washed off and quantified to determine the amount which has been deposited.
- This allows various spray techniques to be tested and modified to improve coverage.
- this method is expensive and time consuming.
- artificial targets may be an unrealistic proxy for leaves whereas any crops used by the laboratory for analysis may need to be destroyed after testing.
- Csorba et al. discloses a study that examines spray retention of fluorescein on young wheat and rape plants using a variety of nozzles delivering ca 75 l/ha as fine to coarse sprays, compares their drift potential and attempts a correlation with the spray spectra produced ( C Csorba, E C Hislop, N M Western. Options for reduced volume "coarse” droplet spraying. Brighton crop protection conference - Weeds - 1995 ).
- the present invention comes from the inventors' work in attempting to overcome the problems associated with the prior art.
- a food safe tracer composition comprising:
- the tracer composition can be used to assess spray deposition.
- the term 'spray deposition' may be understood to be a measure of spray coverage over an area, the volume of liquid comprising the spray deposits, the size of spray deposits on the surface and/or distribution of deposits over the area.
- the tracer composition can be added to a spray tank with a plant protection product (PPP), which may be applied to a plant or other structure or substrate.
- PPP plant protection product
- the term Plant Protective Product (PPP) may refer to any substance that may be applied to a plant or other structure or substrate in agriculture.
- the PPP may comprise a herbicide, an insecticide, an acaricide, a nematicide, a molluscicide, a bactericide, a fungicide, an adjuvant, a fertiliser, a hormone or an elicitor.
- the tracer composition allows the percentage coverage and the amount of the PPP which has been deposited on the plant to be ascertained.
- the fluorescent molecule emits a photon with a wavelength between 450 and 650 nm, more preferably between 475 and 625 nm, and most preferably between 500 and 600 nm.
- chlorophyll A and chlorophyll B do not absorb or emit photons within this range.
- the fluorescent molecule fluoresces when exposed to an excitation wavelength between 150 and 700 nm, more preferably between 300 and 650 nm or between 450 and 600 nm, and most preferably between 460 and 550 nm or between 465 and 500 nm.
- the tracer composition may be used on crops.
- the fluorescent molecule is a compound of formula (I): , wherein each of R 1 to R 8 is independently hydrogen or a C 1-5 alkyl, or a salt and/or solvate thereof.
- the fluorescent molecule is a compound of formula (Ia): , wherein each of R 1 to R 8 is as defined above, or a salt and/or solvate thereof.
- a C 1-5 alkyl may be a methyl, ethyl, propyl, butyl or pentyl.
- R 1 to R 8 may each independently be hydrogen, methyl or ethyl.
- R 1 is hydrogen
- R 2 is methyl or ethyl, and most preferably methyl.
- R 3 is methyl or ethyl, and most preferably methyl.
- R 4 is hydrogen
- R 5 is hydrogen
- R 6 is hydrogen
- R 7 is hydrogen
- R 8 is hydrogen
- the fluorescent molecule may be riboflavin 5'-monophosphate or a salt and/or solvate thereof.
- the salt may be a lithium salt, a sodium salt, a potassium salt, a rubidium salt, a beryllium salt, a magnesium salt, a calcium salt or a strontium salt.
- the fluorescent molecule is riboflavin 5'-monophosphate sodium salt or a solvate thereof.
- the fluorescent molecule is riboflavin 5'-monophosphate sodium salt dihydrate.
- the tracer composition may comprise the florescent molecule at a concentration of at least 0.0001 wt%, more preferably at least 0.001 wt%, at least 0.005 wt% or at least 0.01 wt%, and most preferably at least 0.02 wt%, at least 0.04 wt%, at least 0.06 wt% or at least 0.08 wt%.
- the tracer composition may comprise the florescent molecule at a concentration of less than 50 wt%, more preferably less than 20 wt%, less than 10 wt%, less than 5 wt%, less than 2 wt% or less than 1 wt%, and most preferably less than 0.8 wt%, less than 0.6 wt%, less than 0.4 wt% or less than 0.2 wt%.
- the tracer composition may comprise the florescent molecule at a concentration between 0.0001 and 50 wt%, more preferably between 0.001 and 50 wt%, or between 0.005 and 10 wt% or between 0.01 and 1 wt%, and most preferably between 0.02 and 0.8 wt%, between 0.04 and 0.6 wt%, between 0.06 and 0.4 wt% or between 0.08 and 0.2 wt%.
- the tracer composition may comprise the gelling agent at a concentration of at least 5 wt%, more preferably at least 10 wt%, at least 20 wt%, at least 30 wt%, at least 40 wt% or at least 50 wt%, and most preferably at a concentration of at least 60 wt%, at least 65 wt% or at least 67.5 wt%.
- the tracer composition may comprise the gelling agent at a concentration of less than 99 wt%, preferably less than 95 wt%, less than 90 wt%, less than 85 wt% or less than 80 wt%, and most preferably less than 77.5 wt%, less than 75 wt% or less than 72.5 wt%.
- the tracer composition may comprise the gelling agent at a concentration of between 10 and 99 wt%, more preferably between 20 and 95 wt%, between 30 and 90 wt%, between 40 and 85 wt% or between 50 and 80 wt%, and most preferably at a concentration between 60 and 77.5 wt%, between 65 and 75 wt% or between 67.5 and 72.5 wt%.
- the gelling agent may comprise a saccharide, and is preferably a sugar or a polysaccharide, or a salt and/or solvate thereof.
- the sugar may comprise a disaccharide, or a salt and/or solvate thereof.
- the disaccharide may be sucrose, lactulose, lactose, maltose, trehalose, cellobiose, chitobiose, or a salt and/or solvate thereof.
- the disaccharide is sucrose, or a salt and/or solvate thereof.
- the polysaccharide may be linear or cyclic. Accordingly, the polysaccharide may be a cyclodextrin, agarose or gellan gum.
- the cyclodextrin may be ⁇ -cyclodextrin, ⁇ -cyclodextrin or ⁇ -cyclodextrin.
- the gelling agent may comprise agar. It may be appreciated that agar comprises agarose and agaropectin. It may be appreciated that agaropectin comprises D-glucuronic acid and pyruvic acid.
- the tracer composition may comprise the saccharide at a concentration of at least 5 wt%, more preferably at least 10 wt%, at least 20 wt% or at least 30 wt%, and most preferably at a concentration of at least 32.5 wt%, at least 35 wt% or at least 37.5 wt%.
- the tracer composition may comprising the saccharide at a concentration of less than 90 wt%, more preferably less than 80 wt%, less than 70 wt% or less than 60 wt%, and most preferably less than 50 wt%, less than 45 wt% or less than 42.5 wt%.
- the tracer composition may comprising the saccharide at a concentration of between 5 and 90 wt%, more preferably between 10 and 80 wt%, between 20 and 70 wt% or between 30 and 60 wt%, and most preferably at a concentration between 32.5 and 50 wt%, between 35 and 45 wt% or between 37.5 and 42.5 wt%.
- the gelling agent may comprise an alcohol, and preferably a glycol.
- the glycol may be a polyglycol.
- the glyocol may be polyethylene glycol (PEG).
- the gelling agent comprises a C 1-10 alcohol or glycol, or a salt and/or solvate thereof.
- the gelling agent comprises a C 1-10 glycol, or a salt and/or solvate thereof.
- the C 1-10 glycol may comprise between 2 and 10 hydroxyl groups. More preferably, the gelling agent comprises a C 1-5 glycol.
- the C 1-5 glycol may comprise between 2 and 5 hydroxyl groups.
- the gelling agent comprises a C 2-4 glycol.
- the C 2-4 glycol may comprise between 2 and 4 hydroxyl groups.
- the gelling agent comprises glycerol, or a salt and/or solvate thereof.
- the tracer composition may comprise the alcohol at a concentration of at least 5 wt%, more preferably at least 10 wt%, at least 15 wt% or at least 20 wt%, and most preferably at a concentration of at least 22.5 wt%, at least 25 wt%, at least 27.5 wt% or at least 30 wt%.
- the tracer composition may comprising the alcohol at a concentration of less than 90 wt%, more preferably less than 70 wt%, less than 60 wt% or less than 50 wt%, and most preferably less than 40 wt%, less than 37.5 wt%, less than 35 wt% or less than 32.5 wt%.
- the tracer composition may comprising the alcohol at a concentration of between 5 and 90 wt%, more preferably between 10 and 70 wt%, between 15 and 60 wt% or between 20 and 50 wt%, and most preferably at a concentration between 22.5 and 40 wt%, between 25 and 37.5 wt%, between 27.5 and 35 wt% or between 30 and 32.5 wt%.
- the gelling agent comprises a sugar and a C 1-10 glycol.
- the inventors have found that the sugar and the polyol in combination synergistically improve fluorescence of the fluorescent molecule.
- the weight ratio of the saccharide to the alcohol may be between 1:10 and 10:1, more preferably between 5:1 and 1:5, between 1:4 and 4:1, between 1:3 and 3:1 or between 1:2 and 2:1, most preferably between 1.75:1 and 1:1, between 1.5:1 and 1.1:1 or between 1.3:1 and 1.2:1.
- the composition comprises a stabilising agent which improves the photostability of the fluorescent molecule.
- the stabilising agent may improve the photostability of the fluorescent molecule by absorbing photons. It may be appreciated that the wavelength of the photons absorbed by the stabilising agent may vary depending upon the fluorescent molecule. In one embodiment, the stabilising agent may absorb photons with a wavelength between 100 and 500 nm, more preferably between 150 and 400 nm or between 175 and 350 nm, and most preferably between 200 and 325 nm. It may be appreciated that light with a wavelength of between 100 and 280 nm, otherwise known as ultraviolet C, is absorbed by the ozone layer and atmosphere. Accordingly, photons with these wavelengths are not present in natural light at ground level.
- the stabilising agent may absorb photons with a wavelength between 280 and 500 nm, more preferably between 280 and 470 nm or between 280 and 400 nm, and most preferably between 280 and 350 nm.
- the stabilising agent protects the fluorescent molecule from these wavelengths of light.
- the stabilising agent may be a free radical scavenger.
- the stabilising agent protects the fluorescent molecule from free radicals.
- the stabilising agent may comprise thiosulfuric acid, ascorbic acid, ⁇ -carotene, ethylenediaminetetraacetic acid (EDTA), thiourea, methionine, thiosulfuric acid, butylated hydroxytoluene (BHT), or a salt and/or solvate thereof.
- the methionine may be present in a racemic mixture. Alternatively, the methionine may comprise D-methionine or L-methionine.
- the salt may be a lithium salt, a sodium salt, a potassium salt, a rubidium salt, a beryllium salt, a magnesium salt, a calcium salt or a strontium salt.
- the stabilising agent comprises a compound of formula (II): , wherein each of R 9 to R 12 is independently hydrogen or a C 1-5 alkyl, or a salt and/or solvate thereof.
- the stabilising agent comprises a compound of formula (IIa): , wherein each of R 9 to R 12 is as defined above, or a salt and/or solvate thereof.
- each of R 9 to R 12 is hydrogen.
- the stabilising agent may comprise ascorbic acid, and more preferably L-ascorbic acid, or a salt and/or solvate thereof.
- the tracer composition may comprise the stabilising agent at a concentration of at least 0.01 wt%, more preferably at least 0.1 wt%, at least 0. 5 wt%, at least 1 wt% or at least 1.5 wt%, and most preferably at a concentration of at least 2 wt%, at least 2.5 wt%, at least 3 wt% or at least 3.5 wt%.
- the tracer composition may comprising the stabilising agent at a concentration of less than 90 wt%, more preferably less than 50 wt%, less than 30 wt% or less than 10 wt%, and most preferably less than 7.5 wt%, less than 5 wt%, less than 4.5 wt% or less than 4 wt%.
- the tracer composition may comprising the stabilising agent at a concentration of between 0.01 and 90 wt%, more preferably between 0.1 and 50 wt%, between 0.5 and 30 wt% or between 1 and 10 wt%, and most preferably at a concentration between 2 and 7.5 wt%, between 2.5 and 5 wt%, between 3 and 4.5 wt% or between 3.5 and 4 wt%.
- the tracer composition may comprise a solvent.
- the solvent may comprise water or an organic solvent, such as an alcohol.
- the alcohol may be ethanol.
- the solvent may comprise organic solvents, such as an alcohol, to increase the solubility of components within the composition.
- the solvent is water, and more preferably de-ionised water.
- water is the same solvent used in the majority of commercially available plant protection products (PPPs).
- the tracer composition may comprise the solvent at a concentration of at a concentration of at least 1 wt%, more preferably at least 5 wt%, at least 10 wt% or at least 15 wt%, and most preferably at a concentration of at least 20 wt%, at least 22 wt%, at least 23 wt% or at least 24 wt%.
- the tracer composition may comprising the solvent at a concentration of less than 90 wt%, more preferably less than 70 wt%, less than 50 wt% or less than 40 wt%, and most preferably less than 30 wt%, less than 28 wt%, less than 26 wt% or less than 25 wt%.
- the tracer composition may comprising the solvent at a concentration of between 1 and 90 wt%, more preferably between 5 and 70 wt%, between 10 and 50 wt% or between 15 and 40 wt%, and most preferably at a concentration between 20 and 30 wt%, between 22 and 28 wt%, between 23 and 26 wt% or between 24 and 25 wt%.
- the tracer composition may be added to a plant protection product (PPP).
- PPP plant protection product
- a plant protection composition comprising:
- the PPP may be as defined in relation to the first aspect. It may be appreciated that the PPP may be a substance configured to control a pest. Accordingly, the PPP may comprise a herbicide, an insecticide, an acaricide, a nematicide, a molluscicide, a bactericide and/or a fungicide. The PPP may be a commercially available pesticide.
- the PPP may be a biopesticide agent.
- the PPP may comprise a fungus or the spores thereof.
- the fungus may be a pathogen which controls a pest.
- the pesticide agent may comprise Ampelomyces quisqualis, Beauveria bassiana and/or Bacillus thuringiensis.
- the PPP agent may comprise a small molecule which controls a pest.
- the PPP may comprise myclobutanil, abamectin, spinosad, pyrimethanil, carbonic acid, thiacloprid, chlorpyrifos, azoxystrobin, chlorantraniliprole, methoxyfenozide, iprodione, captan, fenhexamid, clofentezine, boscalid, pyraclostrobin, pendimethalin, cyprodinil, fludioxonil, tebufenpyrad or a salt and/or solvate thereof.
- the salt may be a lithium salt, a sodium salt, a potassium salt, a rubidium salt, a beryllium salt, a magnesium salt, a calcium salt or a strontium salt.
- the salt of carbonic acid may be sodium bicarbonate or potassium bicarbonate and is preferably potassium bicarbonate. It may be appreciated that the term "captan” can refer to the compound identified by IUPAC name (3aR,7aS)-2-[(Trichloromethyl)sulfanyl]-3a,4,7,7a-tetrahydro-1H-isoindole-1,3(2H)-dione.
- the plant protection composition may comprise the tracer composition in an amount which is at least 0.01% (v/v), more preferably at last 0.1% (v/v), at least 0.25% (v/v), at least 0.5% (v/v) or at least 0.75% (v/v), and most preferably at least 1% (v/v).
- the plant protection composition may comprise the tracer composition in an amount which is less than 50% (v/v), more preferably less than 40% (v/v), less than 30% (v/v), less than 20 %(v/v) or less than 10% (v/v), and most preferably is less than 5% (v/v).
- the plant protection composition may comprise the tracer composition in an amount which is between 0.01 and 50% (v/v), more preferably between 0.1 and 40% (v/v), between 0.25 and 30% (v/v), between 0.5 and 20% (v/v) or between 0.75 and 10% (v/v), and most preferably is between 1 and 5% (v/v).
- the plant protection composition may comprise the PPP in an amount which is at least 20% (v/v), more preferably at least 40% (v/v), at least 60% (v/v) or at least 80% (v/v), and most preferably at least 90% (v/v) or at least 95% (v/v).
- the plant protection composition may comprise the PPP in an amount which is less than 99.99% (v/v), more preferably less than 99.9% (v/v) and most preferably is less than 99% (v/v).
- the plant protection composition may comprise the PPP in an amount which is between 20 and 99.99% (v/v), more preferably between 60 and 99.9% (v/v) or between 40 and 99.9% (v/v), and most preferably between 90 and 99% (v/v) or between 95 and 99% (v/v).
- the PPP has a pH of less than 10 at 20°C, more preferably less than 9 at 20°C or 8 at 20°C, and most preferably less than 7 at 20°C.
- the PPP has a pH of more than 4 at 20°C, more preferably more than 6 at 20°C.
- the tracer composition may be diluted for analysis without being combined with a PPP.
- an analysis composition comprising:
- the solvent may comprise water and/or an alcohol.
- the solvent comprises water.
- the analysis composition may comprise the tracer composition in an amount which is at least 0.01% (v/v), more preferably at last 0.1% (v/v), at least 0.25% (v/v), at least 0.5% (v/v) or at least 0.75% (v/v), and most preferably at least 1% (v/v).
- the analysis composition may comprise the tracer composition in an amount which is less than 50% (v/v), more preferably less than 40% (v/v), less than 30% (v/v), less than 20 %(v/v) or less than 10% (v/v), and most preferably is less than 5% (v/v).
- the analysis composition may comprise the tracer composition in an amount which is between 0.01 and 50% (v/v), more preferably between 0.1 and 40% (v/v), between 0.25 and 30% (v/v), between 0.5 and 20% (v/v) or between 0.75 and 10% (v/v), and most preferably is between 1 and 5% (v/v).
- the analysis composition may comprise the solvent in an amount which is at least 20% (v/v), more preferably at least 40% (v/v), at least 60% (v/v) or at least 80% (v/v), and most preferably at least 90% (v/v) or at least 95% (v/v).
- the analysis composition may comprise the solvent in an amount which is less than 99.99% (v/v), more preferably less than 99.9% (v/v) and most preferably is less than 99% (v/v).
- the analysis composition may comprise the solvent in an amount which is between 20 and 99.99% (v/v), more preferably between 60 and 99.9% (v/v) or between 40 and 99.9% (v/v), and most preferably between 90 and 99% (v/v) or between 95 and 99% (v/v).
- an apparatus comprising:
- the first wavelength may be in the range of 400 to 500 nm.
- the second wavelength may be in the range of 500 to 600 nm.
- the light emitting device may comprise at least one light emitting diode.
- Each of said at least one light emitting diodes may be placed in a back focal plane of said light emitting device to provide a uniform pattern of light to illuminate said surface.
- the light emitting device may further comprise at least one of:
- the surface may comprise a plant or a part thereof.
- the material could be a bacteria. Accordingly, the method of the further aspect could be used to detect bacteria on a surface. For instance, the first wavelength could cause the bacteria to fluoresce.
- the material is the tracer composition of the first aspect or the plant protection composition of the second aspect.
- the method may comprise initially spraying the surface with a spray composition comprising the tracer composition of the first aspect or the plant protection composition of the second aspect.
- the method may comprise processing the first fluorescence image to determine a coverage information and/or a dosage information of said tracer composition or plant protection composition.
- the surface may comprise a plant, or a part thereof.
- the plant comprises a crop plant.
- crop plants includes any edible or non-edible plant, including decorative, plant species with commercial value, which is planted and cultivated for commercial use.
- crop plants include floral and nonfloral plants, trees, vegetable plants, turf, and ground cover. It will be appreciated that trees include fruit trees.
- plant is meant to include germinant seeds, emerging seedlings, and established vegetation, including roots and above-ground portions (for example, leaves, stalks, flowers, fruits, branches, limbs, root, etc.).
- Turf refers to grass which grow in areas in which they are desired, or purposely planned for and maintained, for example, a lawn. Turf also refers to a sod, where the surface layer of ground consisting of a mat of grass and grass roots.
- Non-limiting specific examples of crop plants include members of the genera Allium, Apium, Asparagus, Brassica, Camellia, Cicera, Citrus, Coffea, Daucus, Fragaria, Glycine, Helinthus, Lactuca, Lens, Linum, Malus, Phaseolus, Pisum, Prunus, Pyrus, Ricinus, Rubus, Sinapis, Solanum, Spinacia, Theobroma, Vanilla, Vicia, Vitis and Zea.
- the crop plants may include apple trees, asparagus, beans, broccoli, Brussel sprout, cabbage, cacao tree, carrot plants, castor oil plants, cauliflowers, celery, cherry tree, chickpea plants, coffee plants, grape vines, Jerusalem artichokes, leeks, lentil plants, lettuce, linseed, maize, mustard plants, onions, orange trees, peach trees, pea plants, pear trees, potato plants, rapeseed, raspberry plants, spinach, strawberry plants, sunflowers, tea plants, tomato plants and vanilla plants.
- Beans may include black beans, broad beans, butter beans, common beans, faba beans, fava beans, French beans, green beans, kidney beans, lima beans, pinto beans, runner beans and/or soybeans.
- the method allows a user to determine spray deposition of PPP on a crop plant.
- the first wavelength may be between 150 and 700 nm, between 300 and 650 nm, between 350 and 600 nm or 400 and 500 nm.
- the photon does not have a wavelength of 460 nm. This is because photons with a wavelength of 460 nm may be absorbed by chlorophyll. Accordingly, the first wavelength may be between 465 and 500 nm.
- the second wavelength is preferably different to the first wavelength.
- the second wavelength may be between 450 and 650 nm, between 475 and 625 nm or between 500 and 600 nm.
- the first fluorescent image may record the emission of light with a predetermined wavelength in the area.
- the predetermined wavelength is preferably different to the first wavelength.
- the predetermined wavelength may be between 450 and 650 nm, more preferably between 475 and 625 nm, and most preferably between 500 and 600 nm.
- the method may further comprise:
- the method may further comprise:
- Said selecting may select the best candidate according to a metric.
- Said metric may include determining the candidate with the most pixels having a pixel value above a first threshold value and/or the candidate with the most pixels below a second threshold value.
- determining said dosage information may comprise:
- processing the respective fluorescence image comprises:
- the method may comprise analysing determining the number of deposits of the material on the surface.
- the method may comprise determining the size of the deposits of the material on the surface.
- the method may comprise determining the average size of the deposits.
- the average size of the droplets may be known based upon the method used to spray the surface with the spray composition.
- the method may comprise determining said dosage information based upon the amount of the deposits and/or the average size thereof.
- Selectively illuminating the surface may comprise illuminating the surface as a uniform pattern of light.
- a suitable tracer would ideally:
- the inventors prepared an initial solution of FMN-Na in deionised water, where the FMN-Na was present at a concentration of 0.013 mg / ml.
- the initial solution of FMN-Na was then added to the known pesticides, so that the final pesticide preparations had a resulting concentration of FMN-Na of 0.25 ⁇ g / ml, and the fluorescence was measured again.
- the baseline fluorescence was subtracted to determine the amount of fluorescence which was due to the FMN-Na, and this was compared to the fluorescence observed for a concentration of FMN-Na of 0.25 ⁇ g / ml in de-ionised water. The results are shown in Table 1.
- Some of the pesticide products appear to exhibit some slight fluorescence, which may have affected the results to a certain degree.
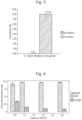
- a decrease in fluorescence of greater than 100% is observed. This may be due to these pesticides reducing or quenching the fluorescence of riboflavin and, at the same time, the fluorescence of the pesticide may also have been quenched due to the addition of FMN-Na, thus causing an overall greater than 100% loss of fluorescence.
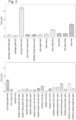
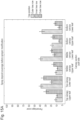
- the inventors also investigated the background fluorescence exhibited by a number of plants using a handheld imaging fluorometer, and the results are shown in Figure 2 .
- the inventors noted that background fluorescence is not a problem for a wide range of crops and tissue types.
- FMN-Na was identified as a suitable fluorescence tracer.
- FMN-Na displayed a low quantum yield when dry and very poor photostability properties.
- the inventors found that it was possible to improve the fluorescent properties of FMN-Na by combining it with gelling agents.
- sucrose and glycerol were used as these compounds are safe and edible. It is noted that both compounds improved the fluorescent properties of FMN-Na when used alone, but offered a particular improvement when used in combination.
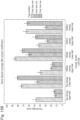
- FMN-Na was unstable in sunlight, and neither sucrose nor glycerol improved its stability. Accordingly, the inventors tested the effect a number of compounds had on the photodegradation of FMN-Na, and the results are shown in Figure 6 .
- the two most effective compounds tested were ascorbic acid and sodium thiosulphate.
- Figure 7 shows the UV absorbance spectra for FMN-Na, ascorbic acid and sodium thiosulphate.
- ascorbic acid closely matches the absorbance spectra of riboflavin between 220 and 300 nm. Without wishing to be bound by theory, it is thought that by absorbing light between these wavelengths the ascorbic acid prevents photodegradation of FMN-Na. It is noted that ascorbic acid is also a free radical scavenger. Accordingly, this action could also be responsible for the improvement in the stability of FMN-Na.
- a tracer composition comprising the following components:
- compositions ascorbic acid and/or sodium thiosulphate were also added to give a concentration of 0.85M or 1.7M, prior to the addition of glycerol.
- a further formulation (formulation D) was prepared by dissolving tocopheryl acetate in a 1:1 weight ratio in ethanol. The ethanol solution was then added to a formulation comprising ascorbic acid. The amount of water in this formulation was reduced so that the total volume of the formulation was the same and the concentration of the other components was not affected. Tocopherol compounds were tested as they have been reported to interact with ascorbic acid and possibly riboflavin to reduce the process of photodegradation.
- FIG 8 shows how the photostability of FMN-Na varied in the different formulations.
- the stability of FMN-Na was significantly improved when using ascorbic acid at a concentration of 0.85 M, and at a concentration of 1.7M the FMN-Na was substantially photostable.
- tocopheryl acetate did not appear to have a beneficial effect on the photodegradation of FMN-Na.
- the inventors were able to identify a food safe tracer comprising FMN-Na.
- the inventors noted that inclusion of sucrose and glycerol was able to greatly enhance the fluorescence of dry deposits and the inclusion of ascorbic acid was able to mitigate photodegradation.
- the tracer is compatible with a wide range of pesticides and crops. Furthermore, it can be used on crops without crop destruction, and is safe to humans and the environment.
- the inventors have further developed a spray deposit fluorimeter to allow analysis of the deposited spray to be conducted.
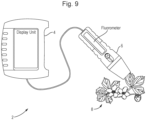
- a suitable fluorimeter 2 is shown in Figure 9 .
- the fluorimeter 2 comprises a processing and visualisation module 4 coupled to a detection module 6.
- the detection module 6 is configured to emit electromagnetic radiation at a predetermined wavelength, for the tracer described in example 1 this wavelength could be between 320 and 490 nm. As shown in the figure, the detection module can be focused on a plant 8 which has been pre-treated with a spray comprising a fluorescent tracer.
- the detection module 6 is also configured to detect emitted wavelengths of light. For the experiments described below, the emission wavelength used by the inventors was 470 nm and the detected wavelength was 550 nm, but it will be appreciated that other wavelengths could also be used.
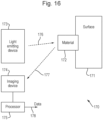
- FIG 16 is a block diagram of a system, indicated generally by the reference numeral 170, in accordance with an example embodiment.
- System 170 shows a surface 171 (such as a plant or leaf surface), a material 172 (such as a tracer material), a light emitting device 173, an imaging device 174, and a processor 175.
- the surface 171 may be a surface of the plant 8 which is sprayed with a tracer material, such as the material 172.
- the light emitting device 173 may be comprised within the detection module 6, and the imaging device 174 and processor 175 may be comprised within the processing and visualization module 4.
- the light emitting device 173 is a dual wavelength light-emitting device. As shown by the dotted arrow 176, the light emitting device 173 illuminates the surface 171 at a first wavelength and a second wavelength. As shown by dotted arrow 177, in response to the illumination, light is received from the surface 171, and the imaging device 174 generates images based on the received light. The generated images are processed at the processor 175, and the processor outputs data 178. In another embodiment, the light emitting device 173 is a single wavelength light-emitting device.
- the system 170 provides imaging hardware and processing algorithms.
- the imaging hardware provides light sources and captures images (e.g. visual and fluorescence images).
- the processing algorithms extract information from the captured images.
- the light-emitting device 173 illuminates the surface 171 at a first wavelength and a second wavelength.
- the first wavelength is in the range of 400 to 500nm (e.g. 470nm) and the second wavelength is in the range of 500 to 600 nm (e.g. 530nm).
- the first wavelength is in the range of 465nm to 500nm.
- the light emitting device 173 may comprise at least one light emitting diode. Each of said at least one light emitting diodes may be placed in a back focal plane of light emitting device 173 to provide a uniform pattern of light to illuminate surface 171. This is explained in further detail below with respect to in Figure 22 .
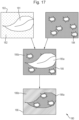
- FIG 17 shows representations of images, indicated generally by the reference numeral 180, in accordance with an example embodiment.
- the images 180 include a first visual image 183, a first fluorescence image 184, a masked image 185, and a second fluorescence image 186.
- the first visual image 183 is captured by the imaging device 174 in response to the light-emitting device 173 illuminating the surface (a leaf in this example) with visual wavelength light.
- the first fluorescence image 184 is captured by the imaging device 174 in response to the light-emitting device illuminating the surface with light having a wavelength such that the material 172 is caused to fluoresce.
- the first visual image 183 comprises a leaf area 181 and a background area 182.
- the first fluorescence image 184 comprises a fluorescence pattern.
- the area 181 would have a different form.
- the masked image 185 comprises a masked area 185a (indicating where fluorescence data is to be processed) and an unmasked area 185b (indicating where fluorescence data is not to be processed).
- the second fluorescence image 186 comprises a processed area 186a and an unprocessed area 186b.
- fluorescence data within the processed area 186a can be used to determined coverage and/or dosage information, as discussed further below.
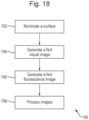
- Figure 18 is a flowchart of an algorithm, indicated generally by the reference numeral 190, in accordance with an example embodiment.
- a surface (such as surface 171), is illuminated, for example, by light emitting device 173.
- the imaging device such as imaging device 174, generates a first visual image (in response to the illumination of the surface 171 at the second wavelength) and, at step 196, the imaging device generates a first fluorescence image (in response to the illumination of the surface 171 at the first wavelength).
- a processor such as processor 175, processes the generated images.
- the steps 194 and 196 can be used to generate the images 182 and 184 described above. Of course, the steps 194 and 196 may be performed in any order and may also be performed simultaneously.
- FIG 19 is a flowchart of an algorithm indicated generally by the reference numeral 200, in accordance with an example embodiment.
- Algorithm 200 is an example implementation of step 198 of the algorithm 190.
- the algorithm 200 starts at step 202, where a mask is generated (based on the first visual image generated in the step 194).
- a second fluorescence image is generated by masking the first fluorescence image (generated in step 196) using the mask.
- the step 202 may generate the masked image 185 and the step 204 may generated the second fluorescence image 186.
- the second fluorescence image 186 is processed to determine the coverage information and/or dosage information of the material 172.
- the unmasked area of the image is omitted from the second fluorescence image such that any fluorescence detected in the background of the surface being illuminated (as shown in the un-masked area) is not included in calculation of the coverage and/or dosage of the tracer.
- the second fluorescence image is processed by the processor 175.
- the processor 175 may convert pixels of the second fluorescence image into a binary image based on whether or not each pixel is above or below a fluorescence threshold. For example, if a value of a pixel is below the fluorescence threshold, the pixel is assigned with a binary value of zero and the pixel is determined to be a non-fluorescent pixel; and if a value of a pixel is above the fluorescence threshold, the pixel is assigned with a binary value of one and the pixel is determined to be a fluorescent pixel.
- the binary image can then be used for determining boundaries of droplets of the material based on the binary values of the pixels.
- the coverage information of the material 172 is determined in the step 206 based on a percentage of the surface 171 covered by the material 172.
- the percentage of the surface covered by the material may be determined based on quantity of fluorescent pixels as a percentage of all pixels of the second fluorescence image.
- the fluorescent pixels may be determined based on whether the pixel has a pixel value above a fluorescence threshold.
- the dosage information of the material 172 is determined in the step 206 based on an amount of fluorescence.
- the amount of fluorescence is determined based on an intensity of each fluorescent pixel of the second fluorescence image.
- the fluorescent pixels may be determined based on whether the pixel has a pixel value above a fluorescence threshold.
- Determinations of coverage and/or quantity may be useful in determination the extent to which are material has been applied to a surface.
- step 206 The skilled person will be aware of alternative implementations of the step 206.
- FIG 20 is a flowchart of an algorithm indicated generally by the reference numeral 210, in accordance with an example embodiment.
- the algorithm 210 may be used as part of the algorithm 190 described above
- the algorithm 210 starts at step 212, where the imaging device 174 generates a plurality of candidate images at different illumination intensities.
- the best candidate of the candidates is selected (according to some metric).
- the algorithm 210 may therefore be used in selecting illumination intensities in the generation of both the first visual image (in step 194) and the first fluorescence image (in step 196). In one example embodiment, three illumination intensities are provided and the most appropriate illumination intensity is chosen for the generation of the said images.
- the metric used in step 214 to select the best candidate may include determining the candidate with the most pixels having a pixel value above a first threshold value (e.g. the most pixels having a value above a zero or noise-threshold).
- the metric may include determining the best candidate to be the candidate with the most pixels having a pixel value below a second threshold value (e.g. the most pixels below a maximum or saturation threshold).
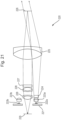
- Figure 21 is a block diagram of a system, indicated generally by the reference numeral 220, in accordance with an example embodiment.
- the system 220 is an example implementation of an arrangement of the light emitting device 173 and the imaging device 174 described above.
- the system 220 comprises a first light emitting diode (LED) module 221, a first LED 222a mounted on the first LED module, a second LED 222b (typically mounted on the first LED module, but optionally mounted on a second LED module, not shown), a first lens 223a, a second lens 223b, an excitation filter 224, a third lens 225, a sample surface 226, at least one emission filter 227, a plurality of fourth lenses 228, and a camera sensor or imaging device 229.
- LED light emitting diode
- the first LED 222a is a blue LED emitting blue light (e.g. 470nm)
- the second LED 222b is a green LED emitting green light (e.g. 530nm).
- the system 220 as shown in Figure 21 is being used to generate a first fluorescence image and can also be used to generate a first visual image (by illuminating the surface 226 using the second LED 222b).
- the LEDs 222a and 222b may be two of a plurality of LEDs within an array; indeed, the LEDs 22a and 222b may be identical, with other LEDs in the array either being identical to those LEDs or different, thereby providing the first and second LEDs of a plurality of LEDs required by some example embodiments.
- the first and second LEDs 222a and 222b comprised within the LED module 221 are placed in a back focal plane of the dual wavelength light emitting device (system 220) to provide a uniform pattern of light to illuminate the surface of the leaf or plant (i.e. the sample surface 226).
- the first and second LEDs 222a and 222b may sit in the back focal plane of the lens 225 (e.g. an achromat lens).
- the illuminated surface may, for example, have an illumination area of the order of 1 cm 2 on the sample surface 226.
- An image (either fluorescent or visual) of the illuminated area is formed on the camera sensor or imaging device 229.
- the sample may be positioned in the front focal plane of the lens 225 and the light then passes through the emission filter 227 and the fourth lenses 228 (e.g. a pair of achromat lenses) to focus the image on the camera sensor or imaging device 229.
- the magnification of the image at the camera sensor or imaging device 229 may be selected to match the illumination area. In this case, a demagnified image may be produced, if the camera is smaller than the illuminated area.
- the lens 225 and/or the fourth lenses 228 may be achromat lenses. However, this is not essential to all embodiments. Other lens configuration (e.g. cheaper or simpler lenses) could be chosen.
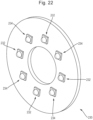
- FIG 22 is block diagram of a system, indicated generally by the reference numeral 230, in accordance with an example embodiment.
- System 230 shows a LED module (such as LED module 221 described above).
- the LED module 221 may be a LED printed circuit board (PCB) assembly.
- PCB printed circuit board
- the LED module 221 comprises a plurality of blue LEDs 232 (similar to the first LED 222a) and a plurality of green LEDs 234 (similar to the second LED 222b).
- the blue LEDs 232 and green LEDs 234 may be arranged in an alternating way as shown in system 230. In the event that the LED module 221 implements the LED module 221 described above, then the relative positions of the first and second LEDs within the module 221 determines whether or not the LEDs 222a and 222b are the identical or different.
- first and second light emitting devices having different wavelength are used. This is not essential to all embodiments. For example, the generation of a visual image may be omitted in some circumstances.
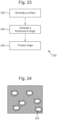
- Figure 23 is a flow chart showing an algorithm, indicated generally by the reference numeral 240, in accordance with an example embodiment.
- a surface (such as the surface 171 described above), is illuminated, for example, by light emitting device 173.
- the imaging device such as imaging device 174, generates a fluorescence image (in response to the illumination of the surface 171 at the first wavelength).
- a processor such as processor 175, processes the fluorescence image.
- Figure 24 is a representation of an image, indicated by the reference numeral 254, in accordance with an example embodiment.
- the image 254 is an example of a fluorescence image that may be generated in the step 244 of the algorithm 240.
- the fluorescence image 184 comprises a fluorescence pattern.
- the image pattern occupies the entirety of the sampled area, such that there is no need for masking and consequently no need for the generation of a visual image.
- the inventors tried a variety of methods to calibrate the fluorimeter to allow quantitative analysis, and these are described below.
- the tracer formulation provided in table 3 was diluted 2% v/v in deionised water.
- the diluted formulation was then then sprayed onto laser cut plastic rectangles of fixed sizes (9.5 mm ⁇ 7 mm) using a modified laboratory sprayer.
- the laboratory sprayer was built using a Micron ULVA (Ultra Low Volume Atomiser) spray head. By controlling the flow rate of the liquid onto the ULVA, the rotational speed, and the exposure time of the squares and WSPs, the characteristics of the spray being applied could be varied. The variations applied included the size of the droplets and number of droplets.
- the deposits on the plastic rectangles were measured using the prototype handheld imaging fluorometer.
- the spray deposits on the plastic squares were washed off into 4 ml of deionised water, and the fluorescence measured using a benchtop fluorimeter (Jenway 6280).
- the plastic rectangles were compared with water sensitive papers cut to the same size.
- the plastic squares and water sensitive papers were positioned side by side in an alternating sequence and then sprayed.
- the deposits on the WSPs were analysed using a RGB camera and the subsequent images processed using ImageJ..
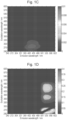
- Figure 10 shows the correlation between the number of deposits and the measured relative fluorescence units (RFU) of the wash-off.
- the sprayed samples were separated by the size of the deposits based on the American Society of Agricultural and Biological Engineers (ASABE) S572.1 definition of droplet size classification, this is reproduced in table 4.
- Table 4 Droplet size classification Spray Quality VMD Range* ( ⁇ m) Extremely Fine ⁇ 60 Very Fine 61-105 Fine 106-235 Medium 236-340 Coarse 341-403 Very Coarse 404-502 Extremely Coarse 503-665 Ultra Coarse >665 *VMD is the droplet size at which 50% of the spray volume is in droplets larger than the VMD and 50% of the volume is in droplets smaller than the VMD.
- Figure 12 shows the rotation speed of the sprayer used to produce the different droplets, and this corresponds to droplet size as explained above.
- the relationship between fluorescence values and the volume of liquid on the measured surface there is a small difference in the relationship between fluorescence values and the volume of liquid on the measured surface.
- this difference is slight, and the linear relationship between fluorescence value and volume of liquid, ignoring droplet size, has an R 2 value of 0.72, meaning that fluorescence value explains over 70% of the measure of volume of tracer.
- the linear relationship between fluorescence value and volume of liquid has an R 2 value of 0.782. It is noted that the largest size droplets are rare in agricultural spraying, and often shatter into smaller droplets when they hit a plant surface.
- the degree of fluorescence will vary depending upon the pesticide used. Accordingly, to ensure accuracy, it is important to measure the fluorescence of a sample comprising the pesticide and the tracer. This measurement can then be used to calibrate the measurements obtained in the field.
- the inventors worked with over 20 growers to conduct 151 assessments over a two year period. These spray assessments were conducted on 19 crop types and tested a wide variety of spray variables. In particular, the inventors tested the tracer composition on baby red leaf lettuce, baby leaf spinach, iceberg lettuce, field peas, field beans, celery, brown onion, asparagus, sweetcorn, potatoes, baby gem lettuce, cherry trees, pear trees raspberry plants, grape vines, broccoli, strawberries and apple trees.
- Results of the spray coverage analysis were highly variable between crops, spray settings and conditions. Typically high levels of spray deposit coverage were observed on the upper leaf surface but very low or zero coverage was observed on the lower leaf surface particularly at the bottom of the canopy. The growers were annoyed at some of the low spray coverage recorded in parts of the canopy.
- spray deposition was conducted using standard industry practices. The spray deposit coverage was determined based upon the percentage coverage, as described in example 5.2.
- Broccoli plants were sprayed with an aqueous solution comprising FMN-Na. As shown in Figure 13 , it was found that spray deposit coverage was between 40% and 60% on the upper surface of the broccoli leaves. Conversely, on the lower surface of the broccoli leaves coverage was only between 1% and 11%. The main insect pests of broccoli colonise the underside of leaves.
- the inventors also assessed the spray coverage of strawberries sprayed with three different adjuvants commonly used as 'wetting agents' in horticulture. All of the solutions prepared comprised FMN-Na. A control solution did not contain any adjuvant, while the remaining solutions comprised commercially available wetting agents at the concentrations recommended by the manufacturers.
- wetting agents in areas with high spray coverage (e.g. the upper side of the leaf), the effect of wetting agents was minimal. However, as shown in Figure 14 , in areas with lower coverage (e.g. the lower side of the leaf) wetting agents improved spray cover significantly. In particular, it is noted that commercially available wetting agent B doubled the coverage of the lower leaf in the bottom canopy compared to the control.
- the growers can select the best wetting agents for a given application, ensuring better coverage.
- a Kentish apple grower was experiencing significant mildew disease on their apple crop and faced a risk of large economic loss.
- the grower had contacted an agronomist for advice who suggested there might be an issue with the spray machine which was used to apply the pesticide to the apple trees.
- the grower insisted that the spraying had been done satisfactorily.
- the apple trees were planted in a three row bed.
- An aqueous solution comprising 2 wt% FMN-Na was applied to the apple trees using the apple grower's normal spraying system, using the same settings and rates as the grower would normally use when applying pesticides.
- the spray machine was set up with a water rate of 400 l/ha.
- the trees where then imaged and the images were analysed as explained in examples 3 and 4.
- Figure 16A shows the results of measuring spray coverage across the three-row bed of trees at various sections of the tree canopy.
- the spray coverage across the trees was highly variable and very low.
- Upon calibrating the spray machine it was discovered that it was actually spraying at 370 l/ha, rather than 400 l/ha as intended, which would be one cause of the low spray coverage. It was thought that a further cause of the low spray coverage and the variability, at least in part, was the old nozzles on the sprayer.
- the inventors have developed a food safe tracer composition which is compatible with a wide range of pesticides and crops. Furthermore, the composition can be used on crops without crop destruction, and is safe to humans and the environment.
- composition it is possible to ascertain the spray deposition achieved when a pesticide is applied to a plant.
- the inventors have shown that analysis of the data also allows the amount of pesticide deposited to be quantified.
Landscapes
- Chemical & Material Sciences (AREA)
- Health & Medical Sciences (AREA)
- Life Sciences & Earth Sciences (AREA)
- General Health & Medical Sciences (AREA)
- Engineering & Computer Science (AREA)
- Organic Chemistry (AREA)
- Immunology (AREA)
- Materials Engineering (AREA)
- Physics & Mathematics (AREA)
- Wood Science & Technology (AREA)
- Dentistry (AREA)
- Toxicology (AREA)
- Plant Pathology (AREA)
- Pest Control & Pesticides (AREA)
- Zoology (AREA)
- Environmental Sciences (AREA)
- Agronomy & Crop Science (AREA)
- Nuclear Medicine, Radiotherapy & Molecular Imaging (AREA)
- Pathology (AREA)
- General Physics & Mathematics (AREA)
- Biochemistry (AREA)
- Analytical Chemistry (AREA)
- Optics & Photonics (AREA)
- Chemical Kinetics & Catalysis (AREA)
- Dispersion Chemistry (AREA)
- Investigating, Analyzing Materials By Fluorescence Or Luminescence (AREA)
- Luminescent Compositions (AREA)
Description
- The invention relates to a food safe tracer composition, and more specifically to a food safe tracer composition which may be used to determine spray deposition comprising the composition. The invention also extends to a method of assessing deposition of a spray using the tracer composition.
- Sprays are often used in agriculture to treat the surface of plants and soil with pesticides, feeds and other substances. A minimum deposit on the surface is required to be effective. Accordingly, to ensure that the minimum deposit has been obtained, methods have been developed to detect and analyse the extent and thoroughness of spray deposits.
- One way of determining coverage is to use water sensitive papers which are distributed amongst crops and which indicate where they have been wetted by the spray. This method has a number of limitations. In particular, the technique is broadly qualitative and gives little indication of the amount of spray on crop leaves. Furthermore, the papers are not deemed to be realistic proxy for leaves. The method requires the water sensitive paper to be dispersed within the crops. In practice, this requires the paper to either be attached directly to the crops or on a supporting structure. This would normally require the paper to be attached by hand, which is time consuming. Finally, the use of water sensitive papers requires completely dry conditions, which drastically effects when they may be used.
- Detectable tracers have been developed for crop sprays where the spray includes a visual or fluorescent tracer. One example of a visual tracer is kaolin, which can be added to the spray and leaves a white residue on the surface of the leaves when the spray dries. Spray coverage can then be visually inspected. Alternatively, when fluorescent tracers are added to the spray the coverage can then be assessed in the dark with a UV light. While these methods offer improvements over water sensitive papers, they are still broadly qualitative. Furthermore, the tracers used often are not food safe, which may require the crop to be destroyed.
- Another way of assessing crop spray coverage is through laboratory testing. This technique requires spraying crops or artificial targets with a detectable substance, e.g. a detectable pesticide, a colourant, or a fluorescent marker. The deposits can be photographed to allow the cover to be analysed. After that the deposits can be washed off and quantified to determine the amount which has been deposited. This allows various spray techniques to be tested and modified to improve coverage. However, this method is expensive and time consuming. Furthermore, artificial targets may be an unrealistic proxy for leaves whereas any crops used by the laboratory for analysis may need to be destroyed after testing.
- Csorba et al. discloses a study that examines spray retention of fluorescein on young wheat and rape plants using a variety of nozzles delivering ca 75 l/ha as fine to coarse sprays, compares their drift potential and attempts a correlation with the spray spectra produced (C Csorba, E C Hislop, N M Western. Options for reduced volume "coarse" droplet spraying. Brighton crop protection conference - Weeds - 1995).
- The present invention comes from the inventors' work in attempting to overcome the problems associated with the prior art.
- In accordance with a first aspect of the invention, there is provided a food safe tracer composition, the composition comprising:
- a food safe fluorescent molecule which fluoresces when exposed to an excitation wavelength, and thereby emit a photon with a wavelength between 400 and 600 nm;
- a stabilising agent configured to improve the photostability of the fluorescent molecule; and
- a gelling agent.
- Advantageously, the tracer composition can be used to assess spray deposition. The term 'spray deposition' may be understood to be a measure of spray coverage over an area, the volume of liquid comprising the spray deposits, the size of spray deposits on the surface and/or distribution of deposits over the area.
- For instance, the tracer composition can be added to a spray tank with a plant protection product (PPP), which may be applied to a plant or other structure or substrate. The term Plant Protective Product (PPP) may refer to any substance that may be applied to a plant or other structure or substrate in agriculture. For instance, the PPP may comprise a herbicide, an insecticide, an acaricide, a nematicide, a molluscicide, a bactericide, a fungicide, an adjuvant, a fertiliser, a hormone or an elicitor. The tracer composition allows the percentage coverage and the amount of the PPP which has been deposited on the plant to be ascertained.
- Preferably, the fluorescent molecule emits a photon with a wavelength between 450 and 650 nm, more preferably between 475 and 625 nm, and most preferably between 500 and 600 nm. Advantageously, chlorophyll A and chlorophyll B do not absorb or emit photons within this range.
- Preferably, the fluorescent molecule fluoresces when exposed to an excitation wavelength between 150 and 700 nm, more preferably between 300 and 650 nm or between 450 and 600 nm, and most preferably between 460 and 550 nm or between 465 and 500 nm.
- Advantageously, the tracer composition may be used on crops.
- In a preferred embodiment, the fluorescent molecule is a compound of formula (I):

- More preferably, the fluorescent molecule is a compound of formula (Ia):
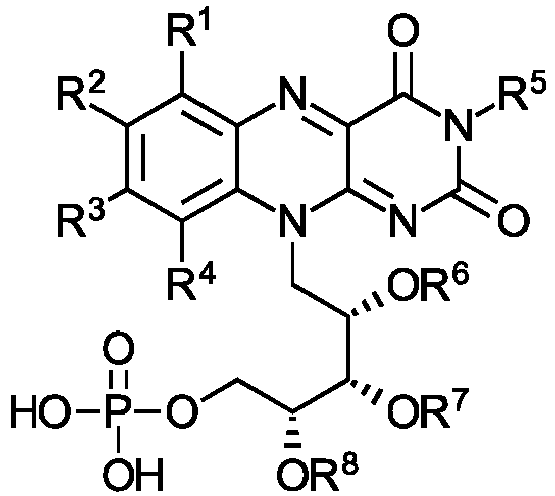

- It may be appreciated that a C1-5 alkyl may be a methyl, ethyl, propyl, butyl or pentyl.
- In a preferred embodiment, R1 to R8 may each independently be hydrogen, methyl or ethyl.
- Preferably, R1 is hydrogen.
- Preferably, R2 is methyl or ethyl, and most preferably methyl.
- Preferably, R3 is methyl or ethyl, and most preferably methyl.
- Preferably, R4 is hydrogen.
- Preferably, R5 is hydrogen.
- Preferably, R6 is hydrogen.
- Preferably, R7 is hydrogen.
- Preferably, R8 is hydrogen.
- Accordingly, the fluorescent molecule may be riboflavin 5'-monophosphate or a salt and/or solvate thereof. The salt may be a lithium salt, a sodium salt, a potassium salt, a rubidium salt, a beryllium salt, a magnesium salt, a calcium salt or a strontium salt. In some embodiments, the fluorescent molecule is riboflavin 5'-monophosphate sodium salt or a solvate thereof. In some embodiments, the fluorescent molecule is riboflavin 5'-monophosphate sodium salt dihydrate.
- The tracer composition may comprise the florescent molecule at a concentration of at least 0.0001 wt%, more preferably at least 0.001 wt%, at least 0.005 wt% or at least 0.01 wt%, and most preferably at least 0.02 wt%, at least 0.04 wt%, at least 0.06 wt% or at least 0.08 wt%. The tracer composition may comprise the florescent molecule at a concentration of less than 50 wt%, more preferably less than 20 wt%, less than 10 wt%, less than 5 wt%, less than 2 wt% or less than 1 wt%, and most preferably less than 0.8 wt%, less than 0.6 wt%, less than 0.4 wt% or less than 0.2 wt%. The tracer composition may comprise the florescent molecule at a concentration between 0.0001 and 50 wt%, more preferably between 0.001 and 50 wt%, or between 0.005 and 10 wt% or between 0.01 and 1 wt%, and most preferably between 0.02 and 0.8 wt%, between 0.04 and 0.6 wt%, between 0.06 and 0.4 wt% or between 0.08 and 0.2 wt%.
- The tracer composition may comprise the gelling agent at a concentration of at least 5 wt%, more preferably at least 10 wt%, at least 20 wt%, at least 30 wt%, at least 40 wt% or at least 50 wt%, and most preferably at a concentration of at least 60 wt%, at least 65 wt% or at least 67.5 wt%. The tracer composition may comprise the gelling agent at a concentration of less than 99 wt%, preferably less than 95 wt%, less than 90 wt%, less than 85 wt% or less than 80 wt%, and most preferably less than 77.5 wt%, less than 75 wt% or less than 72.5 wt%. The tracer composition may comprise the gelling agent at a concentration of between 10 and 99 wt%, more preferably between 20 and 95 wt%, between 30 and 90 wt%, between 40 and 85 wt% or between 50 and 80 wt%, and most preferably at a concentration between 60 and 77.5 wt%, between 65 and 75 wt% or between 67.5 and 72.5 wt%.
- The gelling agent may comprise a saccharide, and is preferably a sugar or a polysaccharide, or a salt and/or solvate thereof. The sugar may comprise a disaccharide, or a salt and/or solvate thereof. The disaccharide may be sucrose, lactulose, lactose, maltose, trehalose, cellobiose, chitobiose, or a salt and/or solvate thereof. Preferably, the disaccharide is sucrose, or a salt and/or solvate thereof. The polysaccharide may be linear or cyclic. Accordingly, the polysaccharide may be a cyclodextrin, agarose or gellan gum. The cyclodextrin may be α-cyclodextrin, β-cyclodextrin or γ-cyclodextrin.
- In some embodiments, the gelling agent may comprise agar. It may be appreciated that agar comprises agarose and agaropectin. It may be appreciated that agaropectin comprises D-glucuronic acid and pyruvic acid.
- The tracer composition may comprise the saccharide at a concentration of at least 5 wt%, more preferably at least 10 wt%, at least 20 wt% or at least 30 wt%, and most preferably at a concentration of at least 32.5 wt%, at least 35 wt% or at least 37.5 wt%. The tracer composition may comprising the saccharide at a concentration of less than 90 wt%, more preferably less than 80 wt%, less than 70 wt% or less than 60 wt%, and most preferably less than 50 wt%, less than 45 wt% or less than 42.5 wt%. The tracer composition may comprising the saccharide at a concentration of between 5 and 90 wt%, more preferably between 10 and 80 wt%, between 20 and 70 wt% or between 30 and 60 wt%, and most preferably at a concentration between 32.5 and 50 wt%, between 35 and 45 wt% or between 37.5 and 42.5 wt%.
- The gelling agent may comprise an alcohol, and preferably a glycol. The glycol may be a polyglycol. Accordingly, the glyocol may be polyethylene glycol (PEG). Alternatively, the gelling agent comprises a C1-10 alcohol or glycol, or a salt and/or solvate thereof. Preferably, the gelling agent comprises a C1-10 glycol, or a salt and/or solvate thereof. The C1-10 glycol may comprise between 2 and 10 hydroxyl groups. More preferably, the gelling agent comprises a C1-5 glycol. The C1-5 glycol may comprise between 2 and 5 hydroxyl groups. Most preferably, the gelling agent comprises a C2-4 glycol. The C2-4 glycol may comprise between 2 and 4 hydroxyl groups. In a most preferred embodiment, the gelling agent comprises glycerol, or a salt and/or solvate thereof.
- The tracer composition may comprise the alcohol at a concentration of at least 5 wt%, more preferably at least 10 wt%, at least 15 wt% or at least 20 wt%, and most preferably at a concentration of at least 22.5 wt%, at least 25 wt%, at least 27.5 wt% or at least 30 wt%. The tracer composition may comprising the alcohol at a concentration of less than 90 wt%, more preferably less than 70 wt%, less than 60 wt% or less than 50 wt%, and most preferably less than 40 wt%, less than 37.5 wt%, less than 35 wt% or less than 32.5 wt%. The tracer composition may comprising the alcohol at a concentration of between 5 and 90 wt%, more preferably between 10 and 70 wt%, between 15 and 60 wt% or between 20 and 50 wt%, and most preferably at a concentration between 22.5 and 40 wt%, between 25 and 37.5 wt%, between 27.5 and 35 wt% or between 30 and 32.5 wt%.
- Preferably, the gelling agent comprises a sugar and a C1-10 glycol. Advantageously, the inventors have found that the sugar and the polyol in combination synergistically improve fluorescence of the fluorescent molecule.
- The weight ratio of the saccharide to the alcohol may be between 1:10 and 10:1, more preferably between 5:1 and 1:5, between 1:4 and 4:1, between 1:3 and 3:1 or between 1:2 and 2:1, most preferably between 1.75:1 and 1:1, between 1.5:1 and 1.1:1 or between 1.3:1 and 1.2:1.
- The composition comprises a stabilising agent which improves the photostability of the fluorescent molecule. The stabilising agent may improve the photostability of the fluorescent molecule by absorbing photons. It may be appreciated that the wavelength of the photons absorbed by the stabilising agent may vary depending upon the fluorescent molecule. In one embodiment, the stabilising agent may absorb photons with a wavelength between 100 and 500 nm, more preferably between 150 and 400 nm or between 175 and 350 nm, and most preferably between 200 and 325 nm. It may be appreciated that light with a wavelength of between 100 and 280 nm, otherwise known as ultraviolet C, is absorbed by the ozone layer and atmosphere. Accordingly, photons with these wavelengths are not present in natural light at ground level. For this reason, the upper part of the above recited ranges may be of more importance. In some embodiments, the stabilising agent may absorb photons with a wavelength between 280 and 500 nm, more preferably between 280 and 470 nm or between 280 and 400 nm, and most preferably between 280 and 350 nm. Advantageously, the stabilising agent protects the fluorescent molecule from these wavelengths of light.
- Alternatively, or additionally, the stabilising agent may be a free radical scavenger. Advantageously, the stabilising agent protects the fluorescent molecule from free radicals.
- The stabilising agent may comprise thiosulfuric acid, ascorbic acid, β-carotene, ethylenediaminetetraacetic acid (EDTA), thiourea, methionine, thiosulfuric acid, butylated hydroxytoluene (BHT), or a salt and/or solvate thereof. The methionine may be present in a racemic mixture. Alternatively, the methionine may comprise D-methionine or L-methionine. The salt may be a lithium salt, a sodium salt, a potassium salt, a rubidium salt, a beryllium salt, a magnesium salt, a calcium salt or a strontium salt.
- Preferably, the stabilising agent comprises a compound of formula (II):

- More preferably, the stabilising agent comprises a compound of formula (IIa):

- Preferably, each of R9 to R12 is hydrogen. Accordingly, the stabilising agent may comprise ascorbic acid, and more preferably L-ascorbic acid, or a salt and/or solvate thereof.
- The tracer composition may comprise the stabilising agent at a concentration of at least 0.01 wt%, more preferably at least 0.1 wt%, at least 0. 5 wt%, at least 1 wt% or at least 1.5 wt%, and most preferably at a concentration of at least 2 wt%, at least 2.5 wt%, at least 3 wt% or at least 3.5 wt%. The tracer composition may comprising the stabilising agent at a concentration of less than 90 wt%, more preferably less than 50 wt%, less than 30 wt% or less than 10 wt%, and most preferably less than 7.5 wt%, less than 5 wt%, less than 4.5 wt% or less than 4 wt%. The tracer composition may comprising the stabilising agent at a concentration of between 0.01 and 90 wt%, more preferably between 0.1 and 50 wt%, between 0.5 and 30 wt% or between 1 and 10 wt%, and most preferably at a concentration between 2 and 7.5 wt%, between 2.5 and 5 wt%, between 3 and 4.5 wt% or between 3.5 and 4 wt%.
- The tracer composition may comprise a solvent. The solvent may comprise water or an organic solvent, such as an alcohol. The alcohol may be ethanol. In some embodiments, the solvent may comprise organic solvents, such as an alcohol, to increase the solubility of components within the composition. However, preferably, the solvent is water, and more preferably de-ionised water. Advantageously, water is the same solvent used in the majority of commercially available plant protection products (PPPs). The tracer composition may comprise the solvent at a concentration of at a concentration of at least 1 wt%, more preferably at least 5 wt%, at least 10 wt% or at least 15 wt%, and most preferably at a concentration of at least 20 wt%, at least 22 wt%, at least 23 wt% or at least 24 wt%. The tracer composition may comprising the solvent at a concentration of less than 90 wt%, more preferably less than 70 wt%, less than 50 wt% or less than 40 wt%, and most preferably less than 30 wt%, less than 28 wt%, less than 26 wt% or less than 25 wt%. The tracer composition may comprising the solvent at a concentration of between 1 and 90 wt%, more preferably between 5 and 70 wt%, between 10 and 50 wt% or between 15 and 40 wt%, and most preferably at a concentration between 20 and 30 wt%, between 22 and 28 wt%, between 23 and 26 wt% or between 24 and 25 wt%.
- It may be appreciated that the tracer composition may be added to a plant protection product (PPP).
- Accordingly, in accordance with a second aspect there is provided a plant protection composition comprising:
- the tracer composition of the first aspect; and
- a plant protection product (PPP).
- The PPP may be as defined in relation to the first aspect. It may be appreciated that the PPP may be a substance configured to control a pest. Accordingly, the PPP may comprise a herbicide, an insecticide, an acaricide, a nematicide, a molluscicide, a bactericide and/or a fungicide. The PPP may be a commercially available pesticide.
- The PPP may be a biopesticide agent. For instance, the PPP may comprise a fungus or the spores thereof. The fungus may be a pathogen which controls a pest. Accordingly, the pesticide agent may comprise Ampelomyces quisqualis, Beauveria bassiana and/or Bacillus thuringiensis.
- Alternatively, or additionally, the PPP agent may comprise a small molecule which controls a pest. The PPP may comprise myclobutanil, abamectin, spinosad, pyrimethanil, carbonic acid, thiacloprid, chlorpyrifos, azoxystrobin, chlorantraniliprole, methoxyfenozide, iprodione, captan, fenhexamid, clofentezine, boscalid, pyraclostrobin, pendimethalin, cyprodinil, fludioxonil, tebufenpyrad or a salt and/or solvate thereof. The salt may be a lithium salt, a sodium salt, a potassium salt, a rubidium salt, a beryllium salt, a magnesium salt, a calcium salt or a strontium salt. In particular, the salt of carbonic acid may be sodium bicarbonate or potassium bicarbonate and is preferably potassium bicarbonate. It may be appreciated that the term "captan" can refer to the compound identified by IUPAC name (3aR,7aS)-2-[(Trichloromethyl)sulfanyl]-3a,4,7,7a-tetrahydro-1H-isoindole-1,3(2H)-dione.
- The plant protection composition may comprise the tracer composition in an amount which is at least 0.01% (v/v), more preferably at last 0.1% (v/v), at least 0.25% (v/v), at least 0.5% (v/v) or at least 0.75% (v/v), and most preferably at least 1% (v/v). The plant protection composition may comprise the tracer composition in an amount which is less than 50% (v/v), more preferably less than 40% (v/v), less than 30% (v/v), less than 20 %(v/v) or less than 10% (v/v), and most preferably is less than 5% (v/v). The plant protection composition may comprise the tracer composition in an amount which is between 0.01 and 50% (v/v), more preferably between 0.1 and 40% (v/v), between 0.25 and 30% (v/v), between 0.5 and 20% (v/v) or between 0.75 and 10% (v/v), and most preferably is between 1 and 5% (v/v).
- The plant protection composition may comprise the PPP in an amount which is at least 20% (v/v), more preferably at least 40% (v/v), at least 60% (v/v) or at least 80% (v/v), and most preferably at least 90% (v/v) or at least 95% (v/v). The plant protection composition may comprise the PPP in an amount which is less than 99.99% (v/v), more preferably less than 99.9% (v/v) and most preferably is less than 99% (v/v). The plant protection composition may comprise the PPP in an amount which is between 20 and 99.99% (v/v), more preferably between 60 and 99.9% (v/v) or between 40 and 99.9% (v/v), and most preferably between 90 and 99% (v/v) or between 95 and 99% (v/v).
- Preferably, the PPP has a pH of less than 10 at 20°C, more preferably less than 9 at 20°C or 8 at 20°C, and most preferably less than 7 at 20°C. Preferably, the PPP has a pH of more than 4 at 20°C, more preferably more than 6 at 20°C.
- Alternatively, the tracer composition may be diluted for analysis without being combined with a PPP.
- Accordingly, in a further aspect there is provided an analysis composition comprising:
- the tracer composition of the first aspect; and
- a solvent.
- The solvent may comprise water and/or an alcohol. Preferably, the solvent comprises water.
- The analysis composition may comprise the tracer composition in an amount which is at least 0.01% (v/v), more preferably at last 0.1% (v/v), at least 0.25% (v/v), at least 0.5% (v/v) or at least 0.75% (v/v), and most preferably at least 1% (v/v). The analysis composition may comprise the tracer composition in an amount which is less than 50% (v/v), more preferably less than 40% (v/v), less than 30% (v/v), less than 20 %(v/v) or less than 10% (v/v), and most preferably is less than 5% (v/v). The analysis composition may comprise the tracer composition in an amount which is between 0.01 and 50% (v/v), more preferably between 0.1 and 40% (v/v), between 0.25 and 30% (v/v), between 0.5 and 20% (v/v) or between 0.75 and 10% (v/v), and most preferably is between 1 and 5% (v/v).
- The analysis composition may comprise the solvent in an amount which is at least 20% (v/v), more preferably at least 40% (v/v), at least 60% (v/v) or at least 80% (v/v), and most preferably at least 90% (v/v) or at least 95% (v/v). The analysis composition may comprise the solvent in an amount which is less than 99.99% (v/v), more preferably less than 99.9% (v/v) and most preferably is less than 99% (v/v). The analysis composition may comprise the solvent in an amount which is between 20 and 99.99% (v/v), more preferably between 60 and 99.9% (v/v) or between 40 and 99.9% (v/v), and most preferably between 90 and 99% (v/v) or between 95 and 99% (v/v).
- In accordance with a third aspect, there is provided an apparatus comprising:
- a dual wavelength light emitting device to selectively illuminate a surface at a first wavelength and to selectively illuminate the surface at a second wavelength, wherein the surface has a material thereon;
- an imaging device for generating a first fluorescence image in response to the illumination of said surface at the first wavelength and a first visual image in response to the illumination of said surface at the second wavelength; and
- a processor configured to process the first visual image to generate a mask indicative of an area of the first visual image; generate a second fluorescence image by masking the first fluorescence image using the mask; and process the second fluorescence image to determine a coverage information and/or a dosage information of said material.
- The first wavelength may be in the range of 400 to 500 nm.
- The second wavelength may be in the range of 500 to 600 nm.
- The light emitting device may comprise at least one light emitting diode. Each of said at least one light emitting diodes may be placed in a back focal plane of said light emitting device to provide a uniform pattern of light to illuminate said surface.
- The light emitting device may further comprise at least one of:
- a first planoconvex lens;
- at least one emission filter; and
- a second planoconvex lens.
- The surface may comprise a plant or a part thereof.
- In accordance with a further aspect, there is provided a method comprising:
- selectively illuminating a surface at a first wavelength and a second wavelength, wherein the surface has a material thereon;
- generating a first fluorescence image of said surface in response to the illumination at the first wavelength;
- generating a first visual image of said surface in response to the illumination at the second wavelength;
- processing the first visual image to generate a mask indicative of an area of the first visual image;
- generating a second fluorescence image by masking the first fluorescence image using the mask; and
- processing the second fluorescence image to determine a coverage information and/or a dosage information of said material.
- The material could be a bacteria. Accordingly, the method of the further aspect could be used to detect bacteria on a surface. For instance, the first wavelength could cause the bacteria to fluoresce.
- However, in a preferred embodiment, the material is the tracer composition of the first aspect or the plant protection composition of the second aspect. Accordingly, the method may comprise initially spraying the surface with a spray composition comprising the tracer composition of the first aspect or the plant protection composition of the second aspect. The method may comprise processing the first fluorescence image to determine a coverage information and/or a dosage information of said tracer composition or plant protection composition.
- The surface may comprise a plant, or a part thereof. In some embodiments, the plant comprises a crop plant. The term "crop plants" as used herein, includes any edible or non-edible plant, including decorative, plant species with commercial value, which is planted and cultivated for commercial use. Thus, crop plants include floral and nonfloral plants, trees, vegetable plants, turf, and ground cover. It will be appreciated that trees include fruit trees. The term "plant" is meant to include germinant seeds, emerging seedlings, and established vegetation, including roots and above-ground portions (for example, leaves, stalks, flowers, fruits, branches, limbs, root, etc.). The term "turf" used herein refers to grass which grow in areas in which they are desired, or purposely planned for and maintained, for example, a lawn. Turf also refers to a sod, where the surface layer of ground consisting of a mat of grass and grass roots.
- Non-limiting specific examples of crop plants include members of the genera Allium, Apium, Asparagus, Brassica, Camellia, Cicera, Citrus, Coffea, Daucus, Fragaria, Glycine, Helinthus, Lactuca, Lens, Linum, Malus, Phaseolus, Pisum, Prunus, Pyrus, Ricinus, Rubus, Sinapis, Solanum, Spinacia, Theobroma, Vanilla, Vicia, Vitis and Zea. More specifically, the crop plants may include apple trees, asparagus, beans, broccoli, Brussel sprout, cabbage, cacao tree, carrot plants, castor oil plants, cauliflowers, celery, cherry tree, chickpea plants, coffee plants, grape vines, Jerusalem artichokes, leeks, lentil plants, lettuce, linseed, maize, mustard plants, onions, orange trees, peach trees, pea plants, pear trees, potato plants, rapeseed, raspberry plants, spinach, strawberry plants, sunflowers, tea plants, tomato plants and vanilla plants. Beans may include black beans, broad beans, butter beans, common beans, faba beans, fava beans, French beans, green beans, kidney beans, lima beans, pinto beans, runner beans and/or soybeans.
- Advantageously, the method allows a user to determine spray deposition of PPP on a crop plant.
- The first wavelength may be between 150 and 700 nm, between 300 and 650 nm, between 350 and 600 nm or 400 and 500 nm. In some embodiments, the photon does not have a wavelength of 460 nm. This is because photons with a wavelength of 460 nm may be absorbed by chlorophyll. Accordingly, the first wavelength may be between 465 and 500 nm.
- The second wavelength is preferably different to the first wavelength. The second wavelength may be between 450 and 650 nm, between 475 and 625 nm or between 500 and 600 nm.
- The first fluorescent image may record the emission of light with a predetermined wavelength in the area. The predetermined wavelength is preferably different to the first wavelength. The predetermined wavelength may be between 450 and 650 nm, more preferably between 475 and 625 nm, and most preferably between 500 and 600 nm.
- The method may further comprise:
- generating a plurality of candidate first visual images at different illumination intensities; and
- selecting one of said plurality candidate first visual images as said first visual image.
- The method may further comprise:
- generating a plurality of candidate first fluorescence images at different illumination intensities; and
- selecting one of said plurality candidate first fluorescence images as said first fluorescence image.
- Said selecting may select the best candidate according to a metric. Said metric may include determining the candidate with the most pixels having a pixel value above a first threshold value and/or the candidate with the most pixels below a second threshold value.
- Determining coverage information may comprise determining a percentage of the surface covered by the material. Determining a percentage of the surface covered by the material may comprise determining a quantity of fluorescent pixels as a percentage of all pixels of the respective fluorescence image, wherein a fluorescent pixel is a pixel having a pixel value above a fluorescence threshold.
- Alternatively, or additionally, determining said dosage information may comprise:
- determining an amount of fluorescence based on an intensity of each fluorescent pixel of the respective fluorescence image, wherein a fluorescent pixel is a pixel having a threshold above a fluorescence threshold; and
- determining dosage information based on the amount of fluorescence.
- Alternatively, or additionally, processing the respective fluorescence image comprises:
- converting pixels of the fluorescence image into a binary image based on whether or not each pixel is above or below a fluorescence threshold; and
- determining boundaries of droplets of said material based on the binary image.
- Accordingly, the method may comprise analysing determining the number of deposits of the material on the surface. The method may comprise determining the size of the deposits of the material on the surface. The method may comprise determining the average size of the deposits. Alternatively, the average size of the droplets may be known based upon the method used to spray the surface with the spray composition. The method may comprise determining said dosage information based upon the amount of the deposits and/or the average size thereof.
- Selectively illuminating the surface may comprise illuminating the surface as a uniform pattern of light.
- All features described herein (including any accompanying claims, abstract and drawings), and/or all of the steps of any method or process so disclosed, may be combined with any of the above aspects in any combination, except combinations where at least some of such features and/or steps are mutually exclusive.
- For a better understanding of the invention, and to show how embodiments of the same may be carried into effect, reference will now be made, by way of example, to the accompanying drawings, in which:-
-
Figure 1 shows the excitation and emission spectra matrices (EEMs) in solution of A)brilliant sulfaflavin pH 7; B) tryptophan; C) vanillin; and D) riboflavin 5'-monophosphate sodium salt (FMN-Na); -
Figure 2 shows the background fluorescence for a number of crops; -
Figure 3 is a graph showing the fluorescence FMN-Na in solution and as a dry deposit; -
Figure 4 is a graph showing how the fluorescence of FMN-Na is effected by exposure to sunlight; -
Figure 5 shows how sucrose and glycerol affect the fluorescence of FMN-Na; -
Figure 6 shows sunlight-induced photodegradation of FMN-Na in the presence of a number of compounds; -
Figure 7 is a graph showing the UV absorbance of FMN-Na, ascorbic acid and sodium thiosulphate; -
Figure 8 is a graph showing the effect that varying concentrations of ascorbic acid and sodium thiosulphate had on the photostability of FMN-Na; -
Figure 9 shows a spray deposit fluorimeter; -
Figure 10 shows graphs showing the correlation between the number of deposits on a sample and the measured relative fluorescence unit (RFU) of the wash off obtained from the samples, the data is grouped into separate graphs depending upon the size of the deposits; -
Figure 11 shows graphs showing the correlation between the volume of tracer on the slide and the percentage cover, the deposits were created using a spinning disk, and the samples are grouped depending upon the revolutions per minute (RPM) of the disk; -
Figure 12 is a graph showing the correlation between the volume of tracer on the slide and the fluorescence; -
Figure 13 is a graph showing spray deposit coverage in canopy zones on broccoli; -
Figure 14 is a graph showing spray deposit coverage on the lower leaf side of strawberry plants with different wetters; -
Figure 15A is a graph showing spray deposition coverage of leaves on apple trees prior to sprayer modification; andFigure 15B is a graph showing spray deposition coverage of leaves on apple trees after sprayer modification; -
Figure 16 is a block diagram of a system in accordance with an example embodiment; -
Figure 17 shows representations of images in accordance with an example embodiment; -
Figures 18 to 20 are flow charts showing algorithms in accordance with an example embodiment; -
Figure 21 is a block diagram of a system in accordance with an example embodiment; -
Figure 22 is a block diagram of a light emitting device in accordance with an example embodiment; -
Figure 23 is a flow chart showing an algorithm in accordance with an example embodiment; and -
Figure 24 is a representation of an image in accordance with an example embodiment. - Firstly, the inventors wanted to identify a fluorescent tracer that could be used in a method of detecting and analysing the extent and thoroughness of spray deposition. A suitable tracer would ideally:
- a) have a high fluorescence quantum yield;
- b) be detectable with minimal interference from background fluorescence of a plant;
- c) be water soluble;
- d) not require the use of a pH buffer;
- e) possess adequate light stability characteristics;
- f) be safe and acceptable for use on edible crops; and
- g) be cost effective.
- Initially, 140 potential compounds were identified. An initial screen, taking the above factors into consideration, left 21 possible compounds. CTG's Horiba Aqualog was used to measure the compounds' excitation and emission spectra matrix (EEM) in solution and in solid phase, the solution results for four of the potential compounds are shown in
Figure 1 . Riboflavin 5'-monophosphate sodium salt (FMN-Na), a version of vitamin B2, was selected as the preferred compound. In particular, Riboflavin 5'-monophosphate was selected because it absorbs photons in the visible part of electromagnetic spectrum, which reduces the chances of interference from other compounds in plant tissues that fluoresce under UV light. Furthermore, the emission of fluorescing riboflavin 5'-monophosphate is between 500 - 580 nm. This is well away from the absorbance and emission spectrum of chlorophyll, thus providing reduced background fluorescence. - For the fluorescent tracer to be effective it must be compatible with widely used pesticides. Accordingly, the inventors prepared an initial solution of FMN-Na in deionised water, where the FMN-Na was present at a concentration of 0.013 mg / ml. The baseline fluorescence of solutions of known pesticides, prepared according to their label instructions, was measured. The initial solution of FMN-Na was then added to the known pesticides, so that the final pesticide preparations had a resulting concentration of FMN-Na of 0.25 µg / ml, and the fluorescence was measured again. The baseline fluorescence was subtracted to determine the amount of fluorescence which was due to the FMN-Na, and this was compared to the fluorescence observed for a concentration of FMN-Na of 0.25 µg / ml in de-ionised water. The results are shown in Table 1.
Table 1 - Effect of common pesticides on riboflavin fluorescence Pesticide Tested Active Agent(s) Effect on riboflavin fluorescence in solution (%) Switch® Cyprodinil and fludioxonil -115 DiPel® Bacillus thuringiensis subspecies kurstaki -108 Stomp® Aqua Pendimethalin -98 Signum® Boscalid and pyraclostrobin -70 Apollo® Clofentezine -51 Teldor® Fenhexamid -48 Captan Captan (IUPAC name (3aR,7aS)-2-[(Trichloromethyl)sulfanyl]-3a,4,7,7a-tetrahydro-1H-isoindole-1,3(2H)-dione) -42 Rovral® Iprodione -41 Runner® Methoxyfenozide -25 Naturalis® Beauveria bassiana strain ATCC 74040 -24 AQ10® Ampelomyces quisqualis strain M10 -22 Coragen® Chlorantraniliprole (Rynaxpyr®) -20 Masia® Tebufenpyrad -17 Amistar® Azoxystrobin -15 Cyren® Chlorpyrifos -15 Calypso® Thiacloprid -11 Potassium bicarbonate Potassium bicarbonate -7 Scala® Pyrimethanil -7 Tracer® Spinosad -6 Agrimec® Abamectin -5 Sysythane® 20EW Fungicide Myclobutanil -1 - Some of the pesticide products appear to exhibit some slight fluorescence, which may have affected the results to a certain degree. In particular, it will be noted that for both Switch® and DiPel® a decrease in fluorescence of greater than 100% is observed. This may be due to these pesticides reducing or quenching the fluorescence of riboflavin and, at the same time, the fluorescence of the pesticide may also have been quenched due to the addition of FMN-Na, thus causing an overall greater than 100% loss of fluorescence.
- Despite these results, it is noted that the vast majority of the pesticides tested reduced the fluorescence of FMN-Na by less than 50%. This suggests that FMN-Na could be used with a large number of pesticides.
- The inventors also investigated the background fluorescence exhibited by a number of plants using a handheld imaging fluorometer, and the results are shown in
Figure 2 . The inventors noted that background fluorescence is not a problem for a wide range of crops and tissue types. - Accordingly, FMN-Na was identified as a suitable fluorescence tracer.
- As shown in
Figures 3 and 4 , FMN-Na displayed a low quantum yield when dry and very poor photostability properties. - As shown in
Figure 5 , the inventors found that it was possible to improve the fluorescent properties of FMN-Na by combining it with gelling agents. In particular, sucrose and glycerol were used as these compounds are safe and edible. It is noted that both compounds improved the fluorescent properties of FMN-Na when used alone, but offered a particular improvement when used in combination. - The inventors found that FMN-Na was unstable in sunlight, and neither sucrose nor glycerol improved its stability. Accordingly, the inventors tested the effect a number of compounds had on the photodegradation of FMN-Na, and the results are shown in
Figure 6 . The two most effective compounds tested were ascorbic acid and sodium thiosulphate. -
Figure 7 shows the UV absorbance spectra for FMN-Na, ascorbic acid and sodium thiosulphate. It will be noted that ascorbic acid closely matches the absorbance spectra of riboflavin between 220 and 300 nm. Without wishing to be bound by theory, it is thought that by absorbing light between these wavelengths the ascorbic acid prevents photodegradation of FMN-Na. It is noted that ascorbic acid is also a free radical scavenger. Accordingly, this action could also be responsible for the improvement in the stability of FMN-Na. - To investigate this, the inventors prepared a tracer composition comprising the following components:
- 20g riboflavin-5'-phosphate sodium salt (food grade);
- 800 g sucrose (food grade)
- 0.5 L glycerol (food grade); and
- 0.5 L water (deionised).
- In some compositions, ascorbic acid and/or sodium thiosulphate were also added to give a concentration of 0.85M or 1.7M, prior to the addition of glycerol.
- A further formulation (formulation D) was prepared by dissolving tocopheryl acetate in a 1:1 weight ratio in ethanol. The ethanol solution was then added to a formulation comprising ascorbic acid. The amount of water in this formulation was reduced so that the total volume of the formulation was the same and the concentration of the other components was not affected. Tocopherol compounds were tested as they have been reported to interact with ascorbic acid and possibly riboflavin to reduce the process of photodegradation.
- All of the compositions were then diluted 2% (v/v) with deionised water to give final testing solutions. The concentrations of the various components in the final formulations tested are provided in table 2.
Table 2 - Components present in tested formulations Concentration (g/1) Standard A B C D E F Riboflavin-5'-phosphate sodium salt 14.26 14.26 14.26 14.26 14.26 14.26 14.26 Sucrose 570.26 570.26 570.26 570.26 570.26 570.26 570.26 Glycerol 449.08 449.08 449.08 449.08 449.08 449.08 449.08 Deionised water 356.41 356.41 356.41 356.41 335 356.41 356.41 Ascorbic acid - 106.7 53.5 53.5 106.7 - - Sodium thiosulphate - - - 47.9 - 95.8 47.9 Tocopheryl acetate - - - - 10.75 - - Ethanol - - - - 10.75 - - -
Figure 8 shows how the photostability of FMN-Na varied in the different formulations. In particular, it will be noted that the stability of FMN-Na was significantly improved when using ascorbic acid at a concentration of 0.85 M, and at a concentration of 1.7M the FMN-Na was substantially photostable. Interestingly, tocopheryl acetate did not appear to have a beneficial effect on the photodegradation of FMN-Na. - Based upon these results, the inventors developed a formulation which they could use in further tests.
- In view of the results given in the above examples, the inventors developed a formulation for further testing, and the components of the formulation are given in table 3.
Table 3 - Tracer composition developed for further testing Component Amount / wt% Riboflavin-5'-phosphate sodium salt 0.99 Sucrose 39.5 Glycerol 31.1 Water (deionised) 24.7 L-ascorbic acid 3.7 - In conclusion, the inventors were able to identify a food safe tracer comprising FMN-Na. The inventors noted that inclusion of sucrose and glycerol was able to greatly enhance the fluorescence of dry deposits and the inclusion of ascorbic acid was able to mitigate photodegradation. The tracer is compatible with a wide range of pesticides and crops. Furthermore, it can be used on crops without crop destruction, and is safe to humans and the environment.
- The inventors have further developed a spray deposit fluorimeter to allow analysis of the deposited spray to be conducted. A
suitable fluorimeter 2 is shown inFigure 9 . Thefluorimeter 2 comprises a processing and visualisation module 4 coupled to a detection module 6. The detection module 6 is configured to emit electromagnetic radiation at a predetermined wavelength, for the tracer described in example 1 this wavelength could be between 320 and 490 nm. As shown in the figure, the detection module can be focused on aplant 8 which has been pre-treated with a spray comprising a fluorescent tracer. The detection module 6 is also configured to detect emitted wavelengths of light. For the experiments described below, the emission wavelength used by the inventors was 470 nm and the detected wavelength was 550 nm, but it will be appreciated that other wavelengths could also be used. -
Figure 16 is a block diagram of a system, indicated generally by thereference numeral 170, in accordance with an example embodiment.System 170 shows a surface 171 (such as a plant or leaf surface), a material 172 (such as a tracer material), a light emitting device 173, an imaging device 174, and aprocessor 175. ViewingFigure 17 in conjunction withFigure 9 , thesurface 171 may be a surface of theplant 8 which is sprayed with a tracer material, such as thematerial 172. The light emitting device 173 may be comprised within the detection module 6, and the imaging device 174 andprocessor 175 may be comprised within the processing and visualization module 4. - In an example embodiment, the light emitting device 173 is a dual wavelength light-emitting device. As shown by the dotted
arrow 176, the light emitting device 173 illuminates thesurface 171 at a first wavelength and a second wavelength. As shown by dottedarrow 177, in response to the illumination, light is received from thesurface 171, and the imaging device 174 generates images based on the received light. The generated images are processed at theprocessor 175, and theprocessor outputs data 178. In another embodiment, the light emitting device 173 is a single wavelength light-emitting device. - Thus, in general terms, the
system 170 provides imaging hardware and processing algorithms. The imaging hardware provides light sources and captures images (e.g. visual and fluorescence
images). The processing algorithms extract information from the captured images. - In an example embodiment, the light-emitting device 173 illuminates the
surface 171 at a first wavelength and a second wavelength. In one example, the first wavelength is in the range of 400 to 500nm (e.g. 470nm) and the second wavelength is in the range of 500 to 600 nm (e.g. 530nm). In another example, the first wavelength is in the range of 465nm to 500nm. The light emitting device 173 may comprise at least one light emitting diode. Each of said at least one light emitting diodes may be placed in a back focal plane of light emitting device 173 to provide a uniform pattern of light to illuminatesurface 171. This is explained in further detail below with respect to inFigure 22 . -
Figure 17 shows representations of images, indicated generally by thereference numeral 180, in accordance with an example embodiment. Theimages 180 include a firstvisual image 183, afirst fluorescence image 184, amasked image 185, and asecond fluorescence image 186. The firstvisual image 183 is captured by the imaging device 174 in response to the light-emitting device 173 illuminating the surface (a leaf in this example) with visual wavelength light. Thefirst fluorescence image 184 is captured by the imaging device 174 in response to the light-emitting device illuminating the surface with light having a wavelength such that thematerial 172 is caused to fluoresce. - In the
example images 180, the firstvisual image 183 comprises aleaf area 181 and abackground area 182. Thefirst fluorescence image 184 comprises a fluorescence pattern. Of course, if a different surface were being illuminated, then thearea 181 would have a different form. - In order to determine the coverage and/or quantity of material applied to a surface (e.g. of a leaf), it is only necessary to process data from the leaf. Thus, the first
visual image 183 is used to determined which parts of the fluorescence image should be processed. Themasked image 185 comprises amasked area 185a (indicating where fluorescence data is to be processed) and an unmaskedarea 185b (indicating where fluorescence data is not to be processed). - The
second fluorescence image 186 comprises a processedarea 186a and anunprocessed area 186b. Thus, fluorescence data within the processedarea 186a can be used to determined coverage and/or dosage information, as discussed further below. - As discussed further below, in the event that the leaf area is large enough to cover the entirety of the
image 183, then it may not be necessary to generate themasked area 185a, since the first and second fluorescence images would be identical. -
Figure 18 is a flowchart of an algorithm, indicated generally by thereference numeral 190, in accordance with an example embodiment. - At
step 192 of thealgorithm 190, a surface (such as surface 171), is illuminated, for example, by light emitting device 173. Atstep 194, the imaging device, such as imaging device 174, generates a first visual image (in response to the illumination of thesurface 171 at the second wavelength) and, atstep 196, the imaging device generates a first fluorescence image (in response to the illumination of thesurface 171 at the first wavelength). Finally, atstep 198, a processor, such asprocessor 175, processes the generated images. Thus, thesteps images steps -
Figure 19 is a flowchart of an algorithm indicated generally by thereference numeral 200, in accordance with an example embodiment.Algorithm 200 is an example implementation ofstep 198 of thealgorithm 190. - The
algorithm 200 starts atstep 202, where a mask is generated (based on the first visual image generated in the step 194). Atstep 204, a second fluorescence image is generated by masking the first fluorescence image (generated in step 196) using the mask. Thus, as shown inFigure 17 , thestep 202 may generate themasked image 185 and thestep 204 may generated thesecond fluorescence image 186. - Finally, at
step 206, thesecond fluorescence image 186 is processed to determine the coverage information and/or dosage information of thematerial 172. The unmasked area of the image is omitted from the second fluorescence image such that any fluorescence detected in the background of the surface being illuminated (as shown in the un-masked area) is not included in calculation of the coverage and/or dosage of the tracer. - In one example embodiment, in order to determine the coverage information and/or dosage information of the material in the
step 206, the second fluorescence image is processed by theprocessor 175. Theprocessor 175 may convert pixels of the second fluorescence image into a binary image based on whether or not each pixel is above or below a fluorescence threshold. For example, if a value of a pixel is below the fluorescence threshold, the pixel is assigned with a binary value of zero and the pixel is determined to be a non-fluorescent pixel; and if a value of a pixel is above the fluorescence threshold, the pixel is assigned with a binary value of one and the pixel is determined to be a fluorescent pixel. The binary image can then be used for determining boundaries of droplets of the material based on the binary values of the pixels. - In one example embodiment, the coverage information of the
material 172 is determined in thestep 206 based on a percentage of thesurface 171 covered by thematerial 172. For example, the percentage of the surface covered by the material may be determined based on quantity of fluorescent pixels as a percentage of all pixels of the second fluorescence image. As discussed earlier, the fluorescent pixels may be determined based on whether the pixel has a pixel value above a fluorescence threshold. - In one example embodiment, the dosage information of the
material 172 is determined in thestep 206 based on an amount of fluorescence. For example, the amount of fluorescence is determined based on an intensity of each fluorescent pixel of the second fluorescence image. As discussed earlier, the fluorescent pixels may be determined based on whether the pixel has a pixel value above a fluorescence threshold. - Determinations of coverage and/or quantity may be useful in determination the extent to which are material has been applied to a surface.
- The skilled person will be aware of alternative implementations of the
step 206. -
Figure 20 is a flowchart of an algorithm indicated generally by thereference numeral 210, in accordance with an example embodiment. Thealgorithm 210 may be used as part of thealgorithm 190 described above - The
algorithm 210 starts atstep 212, where the imaging device 174 generates a plurality of candidate images at different illumination intensities. Next, atstep 214, the best candidate of the candidates is selected (according to some metric). Thealgorithm 210 may therefore be used in selecting illumination intensities in the generation of both the first visual image (in step 194) and the first fluorescence image (in step 196). In one example embodiment, three illumination intensities are provided and the most appropriate illumination intensity is chosen for the generation of the said images. - In one example, the metric used in
step 214 to select the best candidate may include determining the candidate with the most pixels having a pixel value above a first threshold value (e.g. the most pixels having a value above a zero or noise-threshold). Alternatively, the metric may include determining the best candidate to be the candidate with the most pixels having a pixel value below a second threshold value (e.g. the most pixels below a maximum or saturation threshold). -
Figure 21 is a block diagram of a system, indicated generally by thereference numeral 220, in accordance with an example embodiment. Thesystem 220 is an example implementation of an arrangement of the light emitting device 173 and the imaging device 174 described above. - The
system 220 comprises a first light emitting diode (LED)module 221, afirst LED 222a mounted on the first LED module, asecond LED 222b (typically mounted on the first LED module, but optionally mounted on a second LED module, not shown), afirst lens 223a, asecond lens 223b, anexcitation filter 224, athird lens 225, asample surface 226, at least oneemission filter 227, a plurality offourth lenses 228, and a camera sensor orimaging device 229. - In an example embodiment, the
first LED 222a is a blue LED emitting blue light (e.g. 470nm), and thesecond LED 222b is a green LED emitting green light (e.g. 530nm). Thus, thesystem 220 as shown inFigure 21 is being used to generate a first fluorescence image and can also be used to generate a first visual image (by illuminating thesurface 226 using thesecond LED 222b). (It should be noted that theLEDs LEDs 22a and 222b may be identical, with other LEDs in the array either being identical to those LEDs or different, thereby providing the first and second LEDs of a plurality of LEDs required by some example embodiments.) - In an example embodiment, as shown in
system 220, the first andsecond LEDs LED module 221 are placed in a back focal plane of the dual wavelength light emitting device (system 220) to provide a uniform pattern of light to illuminate the surface of the leaf or plant (i.e. the sample surface 226). Thus, the first andsecond LEDs sample surface 226. - An image (either fluorescent or visual) of the illuminated area is formed on the camera sensor or
imaging device 229. To do this, the sample may be positioned in the front focal plane of thelens 225 and the light then passes through theemission filter 227 and the fourth lenses 228 (e.g. a pair of achromat lenses) to focus the image on the camera sensor orimaging device 229. The magnification of the image at the camera sensor orimaging device 229 may be selected to match the illumination area. In this case, a demagnified image may be produced, if the camera is smaller than the illuminated area. - As indicated above, the
lens 225 and/or thefourth lenses 228 may be achromat lenses. However, this is not essential to all embodiments. Other lens configuration (e.g. cheaper or simpler lenses) could be chosen. -
Figure 22 is block diagram of a system, indicated generally by thereference numeral 230, in accordance with an example embodiment.System 230 shows a LED module (such asLED module 221 described above). TheLED module 221 may be a LED printed circuit board (PCB) assembly. - The
LED module 221 comprises a plurality of blue LEDs 232 (similar to thefirst LED 222a) and a plurality of green LEDs 234 (similar to thesecond LED 222b). Theblue LEDs 232 andgreen LEDs 234 may be arranged in an alternating way as shown insystem 230. In the event that theLED module 221 implements theLED module 221 described above, then the relative positions of the first and second LEDs within themodule 221 determines whether or not theLEDs - Of course, many alternative arrangements of LEDs are possible.
- The embodiments described above with reference to
Figures 16 to 22 generally assume that first and second light emitting devices having different wavelength are used. This is not essential to all embodiments. For example, the generation of a visual image may be omitted in some circumstances. -
Figure 23 is a flow chart showing an algorithm, indicated generally by thereference numeral 240, in accordance with an example embodiment. - At
step 242 of thealgorithm 240, a surface (such as thesurface 171 described above), is illuminated, for example, by light emitting device 173. Atstep 244, the imaging device, such as imaging device 174, generates a fluorescence image (in response to the illumination of thesurface 171 at the first wavelength). Atstep 246, a processor, such asprocessor 175, processes the fluorescence image. -
Figure 24 is a representation of an image, indicated by thereference numeral 254, in accordance with an example embodiment. Theimage 254 is an example of a fluorescence image that may be generated in thestep 244 of thealgorithm 240. - In the
example image 254, thefluorescence image 184 comprises a fluorescence pattern. The image pattern occupies the entirety of the sampled area, such that there is no need for masking and consequently no need for the generation of a visual image. Thus, in order to determine the coverage and/or quantity of material applied to a relevant surface, it is only necessary to process the data of thefluorescence image 254. - The inventors tried a variety of methods to calibrate the fluorimeter to allow quantitative analysis, and these are described below. In each of the below described experiments, the tracer formulation provided in table 3 was diluted 2% v/v in deionised water. The diluted formulation was then then sprayed onto laser cut plastic rectangles of fixed sizes (9.5 mm × 7 mm) using a modified laboratory sprayer.
- The laboratory sprayer was built using a Micron ULVA (Ultra Low Volume Atomiser) spray head. By controlling the flow rate of the liquid onto the ULVA, the rotational speed, and the exposure time of the squares and WSPs, the characteristics of the spray being applied could be varied. The variations applied included the size of the droplets and number of droplets. For each of the experiments described below, the deposits on the plastic rectangles were measured using the prototype handheld imaging fluorometer. In addition the spray deposits on the plastic squares were washed off into 4 ml of deionised water, and the fluorescence measured using a benchtop fluorimeter (Jenway 6280).
- The plastic rectangles were compared with water sensitive papers cut to the same size. The plastic squares and water sensitive papers (WSPs) were positioned side by side in an alternating sequence and then sprayed. The deposits on the WSPs were analysed using a RGB camera and the subsequent images processed using ImageJ..
-
Figure 10 shows the correlation between the number of deposits and the measured relative fluorescence units (RFU) of the wash-off. The sprayed samples were separated by the size of the deposits based on the American Society of Agricultural and Biological Engineers (ASABE) S572.1 definition of droplet size classification, this is reproduced in table 4.Table 4 - Droplet size classification Spray Quality VMD Range* (µm) Extremely Fine <60 Very Fine 61-105 Fine 106-235 Medium 236-340 Coarse 341-403 Very Coarse 404-502 Extremely Coarse 503-665 Ultra Coarse >665 *VMD is the droplet size at which 50% of the spray volume is in droplets larger than the VMD and 50% of the volume is in droplets smaller than the VMD. - It is noted that calibration for number of deposits was achieved but image analysis was too CPU intensive to allow the number of deposits to be recorded using the hardware in the handheld device. Furthermore, spray deposits in the field coalesce and therefore a count of deposits would not be useful. However, the analysis could be conducted using a computer with a superior CPU, and might be useful in some situations.
- For this experiment, the plastic squares were grouped together depending upon the rotation speed of the sprayer. It was found that varying the rotation speed varied the size of the droplets, as shown in table 5.
Table 5 - Correlation between rotation speed of sprayer and droplet size Figure RPM Approximate diameter of deposits (µm) 11A 1142 400-600 11B 1958 250-500 11C 4001 100-400 11D 7840 80-200 11E 12170 60-180 11F 16254 40-160 - Accordingly, when the deposits had a diameter approximately between 400 and 650 µm up to 0.06 µl of the tracer was deposited on the slide and only about 25% coverage was obtained, as shown in Figure 11A. Note the values given provide the volume of the tracer composition on the slide, rather than the total volume of liquid. As explained above, the liquid on the slides is a 2% v/v solution of the tracer in deionised water. Accordingly, if 0.06 µl of the tracer was deposited on the slide, it will be appreciated that this corresponds to a total volume of 3 µl of liquid having been deposited. Meanwhile, Figure 11F shows the percentage coverage for deposits with a diameter between 40 - 160 µm. As shown in the Figure, almost 100% coverage was obtained with only about 0.02-0.03 µl of the tracer formulation (1-1.5 µl total liquid) having been deposited. The reason for this discrepancy is that larger diameter droplets are thicker than smaller droplets, and so deposit the same amount of tracer/liquid on a smaller surface area.
- As shown in
Figure 11 , if the size of the droplets is kept constant then there is a strong correlation between percentage cover and the amount of the tracer deposited. Accordingly, if the size of the droplets and the percentage cover was known, it would be possible to calculate the amount of the tracer deposited. - For fluorescent images, fluorescence can be measured in bit values (pixel brightness). Accordingly, images obtained using the handheld fluorimeter were analysed and the mean bit value/mm2 calculated, the results are shown in
Figure 12 . As shown in the Figure, there is a strong correlation between the volume of the tracer measured and the mean bit value/mm2. -
Figure 12 shows the rotation speed of the sprayer used to produce the different droplets, and this corresponds to droplet size as explained above. For droplets of different sizes there is a small difference in the relationship between fluorescence values and the volume of liquid on the measured surface. However, this difference is slight, and the linear relationship between fluorescence value and volume of liquid, ignoring droplet size, has an R2 value of 0.72, meaning that fluorescence value explains over 70% of the measure of volume of tracer. - Furthermore, if the largest droplets with an approximate diameter between 400-600 µm are removed, then the linear relationship between fluorescence value and volume of liquid has an R2 value of 0.782. It is noted that the largest size droplets are rare in agricultural spraying, and often shatter into smaller droplets when they hit a plant surface.
- As explained in example 1, the degree of fluorescence will vary depending upon the pesticide used. Accordingly, to ensure accuracy, it is important to measure the fluorescence of a sample comprising the pesticide and the tracer. This measurement can then be used to calibrate the measurements obtained in the field.
- The inventors worked with over 20 growers to conduct 151 assessments over a two year period. These spray assessments were conducted on 19 crop types and tested a wide variety of spray variables. In particular, the inventors tested the tracer composition on baby red leaf lettuce, baby leaf spinach, iceberg lettuce, field peas, field beans, celery, brown onion, asparagus, sweetcorn, potatoes, baby gem lettuce, cherry trees, pear trees raspberry plants, grape vines, broccoli, strawberries and apple trees.
- Results of the spray coverage analysis were highly variable between crops, spray settings and conditions. Typically high levels of spray deposit coverage were observed on the upper leaf surface but very low or zero coverage was observed on the lower leaf surface particularly at the bottom of the canopy. The growers were surprised at some of the low spray coverage recorded in parts of the canopy.
- Results for specific trials are provided below. In all cases, spray deposition was conducted using standard industry practices. The spray deposit coverage was determined based upon the percentage coverage, as described in example 5.2.
- Broccoli plants were sprayed with an aqueous solution comprising FMN-Na. As shown in
Figure 13 , it was found that spray deposit coverage was between 40% and 60% on the upper surface of the broccoli leaves. Conversely, on the lower surface of the broccoli leaves coverage was only between 1% and 11%. The main insect pests of broccoli colonise the underside of leaves. - Accordingly, the low coverage was identified as being problematic and alternative spray methods can now be investigated.
- The inventors also assessed the spray coverage of strawberries sprayed with three different adjuvants commonly used as 'wetting agents' in horticulture. All of the solutions prepared comprised FMN-Na. A control solution did not contain any adjuvant, while the remaining solutions comprised commercially available wetting agents at the concentrations recommended by the manufacturers.
- It was found that in areas with high spray coverage (e.g. the upper side of the leaf), the effect of wetting agents was minimal. However, as shown in
Figure 14 , in areas with lower coverage (e.g. the lower side of the leaf) wetting agents improved spray cover significantly. In particular, it is noted that commercially available wetting agent B doubled the coverage of the lower leaf in the bottom canopy compared to the control. - Accordingly, using the tracer formulation and methods described above, the growers can select the best wetting agents for a given application, ensuring better coverage.
- A Kentish apple grower was experiencing significant mildew disease on their apple crop and faced a risk of large economic loss. The grower had contacted an agronomist for advice who suggested there might be an issue with the spray machine which was used to apply the pesticide to the apple trees. However, the grower insisted that the spraying had been done satisfactorily.
- The apple trees were planted in a three row bed. An aqueous solution comprising 2 wt% FMN-Na was applied to the apple trees using the apple grower's normal spraying system, using the same settings and rates as the grower would normally use when applying pesticides. In particular, the spray machine was set up with a water rate of 400 l/ha. The trees where then imaged and the images were analysed as explained in examples 3 and 4.
- Analysis of the images found that the sprayer was under-spraying the trees. Figure 16A shows the results of measuring spray coverage across the three-row bed of trees at various sections of the tree canopy. The spray coverage across the trees was highly variable and very low. In particular, it was shown that the inner row of trees had especially low spray coverage, but many other areas also displayed below 20% spray coverage, see
Figure 15A . Upon calibrating the spray machine it was discovered that it was actually spraying at 370 l/ha, rather than 400 l/ha as intended, which would be one cause of the low spray coverage. It was thought that a further cause of the low spray coverage and the variability, at least in part, was the old nozzles on the sprayer. - Due to these results, the nozzles on the sprayer were replaced and 3 nozzle outlets were added to provide a more encompassing spray plume. As shown in
Figure 15B , the spray coverage was significantly improved after modification of the sprayer. Furthermore, this improved coverage was achieved using a lower volume of water (300 l/ha) leading to significant cost savings for the grower. Due to the modification in the sprayer, the grower's apple crop was saved. - The inventors have developed a food safe tracer composition which is compatible with a wide range of pesticides and crops. Furthermore, the composition can be used on crops without crop destruction, and is safe to humans and the environment.
- By using the composition it is possible to ascertain the spray deposition achieved when a pesticide is applied to a plant. Advantageously, the inventors have shown that analysis of the data also allows the amount of pesticide deposited to be quantified.
Claims (15)
- A food safe tracer composition, the composition comprising:- a food safe fluorescent molecule which fluoresces when exposed to an excitation wavelength, and thereby emit a photon with a wavelength between 400 and 600 nm;- a stabilising agent configured to improve the photostability of the fluorescent molecule; and- a gelling agent.
- The tracer composition according to claim 1, wherein the fluorescent molecule emits a photon with a wavelength between 500 and 600 nm, and/or wherein the fluorescent molecule fluoresces when exposed to an excitation wavelength between 150 and 700 nm, preferably wherein the fluorescent molecule fluoresces when exposed to an excitation wavelength between 465 and 500 nm.
- The tracer composition according to claim 1 or claim 2, wherein the fluorescent molecule is a compound of formula (I):
 , wherein each of R1 to R8 is independently hydrogen or a C1-5 alkyl,or a salt and/or solvate thereof,preferably wherein the fluorescent molecule is riboflavin 5'-monophosphate or a salt and/or solvate thereof.
 - The tracer composition according to any preceding claim, wherein the tracer composition comprises:- the florescent molecule at a concentration between 0.0001 and 50 wt%, between 0.001 and 50 wt%, between 0.005 and 10 wt%, between 0.01 and 1 wt%, between 0.02 and 0.8 wt%, between 0.04 and o.6 wt%, between 0.06 and 0.4 wt% or between 0.08 and 0.2 wt%;- the gelling agent at a concentration of between 10 and 99 wt%, between 20 and 95 wt%, between 30 and 90 wt%, between 40 and 85 wt%, between 50 and 80 wt%, between 60 and 77.5 wt%, between 65 and 75 wt% or between 67.5 and 72.5 wt%; and/or- a solvent, which preferably comprises water.
- The tracer composition according to any preceding claim, wherein the gelling agent comprises:- a saccharide, or a salt and/or solvate thereof, preferably wherein the saccharide is a disaccharide, or a salt and/or solvate thereof, more preferably wherein the disaccharide is sucrose, or a salt and/or solvate thereof; and/or- an alcohol, and preferably a glycol, preferably wherein the gelling agent comprises a C1-10 alcohol or glycol, or a salt and/or solvate thereof, more preferably wherein glycerol, or a salt and/or solvate thereof;preferably wherein the gelling agent comprises saccharide and a alcohol, and the weight ratio of the saccharide to the alcohol is between 1:10 and 10:1, between 5:1 and 1:5, between 1:4 and 4:1, between 1:3 and 3:1, between 1:2 and 2:1, between 1.75:1 and 1:1, between 1.5:1 and 1.1:1 or between 1.3:1 and 1.2:1.
- The tracer composition according to any preceding claim, wherein the stabilising agent:- absorbs photons with a wavelength between 100 and 500 nm, between 150 and 400 nm, between 175 and 350 nm or between 200 and 325 nm,- comprises thiosulfuric acid, ascorbic acid, β-carotene, ethylenediaminetetraacetic acid (EDTA), thiourea, methionine, thiosulfuric acid, butylated hydroxytoluene (BHT), or a salt and/or solvate thereof; and/or- comprises a compound of formula (II):
 , wherein each of R9 to R12 is independently hydrogen or a C1-5 alkyl,or a salt and/or solvate thereof, optionally wherein the stabilising agent comprises ascorbic acid, or a salt and/or solvate thereof.
 - The tracer composition according to any preceding claim, wherein the tracer composition comprises the stabilising agent at a concentration of between 0.01 and 90 wt%, between 0.1 and 50 wt%, between 0.5 and 30 wt%, between 1 and 10 wt%, between 2 and 7.5 wt%, between 2.5 and 5 wt%, between 3 and 4.5 wt% or between 3.5 and 4 wt%.
- A plant protection composition comprising:- the tracer composition of any one of claims 1 to 7; and- a plant protection product (PPP).
- The plant protection composition according to claim 8, wherein:- the PPP comprises a herbicide, an insecticide, an acaricide, a nematicide, a molluscicide, a bactericide and/or a fungicide;- the plant protection composition comprises the tracer composition in an amount which is between 0.01 and 50% (v/v), between 0.1 and 40% (v/v), between 0.25 and 30% (v/v), between 0.5 and 20% (v/v), between 0.75 and 10% (v/v) or between 1 and 5% (v/v); and/or- the plant protection composition comprises the PPP in an amount which is between 20 and 99.99% (v/v), between 60 and 99.9% (v/v), between 40 and 99.9% (v/v), between 90 and 99% (v/v) or between 95 and 99% (v/v).
- An apparatus comprising:a dual wavelength light emitting device to selectively illuminate a surface at a first wavelength and to selectively illuminate the surface at a second wavelength, wherein the surface has a material thereon;an imaging device for generating a first fluorescence image in response to the illumination of said surface at the first wavelength and a first visual image in response to the illumination of said surface at the second wavelength; anda processor configured to process the first visual image to generate a mask indicative of an area of the first visual image; generate a second fluorescence image by masking the first fluorescence image using the mask; and process the second fluorescence image to determine a coverage information and/or a dosage information of said material.
- An apparatus according to claim 10, wherein- the first wavelength is in the range of 400 to 500 nm and the second wavelength is in the range of 500 to 600 nm;- the light emitting device comprises at least one light emitting diode, optionally wherein each of said at least one light emitting diodes is placed in a back focal plane of said light emitting device to provide a uniform pattern of light to illuminate said surface;- the light emitting device further comprises at least one of: a first planoconvex lens; at least one emission filter; and a second planoconvex; and/or- the surface comprises a plant or a part thereof.
- A method comprising:selectively illuminating a surface at a first wavelength and a second wavelength, wherein the surface has a material thereon;generating a first fluorescence image of said surface in response to the illumination at the first wavelength;generating a first visual image of said surface in response to the illumination at the second wavelength;processing the first visual image to generate a mask indicative of an area of the first visual image;generating a second fluorescence image by masking the first fluorescence image using the mask; andprocessing the second fluorescence image to determine a coverage information and/or a dosage information of said material.
- A method according to claim 12, wherein the material is the tracer composition defined by any one of claims 1 to 7 or the plant protection composition defined by claim 8 or claim 9, and/or wherein the first wavelength is in the range of 400 to 500 nm and the second wavelength is in the range of 500 to 600 nm, preferably wherein the first wavelength is in the range of 465nm to 500nm.
- A method according to claim 12 or 13, further comprising:generating a plurality of candidate first visual images at different illumination intensities; andselecting one of said plurality candidate first visual images as said first visual image; and/or,further comprising:generating a plurality of candidate first fluorescence images at different illumination intensities; andselecting one of said plurality candidate first fluorescence images as said first fluorescence image;,optionally wherein said selecting selects the best candidate according to a metric, preferably wherein said metric includes determining the candidate with the most pixels having a pixel value above a first threshold value and/or the candidate with the most pixels below a second threshold value.
- A method according to any one of claims 12 to 14, wherein:- determining coverage information comprises determining a percentage of the surface covered by the material, preferably wherein determining a percentage of the surface covered by the material comprises determining a quantity of fluorescent pixels as a percentage of all pixels of the respective fluorescence image, wherein a fluorescent pixel is a pixel having a pixel value above a fluorescence threshold; and/or- determining said dosage information comprises:determining an amount of fluorescence based on an intensity of each fluorescent pixel of the respective fluorescence image, wherein a fluorescent pixel is a pixel having a threshold above a fluorescence threshold; anddetermining dosage information based on the amount of fluorescence; and/or- processing the respective fluorescence image comprises:converting pixels of the fluorescence image into a binary image based on whether or not each pixel is above or below a fluorescence threshold; anddetermining boundaries of droplets of said material based on the binary image; and/or- selectively illuminating the surface comprises illuminating the surface as a uniform pattern of light; and/or- the surface comprises a plant or a part thereof.
Applications Claiming Priority (2)
| Application Number | Priority Date | Filing Date | Title |
|---|---|---|---|
| GB1904451.0A GB2603099A (en) | 2019-03-29 | 2019-03-29 | Tracer Composition |
| PCT/GB2020/050818 WO2020201724A1 (en) | 2019-03-29 | 2020-03-26 | Tracer composition |
Publications (3)
| Publication Number | Publication Date |
|---|---|
| EP3947598A1 EP3947598A1 (en) | 2022-02-09 |
| EP3947598C0 EP3947598C0 (en) | 2024-03-06 |
| EP3947598B1 true EP3947598B1 (en) | 2024-03-06 |
Family
ID=66443041
Family Applications (1)
| Application Number | Title | Priority Date | Filing Date |
|---|---|---|---|
| EP20716554.9A Active EP3947598B1 (en) | 2019-03-29 | 2020-03-26 | Tracer composition |
Country Status (6)
| Country | Link |
|---|---|
| US (1) | US12215263B2 (en) |
| EP (1) | EP3947598B1 (en) |
| CN (1) | CN113795565B (en) |
| ES (1) | ES2977182T3 (en) |
| GB (1) | GB2603099A (en) |
| WO (1) | WO2020201724A1 (en) |
Family Cites Families (21)
| Publication number | Priority date | Publication date | Assignee | Title |
|---|---|---|---|---|
| AT234277B (en) | 1960-02-03 | 1964-06-25 | Haessle Ab | Process for the manufacture of orally administrable iron preparations |
| JP4982913B2 (en) | 2000-09-04 | 2012-07-25 | 大正製薬株式会社 | Iron compound combination oral solution |
| JP4337308B2 (en) * | 2001-06-22 | 2009-09-30 | 大正製薬株式会社 | Liquid composition |
| US6737645B2 (en) * | 2002-08-30 | 2004-05-18 | Tropicana Products, Inc. | Method for qualifying bottle rinser |
| EP1590656A1 (en) | 2003-01-24 | 2005-11-02 | Plant Research International B.V. | Identification labels in plants or plant parts |
| JP5554466B2 (en) * | 2004-03-01 | 2014-07-23 | 味の素株式会社 | Anti-human TNF-α antibody activity decrease inhibitor |
| US20060065670A1 (en) * | 2004-09-21 | 2006-03-30 | Arjowiggins Security | Packaging device for dispensing security-protected units of product |
| EP2056094A1 (en) * | 2007-10-12 | 2009-05-06 | Universiteit Hasselt | Fluorescence imaging system |
| US20090238778A1 (en) | 2008-03-19 | 2009-09-24 | Mordas Carolyn J | Tooth whitening compositions, delivery systems and methods |
| CN101435817B (en) * | 2008-07-23 | 2012-09-19 | 北京林业大学 | A method and special device for introducing fluorescent tracer into woody plants |
| WO2010088514A1 (en) * | 2009-01-30 | 2010-08-05 | Micronics, Inc. | Portable high gain fluorescence detection system |
| CN104544132A (en) | 2014-12-31 | 2015-04-29 | 南通双和食品有限公司 | Food vitamin and preparing method thereof |
| US10107757B2 (en) * | 2015-03-30 | 2018-10-23 | Gemological Institute Of America Inc. (Gia) | Apparatus and method for fluorescence grading of gemstones |
| US9901098B2 (en) * | 2015-09-03 | 2018-02-27 | Tda Research, Inc. | Methods for plant protection |
| CN106974265A (en) | 2016-01-19 | 2017-07-25 | 江苏恒瑞医药股份有限公司 | A kind of enteral nutritional composition |
| CN109337021B (en) * | 2016-11-16 | 2020-09-22 | 南通大学 | Application of fluorescent tracer type itaconic acid aspartic acid copolymer in preparation of water treatment agent |
| DE102017103535B4 (en) * | 2017-02-21 | 2018-10-31 | Institut Dr. Foerster Gmbh & Co. Kg | Fluorescent silane layers for the detection of explosives |
| CA3063925A1 (en) * | 2017-05-17 | 2018-11-22 | Spogen Biotech Inc. | Devices, systems, and methods for agrochemical detection and agrochemical compositions |
| CN109293831B (en) * | 2018-09-17 | 2021-03-09 | 中海油天津化工研究设计院有限公司 | High-salt-resistance fluorescent oil field tracer agent and preparation method thereof |
| CN109580565B (en) * | 2018-11-29 | 2021-11-26 | 北京农业智能装备技术研究中心 | System and method for monitoring deposition parameters of aerial pesticide application liquid medicine |
| US11295152B2 (en) * | 2019-03-01 | 2022-04-05 | Basf Coatings Gmbh | Method and system for object recognition via a computer vision application |
-
2019
- 2019-03-29 GB GB1904451.0A patent/GB2603099A/en not_active Withdrawn
-
2020
- 2020-03-26 US US17/599,944 patent/US12215263B2/en active Active
- 2020-03-26 WO PCT/GB2020/050818 patent/WO2020201724A1/en not_active Ceased
- 2020-03-26 ES ES20716554T patent/ES2977182T3/en active Active
- 2020-03-26 CN CN202080030204.3A patent/CN113795565B/en active Active
- 2020-03-26 EP EP20716554.9A patent/EP3947598B1/en active Active
Also Published As
| Publication number | Publication date |
|---|---|
| US20220195292A1 (en) | 2022-06-23 |
| WO2020201724A1 (en) | 2020-10-08 |
| CN113795565A (en) | 2021-12-14 |
| US12215263B2 (en) | 2025-02-04 |
| EP3947598A1 (en) | 2022-02-09 |
| EP3947598C0 (en) | 2024-03-06 |
| GB201904451D0 (en) | 2019-05-15 |
| CN113795565B (en) | 2025-04-08 |
| GB2603099A (en) | 2022-08-03 |
| ES2977182T3 (en) | 2024-08-20 |
Similar Documents
| Publication | Publication Date | Title |
|---|---|---|
| Su et al. | Fluorescence imaging for rapid monitoring of translocation behaviour of systemic markers in snap beans for automated crop/weed discrimination | |
| Tan et al. | Growth and glucosinolate profiles of a common Asian green leafy vegetable, Brassica rapa subsp. chinensis var. parachinensis (choy sum), under LED lighting | |
| Conesa et al. | Changes in the content of chlorophylls and carotenoids in the rind of Fino 49 lemons during maturation and their relationship with parameters from the CIELAB color space | |
| JP4141387B2 (en) | Composition for the preservation of fruits and vegetables | |
| Guragain et al. | Effect of plasma treatment on the seed germination and seedling growth of radish (Raphanus sativus) | |
| McMurtrey Iii et al. | Distinguishing nitrogen fertilization levels in field corn (Zea mays L.) with actively induced fluorescence and passive reflectance measurements | |
| Agati et al. | Nondestructive optical sensing of flavonols and chlorophyll in white head cabbage (Brassica oleracea L. var. capitata subvar. alba) grown under different nitrogen regimens | |
| Do Bae et al. | Infestation of Riptortus pedestris (Fabricius) decreases the nutritional quality and germination potential of soybean seeds | |
| Krajayklang et al. | Colour at harvest and post-harvest behaviour influence paprika and chilli spice quality. | |
| Su et al. | Development of a systemic crop signalling system for automated real-time plant care in vegetable crops | |
| Bortoloso Pigatto et al. | Effects of indolebutyric acid, stem cutting positions and substrates on the vegetative propagation of Stevia rebaudiana Bertoni | |
| Siecińska et al. | Drought in acid soil increases aluminum toxicity especially of the Al-sensitive wheat | |
| Fan et al. | Effect of production systems on phenolic composition and oxygen radical absorbance capacity of ‘Orléans’ strawberry | |
| Usenik | The influence of the production system on the composition of phytochemicals in Prunus domestica L. fruit | |
| US12215263B2 (en) | Tracer composition | |
| Singh et al. | Character association and path analysis of morphological and economic traits in cabbage (Brassica oleracea var. capitata L.) | |
| Kaur et al. | Antioxidant vitamins in four commercially grown tomato | |
| Mörtl et al. | The effect of intensive chemical plant protection on the quality of spice paprika | |
| Gur et al. | The effect of hormone treatments on germination and seedling characters of sage (Salvia officinalis L.) seeds. | |
| Jiang et al. | In situ mass spectrometry imaging reveals pesticide residues and key metabolic pathways throughout the entire cowpea growth process | |
| Lownds et al. | Effect of surfactants on foliar penetration of NAA and NAA-induced ethylene evolution in cowpea | |
| Su et al. | Computer vision technology for identification of snap bean crops using Systemic Rhodamine B | |
| Caser et al. | The effects of sodium chloride on the aesthetic value of Buxus spp | |
| Gillard et al. | The effect of foliar fungicide application timing on the control of dry bean anthracnose | |
| Christensen et al. | Influence of temperature, low nutrient supply, and soil composition on germination and the growth of sea kale (Crambe maritima L.) |
Legal Events
| Date | Code | Title | Description |
|---|---|---|---|
| STAA | Information on the status of an ep patent application or granted ep patent |
Free format text: STATUS: UNKNOWN |
|
| STAA | Information on the status of an ep patent application or granted ep patent |
Free format text: STATUS: THE INTERNATIONAL PUBLICATION HAS BEEN MADE |
|
| PUAI | Public reference made under article 153(3) epc to a published international application that has entered the european phase |
Free format text: ORIGINAL CODE: 0009012 |
|
| STAA | Information on the status of an ep patent application or granted ep patent |
Free format text: STATUS: REQUEST FOR EXAMINATION WAS MADE |
|
| 17P | Request for examination filed |
Effective date: 20210928 |
|
| AK | Designated contracting states |
Kind code of ref document: A1 Designated state(s): AL AT BE BG CH CY CZ DE DK EE ES FI FR GB GR HR HU IE IS IT LI LT LU LV MC MK MT NL NO PL PT RO RS SE SI SK SM TR |
|
| DAV | Request for validation of the european patent (deleted) | ||
| DAX | Request for extension of the european patent (deleted) | ||
| STAA | Information on the status of an ep patent application or granted ep patent |
Free format text: STATUS: EXAMINATION IS IN PROGRESS |
|
| 17Q | First examination report despatched |
Effective date: 20230419 |
|
| RIC1 | Information provided on ipc code assigned before grant |
Ipc: A01N 25/00 20060101ALI20230804BHEP Ipc: C12P 25/00 20060101ALI20230804BHEP Ipc: C07D 475/14 20060101ALI20230804BHEP Ipc: C09K 11/06 20060101AFI20230804BHEP |
|
| GRAP | Despatch of communication of intention to grant a patent |
Free format text: ORIGINAL CODE: EPIDOSNIGR1 |
|
| STAA | Information on the status of an ep patent application or granted ep patent |
Free format text: STATUS: GRANT OF PATENT IS INTENDED |
|
| INTG | Intention to grant announced |
Effective date: 20230920 |
|
| GRAS | Grant fee paid |
Free format text: ORIGINAL CODE: EPIDOSNIGR3 |
|
| GRAA | (expected) grant |
Free format text: ORIGINAL CODE: 0009210 |
|
| STAA | Information on the status of an ep patent application or granted ep patent |
Free format text: STATUS: THE PATENT HAS BEEN GRANTED |
|
| AK | Designated contracting states |
Kind code of ref document: B1 Designated state(s): AL AT BE BG CH CY CZ DE DK EE ES FI FR GB GR HR HU IE IS IT LI LT LU LV MC MK MT NL NO PL PT RO RS SE SI SK SM TR |
|
| REG | Reference to a national code |
Ref country code: CH Ref legal event code: EP |
|
| REG | Reference to a national code |
Ref country code: DE Ref legal event code: R096 Ref document number: 602020026801 Country of ref document: DE |
|
| REG | Reference to a national code |
Ref country code: IE Ref legal event code: FG4D |
|
| U01 | Request for unitary effect filed |
Effective date: 20240403 |
|
| U07 | Unitary effect registered |
Designated state(s): AT BE BG DE DK EE FI FR IT LT LU LV MT NL PT SE SI Effective date: 20240411 |
|
| PG25 | Lapsed in a contracting state [announced via postgrant information from national office to epo] |
Ref country code: GR Free format text: LAPSE BECAUSE OF FAILURE TO SUBMIT A TRANSLATION OF THE DESCRIPTION OR TO PAY THE FEE WITHIN THE PRESCRIBED TIME-LIMIT Effective date: 20240607 |
|
| PG25 | Lapsed in a contracting state [announced via postgrant information from national office to epo] |
Ref country code: RS Free format text: LAPSE BECAUSE OF FAILURE TO SUBMIT A TRANSLATION OF THE DESCRIPTION OR TO PAY THE FEE WITHIN THE PRESCRIBED TIME-LIMIT Effective date: 20240606 Ref country code: HR Free format text: LAPSE BECAUSE OF FAILURE TO SUBMIT A TRANSLATION OF THE DESCRIPTION OR TO PAY THE FEE WITHIN THE PRESCRIBED TIME-LIMIT Effective date: 20240306 |
|
| PG25 | Lapsed in a contracting state [announced via postgrant information from national office to epo] |
Ref country code: RS Free format text: LAPSE BECAUSE OF FAILURE TO SUBMIT A TRANSLATION OF THE DESCRIPTION OR TO PAY THE FEE WITHIN THE PRESCRIBED TIME-LIMIT Effective date: 20240606 Ref country code: NO Free format text: LAPSE BECAUSE OF FAILURE TO SUBMIT A TRANSLATION OF THE DESCRIPTION OR TO PAY THE FEE WITHIN THE PRESCRIBED TIME-LIMIT Effective date: 20240606 Ref country code: HR Free format text: LAPSE BECAUSE OF FAILURE TO SUBMIT A TRANSLATION OF THE DESCRIPTION OR TO PAY THE FEE WITHIN THE PRESCRIBED TIME-LIMIT Effective date: 20240306 Ref country code: GR Free format text: LAPSE BECAUSE OF FAILURE TO SUBMIT A TRANSLATION OF THE DESCRIPTION OR TO PAY THE FEE WITHIN THE PRESCRIBED TIME-LIMIT Effective date: 20240607 |
|
| REG | Reference to a national code |
Ref country code: ES Ref legal event code: FG2A Ref document number: 2977182 Country of ref document: ES Kind code of ref document: T3 Effective date: 20240820 |
|
| PG25 | Lapsed in a contracting state [announced via postgrant information from national office to epo] |
Ref country code: IS Free format text: LAPSE BECAUSE OF FAILURE TO SUBMIT A TRANSLATION OF THE DESCRIPTION OR TO PAY THE FEE WITHIN THE PRESCRIBED TIME-LIMIT Effective date: 20240706 |
|
| U21 | Renewal fee for the european patent with unitary effect paid with additional fee |
Year of fee payment: 5 Effective date: 20240902 |
|
| PG25 | Lapsed in a contracting state [announced via postgrant information from national office to epo] |
Ref country code: SM Free format text: LAPSE BECAUSE OF FAILURE TO SUBMIT A TRANSLATION OF THE DESCRIPTION OR TO PAY THE FEE WITHIN THE PRESCRIBED TIME-LIMIT Effective date: 20240306 |
|
| PG25 | Lapsed in a contracting state [announced via postgrant information from national office to epo] |
Ref country code: CZ Free format text: LAPSE BECAUSE OF FAILURE TO SUBMIT A TRANSLATION OF THE DESCRIPTION OR TO PAY THE FEE WITHIN THE PRESCRIBED TIME-LIMIT Effective date: 20240306 |
|
| PG25 | Lapsed in a contracting state [announced via postgrant information from national office to epo] |
Ref country code: PL Free format text: LAPSE BECAUSE OF FAILURE TO SUBMIT A TRANSLATION OF THE DESCRIPTION OR TO PAY THE FEE WITHIN THE PRESCRIBED TIME-LIMIT Effective date: 20240306 |
|
| PG25 | Lapsed in a contracting state [announced via postgrant information from national office to epo] |
Ref country code: SK Free format text: LAPSE BECAUSE OF FAILURE TO SUBMIT A TRANSLATION OF THE DESCRIPTION OR TO PAY THE FEE WITHIN THE PRESCRIBED TIME-LIMIT Effective date: 20240306 |
|
| PG25 | Lapsed in a contracting state [announced via postgrant information from national office to epo] |
Ref country code: SM Free format text: LAPSE BECAUSE OF FAILURE TO SUBMIT A TRANSLATION OF THE DESCRIPTION OR TO PAY THE FEE WITHIN THE PRESCRIBED TIME-LIMIT Effective date: 20240306 Ref country code: SK Free format text: LAPSE BECAUSE OF FAILURE TO SUBMIT A TRANSLATION OF THE DESCRIPTION OR TO PAY THE FEE WITHIN THE PRESCRIBED TIME-LIMIT Effective date: 20240306 Ref country code: RO Free format text: LAPSE BECAUSE OF FAILURE TO SUBMIT A TRANSLATION OF THE DESCRIPTION OR TO PAY THE FEE WITHIN THE PRESCRIBED TIME-LIMIT Effective date: 20240306 Ref country code: PL Free format text: LAPSE BECAUSE OF FAILURE TO SUBMIT A TRANSLATION OF THE DESCRIPTION OR TO PAY THE FEE WITHIN THE PRESCRIBED TIME-LIMIT Effective date: 20240306 Ref country code: IS Free format text: LAPSE BECAUSE OF FAILURE TO SUBMIT A TRANSLATION OF THE DESCRIPTION OR TO PAY THE FEE WITHIN THE PRESCRIBED TIME-LIMIT Effective date: 20240706 Ref country code: CZ Free format text: LAPSE BECAUSE OF FAILURE TO SUBMIT A TRANSLATION OF THE DESCRIPTION OR TO PAY THE FEE WITHIN THE PRESCRIBED TIME-LIMIT Effective date: 20240306 |
|
| REG | Reference to a national code |
Ref country code: CH Ref legal event code: PL |
|
| REG | Reference to a national code |
Ref country code: DE Ref legal event code: R097 Ref document number: 602020026801 Country of ref document: DE |
|
| PG25 | Lapsed in a contracting state [announced via postgrant information from national office to epo] |
Ref country code: MC Free format text: LAPSE BECAUSE OF FAILURE TO SUBMIT A TRANSLATION OF THE DESCRIPTION OR TO PAY THE FEE WITHIN THE PRESCRIBED TIME-LIMIT Effective date: 20240306 |
|
| PLBE | No opposition filed within time limit |
Free format text: ORIGINAL CODE: 0009261 |
|
| STAA | Information on the status of an ep patent application or granted ep patent |
Free format text: STATUS: NO OPPOSITION FILED WITHIN TIME LIMIT |
|
| PG25 | Lapsed in a contracting state [announced via postgrant information from national office to epo] |
Ref country code: MC Free format text: LAPSE BECAUSE OF FAILURE TO SUBMIT A TRANSLATION OF THE DESCRIPTION OR TO PAY THE FEE WITHIN THE PRESCRIBED TIME-LIMIT Effective date: 20240306 Ref country code: CH Free format text: LAPSE BECAUSE OF NON-PAYMENT OF DUE FEES Effective date: 20240331 |
|
| 26N | No opposition filed |
Effective date: 20241209 |
|
| U20 | Renewal fee for the european patent with unitary effect paid |
Year of fee payment: 6 Effective date: 20250314 |
|
| PGFP | Annual fee paid to national office [announced via postgrant information from national office to epo] |
Ref country code: ES Payment date: 20250429 Year of fee payment: 6 |
|
| PG25 | Lapsed in a contracting state [announced via postgrant information from national office to epo] |
Ref country code: CY Free format text: LAPSE BECAUSE OF FAILURE TO SUBMIT A TRANSLATION OF THE DESCRIPTION OR TO PAY THE FEE WITHIN THE PRESCRIBED TIME-LIMIT; INVALID AB INITIO Effective date: 20200326 |
|
| PG25 | Lapsed in a contracting state [announced via postgrant information from national office to epo] |
Ref country code: HU Free format text: LAPSE BECAUSE OF FAILURE TO SUBMIT A TRANSLATION OF THE DESCRIPTION OR TO PAY THE FEE WITHIN THE PRESCRIBED TIME-LIMIT; INVALID AB INITIO Effective date: 20200326 |
|
| PG25 | Lapsed in a contracting state [announced via postgrant information from national office to epo] |
Ref country code: TR Free format text: LAPSE BECAUSE OF FAILURE TO SUBMIT A TRANSLATION OF THE DESCRIPTION OR TO PAY THE FEE WITHIN THE PRESCRIBED TIME-LIMIT Effective date: 20240306 |
|
| PGFP | Annual fee paid to national office [announced via postgrant information from national office to epo] |
Ref country code: GB Payment date: 20260317 Year of fee payment: 7 |
|
| PGFP | Annual fee paid to national office [announced via postgrant information from national office to epo] |
Ref country code: IE Payment date: 20260319 Year of fee payment: 7 |
|
| U20 | Renewal fee for the european patent with unitary effect paid |
Year of fee payment: 7 Effective date: 20260316 |