EP3922965A2 - Hand-held micro-raman based detection instrument and method of detection - Google Patents
Hand-held micro-raman based detection instrument and method of detection Download PDFInfo
- Publication number
- EP3922965A2 EP3922965A2 EP21167040.1A EP21167040A EP3922965A2 EP 3922965 A2 EP3922965 A2 EP 3922965A2 EP 21167040 A EP21167040 A EP 21167040A EP 3922965 A2 EP3922965 A2 EP 3922965A2
- Authority
- EP
- European Patent Office
- Prior art keywords
- raman
- raman signal
- micro
- filters
- sample
- Prior art date
- Legal status (The legal status is an assumption and is not a legal conclusion. Google has not performed a legal analysis and makes no representation as to the accuracy of the status listed.)
- Withdrawn
Links
- 238000001069 Raman spectroscopy Methods 0.000 title claims abstract description 102
- 238000001514 detection method Methods 0.000 title claims abstract description 54
- 238000000034 method Methods 0.000 title claims abstract description 50
- 230000003595 spectral effect Effects 0.000 claims abstract description 85
- 244000052769 pathogen Species 0.000 claims abstract description 39
- 230000003287 optical effect Effects 0.000 claims abstract description 34
- 230000001717 pathogenic effect Effects 0.000 claims abstract description 34
- 238000003384 imaging method Methods 0.000 claims abstract description 14
- 230000005284 excitation Effects 0.000 claims description 24
- 238000001914 filtration Methods 0.000 claims description 11
- 230000001427 coherent effect Effects 0.000 claims description 10
- 230000000694 effects Effects 0.000 claims description 4
- 239000000956 alloy Substances 0.000 claims description 3
- 229910045601 alloy Inorganic materials 0.000 claims description 3
- 239000011248 coating agent Substances 0.000 claims description 3
- 238000000576 coating method Methods 0.000 claims description 3
- AUCDRFABNLOFRE-UHFFFAOYSA-N alumane;indium Chemical compound [AlH3].[In] AUCDRFABNLOFRE-UHFFFAOYSA-N 0.000 claims description 2
- 238000004611 spectroscopical analysis Methods 0.000 claims description 2
- 102000004169 proteins and genes Human genes 0.000 abstract description 45
- 108090000623 proteins and genes Proteins 0.000 abstract description 44
- 241000894006 Bacteria Species 0.000 abstract description 28
- 238000004458 analytical method Methods 0.000 abstract description 25
- 241000700605 Viruses Species 0.000 abstract description 21
- 238000012545 processing Methods 0.000 abstract description 10
- 150000001875 compounds Chemical class 0.000 abstract description 8
- -1 bacteria Chemical class 0.000 abstract description 7
- 229940079593 drug Drugs 0.000 abstract description 7
- 239000003814 drug Substances 0.000 abstract description 7
- 238000012216 screening Methods 0.000 abstract description 6
- 230000005856 abnormality Effects 0.000 abstract description 5
- 230000003750 conditioning effect Effects 0.000 abstract description 4
- 239000000523 sample Substances 0.000 description 78
- 239000012636 effector Substances 0.000 description 29
- 239000000835 fiber Substances 0.000 description 26
- 238000001228 spectrum Methods 0.000 description 25
- 150000002632 lipids Chemical class 0.000 description 24
- 238000001237 Raman spectrum Methods 0.000 description 19
- 241000191963 Staphylococcus epidermidis Species 0.000 description 14
- 235000014633 carbohydrates Nutrition 0.000 description 14
- 108020004707 nucleic acids Proteins 0.000 description 14
- 102000039446 nucleic acids Human genes 0.000 description 14
- 206010052428 Wound Diseases 0.000 description 13
- 208000027418 Wounds and injury Diseases 0.000 description 13
- 150000001720 carbohydrates Chemical class 0.000 description 13
- 150000007523 nucleic acids Chemical class 0.000 description 13
- 230000006870 function Effects 0.000 description 11
- 241000712461 unidentified influenza virus Species 0.000 description 11
- 241000191940 Staphylococcus Species 0.000 description 10
- 238000012360 testing method Methods 0.000 description 10
- 241000295644 Staphylococcaceae Species 0.000 description 9
- 206010022000 influenza Diseases 0.000 description 9
- 239000000126 substance Substances 0.000 description 9
- 241000191967 Staphylococcus aureus Species 0.000 description 8
- 210000001519 tissue Anatomy 0.000 description 7
- XLYOFNOQVPJJNP-UHFFFAOYSA-N water Substances O XLYOFNOQVPJJNP-UHFFFAOYSA-N 0.000 description 7
- 241000193830 Bacillus <bacterium> Species 0.000 description 6
- 241000197306 H1N1 subtype Species 0.000 description 6
- OUYCCCASQSFEME-QMMMGPOBSA-N L-tyrosine Chemical compound OC(=O)[C@@H](N)CC1=CC=C(O)C=C1 OUYCCCASQSFEME-QMMMGPOBSA-N 0.000 description 5
- 150000001408 amides Chemical class 0.000 description 5
- 230000000903 blocking effect Effects 0.000 description 5
- 239000000463 material Substances 0.000 description 5
- 230000005855 radiation Effects 0.000 description 5
- 241000186249 Corynebacterium sp. Species 0.000 description 4
- COLNVLDHVKWLRT-QMMMGPOBSA-N L-phenylalanine Chemical compound OC(=O)[C@@H](N)CC1=CC=CC=C1 COLNVLDHVKWLRT-QMMMGPOBSA-N 0.000 description 4
- RJQXTJLFIWVMTO-TYNCELHUSA-N Methicillin Chemical compound COC1=CC=CC(OC)=C1C(=O)N[C@@H]1C(=O)N2[C@@H](C(O)=O)C(C)(C)S[C@@H]21 RJQXTJLFIWVMTO-TYNCELHUSA-N 0.000 description 4
- 230000008859 change Effects 0.000 description 4
- 230000009849 deactivation Effects 0.000 description 4
- 238000000151 deposition Methods 0.000 description 4
- 238000011161 development Methods 0.000 description 4
- 208000015181 infectious disease Diseases 0.000 description 4
- 238000005259 measurement Methods 0.000 description 4
- 229960003085 meticillin Drugs 0.000 description 4
- COLNVLDHVKWLRT-UHFFFAOYSA-N phenylalanine Natural products OC(=O)C(N)CC1=CC=CC=C1 COLNVLDHVKWLRT-UHFFFAOYSA-N 0.000 description 4
- 230000008569 process Effects 0.000 description 4
- VYPSYNLAJGMNEJ-UHFFFAOYSA-N silicon dioxide Inorganic materials O=[Si]=O VYPSYNLAJGMNEJ-UHFFFAOYSA-N 0.000 description 4
- 241000894007 species Species 0.000 description 4
- 238000010183 spectrum analysis Methods 0.000 description 4
- OUYCCCASQSFEME-UHFFFAOYSA-N tyrosine Natural products OC(=O)C(N)CC1=CC=C(O)C=C1 OUYCCCASQSFEME-UHFFFAOYSA-N 0.000 description 4
- 241000186216 Corynebacterium Species 0.000 description 3
- 101710202686 Penicillin-sensitive transpeptidase Proteins 0.000 description 3
- 206010041925 Staphylococcal infections Diseases 0.000 description 3
- 241000201788 Staphylococcus aureus subsp. aureus Species 0.000 description 3
- 238000007621 cluster analysis Methods 0.000 description 3
- 230000008021 deposition Effects 0.000 description 3
- 238000013461 design Methods 0.000 description 3
- 238000005516 engineering process Methods 0.000 description 3
- 238000011835 investigation Methods 0.000 description 3
- 101150008979 mecA gene Proteins 0.000 description 3
- 208000015688 methicillin-resistant staphylococcus aureus infectious disease Diseases 0.000 description 3
- 238000010606 normalization Methods 0.000 description 3
- 238000002360 preparation method Methods 0.000 description 3
- 239000010453 quartz Substances 0.000 description 3
- 238000005070 sampling Methods 0.000 description 3
- 230000028327 secretion Effects 0.000 description 3
- 230000035945 sensitivity Effects 0.000 description 3
- 238000003860 storage Methods 0.000 description 3
- 244000063299 Bacillus subtilis Species 0.000 description 2
- 235000014469 Bacillus subtilis Nutrition 0.000 description 2
- HBBGRARXTFLTSG-UHFFFAOYSA-N Lithium ion Chemical compound [Li+] HBBGRARXTFLTSG-UHFFFAOYSA-N 0.000 description 2
- MSFSPUZXLOGKHJ-UHFFFAOYSA-N Muraminsaeure Natural products OC(=O)C(C)OC1C(N)C(O)OC(CO)C1O MSFSPUZXLOGKHJ-UHFFFAOYSA-N 0.000 description 2
- 108091005461 Nucleic proteins Proteins 0.000 description 2
- 108010013639 Peptidoglycan Proteins 0.000 description 2
- 238000003841 Raman measurement Methods 0.000 description 2
- 150000001413 amino acids Chemical class 0.000 description 2
- 238000013459 approach Methods 0.000 description 2
- 230000008901 benefit Effects 0.000 description 2
- 239000003782 beta lactam antibiotic agent Substances 0.000 description 2
- 230000015572 biosynthetic process Effects 0.000 description 2
- 210000004027 cell Anatomy 0.000 description 2
- 210000002421 cell wall Anatomy 0.000 description 2
- 210000000349 chromosome Anatomy 0.000 description 2
- 239000000470 constituent Substances 0.000 description 2
- 230000007423 decrease Effects 0.000 description 2
- 230000001066 destructive effect Effects 0.000 description 2
- 210000000887 face Anatomy 0.000 description 2
- 238000009499 grossing Methods 0.000 description 2
- UYTPUPDQBNUYGX-UHFFFAOYSA-N guanine Chemical compound O=C1NC(N)=NC2=C1N=CN2 UYTPUPDQBNUYGX-UHFFFAOYSA-N 0.000 description 2
- 210000003128 head Anatomy 0.000 description 2
- 229910001416 lithium ion Inorganic materials 0.000 description 2
- 238000012544 monitoring process Methods 0.000 description 2
- 210000001331 nose Anatomy 0.000 description 2
- 238000003752 polymerase chain reaction Methods 0.000 description 2
- 238000007781 pre-processing Methods 0.000 description 2
- 210000002345 respiratory system Anatomy 0.000 description 2
- 239000000758 substrate Substances 0.000 description 2
- 238000003786 synthesis reaction Methods 0.000 description 2
- 238000012546 transfer Methods 0.000 description 2
- 239000002132 β-lactam antibiotic Substances 0.000 description 2
- 229940124586 β-lactam antibiotics Drugs 0.000 description 2
- GFFGJBXGBJISGV-UHFFFAOYSA-N Adenine Chemical compound NC1=NC=NC2=C1N=CN2 GFFGJBXGBJISGV-UHFFFAOYSA-N 0.000 description 1
- 229930024421 Adenine Natural products 0.000 description 1
- 208000031729 Bacteremia Diseases 0.000 description 1
- 101710116957 D-alanyl-D-alanine carboxypeptidase Proteins 0.000 description 1
- 241000588724 Escherichia coli Species 0.000 description 1
- 241000028466 Escherichia coli O111 Species 0.000 description 1
- 241001333951 Escherichia coli O157 Species 0.000 description 1
- 241000282412 Homo Species 0.000 description 1
- 241000491226 Influenza A virus (A/WSN/1933(H1N1)) Species 0.000 description 1
- 238000002768 Kirby-Bauer method Methods 0.000 description 1
- QIVBCDIJIAJPQS-VIFPVBQESA-N L-tryptophane Chemical compound C1=CC=C2C(C[C@H](N)C(O)=O)=CNC2=C1 QIVBCDIJIAJPQS-VIFPVBQESA-N 0.000 description 1
- 241000881808 Lelliottia amnigena Species 0.000 description 1
- 241000186779 Listeria monocytogenes Species 0.000 description 1
- 101000735344 Lymantria dispar Pheromone-binding protein 2 Proteins 0.000 description 1
- 206010028980 Neoplasm Diseases 0.000 description 1
- 206010029803 Nosocomial infection Diseases 0.000 description 1
- 229910003873 O—P—O Inorganic materials 0.000 description 1
- 241001521757 Propionibacterium sp. Species 0.000 description 1
- 241000589517 Pseudomonas aeruginosa Species 0.000 description 1
- 241001478271 Rahnella aquatilis Species 0.000 description 1
- 241000607142 Salmonella Species 0.000 description 1
- 241000293869 Salmonella enterica subsp. enterica serovar Typhimurium Species 0.000 description 1
- 201000005010 Streptococcus pneumonia Diseases 0.000 description 1
- 241000193998 Streptococcus pneumoniae Species 0.000 description 1
- QIVBCDIJIAJPQS-UHFFFAOYSA-N Tryptophan Natural products C1=CC=C2C(CC(N)C(O)=O)=CNC2=C1 QIVBCDIJIAJPQS-UHFFFAOYSA-N 0.000 description 1
- 108010059993 Vancomycin Proteins 0.000 description 1
- 241000607291 Vibrio fluvialis Species 0.000 description 1
- 206010000269 abscess Diseases 0.000 description 1
- 230000035508 accumulation Effects 0.000 description 1
- 238000009825 accumulation Methods 0.000 description 1
- 229960000643 adenine Drugs 0.000 description 1
- 125000003368 amide group Chemical group 0.000 description 1
- 239000003242 anti bacterial agent Substances 0.000 description 1
- 230000003466 anti-cipated effect Effects 0.000 description 1
- 230000000845 anti-microbial effect Effects 0.000 description 1
- 229940088710 antibiotic agent Drugs 0.000 description 1
- 210000004369 blood Anatomy 0.000 description 1
- 239000008280 blood Substances 0.000 description 1
- 201000011510 cancer Diseases 0.000 description 1
- 239000011203 carbon fibre reinforced carbon Substances 0.000 description 1
- WZOZEZRFJCJXNZ-ZBFHGGJFSA-N cefoxitin Chemical compound N([C@]1(OC)C(N2C(=C(COC(N)=O)CS[C@@H]21)C(O)=O)=O)C(=O)CC1=CC=CS1 WZOZEZRFJCJXNZ-ZBFHGGJFSA-N 0.000 description 1
- 229960002682 cefoxitin Drugs 0.000 description 1
- 230000010267 cellular communication Effects 0.000 description 1
- 230000001413 cellular effect Effects 0.000 description 1
- 238000004140 cleaning Methods 0.000 description 1
- 238000002790 cross-validation Methods 0.000 description 1
- 230000007123 defense Effects 0.000 description 1
- 230000001419 dependent effect Effects 0.000 description 1
- 238000010586 diagram Methods 0.000 description 1
- YFAGHNZHGGCZAX-JKIFEVAISA-N dicloxacillin Chemical compound N([C@@H]1C(N2[C@H](C(C)(C)S[C@@H]21)C(O)=O)=O)C(=O)C1=C(C)ON=C1C1=C(Cl)C=CC=C1Cl YFAGHNZHGGCZAX-JKIFEVAISA-N 0.000 description 1
- 229960001585 dicloxacillin Drugs 0.000 description 1
- 238000007598 dipping method Methods 0.000 description 1
- 201000010099 disease Diseases 0.000 description 1
- 208000037265 diseases, disorders, signs and symptoms Diseases 0.000 description 1
- 239000006185 dispersion Substances 0.000 description 1
- 235000012489 doughnuts Nutrition 0.000 description 1
- 210000005069 ears Anatomy 0.000 description 1
- 210000002919 epithelial cell Anatomy 0.000 description 1
- 210000003743 erythrocyte Anatomy 0.000 description 1
- 230000007717 exclusion Effects 0.000 description 1
- 235000020680 filtered tap water Nutrition 0.000 description 1
- 235000013305 food Nutrition 0.000 description 1
- 230000008014 freezing Effects 0.000 description 1
- 238000007710 freezing Methods 0.000 description 1
- 230000002068 genetic effect Effects 0.000 description 1
- 229930182470 glycoside Natural products 0.000 description 1
- 150000002338 glycosides Chemical class 0.000 description 1
- 239000013056 hazardous product Substances 0.000 description 1
- 230000006872 improvement Effects 0.000 description 1
- 238000000338 in vitro Methods 0.000 description 1
- 238000001727 in vivo Methods 0.000 description 1
- 238000011065 in-situ storage Methods 0.000 description 1
- 230000002779 inactivation Effects 0.000 description 1
- 238000010348 incorporation Methods 0.000 description 1
- 229910052738 indium Inorganic materials 0.000 description 1
- APFVFJFRJDLVQX-UHFFFAOYSA-N indium atom Chemical compound [In] APFVFJFRJDLVQX-UHFFFAOYSA-N 0.000 description 1
- 230000002458 infectious effect Effects 0.000 description 1
- 208000037797 influenza A Diseases 0.000 description 1
- 238000007689 inspection Methods 0.000 description 1
- 230000010354 integration Effects 0.000 description 1
- 238000001990 intravenous administration Methods 0.000 description 1
- 238000012092 latex agglutination test Methods 0.000 description 1
- 230000003902 lesion Effects 0.000 description 1
- 238000004519 manufacturing process Methods 0.000 description 1
- 239000011159 matrix material Substances 0.000 description 1
- 230000007246 mechanism Effects 0.000 description 1
- 239000002906 medical waste Substances 0.000 description 1
- 238000013048 microbiological method Methods 0.000 description 1
- 239000000203 mixture Substances 0.000 description 1
- 238000012986 modification Methods 0.000 description 1
- 230000004048 modification Effects 0.000 description 1
- 230000035772 mutation Effects 0.000 description 1
- GPXLMGHLHQJAGZ-JTDSTZFVSA-N nafcillin Chemical compound C1=CC=CC2=C(C(=O)N[C@@H]3C(N4[C@H](C(C)(C)S[C@@H]43)C(O)=O)=O)C(OCC)=CC=C21 GPXLMGHLHQJAGZ-JTDSTZFVSA-N 0.000 description 1
- 229960000515 nafcillin Drugs 0.000 description 1
- 210000003928 nasal cavity Anatomy 0.000 description 1
- 150000004767 nitrides Chemical class 0.000 description 1
- 238000011017 operating method Methods 0.000 description 1
- 239000013307 optical fiber Substances 0.000 description 1
- UWYHMGVUTGAWSP-JKIFEVAISA-N oxacillin Chemical compound N([C@@H]1C(N2[C@H](C(C)(C)S[C@@H]21)C(O)=O)=O)C(=O)C1=C(C)ON=C1C1=CC=CC=C1 UWYHMGVUTGAWSP-JKIFEVAISA-N 0.000 description 1
- 229960001019 oxacillin Drugs 0.000 description 1
- 239000008188 pellet Substances 0.000 description 1
- 210000003800 pharynx Anatomy 0.000 description 1
- 239000008055 phosphate buffer solution Substances 0.000 description 1
- 239000004038 photonic crystal Substances 0.000 description 1
- 239000013641 positive control Substances 0.000 description 1
- 238000003906 pulsed field gel electrophoresis Methods 0.000 description 1
- 238000004451 qualitative analysis Methods 0.000 description 1
- 238000004445 quantitative analysis Methods 0.000 description 1
- 230000029058 respiratory gaseous exchange Effects 0.000 description 1
- 230000004044 response Effects 0.000 description 1
- 210000002966 serum Anatomy 0.000 description 1
- 239000000243 solution Substances 0.000 description 1
- 230000001954 sterilising effect Effects 0.000 description 1
- 238000004659 sterilization and disinfection Methods 0.000 description 1
- 239000006228 supernatant Substances 0.000 description 1
- 239000000725 suspension Substances 0.000 description 1
- 239000013077 target material Substances 0.000 description 1
- 239000003053 toxin Substances 0.000 description 1
- 231100000765 toxin Toxicity 0.000 description 1
- 108700012359 toxins Proteins 0.000 description 1
- 239000012780 transparent material Substances 0.000 description 1
- 239000001974 tryptic soy broth Substances 0.000 description 1
- 239000006150 trypticase soy agar Substances 0.000 description 1
- 108010050327 trypticase-soy broth Proteins 0.000 description 1
- 210000001635 urinary tract Anatomy 0.000 description 1
- 210000002700 urine Anatomy 0.000 description 1
- MYPYJXKWCTUITO-LYRMYLQWSA-N vancomycin Chemical compound O([C@@H]1[C@@H](O)[C@H](O)[C@@H](CO)O[C@H]1OC1=C2C=C3C=C1OC1=CC=C(C=C1Cl)[C@@H](O)[C@H](C(N[C@@H](CC(N)=O)C(=O)N[C@H]3C(=O)N[C@H]1C(=O)N[C@H](C(N[C@@H](C3=CC(O)=CC(O)=C3C=3C(O)=CC=C1C=3)C(O)=O)=O)[C@H](O)C1=CC=C(C(=C1)Cl)O2)=O)NC(=O)[C@@H](CC(C)C)NC)[C@H]1C[C@](C)(N)[C@H](O)[C@H](C)O1 MYPYJXKWCTUITO-LYRMYLQWSA-N 0.000 description 1
- 229960003165 vancomycin Drugs 0.000 description 1
- MYPYJXKWCTUITO-UHFFFAOYSA-N vancomycin Natural products O1C(C(=C2)Cl)=CC=C2C(O)C(C(NC(C2=CC(O)=CC(O)=C2C=2C(O)=CC=C3C=2)C(O)=O)=O)NC(=O)C3NC(=O)C2NC(=O)C(CC(N)=O)NC(=O)C(NC(=O)C(CC(C)C)NC)C(O)C(C=C3Cl)=CC=C3OC3=CC2=CC1=C3OC1OC(CO)C(O)C(O)C1OC1CC(C)(N)C(O)C(C)O1 MYPYJXKWCTUITO-UHFFFAOYSA-N 0.000 description 1
- 230000000007 visual effect Effects 0.000 description 1
- 238000005406 washing Methods 0.000 description 1
- 150000003952 β-lactams Chemical class 0.000 description 1
Images







Classifications
-
- C—CHEMISTRY; METALLURGY
- C12—BIOCHEMISTRY; BEER; SPIRITS; WINE; VINEGAR; MICROBIOLOGY; ENZYMOLOGY; MUTATION OR GENETIC ENGINEERING
- C12Q—MEASURING OR TESTING PROCESSES INVOLVING ENZYMES, NUCLEIC ACIDS OR MICROORGANISMS; COMPOSITIONS OR TEST PAPERS THEREFOR; PROCESSES OF PREPARING SUCH COMPOSITIONS; CONDITION-RESPONSIVE CONTROL IN MICROBIOLOGICAL OR ENZYMOLOGICAL PROCESSES
- C12Q1/00—Measuring or testing processes involving enzymes, nucleic acids or microorganisms; Compositions therefor; Processes of preparing such compositions
- C12Q1/02—Measuring or testing processes involving enzymes, nucleic acids or microorganisms; Compositions therefor; Processes of preparing such compositions involving viable microorganisms
- C12Q1/04—Determining presence or kind of microorganism; Use of selective media for testing antibiotics or bacteriocides; Compositions containing a chemical indicator therefor
-
- G—PHYSICS
- G01—MEASURING; TESTING
- G01J—MEASUREMENT OF INTENSITY, VELOCITY, SPECTRAL CONTENT, POLARISATION, PHASE OR PULSE CHARACTERISTICS OF INFRARED, VISIBLE OR ULTRAVIOLET LIGHT; COLORIMETRY; RADIATION PYROMETRY
- G01J3/00—Spectrometry; Spectrophotometry; Monochromators; Measuring colours
- G01J3/12—Generating the spectrum; Monochromators
- G01J3/18—Generating the spectrum; Monochromators using diffraction elements, e.g. grating
-
- A—HUMAN NECESSITIES
- A61—MEDICAL OR VETERINARY SCIENCE; HYGIENE
- A61B—DIAGNOSIS; SURGERY; IDENTIFICATION
- A61B5/00—Measuring for diagnostic purposes; Identification of persons
- A61B5/0059—Measuring for diagnostic purposes; Identification of persons using light, e.g. diagnosis by transillumination, diascopy, fluorescence
- A61B5/0075—Measuring for diagnostic purposes; Identification of persons using light, e.g. diagnosis by transillumination, diascopy, fluorescence by spectroscopy, i.e. measuring spectra, e.g. Raman spectroscopy, infrared absorption spectroscopy
-
- C—CHEMISTRY; METALLURGY
- C12—BIOCHEMISTRY; BEER; SPIRITS; WINE; VINEGAR; MICROBIOLOGY; ENZYMOLOGY; MUTATION OR GENETIC ENGINEERING
- C12Q—MEASURING OR TESTING PROCESSES INVOLVING ENZYMES, NUCLEIC ACIDS OR MICROORGANISMS; COMPOSITIONS OR TEST PAPERS THEREFOR; PROCESSES OF PREPARING SUCH COMPOSITIONS; CONDITION-RESPONSIVE CONTROL IN MICROBIOLOGICAL OR ENZYMOLOGICAL PROCESSES
- C12Q1/00—Measuring or testing processes involving enzymes, nucleic acids or microorganisms; Compositions therefor; Processes of preparing such compositions
- C12Q1/02—Measuring or testing processes involving enzymes, nucleic acids or microorganisms; Compositions therefor; Processes of preparing such compositions involving viable microorganisms
- C12Q1/04—Determining presence or kind of microorganism; Use of selective media for testing antibiotics or bacteriocides; Compositions containing a chemical indicator therefor
- C12Q1/14—Streptococcus; Staphylococcus
-
- G—PHYSICS
- G01—MEASURING; TESTING
- G01J—MEASUREMENT OF INTENSITY, VELOCITY, SPECTRAL CONTENT, POLARISATION, PHASE OR PULSE CHARACTERISTICS OF INFRARED, VISIBLE OR ULTRAVIOLET LIGHT; COLORIMETRY; RADIATION PYROMETRY
- G01J3/00—Spectrometry; Spectrophotometry; Monochromators; Measuring colours
- G01J3/02—Details
- G01J3/0205—Optical elements not provided otherwise, e.g. optical manifolds, diffusers, windows
- G01J3/0208—Optical elements not provided otherwise, e.g. optical manifolds, diffusers, windows using focussing or collimating elements, e.g. lenses or mirrors; performing aberration correction
-
- G—PHYSICS
- G01—MEASURING; TESTING
- G01J—MEASUREMENT OF INTENSITY, VELOCITY, SPECTRAL CONTENT, POLARISATION, PHASE OR PULSE CHARACTERISTICS OF INFRARED, VISIBLE OR ULTRAVIOLET LIGHT; COLORIMETRY; RADIATION PYROMETRY
- G01J3/00—Spectrometry; Spectrophotometry; Monochromators; Measuring colours
- G01J3/02—Details
- G01J3/0264—Electrical interface; User interface
-
- G—PHYSICS
- G01—MEASURING; TESTING
- G01J—MEASUREMENT OF INTENSITY, VELOCITY, SPECTRAL CONTENT, POLARISATION, PHASE OR PULSE CHARACTERISTICS OF INFRARED, VISIBLE OR ULTRAVIOLET LIGHT; COLORIMETRY; RADIATION PYROMETRY
- G01J3/00—Spectrometry; Spectrophotometry; Monochromators; Measuring colours
- G01J3/02—Details
- G01J3/0272—Handheld
-
- G—PHYSICS
- G01—MEASURING; TESTING
- G01J—MEASUREMENT OF INTENSITY, VELOCITY, SPECTRAL CONTENT, POLARISATION, PHASE OR PULSE CHARACTERISTICS OF INFRARED, VISIBLE OR ULTRAVIOLET LIGHT; COLORIMETRY; RADIATION PYROMETRY
- G01J3/00—Spectrometry; Spectrophotometry; Monochromators; Measuring colours
- G01J3/02—Details
- G01J3/0291—Housings; Spectrometer accessories; Spatial arrangement of elements, e.g. folded path arrangements
-
- G—PHYSICS
- G01—MEASURING; TESTING
- G01J—MEASUREMENT OF INTENSITY, VELOCITY, SPECTRAL CONTENT, POLARISATION, PHASE OR PULSE CHARACTERISTICS OF INFRARED, VISIBLE OR ULTRAVIOLET LIGHT; COLORIMETRY; RADIATION PYROMETRY
- G01J3/00—Spectrometry; Spectrophotometry; Monochromators; Measuring colours
- G01J3/28—Investigating the spectrum
- G01J3/2823—Imaging spectrometer
-
- G—PHYSICS
- G01—MEASURING; TESTING
- G01J—MEASUREMENT OF INTENSITY, VELOCITY, SPECTRAL CONTENT, POLARISATION, PHASE OR PULSE CHARACTERISTICS OF INFRARED, VISIBLE OR ULTRAVIOLET LIGHT; COLORIMETRY; RADIATION PYROMETRY
- G01J3/00—Spectrometry; Spectrophotometry; Monochromators; Measuring colours
- G01J3/28—Investigating the spectrum
- G01J3/44—Raman spectrometry; Scattering spectrometry ; Fluorescence spectrometry
-
- G—PHYSICS
- G01—MEASURING; TESTING
- G01J—MEASUREMENT OF INTENSITY, VELOCITY, SPECTRAL CONTENT, POLARISATION, PHASE OR PULSE CHARACTERISTICS OF INFRARED, VISIBLE OR ULTRAVIOLET LIGHT; COLORIMETRY; RADIATION PYROMETRY
- G01J3/00—Spectrometry; Spectrophotometry; Monochromators; Measuring colours
- G01J3/28—Investigating the spectrum
- G01J3/44—Raman spectrometry; Scattering spectrometry ; Fluorescence spectrometry
- G01J3/4406—Fluorescence spectrometry
-
- G—PHYSICS
- G01—MEASURING; TESTING
- G01J—MEASUREMENT OF INTENSITY, VELOCITY, SPECTRAL CONTENT, POLARISATION, PHASE OR PULSE CHARACTERISTICS OF INFRARED, VISIBLE OR ULTRAVIOLET LIGHT; COLORIMETRY; RADIATION PYROMETRY
- G01J3/00—Spectrometry; Spectrophotometry; Monochromators; Measuring colours
- G01J3/28—Investigating the spectrum
- G01J3/44—Raman spectrometry; Scattering spectrometry ; Fluorescence spectrometry
- G01J3/4412—Scattering spectrometry
-
- G—PHYSICS
- G01—MEASURING; TESTING
- G01N—INVESTIGATING OR ANALYSING MATERIALS BY DETERMINING THEIR CHEMICAL OR PHYSICAL PROPERTIES
- G01N21/00—Investigating or analysing materials by the use of optical means, i.e. using sub-millimetre waves, infrared, visible or ultraviolet light
- G01N21/62—Systems in which the material investigated is excited whereby it emits light or causes a change in wavelength of the incident light
- G01N21/63—Systems in which the material investigated is excited whereby it emits light or causes a change in wavelength of the incident light optically excited
- G01N21/65—Raman scattering
-
- A—HUMAN NECESSITIES
- A61—MEDICAL OR VETERINARY SCIENCE; HYGIENE
- A61B—DIAGNOSIS; SURGERY; IDENTIFICATION
- A61B5/00—Measuring for diagnostic purposes; Identification of persons
- A61B5/44—Detecting, measuring or recording for evaluating the integumentary system, e.g. skin, hair or nails
- A61B5/441—Skin evaluation, e.g. for skin disorder diagnosis
- A61B5/445—Evaluating skin irritation or skin trauma, e.g. rash, eczema, wound, bed sore
-
- A—HUMAN NECESSITIES
- A61—MEDICAL OR VETERINARY SCIENCE; HYGIENE
- A61B—DIAGNOSIS; SURGERY; IDENTIFICATION
- A61B5/00—Measuring for diagnostic purposes; Identification of persons
- A61B5/68—Arrangements of detecting, measuring or recording means, e.g. sensors, in relation to patient
- A61B5/6801—Arrangements of detecting, measuring or recording means, e.g. sensors, in relation to patient specially adapted to be attached to or worn on the body surface
- A61B5/6813—Specially adapted to be attached to a specific body part
- A61B5/6814—Head
- A61B5/6815—Ear
-
- A—HUMAN NECESSITIES
- A61—MEDICAL OR VETERINARY SCIENCE; HYGIENE
- A61B—DIAGNOSIS; SURGERY; IDENTIFICATION
- A61B5/00—Measuring for diagnostic purposes; Identification of persons
- A61B5/68—Arrangements of detecting, measuring or recording means, e.g. sensors, in relation to patient
- A61B5/6801—Arrangements of detecting, measuring or recording means, e.g. sensors, in relation to patient specially adapted to be attached to or worn on the body surface
- A61B5/6813—Specially adapted to be attached to a specific body part
- A61B5/6814—Head
- A61B5/6819—Nose
-
- A—HUMAN NECESSITIES
- A61—MEDICAL OR VETERINARY SCIENCE; HYGIENE
- A61B—DIAGNOSIS; SURGERY; IDENTIFICATION
- A61B5/00—Measuring for diagnostic purposes; Identification of persons
- A61B5/68—Arrangements of detecting, measuring or recording means, e.g. sensors, in relation to patient
- A61B5/6801—Arrangements of detecting, measuring or recording means, e.g. sensors, in relation to patient specially adapted to be attached to or worn on the body surface
- A61B5/6813—Specially adapted to be attached to a specific body part
- A61B5/6814—Head
- A61B5/682—Mouth, e.g., oral cavity; tongue; Lips; Teeth
-
- A—HUMAN NECESSITIES
- A61—MEDICAL OR VETERINARY SCIENCE; HYGIENE
- A61B—DIAGNOSIS; SURGERY; IDENTIFICATION
- A61B5/00—Measuring for diagnostic purposes; Identification of persons
- A61B5/68—Arrangements of detecting, measuring or recording means, e.g. sensors, in relation to patient
- A61B5/6846—Arrangements of detecting, measuring or recording means, e.g. sensors, in relation to patient specially adapted to be brought in contact with an internal body part, i.e. invasive
-
- G—PHYSICS
- G01—MEASURING; TESTING
- G01J—MEASUREMENT OF INTENSITY, VELOCITY, SPECTRAL CONTENT, POLARISATION, PHASE OR PULSE CHARACTERISTICS OF INFRARED, VISIBLE OR ULTRAVIOLET LIGHT; COLORIMETRY; RADIATION PYROMETRY
- G01J3/00—Spectrometry; Spectrophotometry; Monochromators; Measuring colours
- G01J3/12—Generating the spectrum; Monochromators
- G01J2003/1213—Filters in general, e.g. dichroic, band
-
- G—PHYSICS
- G01—MEASURING; TESTING
- G01J—MEASUREMENT OF INTENSITY, VELOCITY, SPECTRAL CONTENT, POLARISATION, PHASE OR PULSE CHARACTERISTICS OF INFRARED, VISIBLE OR ULTRAVIOLET LIGHT; COLORIMETRY; RADIATION PYROMETRY
- G01J3/00—Spectrometry; Spectrophotometry; Monochromators; Measuring colours
- G01J3/28—Investigating the spectrum
- G01J3/2823—Imaging spectrometer
- G01J2003/2826—Multispectral imaging, e.g. filter imaging
-
- G—PHYSICS
- G01—MEASURING; TESTING
- G01N—INVESTIGATING OR ANALYSING MATERIALS BY DETERMINING THEIR CHEMICAL OR PHYSICAL PROPERTIES
- G01N2201/00—Features of devices classified in G01N21/00
- G01N2201/02—Mechanical
- G01N2201/022—Casings
- G01N2201/0221—Portable; cableless; compact; hand-held
-
- G—PHYSICS
- G01—MEASURING; TESTING
- G01N—INVESTIGATING OR ANALYSING MATERIALS BY DETERMINING THEIR CHEMICAL OR PHYSICAL PROPERTIES
- G01N2333/00—Assays involving biological materials from specific organisms or of a specific nature
- G01N2333/005—Assays involving biological materials from specific organisms or of a specific nature from viruses
- G01N2333/08—RNA viruses
- G01N2333/11—Orthomyxoviridae, e.g. influenza virus
-
- G—PHYSICS
- G01—MEASURING; TESTING
- G01N—INVESTIGATING OR ANALYSING MATERIALS BY DETERMINING THEIR CHEMICAL OR PHYSICAL PROPERTIES
- G01N2333/00—Assays involving biological materials from specific organisms or of a specific nature
- G01N2333/195—Assays involving biological materials from specific organisms or of a specific nature from bacteria
- G01N2333/305—Assays involving biological materials from specific organisms or of a specific nature from bacteria from Micrococcaceae (F)
- G01N2333/31—Assays involving biological materials from specific organisms or of a specific nature from bacteria from Micrococcaceae (F) from Staphylococcus (G)
-
- G—PHYSICS
- G01—MEASURING; TESTING
- G01N—INVESTIGATING OR ANALYSING MATERIALS BY DETERMINING THEIR CHEMICAL OR PHYSICAL PROPERTIES
- G01N2333/00—Assays involving biological materials from specific organisms or of a specific nature
- G01N2333/195—Assays involving biological materials from specific organisms or of a specific nature from bacteria
- G01N2333/34—Assays involving biological materials from specific organisms or of a specific nature from bacteria from Corynebacterium (G)
Definitions
- the present disclosure relates to a method and apparatus for rapidly detecting and identifying protein-based compounds including bacteria, virus, drugs, or tissue abnormalities, and more particularly a portable Raman spectroscopy based spectroscope which is adaptable for examining mucosal surfaces (nares, oral, ear), interrogating a wound site and/or inspection of a potentially contaminated object or surface for protein-based compounds including MRSA or other pathogens.
- the device can be adapted to interrogate tissue specimens, stool, urine, serum or secretions.
- Methicillin resistance of Staphylococcus aureus is determined by the mecA gene which is carried by a mobile genetic element, designated staphylococcal cassette chromosome mec (SCCmec). MecA encodes a beta-lactam-resistant penicillin-binding protein called PBP2a (or PBP2'). Beta-lactam antibiotics normally bind to PBPs in the cell wall disrupting the synthesis of the peptidoglycan layer which results in bacterium death. However, since the beta-lactam antibiotics cannot bind to PBP2a, synthesis of the peptidoglycan layer and the cell wall continues. While the mechanism responsible for mecA transfer is still obscure, evidence supports horizontal transfer of the mecA gene between different staphylococcal species. Typically MRSA is diagnosed using culture based methods.
- CLSI Clinical and Laboratory Standards Institute
- PBP2a The Clinical and Laboratory Standards Institute
- Phenotypic expression of resistance can vary depending on the growth conditions, as well as on the presence of subpopulations of staphylococci that may coexist (susceptible and resistant) within a culture making susceptibility testing by standard microbiological methods potentially problematic.
- culture takes time, usually 1 to 5 days.
- Faster techniques of MRSA screening by molecular methods, such as Polymerase Chain Reaction (PCR) have been developed to test for the mecA gene that confers resistance to methicillin, oxacillin, nafcillin, and dicloxacillin and other similar antibiotics. Such techniques, while faster, still take hours and are sent out to labs.
- commercially available molecular approaches (used for screening) are unable to detect mecA-variants of MRSA.
- Raman spectroscopy is a reagentless, non-destructive, technique that can provide the unique spectral fingerprint of a chemical and/or molecule allowing for target identification without sample preparation.
- a sample is irradiated with a specific wavelength of light whereby a small component, approximately 1 in 10 7 photons, is in-elastically scattered (at wavelengths shifted from the incident radiation).
- the inelastic scattering of photons due to molecular vibrations that change the molecule's polarizability, provide chemical and structural information uniquely characteristic of the targeted substance.
- Raman Spectroscopy can be extremely useful in fully characterizing a material's composition, and allows for relatively fast identification of unknown materials with the use of a Raman spectral database.
- Raman Spectroscopy is a non-contact and non-destructive technique, it is well suited for in-situ, in-vitro and in-vivo analysis.
- Raman Spectroscopy has high potential for screening of bacteria, virus, drugs, as well as tissue abnormalities since it: 1) is practical for a large number of molecular species; 2) can provide rapid identification; and 3) can be used for both qualitative and quantitative analysis.
- a portable or handheld micro Raman based detection instruments would be useful to reliably and rapidly assess Staphylococcus aureus strains in wounds or nasal passages. Rapid assessment and typing would enable tracking the spread of such pathogens and could significantly decrease the number of hospital-acquired infections and the associated costs in treatment thereof.
- a hand-held Raman spectroscopy based device system for mucosal examination (nares, oral, ear) and wound interrogation provides a method for rapid and cost effective screening of bacteria, virus, drugs, and tissue abnormalities.
- the device is a nonintrusive automated near-real-time-point-of-care detection system that can enable healthcare providers to render better patient management and optimize clinical outcomes.
- the device includes a disposable tip element having dimensions that are small enough to fit into a small body cavity, such as the nostril. Three types of tip elements may be employed with this system - one for direct nasal interrogation, one with vacuum suction and filter, and one with proximity optics for wound interrogation.
- the tip element and the device enclose an assembly of optical components which allow for Raman spectral measurement that can provide the unique spectral fingerprint of a chemical and/or molecule allowing for target identification without sample preparation.
- the device incorporates signal processing and identification algorithms for signal conditioning and target detection.
- Combinations of ultra-high resolution micro-filters in discrete regions (e.g., quadrants) of an area on the imaging detector array provide specific analysis of target spectral peaks. Each region or quadrant allows for discrete spectral band detection with each micro-filter providing specific wavenumber detection for spectral analysis.
- Discrete Raman spectral bands that distinguish a targeted substance from background interference are used to develop learning algorithms that serve as a basis for detection and target identification. By obtaining data at discrete spectral regions instead of over the entire spectral rage, acquisition time as well as spectral contributions from confounding background interference will be reduced or eliminated allowing for near-real-time assessment.
- Methods for identification of pathogens in fluidic samples using Raman spectroscopy also form a part of the present disclosure. These methods show use a limited number of discrete spectra peaks to sample key molecular identifiers of a wide range of potential targets for specific pathogen detection.
- the apparatus and methods described herein can be customized for a host of target materials and implemented in a relatively small, portable form factor.
- an adapted system is provided, which can be readily modified to change target needs by means of a built-in learning algorithm.
- An exemplary learning algorithm was developed under a United States Department of Defense program for real-time pathogen detection in water as well as for real-time identification of cancer cells from tissue samples and may be adapted into a detection protocol.
- DFA Discriminant Function Analysis
- the MRSA-2R strain of Staphylococcus aureus has reduced susceptibility to vancomycin and was isolated from human blood from a patient with fatal bacteremia.
- the MSSA-2S strain of Staphylococcus aureus is a hyper-virulent community acquired methicillin-susceptible strain isolated in the United Kingdom. It is a complete genome sequenced strain.
- the MRSA 1R strain of Staphylococcus aureus is Methicillin resistant and was isolated from a human abscess. It is confirmed to carry the mec A gene with a SCCmec, or staphylococcal cassette chromosome mec type IV and PFGE type USA 400.
- the MSSA-1S strain of Staphylococcus aureus is Methicillin sensitive and was isolated from a human lesion [ATCC].
- Staphylococcus epidermidis and Corynebacterium are normal flora found in the nose. Staphylococcus epidermidis with Corynebacteria predominantly colonizes the upper respiratory tract, especially the nostrils. S. epidermidis accounts for 90%-100% of the staphylococci found in the nasal cavity when S. aureus is not present. However, when S. aureus is present, the amount of S. epidermidis drastically decreases. Most species of Corynebacterium will not cause diseases in humans, however; Corynebacterium diptheriae NCTC 13129 is a strain that is highly infectious.
- Samples were prepared from bacteria plated on tryptic soy agar plates. A single colony was picked and added to 5 mls of tryptic soy broth in a 10ml culture tube. The culture tube was place on a shaker in a 37C incubator and incubated overnight. The next day an optical density (OD) was taken to verify the consistency of the growth conditions and to provide a reference OD. The overnight culture was centrifuged at room temperature for 5 min @ 3000 rpms. After centrifuging the supernatant was removed and the bacteria pellet was resuspended with 5mls of filtered tap water. The bacteria were centrifuged as stated and the washing process was repeated 2 more times.
- OD optical density
- Raman spectra were recorded with an in-via Raman microscope (Renishaw ® ) equipped with a 1800 l/mm grating, a 50 mW 514.5 nm laser as the excitation source at 100 % laser power.
- the laser light was focused onto the sample though a 63X dipping objective (Leica HCX PL APO 1.2NA Corr/0.17 CS).
- the spectra were acquired over a spectral range of 400-3200 cm-1 with 40 accumulations at an integration time of 10 s.
- spectra Prior to analysis, spectra were pre-processed using: (1) derivative smoothing with a sliding window of 5; (2) range exclusion in the region of 735-874 cm-1 and 1013-1116 cm-1 to eliminate quartz dominated spectral regions; (3) background subtraction via a robust polynomial fit to remove spectral contributions due to fluorescence; and (4) vector normalization to reduce bacteria concentration effects.
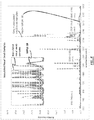
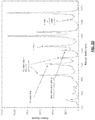
- the mean Raman spectra are shown in Figure 1 .
- a key to developing the Raman spectroscopy based detection device is the development of a Raman spectral database with analysis protocols that allow for target identification and classification.
- Raman spectral bands that can distinguish a targeted substance from background interference are identified. These discrete bands are used to develop learning algorithms that serve as a basis for detection and identification. By obtaining data at discrete spectral regions instead of over the entire spectral range (600-1800 cm-1), acquisition time as well as spectral contributions of confounding background interference can be reduced.
- the spectroscopic system with discrete spectral band identification for algorithms development is detailed in embodiments of the device.
- DFA discriminant function analysis
- Stepwise discriminant function analysis is used to reduce the number of variables (wavenumbers) to a subset of input into simultaneous discriminant analysis for classification.
- the analysis for identifying the MRSA strains of bacteria is done based upon 2-group classification scheme.
- the Staphylococcus group consisted of MRSA 1R, MRSA 2R, MSSA 1S, MSSA 2S, and S. epidermidis, while the non-staphylococcus group consisted of Bacillus subtilis, and Corynebacterium sp.
- the classification results show that 100% of cross-validated grouped cases correctly classified with 100% of the Staphylococcus group and 100% of the non-Staphylococcus group correctly classifying.
- DNA 810-820 Nucleic acids (C-O-P-O-C), A-type helix RNA 829, 852 Tyrosine (buried, exposed) Protein 877-937 Protein [v(C-C)], carbohydrates [v(COC)], lipids Carbohydrates, protein, lipids 1003 Phenylalanine v(C-C) ring breathing Protein 1030-1085 Protein[v(C-N), v(C-C)], carbohydrate [v(CO), v(C-C)], lipids Protein, carbohydrate, lipids 1095 DNA: PO 2 - str (sym) DNA 1126 Protein [(v(C-N), v(C-C)], lipids[v(C-C)], carbohydrates [v(C-C), v(COC) glycoside link] Protein, lipids, carbohydrates 1158 Protein [v(C-C)] Protein 1175 Aromatic amino acids, Tyrosine [ ⁇ (C-H)], Protein 1230-1295 Amide III [v
- Protein, lipids, carbohydrates (1126 cm -1 ), Lipid (1297 cm -1 ), Lipids/protein (1420 cm -1 ) MRSA 1R vs MRSA 2R Group 1: MRSA 1R 100% of cross-validated grouped cases correctly 3 wavenumbers Nucleic acids (1320 cm -1 , 1584 Group 2: MRSA 2R classified with 100% MRSA 1 Rand 100% MRSA 2R correctly classifying. cm -1 ), Lipids/protein/carbohydrates (1375 cm -1 ) MSSA from S.
- epidermidis Group 1 MSSA 1S and MSSA 2S 93.8 % of cross-validated grouped cases correctly classified with 93.9% Staphlocollus and 93.5% (Cory and Bacillus) correctlv classifyinq. 5 wavenumbers Protein (642 cm -1 , 1338, cm -1 ). Protein, lipids, carbohydrates (1126 cm -1 , 1450 cm -1 ), Nucleic acids (1578 cm -1 ) Group 2: S. epidermidis MSSA 1S from MSSA 2S Group 1: MSSA 1S 100% of cross-validated grouped cases correctly classified with 100% MSSA1S and 100% MSSA 2S correctly classifying. 2 wavenumbers Lipid/protein (1420 cm -1 ), Lipids/protein /carbohydrates (1450 cm -1 ) Group 2: MSSA 2S
- the first column in Table 2 lists members of each group.
- the second column lists the cross-validated classification results.
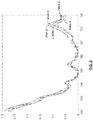
- the third column lists the specific wavenumbers utilized in the Discriminant function models which are shown accumulatively in FIG. 4 .
- the results of this analysis indicate that MRSA can be separated from other bacteria down to the strain level using a minimal number of Raman spectral bands. Further, methacillin sensitive strains of bacteria can also be distinguished and identified.
- a target pathogen with a confounding background For nasal analysis, background interference from potential confounding factors is assessed.
- S. aureus most commonly colonizes the anterior nares (the nostrils), although the respiratory tract, opened wounds, intravenous catheters, and urinary tract are also potential sites for infection. Since there are other bacteria and material in the exterior nares, it is important to investigate the ability to separate MRSA from other species of bacterium and confounding factors.
- Prominent nasal flora include Staphylococcus aureus, Staphylococcus epidermidis cells, Corynebacterium sp., and Propionibacterium sp.
- Nasal secretions may also include Mucin, Epithelial Cells and red blood cells.
- nasal swab samples are taken and inoculated with MRSA 1R, MRSA 2R, MSSA 1S or S. epidermidis.
- a cluster analysis is performed. The pure spectra, of Corynebacterium sp., Staphylococcus epidermidis, MSSA 2S and MRSA 2R in water as well as the spectra of nasal swab samples inoculated with MRSA 2R are analyzed.
- FIG. 5 show the results of a cluster analysis. The results show that nasal swab samples inoculated with MRSA 2R are grouping with pure samples of MRSA 2R indicating that Raman spectroscopy can be used to distinguish bacteria in the presence of confounding factors.
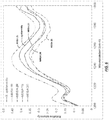
- spectra shown in FIG. 6 are pre-processed slightly different than those shown in previous figures. Due to the large intense peaks of background components, spectra were pre-processed with (1) derivative smoothing using a sliding window of 5; (2) background subtraction via a robust polynomial fit to remove spectral contributions due to fluorescence; and (3) normalization using the 1657 cm-1 peak as opposed to vector normalization.
- the classification results show that 94.5% of cross-validated grouped cases correctly classified with 95.8% of the Staphylococcus group, and 91.3% of the non-Staphylococcus group (Cory and Bacillus) correctly classifying. These results indicate that the regions of 640-740 cm -1 , 1200-1265 cm-1 have potential for bacteria identification.
- nasal swab samples inoculated with MRSA 1R, MRSA 2R, MSSA 1S or S. epidermidis were input into the analysis as unknowns. 100% of the cases correctly classified as staphylococcus.
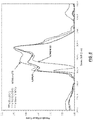
- the mean spectra of the Staphylococcus species and strains show clear distinction in these regions as best seen in FIGS. 8 and 9 .
- the system is designed to acquire Raman measurements in the presence of confounding factors. Measurements will be made directly in the nasal vestibule.
- the spectral regions of 640-740 cm-1, 1200-1265 cm-1, 1640-1740 cm-1 have minimal spectral components due to confounding factors and show utility for this application.
- the otoscope contains a nasal aspirator allowing the sample to be drawn into the end effector of the otoscope through an internal filter. This filter in procedure will reduce the signal from background interference.
- the spectral bands for this configuration are shown in FIG 4 .
- the data collected confirms that a number of Raman peaks exist for identification purposes.
- a comparison of the Raman spectra for A/PR/8 and A/WSN/33 shows a sufficient difference in the spectra, which provides distinguishing characteristics between viruses with the same serotype.
- the Raman spectra of all three viruses in FIG. 8 show a clear triplet of peaks at Raman shift between 2850 and 2950 cm -1 . These peaks are clearly present on all influenza viruses that we have been examined to date.
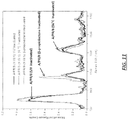
- FIG. 10 shows the spectra of immobilized influenza utilizing background subtraction techniques. The spectral bands clearly identify the distinguishing pleated sheet structure amide I group as well as distinct carbon-carbon nucleic acids and other amide groups.
- the present disclosure further enables an analysis for distinguishing a live (active) virus from a dead (inactivated) virus. For example, results from sampling inactivated dried samples of A/PR/8 (H1N1) serotype influenza run at an excitation wavelength of 785nm revealed difference in the Raman spectra of the virus based on the inactivation method utilized.
- the present disclosure has heretofore focused on active pathogen samples; however, preliminary results of testing the apparatus and methods described herein showed the Raman spectral data could be used to deactivation effects of the virus.
- a sample of A/PR/8 was deactivated by three distinct methods: UV, heat, and chemical deactivation.
- Example embodiments of a hand held micro Raman based detection instrument will now be described more fully with reference to FIGS. 12-24 of the accompanying drawings.
- Example embodiments are provided so that this disclosure will be thorough, and will fully convey the scope of this disclosure to those who are skilled in the art. Specific details may be set forth to provide a thorough understanding of embodiments of the present disclosure. It will be apparent to those skilled in the art that specific details need not be employed, that example embodiments may be embodied in many different forms and that neither should be construed to limit the scope of the disclosure. In some example embodiments, well-known processes, well-known structures, and well-known technologies are not described in detail.
- an exemplary form factor for the hand held Raman spectroscopy based system 10 is shown and which includes a miniature laser package and optics.
- the hand held system may be configured as an otoscope for testing in ears, nose and throat, as an ophthalmoscope for testing in the eyes or, more generally, as a hand held spectroscope for testing wounds sites, food or inanimate surfaces.
- Functional components of the system components include a hand held form factor housing 12 and, a disposable interrogation tip or end effector 14 that is used for nasal interrogation.
- the system can be used with three types of end effectors -- one for direct nasal interrogation, one with vacuum suction and filter, and one with proximity optics for wound interrogation.
- Other components not shown in FIG. 12 but illustrated and described hereinafter include optical sampling head having a hybrid micro mirror, an integrated micro CCD or CMOS imager with ultra-high resolution narrow range spatially graded filter (takes the place of a large delicate spectrometer), signal processing and identification algorithms for signal conditioning and target detection.
- a key to developing a hand-held Raman spectroscopy based device is the development of analysis protocols that allow for target identification and classification. Spectral analyses from discrete Raman bands that distinguish a targeted substance from background interference form the basis of this development. These discrete bands are used to develop learning algorithms that serve as a basis for detection and identification.
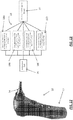
- a diagram of the functionality of hand-held device is schematically illustrated in FIG. 13 to include a probe front end 16, a set of micro-graded filters 18 and an imager 20. The set of micro-graded filters are designed for filtering at the discrete band, e.g. filters 18A-18D.
- Filter 18A is a micro-graded filter covering spectral band 640-740 cm -1 ( ⁇ 3 nm band)
- filter 18B is a micro-graded filter covering spectral band 1200-1260 cm -1 ( ⁇ 2 nm band)
- filter 18C is a micro-graded filter covering spectral band 1520-1560 cm -1 ( ⁇ 1.3 nm band)
- filter 18D is a micro-graded filter covering spectral band 1620-1750 cm -1 ( ⁇ 4.4 nm band).
- filter 18A filters a band in the range of 550.57-553.80 nm
- filter 18B filters a band in the range of 568.28-570.22 nm
- filter 18C filters a band in the range of 578.80-580.18 nm
- filter 18D filters a band in the range of 582.17-586.61 nm.
- the imager 20 may be a CCD, a CMOS or other similar digital imaging devices.
- This point-of-care (POC) diagnostic technology is relatively low cost and demonstrates feasibility for use in the resource-limited settings and triage settings to non-clinical utilities.
- the device allows for sample collection (with disposable nasal end effector on the device), processing and result readout in the same area, without the need to send samples to a central collection point for processing or testing. It requires no sample manipulation and provides safe-containment of bio-hazardous material with routine disposal of the disposable tip.
- Output is provided in a visual format, without ambiguity, and includes a full process negative and internal positive control. Read-outs are available as inputs into medical management protocols.
- the system may also include an integrated barcoding system as a way of connecting a sample taken perhaps hours earlier to the individual who provided that sample.
- the device is designed for operation in non-ideal conditions, which are expected for a field or point of care deployable instrument. This includes an ability to operate under temperature extremes between 0 and 45 degree Celsius. If the design is such that version capable of operating from -25 to +50 degrees Celsius could be produced, but may require heaters to prevent freezing that could impact battery life.
- the device is also designed to be water and dirt resistant to allow the devices to operate under non-ideal conditions. Only the disposable end effector is exposed to the patient, thus no sterilization or cleaning of the device will be required between uses. The exposed surfaces of the device may be fabricated with antimicrobial or bacterium-resistant material.
- the device may also utilize existing bar code bracelets if already assigned at the point-of-care facility or site.
- the device includes a small low-power processor to operate the device, collect and analyze data, and store results.
- the device includes a USB controller to allow for the downloading of data from the POC device's internal storage to external devices, as well as real time display.
- the device on an auxiliary monitor may also include standard wireless/cellular cards if desired.
- the device utilizes an externally accessible, readily swappable, rechargeable battery pack for power.
- FIG. 14 A schematic representation of the components of the hand-held Raman spectroscopy based device 10 is shown in Figure 14 .
- radiation from laser 22 is directed through a laser line filter 24, which transmits laser light while suppressing ambient light, to a 45° beam splitter 26.
- the beam splitter 26 reflects the laser light through the disposable end effector 14 to the samples where it interacts with the sample producing a Raman shifted signal.
- Light is collected from the sample at a 180-degree geometry and is transmitted through the beam splitter 26 and laser blocking filter 28.
- the laser blocking filter further prevents undesired laser light from reaching the detector 30.
- the Raman shifted signal then impinges upon a beam expander 32 (for example a simple beam expander 32A, 32B as shown in FIGS. 18A and 18B , respectively) that increase the diameter of a collimated input beam to a larger collimated output beam.
- a beam expander 32 for example a simple beam expander 32A, 32B as shown in FIGS. 18A and 18B , respectively
- the particular configuration and shape of the beam expander optics may be changed, such as off axis parabolic reflection, to make the beam expander more efficient and easily packaged within the device.
- the optical signals of the output beam are converted to electrical signals by an imager 30 with ultra-high resolution narrow range spatially graded filter 34 for processing.
- Filter 34 preferably includes a set of micro-graded filters 34A-34D as described in reference to FIG. 13 .
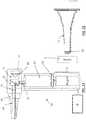
- the disposable end effector 14 schematically illustrated in FIG. 15 is an attachment that interacts with the patient either inserted into the nasal passage or in proximity to a wound or infection situs.
- a lens 36 is integrated at tip of the end effector to allow laser light be focused onto the specimens and Raman scattered light to be collected.
- a modified end effector 14' is used when sample filtration is required.
- the end effector 14' will connect to a vacuum source 38 allowing the sample to be drawn into the end effector body through an internal filter 40.
- the device may be fitted with a small vacuum pump which functions as the vacuum source 38 removes gas molecules (air) from a sealed volume, denoted by the dashed line in FIG.
- the vacuum will draw the sample into the end effector 14'.
- Raman measurement takes place at an optical window 42 fabricated out of an optically transparent material such as quartz.
- the optical window 42 is located concentrically within a mesh 44 and a seal 46 formed on an end of the end effector 14' opposite the filter 40. Filtering the sample will reduce the signal from background interference by trapping large debris allowing bacteria or virus to pass through for measurement.
- the system is configured to deliver and collect light from the sample using an open beam path.
- Lens tubes 24, 38 are utilized to isolate the optical path and reduce stray light.
- the end effectors 14, 14' shown are disposable specula that detachably connects to the head 48 of the device 10 with, for example a twist lock connection to allow for precise optical alignment and ease of end effector (tip) removal.
- the end effector connectors may be equipped with or without a focusing lens.
- the connector will house a lens 36 to allow laser light be focused onto the sample and Raman scattered light to be collected.
- the lens will be absent.
- the specula is designed as a single use component that is detached from the device head 48 and disposed in accordance with medical waste disposal procedures.
- the incident beam and collected signal light share a common path such that a 45° beam splitter 26 is used to reflect the laser light through the optics to the sample while efficiently transmitting the returning Raman-shifted signal light.
- a laser-blocking filter 24 at normal incidence is used ahead of the dispersion element 26 to completely block the undesired laser light.
- the diameter of a collimated input beam is increased with a beam expander 32 to a larger collimated output beam.
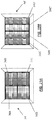
- a set of ultra-high resolution micro-filter quadrants 34A-34D are arranged in front of the imaging detector 30 and provide specific wavenumber or spectral band filtering by the discrete waveband analysis.
- Each quadrant 34A-34D allows for discrete spectral band detection with each micro-filter providing specific wavenumber detection for spectral analysis.
- the quadrants 34A-34D may be arranged symmetrically about the x and y axes as shown in FIG. 19A , or arranged in vertical bands as shown in FIG. 19B .
- the image sensor 30 converts the optical signals, into electrical signals.
- the imaging sensor 30 can be an integrated CCD or CMOS or the like.
- the unique micro optical filters provide a narrow range of spatially graded filter, which span the narrow spectral region covering a specific Raman Spectral peak or narrow region of closely neighboring peaks. Commercial graded filters do not have sufficient resolution to achieve 1 cm-1 spatial resolution.
- the spectral wavelength is transformed to an imaging array position/intensity reading that provides a reconstruction of the spectral peaks of interest.
- the method of fabrication is a graded Indium Aluminum Nitride (InAIN) alloy that can provide spectral filtering by band gap engineering at any region between 1eV and 6 eV band gap or 1240 nm to 206 nm.
- a hollow cathode based low energy plasma deposition is used to deposit the nitride alloy. Deposition is controlled by a sliding substrate window coordinated with a change in Indium deposition rate creating the graded optical coating.
- a narrow line width laser 22 packaged in a module with integral drive electronics is used for Raman excitation.
- the wavelength and laser power is chosen based upon the application.
- the laser is able to be used as an open beam source or be coupled to an optical waveguide.
- the spectrometer subsystem includes an electronic sub- system as well as an internal lithium-ion battery pack 52 to provide power to the system and allow for field-portable use.
- the system 10 is powered from either its internal battery pack or via an external charger/power adapter.
- the device 10 may have a provision for monitoring battery life and charge status.
- the device 10 may be designed with a USB controller (not shown) to allow for the downloading of data from the internal storage of the point of care (POC) device to external devices as well as a real time display (not shown). In the form of a compact LCD panel.
- the device may also be built to accommodate standard wireless/cellular communication if desired.
- the spectrometer electronic subsystem 50 utilizes a dedicated micro-controller to read the spectrum measured with the imaging sensor 30, performs the basic processing of the image data, and transmits that information to a display, PC or other similar interface.
- the device 10 may be fitted with a small vacuum 38 for pump to work in conjunction with the disposable end effector 14' with filter for vacuum suction application.
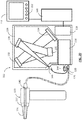
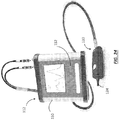
- an device 110 is designed as a Raman probe with optic connection to a portable detection system 112 as shown in FIGS. 20 and 24 .
- the device 110 is designed to deliver laser light to the sample and collect Raman scatter.
- the device 110 is configured with waveguides, lenses, and filters that function to transmit the Raman scatter from the sample to the detection system for spectral analysis in a manner similar to that described with respect to device 10.
- the detection system 112 is a portable unit approximately 24 cm X 10 cm x 3 cm in size (6"x4"x1"). Key components include a laser 114 optically coupled to the device 110 for Raman excitation, and a spectrograph subunit 114 optically coupled to the device 110 for the measurement of Raman radiation intensity as a function of wavelength.
- a spectrograph subunit 116 indicated by the dashed box in FIG. 20 can be configured as, but is not limited to: a grating spectrometer, a prism spectrometer, or an interferometer.
- the detection system 112 will also incorporate a micro controller 118 for signal processing and identification algorithms for signal conditioning and target detection, as well as support a user friendly graphical display that acts as the human-machine interface.
- a color LCD display will have sufficient resolution to display use instructions, as well as test results in text output for go/no-go classification, and to graphically display a spectra.
- a simple menu structure with large pushbutton icons make operation of the device straight
- the spectroscope subunit 116 is configured as a Czerny-Turner spectrometer. Radiation from laser 114 is directed through a flexible optical waveguide (fiber) 120 to the device 110 and is transmitted through a laser line filter 122 and disposable end effector 124 to the samples. The light interacts with the sample producing a Raman shifted signal which is collected at 180-degree geometry. The collected light is transmitted thought a laser blocking filter 122 and coupled into a flexible optical waveguide (fiber) 126. The laser blocking filter 122 prevents undesired laser light from reaching the detector. The Raman shifted signal is directed through the optical waveguide (fibers) 126 to the spectroscope subunit 116 of the detection system 112.
- Light entering the subunit 116 is reflected off of the collimating mirror 128 and is directed onto the diffraction grating 130 which separates incident polychromatic light into constituent wavelength components.
- the diffracted light is directed to a focusing mirror 132 onto a detector 134 which converts optical to electrical signals for processing.
- the disposable end effector 124 is a disposable specula that interacts with the patient either inserted into the nasal passage or in proximity to a wound or infection sight.
- the end effector design is similar to that described in FIGS. 15-17 .
- FIGS. 21-23D Further details of the optical train for the device 110 are illustrated in FIGS. 21-23D .
- Light from the laser 114 is coupled into the excitation fibers 120e of the probe as shown in FIG. 19 .
- the excitation fibers 120e form part of the fiber bundle 120 which are concentrically arranged around the collection fiber 120c.
- the collection fiber 120c has a diameter approximately four times larger than the diameter of the excitation fiber 120e.
- a high rejection filter (laser line filter) 122A at the output of these fibers is used to remove Raman bands arising from the silica core, thus allowing only the laser light to be transmitted to the sample.
- Hollow core Photonic crystal fibers are used as excitation fibers in order to reduce/eliminate the need for filtering.
- FIG. 22C illustrate an excitation beam transmitted from the excitation fibers 120e and impinging on the face of the cone lens 138.
- the height of the cone lens 138 is approximate twice the diameter of the excitation fiber 120e as best seen in FIG. 22B .
- This lens 138 has dielectric coated faces that allow the laser light to be reflected and the Raman scatter to be transmitted.
- the outside surface of the lens 138 is coated with a dielectric to reflect laser light and pass Stokes scattered light.
- the reflected laser light is directed toward the sample surface and focused with a convex lens. When the lens is absent, collimated light is output from the probe. Light scattered from a sample is collected 180 degrees relative to the direction of the laser beam. It is directed through the cone lens 138 which allows only the Raman scattered light to be coupled into the collection fiber 126.
- the off axis parabolic mirror is an annular or doughnut shaped optic that has eight conic depressions or dimples 140 on its surface. Each of the eight dimples 140 forms a 90 degree parabolic mirror with its focal point at a designated excitation fiber 120e.
- the cone lens 138 is a hollow hexagonal optical element whose faces are at a 45 degree angle. The lens 138 has a dielectric coating enabling it to act as a long pass filter (reflecting laser light and transmitting the Raman scatter).
- a strain relief boot 142 which provide strain relief to fiber cables, and exhibit a high degree of flexibility.
- a first connector 144 secures the excitation fiber (waveguide) of the device 110 to the laser 114.
- a second connector 146 secures the Raman collection fiber (waveguide) of the device 110 to the spectrograph subunit 116.
- a narrow line width laser 114 is packaged in a module with integral drive electronics for Raman excitation. The wavelength and laser power is selected based upon the application and target identification. The laser is coupled to an optical fiber or waveguide with use of a third connector.
- the second fiber connector 146 secures the input fiber 126 (or waveguide) to the spectrograph subunit 116. Light from the input fiber (or waveguide) enters the detection system through this connector. Behind the connector, a slit (not shown) having a dark piece of material containing a rectangular aperture may be utilized.
- the collimating mirror 128 focuses light entering the spectrometer portion of the detection system towards the grating 130. Diffraction grating 130 diffracts light from the collimating mirror 128 and directs the diffracted light onto the focusing mirror 132.
- the dispersive element 130 separates incident polychromatic light into constituent wavelength components and can be a grating or prism or a like.
- Focusing mirror 132 receives light reflected from the grating 130 and focuses the light onto the CCD Detector 134.
- CCD detector 134 collects the light received from the focusing mirror 132 and converts the optical signal to a digital signal.
- Each pixel on the CCD Detector corresponds to the wavelength of light that strikes it, creating a digital response signal.
- the detection system 112 includes an internal lithium-ion battery pack (not shown) to provide power to the system and allow for field-portable use.
- the system can be run from either its internal battery pack or via an external charger/power adapter.
- the device 112 will have a provision for monitoring battery life and charge status.
- the detection system 112 may include an electronic sub-system which includes a PC-based processor 148, spectrometer 116, vacuum pump and valve controller (not shown), pressure sensors (not shown), and interlocks.
- PC-based processor is used to perform all of the computation and coupled to an LCD display 150 with a touch screen and/or perimeter function buttons 152 to handle menu selection.
- the spectrometer subsystem 112 utilizes a dedicated micro-controller 118 to read the CCD array, perform basic processing on the image data, then transmit that information to the PC using a USB or other similar interface.
- a flow chart 210 illustrating the detection process is provided.
- a hand-held Raman spectroscopic device as described above is operated to transmit a coherent light beam from the excitation laser onto a sample.
- the imaging sensor detects radiation from the filtered Raman-shifted sample signal (block 212) and generates image data representative thereof (block 214).
- the image data is then analyzed (block 216) and the spectral features at discrete spectral bands are examined to detect the presence of a target pathogen (block 218). If no target pathogenic features are found, the device displays and/or reports a negative result for the presence of the target pathogen (block 220).
- target pathogenic features are found, these features are compared with baseline Raman spectra (block 222). Algorithms and classification coefficients are computed based on the baseline spectra (block 224). Typing of the target pathogenic features is done in a hierarchical approach and classification is assigned as the comparison moves down the hierarchy (block 226). If a positive database match is identified, the device displays and/or reports a positive result for the presence of the target pathogen (block 228). If a positive database match is not identified, the probability of the target pathogen's identity or membership within a particular group of interest may be computed and displayed or reported (block 230).
- a robust portable Raman spectroscopy based system as detailed above has many anticipated benefits.
- the nonintrusive, nondestructive technique for nasal examination and wound interrogation provides rapid and cost effective screening of a wide range of protein-based compounds including bacteria, virus, drugs, and tissue abnormalities.
- the method requires little or no sample preparation, reducing the need for storage of consumables.
- the ease of use and non-contact sampling make the device a valuable tool for point of care investigations.
- the device is a reagentless automated near real time point of care detection system that can enable healthcare providers to render better patient management and optimize clinical outcomes. Since the sensor can be developed to analyze bacteria, virus, drugs, and tissue, it can be promoted to a variety of market segments that include: primary care physicians, and drug stores.
Landscapes
- Physics & Mathematics (AREA)
- Spectroscopy & Molecular Physics (AREA)
- Health & Medical Sciences (AREA)
- General Physics & Mathematics (AREA)
- Life Sciences & Earth Sciences (AREA)
- Chemical & Material Sciences (AREA)
- Engineering & Computer Science (AREA)
- Organic Chemistry (AREA)
- General Health & Medical Sciences (AREA)
- Zoology (AREA)
- Wood Science & Technology (AREA)
- Proteomics, Peptides & Aminoacids (AREA)
- Immunology (AREA)
- Biochemistry (AREA)
- Analytical Chemistry (AREA)
- Biophysics (AREA)
- Molecular Biology (AREA)
- Pathology (AREA)
- Bioinformatics & Cheminformatics (AREA)
- Microbiology (AREA)
- General Engineering & Computer Science (AREA)
- Toxicology (AREA)
- Genetics & Genomics (AREA)
- Biotechnology (AREA)
- Nuclear Medicine, Radiotherapy & Molecular Imaging (AREA)
- Human Computer Interaction (AREA)
- Public Health (AREA)
- Medical Informatics (AREA)
- Heart & Thoracic Surgery (AREA)
- Animal Behavior & Ethology (AREA)
- Veterinary Medicine (AREA)
- Biomedical Technology (AREA)
- Surgery (AREA)
- Investigating, Analyzing Materials By Fluorescence Or Luminescence (AREA)
Abstract
Description
- This application claims the benefit of
U.S. Provisional Application No. 61/893,095, filed on August 7, 2013 - The present disclosure relates to a method and apparatus for rapidly detecting and identifying protein-based compounds including bacteria, virus, drugs, or tissue abnormalities, and more particularly a portable Raman spectroscopy based spectroscope which is adaptable for examining mucosal surfaces (nares, oral, ear), interrogating a wound site and/or inspection of a potentially contaminated object or surface for protein-based compounds including MRSA or other pathogens. The device can be adapted to interrogate tissue specimens, stool, urine, serum or secretions.
- This section provides background information related to the present disclosure which is not necessarily prior art.
- Methicillin resistance of Staphylococcus aureus (MRSA) is determined by the mecA gene which is carried by a mobile genetic element, designated staphylococcal cassette chromosome mec (SCCmec). MecA encodes a beta-lactam-resistant penicillin-binding protein called PBP2a (or PBP2'). Beta-lactam antibiotics normally bind to PBPs in the cell wall disrupting the synthesis of the peptidoglycan layer which results in bacterium death. However, since the beta-lactam antibiotics cannot bind to PBP2a, synthesis of the peptidoglycan layer and the cell wall continues. While the mechanism responsible for mecA transfer is still obscure, evidence supports horizontal transfer of the mecA gene between different staphylococcal species. Typically MRSA is diagnosed using culture based methods.
- The Clinical and Laboratory Standards Institute (CLSI) recommends the cefoxitin disk diffusion test supplemented with the latex agglutination test for PBP2a. Phenotypic expression of resistance can vary depending on the growth conditions, as well as on the presence of subpopulations of staphylococci that may coexist (susceptible and resistant) within a culture making susceptibility testing by standard microbiological methods potentially problematic. In addition, culture takes time, usually 1 to 5 days. Faster techniques of MRSA screening by molecular methods, such as Polymerase Chain Reaction (PCR), have been developed to test for the mecA gene that confers resistance to methicillin, oxacillin, nafcillin, and dicloxacillin and other similar antibiotics. Such techniques, while faster, still take hours and are sent out to labs. In addition, commercially available molecular approaches (used for screening) are unable to detect mecA-variants of MRSA.
- Raman spectroscopy is a reagentless, non-destructive, technique that can provide the unique spectral fingerprint of a chemical and/or molecule allowing for target identification without sample preparation. With this technique, a sample is irradiated with a specific wavelength of light whereby a small component, approximately 1 in 107 photons, is in-elastically scattered (at wavelengths shifted from the incident radiation). The inelastic scattering of photons, due to molecular vibrations that change the molecule's polarizability, provide chemical and structural information uniquely characteristic of the targeted substance. Raman Spectroscopy can be extremely useful in fully characterizing a material's composition, and allows for relatively fast identification of unknown materials with the use of a Raman spectral database. In addition, since Raman Spectroscopy is a non-contact and non-destructive technique, it is well suited for in-situ, in-vitro and in-vivo analysis.
- Raman Spectroscopy has high potential for screening of bacteria, virus, drugs, as well as tissue abnormalities since it: 1) is practical for a large number of molecular species; 2) can provide rapid identification; and 3) can be used for both qualitative and quantitative analysis. A portable or handheld micro Raman based detection instruments would be useful to reliably and rapidly assess Staphylococcus aureus strains in wounds or nasal passages. Rapid assessment and typing would enable tracking the spread of such pathogens and could significantly decrease the number of hospital-acquired infections and the associated costs in treatment thereof.
- This section provides a general summary of the disclosure, and is not a comprehensive disclosure of its full scope or all of its features.
- A hand-held Raman spectroscopy based device system for mucosal examination (nares, oral, ear) and wound interrogation provides a method for rapid and cost effective screening of bacteria, virus, drugs, and tissue abnormalities. The device is a nonintrusive automated near-real-time-point-of-care detection system that can enable healthcare providers to render better patient management and optimize clinical outcomes. The device includes a disposable tip element having dimensions that are small enough to fit into a small body cavity, such as the nostril. Three types of tip elements may be employed with this system - one for direct nasal interrogation, one with vacuum suction and filter, and one with proximity optics for wound interrogation. The tip element and the device enclose an assembly of optical components which allow for Raman spectral measurement that can provide the unique spectral fingerprint of a chemical and/or molecule allowing for target identification without sample preparation.
- The device incorporates signal processing and identification algorithms for signal conditioning and target detection. Combinations of ultra-high resolution micro-filters in discrete regions (e.g., quadrants) of an area on the imaging detector array provide specific analysis of target spectral peaks. Each region or quadrant allows for discrete spectral band detection with each micro-filter providing specific wavenumber detection for spectral analysis. Discrete Raman spectral bands that distinguish a targeted substance from background interference are used to develop learning algorithms that serve as a basis for detection and target identification. By obtaining data at discrete spectral regions instead of over the entire spectral rage, acquisition time as well as spectral contributions from confounding background interference will be reduced or eliminated allowing for near-real-time assessment.
- Methods for identification of pathogens in fluidic samples using Raman spectroscopy also form a part of the present disclosure. These methods show use a limited number of discrete spectra peaks to sample key molecular identifiers of a wide range of potential targets for specific pathogen detection. As a result, the apparatus and methods described herein can be customized for a host of target materials and implemented in a relatively small, portable form factor. In essence, an adapted system is provided, which can be readily modified to change target needs by means of a built-in learning algorithm. An exemplary learning algorithm was developed under a United States Department of Defense program for real-time pathogen detection in water as well as for real-time identification of cancer cells from tissue samples and may be adapted into a detection protocol. After pre-processing is complete, a Discriminant Function Analysis (DFA) is used to classify samples. DFA predicts membership in a group. The independent variables are the predictors and the dependent variables are the groups, based on an assumption of multivariate normality. This resulting data is used to modify the Raman-based spectral analysis executed in the hand held device.
- Further areas of applicability will become apparent from the description provided herein. The description and specific examples in this summary are intended for purposes of illustration only and are not intended to limit the scope of the present disclosure.
- The drawings described herein are for illustrative purposes only of selected embodiments and not all possible implementations, and are not intended to limit the scope of the present disclosure.
-
FIG. 1 illustrates the mean spectra for various bacteria in terms of the relative intensity as a function of wavelength; -
FIG. 2 illustrates the wave numbers or spectral bands ascertained with DFA distinguishing the tested bacteria; -
FIG. 3 illustrates a cluster analysis of Raman spectra of bacteria; -
FIG. 4 illustrates a comparison of mean spectra for inoculated nasal swab samples (light) and MRSA 1R (dark); -
FIG. 5 illustrates the mean spectra of Staphylococcus with an expanded view of minimally obstructed spectral regions 600-740 (cm-1); -
FIG. 6 illustrates the mean spectra of Staphylococcus with an expanded view of minimally obstructed spectral regions 1200-1300 (cm-1); -
FIG. 7 illustrates a sample of the Raman spectra collected for three influenza virus; -
FIG. 8 illustrates spectral peaks for the three influenza virus at Raman shifts between 2850 and 2950 cm-1; -
FIG. 9 illustrates spectral peaks for the three influenza virus at Raman shifts between 700 and 1700 cm-1; -
FIG. 10 illustrates the spectra of immobilized influenza utilizing background subtraction techniques; -
FIG. 11 illustrates spectra of an influenza virus which has been deactivated using different deactivation procedures including UV, thermal and chemical treatment; -
FIG. 12 illustrates an exemplary form factor of the hand held micro-Raman based detection instrument; -
FIG. 13 illustrates the functional characteristics of the spectroscope shown inFIG. 12 ; -
FIG. 14 illustrates the components of the device shown inFIG. 12 ; -
FIG. 15 a disposable end effector of the device for wound and/or nasal interrogation; -
FIG. 16 illustrates a disposable end effector of the device with filtering function for vacuum suction application; -
FIG. 17 is an end view of the end effector shown inFIG. 16 ; -
FIG. 18A and 18B illustrate simple examples of the beam expander shown inFIG. 14 ; -
FIG. 19 illustrates the filter element shown inFIG. 14 ; -
FIG. 20 illustrates another embodiment of a Raman probe and detection system; -
FIG. 21A-C illustrates the optical components of the Raman probe shown inFIG. 20 ; -
FIG. 22A-C illustrates detailed aspects of the optical components shown inFIG. 20 ; -
FIG. 23A-D illustrates a laser line filter, off-axis parabolic mirror system and hexagonal conical lens for the Raman probe shown inFIG. 22 ; -
FIG. 24 illustrates a portable form factor of the device shown inFIG. 20 ;and -
FIG. 25 is a flow chart illustrating the operating procedures carried out during a pathogen detection procedure using the hand held micro-Raman based detection instrument. - Corresponding reference numerals indicate corresponding parts throughout the several views of the drawings.
- Through preliminary studies explained in further detail below, the feasibility of Raman Spectroscopy to assess various protein-based compounds including numerous pathogens using a laboratory Raman Spectrometer is demonstrated. For these studies the following pathogens were evaluated in the absence of background interference:
- MSSA-1S: Staphylococcus aureus subsp. aureus (ATCC® 6538™);
- MSSA-2S: Staphylococcus aureus subsp. aureus (ATCC® BAA1721™);
- MRSA-1R: Staphylococcus aureus (ATCC® BAA1683™);
- MRSA-2R: Staphylococcus aureus subsp. aureus (ATCC® 700787™);
- Corynebacterium sp. (ATCC® 6931™);
- Staphylococcus epidermidis (ATCC® 12228™);
- Influenza APR8/34 (H1N1);
- Influenza A/WSN/32 (H1N1); and
- Influenza A/Udorn/72 (H2N3).
- The MRSA-2R strain of Staphylococcus aureus has reduced susceptibility to vancomycin and was isolated from human blood from a patient with fatal bacteremia. The MSSA-2S strain of Staphylococcus aureus is a hyper-virulent community acquired methicillin-susceptible strain isolated in the United Kingdom. It is a complete genome sequenced strain. The
MRSA 1R strain of Staphylococcus aureus is Methicillin resistant and was isolated from a human abscess. It is confirmed to carry the mec A gene with a SCCmec, or staphylococcal cassette chromosome mec type IV andPFGE type USA 400. The MSSA-1S strain of Staphylococcus aureus is Methicillin sensitive and was isolated from a human lesion [ATCC]. - Staphylococcus epidermidis and Corynebacterium are normal flora found in the nose. Staphylococcus epidermidis with Corynebacteria predominantly colonizes the upper respiratory tract, especially the nostrils. S. epidermidis accounts for 90%-100% of the staphylococci found in the nasal cavity when S. aureus is not present. However, when S. aureus is present, the amount of S. epidermidis drastically decreases. Most species of Corynebacterium will not cause diseases in humans, however; Corynebacterium diptheriae NCTC 13129 is a strain that is highly infectious.
- Samples were prepared from bacteria plated on tryptic soy agar plates. A single colony was picked and added to 5 mls of tryptic soy broth in a 10ml culture tube. The culture tube was place on a shaker in a 37C incubator and incubated overnight. The next day an optical density (OD) was taken to verify the consistency of the growth conditions and to provide a reference OD. The overnight culture was centrifuged at room temperature for 5 min @ 3000 rpms. After centrifuging the supernatant was removed and the bacteria pellet was resuspended with 5mls of filtered tap water. The bacteria were centrifuged as stated and the washing process was repeated 2 more times. On the final wash the OD of the solution was measured and if the OD was greater than 1.05, water was added until an OD of 1+0.05 was obtained. 150 ul of the bacteria suspension was then placed on a UV quartz substrate (Craic technologies) for Raman spectroscopy.
- Raman spectra were recorded with an in-via Raman microscope (Renishaw ®) equipped with a 1800 l/mm grating, a 50 mW 514.5 nm laser as the excitation source at 100 % laser power. The laser light was focused onto the sample though a 63X dipping objective (Leica HCX PL APO 1.2NA Corr/0.17 CS). The spectra were acquired over a spectral range of 400-3200 cm-1 with 40 accumulations at an integration time of 10 s.
- Prior to analysis, spectra were pre-processed using: (1) derivative smoothing with a sliding window of 5; (2) range exclusion in the region of 735-874 cm-1 and 1013-1116 cm-1 to eliminate quartz dominated spectral regions; (3) background subtraction via a robust polynomial fit to remove spectral contributions due to fluorescence; and (4) vector normalization to reduce bacteria concentration effects. The mean Raman spectra are shown in
Figure 1 . - A key to developing the Raman spectroscopy based detection device is the development of a Raman spectral database with analysis protocols that allow for target identification and classification. As part of the analysis protocol, Raman spectral bands that can distinguish a targeted substance from background interference are identified. These discrete bands are used to develop learning algorithms that serve as a basis for detection and identification. By obtaining data at discrete spectral regions instead of over the entire spectral range (600-1800 cm-1), acquisition time as well as spectral contributions of confounding background interference can be reduced. The spectroscopic system with discrete spectral band identification for algorithms development is detailed in embodiments of the device.
- To identify discrete spectral bands of statistical significance, the pure spectra of bacteria in water were analyzed using discriminant function analysis, DFA (IBM SPSS Statistics 21). DFA builds a predictive model for group membership. The model is composed of discriminant functions that are based on linear combinations of predictor variables. Spectral data, that is to say wavenumber with associated Raman intensity, corresponding to the following Raman peaks were utilized: 600, 621, 643, 670, 725, 896, 935, 960, 1003, 1126, 1158, 1173, 1209, 1249, 1297, 1320, 1338, 1362, 1375, 1397, 1420, 1449, 1480, 1578, 1584, 1606, 1620, 1640, 1657 cm-1. Stepwise discriminant function analysis is used to reduce the number of variables (wavenumbers) to a subset of input into simultaneous discriminant analysis for classification. Once the model is finalized, cross validation is done based on the "leave one-out" principle in which one individual is removed from the original matrix and the discriminant analysis is then performed from the remaining observations and used to classify the omitted individual.
- A similar procedure and analysis can be used for other pathogens such as the influenza virus described herein, as well as numerous other protein-based compounds.
- The analysis for identifying the MRSA strains of bacteria is done based upon 2-group classification scheme. First an investigation of the ability of Raman spectroscopy to distinguish the Staphylococcus genus from other genus of bacteria is conducted. The Staphylococcus group consisted of
MRSA 1R,MRSA 2R,MSSA 1S, MSSA 2S, and S. epidermidis, while the non-staphylococcus group consisted of Bacillus subtilis, and Corynebacterium sp. The classification results show that 100% of cross-validated grouped cases correctly classified with 100% of the Staphylococcus group and 100% of the non-Staphylococcus group correctly classifying. Five wavenumbers were utilized in the discriminant model ; 725 cm-1, 1158 cm-1, 1209 cm-1, 1420 cm-1, and 1450 cm-1, corresponding to vibrations of nucleic acids, proteins and lipids. Raman vibrational band assignments are given in Table 1 shown below.TABLE 1 Wavenumber cm -1Tentative Assignments from Literature Location 620, 640 Amino acids (620 cm-1 = phenylalanine, 640 cm-1 = tyrosine) Protein 665-782 Nucleic acids (G,A,C,T,U) DNA/RNA 788 O-P-O sym str. DNA 810-820 Nucleic acids (C-O-P-O-C), A-type helix RNA 829, 852 Tyrosine (buried, exposed) Protein 877-937 Protein [v(C-C)], carbohydrates [v(COC)], lipids Carbohydrates, protein, lipids 1003 Phenylalanine v(C-C) ring breathing Protein 1030-1085 Protein[v(C-N), v(C-C)], carbohydrate [v(CO), v(C-C)], lipids Protein, carbohydrate, lipids 1095 DNA: PO2 - str (sym) DNA 1126 Protein [(v(C-N), v(C-C)], lipids[v(C-C)], carbohydrates [v(C-C), v(COC) glycoside link] Protein, lipids, carbohydrates 1158 Protein [v(C-C)] Protein 1175 Aromatic amino acids, Tyrosine [δ(C-H)], Protein 1230-1295 Amide III [v(C-N), N-H bend, C=O, O=C-N bend], 1230 cm-1 =sat lipid Protein, nucleic acids, lipids 1295,1267 Lipids [δ(CH2)] likely unsaturated Lipids 1320-1340 Nucleic acids (Guanine, Adenine), proteins, carbs (1340 cm-1) DNA/RNA, proteins, carbohydrates 1336 Amino acids [C-H bend] Protein 1375 Nucleic acids (T,A,G) DNA 1420-1460 Lipids, carbohydrates, proteins [δ(C-H2) scissoring for each] Lipids, carbohydrates, proteins 1483-1487 Nucleic acid (G, A), CH def. DNA 1518-1550 Amide II [N-H bend, v(C-N), v(C=C)] Protein 1575-1578 Nucleic acids (G, A), ring stretching DNA 1585 Tryptophan, Phenylalanine Protein 1606 Phenylalanine, Tyr. Protein 1617 Tyrosine, Trp. Protein 1640 Water 1650-1680 Amide I [v(C=O), v(C-N), N-H bend], Lipid [C=C str] Protein, Lipid 1735 >C=O ester str. Lipids - Next, the feasibility of Raman spectroscopy to distinguish MRSA from other Staphylococcus species and strains is determined. The analysis continues all the way to stain identification. The DFA classification results are provided in Table 2 shown below.
TABLE 2 Groups Cross-validated Results Wavenumbers for the DF Genus Group 1: Staphylococcus Group 2: Bacillus and Cory 100% of cross-validated grouped cases correctly classified with 100% Staphlocollus and 100% (Cory and Bacillus) correctly classifying. 5 wavenumbers Nucleic acids (725 cm-1), Protein (1158 cm-1, 1209 cm-1), Lipids/protein (1420 cm-1), Lipids/protein/carbohydrates (1450 cm-1) MRSA from other staph Group 1: MRSA1R and MRSA 2R Group 2:MSSA 1S, MSSA 2S, and S. epidermidis90.7% of cross-validated grouped cases correctly classified with 89.9% MRSA and 91.3% (MSSA and S. epidermidis) correctly classifying. 6 wavenumbers Protein (621 cm-1, 1173 cm-1, 1338 cm-1). Protein, lipids, carbohydrates (1126 cm-1), Lipid (1297 cm-1), Lipids/protein (1420 cm-1) MRSA 1R vsMRSA 2RGroup 1: MRSA 1R100% of cross-validated grouped cases correctly 3 wavenumbers Nucleic acids (1320 cm-1, 1584 Group 2: MRSA 2Rclassified with 100 % MRSA 1 Rand 100% MRSA 2R correctly classifying.cm-1), Lipids/protein/carbohydrates (1375 cm-1) MSSA from S. epidermidis Group 1: MSSA 1S and MSSA 2S93.8 % of cross-validated grouped cases correctly classified with 93.9% Staphlocollus and 93.5% (Cory and Bacillus) correctlv classifyinq. 5 wavenumbers Protein (642 cm-1, 1338, cm-1). Protein, lipids, carbohydrates (1126 cm-1, 1450 cm-1), Nucleic acids (1578 cm-1) Group 2: S. epidermidis MSSA 1S from MSSA 2S Group 1: MSSA 1S100% of cross-validated grouped cases correctly classified with 100% MSSA1S and 100% MSSA 2S correctly classifying. 2 wavenumbers Lipid/protein (1420 cm-1), Lipids/protein /carbohydrates (1450 cm-1) Group 2: MSSA 2S - The first column in Table 2 lists members of each group. The second column lists the cross-validated classification results. The third column lists the specific wavenumbers utilized in the Discriminant function models which are shown accumulatively in
FIG. 4 . The results of this analysis indicate that MRSA can be separated from other bacteria down to the strain level using a minimal number of Raman spectral bands. Further, methacillin sensitive strains of bacteria can also be distinguished and identified. - Next, the detection of a target pathogen with a confounding background is considered. For nasal analysis, background interference from potential confounding factors is assessed. S. aureus most commonly colonizes the anterior nares (the nostrils), although the respiratory tract, opened wounds, intravenous catheters, and urinary tract are also potential sites for infection. Since there are other bacteria and material in the exterior nares, it is important to investigate the ability to separate MRSA from other species of bacterium and confounding factors. Prominent nasal flora include Staphylococcus aureus, Staphylococcus epidermidis cells, Corynebacterium sp., and Propionibacterium sp. Nasal secretions may also include Mucin, Epithelial Cells and red blood cells.
- For this work nasal swab samples are taken and inoculated with
MRSA 1R,MRSA 2R,MSSA 1S or S. epidermidis. To determine if MRSA can be distinguished in the presence of nasal secretions, a cluster analysis is performed. The pure spectra, of Corynebacterium sp., Staphylococcus epidermidis, MSSA 2S andMRSA 2R in water as well as the spectra of nasal swab samples inoculated withMRSA 2R are analyzed.FIG. 5 show the results of a cluster analysis. The results show that nasal swab samples inoculated withMRSA 2R are grouping with pure samples ofMRSA 2R indicating that Raman spectroscopy can be used to distinguish bacteria in the presence of confounding factors. - To determine regions of the Raman spectra that are not dominated by background interference, the pure spectra of
MRSA 1R (in the absence of background factors) was overlaid on the spectra of inoculated nasal swab samples.FIG 6 indicate that regions around 640-740, 1200-1265, 1520-1560 and 1620-1700 cm-1 have minimal background contribution. - The spectra shown in
FIG. 6 are pre-processed slightly different than those shown in previous figures. Due to the large intense peaks of background components, spectra were pre-processed with (1) derivative smoothing using a sliding window of 5; (2) background subtraction via a robust polynomial fit to remove spectral contributions due to fluorescence; and (3) normalization using the 1657 cm-1 peak as opposed to vector normalization. - The pure spectra, of bacteria in water, were re-analyzed with DFA using data only in the regions 640-740, 1200-1265 cm-1. The ability of Raman spectroscopy to distinguish the Staphylococcus genus from other bacteria genus is shown in below. Five wavenumbers are utilized in the discriminant model ; 640 cm-1, 672 cm-1, 725 cm-1, 1209 cm-1, and 1225 cm-1, corresponding to vibrations of nucleic acids, and proteins.
TABLE 3 Groups Gross-validated Results Wavenumbers for the DF Genus Group 1: Staphylococcus 94.5% of cross-validated grouped cases correctly classified with 95.8% Staphylococcus and 91.3% (Cory and Bacillus) correctly classifying. 5 wavenumbers
Protein (640 cm-1, 1209 cm-1), Nucleic acids (672 cm-1, 725 cm-1), edge of Amide III peak (1225 cm-1)Group 2: Bacillus and Cory - The classification results show that 94.5% of cross-validated grouped cases correctly classified with 95.8% of the Staphylococcus group, and 91.3% of the non-Staphylococcus group (Cory and Bacillus) correctly classifying. These results indicate that the regions of 640-740 cm-1, 1200-1265 cm-1 have potential for bacteria identification. To test the model further, nasal swab samples inoculated with
MRSA 1R,MRSA 2R,MSSA 1S or S. epidermidis were input into the analysis as unknowns. 100% of the cases correctly classified as staphylococcus. Further, the mean spectra of the Staphylococcus species and strains show clear distinction in these regions as best seen inFIGS. 8 and9 . - The preliminary studies detailed above have shown a high confidence level that staph in general can be identified with 5 or less Raman spectral regions. In one embodiment of the invention, the system is designed to acquire Raman measurements in the presence of confounding factors. Measurements will be made directly in the nasal vestibule. The spectral regions of 640-740 cm-1, 1200-1265 cm-1, 1640-1740 cm-1 have minimal spectral components due to confounding factors and show utility for this application. In another embodiment, the otoscope contains a nasal aspirator allowing the sample to be drawn into the end effector of the otoscope through an internal filter. This filter in procedure will reduce the signal from background interference. The spectral bands for this configuration are shown in
FIG 4 . - An analysis for identifying influenza virus is done using a similar classification scheme. Raman spectra have been obtained for several purified influenza viruses in phosphate buffer solution using hand held micro Raman spectrometer at an excitation wavelength of 514.5 nm fitted with a fluidic probe as further described herein. An excitation wavelength of 514.5 nm, resulted in a significant fluorescence signal from the samples. However, Raman peaks associated with the target viruses were sufficiently strong to be detectable from the background fluorescent signal. A sample of the Raman spectra collected for three influenza virus examined are shown in
FIG. 7 . The three strains of influenza for which preliminary results are shown are as follows: A/PR/8 and A/WSN/33 both being of the H1N1 serotype and A/Udorn/72 of the H3N2 serotype. - The results confirm that Raman spectra can be obtained for influenza virus. In addition to confirming the utility of Raman for the investigation of influenza viruses, the data collected confirms that a number of Raman peaks exist for identification purposes. A comparison of the Raman spectra for A/PR/8 and A/WSN/33 shows a sufficient difference in the spectra, which provides distinguishing characteristics between viruses with the same serotype. The Raman spectra of all three viruses in
FIG. 8 show a clear triplet of peaks at Raman shift between 2850 and 2950 cm-1. These peaks are clearly present on all influenza viruses that we have been examined to date. - This sample data clearly provides virus detection in general as compared to spectrum from other biological entities. At Raman shifts of approximately 700 to 1700 cm-1, as shown in
FIG. 9 , a large number of distinct peaks are observed for all virus samples. While many of these peaks are common to all viruses tested, a close examination shows that the relative heights of the specific peaks as well as shifts in the position of some peaks differ with each virus strain. It is these peak ratios and shifts that are utilized to distinguish the various strains from one another. To increase the sensitivity and data characteristics of influenza,FIG. 10 shows the spectra of immobilized influenza utilizing background subtraction techniques. The spectral bands clearly identify the distinguishing pleated sheet structure amide I group as well as distinct carbon-carbon nucleic acids and other amide groups. These results clearly indicate influenza distinguishing abilities for Raman spectroscopy identification. The improvements in sensitivity and an increase in resolution in the described system will help in identifying and distinguishing differences in this region. - The present disclosure further enables an analysis for distinguishing a live (active) virus from a dead (inactivated) virus. For example, results from sampling inactivated dried samples of A/PR/8 (H1N1) serotype influenza run at an excitation wavelength of 785nm revealed difference in the Raman spectra of the virus based on the inactivation method utilized. The present disclosure has heretofore focused on active pathogen samples; however, preliminary results of testing the apparatus and methods described herein showed the Raman spectral data could be used to deactivation effects of the virus. In order to determine the deactivation effects of the virus, a sample of A/PR/8 was deactivated by three distinct methods: UV, heat, and chemical deactivation. When these samples were examined at an excitation wavelength of 785nm, clear difference in the Raman spectra of the sample that was chemically deactivate were observed as can be seen in
FIG. 11 . This difference is most obvious in the shift of the peak from 1080 to 1040 cm-1, but can also be seen in the minor shift of the peak located near 1340 cm-1. Minor difference also exists between the UV and heat deactivated influenza samples, but indicates the sensitivity to change in the analysis. This information is useful for the identifying changes or mutations in the target virus. For example,FIG. 7 shows a significant portion of the mean Raman spectra of APR8/34 (H1N1), A/WSN/32 (H1N1), and A/Udorn/72 (H3N2) after preprocessing. Approximately 12 spectra averaged of each pathogen were averaged and the classification results are reproduced in Table 4 below.TABLE 4 Virus Type Predicted Group Membership Total WSN PR-8-34 UDORN Original Count WSN 11 1 0 12 dimension 2PR-8-34 0 8 0 8 UDORN 0 0 12 12 % WSN 91.7 8.3 .0 100.0 dimension 2PR-8-34 .0 100.0 .0 100.0 UDORN .0 .0 100.0 100.0 - Example embodiments of a hand held micro Raman based detection instrument will now be described more fully with reference to
FIGS. 12-24 of the accompanying drawings. Example embodiments are provided so that this disclosure will be thorough, and will fully convey the scope of this disclosure to those who are skilled in the art. Specific details may be set forth to provide a thorough understanding of embodiments of the present disclosure. It will be apparent to those skilled in the art that specific details need not be employed, that example embodiments may be embodied in many different forms and that neither should be construed to limit the scope of the disclosure. In some example embodiments, well-known processes, well-known structures, and well-known technologies are not described in detail. - The terminology used herein is for the purpose of describing particular example embodiments only and is not intended to be limiting. As used herein, the singular forms "a," "an," and "the" may include the plural forms as well, unless the context clearly indicates otherwise. The terms "comprises," "comprising," "including," and "having," are inclusive and therefore specify the presence of recited structure(s) or step(s); for example, the stated features, integers, steps, operations, groups elements, and/or components, but do not preclude the presence or addition of additional structure(s) or step(s) thereof. The methods, steps, processes, and operations described herein are not to be construed as necessarily requiring performance in the stated or any particular order discussed or illustrated, unless specifically identified as an order of performance. It is also to be understood that additional, alternative or equivalent steps may be employed.
- When structure is referred to as being "on," "engaged to," "connected to," or "coupled to" other structure, it may be directly or indirectly (i.e., via intervening structure) on, engaged, connected or coupled to the other structure. In contrast, when structure is referred to as being "directly on," "directly engaged to," "directly connected to," or "directly coupled to" the other structure, there may be no intervening structure present. Other words used to describe the relationship between elements should be interpreted in a like fashion (e.g., "between" versus "directly between," "adjacent" versus "directly adjacent"). As used herein, the term "and/or" includes any and all combinations of one or more of the associated referenced items.
- Terms of degree (e.g., first, second, third) which are used herein to describe various structure or steps are not intended to be limiting. These terms are used to distinguish one structure or step from other structure or steps, and do not imply a sequence or order unless clearly indicated by the context of their usage. Thus, a first structure or step similarly may be termed a second structure or step without departing from the teachings of the example embodiments. Likewise, spatially relative terms (e.g., "inner," "outer," "beneath," "below," "lower," "above," "upper") which are used herein to describe the relative special relationship of one structure or step to other structure or step(s) may encompass orientations of the device or its operation that are different than depicted in the figures. For example, if a figure is turned over, structure described as "below" or "beneath" other structure would then be oriented "above" the other structure without materially affecting its special relationship or operation. The structure may be otherwise oriented (e.g. rotated 90 degrees or at other orientations) and the spatially relative descriptors used herein interpreted accordingly.
- With reference now to
FIG. 12 , an exemplary form factor (e.g, Tele-View® Wireless Otoscope by Advanced Monitors Corp.) for the hand held Raman spectroscopy basedsystem 10 is shown and which includes a miniature laser package and optics. The hand held system may be configured as an otoscope for testing in ears, nose and throat, as an ophthalmoscope for testing in the eyes or, more generally, as a hand held spectroscope for testing wounds sites, food or inanimate surfaces. Functional components of the system components include a hand heldform factor housing 12 and, a disposable interrogation tip orend effector 14 that is used for nasal interrogation. The system can be used with three types of end effectors -- one for direct nasal interrogation, one with vacuum suction and filter, and one with proximity optics for wound interrogation. Other components not shown inFIG. 12 but illustrated and described hereinafter include optical sampling head having a hybrid micro mirror, an integrated micro CCD or CMOS imager with ultra-high resolution narrow range spatially graded filter (takes the place of a large delicate spectrometer), signal processing and identification algorithms for signal conditioning and target detection. - A key to developing a hand-held Raman spectroscopy based device is the development of analysis protocols that allow for target identification and classification. Spectral analyses from discrete Raman bands that distinguish a targeted substance from background interference form the basis of this development. These discrete bands are used to develop learning algorithms that serve as a basis for detection and identification. A diagram of the functionality of hand-held device is schematically illustrated in
FIG. 13 to include a probefront end 16, a set ofmicro-graded filters 18 and animager 20. The set of micro-graded filters are designed for filtering at the discrete band, e.g. filters 18A-18D. As presently preferred,Filter 18A is a micro-graded filter covering spectral band 640-740 cm-1 (∼ 3 nm band),filter 18B is a micro-graded filter covering spectral band 1200-1260 cm-1 (∼ 2 nm band),filter 18C is a micro-graded filter covering spectral band 1520-1560 cm-1 (∼ 1.3 nm band), and filter 18D is a micro-graded filter covering spectral band 1620-1750 cm-1 (∼ 4.4 nm band). It should be noted for an excitation beam at 532 nm,filter 18A filters a band in the range of 550.57-553.80 nm,filter 18B filters a band in the range of 568.28-570.22 nm,filter 18C filters a band in the range of 578.80-580.18 nm, and filter 18D filters a band in the range of 582.17-586.61 nm. Theimager 20 may be a CCD, a CMOS or other similar digital imaging devices. - This point-of-care (POC) diagnostic technology is relatively low cost and demonstrates feasibility for use in the resource-limited settings and triage settings to non-clinical utilities. The device allows for sample collection (with disposable nasal end effector on the device), processing and result readout in the same area, without the need to send samples to a central collection point for processing or testing. It requires no sample manipulation and provides safe-containment of bio-hazardous material with routine disposal of the disposable tip. Output is provided in a visual format, without ambiguity, and includes a full process negative and internal positive control. Read-outs are available as inputs into medical management protocols. The system may also include an integrated barcoding system as a way of connecting a sample taken perhaps hours earlier to the individual who provided that sample.
- As noted above, the device is designed for operation in non-ideal conditions, which are expected for a field or point of care deployable instrument. This includes an ability to operate under temperature extremes between 0 and 45 degree Celsius. If the design is such that version capable of operating from -25 to +50 degrees Celsius could be produced, but may require heaters to prevent freezing that could impact battery life. The device is also designed to be water and dirt resistant to allow the devices to operate under non-ideal conditions. Only the disposable end effector is exposed to the patient, thus no sterilization or cleaning of the device will be required between uses. The exposed surfaces of the device may be fabricated with antimicrobial or bacterium-resistant material.
- The device, as an option, may also utilize existing bar code bracelets if already assigned at the point-of-care facility or site. The device includes a small low-power processor to operate the device, collect and analyze data, and store results. The device includes a USB controller to allow for the downloading of data from the POC device's internal storage to external devices, as well as real time display. The device on an auxiliary monitor may also include standard wireless/cellular cards if desired. The device utilizes an externally accessible, readily swappable, rechargeable battery pack for power.
- A schematic representation of the components of the hand-held Raman spectroscopy based
device 10 is shown inFigure 14 . In this example, radiation fromlaser 22 is directed through alaser line filter 24, which transmits laser light while suppressing ambient light, to a 45°beam splitter 26. Thebeam splitter 26 reflects the laser light through thedisposable end effector 14 to the samples where it interacts with the sample producing a Raman shifted signal. Light is collected from the sample at a 180-degree geometry and is transmitted through thebeam splitter 26 andlaser blocking filter 28. The laser blocking filter further prevents undesired laser light from reaching thedetector 30. - The Raman shifted signal then impinges upon a beam expander 32 (for example a
simple beam expander FIGS. 18A and 18B , respectively) that increase the diameter of a collimated input beam to a larger collimated output beam. The particular configuration and shape of the beam expander optics may be changed, such as off axis parabolic reflection, to make the beam expander more efficient and easily packaged within the device. The optical signals of the output beam are converted to electrical signals by animager 30 with ultra-high resolution narrow range spatially gradedfilter 34 for processing.Filter 34 preferably includes a set ofmicro-graded filters 34A-34D as described in reference toFIG. 13 . - The
disposable end effector 14 schematically illustrated inFIG. 15 is an attachment that interacts with the patient either inserted into the nasal passage or in proximity to a wound or infection situs. For direct nasal or wound interrogation, alens 36 is integrated at tip of the end effector to allow laser light be focused onto the specimens and Raman scattered light to be collected. As shown inFIG. 16 , a modified end effector 14' is used when sample filtration is required. The end effector 14' will connect to avacuum source 38 allowing the sample to be drawn into the end effector body through aninternal filter 40. In one embodiment, the device may be fitted with a small vacuum pump which functions as thevacuum source 38 removes gas molecules (air) from a sealed volume, denoted by the dashed line inFIG. 14 , in order to leave behind a partial vacuum. The vacuum will draw the sample into the end effector 14'. Raman measurement takes place at anoptical window 42 fabricated out of an optically transparent material such as quartz. Theoptical window 42 is located concentrically within amesh 44 and aseal 46 formed on an end of the end effector 14' opposite thefilter 40. Filtering the sample will reduce the signal from background interference by trapping large debris allowing bacteria or virus to pass through for measurement. - The system is configured to deliver and collect light from the sample using an open beam path.
Lens tubes - The end effectors 14, 14' shown are disposable specula that detachably connects to the
head 48 of thedevice 10 with, for example a twist lock connection to allow for precise optical alignment and ease of end effector (tip) removal. The end effector connectors may be equipped with or without a focusing lens. For vacuum suction application, the connector will house alens 36 to allow laser light be focused onto the sample and Raman scattered light to be collected. For wound and direct nasal interrogation, the lens will be absent. The specula is designed as a single use component that is detached from thedevice head 48 and disposed in accordance with medical waste disposal procedures. - For this system, the incident beam and collected signal light share a common path such that a 45°
beam splitter 26 is used to reflect the laser light through the optics to the sample while efficiently transmitting the returning Raman-shifted signal light. A laser-blockingfilter 24 at normal incidence is used ahead of thedispersion element 26 to completely block the undesired laser light. The diameter of a collimated input beam is increased with abeam expander 32 to a larger collimated output beam. With reference toFIGS. 13 ,19A and 19B , a set of ultra-high resolutionmicro-filter quadrants 34A-34D are arranged in front of theimaging detector 30 and provide specific wavenumber or spectral band filtering by the discrete waveband analysis. Eachquadrant 34A-34D allows for discrete spectral band detection with each micro-filter providing specific wavenumber detection for spectral analysis. Thequadrants 34A-34D may be arranged symmetrically about the x and y axes as shown inFIG. 19A , or arranged in vertical bands as shown inFIG. 19B . Theimage sensor 30 converts the optical signals, into electrical signals. Theimaging sensor 30 can be an integrated CCD or CMOS or the like. - The unique micro optical filters provide a narrow range of spatially graded filter, which span the narrow spectral region covering a specific Raman Spectral peak or narrow region of closely neighboring peaks. Commercial graded filters do not have sufficient resolution to achieve 1 cm-1 spatial resolution. The spectral wavelength is transformed to an imaging array position/intensity reading that provides a reconstruction of the spectral peaks of interest. The method of fabrication is a graded Indium Aluminum Nitride (InAIN) alloy that can provide spectral filtering by band gap engineering at any region between 1eV and 6 eV band gap or 1240 nm to 206 nm. A hollow cathode based low energy plasma deposition is used to deposit the nitride alloy. Deposition is controlled by a sliding substrate window coordinated with a change in Indium deposition rate creating the graded optical coating.
- A narrow
line width laser 22 packaged in a module with integral drive electronics is used for Raman excitation. The wavelength and laser power is chosen based upon the application. The laser is able to be used as an open beam source or be coupled to an optical waveguide. - The spectrometer subsystem includes an electronic sub- system as well as an internal lithium-
ion battery pack 52 to provide power to the system and allow for field-portable use. Thesystem 10 is powered from either its internal battery pack or via an external charger/power adapter. Thedevice 10 may have a provision for monitoring battery life and charge status. Thedevice 10 may be designed with a USB controller (not shown) to allow for the downloading of data from the internal storage of the point of care (POC) device to external devices as well as a real time display (not shown). In the form of a compact LCD panel. The device may also be built to accommodate standard wireless/cellular communication if desired. The spectrometerelectronic subsystem 50 utilizes a dedicated micro-controller to read the spectrum measured with theimaging sensor 30, performs the basic processing of the image data, and transmits that information to a display, PC or other similar interface. As previously noted, thedevice 10 may be fitted with asmall vacuum 38 for pump to work in conjunction with the disposable end effector 14' with filter for vacuum suction application. - In another embodiment, an
device 110 is designed as a Raman probe with optic connection to aportable detection system 112 as shown inFIGS. 20 and24 . Thedevice 110 is designed to deliver laser light to the sample and collect Raman scatter. To accomplish this, thedevice 110 is configured with waveguides, lenses, and filters that function to transmit the Raman scatter from the sample to the detection system for spectral analysis in a manner similar to that described with respect todevice 10. - The
detection system 112 is a portable unit approximately 24cm X 10 cm x 3 cm in size (6"x4"x1"). Key components include alaser 114 optically coupled to thedevice 110 for Raman excitation, and aspectrograph subunit 114 optically coupled to thedevice 110 for the measurement of Raman radiation intensity as a function of wavelength. Aspectrograph subunit 116 indicated by the dashed box inFIG. 20 can be configured as, but is not limited to: a grating spectrometer, a prism spectrometer, or an interferometer. Thedetection system 112 will also incorporate amicro controller 118 for signal processing and identification algorithms for signal conditioning and target detection, as well as support a user friendly graphical display that acts as the human-machine interface. A color LCD display will have sufficient resolution to display use instructions, as well as test results in text output for go/no-go classification, and to graphically display a spectra. A simple menu structure with large pushbutton icons make operation of the device straight forward and user friendly. - As shown in
FIGS. 20 and24 thespectroscope subunit 116 is configured as a Czerny-Turner spectrometer. Radiation fromlaser 114 is directed through a flexible optical waveguide (fiber) 120 to thedevice 110 and is transmitted through alaser line filter 122 anddisposable end effector 124 to the samples. The light interacts with the sample producing a Raman shifted signal which is collected at 180-degree geometry. The collected light is transmitted thought alaser blocking filter 122 and coupled into a flexible optical waveguide (fiber) 126. Thelaser blocking filter 122 prevents undesired laser light from reaching the detector. The Raman shifted signal is directed through the optical waveguide (fibers) 126 to thespectroscope subunit 116 of thedetection system 112. Light entering thesubunit 116 is reflected off of thecollimating mirror 128 and is directed onto thediffraction grating 130 which separates incident polychromatic light into constituent wavelength components. The diffracted light is directed to a focusingmirror 132 onto adetector 134 which converts optical to electrical signals for processing. - As presently preferred, the
disposable end effector 124 is a disposable specula that interacts with the patient either inserted into the nasal passage or in proximity to a wound or infection sight. The end effector design is similar to that described inFIGS. 15-17 . - Further details of the optical train for the
device 110 are illustrated inFIGS. 21-23D . Light from thelaser 114 is coupled into theexcitation fibers 120e of the probe as shown inFIG. 19 . As best seen inFIG. 22A , theexcitation fibers 120e form part of thefiber bundle 120 which are concentrically arranged around thecollection fiber 120c. In a preferred embodiment, thecollection fiber 120c has a diameter approximately four times larger than the diameter of theexcitation fiber 120e. A high rejection filter (laser line filter) 122A at the output of these fibers is used to remove Raman bands arising from the silica core, thus allowing only the laser light to be transmitted to the sample. Hollow core Photonic crystal fibers are used as excitation fibers in order to reduce/eliminate the need for filtering. - Off axis
parabolic mirrors 136, located beneath theexcitation fibers 120 collimate and direct the beams to a 45degree cone lens 138.FIG. 22C illustrate an excitation beam transmitted from theexcitation fibers 120e and impinging on the face of thecone lens 138. As presently preferred, the height of thecone lens 138 is approximate twice the diameter of theexcitation fiber 120e as best seen inFIG. 22B . Thislens 138 has dielectric coated faces that allow the laser light to be reflected and the Raman scatter to be transmitted. In particular, the outside surface of thelens 138 is coated with a dielectric to reflect laser light and pass Stokes scattered light. The reflected laser light is directed toward the sample surface and focused with a convex lens. When the lens is absent, collimated light is output from the probe. Light scattered from a sample is collected 180 degrees relative to the direction of the laser beam. It is directed through thecone lens 138 which allows only the Raman scattered light to be coupled into thecollection fiber 126. - Two key elements of this design are the off axis
parabolic mirror 136 system and the 45degree cone lens 138. As best seen inFIG. 23B , the off axis parabolic mirror is an annular or doughnut shaped optic that has eight conic depressions ordimples 140 on its surface. Each of the eightdimples 140 forms a 90 degree parabolic mirror with its focal point at a designatedexcitation fiber 120e. As shown inFIGS. 21, 22B, 22C, 23C and 23D , thecone lens 138 is a hollow hexagonal optical element whose faces are at a 45 degree angle. Thelens 138 has a dielectric coating enabling it to act as a long pass filter (reflecting laser light and transmitting the Raman scatter). - Other features incorporation into the system includes: a
strain relief boot 142 which provide strain relief to fiber cables, and exhibit a high degree of flexibility. Afirst connector 144 secures the excitation fiber (waveguide) of thedevice 110 to thelaser 114. Asecond connector 146 secures the Raman collection fiber (waveguide) of thedevice 110 to thespectrograph subunit 116. A narrowline width laser 114 is packaged in a module with integral drive electronics for Raman excitation. The wavelength and laser power is selected based upon the application and target identification. The laser is coupled to an optical fiber or waveguide with use of a third connector. - The
second fiber connector 146 secures the input fiber 126 (or waveguide) to thespectrograph subunit 116. Light from the input fiber (or waveguide) enters the detection system through this connector. Behind the connector, a slit (not shown) having a dark piece of material containing a rectangular aperture may be utilized. Thecollimating mirror 128 focuses light entering the spectrometer portion of the detection system towards the grating 130.Diffraction grating 130 diffracts light from thecollimating mirror 128 and directs the diffracted light onto the focusingmirror 132. Thedispersive element 130 separates incident polychromatic light into constituent wavelength components and can be a grating or prism or a like. Focusingmirror 132 receives light reflected from the grating 130 and focuses the light onto theCCD Detector 134.CCD detector 134 collects the light received from the focusingmirror 132 and converts the optical signal to a digital signal. Each pixel on the CCD Detector corresponds to the wavelength of light that strikes it, creating a digital response signal. - As noted above, the
detection system 112 includes an internal lithium-ion battery pack (not shown) to provide power to the system and allow for field-portable use. The system can be run from either its internal battery pack or via an external charger/power adapter. Thedevice 112 will have a provision for monitoring battery life and charge status. Thedetection system 112 may include an electronic sub-system which includes a PC-basedprocessor 148,spectrometer 116, vacuum pump and valve controller (not shown), pressure sensors (not shown), and interlocks. PC-based processor is used to perform all of the computation and coupled to anLCD display 150 with a touch screen and/orperimeter function buttons 152 to handle menu selection. Thespectrometer subsystem 112 utilizes adedicated micro-controller 118 to read the CCD array, perform basic processing on the image data, then transmit that information to the PC using a USB or other similar interface. - With reference now to
FIG. 25 , aflow chart 210 illustrating the detection process is provided. In particular, a hand-held Raman spectroscopic device as described above is operated to transmit a coherent light beam from the excitation laser onto a sample. The imaging sensor detects radiation from the filtered Raman-shifted sample signal (block 212) and generates image data representative thereof (block 214). The image data is then analyzed (block 216) and the spectral features at discrete spectral bands are examined to detect the presence of a target pathogen (block 218). If no target pathogenic features are found, the device displays and/or reports a negative result for the presence of the target pathogen (block 220). - If target pathogenic features are found, these features are compared with baseline Raman spectra (block 222). Algorithms and classification coefficients are computed based on the baseline spectra (block 224). Typing of the target pathogenic features is done in a hierarchical approach and classification is assigned as the comparison moves down the hierarchy (block 226). If a positive database match is identified, the device displays and/or reports a positive result for the presence of the target pathogen (block 228). If a positive database match is not identified, the probability of the target pathogen's identity or membership within a particular group of interest may be computed and displayed or reported (block 230).
- A robust portable Raman spectroscopy based system as detailed above has many anticipated benefits. The nonintrusive, nondestructive technique for nasal examination and wound interrogation provides rapid and cost effective screening of a wide range of protein-based compounds including bacteria, virus, drugs, and tissue abnormalities. The method requires little or no sample preparation, reducing the need for storage of consumables. In addition, the ease of use and non-contact sampling make the device a valuable tool for point of care investigations.
- The device is a reagentless automated near real time point of care detection system that can enable healthcare providers to render better patient management and optimize clinical outcomes. Since the sensor can be developed to analyze bacteria, virus, drugs, and tissue, it can be promoted to a variety of market segments that include: primary care physicians, and drug stores.
- The foregoing description of the embodiments has been provided for purposes of illustration and description. It is not intended to be exhaustive or to limit the disclosure. Individual elements or features of a particular embodiment are generally not limited to that particular embodiment, but, where applicable, are interchangeable and can be used in a selected embodiment, even if not specifically shown or described. The same may also be varied in many ways. Such variations are not to be regarded as a departure from the disclosure, and all such modifications are intended to be included within the scope of the disclosure.
- Also disclosed herein are the following clauses:
- 1. A hand held Raman spectroscopic instrument for pathogen detection comprising:
- a housing having a handle portion, a head portion and an end effector;
- a Raman spectroscopic probe encased in the housing and including:
- a laser disposed in the handle portion and operable to emit a coherent light beam;
- a laser line filter operable to transmit the light beam along an optical path and suppress ambient light;
- a beam splitter disposed in the head portion and operable to reflect the light beam from the laser line filter through an aperture formed in the end effector toward onto a sample to produce a Raman-shifted sample signal;
- a collector to collect the sample signal and transmit the sample signal through the beam splitter;
- a beam expander to collimate the sample signal from the beam splitter and generate an expanded diameter sample signal;
- an ultra-high resolution, narrow range, spatially graded filter to filter the expanded diameter sample signal in at least one narrow spectral band based on a predetermined set of discrete spectral bands for a target pathogen; and
- an imager for converting the expanded diameter sample signal to image data representative of the Raman-shifted sample signal; and
- an electronics assembly including:
- a micro-controller encased within the housing for controlling the Raman spectroscopic probe, reading the image data from the imager, and analyzing the image data at the discrete spectral bands to detect the presence of the target pathogen, comparing the image data with a baseline Raman spectra and communicating a test result based on the analysis and comparison; and
- a power source operably coupled to the micro-controller and the Raman spectroscopic probe.
- 2. The detection instrument of
clause 1 wherein the filter filters the expanded diameter sample signal in at least one narrow spectral band selected from the group consisting of: 640-740 cm-1, 1200-1260 cm-1, 1520-1560 cm-1, and 1640-1740 cm-1. - 3. The detection instrument of
clause 1 wherein the filter filters the expanded diameter sample signal in a plurality of narrow spectral bands. - 4. The detection instrument of clause 3 wherein the filter filters the expanded diameter sample signal in a plurality of narrow spectral bands selected from the group consisting of: 640-740 cm-1, 1200-1260 cm-1, 1520-1560 cm-1, and 1640-1740 cm-1.
- 5. The detection instrument of clause 3 wherein the filter filters the expanded diameter sample signal in each of the spectral bands at 640-740 cm-1, 1200-1260 cm-1, 1520-1560 cm-1, and 1640-1740 cm-1.
- 6. The detection instrument of according to any of clauses 1-5 wherein the filter is divided into discrete regions, each of said regions providing filtering at one of the spectral bands.
- 7. The detection instrument according to any of clauses 1-6 wherein the Raman spectroscopic probe further comprises a 180-degree backscatter element interposed between the beam splitter and the end effector aperture, the backscatter element having:
- a centrally located collection fiber for transmitting the Raman-shifted sample signal to the beam splitter;
- a plurality of excitation fibers radially arranged with respect to the collection filter for transmitting the coherent light beam; and
- a mirror for reflecting the coherent light beam emitted from the plurality of excitation fiber
- 8. The detection instrument according to any of clauses 1-7 wherein the Raman spectroscopic probe further comprises laser blocking filter between beam splitter and the detector.
- 9. The detection instrument according to any of clauses 1-8 wherein the end effector further comprises a disposable specula having a base detachably secured to the head portion of the housing, the specula tapering from the base portion to a tip having an aperture formed therethrough.
- 10. The detection instrument of clause 9 wherein the disposable specula further comprises a lens arranged at the tip in the aperture to focus the light beam and collect the sample signal.
- 11. The detection instrument of clause 9 wherein the disposable specula further comprises a filter arranged at the tip in the aperture, an optical window located near the base and a vacuum source coupled to the end effector for drawing a sample through the filter and onto the optical window.
- 12. A method for detecting a target pathogen using Raman-based spectroscopic analysis comprising:
- transmitting a coherent light beam onto a sample to generate a Raman-shifted sample signal;
- filtering the Raman-shifted sample signal in at least one narrow spectral band based on a predetermined set of discrete spectral bands for a target pathogen to generate a filtered Raman-shifted sample signal;
- generating image data representative of the filtered Raman-shifted sample signal;
- analyzing the image data at the discrete spectral bands to detect the presence of the target pathogen;
- comparing the image data with a baseline Raman spectra;
- displaying a positive result when the comparison of the image data with the baseline Raman spectra indicates a match.
- 13. The method for detecting a target pathogen of
clause 12 wherein the Raman-shifted signal is filtered in at least one narrow spectral band selected from the group consisting of: 640-740 cm-1, 1200-1260 cm-1, 1520-1560 cm-1, and 1640-1740 cm-1. - 14. The method for detecting a target pathogen of
clause 12 wherein the Raman-shifted signal is filtered in multiple narrow spectral bands selected from the group consisting of: 640-740 cm-1, 1200-1260 cm-1, 1520-1560 cm-1, and 1640-1740 cm-1. - 15. The method for detecting a target pathogen of
clause 14 wherein the Raman-shifted signal is filtered in each of the spectral bands at 640-740 cm-1, 1200-1260 cm-1, 1520-1560 cm-1, and 1640-1740 cm-1. - 16. The method for detecting a target pathogen according to any of clauses 12-15 further comprising projecting the coherent light beam through a lens and onto the sample.
- 17. The method for detecting a target pathogen according to any of clauses 12-16 further comprising drawing the sample through a filter and depositing the filtered sample on an optical window, wherein the coherent light beam is transmitted through the optical window onto the sample.
- 18. The method for detecting a target pathogen using a hand held spectroscope comprising:
- transmitting a coherent light beam from a laser in an spectroscope housing along an optical path through an aperture formed in an end effector and onto a sample to generate a Raman-shifted sample signal;
- receiving the Raman-shifted sample signal through the aperture;
- filtering the Raman-shifted sample signal in at least one narrow spectral band based on a predetermined set of discrete spectral bands for a target pathogen to generate a filtered Raman-shifted sample signal;
- projecting the filtered Raman-shifted sample signal onto an imager in the spectroscope housing to generate image data representative of the filtered Raman-shifted sample signal;
- analyzing the image data at the discrete spectral bands to detect the presence of the target pathogen;
- comparing the image data with a baseline Raman spectra; and
- displaying a positive result when the comparison of the image data with the baseline Raman spectra indicates a match.
- 19. The method for detecting a target pathogen of
clause 18 wherein the Raman-shifted signal is filtered in at least one narrow spectral band selected from the group consisting of: 640-740 cm-1, 1200-1260 cm-1, 1520-1560 cm-1, and 1640-1740 cm-1. - 20. The method for detecting a target pathogen of
clause 18 wherein the Raman-shifted signal is filtered in multiple narrow spectral bands selected from the group consisting of: 640-740 cm-1, 1200-1260 cm-1, 1520-1560 cm-1, and 1640-1740 cm-1.
Claims (14)
- A Raman spectroscopic system comprising:an excitation light source to radiate coherent light onto a sample;a collector to collect a Raman signal from the sample;a beam collimator to collimate the collected Raman signal and generate a collimated Raman signal;an optical filter to filter the collimated Raman signal, whereinthe optical filter comprises a plurality of micro-filters arranged co-planarly and spatially adjacent to each other, andeach of the micro-filters is configured to transmit a different spectral band of the collimated Raman signal; andan imaging sensor array comprising a plurality of detection areas to separately detect each of a plurality of the different spectral bands transmitted from each of the micro-filters.
- The system of claim 1, wherein the excitation light source comprises a laser; and optionally wherein the beam collimator comprises a beam expander configured to increase the diameter of a collimated input beam.
- The system of any preceding claim, further comprising a beam splitter configured to direct the collimated Raman signal to the optical filter.
- The system of any preceding claim, wherein the plurality of micro-filters are arranged in front of the imaging sensor array, each one of the plurality of micro-filters transmitting a different one of the different spectral bands of the collimated Raman signal to a different detection area of the imaging sensor array.
- The system of any preceding claim, wherein the different spectral bands comprise at least one of 640-740 cm-1, 1040-1080 cm-1, 1200-1265 cm-1, 1320-1340-1, 1520-1560 cm-1, 1620-1750 cm-1, and 2850-2950 cm-1; and optionally
wherein the different spectral bands comprise at least two of 640-740 cm-1, 1200-1265 cm-1, 1520-1560 cm-1, and 1620-1750 cm-1. - The system of any preceding claim, wherein one or more of the micro-filters have a spectral resolution of 1 cm-1.
- The system of any preceding claim, wherein one or more of the micro-filters are micro-graded filters.
- The system of any preceding claim, wherein one or more of the micro-filters comprise a graded Indium Aluminum Nitride (InAIN) alloy coating.
- A method for distinguishing an active pathogen from an inactivated pathogen using Raman based spectroscopic analysis, the method comprising:radiating coherent light onto a sample;collecting a Raman signal from the sample;collimating the Raman signal;dispersing the collimated Raman signal;directing the dispersed Raman signal to an optical filter;analyzing the Raman signal for the presence of a pathogen; andanalyzing the Raman signal for a Raman peak spectral shift indicative of an activity or inactivity of the pathogen.
- The method of claim 9, further comprising analyzing the Raman signal for the Raman peak spectral shift that is in a spectral band selected from 640-740 cm-1, 1040-1080 cm-1, 1200-1265 cm-1, 1320-1340-1, 1520-1560 cm-1, 1620-1750 cm-1, and 2850-2950 cm-1.
- The method of claim 9 or 10, further comprising simultaneously filtering, by the optical filter, the dispersed Raman signal in a plurality of different spectral bands.
- The method of claim 11, wherein the different spectral bands comprise at least one of 640-740 cm-1, 1040-1080 cm-1, 1200-1265 cm-1, 1320-1340-1, 1520-1560 cm-1, 1620-1750 cm-1, and 2850-2950 cm-1; and optionally
wherein the different spectral bands comprise at least two of 640-740 cm-1, 1200-1265 cm-1, 1520-1560 cm-1, and 1620-1750 cm-1. - The method of claim 11 or 12, further comprising detecting the filtered Raman signal by an imaging sensor array, the imaging sensor array comprising a plurality of detection areas to separately detect each of a plurality of different spectral bands of the filtered Raman signal.
- The method of any one of claims 9 to 13, wherein the optical filter comprises a plurality of micro-filters arranged co-planarly and spatially adjacent to each other, each of the micro-filters is configured to transmit a different spectral band of the dispersed Raman signal, and the method further comprises:
transmitting a different spectral band to a different detection area of an imaging sensor array.
Applications Claiming Priority (3)
| Application Number | Priority Date | Filing Date | Title |
|---|---|---|---|
| US201361863095P | 2013-08-07 | 2013-08-07 | |
| EP14834893.1A EP3030870B1 (en) | 2013-08-07 | 2014-08-07 | Hand-held micro-raman based detection instrument and method of detection |
| PCT/US2014/050182 WO2015021300A1 (en) | 2013-08-07 | 2014-08-07 | Hand-held micro-raman based detection instrument and method of detection |
Related Parent Applications (1)
| Application Number | Title | Priority Date | Filing Date |
|---|---|---|---|
| EP14834893.1A Division EP3030870B1 (en) | 2013-08-07 | 2014-08-07 | Hand-held micro-raman based detection instrument and method of detection |
Publications (2)
| Publication Number | Publication Date |
|---|---|
| EP3922965A2 true EP3922965A2 (en) | 2021-12-15 |
| EP3922965A3 EP3922965A3 (en) | 2022-03-30 |
Family
ID=52461936
Family Applications (2)
| Application Number | Title | Priority Date | Filing Date |
|---|---|---|---|
| EP21167040.1A Withdrawn EP3922965A3 (en) | 2013-08-07 | 2014-08-07 | Hand-held micro-raman based detection instrument and method of detection |
| EP14834893.1A Active EP3030870B1 (en) | 2013-08-07 | 2014-08-07 | Hand-held micro-raman based detection instrument and method of detection |
Family Applications After (1)
| Application Number | Title | Priority Date | Filing Date |
|---|---|---|---|
| EP14834893.1A Active EP3030870B1 (en) | 2013-08-07 | 2014-08-07 | Hand-held micro-raman based detection instrument and method of detection |
Country Status (5)
| Country | Link |
|---|---|
| US (2) | US10253346B2 (en) |
| EP (2) | EP3922965A3 (en) |
| CN (1) | CN105723195B (en) |
| ES (1) | ES2877351T3 (en) |
| WO (1) | WO2015021300A1 (en) |
Cited By (1)
| Publication number | Priority date | Publication date | Assignee | Title |
|---|---|---|---|---|
| CN116007529A (en) * | 2022-12-15 | 2023-04-25 | 河北科技大学 | Handheld measuring equipment and measuring system |
Families Citing this family (43)
| Publication number | Priority date | Publication date | Assignee | Title |
|---|---|---|---|---|
| EP3209983A4 (en) | 2014-10-23 | 2018-06-27 | Verifood Ltd. | Accessories for handheld spectrometer |
| WO2016125165A2 (en) | 2015-02-05 | 2016-08-11 | Verifood, Ltd. | Spectrometry system with visible aiming beam |
| EP3978618A1 (en) | 2015-05-08 | 2022-04-06 | Spectral Platforms, Inc. | Albumin-based non-covalent complexes and methods of use thereof |
| US10874333B2 (en) | 2015-09-15 | 2020-12-29 | Massachusetts Institute Of Technology | Systems and methods for diagnosis of middle ear conditions and detection of analytes in the tympanic membrane |
| CN108471945A (en) * | 2015-11-13 | 2018-08-31 | 耶斯生物技术公司 | In relation to the device and system and method broken up in situ between the infection of viral and non-viral |
| CN105996995B (en) * | 2016-05-03 | 2018-09-07 | 华南师范大学 | A kind of tympanitis diagnostic system and instrument based on spectral technique |
| US10838190B2 (en) * | 2016-06-21 | 2020-11-17 | Sri International | Hyperspectral imaging methods and apparatuses |
| EP3488204A4 (en) * | 2016-07-20 | 2020-07-22 | Verifood Ltd. | Accessories for handheld spectrometer |
| DE102016113748A1 (en) * | 2016-07-26 | 2018-02-01 | Leibniz-Institut für Photonische Technologien e. V. | Combined optical-spectroscopic method for the determination of microbial pathogens |
| WO2018033894A1 (en) * | 2016-08-19 | 2018-02-22 | Monash University | Spectroscopic systems and methods for the identification and quantification of pathogens |
| US10705022B2 (en) * | 2016-08-24 | 2020-07-07 | Goodrich Corporation | Robust spectroscopy systems |
| JPWO2018116363A1 (en) * | 2016-12-19 | 2019-10-24 | オリンパス株式会社 | Raman probe and Raman spectrum measuring device |
| EP3602065A4 (en) * | 2017-03-20 | 2020-12-23 | Spectral Platforms, Inc. | SPECTROSCOPIC METHODS OF DETECTION AND CHARACTERIZATION OF MICROORGANISMS |
| FI3602007T3 (en) | 2017-03-22 | 2024-01-16 | Adiuvo Diagnostics Pvt Ltd | Device and method for detection and classification of pathogens |
| CN108732155B (en) * | 2017-04-25 | 2022-11-18 | 武汉菲谱光电技术有限公司 | Raman probe |
| KR102498122B1 (en) * | 2017-11-21 | 2023-02-09 | 삼성전자주식회사 | Spectroscopy device, spectroscopy method and biological signal measuring apparatus |
| WO2019190122A1 (en) * | 2018-03-30 | 2019-10-03 | 삼성전자 주식회사 | Electronic device for acquiring state information on object, and control method therefor |
| KR102592510B1 (en) | 2018-07-31 | 2023-10-20 | 삼성전자주식회사 | Raman probe and spectroscopic analysis apparatus using the Raman probe for in vivo biological components |
| CN109363768A (en) * | 2018-10-10 | 2019-02-22 | 南京诺源医疗器械有限公司 | 785nm wavelength light source near-infrared fluorescence angiography surgery guidance system |
| US11060912B2 (en) * | 2018-12-06 | 2021-07-13 | University Of Maryland, College Park | Multi-stage parallel spectroscopy systems and methods |
| GB2580186B (en) | 2018-12-24 | 2021-09-15 | Cell Therapy Catapult Ltd | Monitoring viral titre using Raman Spectroscopy |
| US11698304B2 (en) | 2019-02-15 | 2023-07-11 | Wayne State University | Apparatuses, systems, and methods for detecting materials based on Raman spectroscopy |
| US10760969B1 (en) | 2019-02-28 | 2020-09-01 | Biospex, Inc. | Fluorescence and systemic noise reduction in time-gated spectroscopy |
| WO2020183437A1 (en) * | 2019-03-13 | 2020-09-17 | Monash University | Systems and methods for spectral detection of drug-resistant pathogens |
| US11326944B2 (en) * | 2019-07-12 | 2022-05-10 | Biospex, Inc. | Wearable spectrometer with filtered sensor |
| US11454540B2 (en) * | 2019-07-12 | 2022-09-27 | Biospex, Inc. | Wearable spectroscopy using filtered sensor |
| WO2021081263A1 (en) | 2019-10-25 | 2021-04-29 | Amgen Inc. | Configurable handheld biological analyzers for identification of biological products based on raman spectroscopy |
| CN110632058B (en) * | 2019-11-04 | 2022-05-03 | 宁波源禄光电有限公司 | Small light splitting device for Raman spectrum analysis |
| US11105790B2 (en) * | 2019-11-26 | 2021-08-31 | Zomedica Corp. | Compositions and methods for diagnosing parasitic infections |
| KR102908182B1 (en) * | 2019-12-13 | 2026-01-05 | 삼성전자주식회사 | Compact raman sensor, and apparatus for estimating bio-component using the same |
| EP3936434B1 (en) * | 2020-07-06 | 2023-11-22 | B/E Aerospace, Inc. | Aircraft galley pathogen test kit |
| US11304605B2 (en) * | 2020-07-20 | 2022-04-19 | 123IV, Inc. | Self-administered, non-invasive, transcutaneous viral detector |
| US20220074917A1 (en) * | 2020-09-08 | 2022-03-10 | Brewmetrix LLC | Spectroscopic method and apparatus for detection of viruses and other biological pathogens |
| MA50886B1 (en) | 2020-09-11 | 2022-07-29 | Moroccan Foundation For Advanced Science Innovation & Res Mascir | Device for predictive detection of the presence of a virus of the sars-cov species such as the sars-cov-2 virus in a biological sample taken from a patient |
| CN112666098A (en) * | 2020-11-06 | 2021-04-16 | 上海市第八人民医院 | Pathogenic pathogen detection system for intestinal infectious disease in summer |
| EP4275035A1 (en) * | 2021-01-05 | 2023-11-15 | Wayne State University | Raman-based systems and methods for material identification |
| TWI808395B (en) * | 2021-03-16 | 2023-07-11 | 美商艾諾斯生技股份有限公司 | Gas detection system for gynecological disease detection and detection method using the same |
| US11490852B1 (en) * | 2021-08-09 | 2022-11-08 | hemal b kurani | Wearable device for detecting microorganisms, sterilizing pathogens, and environmental monitoring |
| US12555691B2 (en) * | 2022-02-22 | 2026-02-17 | Hyperspectral Corp. | Systems and methods for detecting pathogens using spectrometer scans |
| CN115632303B (en) * | 2022-10-12 | 2025-10-24 | 深圳技术大学 | Device and method for improving gas Raman laser power stability |
| CN116879266A (en) * | 2023-07-20 | 2023-10-13 | 天津大学 | A method for detecting Escherichia coli based on silicon-based dual-polarization Fourier transform spectrometer |
| TWI885674B (en) * | 2023-12-29 | 2025-06-01 | 國立臺灣科技大學 | Multiple wavelength reflective raman probe and raman spectra detection device |
| DE102024129205A1 (en) * | 2024-10-09 | 2026-04-09 | Netzsch - Gerätebau Gesellschaft mit beschränkter Haftung | Mobile Raman spectrometer system and method for medical diagnostics of human, animal or plant samples |
Family Cites Families (48)
| Publication number | Priority date | Publication date | Assignee | Title |
|---|---|---|---|---|
| WO1995011624A2 (en) * | 1993-10-29 | 1995-05-04 | Feld Michael S | A raman endoscope |
| US5842995A (en) * | 1996-06-28 | 1998-12-01 | Board Of Regents, The Univerisity Of Texas System | Spectroscopic probe for in vivo measurement of raman signals |
| WO1998037417A1 (en) | 1997-02-20 | 1998-08-27 | The Regents Of The University Of California | Plasmon resonant particles, methods and apparatus |
| US6008889A (en) * | 1997-04-16 | 1999-12-28 | Zeng; Haishan | Spectrometer system for diagnosis of skin disease |
| US6064897A (en) * | 1998-06-01 | 2000-05-16 | Abbott Laboratories | Sensor utilizing Raman spectroscopy for non-invasive monitoring of analytes in biological fluid and method of use |
| US6574501B2 (en) * | 1998-07-13 | 2003-06-03 | Childrens Hospital Los Angeles | Assessing blood brain barrier dynamics or identifying or measuring selected substances or toxins in a subject by analyzing Raman spectrum signals of selected regions in the eye |
| US7419467B2 (en) | 1998-11-25 | 2008-09-02 | M3 Electronics, Inc. | Medical inspection device |
| EP1054250B1 (en) * | 1999-01-25 | 2002-09-04 | Hamamatsu Photonics K.K. | Pipette adaptor, pipette for absorbance measurement, method and apparatus for absorbance measurement |
| US6587711B1 (en) * | 1999-07-22 | 2003-07-01 | The Research Foundation Of Cuny | Spectral polarizing tomographic dermatoscope |
| US6778269B2 (en) * | 2001-09-04 | 2004-08-17 | Board Of Regents, The University Of Texas System | Detecting isotopes and determining isotope ratios using raman spectroscopy |
| US20040200975A1 (en) * | 2003-04-14 | 2004-10-14 | Brown Dale Marius | Ultraviolet sensors for monitoring energy in the germicidal wavelengths |
| US7292333B2 (en) * | 2003-06-24 | 2007-11-06 | Corning Incorporated | Optical interrogation system and method for 2-D sensor arrays |
| US7548310B2 (en) | 2003-07-18 | 2009-06-16 | Chemimage Corporation | Method and apparatus for compact spectrometer for multipoint sampling of an object |
| US7103402B2 (en) | 2003-10-02 | 2006-09-05 | Ut-Battelle, Llc | Advanced synchronous luminescence imaging for chemical and medical diagnostics |
| CN101166957A (en) * | 2004-04-30 | 2008-04-23 | 阿胡拉公司 | Method and apparatus for performing Raman spectroscopy |
| JP2007535680A (en) | 2004-04-30 | 2007-12-06 | アフラ・コーポレーション | Method and apparatus for performing Raman spectroscopy |
| US7403281B2 (en) * | 2004-05-07 | 2008-07-22 | University Of Wyoming | Raman spectrometer |
| ATE514060T1 (en) | 2004-05-27 | 2011-07-15 | Yeda Res & Dev | COHERENTLY CONTROLLED NONLINEAR RAMAN SPECTROSCOPY |
| JP2008512128A (en) * | 2004-09-09 | 2008-04-24 | マイクロフルイディク システムズ インコーポレイテッド | Extraction apparatus and sample preparation method |
| US8346346B1 (en) * | 2005-01-24 | 2013-01-01 | The Board Of Trustees Of The Leland Stanford Junior University | Optical analysis system and approach therefor |
| US20060176478A1 (en) * | 2005-02-09 | 2006-08-10 | Raman Systems, Inc. | Raman spectroscopy with stabilized multi-mode lasers |
| US20090088615A1 (en) * | 2007-10-01 | 2009-04-02 | Mark Ries Robinson | Indwelling Fiber Optic Probe for Blood Glucose Measurements |
| WO2006113537A2 (en) | 2005-04-14 | 2006-10-26 | Chemimage Corporation | Method and applications to enhance and image optical signals from biological objects |
| EP1903930A2 (en) * | 2005-07-05 | 2008-04-02 | The Board of Regents of The University of Texas System | Depth-resolved spectroscopy method and apparatus |
| US7355714B2 (en) * | 2005-12-29 | 2008-04-08 | Xerox Corporation | Reconfigurable MEMS fabry-perot tunable matrix filter systems and methods |
| US20120145906A1 (en) * | 2006-03-03 | 2012-06-14 | Chemlmage Corporation | Portable system for detecting explosives and a method of use thereof |
| US20070279627A1 (en) * | 2006-06-02 | 2007-12-06 | Tack Leslie M | Raman instrumentation |
| US7656523B2 (en) * | 2006-06-30 | 2010-02-02 | Intel Corporation | Multiplexed raman detection with filter set |
| KR100812078B1 (en) * | 2006-09-26 | 2008-03-07 | 동부일렉트로닉스 주식회사 | Image sensor and its manufacturing method |
| US8690864B2 (en) * | 2007-03-09 | 2014-04-08 | Covidien Lp | System and method for controlling tissue treatment |
| WO2009000078A1 (en) * | 2007-06-25 | 2008-12-31 | Led Medical Diagnostics, Inc. | Methods, systems and apparatus relating to colposcopic-type viewing extension devices |
| EP2323724A1 (en) * | 2008-09-18 | 2011-05-25 | Acclarent, Inc. | Methods and apparatus for treating disorders of the ear nose and throat |
| US8953159B2 (en) | 2008-10-03 | 2015-02-10 | The Board Of Trustees Of The University Of Illinois | Surface enhanced raman spectroscopy nanodome biosensors and methods of manufacturing the same |
| EP2387713A2 (en) * | 2009-01-16 | 2011-11-23 | The Brigham and Women's Hospital, Inc. | System and method for characterization of oral, systemic and mucosal tissue utilizing raman spectroscopy |
| US8876373B2 (en) | 2009-04-09 | 2014-11-04 | Welch Allyn, Inc. | IR thermometry probe cover |
| US8561486B2 (en) | 2009-07-13 | 2013-10-22 | Enertechnix, Inc | Particle interrogation devices and methods |
| US20110204258A1 (en) * | 2009-12-11 | 2011-08-25 | Heller Daniel A | Spectral imaging of photoluminescent materials |
| US8867033B2 (en) * | 2010-06-15 | 2014-10-21 | MKS Technology | Spectrometer |
| US9662047B2 (en) * | 2010-08-05 | 2017-05-30 | Massachusetts Institute Of Technology | Portable raman diagnostic system |
| US8766177B2 (en) | 2010-10-11 | 2014-07-01 | University Of North Texas | Nanomanipulation coupled nanospray mass spectrometry (NMS) |
| US9250131B2 (en) * | 2011-01-17 | 2016-02-02 | Ricoh Co., Ltd. | Multi-imaging system with interleaved images |
| CA2843752A1 (en) | 2011-08-22 | 2013-02-28 | Spectral Platforms, Inc. | Rapid detection of metabolic activity |
| WO2013063038A1 (en) * | 2011-10-24 | 2013-05-02 | Rosestreet Labs, Llc | Nitride uv light sensors on silicon substrates |
| CN104040309B (en) * | 2011-11-03 | 2019-06-07 | 威利食品有限公司 | Inexpensive spectrometric system for end user's food analysis |
| JP5697584B2 (en) * | 2011-11-25 | 2015-04-08 | キヤノン株式会社 | Stimulated Raman scattering measurement apparatus and stimulated Raman scattering measurement method |
| US9572529B2 (en) * | 2012-10-31 | 2017-02-21 | Covidien Lp | Surgical devices and methods utilizing optical coherence tomography (OCT) to monitor and control tissue sealing |
| US8873041B1 (en) * | 2013-01-29 | 2014-10-28 | Bayspec, Inc. | Raman spectroscopy using multiple excitation wavelengths |
| CN103196888B (en) * | 2013-04-02 | 2015-11-18 | 香港应用科技研究院有限公司 | Raman signal detection and analysis system and method thereof |
-
2014
- 2014-08-07 CN CN201480044989.4A patent/CN105723195B/en active Active
- 2014-08-07 WO PCT/US2014/050182 patent/WO2015021300A1/en not_active Ceased
- 2014-08-07 EP EP21167040.1A patent/EP3922965A3/en not_active Withdrawn
- 2014-08-07 ES ES14834893T patent/ES2877351T3/en active Active
- 2014-08-07 EP EP14834893.1A patent/EP3030870B1/en active Active
- 2014-08-07 US US14/910,459 patent/US10253346B2/en active Active
-
2019
- 2019-02-25 US US16/284,050 patent/US11236379B2/en not_active Expired - Fee Related
Cited By (1)
| Publication number | Priority date | Publication date | Assignee | Title |
|---|---|---|---|---|
| CN116007529A (en) * | 2022-12-15 | 2023-04-25 | 河北科技大学 | Handheld measuring equipment and measuring system |
Also Published As
| Publication number | Publication date |
|---|---|
| CN105723195A (en) | 2016-06-29 |
| EP3030870A4 (en) | 2018-01-10 |
| WO2015021300A1 (en) | 2015-02-12 |
| US11236379B2 (en) | 2022-02-01 |
| US20160177366A1 (en) | 2016-06-23 |
| EP3922965A3 (en) | 2022-03-30 |
| EP3030870A1 (en) | 2016-06-15 |
| CN105723195B (en) | 2019-09-03 |
| EP3030870B1 (en) | 2021-04-07 |
| ES2877351T3 (en) | 2021-11-16 |
| US10253346B2 (en) | 2019-04-09 |
| US20190203255A1 (en) | 2019-07-04 |
Similar Documents
| Publication | Publication Date | Title |
|---|---|---|
| US11236379B2 (en) | Raman based detection instrument and method of detection | |
| US6765668B2 (en) | Method for detection of pathogenic microorganisms | |
| US7057721B2 (en) | Wide field method for detecting pathogenic microorganisms | |
| US7532320B2 (en) | Multimodal method for identifying hazardous agents | |
| JP2021063788A (en) | System and method for serum based cancer detection | |
| AU2003234222A1 (en) | Bio-spectral imaging system and methods for diagnosing cell disease state | |
| Singh et al. | Culture-independent Raman spectroscopic identification of bacterial pathogens from clinical samples using deep transfer learning | |
| KR20170081568A (en) | nondestructive collection of evidence | |
| CN107941782A (en) | Can endoscopic fiber Raman microprobe and detection device | |
| US20240060899A1 (en) | Raman-based systems and methods for material identification | |
| US20120252058A1 (en) | System and Method for the Assessment of Biological Particles in Exhaled Air | |
| RU2406078C2 (en) | Method for detection and identification of biological microobjects and their nanocomponents and related device for implementation thereof | |
| Banerjee et al. | Deciphering the finger prints of brain cancer glioblastoma multiforme from four different patients by using near infrared Raman spectroscopy | |
| WO2010076801A1 (en) | Means and methods for rapid droplet, aerosols and swab infection analysis | |
| US9856505B2 (en) | Identification of mycoplasm contamination using Raman spectroscopy | |
| CN111060476A (en) | Near-infrared spectrum system for detecting bacterial infection of wound surface or LB culture solution and detection method thereof | |
| Chen et al. | Detection of nasopharyngeal cancer cells using the laser tweezer Raman spectroscopy technology | |
| Fitzmaurice et al. | Raman spectroscopy: development of clinical applications for breast cancer diagnosis | |
| WO2009075768A2 (en) | Optical device and method for real-time chemosensitivity testing | |
| Ullah et al. | Raman Spectroscopy and Machine Learning-based Optical Sensor for Rapid Tuberculosis Diagnosis via Sputum | |
| Mayerhöfer et al. | Moving raman spectroscopy into the clinic | |
| Wang et al. | Raman Spectroscopy: Development of Clinical Applications for Breast Cancer Diagnosis | |
| Silge et al. | Raman Spectroscopy for Point-of-Care Blood Testing | |
| Artiouchenko et al. | Innovative fiber systems for laser medicine and technology |
Legal Events
| Date | Code | Title | Description |
|---|---|---|---|
| PUAI | Public reference made under article 153(3) epc to a published international application that has entered the european phase |
Free format text: ORIGINAL CODE: 0009012 |
|
| STAA | Information on the status of an ep patent application or granted ep patent |
Free format text: STATUS: THE APPLICATION HAS BEEN PUBLISHED |
|
| AC | Divisional application: reference to earlier application |
Ref document number: 3030870 Country of ref document: EP Kind code of ref document: P |
|
| AK | Designated contracting states |
Kind code of ref document: A2 Designated state(s): AL AT BE BG CH CY CZ DE DK EE ES FI FR GB GR HR HU IE IS IT LI LT LU LV MC MK MT NL NO PL PT RO RS SE SI SK SM TR |
|
| PUAL | Search report despatched |
Free format text: ORIGINAL CODE: 0009013 |
|
| AK | Designated contracting states |
Kind code of ref document: A3 Designated state(s): AL AT BE BG CH CY CZ DE DK EE ES FI FR GB GR HR HU IE IS IT LI LT LU LV MC MK MT NL NO PL PT RO RS SE SI SK SM TR |
|
| RIC1 | Information provided on ipc code assigned before grant |
Ipc: G01J 3/12 20060101ALI20220222BHEP Ipc: G01J 3/28 20060101ALI20220222BHEP Ipc: G01J 3/18 20060101ALI20220222BHEP Ipc: A61B 5/00 20060101ALI20220222BHEP Ipc: A61B 1/227 20060101ALI20220222BHEP Ipc: G01N 21/65 20060101ALI20220222BHEP Ipc: C12Q 1/14 20060101ALI20220222BHEP Ipc: C12Q 1/04 20060101ALI20220222BHEP Ipc: G01J 3/02 20060101ALI20220222BHEP Ipc: G01J 3/44 20060101AFI20220222BHEP |
|
| STAA | Information on the status of an ep patent application or granted ep patent |
Free format text: STATUS: REQUEST FOR EXAMINATION WAS MADE |
|
| 17P | Request for examination filed |
Effective date: 20220930 |
|
| RBV | Designated contracting states (corrected) |
Designated state(s): AL AT BE BG CH CY CZ DE DK EE ES FI FR GB GR HR HU IE IS IT LI LT LU LV MC MK MT NL NO PL PT RO RS SE SI SK SM TR |
|
| STAA | Information on the status of an ep patent application or granted ep patent |
Free format text: STATUS: EXAMINATION IS IN PROGRESS |
|
| 17Q | First examination report despatched |
Effective date: 20240702 |
|
| STAA | Information on the status of an ep patent application or granted ep patent |
Free format text: STATUS: THE APPLICATION HAS BEEN WITHDRAWN |
|
| STAA | Information on the status of an ep patent application or granted ep patent |
Free format text: STATUS: EXAMINATION IS IN PROGRESS |
|
| 18W | Application withdrawn |
Effective date: 20240905 |
|
| D18W | Application withdrawn (deleted) | ||
| STAA | Information on the status of an ep patent application or granted ep patent |
Free format text: STATUS: THE APPLICATION IS DEEMED TO BE WITHDRAWN |
|
| 18D | Application deemed to be withdrawn |
Effective date: 20241105 |