EP3851894B1 - System and method for digital microscopy imaging - Google Patents
System and method for digital microscopy imaging Download PDFInfo
- Publication number
- EP3851894B1 EP3851894B1 EP20152589.6A EP20152589A EP3851894B1 EP 3851894 B1 EP3851894 B1 EP 3851894B1 EP 20152589 A EP20152589 A EP 20152589A EP 3851894 B1 EP3851894 B1 EP 3851894B1
- Authority
- EP
- European Patent Office
- Prior art keywords
- focus value
- threshold
- images
- image
- captured image
- Prior art date
- Legal status (The legal status is an assumption and is not a legal conclusion. Google has not performed a legal analysis and makes no representation as to the accuracy of the status listed.)
- Active
Links
Images


Classifications
-
- G—PHYSICS
- G02—OPTICS
- G02B—OPTICAL ELEMENTS, SYSTEMS OR APPARATUS
- G02B21/00—Microscopes
- G02B21/36—Microscopes arranged for photographic purposes or projection purposes or digital imaging or video purposes including associated control and data processing arrangements
- G02B21/365—Control or image processing arrangements for digital or video microscopes
- G02B21/367—Control or image processing arrangements for digital or video microscopes providing an output produced by processing a plurality of individual source images, e.g. image tiling, montage, composite images, depth sectioning, image comparison
-
- G—PHYSICS
- G02—OPTICS
- G02B—OPTICAL ELEMENTS, SYSTEMS OR APPARATUS
- G02B7/00—Mountings, adjusting means, or light-tight connections, for optical elements
- G02B7/28—Systems for automatic generation of focusing signals
- G02B7/36—Systems for automatic generation of focusing signals using image sharpness techniques, e.g. image processing techniques for generating autofocus signals
- G02B7/38—Systems for automatic generation of focusing signals using image sharpness techniques, e.g. image processing techniques for generating autofocus signals measured at different points on the optical axis, e.g. focussing on two or more planes and comparing image data
-
- G—PHYSICS
- G02—OPTICS
- G02B—OPTICAL ELEMENTS, SYSTEMS OR APPARATUS
- G02B21/00—Microscopes
- G02B21/24—Base structure
- G02B21/241—Devices for focusing
- G02B21/244—Devices for focusing using image analysis techniques
Definitions
- the invention relates to a system and method for digital microscopy imaging.
- Microscopes have a shallow depth of field, especially when examining objects with high magnification. Thus, for thicker objects, this means that the entire object cannot be in focus at the same time. As a result, the focus has to be adjusted in order to look at one focused part, a so-called focus layer, at a time.
- the microscope captures images at multiple focus layers throughout the object. These images, each captured at different foci, make up a z-stack in the camera.
- the z-stack data can then be communicated to external units such as a computer for analysis.
- the amount of data that needs to be sent to the external unit thus relates to the number of focus layers. Since not all images contain useful or interesting information, this results in vast amounts of unnecessary data being sent to the external unit, which requires high bandwidth and more expensive components. There is thus a need for improvements within this context.
- US 2019 129160 A1 discloses a microscopy system wherein image processing is carried out in a processor of the camera.
- a first aspect of the invention is defined in claim 1.
- An advantage of this method is that the focus values are determined directly in the camera before the images are sent to a separate computing unit. By doing this, it can be ensured that only relevant images e.g. with good enough quality, i.e. focus value, are sent to the computing unit. Thus, less bandwidth between the camera and the computing unit is required, which allows for a sped up over all analysis process for the sample, as well as a cheaper hardware due to reduced bandwidth requirements.
- the step of comparing the focus value of the captured image with at least one threshold focus value comprises comparing the focus value with a first threshold focus value.
- a low complexity process of determining whether the captured image is relevant or not is achieved.
- the method further comprises the step of calculating a focus value curve for the plurality of images, and determining a focal distance corresponding to a peak focus value of the focus value curve, wherein the step of comparing the focus value of the captured image with at least one threshold focus value comprises: for an image captured at a focal distance less than the focal distance corresponding to the peak focus value, comparing the focus value with a first threshold focus value, and for an image captured at a focal distance larger than the focal distance corresponding to the peak focus value, comparing the focus value with a second threshold focus value, the second threshold focus value being different from the first threshold focus value.
- An advantage of calculating a focus value curve is that the focus value is a relative measure and cannot be determined by evaluating one isolated image.
- the focus value curve can then be analyzed in order to select only those images having good enough quality, i.e. focus value.
- the focus value of captured images and/or thresholds can be assessed in relation to this peak value.
- the number of images being marked as interesting can be lowered while still ensuring that all images with interesting information are marked. This can be achieved in thicker or non-uniform samples by having a first threshold that is lower or higher than a second threshold.
- the first and second threshold can be set based on what type of sample is being analyzed, which thereby increases the flexibility of the inventive concept described herein.
- the first threshold may be set as a defined percentage of the peak focus value
- the second threshold may be set as defined percentage of the first threshold or the peak focus value.
- the steps of comparing the focus value of the captured image with at least one threshold focus value and marking the captured image as an interesting image is performed in the camera.
- the method further comprises the step of transmitting, from the camera, each determined focus value to the separate computing unit, wherein the steps of comparing the focus value of the captured image with at least one threshold focus value and marking the captured image as an interesting image is performed at the separate computing unit.
- the method also further comprises the step of receiving, at the camera, an indication from the separate computing unit of the marked images.
- the step of capturing images is performed for each relevant focal distance in the sample, before the marking of images as interesting images is performed.
- the step of determining a focus value is performed after every captured image at each focal distance, before the next image is captured at the next focal distance, such that after a focus value has been determined to exceed the first threshold value, the step of capturing images is interrupted if the determined focus value for a captured image does not exceed the first and/or second threshold value.
- An advantage of interrupting the step of capturing images if an image is determined to be of too low quality (i.e. not in focus) is that the analysis process can be sped up.
- the first and/or second threshold focus value is calculated as a threshold percentage of the highest determined focus value for the captured images.
- An advantage of determining a threshold focus value as a percentage of the highest determined focus value is that it provides for a straightforward way of filtering those images exceeding/not exceeding the percentage threshold.
- Another advantage of determining a threshold focus value as a percentage of the highest determined focus value is that the threshold is determined based on properties of the biological sample, and thus is individually adapted to each sample.
- the threshold percentage for the first threshold is 50%.
- the step of capturing images is performed for a plurality of x-y-positions in the sample.
- the first threshold and/or second threshold is based on focus value curves previously determined for other x-y-positions of the same sample.
- An advantage of basing thresholds on previously determined focus value curves of the same sample is that a new threshold or thresholds does not have to be determined for every x-y-position within the sample. This saves processing power.
- Another advantage is that by calculating the first threshold and/or second threshold based on multiple focus curves (e.g. taking the average), the accuracy of the threshold(s) become higher.
- Another advantage of basing a threshold on previous focus value curves is that the threshold can be set to an advantageous percentage of the peak value.
- the focus value for each image is calculated by convolution with a filter in the x-direction and/or y-direction.
- the camera comprises a programmable logic device, and the step of determining the focal value for the captured images is performed in the programmable logic device.
- the sample is a peripheral blood sample, cytology sample or a histopathology sample.
- a second part of the first aspect is a system for digital microscopy imaging as defined in claim 13.
- the processing unit is a programmable logic device.
- the camera comprises a camera sensor for capturing a plurality of images of a plurality of x-y-positions in the sample.
- the second part of the first aspect may generally have the same features and advantages as the first part of the first aspect. It is further noted that the invention relates to all possible combinations of features unless explicitly stated otherwise.
- each relevant focal distance in the sample' is to be understood as being dependent on the depth of field and content of the slide.
- the number of relevant focal distances is not a fixed number, but rather varies with the depth of field and content of the slide.
- the z-direction with respect to e.g. a z-stack, is to be understood as a direction in the vertical plane and representing a depth.
- the z-direction is perpendicular to both the x- and y-directions, which are perpendicular directions in the horizontal plane.
- Figure 1 discloses a schematic view of a method for digital microscopy imaging according to the invention.
- the method comprises capturing S1 with a camera 2 (further described herein with reference to figure 5 ) a plurality of images of a position in a biological sample.
- the camera 2 comprises a processing unit 4, which is a programmable logic device.
- the biological sample could be a peripheral blood sample, cytology sample, histopathology sample, cervical sample, bone marrow, fecal sample, or any type of body fluid sample.
- Each of the images is captured at a different focal distance z (further described herein with reference to figures 4a-c ).
- the camera 2 may capture a plurality of images at a plurality of x-y-positions in the sample.
- a focus value f (further described herein with reference to figures 4a-c ) is determined S2 for each captured image.
- the focus value f describes how focused an image is.
- the focus value can for example be calculated by convoluting the image with a filter in the x- or y-direction. Any other suitable algorithm for determining a focus value of an image may be used, such as performing a contrast measurement on the image data of the image.
- the focus value f is then compared S3 with at least one threshold focus value t (further describe herein with reference to figure 4 ). It is plausible that the images are compared S3 to a first threshold focus value t1, and/or a second threshold focus value t2 (further described herein with reference to figure 4a and 4c ). If the focus value f of the captured image is determined to exceed the at least one threshold focus value t, the image is marked S4 as interesting. Finally, the images marked as interesting are transmitted S5 from the camera 2 to a separate computing unit 6. Only images marked as interesting are transmitted, which enables for lower requirements on the hardware buses, and speeds up the analysis process, making the system cheaper.
- Figure 2 discloses a schematic view of a method for digital microscopy imaging according to another embodiment of the invention.
- images are captured S11 by a camera 2, and a focus value f for each image is determined S12.
- a focus value curve c (further described herein with reference to figures 4a-c ) is calculated S13 for the plurality of images.
- the focus value of captured images and/or thresholds can be assessed in relation to various properties of the curve c.
- the images and/or thresholds can be assessed in relation to a peak focus value p (further described herein with reference to figures 4a-c ).
- a focal distance z corresponding to the peak focus value p can be determined S14.
- the focus value f is compared S15 with a first threshold focus value t1.
- the focus value f is compared S15 with a second threshold value t2 that is different from the first threshold focus value f1.
- the term "different" is to be understood as higher or lower.
- the first threshold focus value t1 is in some cases lower than the second threshold focus value t2. It is to be noted however, that depending on the direction in which the focus is studied in a sample, the thickness of the sample, or the type of sample, it might be preferable that t2 is lower than t1. It is also plausible that the first and second threshold values are equal. In some cases, the sample is similar in content for every x-y-position.
- the step of comparing images S3, S15 can be performed in the camera 2. As can be seen in figure 3 , it is however also plausible, that each determined S120 focus value f is transmitted S130 to the separate computing unit 6 from the camera 2. The step of comparing S140 the focus value f of the images to the at least one threshold focus value t and marking S150 them as interesting is then performed in the computing unit 6. An indication is then received S160 at the camera 2 from the computing unit 6 of the marked images. Only the marked images are then transmitted S170 back to the computing unit 6.
- the step of capturing images S1, S11, S110 is performed for each focal distance z in the sample before the marking S4, S16, S150 of images as interesting is performed. It is however equally plausible that the focus value f is determined S2, S12, S120 after each image captured S1, S11, S110 at a focal distance z, such that if a focus value f is determined S2, S12, S120 to exceed the first threshold focus value t1, the capturing S1, S11, S110 is interrupted if the determined focus value for a captured image does not exceed the second threshold value t2.
- the first threshold focus value t1 and/or the second threshold focus value t2 can be calculated as a threshold percentage of the highest determined focus value f for the captured images.
- the threshold percentage for the first and/or second threshold is for example 50%. It is equally plausible that the percentage is higher such as 55%, 60%, 70%, etc., or lower such as 45%, 40%, 30%, etc.
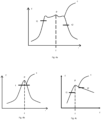
- Figures 4a-c show three different examples of focus curves c for a sample. It is to be noted that the number of thresholds, and their placement, in these figures are for explanatory purposes only, and that any type of sample focus curve could have any number of thresholds placed at curve points not illustrated in the figures.
- Figure 4a shows an example of a focus curve c.
- the focus curve c represented in fig. 4a could for example be a histopathology sample. These types of samples are often thicker with uneven structures, hence the three peaks seen in the figure.
- the x-axis defines the focal distance z at which the image is captured.
- the y-axis represents the focus value f.
- the peak focus value p is the highest focus value, and has a corresponding focal distance z.
- the first threshold t1 and second threshold t2 can be seen in figure 4a .
- the second threshold t2 is lower than the first threshold t1.
- the focus value f can be compared S15 with the first threshold focus value t1.
- the focus value f can be compared S15 with the second threshold value t2.
- the first threshold t1 is higher than the second threshold t2, however, it is also plausible that it is the other way around as is further described with reference to figure 4c .
- Figure 4b shows another example of a focus curve c.
- the focus curve c in figure 4b has a Gaussian shape, which commonly occurs in thinner samples, such as blood. Unlike the example in figure 4a , this curve c only has one threshold t. Having multiple thresholds can be advantageous in thicker samples with uneven structures and/or asymmetrical shapes. A second threshold could then be of use to detect irregular behavior such as peaks.
- a single threshold can be set. If basing the single threshold on previous curves at previous positions in the sample, the estimated threshold can be more statistically accurate, and thus be higher and still ensure that all interesting information (i.e. images with focus values exceeding the threshold) has been added to the z-stack.
- Figure 4c shows yet another example of a focus curve c.
- the first threshold t1 is lower than the second threshold t2.
- the thresholds are based on previous focus curves in the same sample. Samples usually look the same for different x-y-positions.
- the selection of images marked as interesting can be interrupted at t2 despite images to the right in fig. 4c having a relatively high focus value f. Knowing where the peak value p is, ensures that no important image information gets lost, despite t2 being higher than t1.
- the realization that the step of marking images as interesting can be interrupted at a second threshold t2 can be utilized irrespective of what the curve c looks like.
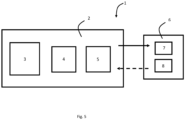
- FIG. 5 discloses a schematic view of a digital microscopy imaging system 1.
- the imaging system 1 comprises a camera 2.
- the camera 2 has a camera sensor 3 which captures images.
- the camera 2 can capture images of a biological sample at different focal distances z.
- the camera 2 may capture a plurality of images of a plurality of x-y-positions in the sample.
- the biological sample could be a peripheral blood sample, cytology sample, histopathology sample, cervical sample, bone marrow, fecal sample, or any type of body fluid sample.
- the camera 2 further comprises a processing unit 4 which is a programmable logic device.
- the processing unit determines a focus value f.
- the focus value f is a relative measurement, and by obtaining a focus curve c one can determine which image is most focused.
- the focus value f can be determined for each image captured by the camera 2.
- the focus value f for each captured image can be compared with a threshold focus value t. Should the focus value f of the image be determined to exceed the threshold focus value t, the image is marked as interesting.
- the camera 2 further comprises a transmitting unit 5 which in some embodiments transmits the focus value f from the camera 2 to a computing unit 6.
- the transmitting unit 5 transmits the images marked as interesting to the computing unit 6.
- the straight line between the camera 2 and the computing unit 6 represents the communication of the focus values f and/or the images marked as interesting, while the dotted line between the computing unit 6 and the camera 2 represents the communication of the indication of which images are interesting.
- the computing unit 6, is a separate unit from the camera 2, and may comprise a receiving unit 7.
- the receiving unit 7 receives the focus value f and/or the images marked as interesting from the camera 2.
- the computing unit 6 further comprises a processing unit 8, in which the received images from the camera 2 can be assembled.
- the received images might be assembled into a so-called z-stack.
- a z-stack consists of multiple images captured at different focus distances z.
- the user of the digital microscopy system can study the z-stack as if it was a traditional microscope by viewing the different focus depths. It is also plausible that the received images are assembled into one composite image, in which the best focused areas of each image captured at each focal distance z is combined to an "all focused" image.
- the processing unit 8 might be a programmable logic device.
Landscapes
- Physics & Mathematics (AREA)
- Engineering & Computer Science (AREA)
- Computer Vision & Pattern Recognition (AREA)
- General Physics & Mathematics (AREA)
- Optics & Photonics (AREA)
- Chemical & Material Sciences (AREA)
- Analytical Chemistry (AREA)
- Multimedia (AREA)
- Microscoopes, Condenser (AREA)
Description
- The invention relates to a system and method for digital microscopy imaging.
- Microscopes have a shallow depth of field, especially when examining objects with high magnification. Thus, for thicker objects, this means that the entire object cannot be in focus at the same time. As a result, the focus has to be adjusted in order to look at one focused part, a so-called focus layer, at a time. In digital microscopy it is sometimes preferable to look at a plurality of focus layers of an object, and in order to do this, the microscope captures images at multiple focus layers throughout the object. These images, each captured at different foci, make up a z-stack in the camera. The z-stack data can then be communicated to external units such as a computer for analysis. The amount of data that needs to be sent to the external unit thus relates to the number of focus layers. Since not all images contain useful or interesting information, this results in vast amounts of unnecessary data being sent to the external unit, which requires high bandwidth and more expensive components. There is thus a need for improvements within this context.
-
US 2019 129160 A1 discloses a microscopy system wherein image processing is carried out in a processor of the camera. - In view of the above, it is thus an object of the present invention to overcome or at least mitigate the problems discussed above. In particular, it is an object of the invention to provide an improved and more efficient way of examining samples with a digital microscope and selecting what image data to send to an external computing unit.
- A first aspect of the invention is defined in
claim 1. - An advantage of this method is that the focus values are determined directly in the camera before the images are sent to a separate computing unit. By doing this, it can be ensured that only relevant images e.g. with good enough quality, i.e. focus value, are sent to the computing unit. Thus, less bandwidth between the camera and the computing unit is required, which allows for a sped up over all analysis process for the sample, as well as a cheaper hardware due to reduced bandwidth requirements.
- According to the first aspect, the step of comparing the focus value of the captured image with at least one threshold focus value comprises comparing the focus value with a first threshold focus value. Advantageously, a low complexity process of determining whether the captured image is relevant or not is achieved.
- According to some embodiments of the first part of the first aspect, the method further comprises the step of calculating a focus value curve for the plurality of images, and determining a focal distance corresponding to a peak focus value of the focus value curve, wherein the step of comparing the focus value of the captured image with at least one threshold focus value comprises: for an image captured at a focal distance less than the focal distance corresponding to the peak focus value, comparing the focus value with a first threshold focus value, and for an image captured at a focal distance larger than the focal distance corresponding to the peak focus value, comparing the focus value with a second threshold focus value, the second threshold focus value being different from the first threshold focus value.
- An advantage of calculating a focus value curve is that the focus value is a relative measure and cannot be determined by evaluating one isolated image. The focus value curve can then be analyzed in order to select only those images having good enough quality, i.e. focus value. By for example determining a peak focus value of the focus value curve, the focus value of captured images and/or thresholds can be assessed in relation to this peak value. By having a first and second threshold being different from each other and assessing these in relation to e.g. the peak value of the focus value curve, the number of images being marked as interesting can be lowered while still ensuring that all images with interesting information are marked. This can be achieved in thicker or non-uniform samples by having a first threshold that is lower or higher than a second threshold. The first and second threshold can be set based on what type of sample is being analyzed, which thereby increases the flexibility of the inventive concept described herein. For example, the first threshold may be set as a defined percentage of the peak focus value, and the second threshold may be set as defined percentage of the first threshold or the peak focus value.
- According to the first part of the first aspect, the steps of comparing the focus value of the captured image with at least one threshold focus value and marking the captured image as an interesting image, is performed in the camera. An advantage of performing the comparing step in the camera is that less data needs to be transferred to an external unit such as a computer. Moreover, the efficiency is increased since the determination of a captured image as being interesting image or not is performed in the camera, thus removing one step of information exchange with an external unit. Thus, less bandwidth is required, and the method gets more efficient.
- According to some embodiments of the first part of the first aspect, the method further comprises the step of transmitting, from the camera, each determined focus value to the separate computing unit, wherein the steps of comparing the focus value of the captured image with at least one threshold focus value and marking the captured image as an interesting image is performed at the separate computing unit. The method also further comprises the step of receiving, at the camera, an indication from the separate computing unit of the marked images. An advantage of performing the comparing step in the computer instead of in the camera is that the camera requires less processing power. Moreover, the separate computing unit may use more advanced statistical data and calculations for determining the threshold focus value, without necessarily increasing the requirements of the processing power of the camera.
- According to some embodiments of the first part of the first aspect, the step of capturing images is performed for each relevant focal distance in the sample, before the marking of images as interesting images is performed. An advantage of capturing images for each focal distance in the sample is that a more detailed focus value curve can be determined. Thus, the step of marking images as interesting will be more accurate.
- According to some embodiments of the first part of the first aspect, the step of determining a focus value is performed after every captured image at each focal distance, before the next image is captured at the next focal distance, such that after a focus value has been determined to exceed the first threshold value, the step of capturing images is interrupted if the determined focus value for a captured image does not exceed the first and/or second threshold value.
- An advantage of interrupting the step of capturing images if an image is determined to be of too low quality (i.e. not in focus) is that the analysis process can be sped up.
- According to some embodiments of the first part of the first aspect, the first and/or second threshold focus value is calculated as a threshold percentage of the highest determined focus value for the captured images.
- An advantage of determining a threshold focus value as a percentage of the highest determined focus value is that it provides for a straightforward way of filtering those images exceeding/not exceeding the percentage threshold. Another advantage of determining a threshold focus value as a percentage of the highest determined focus value is that the threshold is determined based on properties of the biological sample, and thus is individually adapted to each sample.
- According to some embodiments of the first part of the first aspect, the threshold percentage for the first threshold is 50%.
- According to some embodiments of the first part of the first aspect, the step of capturing images is performed for a plurality of x-y-positions in the sample. An advantage of capturing images for a plurality of x-y-positions is that information from the entire sample is gathered. Thus, the effect of saving bandwidth by only sending interesting images to the external unit becomes even greater, since sending all image information from every z-stack at every x-y-position in a sample would be less efficient and require more time, imply higher requirements on the bus hardware and be more expensive.
- According to some embodiments of the first part of the first aspect, the first threshold and/or second threshold is based on focus value curves previously determined for other x-y-positions of the same sample. An advantage of basing thresholds on previously determined focus value curves of the same sample is that a new threshold or thresholds does not have to be determined for every x-y-position within the sample. This saves processing power. Another advantage is that by calculating the first threshold and/or second threshold based on multiple focus curves (e.g. taking the average), the accuracy of the threshold(s) become higher. Another advantage of basing a threshold on previous focus value curves is that the threshold can be set to an advantageous percentage of the peak value.
- According to some embodiments of the first part of the first aspect, the focus value for each image is calculated by convolution with a filter in the x-direction and/or y-direction. An advantage of using convolution to filter the images is that it accentuates details of an image that are relevant for determining the focus value.
- According to the first aspect, the camera comprises a programmable logic device, and the step of determining the focal value for the captured images is performed in the programmable logic device. An advantage of using a programmable logic device is that they are small, fast, cheap and requires low power.
- According to some embodiments of the first part of the first aspect, the sample is a peripheral blood sample, cytology sample or a histopathology sample.
- A second part of the first aspect is a system for digital microscopy imaging as defined in claim 13.
- According to some embodiments of the second part of the first aspect, the processing unit is a programmable logic device.
- According to some embodiments of the second part of the first aspect, the camera comprises a camera sensor for capturing a plurality of images of a plurality of x-y-positions in the sample. An advantage of capturing images for a plurality of x-y-positions is that information from the entire sample is gathered. Thus, the effect of saving bandwidth by only sending interesting images to the external unit becomes even greater, since sending all image information from every z-stack at every x-y-position in a sample would be less efficient and require more time, imply higher requirements on the bus hardware and be more expensive.
- Preferred embodiments appear in the dependent claims and in the description.
- The second part of the first aspect may generally have the same features and advantages as the first part of the first aspect. It is further noted that the invention relates to all possible combinations of features unless explicitly stated otherwise.
- The invention will by way of example be described in more detail with reference to the appended drawings, which show presently preferred embodiments of the invention. This invention may, however, be embodied in many different forms and should not be construed as limited to the embodiments set forth herein; rather, these embodiments are provided for thoroughness and completeness, and fully convey the scope of the invention to the skilled person. Additionally, variations to the disclosed embodiments can be understood and effected by the skilled person in practicing the claimed invention, from a study of the drawings, the disclosure, and the appended claims. It will be appreciated that the drawings are for illustration only and are not in any way restricting the scope of the invention.
-
Figure 1 discloses a schematic view of a method for digital microscopy imaging according to some embodiments of the invention. -
Figure 2 discloses a schematic view of a method for digital microscopy imaging according to some embodiments of the invention. -
Figure 3 discloses a schematic view of a method for digital microscopy imaging according to some embodiments of the inventionFigure 4a discloses a first example of a focus curve. -
Figure 4b discloses a second example of a focus curve. -
Figure 4c discloses a third example of a focus curve. -
Figure 5 discloses a schematic view of a digital microscopy imaging system according to the invention. - It is contemplated that there are numerous modifications of the embodiments described herein, which are still within the scope of the invention as defined by the appended claims. The concept of the present invention is to provide an improved method and system for digital microscopy imaging.
- The term relevant, with respect to 'each relevant focal distance in the sample', is to be understood as being dependent on the depth of field and content of the slide. Thus, the number of relevant focal distances is not a fixed number, but rather varies with the depth of field and content of the slide.
- The z-direction, with respect to e.g. a z-stack, is to be understood as a direction in the vertical plane and representing a depth. The z-direction is perpendicular to both the x- and y-directions, which are perpendicular directions in the horizontal plane.
-
Figure 1 discloses a schematic view of a method for digital microscopy imaging according to the invention. As can be seen, the method comprises capturing S1 with a camera 2 (further described herein with reference tofigure 5 ) a plurality of images of a position in a biological sample. Thecamera 2 comprises aprocessing unit 4, which is a programmable logic device. The biological sample could be a peripheral blood sample, cytology sample, histopathology sample, cervical sample, bone marrow, fecal sample, or any type of body fluid sample. Each of the images is captured at a different focal distance z (further described herein with reference tofigures 4a-c ). Thecamera 2 may capture a plurality of images at a plurality of x-y-positions in the sample. After capturing S1 the images, a focus value f (further described herein with reference tofigures 4a-c ) is determined S2 for each captured image. The focus value f describes how focused an image is. The focus value can for example be calculated by convoluting the image with a filter in the x- or y-direction. Any other suitable algorithm for determining a focus value of an image may be used, such as performing a contrast measurement on the image data of the image. - For every captured image, the focus value f is then compared S3 with at least one threshold focus value t (further describe herein with reference to
figure 4 ). It is plausible that the images are compared S3 to a first threshold focus value t1, and/or a second threshold focus value t2 (further described herein with reference tofigure 4a and 4c ). If the focus value f of the captured image is determined to exceed the at least one threshold focus value t, the image is marked S4 as interesting. Finally, the images marked as interesting are transmitted S5 from thecamera 2 to aseparate computing unit 6. Only images marked as interesting are transmitted, which enables for lower requirements on the hardware buses, and speeds up the analysis process, making the system cheaper. -
Figure 2 discloses a schematic view of a method for digital microscopy imaging according to another embodiment of the invention. According to this embodiment, images are captured S11 by acamera 2, and a focus value f for each image is determined S12. Then, a focus value curve c (further described herein with reference tofigures 4a-c ) is calculated S13 for the plurality of images. By analyzing the focus value curve c, the focus value of captured images and/or thresholds can be assessed in relation to various properties of the curve c. For example, the images and/or thresholds can be assessed in relation to a peak focus value p (further described herein with reference tofigures 4a-c ). Another example is to apply a low pass filter to the curve c, thereby eliminating noise, and assessing the images and/or thresholds in relation to the resulting filtered curve. Other filters may also be used. In the following sections, examples will be described relating to the peak focus value p, it is however, as just described, possible to evaluate the curve c with respect to other aspects. A focal distance z corresponding to the peak focus value p can be determined S14. For images captured at focal distances z less than the focal distance z determined S14 to correspond to the peak value p, the focus value f is compared S15 with a first threshold focus value t1. For images captured at a focal distance z larger than the focal distance z corresponding to the peak focus value p, the focus value f is compared S15 with a second threshold value t2 that is different from the first threshold focus value f1. The term "different" is to be understood as higher or lower. The first threshold focus value t1 is in some cases lower than the second threshold focus value t2. It is to be noted however, that depending on the direction in which the focus is studied in a sample, the thickness of the sample, or the type of sample, it might be preferable that t2 is lower than t1. It is also plausible that the first and second threshold values are equal. In some cases, the sample is similar in content for every x-y-position. It can therefore be advantageous to base the first t1 and second t2 threshold focus values on focus value curves c previously determined for other x-y-positions of the same sample. The step of comparing images S3, S15 can be performed in thecamera 2. As can be seen infigure 3 , it is however also plausible, that each determined S120 focus value f is transmitted S130 to theseparate computing unit 6 from thecamera 2. The step of comparing S140 the focus value f of the images to the at least one threshold focus value t and marking S150 them as interesting is then performed in thecomputing unit 6. An indication is then received S160 at thecamera 2 from thecomputing unit 6 of the marked images. Only the marked images are then transmitted S170 back to thecomputing unit 6. - For all of the embodiments described herein, it is plausible that the step of capturing images S1, S11, S110 is performed for each focal distance z in the sample before the marking S4, S16, S150 of images as interesting is performed. It is however equally plausible that the focus value f is determined S2, S12, S120 after each image captured S1, S11, S110 at a focal distance z, such that if a focus value f is determined S2, S12, S120 to exceed the first threshold focus value t1, the capturing S1, S11, S110 is interrupted if the determined focus value for a captured image does not exceed the second threshold value t2. The first threshold focus value t1 and/or the second threshold focus value t2, can be calculated as a threshold percentage of the highest determined focus value f for the captured images. The threshold percentage for the first and/or second threshold is for example 50%. It is equally plausible that the percentage is higher such as 55%, 60%, 70%, etc., or lower such as 45%, 40%, 30%, etc.
-
Figures 4a-c show three different examples of focus curves c for a sample. It is to be noted that the number of thresholds, and their placement, in these figures are for explanatory purposes only, and that any type of sample focus curve could have any number of thresholds placed at curve points not illustrated in the figures. -
Figure 4a shows an example of a focus curve c. The focus curve c represented infig. 4a could for example be a histopathology sample. These types of samples are often thicker with uneven structures, hence the three peaks seen in the figure. By studying the focus curve c, one can determine which image(s) has a high enough focus value f with respect to a set threshold t1, t2. The x-axis defines the focal distance z at which the image is captured. The y-axis represents the focus value f. The peak focus value p is the highest focus value, and has a corresponding focal distance z. The first threshold t1 and second threshold t2 can be seen infigure 4a . In this case, the second threshold t2 is lower than the first threshold t1. For images captured at focal distances z less than the focal distance z determined S14 to correspond to the peak value p, the focus value f can be compared S15 with the first threshold focus value t1. For images captured at a focal distance z larger than the focal distance z corresponding to the peak focus value p, the focus value f can be compared S15 with the second threshold value t2. As can be seen infigure 4a , the first threshold t1 is higher than the second threshold t2, however, it is also plausible that it is the other way around as is further described with reference tofigure 4c . -
Figure 4b shows another example of a focus curve c. The focus curve c infigure 4b has a Gaussian shape, which commonly occurs in thinner samples, such as blood. Unlike the example infigure 4a , this curve c only has one threshold t. Having multiple thresholds can be advantageous in thicker samples with uneven structures and/or asymmetrical shapes. A second threshold could then be of use to detect irregular behavior such as peaks. In samples where the focus curve c is symmetrical and where different x-y positions have similar properties, a single threshold can be set. If basing the single threshold on previous curves at previous positions in the sample, the estimated threshold can be more statistically accurate, and thus be higher and still ensure that all interesting information (i.e. images with focus values exceeding the threshold) has been added to the z-stack. -
Figure 4c shows yet another example of a focus curve c. As can be seen, the first threshold t1 is lower than the second threshold t2. This is especially useful in embodiments where the thresholds are based on previous focus curves in the same sample. Samples usually look the same for different x-y-positions. Thus, by utilizing previous focus curves in the sample, i.e. knowing roughly where the peak value p should be and which focal distance z has the best image information/focus, the selection of images marked as interesting can be interrupted at t2 despite images to the right infig. 4c having a relatively high focus value f. Knowing where the peak value p is, ensures that no important image information gets lost, despite t2 being higher than t1. The realization that the step of marking images as interesting can be interrupted at a second threshold t2 can be utilized irrespective of what the curve c looks like. -
Figure 5 discloses a schematic view of a digitalmicroscopy imaging system 1. Theimaging system 1 comprises acamera 2. Thecamera 2 has acamera sensor 3 which captures images. Thecamera 2 can capture images of a biological sample at different focal distances z. Thecamera 2 may capture a plurality of images of a plurality of x-y-positions in the sample. The biological sample could be a peripheral blood sample, cytology sample, histopathology sample, cervical sample, bone marrow, fecal sample, or any type of body fluid sample. Thecamera 2 further comprises aprocessing unit 4 which is a programmable logic device. - The processing unit determines a focus value f. The focus value f is a relative measurement, and by obtaining a focus curve c one can determine which image is most focused. The focus value f can be determined for each image captured by the
camera 2. In theprocessing unit 4, the focus value f for each captured image can be compared with a threshold focus value t. Should the focus value f of the image be determined to exceed the threshold focus value t, the image is marked as interesting. Thecamera 2 further comprises a transmittingunit 5 which in some embodiments transmits the focus value f from thecamera 2 to acomputing unit 6. The transmittingunit 5 transmits the images marked as interesting to thecomputing unit 6. Infigure 5 , the straight line between thecamera 2 and thecomputing unit 6 represents the communication of the focus values f and/or the images marked as interesting, while the dotted line between thecomputing unit 6 and thecamera 2 represents the communication of the indication of which images are interesting. Thecomputing unit 6, is a separate unit from thecamera 2, and may comprise a receivingunit 7. The receivingunit 7 receives the focus value f and/or the images marked as interesting from thecamera 2. Thecomputing unit 6 further comprises aprocessing unit 8, in which the received images from thecamera 2 can be assembled. The received images might be assembled into a so-called z-stack. A z-stack consists of multiple images captured at different focus distances z. The user of the digital microscopy system can study the z-stack as if it was a traditional microscope by viewing the different focus depths. It is also plausible that the received images are assembled into one composite image, in which the best focused areas of each image captured at each focal distance z is combined to an "all focused" image. Theprocessing unit 8 might be a programmable logic device.
Claims (13)
- A method for digital microscopy imaging, the method comprising:capturing (S1, S11, S110) with a camera (2) comprising a programmable logic device, a plurality of images of a position in a biological sample, wherein each image is captured at a different focal distance (z),determining (S2, S12, S120) in the programmable logic device in the camera (2), a focus value (f) for each captured image,for each captured image, comparing (S3, S15, S140) the focus value (f) of the captured image with at least one threshold focus value (t, t1, t2), wherein the at least one threshold focus value (t, t1, t2) is calculated as a threshold percentage of a highest determined focus value for the captured images, wherein the threshold percentage is lower than 100 %;upon determining (S2, S12, S120) that the focus value (f) of the captured image exceeds the at least one threshold focus value (t, t1, t2), marking (S4, S16, S150) the captured image as an interesting image, andtransmitting (S5, S17, S130) the images marked (S4, S16, S150) as interesting from the camera to a separate computing unit (6).
- Method according to claim 1, wherein the step of comparing (S3, S15, S140) the focus value (f) of the captured image with at least one threshold focus value (t) comprises comparing the focus value (f) with a first threshold focus value (t1).
- Method according to claim 1, further comprising the step of:calculating (S13) a focus value curve (c) for the plurality of images,determining a focal distance (z) corresponding to a peak focus value (p) of the focus value curve (c),wherein the step of comparing (S15) the focus value of the captured image with at least one threshold focus value comprises:for an image captured at a focal distance (z) less than the focal distance corresponding to the peak focus value (p), comparing (S15) the focus value (f) with a first threshold focus value (t1)for an image captured at a focal distance (z) larger than the focal distance corresponding to the peak focus value (p), comparing the focus value (f) with a second threshold focus value (t2), the second threshold focus value (t2) being different from the first threshold focus value (t1).
- Method according to any one of claim 1-3, wherein the steps of comparing (S3, S15, S140) the focus value of the captured image with at least one threshold focus value and marking the captured image as an interesting image, is performed in the camera (2).
- Method according to any one of claim 1-3, further comprising the step of:transmitting (S5, S17, S130), from the camera (2), each determined focus value (f) to the separate computing unit (6),wherein the steps of comparing (S3, S15, S140) the focus value of the captured image with at least one threshold focus value (t, t1, t2) and marking (S4, S16, S150) the captured image as an interesting image is performed at the separate computing unit (6),wherein the method further comprises the step of:
receiving (S160), at the camera (2), an indication from the separate computing unit (6) of the marked images. - Method according to any of the preceding claims, wherein the step of capturing (S1, S11, S110) images is performed for each relevant focal distance (z) in the sample, before the marking (S4, S16, S150) of images as interesting images is performed.
- Method according to any one of claims 3-6, wherein the step of determining (S2, S12, S120) a focus value (f) is performed after every captured image at each focal distance (z), before the next image is captured at the next focal distance (z), such that after a focus value (f) has been determined (S2, S12, S120) to exceed the first threshold value (t1), the step of capturing (S1, S11, S110) images is interrupted if the determined focus value for a captured image does not exceed the first and/or second threshold value (t1, t2).
- Method according to any preceding claim, wherein the threshold percentage for the first threshold (t1) is 50%.
- Method according to any of the previous claims, wherein the step of capturing (S1, S11, S110) images is performed for a plurality of x-y-positions in the sample.
- Method according to claim 3, wherein the first threshold (t1) and/or second threshold (t2) is based on focus value curves (c) previously determined for other x-y-positions of the same sample.
- Method according to any of the preceding claims, wherein the focus value for each image is calculated by convolution with a filter in the x-direction and/or y-direction.
- Method according to any of the preceding claims, wherein the sample is a peripheral blood sample, cytology sample or a histopathology sample.
- A system (1) for digital microscopy imaging, comprising:a camera (2), comprising:a camera sensor (3) for capturing a plurality of images of a position in a biological sample, wherein each image is captured at a different focal distance (z),programmable logic device for determining a focus value (f) for each captured image and for calculating at least one threshold focus value (t, t1, t2) as a threshold percentage of a highest determined focus value for the captured images, wherein the threshold percentage is lower than 100 %, and for each captured image, comparing the focus value (f) of the captured image with the at least one threshold focus value (t, t1, t2), and upon determining that the focus value (f) of the captured image exceeds the at least one threshold focus value (t, t1, t2), marking the captured image as an interesting image,a transmitting unit (5) for transmitting the focus values (f) and/or the images marked as interesting from the camera (2), anda separate computing unit (6), comprising:a receiving unit (7) for receiving the focus values (f) and/or the images marked as interesting from the camera (2), anda processing unit (8) to assemble the received images.
Priority Applications (2)
| Application Number | Priority Date | Filing Date | Title |
|---|---|---|---|
| EP20152589.6A EP3851894B1 (en) | 2020-01-20 | 2020-01-20 | System and method for digital microscopy imaging |
| US17/152,604 US20210223533A1 (en) | 2020-01-20 | 2021-01-19 | System and method for digital microscopy imaging |
Applications Claiming Priority (1)
| Application Number | Priority Date | Filing Date | Title |
|---|---|---|---|
| EP20152589.6A EP3851894B1 (en) | 2020-01-20 | 2020-01-20 | System and method for digital microscopy imaging |
Publications (3)
| Publication Number | Publication Date |
|---|---|
| EP3851894A1 EP3851894A1 (en) | 2021-07-21 |
| EP3851894B1 true EP3851894B1 (en) | 2024-06-12 |
| EP3851894C0 EP3851894C0 (en) | 2024-06-12 |
Family
ID=69185356
Family Applications (1)
| Application Number | Title | Priority Date | Filing Date |
|---|---|---|---|
| EP20152589.6A Active EP3851894B1 (en) | 2020-01-20 | 2020-01-20 | System and method for digital microscopy imaging |
Country Status (2)
| Country | Link |
|---|---|
| US (1) | US20210223533A1 (en) |
| EP (1) | EP3851894B1 (en) |
Family Cites Families (8)
| Publication number | Priority date | Publication date | Assignee | Title |
|---|---|---|---|---|
| US7518652B2 (en) * | 2000-05-03 | 2009-04-14 | Aperio Technologies, Inc. | Method and apparatus for pre-focus in a linear array based slide scanner |
| EP1486067B1 (en) * | 2002-02-13 | 2015-04-15 | Reify Corporation | Method and apparatus for acquisition, compression, and characterization of spatiotemporal signals |
| US7417213B2 (en) * | 2005-06-22 | 2008-08-26 | Tripath Imaging, Inc. | Apparatus and method for rapid microscopic image focusing having a movable objective |
| JP2011209450A (en) * | 2010-03-29 | 2011-10-20 | Nikon Corp | Digital camera and image sorting program |
| WO2014208224A1 (en) * | 2013-06-24 | 2014-12-31 | オリンパスメディカルシステムズ株式会社 | Autofocus device |
| CN107111124B (en) * | 2014-10-29 | 2020-04-21 | 分子装置有限公司 | Apparatus and method for generating in-focus images using parallel imaging in a microscope system |
| EP3351992B1 (en) * | 2017-01-24 | 2019-10-23 | Horiba France SAS | Micro-spectrometry measurement method and system |
| JP2019101359A (en) * | 2017-12-07 | 2019-06-24 | オリンパス株式会社 | Observation device and focus detection method |
-
2020
- 2020-01-20 EP EP20152589.6A patent/EP3851894B1/en active Active
-
2021
- 2021-01-19 US US17/152,604 patent/US20210223533A1/en not_active Abandoned
Also Published As
| Publication number | Publication date |
|---|---|
| US20210223533A1 (en) | 2021-07-22 |
| EP3851894A1 (en) | 2021-07-21 |
| EP3851894C0 (en) | 2024-06-12 |
Similar Documents
| Publication | Publication Date | Title |
|---|---|---|
| US11803964B2 (en) | Method and system for imaging a cell sample | |
| CN108682008B (en) | A kind of Leukocyte Image clarity evaluation method and device | |
| JP5198476B2 (en) | Method for determining focus position and vision inspection system | |
| AU2009251162B2 (en) | Method for classifying slides using scatter plot distributions | |
| CN110738658B (en) | Image quality evaluation method | |
| AU2004250116B2 (en) | System for determining the stain quality of slides using scatter plot distributions | |
| EP1411469A2 (en) | Quantifying the sharpness of a digital image | |
| US20080199066A1 (en) | Sample image obtaining method, sample image obtaining apparatus and sample image filing system | |
| EP3851894A1 (en) | System and method for digital microscopy imaging | |
| Priya et al. | Retrospective non-uniform illumination correction techniques in images of tuberculosis | |
| EP1947441B1 (en) | Apparatus for determining positions of objects contained in a sample | |
| US10482314B2 (en) | Automatic calculation for ploidy classification | |
| WO2020069738A1 (en) | Automatic calculation for ploidy classification | |
| CN100588941C (en) | A system for classifying slides using a scatterplot distribution | |
| CN117152447B (en) | Intelligent management method and system for punching die | |
| CN119672279B (en) | A method, system, equipment, and medium for detecting burrs on lithium battery slitting electrode sheets. | |
| Friedrich et al. | Removing defocused objects from single focal plane scans of cytological slides | |
| CN118941635A (en) | A fiber core point cloud positioning method based on probability distribution and related equipment | |
| CN113628203A (en) | Image quality detection method and detection system | |
| CN116843973A (en) | Medical hyperspectral image classification method based on removing bad bands | |
| Earnhardt et al. | Toner Particle Shape Characterization by FE-SEM Image Analysis | |
| KR20220082277A (en) | Determination method for cell zone of slide sample image smeared with bone-marrow and high magnification imaging method of the same cell zone |
Legal Events
| Date | Code | Title | Description |
|---|---|---|---|
| PUAI | Public reference made under article 153(3) epc to a published international application that has entered the european phase |
Free format text: ORIGINAL CODE: 0009012 |
|
| STAA | Information on the status of an ep patent application or granted ep patent |
Free format text: STATUS: REQUEST FOR EXAMINATION WAS MADE |
|
| 17P | Request for examination filed |
Effective date: 20201006 |
|
| AK | Designated contracting states |
Kind code of ref document: A1 Designated state(s): AL AT BE BG CH CY CZ DE DK EE ES FI FR GB GR HR HU IE IS IT LI LT LU LV MC MK MT NL NO PL PT RO RS SE SI SK SM TR |
|
| STAA | Information on the status of an ep patent application or granted ep patent |
Free format text: STATUS: EXAMINATION IS IN PROGRESS |
|
| 17Q | First examination report despatched |
Effective date: 20220718 |
|
| GRAP | Despatch of communication of intention to grant a patent |
Free format text: ORIGINAL CODE: EPIDOSNIGR1 |
|
| STAA | Information on the status of an ep patent application or granted ep patent |
Free format text: STATUS: GRANT OF PATENT IS INTENDED |
|
| GRAS | Grant fee paid |
Free format text: ORIGINAL CODE: EPIDOSNIGR3 |
|
| INTG | Intention to grant announced |
Effective date: 20240411 |
|
| GRAA | (expected) grant |
Free format text: ORIGINAL CODE: 0009210 |
|
| STAA | Information on the status of an ep patent application or granted ep patent |
Free format text: STATUS: THE PATENT HAS BEEN GRANTED |
|
| AK | Designated contracting states |
Kind code of ref document: B1 Designated state(s): AL AT BE BG CH CY CZ DE DK EE ES FI FR GB GR HR HU IE IS IT LI LT LU LV MC MK MT NL NO PL PT RO RS SE SI SK SM TR |
|
| REG | Reference to a national code |
Ref country code: GB Ref legal event code: FG4D |
|
| REG | Reference to a national code |
Ref country code: CH Ref legal event code: EP |
|
| REG | Reference to a national code |
Ref country code: DE Ref legal event code: R096 Ref document number: 602020032164 Country of ref document: DE |
|
| REG | Reference to a national code |
Ref country code: IE Ref legal event code: FG4D |
|
| U01 | Request for unitary effect filed |
Effective date: 20240625 |
|
| U07 | Unitary effect registered |
Designated state(s): AT BE BG DE DK EE FI FR IT LT LU LV MT NL PT SE SI Effective date: 20240704 |
|
| PG25 | Lapsed in a contracting state [announced via postgrant information from national office to epo] |
Ref country code: HR Free format text: LAPSE BECAUSE OF FAILURE TO SUBMIT A TRANSLATION OF THE DESCRIPTION OR TO PAY THE FEE WITHIN THE PRESCRIBED TIME-LIMIT Effective date: 20240612 |
|
| PG25 | Lapsed in a contracting state [announced via postgrant information from national office to epo] |
Ref country code: GR Free format text: LAPSE BECAUSE OF FAILURE TO SUBMIT A TRANSLATION OF THE DESCRIPTION OR TO PAY THE FEE WITHIN THE PRESCRIBED TIME-LIMIT Effective date: 20240913 |
|
| PG25 | Lapsed in a contracting state [announced via postgrant information from national office to epo] |
Ref country code: ES Free format text: LAPSE BECAUSE OF FAILURE TO SUBMIT A TRANSLATION OF THE DESCRIPTION OR TO PAY THE FEE WITHIN THE PRESCRIBED TIME-LIMIT Effective date: 20240612 |
|
| PG25 | Lapsed in a contracting state [announced via postgrant information from national office to epo] |
Ref country code: NO Free format text: LAPSE BECAUSE OF FAILURE TO SUBMIT A TRANSLATION OF THE DESCRIPTION OR TO PAY THE FEE WITHIN THE PRESCRIBED TIME-LIMIT Effective date: 20240912 Ref country code: HR Free format text: LAPSE BECAUSE OF FAILURE TO SUBMIT A TRANSLATION OF THE DESCRIPTION OR TO PAY THE FEE WITHIN THE PRESCRIBED TIME-LIMIT Effective date: 20240612 Ref country code: GR Free format text: LAPSE BECAUSE OF FAILURE TO SUBMIT A TRANSLATION OF THE DESCRIPTION OR TO PAY THE FEE WITHIN THE PRESCRIBED TIME-LIMIT Effective date: 20240913 Ref country code: ES Free format text: LAPSE BECAUSE OF FAILURE TO SUBMIT A TRANSLATION OF THE DESCRIPTION OR TO PAY THE FEE WITHIN THE PRESCRIBED TIME-LIMIT Effective date: 20240612 Ref country code: RS Free format text: LAPSE BECAUSE OF FAILURE TO SUBMIT A TRANSLATION OF THE DESCRIPTION OR TO PAY THE FEE WITHIN THE PRESCRIBED TIME-LIMIT Effective date: 20240912 |
|
| PG25 | Lapsed in a contracting state [announced via postgrant information from national office to epo] |
Ref country code: PL Free format text: LAPSE BECAUSE OF FAILURE TO SUBMIT A TRANSLATION OF THE DESCRIPTION OR TO PAY THE FEE WITHIN THE PRESCRIBED TIME-LIMIT Effective date: 20240612 |
|
| U20 | Renewal fee for the european patent with unitary effect paid |
Year of fee payment: 6 Effective date: 20241217 |
|
| PG25 | Lapsed in a contracting state [announced via postgrant information from national office to epo] |
Ref country code: IS Free format text: LAPSE BECAUSE OF FAILURE TO SUBMIT A TRANSLATION OF THE DESCRIPTION OR TO PAY THE FEE WITHIN THE PRESCRIBED TIME-LIMIT Effective date: 20241012 |
|
| PG25 | Lapsed in a contracting state [announced via postgrant information from national office to epo] |
Ref country code: CZ Free format text: LAPSE BECAUSE OF FAILURE TO SUBMIT A TRANSLATION OF THE DESCRIPTION OR TO PAY THE FEE WITHIN THE PRESCRIBED TIME-LIMIT Effective date: 20240612 |
|
| PG25 | Lapsed in a contracting state [announced via postgrant information from national office to epo] |
Ref country code: SK Free format text: LAPSE BECAUSE OF FAILURE TO SUBMIT A TRANSLATION OF THE DESCRIPTION OR TO PAY THE FEE WITHIN THE PRESCRIBED TIME-LIMIT Effective date: 20240612 Ref country code: RO Free format text: LAPSE BECAUSE OF FAILURE TO SUBMIT A TRANSLATION OF THE DESCRIPTION OR TO PAY THE FEE WITHIN THE PRESCRIBED TIME-LIMIT Effective date: 20240612 |
|
| PG25 | Lapsed in a contracting state [announced via postgrant information from national office to epo] |
Ref country code: SM Free format text: LAPSE BECAUSE OF FAILURE TO SUBMIT A TRANSLATION OF THE DESCRIPTION OR TO PAY THE FEE WITHIN THE PRESCRIBED TIME-LIMIT Effective date: 20240612 |
|
| PG25 | Lapsed in a contracting state [announced via postgrant information from national office to epo] |
Ref country code: SM Free format text: LAPSE BECAUSE OF FAILURE TO SUBMIT A TRANSLATION OF THE DESCRIPTION OR TO PAY THE FEE WITHIN THE PRESCRIBED TIME-LIMIT Effective date: 20240612 Ref country code: SK Free format text: LAPSE BECAUSE OF FAILURE TO SUBMIT A TRANSLATION OF THE DESCRIPTION OR TO PAY THE FEE WITHIN THE PRESCRIBED TIME-LIMIT Effective date: 20240612 Ref country code: RO Free format text: LAPSE BECAUSE OF FAILURE TO SUBMIT A TRANSLATION OF THE DESCRIPTION OR TO PAY THE FEE WITHIN THE PRESCRIBED TIME-LIMIT Effective date: 20240612 Ref country code: PL Free format text: LAPSE BECAUSE OF FAILURE TO SUBMIT A TRANSLATION OF THE DESCRIPTION OR TO PAY THE FEE WITHIN THE PRESCRIBED TIME-LIMIT Effective date: 20240612 Ref country code: IS Free format text: LAPSE BECAUSE OF FAILURE TO SUBMIT A TRANSLATION OF THE DESCRIPTION OR TO PAY THE FEE WITHIN THE PRESCRIBED TIME-LIMIT Effective date: 20241012 Ref country code: CZ Free format text: LAPSE BECAUSE OF FAILURE TO SUBMIT A TRANSLATION OF THE DESCRIPTION OR TO PAY THE FEE WITHIN THE PRESCRIBED TIME-LIMIT Effective date: 20240612 |
|
| PLBE | No opposition filed within time limit |
Free format text: ORIGINAL CODE: 0009261 |
|
| STAA | Information on the status of an ep patent application or granted ep patent |
Free format text: STATUS: NO OPPOSITION FILED WITHIN TIME LIMIT |
|
| 26N | No opposition filed |
Effective date: 20250313 |
|
| REG | Reference to a national code |
Ref country code: CH Ref legal event code: PL |
|
| PG25 | Lapsed in a contracting state [announced via postgrant information from national office to epo] |
Ref country code: MC Free format text: LAPSE BECAUSE OF FAILURE TO SUBMIT A TRANSLATION OF THE DESCRIPTION OR TO PAY THE FEE WITHIN THE PRESCRIBED TIME-LIMIT Effective date: 20240612 |
|
| GBPC | Gb: european patent ceased through non-payment of renewal fee |
Effective date: 20250120 |
|
| PG25 | Lapsed in a contracting state [announced via postgrant information from national office to epo] |
Ref country code: GB Free format text: LAPSE BECAUSE OF NON-PAYMENT OF DUE FEES Effective date: 20250120 |
|
| PG25 | Lapsed in a contracting state [announced via postgrant information from national office to epo] |
Ref country code: CH Free format text: LAPSE BECAUSE OF NON-PAYMENT OF DUE FEES Effective date: 20250131 |
|
| PG25 | Lapsed in a contracting state [announced via postgrant information from national office to epo] |
Ref country code: IE Free format text: LAPSE BECAUSE OF NON-PAYMENT OF DUE FEES Effective date: 20250120 |
|
| U20 | Renewal fee for the european patent with unitary effect paid |
Year of fee payment: 7 Effective date: 20251215 |