EP3842540A1 - Method for producing classifier for use in prediction of event occurring in subject, and method for stratifying subjects using said classifier - Google Patents
Method for producing classifier for use in prediction of event occurring in subject, and method for stratifying subjects using said classifier Download PDFInfo
- Publication number
- EP3842540A1 EP3842540A1 EP19852485.2A EP19852485A EP3842540A1 EP 3842540 A1 EP3842540 A1 EP 3842540A1 EP 19852485 A EP19852485 A EP 19852485A EP 3842540 A1 EP3842540 A1 EP 3842540A1
- Authority
- EP
- European Patent Office
- Prior art keywords
- discriminator
- patient
- survival rate
- biomarker
- subpopulation
- Prior art date
- Legal status (The legal status is an assumption and is not a legal conclusion. Google has not performed a legal analysis and makes no representation as to the accuracy of the status listed.)
- Withdrawn
Links
Images










Classifications
-
- C—CHEMISTRY; METALLURGY
- C12—BIOCHEMISTRY; BEER; SPIRITS; WINE; VINEGAR; MICROBIOLOGY; ENZYMOLOGY; MUTATION OR GENETIC ENGINEERING
- C12Q—MEASURING OR TESTING PROCESSES INVOLVING ENZYMES, NUCLEIC ACIDS OR MICROORGANISMS; COMPOSITIONS OR TEST PAPERS THEREFOR; PROCESSES OF PREPARING SUCH COMPOSITIONS; CONDITION-RESPONSIVE CONTROL IN MICROBIOLOGICAL OR ENZYMOLOGICAL PROCESSES
- C12Q1/00—Measuring or testing processes involving enzymes, nucleic acids or microorganisms; Compositions therefor; Processes of preparing such compositions
- C12Q1/68—Measuring or testing processes involving enzymes, nucleic acids or microorganisms; Compositions therefor; Processes of preparing such compositions involving nucleic acids
- C12Q1/6876—Nucleic acid products used in the analysis of nucleic acids, e.g. primers or probes
- C12Q1/6883—Nucleic acid products used in the analysis of nucleic acids, e.g. primers or probes for diseases caused by alterations of genetic material
- C12Q1/6886—Nucleic acid products used in the analysis of nucleic acids, e.g. primers or probes for diseases caused by alterations of genetic material for cancer
-
- G—PHYSICS
- G01—MEASURING; TESTING
- G01N—INVESTIGATING OR ANALYSING MATERIALS BY DETERMINING THEIR CHEMICAL OR PHYSICAL PROPERTIES
- G01N33/00—Investigating or analysing materials by specific methods not covered by groups G01N1/00 - G01N31/00
- G01N33/48—Biological material, e.g. blood, urine; Haemocytometers
- G01N33/50—Chemical analysis of biological material, e.g. blood, urine; Testing involving biospecific ligand binding methods; Immunological testing
- G01N33/53—Immunoassay; Biospecific binding assay; Materials therefor
- G01N33/575—Immunoassay; Biospecific binding assay; Materials therefor for cancer
-
- G—PHYSICS
- G06—COMPUTING OR CALCULATING; COUNTING
- G06N—COMPUTING ARRANGEMENTS BASED ON SPECIFIC COMPUTATIONAL MODELS
- G06N5/00—Computing arrangements using knowledge-based models
- G06N5/01—Dynamic search techniques; Heuristics; Dynamic trees; Branch-and-bound
-
- G—PHYSICS
- G16—INFORMATION AND COMMUNICATION TECHNOLOGY [ICT] SPECIALLY ADAPTED FOR SPECIFIC APPLICATION FIELDS
- G16B—BIOINFORMATICS, i.e. INFORMATION AND COMMUNICATION TECHNOLOGY [ICT] SPECIALLY ADAPTED FOR GENETIC OR PROTEIN-RELATED DATA PROCESSING IN COMPUTATIONAL MOLECULAR BIOLOGY
- G16B40/00—ICT specially adapted for biostatistics; ICT specially adapted for bioinformatics-related machine learning or data mining, e.g. knowledge discovery or pattern finding
-
- G—PHYSICS
- G16—INFORMATION AND COMMUNICATION TECHNOLOGY [ICT] SPECIALLY ADAPTED FOR SPECIFIC APPLICATION FIELDS
- G16H—HEALTHCARE INFORMATICS, i.e. INFORMATION AND COMMUNICATION TECHNOLOGY [ICT] SPECIALLY ADAPTED FOR THE HANDLING OR PROCESSING OF MEDICAL OR HEALTHCARE DATA
- G16H50/00—ICT specially adapted for medical diagnosis, medical simulation or medical data mining; ICT specially adapted for detecting, monitoring or modelling epidemics or pandemics
- G16H50/20—ICT specially adapted for medical diagnosis, medical simulation or medical data mining; ICT specially adapted for detecting, monitoring or modelling epidemics or pandemics for computer-aided diagnosis, e.g. based on medical expert systems
-
- G—PHYSICS
- G16—INFORMATION AND COMMUNICATION TECHNOLOGY [ICT] SPECIALLY ADAPTED FOR SPECIFIC APPLICATION FIELDS
- G16H—HEALTHCARE INFORMATICS, i.e. INFORMATION AND COMMUNICATION TECHNOLOGY [ICT] SPECIALLY ADAPTED FOR THE HANDLING OR PROCESSING OF MEDICAL OR HEALTHCARE DATA
- G16H50/00—ICT specially adapted for medical diagnosis, medical simulation or medical data mining; ICT specially adapted for detecting, monitoring or modelling epidemics or pandemics
- G16H50/30—ICT specially adapted for medical diagnosis, medical simulation or medical data mining; ICT specially adapted for detecting, monitoring or modelling epidemics or pandemics for calculating health indices; for individual health risk assessment
-
- C—CHEMISTRY; METALLURGY
- C12—BIOCHEMISTRY; BEER; SPIRITS; WINE; VINEGAR; MICROBIOLOGY; ENZYMOLOGY; MUTATION OR GENETIC ENGINEERING
- C12Q—MEASURING OR TESTING PROCESSES INVOLVING ENZYMES, NUCLEIC ACIDS OR MICROORGANISMS; COMPOSITIONS OR TEST PAPERS THEREFOR; PROCESSES OF PREPARING SUCH COMPOSITIONS; CONDITION-RESPONSIVE CONTROL IN MICROBIOLOGICAL OR ENZYMOLOGICAL PROCESSES
- C12Q2600/00—Oligonucleotides characterized by their use
- C12Q2600/118—Prognosis of disease development
-
- C—CHEMISTRY; METALLURGY
- C12—BIOCHEMISTRY; BEER; SPIRITS; WINE; VINEGAR; MICROBIOLOGY; ENZYMOLOGY; MUTATION OR GENETIC ENGINEERING
- C12Q—MEASURING OR TESTING PROCESSES INVOLVING ENZYMES, NUCLEIC ACIDS OR MICROORGANISMS; COMPOSITIONS OR TEST PAPERS THEREFOR; PROCESSES OF PREPARING SUCH COMPOSITIONS; CONDITION-RESPONSIVE CONTROL IN MICROBIOLOGICAL OR ENZYMOLOGICAL PROCESSES
- C12Q2600/00—Oligonucleotides characterized by their use
- C12Q2600/158—Expression markers
-
- G—PHYSICS
- G01—MEASURING; TESTING
- G01N—INVESTIGATING OR ANALYSING MATERIALS BY DETERMINING THEIR CHEMICAL OR PHYSICAL PROPERTIES
- G01N2800/00—Detection or diagnosis of diseases
- G01N2800/52—Predicting or monitoring the response to treatment, e.g. for selection of therapy based on assay results in personalised medicine; Prognosis
Definitions
- This disclosure relates to a method for generating a discriminator for predicting an event that will occur in a test subject, a method for stratifying test subjects using the discriminator, an apparatus equipped with the discriminator for stratifying test subjects, and a method for predicting a survival rate of a cancer patient.
- Cancer is the leading cause of deaths in developed countries, and methods for stratifying patients with high mortality or patients who benefit from anticancer treatments have been under study for a decade or more.
- Patent Document 1 discloses a method for predicting the risk for recurrence of breast cancer within 10 years after surgery from the expression of 95 genes.
- Non-patent Document 1 discloses a method for predicting the risk for recurrence of invasive (stages I, II, III [up to T3N1]) and estrogen-receptor (ER) positive breast cancer within 10 years after surgery from the expression of 21 genes.
- the method disclosed in Non-patent Document 1 is provided as an inspection service under the name of Oncotype DX.
- Non-patent Document 2 discloses a method for predicting the risk for recurrence after 10 years from the expression of 70 genes.
- the method disclosed in Non-patent Document 2 is provided as an inspection service under the name of MammaPrint.
- Non-patent Document 3 discloses a method for predicting the risk for distant recurrence after 10 years in young breast cancer patients based on the expression of PAM 50 genes. The method disclosed in Non-patent Document 3 is provided as an inspection service under the name of Prosigna.
- Non-patent Document 4 discloses a method for selecting ER-positive early-stage breast cancer patients to whom extended endocrine therapy will be applied. The method described in Non-patent Document 4 is provided as an inspection service under the name of Breast Cancer Index.
- Non-patent Document 5 discloses a method for predicting the risk for distant recurrence of ER-positive and HER2-negative early-stage breast cancer. The method disclosed in Non-patent Document 5 is provided as an inspection service under the name of EndoPredict.
- Patent Document 1 Japanese Patent No. 5725274
- Patent Document 1 and Non-patent Documents 1 to 5 are useful for predicting the risk for recurrence or the therapeutic effects but does not provide an answer to the above patients' question.
- Patent Document 1 and Non-patent Documents 1 to 5 are applied only to breast cancer that is ER-positive (that is, may benefit from hormone therapies) and has little lymph node metastasis.
- test subjects can be stratified according to an event that will occur in the body of the test subject using a discriminator generated by a method described later.
- the present disclosure includes the following embodiments.
- a method for generating a discriminator comprising:
- a method for generating a discriminator comprising:
- Embodiment 1 or 2 The method for generating a discriminator according to Embodiment 1 or 2, wherein the machine learning method is a random forest.
- the method for generating a discriminator according to Embodiment 6, wherein the disease the patient is suffering from is cancer.
- a discriminator generation apparatus comprising a processing unit, wherein the processing unit executes a method for generating a discriminator according to any one of Embodiments 1 to 8.
- Embodiment 12 The method of use according to Embodiment 10, wherein the patient is a cancer patient. Embodiment 12.
- Embodiment 13 The method of use according to Embodiment 11, wherein the cancer is breast cancer. Embodiment 13.
- a method for predicting a survival rate of a patient comprising the steps of:
- a method for predicting a survival rate of a patient comprising the steps of:
- a method for predicting a survival rate of a patient comprising the steps of:
- a method for predicting a survival rate of a patient comprising the steps of:
- Embodiment 17 wherein the cancer is breast cancer.
- Embodiment 19 The prediction method according to Embodiment 17, wherein the cancer is breast cancer.
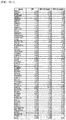
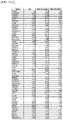
- the prediction method according to Embodiment 18, wherein the biomarkers extracted as a second subpopulation when a discriminator is generated include the genes shown in Table 1-1 and Table 1-2 below, and the measured value of the biomarker is the expression level of an mRNA or protein derived from the gene.
- biomarkers that are extracted as a third subpopulation when a discriminator is generated include FOXM1, CPT1A, GARS, MARS, UTP23, ANLN, HMGB3, ATP5B, APOOL, CYB561, GRHL2, ESRP1, EZR, RBBP8, CIRBP, PTGER3, LAMA3, OARD1, ANKRD29, EGR3, DIRAS3, MITD1 and LAMB3, and the measured value of the biomarker is the expression level of an mRNA or protein derived from the gene.
- a patient survival rate prediction apparatus comprising a processing unit, wherein the processing unit is for executing a prediction method according to any one of Embodiments 13 to 20.
- a method for assisting stratification of patients according to their survival rates comprising the steps of:
- Embodiment 22 wherein the patients are cancer patients.
- Embodiment 24 The method according to Embodiment 22, wherein the patients are cancer patients.
- Embodiment 22 or 23 wherein the reference ranges have been determined according to a category such as the clinical stage classification of cancer, the histological type, clinical stage or pathological tissue grade of cancer, or the age group, and wherein the method further comprises a step of acquiring information on the clinical stage classification of the cancer of the test subject, the histological type, clinical stage or pathological tissue grade of the cancer, the age group of the test subject according to the category.
- Embodiment 25 Embodiment 25.
- An inspection reagent for use in predicting a survival rate of a breast cancer patient comprising a probe, primer or antibody for detecting the expression level of an mRNA or protein derived from at least one selected from the genes shown in Table 1-1 and Table 1-2 below (with the proviso that an aspect consisting only of ANLN, FOXM1, RBBP8 or a combination of these genes is not included).
- An inspection reagent for use in predicting a survival rate of a breast cancer patient comprising a probe, primer, or antibody for detecting the expression level of an mRNA or protein derived from at least one selected from a gene group consisting of FOXM1, CPT1A, GARS, MARS, UTP23, ANLN, HMGB3, ATP5B, APOOL, CYB561, GRHL2, ESRP1, EZR, RBBP8, CIRBP, PTGER3, LAMA3, OARD1, ANKRD29, EGR3, DIRAS3, MITD1 and LAMB3 (with the proviso that an aspect consisting only of ANLN, FOXM1, RBBP8 or a combination of these genes is not included).
- a computer readable storage medium in which a discriminator according to Embodiment 29 has been stored is a computer readable storage medium in which a discriminator according to Embodiment 29 has been stored.
- a computer program for generating a discriminator which executes a method for generating a discriminator according to any one of Embodiments 1 to 8 when executed by a computer.
- a computer program for predicting a survival rate of a patient which executes a prediction method according to any one of Embodiments 13 to 20 when executed by a computer.
- a discriminator is generated based on measured values of multiple biomarkers.
- multiple biomarkers that may vary in relation with an event that will occur in the body of a test subject are determined based on measured values of the biomarkers.
- the discriminator is generated from a score that is determined based on a measured value of each biomarker and a weight of each biomarker that is calculated by a statistical method for multiple extracted biomarkers.
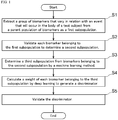
- the discriminator is generated when a processing unit 101 of a discriminator generation apparatus, which is described later, executes each step shown in FIG. 1 , for example.
- step S1 upon receiving a user's instruction to start processing from an input unit 111, the processing unit 101 extracts a group of biomarkers that vary in relation with an event that will occur in the body of a test subject from a parent population of biomarkers as a first subpopulation.
- step S2 the processing unit 101 validates each biomarker belonging to the first subpopulation to extract a second subpopulation that is predicted to be related more closely to an event that will occur in the body.
- step S3 the processing unit 101 extracts a third subpopulation that is predicted to be related much more closely to an event that will occur in the body from the biomarkers belonging to the second subpopulation by a machine learning method.
- step S4 the processing unit 101 calculates a weight of each biomarker belonging to the third subpopulation by a deep learning method.
- step S5 the processing unit 101 may validate the generalization/versatile ability, application potentiality and/or the like of the generated discriminator.
- FIG. 7 A typical example of each step is shown in FIG. 7 , but the present disclosure should not be construed as being limited to FIG. 7 .
- Step 1 is a step of determining a group of biomarkers that may vary in relation with an event that will occur in the body of a test subject.
- test subject is not limited as long as it is a mammal. Examples include humans, monkeys, dogs, cats, mice, rats, rabbits and so on.
- test subject is a human.
- test subject is a test subject suffering from a disease or diagnosed as suffering from a disease.
- the test subject is a patient.
- the disease is not particularly limited.
- the disease is a malignant tumor.
- the disease is a malignant epithelial tumor (cancer).
- the malignant tumor include solid tumors including respiratory system malignant tumors arising from the trachea, bronchi, lung or the like; digestive system malignant tumors arising from the epipharynx, esophagus, stomach, duodenum, jejunum, ileum, cecum, appendix, ascending colon, transverse colon, sigmoid colon, rectum, anal region or the like; liver cancer; pancreatic cancer; urinary system malignant tumors arising from the bladder, ureter or kidney; female reproductive system malignant tumors arising from the ovary, oviduct, uterus and so on; breast cancer; prostatic cancer; skin cancer; malignant tumors in the endocrine system such as hypothalamus, pituitary gland, thyroid gland, parathyroid gland, adrenal gland or the like; central nervous system malignant tumors; mal
- More preferred examples include epithelial malignant tumors in the respiratory system such as lung cancer (squamous cancer, small cell cancer, large cell cancer, adenocarcinoma) or the like; epithelial malignant tumors in the digestive system such as stomach cancer, duodenum cancer, large bowel cancer (sigmoid colon cancer, rectum cancer, etc.) or the like; liver cancer; pancreatic cancer; bladder cancer; thyroid gland cancer; ovary cancer; breast cancer; and prostate cancer. Most preferably, the disease is breast cancer.
- the disease is a malignant tumor
- the event that will occur in the body of a test subject is not limited. Examples include an onset of a disease (including, for example, an initial onset and recurrence), a biological response to treatment of a disease, the consequence of a disease (including, for example, cure and remission), the consequences of the test subject itself (including, for example, death and survival) and so on.
- the event is an onset of a disease, the consequence of a disease, the consequences of the test subject itself, and so on. More preferably, the event is the consequence of the test subject itself within or after a predetermined period of time, and still more preferably the death or survival of the test subject itself after a predetermined period of time.
- An event that will occur in the body of a test subject can be evaluated by whether or not the event will occur or by its probability.
- the probability include the rate of incidence of the disease, the rate at which the disease becomes severe, the treatment success rate for the disease, the treatment failure rate for the disease, the cure rate of the disease, the remission rate of the disease, the survival rate of the test subject, the mortality rate of the test subject and so on. Categorizing test subjects according to whether or not an event will occur or the probability of the event occurring is also referred to as stratifying the test subjects.
- the predetermined period of time can be selected as appropriate from 1 year, 2 years, 3 years, 5 years, 6 years, 7 years, 8 years, 9 years, 10 years, 15 years, 20 years, and 30 years depending on the event that will occur in the body.
- the most typical example of the event that will occur in the body of a test subject is the survival of a breast cancer patient after 10 or 20 years.
- the biomarkers are not limited as long as they are substances in the body.
- the substances in the body are at least one metabolic substance selected from the group consisting of nucleic acids (including genes); carbohydrates; lipids; glycoproteins; glycolipids; lipoproteins; amino acids, peptides; proteins; polyphenols; chemokines; and ultimate metabolites, intermediate metabolites and synthetic raw materials of the above substances; metal ions or the like, and more preferably are genes.
- the measured values of biomarkers are not limited as long as they can be measured by a known method and are values that reflect the amounts or concentrations of the above biomarkers.
- the measured values may be represented as quantitative values, or may be represented in a seme-quantitative way such as "increase,” "no change” or “decrease.”
- an immunological measurement method such as an ELISA method, a western blotting method or the like
- a quantitative RT-PCR method, an RNA-Seq method or the like can be employed.
- biomarkers when genes are used as the biomarkers, values that reflect the abundance of proteins or expression levels (such as the number of copies) of mRNAs derived from the genes can be used as the measured values of biomarkers.
- the parent population of biomarkers includes all the coding genes registered in HUGO Gene Nomenclature Committee (HGNC).
- the measured values of biomarkers may be measured values in a specimen containing tissue or cells at the lesion site of the disease. Also, the measured values may be measured values in a specimen containing substances in the body that reflect the state of the disease such as blood samples (including whole blood, plasma, serum and so on), urine, cerebrospinal fluid, ascites, pleural effusion and so on.
- the specimen is preferably cancer tissue or cancer cells.
- biomarkers As the measured values of biomarkers, information registered in a known database may be used.
- RNA-seq mRNA expression in the TCGA breast cancer dataset from cBioPortal is used as a first cohort for determining a group of biomarkers the measured values of which vary in relation with an event that will occur in the body of a test subject (also referred to as "discovery cohort").
- Whether or not the measured value of each biomarker varies in relation with an event that will occur in the body of a test subject can be determined by a statistical method.
- the statistical method is not limited as long as it can determine whether or not each biomarker is related to an event of interest. For example, each biomarker is classified into a high measured value or a low measured value group, and the relation with whether or not an event occurred in the body is evaluated for each biomarker belonging to each group. The relation with an event that will occur in the body is validated by a significant difference test, and biomarkers determined to have a "difference" by a significance test can be determined as candidate biomarkers that are related to an event that will occur in the body.
- the median of measured values of the biomarkers in a population is used as a boundary, and the measured values are divided into two groups by determining measured values equal to or higher than the median as "high” and measured values lower than the median as "low.”
- a median is characterized by the fact that no large difference is created between the numbers of biomarkers belonging to each group because the number of biomarkers belonging to each group after grouping is substantially the same. For this reason, it is preferred to use a median for grouping.
- Such a statistical analysis can be made using known statistical analysis software (for example, statistical analysis free software "R") or the like.
- the significant difference test can be selected according to information that represents the probability of variations occurring depending on a target event for each biomarker. For example, when the event that will occur in the body is one represented by a survival rate, the information that represents the probability of variations occurring for each biomarker is a Kaplan-Meier Plot.
- step S1 is intended to reduce the candidate biomarkers, a cutoff value is set for a significance level, p-value, calculated in a significant difference test. Biomarkers with a p-value smaller than the cutoff value can be determined as biomarkers "having a difference,” and biomarkers with a p-value larger than the cutoff value can be separated as biomarkers "having no difference.”
- the significant difference test can be selected, depending on the distribution of the measured values of biomarkers, from, for example, a t-test, a chi-square test, a one-way analysis of variance (which may include a test such as a Kruskal-Wallis test, a Mann-Whitney test or the like), a Friedman's test, a Cochran's Q test, a Log-rank test and so on.
- the cutoff value can be selected, for example, from 0.05, 0.01, 0.005, 0.001 and so on.
- a Log-rank test for example, can be employed as a method for the significant difference test.
- the cutoff value is set to 0.01.
- genes determined to have a p-value of less than 0.01 in a Log-rank test were extracted as biomarkers belonging to a first subpopulation related to an event that will occur in the body.
- Kaplan-Meier plots can be generated using statistical analysis software "R (survival package)” or the like.
- R survival package
- a Log-rank test can be conducted using the survival package, Python (lifelines package) of R or the like.
- the processing unit 101 can determine the group of biomarkers determined to "have a difference" by a significant difference test as a first subpopulation.
- step S2 the processing unit 101 uses a validation cohort for the first subpopulation, which has determined to "have a difference" by a significant difference test in step S1, to validate the correctness as candidate biomarkers.
- the validation is performed exhaustively on all the biomarkers extracted as the first subpopulation, and biomarkers determined to be correct as candidate biomarkers are extracted as a second subpopulation.
- the validation cohort is preferably selected from a cohort different from the discovery cohort.
- the cohort may be divided into two groups and one of the groups may be used as a discovery cohort and the other as a validation cohort.
- the validation cohort is preferably selected from a cohort different from the discovery cohort.
- the validation method is not limited as long as the correctness as candidate biomarkers can be validated.
- a meta-analysis a Log-rank test or the like can be employed.
- a meta-analysis is performed using a validation cohort different from the discovery cohort.
- the meta-analysis performs validation from hazard ratios and 95% confidence intervals by a Cox regression analysis. These analyses can be made using software such as Python (3.6.2).
- multicenter combined breast cancer cohorts [ Abdel-Fatah, T. M. A. et al. The Lancet. Oncology 17, 1004-1018, doi:10.1016/s1470-2045(16)00174-1 (2016 )], which are different from the discovery cohort, are used as a validation cohort to perform validation by a meta-analysis.
- the processing unit 101 can extract biomarkers validated to be correct as candidate biomarkers as a second subpopulation that is related more closely to an event that will occur in the body.
- the second subpopulation of the typical example shown in FIG. 7 is as shown in Table 1-1 and Table 1-2.
- Table 1-1 Gene Name NCBI* Gene ID Gene Name NCBl* Gene ID Gene Name NCBl* Gene ID 1 ADHFE1 137872 41 DCAF16 54876 81 LEF1 51176 2 AMD1 262 42 DCTPP1 79077 82 LEPROTL1 23484 3 ANKRD29 147463 43 DEF6 50619 83 LRP11 84918 4 ANLN 54443 44 DERL1 79139 84 LTF 4057 5 AP5S1 55317 45 DHRS1 115817 85 MAL2 114569 6 APOBEC3F 200316 46 DIRAS3 9077 86 MAP4K1 11184 7 APOBEC3G 60489 47 EEF1G 1937 87 MAPT 4137 8 APOL3 80833 48 EGR3 1960 88 MARS 4141 9 APOOL 139322 49 ENOSF1 55556 89 MAX 4149 10
- ATP5F1B is also referred to as ATP5B.
- Table 1-2 Gene Name NCBI* Gene ID Gene Name NCBI* Gene ID 121 QPRT 23475 161 TPRG1 285386 122 RAB2A 5862 162 TPT1 7178 123 RAC2 5880 163 TRAF5 7188 124 RAD1 5810 164 TRAPPC12 51112 125 RAPGEFL1 51195 165 TRIM34 53840 126 RARRES3 5920 166 TRIM35 23087 127 RBBP8 5932 167 TRIM45 80263 128 REPS1 85021 168 TVP23C 201158 129 RILPL2 196383 169 UBA7 7318 130 RPF1 80135 170 UBE2A 7319 131 RPL11 6135 171 UBTF 7343 132 RPL14 9045 172 UBXN1 51035 133 RPS6KA1 6195 173 UBXN11 91544
- the processing unit 101 extracts a third subpopulation from the second subpopulation by machine learning and validation.
- the machine learning method is not limited as long as feature values can be extracted. Examples of the machine learning method include a random forest, a decision tree, a support vector regression, a support vector machine, a logistic analysis, a sparse logistic analysis, a deep learning and so on. Preferred is a random forest.
- the machine learning can be performed using a Python-based scikit-learn library or the like.
- the machine learning method extracts, according to the feature values, biomarkers that are related more closely to an event that will occur in the body from the second subpopulation as feature values (step S31).
- the feature values are values that represent the intensity of relation between the variation of the measured value of each biomarker and an event that will occur in the body. For example, when the machine learning is a random forest, feature values are extracted based on feature importance values calculated in the validation.
- biomarkers that are related more closely to an event that will occur in the body can be extracted.
- the plurality is not limited as long as it is two or more.
- the plurality is intended to mean 3, 5, 10, 15, 20, 23, 25, 30, 40, 50, 100 or the like.
- the training data may be the cohort used as a discovery cohort or the cohort used as a validation cohort in step S2, or may be a different cohort. To improve the generalization/versatile ability and/or application potentiality of the discriminator that will be finally generated, it is preferred to use a cohort different from the discovery cohort or the validation cohort used in step S2 as the training data.
- the cohort used for validation is preferably selected from a cohort different from the training data.
- the cohort may be divided into two groups and one of the groups may be used as the training data and the other as a cohort for validation. Selection may be made from different cohorts.
- the cohort used for validation is selected from a cohort different from the training data.
- step S32 the processing unit 101 performs validation on the feature values extracted in step S31.
- the validation is repeated until feature values that are related most closely to an event that will occur in the body are found (step S33).
- feature values biomarker group
- step S34 feature values (biomarker group) that are related much more closely to an event that will occur in the body are extracted from the second subpopulation.
- a hold-out method a cross-validation such as a leave-one-out cross-validation (LOOCV), a mixing matrix and so on can be employed as the validation method.
- LOOCV leave-one-out cross-validation
- a cross-validation for example, a 10-fold cross-validation or the like can be employed.
- the processing unit 101 can extract a third subpopulation that is related more closely to an event that will occur in the body.
- the genes extracted in the typical example shown in FIG. 7 are 23 genes shown in FIG. 11-1a .
- step 4 for the biomarkers belonging to the third subpopulation, the training data are input into a neural network to calculate a weight of each biomarker belonging to the third subpopulation (which may be represented by "Weight” or "w i ,” wherein i represents each biomarker) by a deep learning method.
- a weight of each biomarker belonging to the third subpopulation which may be represented by "Weight” or "w i ,” wherein i represents each biomarker
- the deep learning method is not limited as long as a weight of each biomarker can be calculated. Examples include a gradient descent method, a stochastic gradient method, a feedforward neural network, an autoencoder, an error propagation method, a convolutional neural network, a recurrent neural network, a Boltzmann machine and so on. Preferred is a gradient descent method.
- the deep learning can be performed using a Python-based TensorFlow library or the like.
- the training data used in step 4 may be the same as or different from the training data used in step 3. Also, the training data used in step 4 may be the cohort used as a discovery cohort or the cohort used as a validation cohort in step S2.
- the discriminator is a function for multiplying the score of each biomarker belonging to the third subpopulation by the weight calculated by the deep learning and obtaining the sum of the products.
- the score of each biomarker is a value that links the measured value of each biomarker belonging to the third subpopulation with an event that will occur in the body.
- the value to be linked is, for example, binary data such as "0" and "1.”
- an event that will occur in the body is represented by a survival rate
- biomarkers that lead to a possibility that the prognosis will be poor when their measured values are higher than the median "1” is given as a "Gene_Score” when the measured value of each biomarker is higher than the median and "0” is given as a “Gene_Score” when the measured value of each biomarker is lower than the median.
- mPS molecular prognostic score
- the discriminator is the weighed sum of "Gene_Scores" of 23 genes shown in FIG. 11-1a in the breast cancer tissue of each patient.
- the discriminator is represented by the following formula.
- the mPS value exhibits a smaller value as the survival rate is better. Also, when scores based on the score pattern 1 are used, the mPS value exhibits a larger value as the survival rate is poorer.
- the mPS value exhibits a larger value as the survival rate is better. Also, when scores based on the score pattern 2 are used, the mPS value exhibits a smaller value as the survival rate is poorer.
- the discriminator may be generated by performing step S4 on the measured values of the biomarkers in the second subpopulation without performing step S3 shown in FIG. 1 .
- the generated discriminator may be stored in a storage unit of each apparatus described later, or may be output from each output unit. Also, it may be stored in a storage medium described later, or may be network-transmitted via a communication I/F 105.
- Step 5 is an optional step. Step 5 is a step of validating whether the discriminator generated in step 4 is applicable to any cohort divided into groups according to the type of the cohort, the subtypes of the disease, the age of the test subjects or the like.
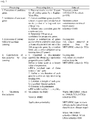
- the subtypes of the disease are, for example, clinical stage classification of cancer (A, B, C, D, E, F-I, and F-II shown in FIG. 18a ), clinical stages (TNM classification for cancer; stages I, II, III, etc. for breast cancer), histopathological grades (poorly differentiated type, moderately-differentiated type, well-differentiated type, etc.), or histological types (invasive ductal carcinoma (IDC), invasive lobular carcinoma (ILC), mixed IDC and ILC (MDLC), etc. for breast cancer).
- A, B, C, D, E, F-I, and F-II shown in FIG. 18a
- clinical stages TMM classification for cancer; stages I, II, III, etc. for breast cancer
- histopathological grades poorly differentiated type, moderately-differentiated type, well-differentiated type, etc.
- histological types invasive ductal carcinoma (IDC), invasive lobular carcinoma (ILC), mixed IDC and ILC (MDLC
- Grouping according to age or the like can divide the test subjects into, for example, a young group (younger than 50 years old), a mature group (not younger than 50 years old and younger than 70 years old) and a senior group (not younger than 70 years old).
- the generalization/versatile ability, the application potentiality and/or the like of the discriminator can be validated by statistically validating the correlation between the measured value of each biomarker and an event that will occur in the body for each cohort divided into groups.
- the method for obtaining a correlation is known.
- the generated discriminator may be stored in a storage medium such as a hard disk, a semiconductor memory device like a flash memory, an optical disc or the like.
- a storage medium such as a hard disk, a semiconductor memory device like a flash memory, an optical disc or the like.
- the format in which a program is stored in the storage medium is not limited as long as the processing unit 101, a processing unit 201 or a processing unit 301 can read the program.
- the program is preferably stored in the storage medium in a non-volatile manner.
- the generated discriminator can be used to evaluate an event that will occur in the body of a test subject.
- the discriminator generation apparatus 10 includes at least the processing unit 101, and the processing unit 101 generates a discriminator mentioned in the above section 1 according to the steps described in the above section 1., FIG. 1 or FIG. 2 .
- FIG. 3 shows the hardware configuration of the discriminator generation apparatus 10.
- FIG. 4 shows a block diagram of the discriminator generation apparatus 10.
- the discriminator generation apparatus 10 may be connected to an input unit 111, an output unit 112 and a storage medium 113.
- the processing unit 101 a memory 102, a ROM (read only memory) 103, a storage device 104, a communication interface (I/F) 105, an input interface (I/F) 106, an output interface (I/F) 107 and a media interface (I/F) 108 are data-communicably connected to one another by a bus 109.
- the memory 102 and the storage device 104 may be collectively referred to simply as "storage unit.”
- the storage unit stores the generated discriminator, a reference values or reference ranges for mPS, measured values of biomarkers of each patient, and an mPS of each patient in a volatile or non-volatile manner.
- the processing unit 101 is a CPU of the discriminator generation apparatus 10.
- the processing unit 101 may be a GPU.
- the processing unit 101 executes a computer program stored in the storage device 104 or the ROM 103 and processes acquired data, the discriminator generation apparatus 10 functions.
- the ROM 103 is constituted of a mask ROM, a PROM, an EPROM, an EEPROM or the like, and stores computer programs that are executed by the processing unit 101 and data used therefor.
- the processing unit 101 may be an MPU 101.
- the ROM 103 stores a boot program that is executed by the processing unit 101 when the discriminator generation apparatus 10 is activated and programs and settings related to the operation of the hardware of the discriminator generation apparatus 10.
- the memory 102 is constituted of a RAM (Random access memory) such as an SRAM or DRAM.
- the memory 102 is used to read out computer programs stored in the ROM 103 and the storage device 104. Also, the memory 102 is utilized as a workspace when the processing unit 101 executes these computer programs.
- the storage device 104 is constituted of a hard disk, a semiconductor memory device like a flash memory, an optical disc or the like.
- various computer programs to be executed by the processing unit 101 such as operating systems and application programs and various setting data used for execution of the computer programs are stored.
- the storage device 104 stores the reference value and so on in a non-volatile manner.
- the communication I/F 105 is constituted of a serial interface such as a USB, IEEE1394 or RS-232C, a parallel interface such as an SCSI, IDE or IEEE1284, an analog interface consisting of a D/A converter, A/D converter or the like, a network interface controller (NIC) and so on.
- the communication I/F 105 Under the control of the processing unit 101, the communication I/F 105 receives data from a measurement unit 30 or other external devices and, when necessary, sends or displays information stored in or generated by the discriminator generation apparatus 10 to or on the measurement unit 30 or the outside.
- the communication I/F 105 may communicate with the measurement unit 30 or other external devices via a network.
- the input I/F 106 is constituted, for example, of a serial interface such as a USB, IEEE1394 or RS-232C, a parallel interface such as an SCSI, IDE or IEEE1284, an analog interface consisting of a D/A converter, A/D converter or the like and so on.
- the input I/F 106 accepts text input, clicks, voice input or the like from the input unit 111.
- the accepted input is stored in the memory 102 or the storage device 104.
- the input unit 111 is constituted of a touch panel, a keyboard, a mouse, a pen tablet, a microphone or the like, and performs text or voice input into the discriminator generation apparatus 10.
- the input unit 111 may be connected from the outside of the discriminator generation apparatus 10, or may be integrated with the discriminator generation apparatus 10.
- the output I/F 107 is constituted, for example, of an interface similar to that for the input I/F 106.
- the output I/F 107 outputs information generated by the processing unit 101 to the output unit 112.
- the output I/F 107 outputs information generated by the processing unit 101 and stored in the storage device 104 to the output unit 112.
- the output unit 112 is constituted, for example, of a display, a printer or the like, and displays measurement results transmitted from the measurement unit 30, various operation windows, results of analyses and so on in the discriminator generation apparatus 10.
- the media I/F 108 reads out, for example, application software or the like stored in the storage medium 113.
- the read-out application software or the like is stored in the memory 102 or the storage device 104.
- the media I/F 108 writes information generated by the processing unit 101 into the storage medium 113.
- the media I/F 108 writes information generated by the processing unit 101 and stored in the storage device 104 into the storage medium 113.
- the storage medium 113 is constituted of a flexible disk, a CD-ROM, a DVD-ROM or the like.
- the storage medium 113 is connected to the media I/F 108 by a flexible disk drive, a CD-ROM drive, a DVD-ROM drive or the like.
- An application program that is used by a computer to execute an operation or the like may be stored in the storage medium 113.
- the processing unit 101 may acquire application software or various settings necessary for control of the discriminator generation apparatus 10 via a network instead of reading those out of the ROM 103 or the storage device 104.
- the application program is stored in a storage device of a server computer on a network, it is also possible for the discriminator generation apparatus 10 to access this server computer to download a computer program and store it into the ROM 103 or the storage device 104.
- an operation system that provides a graphical user interface environment such as Windows (trademark) manufactured and sold by Microsoft, USA or the like has been installed in the ROM 103 or the storage device 104.
- An application program according to a second embodiment shall operate on the operating system.
- the discriminator generation apparatus 10 may be a personal computer or the like.
- a certain embodiment of this disclosure relates to a computer program for generating a discriminator.
- the computer program causes the processing unit 101 to execute step S1, step S2 and step S4, preferably steps S1 to S5, described in FIG. 1 , and steps S31 to S34 described in FIG. 2 .
- a certain embodiment of this disclosure relates to a storage medium in which the computer program has been stored.
- the computer program is stored in a storage medium such as a hard disk, a semiconductor memory device like a flash memory, an optical disc or the like.
- the format in which the program is stored in the storage medium is not limited as long as the processing unit 101 can read the program.
- the program is preferably stored in the storage medium in a non-volatile manner.
- a certain embodiment of this disclosure relates to a method for predicting a survival rate of a patient.
- the discriminator generated by the method in the above section 1. is used to predict a survival rate of a patient after a predetermined period of time.
- the disease the patient is suffering from is not particularly limited, but the diseases listed in the above section 1.(1) can be incorporated here.
- the disease is cancer, and more preferably breast cancer.
- the survival rate of a patient after a predetermined period of time can be predicted by comparing the mPS value of the patient with a reference value.
- the scores input into the discriminator are in the score pattern 1, specifically, the mPS value of each patient obtained by the discriminator is compared with its reference value. Then, when the mPS of the patient is larger than the reference value, it can be determined that the survival rate of the patient after a predetermined period of time, preferably after 10 or 20 years, will be poor. Also, when the mPS of the patient is equal to or smaller than the reference value, it can be determined that the survival rate of the patient after a predetermined period of time, preferably after 10 or 20 years, will be good.
- the mPS value of each patient obtained by the discriminator is compared with its reference value. Then, when the mPS of the patient is smaller than the reference value, it can be determined that the survival rate of the patient after a predetermined period of time, preferably after 10 or 20 years, will be poor. Also, when the mPS of the patient is equal to or larger than the reference value, it can be determined that the survival rate of the patient after a predetermined period of time, preferably after 10 or 20 years, will be good.
- This embodiment may include a step of acquiring measured values of biomarkers from a specimen containing tissue or cells taken from a lesion site of the disease in the patient, or a specimen containing substances in the body that reflect the state of the disease such as blood samples (including whole blood, plasma, serum and so on), urine, cerebrospinal fluid, ascites, pleural effusion and so on.
- Measured values of biomarkers can be acquired by a known method.
- the biomarkers are genes
- measured values of the biomarkers can be acquired by, for example, a quantitative RT-PCR method, an RNA-Seq method or the like.
- This embodiment may include a step of calculating an mPS value of each patient using a discriminator.
- the measured values of biomarkers of a group of genes in the second subpopulation or the third subpopulation obtained for each patient are binarized according to the method described in the above section 1. to determine the score of each gene.
- the processing unit 201 inputs the score of each gene into a discriminator stored in the storage unit to calculate the mPS of each patient.
- the reference value is not limited as long as it is a value with which it can be determined that the survival rate of the patient after a predetermined period of time will be good and/or poor.
- the reference value can be obtained from the mPS of a patient whose survival rate after a predetermined period of time is good or the mPS of a patient whose survival rate after a predetermined period of time is poor.
- the reference value may be the upper limit of the mPSs in a group of patients whose survival rate after a predetermined period of time is good or the lower limit of the mPSs in a group of patients whose survival rate after a predetermined period of time is poor.
- the reference value may be the median, average, mode or the like of a plurality of mPSs in a population including both a group of patients whose survival rate after a predetermined period of time is good and a group of patients whose survival rate after a predetermined period of time is poor.
- the reference value may be calculated by an ROC curve (Receiver Operatorating Characteristic curve), a discriminant analysis method, a mode method, a Kittler method, a 3 ⁇ method, a p-tile method or the like. It is preferred that the reference value has been determined in advance.
- the survival rate prediction apparatus 20 includes at least the processing unit 201. Because the configuration of the survival rate prediction apparatus 20 is the same as that of the discriminator generation apparatus 10, the description in the above section 2. and FIG. 3 and FIG. 4 are incorporated here.
- the discriminator generation apparatus 10 the processing unit 101, the memory 102, the ROM 103, the storage device 104, the communication interface (I/F) 105, the input interface (I/F) 106, the output interface (I/F) 107, the media interface (I/F) 108, the bus 109, the input unit 111, the output unit 112 and the storage medium 113 are replaced with a processing unit 201, a memory 202, a ROM 203, a storage device 204, a communication interface (I/F) 205, an input interface (I/F) 206, an output interface (I/F) 207, a media interface (I/F) 208, a bus 209, an input unit 211, an output unit 212 and a storage medium 213, respectively.
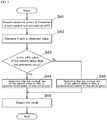
- FIG. 5 the operation of the survival rate prediction apparatus 20 is described.
- a case where the scores that are input into the discriminator are in the score pattern 1 is described as an example.
- the processing unit 201 acquires measured values of biomarkers included in the second subpopulation or the third subpopulation input through the input unit 211 by a user for each cancer patient.
- the processing unit 201 acquires measured values of biomarkers included in the second subpopulation or the third subpopulation from a network through the communication I/F 205 for each patient according to an instruction to start processing input through the input unit 211 by a user.
- the processing unit 201 binarizes the measured value of each biomarker acquired according to the method described in the above section 1. to determine a score of each biomarker.
- the processing unit 201 inputs the score of each gene into a discriminator stored in the storage unit to calculate an mPS of each patient.
- step S42 the processing unit 201 compares the mPS of each cancer patient with a reference value for mPS stored in the storage unit.
- step S43 the processing unit 201 determines whether or not the mPS of each patient is larger than the reference value.
- step S43 determines whether the survival rate of the patient after a predetermined period of time will be poor (step S44). If the determination in step S43 is NO, it is determined that the survival rate of the patient after a predetermined period of time will be good (step S45).
- step S43 determines whether the survival rate of the patient within or after a predetermined period of time will be good in step S44. If the determination in step S43 is NO, it is determined that the survival rate of the patient within or after a predetermined period of time will be poor in step S45.
- step S46 the processing unit 201 outputs the determination result to the output unit 212.
- the processing unit 201 may store the determination result in the storage device 204.
- a certain embodiment of this disclosure relates to a computer program for predicting a survival rate of a cancer patient.
- the computer program causes the processing unit 201 to execute steps S41 to S46 described in FIG. 5 .
- a certain embodiment of this disclosure relates to a storage medium in which the computer program has been stored.
- the computer program is stored in a storage medium such as a hard disk, a semiconductor memory device like a flash memory, an optical disc or the like.
- the format in which the program is stored in the storage medium is not limited as long as the processing unit 201 can read the program.
- the program is preferably stored in the storage medium in a non-volatile manner.
- a certain embodiment of this disclosure relates to a method for assisting stratification of cancer patients based on their survival rates.
- mPSs calculated with a discriminator generated as described in the above section 1. are used to assist stratification of cancer patients based on survival rates of the cancer patients after a predetermined period of time. Specifically, cancer patients are stratified by comparing the mPS value of each cancer patient obtained by the discriminator with its reference ranges to determine the bin into which the mPS value of each cancer patient is categorized.
- this embodiment may include a step of acquiring measured values of biomarkers from a specimen containing tissue or cells taken from a lesion site of the disease in the cancer patient, or a specimen containing substances in the body that reflect the state of the disease such as blood samples (including whole blood, plasma, serum and so on), urine, cerebrospinal fluid, ascites, pleural effusion and so on. Measured values of biomarkers can be acquired by a known method. When the biomarkers are genes, measured values of the biomarkers can be acquired by, for example, a quantitative RT-PCR method, an RNA-Seq method or the like. Also, this embodiment may include a step of calculating an mPS value of each patient using a discriminator.
- the measured values of biomarkers in the second subpopulation or the third subpopulation obtained for each patient are binarized according to the method described in the above section 1. to determine the score of each gene.
- the processing unit 301 inputs the score of each gene into a discriminator stored in the storage unit to calculate the mPS of each patient.
- the survival rate of each patient can be predicted in a stepwise fashion.
- the survival rate of each patient can be predicted in a stepwise fashion.
- the reference ranges may have been determined according to a category such as the histological type, clinical stage or pathological tissue grade, the age group or the like.
- the method for assisting stratification further includes acquiring information on the histological type, clinical stage or pathological tissue grade of the cancer and the age group according to the category.
- a processing unit 301 can acquire these pieces of information from an input through an input unit 311 by a user, linkage with an electronic health record or the like. It is preferred that the reference ranges have been determined in advance.
- the stratification apparatus 30 includes at least the processing unit 301. Because the configuration of the stratification apparatus 30 is the same as that of the discriminator generation apparatus 10, the description in the above section 2. and FIG. 3 and FIG. 4 are incorporated here.
- the discriminator generation apparatus 10 the processing unit 101, the memory 102, the ROM 103, the storage device 104, the communication interface (I/F) 105, the input interface (I/F) 106, the output interface (I/F)107, the media interface (I/F) 108, the bus 109, the input unit 111, the output unit 112 and the storage medium 113 are replaced with a processing unit 301, a memory 302, a ROM 303, a storage device 304, a communication interface (I/F) 305, an input interface (I/F) 306, an output interface (I/F) 307, a media interface (I/F) 308, a bus 309, an input unit 311, an output unit 312 and a storage medium 313, respectively.
- a processing unit 301 a memory 302, a ROM 303, a storage device 304, a communication interface (I/F) 305, an input interface (I/F) 306, an output interface (I/F) 307, a media
- the processing unit 301 acquires measured values of biomarkers included in the second subpopulation or the third subpopulation input through the input unit 311 by a user for each patient.
- the processing unit 301 acquires measured values of biomarkers included in the second subpopulation or the third subpopulation from a network through the communication I/F 305 for each patient according to an instruction to start processing input through the input unit 311 by a user.
- the processing unit 301 binarizes the measured value of each biomarker acquired according to the method described in the above section 1. to determine a score of each biomarker.
- the processing unit 301 inputs the score of each gene into a discriminator stored in the storage unit to calculate an mPS of each patient.
- step S52 the processing unit 301 compares the mPS of each patient with reference ranges for mPS stored in a storage unit.
- step S53 it is determined that the patient has a survival rate of the bin to which the mPS of the patient belongs.
- step S54 the processing unit 301 outputs the determination result to the output unit 312.
- the processing unit 301 may store the determination result in the storage device 304.
- a certain embodiment of this disclosure relates to a computer program for stratifying cancer patients.
- the computer program causes the processing unit 301 to execute steps S51 to S54 described in FIG. 6 .
- a certain embodiment of this disclosure relates to a storage medium in which the computer program has been stored.
- the computer program is stored in a storage medium such as a hard disk, a semiconductor memory device like a flash memory, an optical disc or the like.
- the format in which the program is stored in the storage medium is not limited as long as the processing unit 301 can read the program.
- the program is preferably stored in the storage medium in a non-volatile manner.
- a certain embodiment of this disclosure relates to the use of at least one gene selected from the genes described in Table 1-1 and Table 1-2 as a biomarker for predicting the survival rate of a breast cancer patient.
- the biomarker does not include an aspect consisting only of ANLN, FOXM1, RBBP8 or a combination of these genes.
- At least one selected from the group consisting of FOXM1, CPT1A, GARS, MARS, UTP23, ANLN, HMGB3, ATP5B, APOOL, CYB561, GRHL2, ESRP1, EZR, RBBP8, CIRBP, PTGER3, LAMA3, OARD1, ANKRD29, EGR3, DIRAS3, MITD1 and LAMB3 is used as a biomarker for predicting a survival rate of a breast cancer patient.
- the expression level of an mRNA and/or a protein derived from at least one gene selected from the group of genes is used as a biomarker.
- a certain embodiment of this disclosure relates to an inspection reagent used to predict a survival rate of a breast cancer patient that contains a probe, primer or antibody for detecting the expression level of an mRNA or protein derived from at least one gene selected from the genes described in Table 1-1 and Table 1-2.
- a probe, primer or antibody for detecting the expression level of an mRNA or protein derived from at least one gene selected from the genes described in Table 1-1 and Table 1-2 Preferably, an aspect consisting only of ANLN, FOXM1, RBBP8 or a combination of these genes is not included.
- More preferred is at least one selected from the group consisting of FOXM1, CPT1A, GARS, MARS, UTP23, ANLN, HMGB3, ATP5B, APOOL, CYB561, GRHL2, ESRP1, EZR, RBBP8, CIRBP, PTGER3, LAMA3, OARD1, ANKRD29, EGR3, DIRAS3, MITD1 and LAMB3 (with the proviso that an aspect consisting only of ANLN, FOXM1, RBBP8 or a combination of these genes is not included).
- This inspection reagent is not limited as long as it can be used in an RT-PCR method, a microarray method, an RNA-Seq method, an ELISA method, a western blotting method or the like.
- the inspection reagent may constitute an inspection kit used to predict a survival rate of a breast cancer patient that includes the inspection reagent, an enzyme for reacting the inspection reagent, a reaction liquid in which a hybridization or antigen-antibody reaction is carried out, an instruction manual or a printed medium showing the URL or QR code (trademark) of a Web page that provides the instruction manual.
- a plurality of known breast cancer cohorts was used to generate a discriminator. There were few patients with metastasis from the cohorts used in this study.
- the TCGA cohort was used as a discovery cohort.
- the GISTEC can be referred to Mermel, C. H. et al. Genome Biol.
- the METABRIC cohort is independent of the TCGA cohort.
- HGNC HUGO Gene Nomenclature Committee
- CGDS-R package and Web APIs provided by cBioPortal were used.
- a Python-based TensorFlow library was also used for a neural network analysis.
- Python (3.6.2) established in Anaconda distribution and written in a custom script was used.
- Kaplan-Meier plots were created using R (survival package), and validated using Python (lifelines package). As a cutoff value for dividing a low expression group and a high expression group for each gene, the median was used. In this example, the low expression may be represented by a superscript "low” and the high expression by a superscript "high.”
- mPS molecular prognostic score
- the survival period was from the date of diagnosis to the date of death except for the meta-analysis shown in FIG. 8e .
- a Log-rank test was conducted to compare the survival rates.
- the R survival package was used to estimate hazard ratios (HRs) and their 95% confidence intervals (CIs) with Cox regression. The presence or absence of a significant difference was determined at a two-sided p-value of 0.05 except for the discovery cohort ( FIG. 8 ), and the cutoff was set to 0.01 in order to reduce the number of candidate genes.
- FIG. 7 shows an outline of the generation of a discriminator for predicting the prognosis of cancer from multiple cohorts.
- the method for generating a discriminator roughly includes the following five steps.
- step 1 the TCGA cohort was downloaded, and gene candidates that are related to the 10-year survival rate of breast cancer patients were explored based on the number of reads (expression levels) of these RNAs.
- the median age in this discovery cohort was 59 years old (IQR 49-68).
- the cohort was divided into two groups (a low expression group and a high expression group) at the median of the RNA read number. Then, survival curves for 10 years were generated for all genes by Kaplan-Meier Plots of the low expression group and the high expression group.
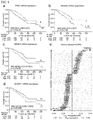
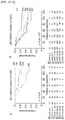
- FIGs. 8a, 8b, 8c and 8d show Kaplan-Meier Plots of PGK1, TMEM65, BEND5, and ENOSF1, respectively, as examples of candidates genes.
- PGK1 and TMEM65 are examples in which the survival rate in breast cancer was worse in the high expression group than in the low expression group.
- BEND5 and ENOSF1 are examples in which the survival rate in breast cancer was worse in the low expression group than in the high expression group.
- the symbol H indicates the high expression group and the symbol L indicates the low expression group.
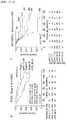
- step 2 the 286 genes picked up by a Log-rank test were validated by a meta-analysis using the multicenter cohorts as validation cohorts, and 184 genes were further extracted as candidate genes ( FIG. 8e ).
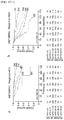
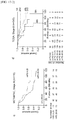
- TMEM65 and RILPL2 showed the highest HR expression level ( FIG. 9-1a ) and the lowest HR expression level ( FIG. 9-1b ), respectively, in the multicenter cohorts, and were genes that are considered to be most closely related to the prognosis of breast cancer. These genes have not been addressed neither in basic cancer studies nor in clinical cancer studies.
- a combination of genes that are considered to be second most closely related to the prognosis of breast cancer is that of TMEM65 high and DCTPP1 high , which was observed in 244 patients in the TCGA cohort.
- step 3 feature values were extracted by a random forest for the 184 genes extracted in step 2 to extract genes that are related more closely to the survival rate of breast cancer.
- the result obtained by a random forest was validated by a cross-validation.
- the 23 genes shown in FIG. 11-1a were selected as predictive genes for predicting a 10-year survival rate of breast cancer. 13 genes out of the 23 genes may lead to a poor prognosis when their expression is higher than the median and 10 genes may lead to a poor prognosis when their expression is lower than the median.
- step 4 a neural network was used to calculate weights of the 23 genes extracted in step 3.
- a cohort with n 952 extracted at random from the METABRIC cohort, which was also used in step 3, was used.
- a loss function of cross entropy of each gene was defined, and a weight of each gene "Gene_Weight" was calculated by a gradient descent method [ FIG. 12 : Kourou, K., et al. Computational and structural biotechnology journal 13, 8-17,doi:10.1016/j.csbj.2014.11.005 (2015 )].
- Gene Scores were set. Specifically, for genes that may lead to a poor prognosis when their expression is higher than the median, “1” is given as a “Gene_Score” when the expression of each gene in the breast cancer tissue of the patient is higher than the median, and “0” is given as a “Gene_Score” when the expression of each gene in the breast cancer tissue of the patient is lower than the median.
- mPS molecular prognostic score
- the discriminator is a weighed sum of the "Gene_Scores" of the 23 genes shown in FIG. 11-1a in the breast cancer tissue of each patient.
- 23 indicates the 23 genes shown in FIG. 11-1a .).
- the "Gene_Weight" was set such that the mPS falls within the range of 0 to 50 ( FIG. 11-1a ).
- the distribution of mPSs in the METABRIC cohort is shown in FIG. 11-2b .
- the mPSs had an average of 24.973, an interquartile range of 15.915-34.030, and a standard deviation of 11.297.
- FIG. 11-2c shows the stage classification of breast cancer and the distribution of cohort in each of six bins into which the mPS range of 0 to 50 is divided.
- the symbol S1 indicates breast cancer stage I
- the symbol S2 indicates breast cancer stage II
- the mPS exhibited a good correlation with the clinical stage.
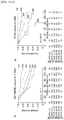
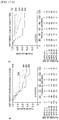
- FIG. 11-3d shows the survival rates of the cohorts belonging to each bin of the first to sixth bins of mPS of the METABRIC cohort.
- FIG. 11-3e shows the survival rates of the cohorts belonging to each bin of the first to sixth bins of mPS of the TCGA cohort.
- the mPS can stratify the survival rates. It was shown that the mPS can stratify a breast cancer cohort according to the survival rate even without clinical information. In addition, because a cohort can be stratified regardless of the type of the cohort, it was shown that the discriminator has a high generalization/versatile ability.
- the discriminator has a possibility of being applicable to various breast cancer subtypes.
- a pre-menopause cohort e.g. younger than 50 years old
- the therapeutic choice for an elder cohort e.g. older than 70 years old
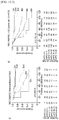
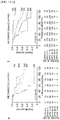
- a cohort is categorized according to the age group and it was examined whether the discriminator can stratify a cohort according to the survival rate using the METABRIC cohort.
- FIG. 13-2d METABRIC cohort ⁇ 50 years old
- FIG. 14a METABRIC cohort ⁇ 50s and 60s
- the mPS also exhibited a correlation with the survival rate in a cohort younger than 50 years old, a cohort in their 50s and 60s, and an elder cohort (not younger than 70 years old).
- the 20-year survival rate was tracked for the cohort younger than 50 years old to examine whether the discriminator can stratify a cohort according to the survival rate.
- invasive ductal carcinoma IDC
- ILC invasive ductal carcinoma
- the mPS exhibited a good correlation with the survival rate even in a cohort of invasive ductal carcinoma.
- the second most frequent histological subtype of breast cancer is invasive lobular carcinoma (ILC) and mixed IDC and ILC (MDLC).
- ILC and MDLC are totally different from IDC in a histopathological sense.
- Histological subtypes of breast cancer are also categorized according to the malignancy diagnosed from histological appearance.
- the malignancy is divided into three grades depending on the degree of differentiation of cells constituting the cancer tissue: G1 (Grade 1: well differentiated), G2 (Grade 2: moderately differentiated) and G3 (Grade 3: poorly differentiated).
- G1 G1
- G2 G2
- G3 G3
- a cohort was categorized according to these grades, and the correlation between the mPS and the survival rate was examined for the cohort of each grade after the categorization.
- the mPS was well-correlated with the survival rate in all the grades. This indicates that the discriminator has a possibility of being applicable to various grades of breast cancer.
- the TNM categorization is applied to categorization showing the degree of progression (stage) of cancer not only in the case of breast cancer.
- the TNM categorization is a method for categorizing the degree of progression of cancer based on information such as histological appearance, metastasis in lymph nodes and so on regardless of the various subtypes of cancer as described above.
- the TNM categorization categorizes breast cancer tissue into stages I to VI by an academically determined method.
- the result may be different from the grade of malignancy of cancer tissue because the degree of progression is determined based on the TNM categorization criteria independently of each subtype as described above.
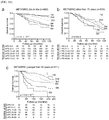
- a survival rate of more than 10 years among patients belonging to stage I about 90% of patients showed an mPS of lower than 11 (a good 10-year survival rate).
- the other patients had an mPS of higher than 25 and, consequently, a low 10-year survival rate even though they were categorized into stage I by the TNM categorization [ FIG. 17-1a : METABRIC, Stage I].
- patients with an mPS below 5 showed a very good survival rate.
- patients with an mPS of above 45 had a poor survival rate [ FIG. 17-1b : METABRIC, Stage II].
- patients with an mPS below 25 showed a relatively good survival rate.
- patients with an mPS above 25 had a poor survival rate [ FIG. 17-2c : METABRIC, Stage III].
- TCGA TCGA
- Stage I-III it was shown that the mPS increases and the survival rate becomes worse as the stage progressed.
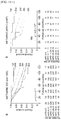
- the NPI is calculated based on the size of the primary tumor, the number of lymph nodes involved and the tumor grade.
- the METABRIC cohort is categorized into five NPI groups [Excellent (NPI ⁇ 2.41), Good (2.41-3.4), Moderate I (3.41-4.4), Moderate II (4.41-5.4), and Poor (NPI>5.4)], and the relationship with the mPS was examined. As a result, it was proved that the NPI is heterogeneous (non-uniform) grouping in the survival rate.
- a cohort categorized into the NPI Moderate II is shown in FIG. 17-3f .
- FIG. 16-1a METABRIC, Excellent
- FIG. 16-1b METABRIC, Good
- FIG. 16-2c METABRIC, Moderate I
- FIG. 16-2d METABRIC, Poor.
- FIG. 18a shows the result of categorizing the clinical stages I to IV of cancer, based on the first bin (mPS 0-5) to the sixth bin (mPS 45-50) of the mPS, into 7 classes: A, B, C, D, E, F-I and F-II.
- the distribution of the first to sixth bins of the mPS was in excellent agreement with the clinical stage categorization.
- the mPS precisely reflects the survival rate of cancer patients within and after a predetermined period of time.
- the mPS has a generalization/versatile ability because it exhibited a good correlation with the clinical stage categorization, clinical stage and pathological grade of cancer according to the integrated score.
Landscapes
- Health & Medical Sciences (AREA)
- Engineering & Computer Science (AREA)
- Life Sciences & Earth Sciences (AREA)
- Chemical & Material Sciences (AREA)
- Medical Informatics (AREA)
- Pathology (AREA)
- Public Health (AREA)
- Physics & Mathematics (AREA)
- General Health & Medical Sciences (AREA)
- Biomedical Technology (AREA)
- Immunology (AREA)
- Data Mining & Analysis (AREA)
- Theoretical Computer Science (AREA)
- Molecular Biology (AREA)
- Proteomics, Peptides & Aminoacids (AREA)
- Databases & Information Systems (AREA)
- Biotechnology (AREA)
- Epidemiology (AREA)
- Analytical Chemistry (AREA)
- Organic Chemistry (AREA)
- Bioinformatics & Cheminformatics (AREA)
- Urology & Nephrology (AREA)
- Microbiology (AREA)
- Zoology (AREA)
- Wood Science & Technology (AREA)
- Hematology (AREA)
- Biochemistry (AREA)
- Artificial Intelligence (AREA)
- Software Systems (AREA)
- Genetics & Genomics (AREA)
- Biophysics (AREA)
- Primary Health Care (AREA)
- Evolutionary Computation (AREA)
- General Physics & Mathematics (AREA)
- General Engineering & Computer Science (AREA)
- Computing Systems (AREA)
- Oncology (AREA)
- Bioinformatics & Computational Biology (AREA)
- Evolutionary Biology (AREA)
- Spectroscopy & Molecular Physics (AREA)
Abstract
Description
- This disclosure relates to a method for generating a discriminator for predicting an event that will occur in a test subject, a method for stratifying test subjects using the discriminator, an apparatus equipped with the discriminator for stratifying test subjects, and a method for predicting a survival rate of a cancer patient.
- Cancer is the leading cause of deaths in developed countries, and methods for stratifying patients with high mortality or patients who benefit from anticancer treatments have been under study for a decade or more.
- For example,
Patent Document 1 discloses a method for predicting the risk for recurrence of breast cancer within 10 years after surgery from the expression of 95 genes. Non-patentDocument 1 discloses a method for predicting the risk for recurrence of invasive (stages I, II, III [up to T3N1]) and estrogen-receptor (ER) positive breast cancer within 10 years after surgery from the expression of 21 genes. The method disclosed inNon-patent Document 1 is provided as an inspection service under the name of Oncotype DX. Non-patentDocument 2 discloses a method for predicting the risk for recurrence after 10 years from the expression of 70 genes. The method disclosed inNon-patent Document 2 is provided as an inspection service under the name of MammaPrint. Non-patentDocument 3 discloses a method for predicting the risk for distant recurrence after 10 years in young breast cancer patients based on the expression ofPAM 50 genes. The method disclosed inNon-patent Document 3 is provided as an inspection service under the name of Prosigna. Non-patentDocument 4 discloses a method for selecting ER-positive early-stage breast cancer patients to whom extended endocrine therapy will be applied. The method described inNon-patent Document 4 is provided as an inspection service under the name of Breast Cancer Index. Non-patentDocument 5 discloses a method for predicting the risk for distant recurrence of ER-positive and HER2-negative early-stage breast cancer. The method disclosed inNon-patent Document 5 is provided as an inspection service under the name of EndoPredict. - [Patent Document 1]
Japanese Patent No. 5725274 -
- [Non-Patent Document 1] Sparano, J. A. et al. Prospective Validation of a 21-Gene Expression Assay in Breast Cancer. N. Engl. J. Med. 373, 2005-2014, doi:10.1056/NEJMoa1510764 (2015).
- [Non-Patent Document 2] van 't Veer, L. J. et al. Nature 415, 530-536, doi:10.1038/415530a (2002).
- [Non-Patent Document 3] Parker, J. S. et al. J. Clin. Oncol. 27, 1160-1167, doi:10.1200/jco.2008.18.1370 (2009).
- [Non-Patent Document 4] Ma, X. J. et al. Cancer Cell 5, 607-616, doi:10.1016/j.ccr.2004.05.015 (2004).
- [Non-Patent Document 5] Filipits, M. et al. Clin. Cancer Res. 17, 6012-6020,doi:10.1158/1078-0432.ccr-11-0926 (2011).
- The first question that those who have been notified of cancer ask the doctor is often how many more years they can expect to live.
- The methods disclosed in
Patent Document 1 andNon-patent Documents 1 to 5 are useful for predicting the risk for recurrence or the therapeutic effects but does not provide an answer to the above patients' question. - Also, the methods disclosed in
Patent Document 1 andNon-patent Documents 1 to 5 are applied only to breast cancer that is ER-positive (that is, may benefit from hormone therapies) and has little lymph node metastasis. - In other words, at the present stage, a method for predicting an event that will occur in the body of a test subject such as life or death of the test subject over the entire cancer or entire diseases has not been established.
- In the invention disclosed herein, it is an object to provide a method for stratifying test subjects according to an event that will occur in the body of the test subject.
- The present inventors have conducted diligent studies, and consequently found that test subjects can be stratified according to an event that will occur in the body of the test subject using a discriminator generated by a method described later.
- The present disclosure includes the following embodiments.
- A method for generating a discriminator, comprising:
-
step 1 of determining, for a parent population of biomarkers derived from a test subject, whether each biomarker varies in relation with an event that will occur in the body of the test subject by a statistical method based on a measured value of each biomarker, and extracting a group of biomarkers determined to vary as a first subpopulation, -
step 2 of validating each biomarker belonging to the first subpopulation, and extracting a group of biomarkers statistically predicted to be related more closely to the event that will occur in the body as a second subpopulation, and -
step 3 of calculating a weight of each biomarker belonging to the second subpopulation by a deep learning method, - A method for generating a discriminator, comprising:
- step A of determining, for a parent population of biomarkers derived from a test subject, whether each biomarker varies in relation with an event that will occur in the body of the test subject by a statistical method based on a measured value of each biomarker, and extracting a group of biomarkers determined to vary as a first subpopulation,
- step B of validating each biomarker belonging to the first subpopulation, and extracting a group of biomarkers statistically predicted to be related more closely to the event that will occur in the body as a second subpopulation,
- step C of extracting a group of biomarkers statistically predicted to be related much more closely to an event that will occur in the body from the biomarkers belonging to the second subpopulation as a third subpopulation by a machine learning method, and
- step D of calculating a weight of each biomarker belonging to the third subpopulation by a deep learning method,
- The method for generating a discriminator according to
Embodiment - The method for generating a discriminator according to any one of
Embodiments 1 to 3, wherein the deep learning method is a gradient descent method. - The method for generating a discriminator according to any one of
Embodiments 1 to 4, wherein the validation is a meta-analysis. - The method for generating a discriminator according to any one of
Embodiments 1 to 5, wherein the event that will occur in the body is the survival rate of the patient within or after a predetermined period of time. - The method for generating a discriminator according to
Embodiment 6, wherein the disease the patient is suffering from is cancer. - The method for generating a discriminator according to any one of
Embodiments 1 to 7, wherein the biomarkers are genes, and the measured value of the biomarker is the expression level of an mRNA or protein derived from the gene. - A discriminator generation apparatus, comprising a processing unit, wherein the processing unit executes a method for generating a discriminator according to any one of
Embodiments 1 to 8. - A method of use in which a discriminator generated by a method for generating a discriminator according to any one of
Embodiments 1 to 8 is used to predict the survival rate of a patient within or after a predetermined period of time. - The method of use according to
Embodiment 10, wherein the patient is a cancer patient.Embodiment 12. - The method of use according to
Embodiment 11, wherein the cancer is breast cancer.Embodiment 13. - A method for predicting a survival rate of a patient, comprising the steps of:
- acquiring, for a patient, a weighed sum calculated using a discriminator generated by a method for generating a discriminator according to any one of
Embodiments 1 to 8, and - determining that the patient has a good survival rate when a weighed sum calculated using a discriminator generated by a method for generating a discriminator according to any one of
Embodiments 1 to 8 takes a smaller value as the survival rate within or after a predetermined period of time is better and when the weighed sum of the patient is equal to or smaller than a reference value. - A method for predicting a survival rate of a patient, comprising the steps of:
- acquiring, for a patient, a weighed sum calculated using a discriminator generated by a method for generating a discriminator according to any one of
Embodiments 1 to 8, and - determining that the patient has a poor survival rate when a weighed sum calculated using a discriminator generated by a method for generating a discriminator according to any one of
Embodiments 1 to 8 takes a smaller value as the survival rate within or after a predetermined period of time is better and when the weighed sum of the patient is larger than a reference value.Embodiment 15. - A method for predicting a survival rate of a patient, comprising the steps of:
- acquiring, for a patient, a weighed sum calculated using a discriminator generated by a method for generating a discriminator according to any one of
Embodiments 1 to 8, and - determining that the patient has a good survival rate when a weighed sum calculated using a discriminator generated by a method for generating a discriminator according to any one of
Embodiments 1 to 8 takes a larger value as the survival rate within or after a predetermined period of time is better and when the weighed sum of the patient is equal to or larger than a reference value. - A method for predicting a survival rate of a patient, comprising the steps of:
- acquiring, for a patient, a weighed sum calculated using a discriminator generated by a method for generating a discriminator according to any one of
Embodiments 1 to 8, and - determining that the patient has a poor survival rate when a weighed sum calculated using a discriminator generated by a method for generating a discriminator according to any one of
Embodiments 1 to 8 takes a larger value as the survival rate within or after a predetermined period of time is better and when the weighed sum of the patient is smaller than a reference value.Embodiment 17. - The prediction method according to any one of
Embodiments 13 to 16, wherein the patient is a cancer patient. - The prediction method according to
Embodiment 17, wherein the cancer is breast cancer.Embodiment 19. - The prediction method according to
Embodiment 18, wherein the biomarkers extracted as a second subpopulation when a discriminator is generated include the genes shown in Table 1-1 and Table 1-2 below, and the measured value of the biomarker is the expression level of an mRNA or protein derived from the gene. - The prediction method according to
Embodiment 18, wherein the biomarkers that are extracted as a third subpopulation when a discriminator is generated include FOXM1, CPT1A, GARS, MARS, UTP23, ANLN, HMGB3, ATP5B, APOOL, CYB561, GRHL2, ESRP1, EZR, RBBP8, CIRBP, PTGER3, LAMA3, OARD1, ANKRD29, EGR3, DIRAS3, MITD1 and LAMB3, and the measured value of the biomarker is the expression level of an mRNA or protein derived from the gene. - A patient survival rate prediction apparatus comprising a processing unit, wherein the processing unit is for executing a prediction method according to any one of
Embodiments 13 to 20. - A method for assisting stratification of patients according to their survival rates, comprising the steps of:
- comparing weighed sums calculated for the patients using a discriminator generated by a method for generating a discriminator according to any one of
Embodiments 1 to 8 with corresponding reference ranges, and - determining bins of the reference ranges to which the weighed sums of the patients belong.
- The method according to
Embodiment 22, wherein the patients are cancer patients.Embodiment 24. - The method according to
Embodiment
wherein the method further comprises a step of acquiring information on the clinical stage classification of the cancer of the test subject, the histological type, clinical stage or pathological tissue grade of the cancer, the age group of the test subject according to the category.Embodiment 25. - Use of at least one selected from the genes shown in Table 1-1 and Table 1-2 below (with the proviso that an aspect consisting only of ANLN, FOXM1, RBBP8 or a combination of these genes is not included) as a biomarker for predicting a survival rate of a breast cancer patient.
Embodiment 26. - Use of at least one selected from the gene group consisting of FOXM1, CPT1A, GARS, MARS, UTP23, ANLN, HMGB3, ATP5B, APOOL, CYB561, GRHL2, ESRP1, EZR, RBBP8, CIRBP, PTGER3, LAMA3, OARD1, ANKRD29, EGR3, DIRAS3, MITD1 and LAMB3 (with the proviso that an aspect consisting only of ANLN, FOXM1, RBBP8 or a combination of these genes is not included) as a biomarker for predicting a survival rate of a breast cancer patient.
Embodiment 27. - An inspection reagent for use in predicting a survival rate of a breast cancer patient, comprising a probe, primer or antibody for detecting the expression level of an mRNA or protein derived from at least one selected from the genes shown in Table 1-1 and Table 1-2 below (with the proviso that an aspect consisting only of ANLN, FOXM1, RBBP8 or a combination of these genes is not included).
- An inspection reagent for use in predicting a survival rate of a breast cancer patient, comprising a probe, primer, or antibody for detecting the expression level of an mRNA or protein derived from at least one selected from a gene group consisting of FOXM1, CPT1A, GARS, MARS, UTP23, ANLN, HMGB3, ATP5B, APOOL, CYB561, GRHL2, ESRP1, EZR, RBBP8, CIRBP, PTGER3, LAMA3, OARD1, ANKRD29, EGR3, DIRAS3, MITD1 and LAMB3 (with the proviso that an aspect consisting only of ANLN, FOXM1, RBBP8 or a combination of these genes is not included).
- A discriminator generated by a method for generating a discriminator according to any one of
Embodiments 1 to 8. - A computer readable storage medium in which a discriminator according to
Embodiment 29 has been stored. - A computer program for generating a discriminator, which executes a method for generating a discriminator according to any one of
Embodiments 1 to 8 when executed by a computer. - A computer program for predicting a survival rate of a patient, which executes a prediction method according to any one of
Embodiments 13 to 20 when executed by a computer. - It is possible to predict whether an event will occur in the body of a test subject. It is also possible to provide a method for generating a versatile discriminator for predicting whether an event will occur in the body of a test subject based on information from known databases.
-
-
FIG. 1 is a flowchart showing the flow of a method for generating a discriminator. -
FIG. 2 is a flowchart showing the flow of step S3 inFIG. 1 . -
FIG. 3 is a conceptual diagram of a discriminator generation apparatus, a prediction apparatus, and a stratification apparatus. -
FIG. 4 is a block diagram of the discriminator generation apparatus, the prediction apparatus, and the stratification apparatus. -
FIG. 5 is a flowchart showing the flow of a prediction method. -
FIG. 6 is a flowchart showing the flow of a stratification method. -
FIG. 7 shows a typical example of a method for generating a discriminator. -
FIG. 8a shows Kaplan-Meier Plots for high and low PGK1 expression groups.FIG. 8b shows Kaplan-Meier Plots for high and low TMEM65 expression groups.FIG. 8c shows Kaplan-Meier Plots for high and low BEND5 expression groups.FIG. 8d shows Kaplan-Meier Plots for high and low ENOSF1 expression groups.FIG. 8e shows a result of a meta-analysis. -
FIG. 9-1a shows the confidence intervals of genes that lead to a poor survival rate when expressed at a high level.FIG. 9-1b shows the confidence intervals of genes that lead to a poor survival rate when expressed at a low level. -
FIG. 9-2c shows Kaplan-Meier Plots for a TMEM65high and DCTPP1high group and a group of others.FIG. 9-2d shows Kaplan-Meier Plots for a UBA7low and ENOSF1low group and a group of others. -
FIG. 10-1 shows the hazard ratios (HR) of the genes shown in Table 1-1 to Table 1-2 and their confidence intervals. -
FIG. 10-2 shows the hazard ratios (HR) of the genes shown in Table 1-1 to Table 1-2 and their confidence intervals. -
FIG. 10-3 shows the hazard ratios (HR) of the genes shown in Table 1-1 to Table 1-2 and their confidence intervals. -
FIG. 10-4 shows the hazard ratios (HR) of the genes shown in Table 1-1 to Table 1-2 and their confidence intervals. -
FIG. 11-1a shows Gene_Scores and Gene_Weights of 23 genes. -
FIG. 11-2b shows the distribution of mPS in the METABRIC cohort.FIG. 11-2c shows the distribution of mPS in each stage. -
FIG. 11-3d shows Kaplan-Meier Plots for every bin of mPS of the METABRIC cohort.FIG. 11-3e shows Kaplan-Meier Plots for every bin of mPS of the TCGA cohort. -
FIG. 12 shows an outline of a method for predicting a survival rate according to the present disclosure. -
FIG. 13-1a shows Kaplan-Meier Plots for every bin of mPS in HER2-enriched breast cancer patients from the METABRIC cohort.FIG. 13-1b shows Kaplan-Meier Plots for every bin of mPS in Claudin-low breast cancer patients from the METABRIC cohort. -
FIG. 13-2c shows Kaplan-Meier Plots for every bin of mPS in Normal-like breast cancer patients from the METABRIC cohort.FIG. 13-2d shows Kaplan-Meier Plots for every bin of mPS in breast cancer patients younger than 50 years old from the METABRIC cohort. -
FIG. 13-3e shows Kaplan-Meier Plots for every bin of mPS in ILC breast cancer patients from the METABRIC cohort.FIG. 13-3f shows Kaplan-Meier Plots for every bin of mPS ingrade 2 breast cancer patients from the METABRIC cohort·(n=740). -
FIG. 14a shows Kaplan-Meier Plots for every bin of mPS in breast cancer patients in their 50s and 60s from the METABRIC cohort.FIG. 14b shows Kaplan-Meier Plots for every bin of mPS in breast cancer patients not younger than 70 years old from the METABRIC cohort.FIG. 14c shows Kaplan-Meier Plots for every bin of mPS in breast cancer patients younger than 50 years old from the METABRIC cohort. -
FIG. 15-1a shows Kaplan-Meier Plots for every bin of mPS in IDC breast cancer patients from the METABRIC cohort.FIG. 15-1b is a Kaplan-Meier Plot for every bin of mPS in MDLC breast cancer patients from the METABRIC cohort. -
FIG. 15-2c shows Kaplan-Meier Plots for every bin of mPS ingrade 1 breast cancer patients from the METABRIC cohort.FIG. 15-2d shows Kaplan-Meier Plots for every bin of mPS ingrade 3 breast cancer patients from the METABRIC cohort. -
FIG. 16-1a shows Kaplan-Meier Plot for Kaplan-Meier Plots for every bin of mPS in breast cancer patients categorized into the Nottingham Prognostic Index (NPI) Excellent group from the METABRIC cohort.FIG. 16-1b shows Kaplan-Meier Plots for every bin of mPS in breast cancer patients categorized into the Nottingham Prognostic Index (NPI) Good group from the METABRIC cohort. -
FIG. 16-2c shows Kaplan-Meier Plots for every bin of mPS in breast cancer patients categorized into the Nottingham Prognostic Index (NPI) Moderate group from the METABRIC cohort.FIG. 16-2d shows Kaplan-Meier Plots for every bin of mPS in breast cancer patients categorized into the Nottingham Prognostic Index (NPI) Poor group from the METABRIC cohort. -
FIG. 17-1a shows Kaplan-Meier Plots for every bin of mPS in breast cancer patients categorized into Stage I from the METABRIC cohort.FIG. 17-1b is Kaplan-Meier Plots for every bin of mPS in breast cancer patients categorized into Stage II from the METABRIC cohort. -
FIG. 17-2c shows Kaplan-Meier Plots for every bin of mPS in breast cancer patients categorized into Stage III from the METABRIC cohort.FIG. 17-2d shows Kaplan-Meier Plots for every bin of mPS in breast cancer patients categorized into Stage II from the TCGA cohort. -
FIG. 17-3e shows Kaplan-Meier Plots for every bin of mPS in breast cancer patients categorized into Stages I to III from the TCGA cohort.FIG. 17-3f shows Kaplan-Meier Plots for every bin of mPS in breast cancer patients categorized into Moderate II from the METABRIC cohort. -
FIG. 18a is a diagram showing the relationship of classes in which clinical stages are integrated with mPS.FIG. 18b shows Kaplan-Meier Plots for every bin of classes in which clinical stages are integrated with mPS for the entire METABRIC and TCGA cohorts. - A discriminator is generated based on measured values of multiple biomarkers. First, for a parent population of biomarkers, multiple biomarkers that may vary in relation with an event that will occur in the body of a test subject are determined based on measured values of the biomarkers. The discriminator is generated from a score that is determined based on a measured value of each biomarker and a weight of each biomarker that is calculated by a statistical method for multiple extracted biomarkers.
- More specifically, the discriminator is generated when a
processing unit 101 of a discriminator generation apparatus, which is described later, executes each step shown inFIG. 1 , for example. - First, in step S1, upon receiving a user's instruction to start processing from an
input unit 111, theprocessing unit 101 extracts a group of biomarkers that vary in relation with an event that will occur in the body of a test subject from a parent population of biomarkers as a first subpopulation. - Next, in step S2, the
processing unit 101 validates each biomarker belonging to the first subpopulation to extract a second subpopulation that is predicted to be related more closely to an event that will occur in the body. - Next, in step S3, the
processing unit 101 extracts a third subpopulation that is predicted to be related much more closely to an event that will occur in the body from the biomarkers belonging to the second subpopulation by a machine learning method. - Next, in step S4, the
processing unit 101 calculates a weight of each biomarker belonging to the third subpopulation by a deep learning method. Theprocessing unit 101 generates a discriminator as described below from the weights calculated in step S4 and scores determined based on the measured value of each biomarker belonging to the third subpopulation;
[wherein mPS indicates a molecular prognostic score, w indicates a weight of each biomarker, GS indicates a score of each biomarker, i indicates each biomarker, and n represents the total number of biomarkers. wi*Si represents the product of the weight of each biomarker and the score of the corresponding biomarker]. - Finally, in step S5, the
processing unit 101 may validate the generalization/versatile ability, application potentiality and/or the like of the generated discriminator. - Each step is described in more detail.
- A typical example of each step is shown in
FIG. 7 , but the present disclosure should not be construed as being limited toFIG. 7 . -
Step 1 is a step of determining a group of biomarkers that may vary in relation with an event that will occur in the body of a test subject. - The test subject is not limited as long as it is a mammal. Examples include humans, monkeys, dogs, cats, mice, rats, rabbits and so on. Preferably, the test subject is a human. Preferably, the test subject is a test subject suffering from a disease or diagnosed as suffering from a disease. Preferably, the test subject is a patient.
- The disease is not particularly limited. Preferably, the disease is a malignant tumor. More preferably, the disease is a malignant epithelial tumor (cancer). Examples of the malignant tumor include solid tumors including respiratory system malignant tumors arising from the trachea, bronchi, lung or the like; digestive system malignant tumors arising from the epipharynx, esophagus, stomach, duodenum, jejunum, ileum, cecum, appendix, ascending colon, transverse colon, sigmoid colon, rectum, anal region or the like; liver cancer; pancreatic cancer; urinary system malignant tumors arising from the bladder, ureter or kidney; female reproductive system malignant tumors arising from the ovary, oviduct, uterus and so on; breast cancer; prostatic cancer; skin cancer; malignant tumors in the endocrine system such as hypothalamus, pituitary gland, thyroid gland, parathyroid gland, adrenal gland or the like; central nervous system malignant tumors; malignant tumors arising from the bone-soft tissue, and so on. More preferred examples include epithelial malignant tumors in the respiratory system such as lung cancer (squamous cancer, small cell cancer, large cell cancer, adenocarcinoma) or the like; epithelial malignant tumors in the digestive system such as stomach cancer, duodenum cancer, large bowel cancer (sigmoid colon cancer, rectum cancer, etc.) or the like; liver cancer; pancreatic cancer; bladder cancer; thyroid gland cancer; ovary cancer; breast cancer; and prostate cancer. Most preferably, the disease is breast cancer.
- When the disease is a malignant tumor, it is preferred that no metastasis of the malignant tumor is observed in the test subject.
- The event that will occur in the body of a test subject is not limited. Examples include an onset of a disease (including, for example, an initial onset and recurrence), a biological response to treatment of a disease, the consequence of a disease (including, for example, cure and remission), the consequences of the test subject itself (including, for example, death and survival) and so on. Preferably, the event is an onset of a disease, the consequence of a disease, the consequences of the test subject itself, and so on. More preferably, the event is the consequence of the test subject itself within or after a predetermined period of time, and still more preferably the death or survival of the test subject itself after a predetermined period of time.
- An event that will occur in the body of a test subject can be evaluated by whether or not the event will occur or by its probability. Examples of the probability include the rate of incidence of the disease, the rate at which the disease becomes severe, the treatment success rate for the disease, the treatment failure rate for the disease, the cure rate of the disease, the remission rate of the disease, the survival rate of the test subject, the mortality rate of the test subject and so on. Categorizing test subjects according to whether or not an event will occur or the probability of the event occurring is also referred to as stratifying the test subjects.
- The predetermined period of time can be selected as appropriate from 1 year, 2 years, 3 years, 5 years, 6 years, 7 years, 8 years, 9 years, 10 years, 15 years, 20 years, and 30 years depending on the event that will occur in the body.
- In this disclosure, the most typical example of the event that will occur in the body of a test subject is the survival of a breast cancer patient after 10 or 20 years.
- The biomarkers are not limited as long as they are substances in the body. The substances in the body are at least one metabolic substance selected from the group consisting of nucleic acids (including genes); carbohydrates; lipids; glycoproteins; glycolipids; lipoproteins; amino acids, peptides; proteins; polyphenols; chemokines; and ultimate metabolites, intermediate metabolites and synthetic raw materials of the above substances; metal ions or the like, and more preferably are genes.
- The measured values of biomarkers are not limited as long as they can be measured by a known method and are values that reflect the amounts or concentrations of the above biomarkers. The measured values may be represented as quantitative values, or may be represented in a seme-quantitative way such as "increase," "no change" or "decrease." For example, when the biomarkers are genes and values that reflect the abundance of proteins derived from the genes are measured, an immunological measurement method (such as an ELISA method, a western blotting method or the like) can be employed. When the biomarkers are genes and values that reflect the expression levels (such as the number of copies) of mRNAs derived from the genes are measured, a quantitative RT-PCR method, an RNA-Seq method or the like can be employed.
- For example, when genes are used as the biomarkers, values that reflect the abundance of proteins or expression levels (such as the number of copies) of mRNAs derived from the genes can be used as the measured values of biomarkers. In
FIG. 7 , the parent population of biomarkers includes all the coding genes registered in HUGO Gene Nomenclature Committee (HGNC). - The measured values of biomarkers may be measured values in a specimen containing tissue or cells at the lesion site of the disease. Also, the measured values may be measured values in a specimen containing substances in the body that reflect the state of the disease such as blood samples (including whole blood, plasma, serum and so on), urine, cerebrospinal fluid, ascites, pleural effusion and so on. When the disease is cancer, the specimen is preferably cancer tissue or cancer cells.
- As the measured values of biomarkers, information registered in a known database may be used. Examples of the known database include cBioPortal [Cerami, E. et al. Cancer Discov. 2, 401-404, doi:10.1158/2159-8290.cd-12-0095 (2012)], multicenter combined breast cancer cohorts [Abdel-Fatah, T. M. A. et al. The Lancet. )], Whole METABRIC cohort [n=1904; Pereira, B. et al. ) and Curtis, C. et al. Nature 486, 346-352, doi:10.1038/nature10983 (2012)] and so on. In the example shown in
FIG. 7 , the mRNA expression (RNA-seq) in the TCGA breast cancer dataset from cBioPortal is used as a first cohort for determining a group of biomarkers the measured values of which vary in relation with an event that will occur in the body of a test subject (also referred to as "discovery cohort"). - Whether or not the measured value of each biomarker varies in relation with an event that will occur in the body of a test subject can be determined by a statistical method.
- The statistical method is not limited as long as it can determine whether or not each biomarker is related to an event of interest. For example, each biomarker is classified into a high measured value or a low measured value group, and the relation with whether or not an event occurred in the body is evaluated for each biomarker belonging to each group. The relation with an event that will occur in the body is validated by a significant difference test, and biomarkers determined to have a "difference" by a significance test can be determined as candidate biomarkers that are related to an event that will occur in the body.
- For each biomarker, whether its measured value is high or low can be determined on the basis of, for example, the median, average, interquartile range and so on. In the typical example in
FIG. 7 , with regard to the determination of whether the measured value of each biomarker is high or low, the median of measured values of the biomarkers in a population is used as a boundary, and the measured values are divided into two groups by determining measured values equal to or higher than the median as "high" and measured values lower than the median as "low." A median is characterized by the fact that no large difference is created between the numbers of biomarkers belonging to each group because the number of biomarkers belonging to each group after grouping is substantially the same. For this reason, it is preferred to use a median for grouping. Such a statistical analysis can be made using known statistical analysis software (for example, statistical analysis free software "R") or the like. - The significant difference test can be selected according to information that represents the probability of variations occurring depending on a target event for each biomarker. For example, when the event that will occur in the body is one represented by a survival rate, the information that represents the probability of variations occurring for each biomarker is a Kaplan-Meier Plot.
- Because step S1 is intended to reduce the candidate biomarkers, a cutoff value is set for a significance level, p-value, calculated in a significant difference test. Biomarkers with a p-value smaller than the cutoff value can be determined as biomarkers "having a difference," and biomarkers with a p-value larger than the cutoff value can be separated as biomarkers "having no difference."
- The significant difference test can be selected, depending on the distribution of the measured values of biomarkers, from, for example, a t-test, a chi-square test, a one-way analysis of variance (which may include a test such as a Kruskal-Wallis test, a Mann-Whitney test or the like), a Friedman's test, a Cochran's Q test, a Log-rank test and so on.
- The cutoff value can be selected, for example, from 0.05, 0.01, 0.005, 0.001 and so on.
- When the information that represents the probability for each biomarker is a Kaplan-Meier Plot, a Log-rank test, for example, can be employed as a method for the significant difference test. In the typical example shown in
FIG. 7 , the cutoff value is set to 0.01. In other words, genes determined to have a p-value of less than 0.01 in a Log-rank test were extracted as biomarkers belonging to a first subpopulation related to an event that will occur in the body. - Kaplan-Meier plots can be generated using statistical analysis software "R (survival package)" or the like. A Log-rank test can be conducted using the survival package, Python (lifelines package) of R or the like.
- In this way, the
processing unit 101 can determine the group of biomarkers determined to "have a difference" by a significant difference test as a first subpopulation. - In step S2, the
processing unit 101 uses a validation cohort for the first subpopulation, which has determined to "have a difference" by a significant difference test in step S1, to validate the correctness as candidate biomarkers. The validation is performed exhaustively on all the biomarkers extracted as the first subpopulation, and biomarkers determined to be correct as candidate biomarkers are extracted as a second subpopulation. - The validation cohort is preferably selected from a cohort different from the discovery cohort. When there is only one cohort, the cohort may be divided into two groups and one of the groups may be used as a discovery cohort and the other as a validation cohort. To improve the generalization/versatile ability and/or application potentiality of the discriminator that will be finally generated, the validation cohort is preferably selected from a cohort different from the discovery cohort.
- The validation method is not limited as long as the correctness as candidate biomarkers can be validated. As a validation method, a meta-analysis, a Log-rank test or the like can be employed. Preferably, a meta-analysis is performed using a validation cohort different from the discovery cohort. The meta-analysis performs validation from hazard ratios and 95% confidence intervals by a Cox regression analysis. These analyses can be made using software such as Python (3.6.2).
- In the typical example shown in
FIG. 7 , multicenter combined breast cancer cohorts [Abdel-Fatah, T. M. A. et al. The Lancet. )], which are different from the discovery cohort, are used as a validation cohort to perform validation by a meta-analysis. - In this way, the
processing unit 101 can extract biomarkers validated to be correct as candidate biomarkers as a second subpopulation that is related more closely to an event that will occur in the body. - The second subpopulation of the typical example shown in
FIG. 7 is as shown in Table 1-1 and Table 1-2.[Table 1-1] Gene Name NCBI* Gene ID Gene Name NCBl* Gene ID Gene Name NCBl* Gene ID 1 ADHFE1 137872 41 DCAF16 54876 81 LEF1 51176 2 AMD1 262 42 DCTPP1 79077 82 LEPROTL1 23484 3 ANKRD29 147463 43 DEF6 50619 83 LRP11 84918 4 ANLN 54443 44 DERL1 79139 84 LTF 4057 5 AP5S1 55317 45 DHRS1 115817 85 MAL2 114569 6 APOBEC3F 200316 46 DIRAS3 9077 86 MAP4K1 11184 7 APOBEC3G 60489 47 EEF1G 1937 87 MAPT 4137 8 APOL3 80833 48 EGR3 1960 88 MARS 4141 9 APOOL 139322 49 ENOSF1 55556 89 MAX 4149 10 ARHGAP26 23092 50 ESRP1 54845 90 MITD1 129531 11 ARMC1 55156 51 EVA1C 59271 91 MMGT1 93380 12 ATP5F1B*** 506 52 EZR 7430 92 MRPL13 28998 13 ATP6V1C1 528 53 FAXDC2 10826 93 MTDH 92140 14 BEND5 79656 54 FKBP5 2289 94 MTFR1 9650 15 BTF3 689 55 FOXM1 2305 95 NDUFAF6 137682 16 BTG1 694 56 GARS 2617 96 NEFH 4744 17 C1RL 51279 57 GRHL2 79977 97 NFKBIA 4792 18 CARD10 29775 58 GSTM4 2948 98 NKAP 79576 19 CASP9 842 59 GSTO1 9446 99 NONO 4841 20 CCDC115 84317 60 GTF2IRD2B 389524 100 NR1H3 10062 21 CCDC24 149473 61 H6PD 9563 101 NSA2 10412 22 CCDC69 26112 62 HCCS 3052 102 NSMCE2 286053 23 CCNE1 898 63 HILPDA 29923 103 OARD1 221443 24 CCT2 10576 64 HMGB3 3149 104 PARG 8505 25 CCT4 10575 65 HNRNPA1L2 144983 105 PARP3 10039 26 CCT6A 908 66 HSP90AA1 3320 106 PCMT1 5110 27 CD24 100133941 67 HSPA2 3306 107 PDCD2 5134 28 CD48 962 68 IARS 3376 108 PGK1 5230 29 CD52 1043 69 IGF2R 3482 109 PHF7 51533 30 CD6 923 70 IP6K2 51447 110 PLAT 5327 31 CD74 972 71 IRF2 3660 111 PLEKHA4 57664 32 CDK8 1024 72 ITGA10 8515 112 PLXNB3 5365 33 CIR1 9541 73 JAK1 3716 113 PNRC2 55629 34 CIRBP 1153 74 KANSL2 54934 114 POP1 10940 35 COG8 84342 75 KDM4B 23030 115 PRKAB2 5565 36 COPS6 10980 76 KIF21A 55605 116 PSMD10 5716 37 CPT1A 1374 77 KRCC1 51315 117 PSME1 5720 38 CRK 1398 78 LAMA3 3909 118 PTGER3 5733 39 CYB561 1534 79 LAMB3 3914 119 PTK2 5747 40 CYP27A1 1593 80 LARP4B 23185 120 PYCARD 29108 *NCBI : National Center for Biotechnology Information
**The genes shown in bold italic letters belong to a third subpopulation.
***ATP5F1B is also referred to as ATP5B.[Table 1-2] Gene Name NCBI* Gene ID Gene Name NCBI* Gene ID 121 QPRT 23475 161 TPRG1 285386 122 RAB2A 5862 162 TPT1 7178 123 RAC2 5880 163 TRAF5 7188 124 RAD1 5810 164 TRAPPC12 51112 125 RAPGEFL1 51195 165 TRIM34 53840 126 RARRES3 5920 166 TRIM35 23087 127 RBBP8 5932 167 TRIM45 80263 128 REPS1 85021 168 TVP23C 201158 129 RILPL2 196383 169 UBA7 7318 130 RPF1 80135 170 UBE2A 7319 131 RPL11 6135 171 UBTF 7343 132 RPL14 9045 172 UBXN1 51035 133 RPS6KA1 6195 173 UBXN11 91544 134 RTN4IP1 84816 174 UTP23 84294 135 SAV1 60485 175 VBP1 7411 136 SCUBE2 57758 176 WLS 79971 137 SERPINA1 5265 177 YTHDF3 253943 138 SH3D21 79729 178 ZBED6CL 113763 139 SHISA5 51246 179 ZDHHC9 51114 140 SKP1 6500 180 ZFHX3 463 141 SLC35A2 7355 181 ZMYND10 51364 142 SLC7A5 8140 182 ZNF496 84838 143 SPATA7 55812 183 ZNF552 79818 144 SPOCK2 9806 184 ZNF671 79891 145 STC2 8614 146 STEAP2 261729 147 STK3 6788 148 STK39 27347 149 STRAP 11171 150 SURF4 6836 151 SUSD3 203328 152 TAPBPL 55080 153 TARS 6897 154 TBC1D10C 374403 155 THG1L 54974 156 TMEM229B 161145 157 TMEM65 157378 158 TMEM69 51249 159 TNFRSF14 8764 160 TNIP1 10318 *NCBI : National Center for Biotechnology Information
**The genes shown in bold italic letters belong to a third subpopulation. - The
processing unit 101 extracts a third subpopulation from the second subpopulation by machine learning and validation. The machine learning method is not limited as long as feature values can be extracted. Examples of the machine learning method include a random forest, a decision tree, a support vector regression, a support vector machine, a logistic analysis, a sparse logistic analysis, a deep learning and so on. Preferred is a random forest. The machine learning can be performed using a Python-based scikit-learn library or the like. - As shown in
FIG. 2 , by extracting feature values from training data, for example, for the biomarkers belonging to the second subpopulation extracted in step S2 ofFIG. 1 , the machine learning method extracts, according to the feature values, biomarkers that are related more closely to an event that will occur in the body from the second subpopulation as feature values (step S31). The feature values are values that represent the intensity of relation between the variation of the measured value of each biomarker and an event that will occur in the body. For example, when the machine learning is a random forest, feature values are extracted based on feature importance values calculated in the validation. In other words, by extracting a plurality of biomarkers in the descending order of the feature importance values, biomarkers that are related more closely to an event that will occur in the body can be extracted. Here, the plurality is not limited as long as it is two or more. For example, the plurality is intended to mean 3, 5, 10, 15, 20, 23, 25, 30, 40, 50, 100 or the like. - The training data may be the cohort used as a discovery cohort or the cohort used as a validation cohort in step S2, or may be a different cohort. To improve the generalization/versatile ability and/or application potentiality of the discriminator that will be finally generated, it is preferred to use a cohort different from the discovery cohort or the validation cohort used in step S2 as the training data.
- In the typical example shown in
FIG. 7 , the Whole METABRIC cohort [Pereira, B. et al. ) and Curtis, C. et al. Nature 486, 346-352, doi:10.1038/nature10983 (2012)] is used as the training data. - The cohort used for validation is preferably selected from a cohort different from the training data. When there is only one cohort, the cohort may be divided into two groups and one of the groups may be used as the training data and the other as a cohort for validation. Selection may be made from different cohorts. Preferably, the cohort used for validation is selected from a cohort different from the training data.
- Next, in step S32, as shown in
FIG. 2 , theprocessing unit 101 performs validation on the feature values extracted in step S31. The validation is repeated until feature values that are related most closely to an event that will occur in the body are found (step S33). In this way, feature values (biomarker group) that are related much more closely to an event that will occur in the body are extracted from the second subpopulation (step S34). - When a cohort selected from the same cohort as the training data is used for validation, a hold-out method, a cross-validation such as a leave-one-out cross-validation (LOOCV), a mixing matrix and so on can be employed as the validation method. Preferred is a cross-validation. As a cross-validation, for example, a 10-fold cross-validation or the like can be employed. These analyses can be conducted using Python (3.6.2) or the like.
- In the typical example shown in
FIG. 7 , a 10-fold cross-validation is used for validation. - In this way, the
processing unit 101 can extract a third subpopulation that is related more closely to an event that will occur in the body. - The genes extracted in the typical example shown in
FIG. 7 are 23 genes shown inFIG. 11-1a . - In
step 4, for the biomarkers belonging to the third subpopulation, the training data are input into a neural network to calculate a weight of each biomarker belonging to the third subpopulation (which may be represented by "Weight" or "wi," wherein i represents each biomarker) by a deep learning method. - The deep learning method is not limited as long as a weight of each biomarker can be calculated. Examples include a gradient descent method, a stochastic gradient method, a feedforward neural network, an autoencoder, an error propagation method, a convolutional neural network, a recurrent neural network, a Boltzmann machine and so on. Preferred is a gradient descent method. The deep learning can be performed using a Python-based TensorFlow library or the like.
- In the typical example shown in
FIG. 7 , a loss function by cross entropy of each gene is defined, and a weight "Gene_Weight" of each gene is calculated by a gradient descent method [Kourou, K., et al. Computational and )]. - The training data used in
step 4 may be the same as or different from the training data used instep 3. Also, the training data used instep 4 may be the cohort used as a discovery cohort or the cohort used as a validation cohort in step S2. - As shown in
Mathematical Formula 1, the discriminator is a function for multiplying the score of each biomarker belonging to the third subpopulation by the weight calculated by the deep learning and obtaining the sum of the products. - The score of each biomarker is a value that links the measured value of each biomarker belonging to the third subpopulation with an event that will occur in the body. The value to be linked is, for example, binary data such as "0" and "1." For example, when an event that will occur in the body is represented by a survival rate, for biomarkers that lead to a possibility that the prognosis will be poor when their measured values are higher than the median, "1" is given as a "Gene_Score" when the measured value of each biomarker is higher than the median and "0" is given as a "Gene_Score" when the measured value of each biomarker is lower than the median. For biomarkers that lead to a possibility that the prognosis will be poor when their measured values are lower than the median, "1" is given as a "Gene_Score" when the measured value of each biomarker is lower than the median, and "0" is given as a "Gene_Score" when the measured value of each biomarker is higher than the median. This aspect is hereinafter referred to as "score
pattern 1." - By inputting these scores into the discriminator, a weighed sum can be calculated. The weighed sum using the discriminator is referred to as molecular prognostic score (mPS).
- In the typical example shown in
FIG. 7 , the discriminator is the weighed sum of "Gene_Scores" of 23 genes shown inFIG. 11-1a in the breast cancer tissue of each patient. In other words, the discriminator is represented by the following formula.
(wherein w represents a "Gene_Weight," GS indicates a "Gene_Score," n is 23, i indicates each biomarker, and wi*GSi indicates the product of the weight and score of each biomarker. 23 indicates the 23 genes shown inFIG. 11-1a .). - When scores based on the
score pattern 1 are used, the mPS value exhibits a smaller value as the survival rate is better. Also, when scores based on thescore pattern 1 are used, the mPS value exhibits a larger value as the survival rate is poorer. - Also, as another aspect, when the event that will occur in the body is represented by, for example, a survival rate, for biomarkers that lead to a possibility that the prognosis will be poor when their measured values are higher than the median, "0" is given as a "Gene_Score" when the measured value of each biomarker is higher than the median and "1" is given as a "Gene_Score" when the measured value of each biomarker is lower than the median. For biomarkers that lead to a possibility that the prognosis will be poor when their measured values are lower than the median, "0" is given as a "Gene_Score" when the measured value of each biomarker is lower than the median and "1" is given as a "Gene_Score" when the measured value of each biomarker is higher than the median. This aspect is hereinafter referred to as "score
pattern 2." - When scores based on the
score pattern 2 are used, the mPS value exhibits a larger value as the survival rate is better. Also, when scores based on thescore pattern 2 are used, the mPS value exhibits a smaller value as the survival rate is poorer. - Here, the discriminator may be generated by performing step S4 on the measured values of the biomarkers in the second subpopulation without performing step S3 shown in
FIG. 1 . - The generated discriminator may be stored in a storage unit of each apparatus described later, or may be output from each output unit. Also, it may be stored in a storage medium described later, or may be network-transmitted via a communication I/
F 105. -
Step 5 is an optional step.Step 5 is a step of validating whether the discriminator generated instep 4 is applicable to any cohort divided into groups according to the type of the cohort, the subtypes of the disease, the age of the test subjects or the like. - The subtypes of the disease are, for example, clinical stage classification of cancer (A, B, C, D, E, F-I, and F-II shown in
FIG. 18a ), clinical stages (TNM classification for cancer; stages I, II, III, etc. for breast cancer), histopathological grades (poorly differentiated type, moderately-differentiated type, well-differentiated type, etc.), or histological types (invasive ductal carcinoma (IDC), invasive lobular carcinoma (ILC), mixed IDC and ILC (MDLC), etc. for breast cancer). - Grouping according to age or the like can divide the test subjects into, for example, a young group (younger than 50 years old), a mature group (not younger than 50 years old and younger than 70 years old) and a senior group (not younger than 70 years old).
- The generalization/versatile ability, the application potentiality and/or the like of the discriminator can be validated by statistically validating the correlation between the measured value of each biomarker and an event that will occur in the body for each cohort divided into groups. The method for obtaining a correlation is known.
- The generated discriminator may be stored in a storage medium such as a hard disk, a semiconductor memory device like a flash memory, an optical disc or the like. The format in which a program is stored in the storage medium is not limited as long as the
processing unit 101, a processing unit 201 or a processing unit 301 can read the program. The program is preferably stored in the storage medium in a non-volatile manner. - The generated discriminator can be used to evaluate an event that will occur in the body of a test subject.
- This disclosure relates to an
apparatus 10 for generating a discriminator (also referred to as "discriminator generation apparatus 10"). Thediscriminator generation apparatus 10 includes at least theprocessing unit 101, and theprocessing unit 101 generates a discriminator mentioned in theabove section 1 according to the steps described in the above section 1.,FIG. 1 orFIG. 2 . -
FIG. 3 shows the hardware configuration of thediscriminator generation apparatus 10.FIG. 4 shows a block diagram of thediscriminator generation apparatus 10. Thediscriminator generation apparatus 10 may be connected to aninput unit 111, anoutput unit 112 and astorage medium 113. - In the
discriminator generation apparatus 10, theprocessing unit 101, amemory 102, a ROM (read only memory) 103, astorage device 104, a communication interface (I/F) 105, an input interface (I/F) 106, an output interface (I/F) 107 and a media interface (I/F) 108 are data-communicably connected to one another by abus 109. Thememory 102 and thestorage device 104 may be collectively referred to simply as "storage unit." The storage unit stores the generated discriminator, a reference values or reference ranges for mPS, measured values of biomarkers of each patient, and an mPS of each patient in a volatile or non-volatile manner. - The
processing unit 101 is a CPU of thediscriminator generation apparatus 10. Theprocessing unit 101 may be a GPU. When theprocessing unit 101 executes a computer program stored in thestorage device 104 or theROM 103 and processes acquired data, thediscriminator generation apparatus 10 functions. - The
ROM 103 is constituted of a mask ROM, a PROM, an EPROM, an EEPROM or the like, and stores computer programs that are executed by theprocessing unit 101 and data used therefor. Theprocessing unit 101 may be anMPU 101. TheROM 103 stores a boot program that is executed by theprocessing unit 101 when thediscriminator generation apparatus 10 is activated and programs and settings related to the operation of the hardware of thediscriminator generation apparatus 10. - The
memory 102 is constituted of a RAM (Random access memory) such as an SRAM or DRAM. Thememory 102 is used to read out computer programs stored in theROM 103 and thestorage device 104. Also, thememory 102 is utilized as a workspace when theprocessing unit 101 executes these computer programs. - The
storage device 104 is constituted of a hard disk, a semiconductor memory device like a flash memory, an optical disc or the like. In thestorage device 104, various computer programs to be executed by theprocessing unit 101 such as operating systems and application programs and various setting data used for execution of the computer programs are stored. Specifically, thestorage device 104 stores the reference value and so on in a non-volatile manner. - The communication I/
F 105 is constituted of a serial interface such as a USB, IEEE1394 or RS-232C, a parallel interface such as an SCSI, IDE or IEEE1284, an analog interface consisting of a D/A converter, A/D converter or the like, a network interface controller (NIC) and so on. Under the control of theprocessing unit 101, the communication I/F 105 receives data from ameasurement unit 30 or other external devices and, when necessary, sends or displays information stored in or generated by thediscriminator generation apparatus 10 to or on themeasurement unit 30 or the outside. The communication I/F 105 may communicate with themeasurement unit 30 or other external devices via a network. - The input I/
F 106 is constituted, for example, of a serial interface such as a USB, IEEE1394 or RS-232C, a parallel interface such as an SCSI, IDE or IEEE1284, an analog interface consisting of a D/A converter, A/D converter or the like and so on. The input I/F 106 accepts text input, clicks, voice input or the like from theinput unit 111. The accepted input is stored in thememory 102 or thestorage device 104. - The
input unit 111 is constituted of a touch panel, a keyboard, a mouse, a pen tablet, a microphone or the like, and performs text or voice input into thediscriminator generation apparatus 10. Theinput unit 111 may be connected from the outside of thediscriminator generation apparatus 10, or may be integrated with thediscriminator generation apparatus 10. - The output I/
F 107 is constituted, for example, of an interface similar to that for the input I/F 106. The output I/F 107 outputs information generated by theprocessing unit 101 to theoutput unit 112. The output I/F 107 outputs information generated by theprocessing unit 101 and stored in thestorage device 104 to theoutput unit 112. - The
output unit 112 is constituted, for example, of a display, a printer or the like, and displays measurement results transmitted from themeasurement unit 30, various operation windows, results of analyses and so on in thediscriminator generation apparatus 10. - The media I/
F 108 reads out, for example, application software or the like stored in thestorage medium 113. The read-out application software or the like is stored in thememory 102 or thestorage device 104. Also, the media I/F 108 writes information generated by theprocessing unit 101 into thestorage medium 113. The media I/F 108 writes information generated by theprocessing unit 101 and stored in thestorage device 104 into thestorage medium 113. - The
storage medium 113 is constituted of a flexible disk, a CD-ROM, a DVD-ROM or the like. Thestorage medium 113 is connected to the media I/F 108 by a flexible disk drive, a CD-ROM drive, a DVD-ROM drive or the like. An application program that is used by a computer to execute an operation or the like may be stored in thestorage medium 113. - The
processing unit 101 may acquire application software or various settings necessary for control of thediscriminator generation apparatus 10 via a network instead of reading those out of theROM 103 or thestorage device 104. When the application program is stored in a storage device of a server computer on a network, it is also possible for thediscriminator generation apparatus 10 to access this server computer to download a computer program and store it into theROM 103 or thestorage device 104. - Also, an operation system that provides a graphical user interface environment such as Windows (trademark) manufactured and sold by Microsoft, USA or the like has been installed in the
ROM 103 or thestorage device 104. An application program according to a second embodiment shall operate on the operating system. In other words, thediscriminator generation apparatus 10 may be a personal computer or the like. - A certain embodiment of this disclosure relates to a computer program for generating a discriminator. The computer program causes the
processing unit 101 to execute step S1, step S2 and step S4, preferably steps S1 to S5, described inFIG. 1 , and steps S31 to S34 described inFIG. 2 . - In addition, a certain embodiment of this disclosure relates to a storage medium in which the computer program has been stored. In other words, the computer program is stored in a storage medium such as a hard disk, a semiconductor memory device like a flash memory, an optical disc or the like. The format in which the program is stored in the storage medium is not limited as long as the
processing unit 101 can read the program. The program is preferably stored in the storage medium in a non-volatile manner. - A certain embodiment of this disclosure relates to a method for predicting a survival rate of a patient. In this embodiment, the discriminator generated by the method in the
above section 1. is used to predict a survival rate of a patient after a predetermined period of time. The disease the patient is suffering from is not particularly limited, but the diseases listed in the above section 1.(1) can be incorporated here. Preferably, the disease is cancer, and more preferably breast cancer. - The survival rate of a patient after a predetermined period of time can be predicted by comparing the mPS value of the patient with a reference value. When the scores input into the discriminator are in the
score pattern 1, specifically, the mPS value of each patient obtained by the discriminator is compared with its reference value. Then, when the mPS of the patient is larger than the reference value, it can be determined that the survival rate of the patient after a predetermined period of time, preferably after 10 or 20 years, will be poor. Also, when the mPS of the patient is equal to or smaller than the reference value, it can be determined that the survival rate of the patient after a predetermined period of time, preferably after 10 or 20 years, will be good. When the scores input into the discriminator are in thescore pattern 2, specifically, the mPS value of each patient obtained by the discriminator is compared with its reference value. Then, when the mPS of the patient is smaller than the reference value, it can be determined that the survival rate of the patient after a predetermined period of time, preferably after 10 or 20 years, will be poor. Also, when the mPS of the patient is equal to or larger than the reference value, it can be determined that the survival rate of the patient after a predetermined period of time, preferably after 10 or 20 years, will be good. - This embodiment may include a step of acquiring measured values of biomarkers from a specimen containing tissue or cells taken from a lesion site of the disease in the patient, or a specimen containing substances in the body that reflect the state of the disease such as blood samples (including whole blood, plasma, serum and so on), urine, cerebrospinal fluid, ascites, pleural effusion and so on. Measured values of biomarkers can be acquired by a known method. When the biomarkers are genes, measured values of the biomarkers can be acquired by, for example, a quantitative RT-PCR method, an RNA-Seq method or the like.
- This embodiment may include a step of calculating an mPS value of each patient using a discriminator. The measured values of biomarkers of a group of genes in the second subpopulation or the third subpopulation obtained for each patient are binarized according to the method described in the
above section 1. to determine the score of each gene. The processing unit 201 inputs the score of each gene into a discriminator stored in the storage unit to calculate the mPS of each patient. - The reference value is not limited as long as it is a value with which it can be determined that the survival rate of the patient after a predetermined period of time will be good and/or poor. For example, the reference value can be obtained from the mPS of a patient whose survival rate after a predetermined period of time is good or the mPS of a patient whose survival rate after a predetermined period of time is poor. Also, as another aspect, the reference value may be the upper limit of the mPSs in a group of patients whose survival rate after a predetermined period of time is good or the lower limit of the mPSs in a group of patients whose survival rate after a predetermined period of time is poor. Also, as a yet another aspect, the reference value may be the median, average, mode or the like of a plurality of mPSs in a population including both a group of patients whose survival rate after a predetermined period of time is good and a group of patients whose survival rate after a predetermined period of time is poor. Alternatively, the reference value may be calculated by an ROC curve (Receiver Operatorating Characteristic curve), a discriminant analysis method, a mode method, a Kittler method, a 3σ method, a p-tile method or the like. It is preferred that the reference value has been determined in advance.
- In this embodiment, for the terms used in the
above section 1. such as discriminator, patient, cancer, survival rate, predetermined period, mPS and so on, the description in theabove section 1. is incorporated here. - This disclosure relates to an
apparatus 20 for predicting a survival rate of a patient (also referred to as survival rate prediction apparatus 20). The survivalrate prediction apparatus 20 includes at least the processing unit 201. Because the configuration of the survivalrate prediction apparatus 20 is the same as that of thediscriminator generation apparatus 10, the description in theabove section 2. andFIG. 3 and FIG. 4 are incorporated here. - In
FIG. 3 or FIG. 4 , thediscriminator generation apparatus 10, theprocessing unit 101, thememory 102, theROM 103, thestorage device 104, the communication interface (I/F) 105, the input interface (I/F) 106, the output interface (I/F) 107, the media interface (I/F) 108, thebus 109, theinput unit 111, theoutput unit 112 and thestorage medium 113 are replaced with a processing unit 201, amemory 202, aROM 203, astorage device 204, a communication interface (I/F) 205, an input interface (I/F) 206, an output interface (I/F) 207, a media interface (I/F) 208, abus 209, an input unit 211, anoutput unit 212 and a storage medium 213, respectively. Referring toFIG. 5 , the operation of the survivalrate prediction apparatus 20 is described. Here, a case where the scores that are input into the discriminator are in thescore pattern 1 is described as an example. - First, in step S41, the processing unit 201 acquires measured values of biomarkers included in the second subpopulation or the third subpopulation input through the input unit 211 by a user for each cancer patient. Alternatively, the processing unit 201 acquires measured values of biomarkers included in the second subpopulation or the third subpopulation from a network through the communication I/F 205 for each patient according to an instruction to start processing input through the input unit 211 by a user. The processing unit 201 binarizes the measured value of each biomarker acquired according to the method described in the
above section 1. to determine a score of each biomarker. The processing unit 201 inputs the score of each gene into a discriminator stored in the storage unit to calculate an mPS of each patient. - Next, in step S42, the processing unit 201 compares the mPS of each cancer patient with a reference value for mPS stored in the storage unit. In step S43, the processing unit 201 determines whether or not the mPS of each patient is larger than the reference value.
- If the determination in step S43 is YES, it is determined that the survival rate of the patient after a predetermined period of time will be poor (step S44). If the determination in step S43 is NO, it is determined that the survival rate of the patient after a predetermined period of time will be good (step S45).
- When the scores that are input into the discriminator are in the
score pattern 2, if the determination in step S43 is YES, it is determined that the survival rate of the patient within or after a predetermined period of time will be good in step S44. If the determination in step S43 is NO, it is determined that the survival rate of the patient within or after a predetermined period of time will be poor in step S45. - Next, in step S46, the processing unit 201 outputs the determination result to the
output unit 212. Although not shown, the processing unit 201 may store the determination result in thestorage device 204. - In this embodiment, for the description of the terms in common with those in the above sections 1., 2. and 4., the description in the above sections 1., 2. and 4. is incorporated here.
- A certain embodiment of this disclosure relates to a computer program for predicting a survival rate of a cancer patient.
- The computer program causes the processing unit 201 to execute steps S41 to S46 described in
FIG. 5 . - In addition, a certain embodiment of this disclosure relates to a storage medium in which the computer program has been stored. In other words, the computer program is stored in a storage medium such as a hard disk, a semiconductor memory device like a flash memory, an optical disc or the like. The format in which the program is stored in the storage medium is not limited as long as the processing unit 201 can read the program. The program is preferably stored in the storage medium in a non-volatile manner.
- A certain embodiment of this disclosure relates to a method for assisting stratification of cancer patients based on their survival rates.
- In this embodiment, mPSs calculated with a discriminator generated as described in the
above section 1. are used to assist stratification of cancer patients based on survival rates of the cancer patients after a predetermined period of time. Specifically, cancer patients are stratified by comparing the mPS value of each cancer patient obtained by the discriminator with its reference ranges to determine the bin into which the mPS value of each cancer patient is categorized. - Specifically, this embodiment may include a step of acquiring measured values of biomarkers from a specimen containing tissue or cells taken from a lesion site of the disease in the cancer patient, or a specimen containing substances in the body that reflect the state of the disease such as blood samples (including whole blood, plasma, serum and so on), urine, cerebrospinal fluid, ascites, pleural effusion and so on. Measured values of biomarkers can be acquired by a known method. When the biomarkers are genes, measured values of the biomarkers can be acquired by, for example, a quantitative RT-PCR method, an RNA-Seq method or the like. Also, this embodiment may include a step of calculating an mPS value of each patient using a discriminator. The measured values of biomarkers in the second subpopulation or the third subpopulation obtained for each patient are binarized according to the method described in the
above section 1. to determine the score of each gene. The processing unit 301 inputs the score of each gene into a discriminator stored in the storage unit to calculate the mPS of each patient. - For example, the reference ranges can be set to mPS=0 to 5 for a first bin, mPS=5 to 11 for a second bin, mPS=11 to 25 for a third bin, mPS=25 to 36 for a fourth bin, mPS=36 to 45 for a fifth bin, and mPS=45 to 50 for a sixth bin. In the case of the
score pattern 1, because the survival rate after a predetermined period of time is poorer from the first bin to the sixth bin, the survival rate of each patient can be predicted in a stepwise fashion. In the case of thescore pattern 2, because the survival rate after a predetermined period of time is better from the first bin to the sixth bin, the survival rate of each patient can be predicted in a stepwise fashion. - When the disease is cancer, the reference ranges may have been determined according to a category such as the histological type, clinical stage or pathological tissue grade, the age group or the like. In this case, the method for assisting stratification further includes acquiring information on the histological type, clinical stage or pathological tissue grade of the cancer and the age group according to the category. A processing unit 301 can acquire these pieces of information from an input through an input unit 311 by a user, linkage with an electronic health record or the like. It is preferred that the reference ranges have been determined in advance.
- In this embodiment, for the terms used in the
above section 1. such as discriminator, cancer, survival rate, predetermined period, mPS, histological type, subtype of cancer, clinical stage, pathological tissue grade, age group and so on, the description in theabove section 1. is incorporated here. - This disclosure relates to an
apparatus 30 for stratifying patients (also referred to as stratification apparatus 30). Thestratification apparatus 30 includes at least the processing unit 301. Because the configuration of thestratification apparatus 30 is the same as that of thediscriminator generation apparatus 10, the description in theabove section 2. andFIG. 3 and FIG. 4 are incorporated here. - In
FIG. 3 or FIG. 4 , thediscriminator generation apparatus 10, theprocessing unit 101, thememory 102, theROM 103, thestorage device 104, the communication interface (I/F) 105, the input interface (I/F) 106, the output interface (I/F)107, the media interface (I/F) 108, thebus 109, theinput unit 111, theoutput unit 112 and thestorage medium 113 are replaced with a processing unit 301, a memory 302, aROM 303, a storage device 304, a communication interface (I/F) 305, an input interface (I/F) 306, an output interface (I/F) 307, a media interface (I/F) 308, abus 309, an input unit 311, an output unit 312 and astorage medium 313, respectively. - Referring to
FIG. 6 , the operation of thestratification apparatus 30 is described. - First, in step S51, the processing unit 301 acquires measured values of biomarkers included in the second subpopulation or the third subpopulation input through the input unit 311 by a user for each patient. Alternatively, the processing unit 301 acquires measured values of biomarkers included in the second subpopulation or the third subpopulation from a network through the communication I/
F 305 for each patient according to an instruction to start processing input through the input unit 311 by a user. The processing unit 301 binarizes the measured value of each biomarker acquired according to the method described in theabove section 1. to determine a score of each biomarker. The processing unit 301 inputs the score of each gene into a discriminator stored in the storage unit to calculate an mPS of each patient. - Next, in step S52, the processing unit 301 compares the mPS of each patient with reference ranges for mPS stored in a storage unit. In step S53, it is determined that the patient has a survival rate of the bin to which the mPS of the patient belongs.
- Next, in step S54, the processing unit 301 outputs the determination result to the output unit 312. Although not shown, the processing unit 301 may store the determination result in the storage device 304.
- In this embodiment, for the description of the terms in common with those in the above sections 1., 2. and 7., the description in the above sections 1., 2. and 7. is incorporated here.
- A certain embodiment of this disclosure relates to a computer program for stratifying cancer patients.
- The computer program causes the processing unit 301 to execute steps S51 to S54 described in
FIG. 6 . - In addition, a certain embodiment of this disclosure relates to a storage medium in which the computer program has been stored. In other words, the computer program is stored in a storage medium such as a hard disk, a semiconductor memory device like a flash memory, an optical disc or the like. The format in which the program is stored in the storage medium is not limited as long as the processing unit 301 can read the program. The program is preferably stored in the storage medium in a non-volatile manner.
- A certain embodiment of this disclosure relates to the use of at least one gene selected from the genes described in Table 1-1 and Table 1-2 as a biomarker for predicting the survival rate of a breast cancer patient. Preferably, the biomarker does not include an aspect consisting only of ANLN, FOXM1, RBBP8 or a combination of these genes. More preferably, at least one selected from the group consisting of FOXM1, CPT1A, GARS, MARS, UTP23, ANLN, HMGB3, ATP5B, APOOL, CYB561, GRHL2, ESRP1, EZR, RBBP8, CIRBP, PTGER3, LAMA3, OARD1, ANKRD29, EGR3, DIRAS3, MITD1 and LAMB3 (with the proviso that an aspect consisting only of ANLN, FOXM1, RBBP8 or a combination of these genes is not included) is used as a biomarker for predicting a survival rate of a breast cancer patient. The expression level of an mRNA and/or a protein derived from at least one gene selected from the group of genes is used as a biomarker.
- A certain embodiment of this disclosure relates to an inspection reagent used to predict a survival rate of a breast cancer patient that contains a probe, primer or antibody for detecting the expression level of an mRNA or protein derived from at least one gene selected from the genes described in Table 1-1 and Table 1-2. Preferably, an aspect consisting only of ANLN, FOXM1, RBBP8 or a combination of these genes is not included. More preferred is at least one selected from the group consisting of FOXM1, CPT1A, GARS, MARS, UTP23, ANLN, HMGB3, ATP5B, APOOL, CYB561, GRHL2, ESRP1, EZR, RBBP8, CIRBP, PTGER3, LAMA3, OARD1, ANKRD29, EGR3, DIRAS3, MITD1 and LAMB3 (with the proviso that an aspect consisting only of ANLN, FOXM1, RBBP8 or a combination of these genes is not included). This inspection reagent is not limited as long as it can be used in an RT-PCR method, a microarray method, an RNA-Seq method, an ELISA method, a western blotting method or the like.
- The inspection reagent may constitute an inspection kit used to predict a survival rate of a breast cancer patient that includes the inspection reagent, an enzyme for reacting the inspection reagent, a reaction liquid in which a hybridization or antigen-antibody reaction is carried out, an instruction manual or a printed medium showing the URL or QR code (trademark) of a Web page that provides the instruction manual.
- Examples are hereinafter shown to describe this disclosure in more detail. However, this disclosure should not be construed as being limited to the examples.
- A plurality of known breast cancer cohorts was used to generate a discriminator. There were few patients with metastasis from the cohorts used in this study.
- The TCGA cohort was used as a discovery cohort. As the TCGA cohort, the GISTEC-based copy number alterrarions (CNAs) cohort [n=958; Curtis, C. et al. Nature 486, 346-352, doi:10.1038/nature10983 (2012); hereinafter referred to as "TCGA cohort"] of the TCGA breast cancer dataset was downloaded from cBioPortal [Cerami, E. et al. Cancer Discov. 2, 401-404, doi:10.1158/2159-8290.cd-12-0095 (2012)]. The GISTEC can be referred to Mermel, C. H. et al. Genome Biol. 12, R41, doi:10.1186/gb-2011-12-4-r41(2011). In cBioPortal, the expression levels of mRNAs derived from each gene in breast cancer tissue (result of analysis by RNA-seq) are registered.
- As a validation cohort for use in
step 2, multicenter combined breast cancer cohorts [n=5844; Abdel-Fatah, T. M. A. et al. The Lancet. ); hereinafter referred to as "multicenter cohorts") were used. - As training data for use in
step 3, the Whole METABRIC cohort [n=1904; Pereira, B. et al. ) and Curtis, C. et al. Nature 486, 346-352, doi:10.1038/nature10983 (2012); hereinafter referred to as "METABRIC cohort"] was used. The METABRIC cohort is independent of the TCGA cohort. - The breakdown of each cohort is shown in Table 2.
[Table 2] TCGA METABRIC Age Median (IQR) 59 (49-68) 61.8 (51.4-70.6) PAM50 LumA 415 679 LumB 176 461 HER2 65 220 Claudin-low 0 199 Normal-like 25 140 Basal 136 199 ONCOTREE IDC 643 1500 ILC 167 141 MDLC 26 87 Clinical Stage I 157 475 II 545 800 III 220 115 IV 15 9 NPI Excellent n.d. 163 Good n.d. 477 Moderate I n.d. 662 Moderate II n.d. 408 Poor n.d. 194 - A list of human genes was acquired from HUGO Gene Nomenclature Committee (HGNC).
- For download of data from cBioPortal, CGDS-R package and Web APIs provided by cBioPortal were used. For a random forest approach of machine learning, a Python-based scikit-learn library with parameters defaulted except n_estimators (= 500) and max_depth (= 10) was used. A Python-based TensorFlow library was also used for a neural network analysis. For other analyses, Python (3.6.2) established in Anaconda distribution and written in a custom script was used.
- Kaplan-Meier plots were created using R (survival package), and validated using Python (lifelines package). As a cutoff value for dividing a low expression group and a high expression group for each gene, the median was used. In this example, the low expression may be represented by a superscript "low" and the high expression by a superscript "high." For validation of the molecular prognostic score (mPS), the data were truncated at 10 years unless otherwise specified. The survival period was from the date of diagnosis to the date of death except for the meta-analysis shown in
FIG. 8e . A Log-rank test was conducted to compare the survival rates. For meta-analysis, the R survival package was used to estimate hazard ratios (HRs) and their 95% confidence intervals (CIs) with Cox regression. The presence or absence of a significant difference was determined at a two-sided p-value of 0.05 except for the discovery cohort (FIG. 8 ), and the cutoff was set to 0.01 in order to reduce the number of candidate genes. -
FIG. 7 shows an outline of the generation of a discriminator for predicting the prognosis of cancer from multiple cohorts. - The method for generating a discriminator roughly includes the following five steps.
- Step 1: Extraction of candidate genes
- Step 2: Validation of candidate genes
- Step 3: Extraction of feature values by machine learning
- Step 4: Construction of a discriminator by deep learning
- Step 5: Validation of discriminator
- Each step is described.
- In
step 1, the TCGA cohort was downloaded, and gene candidates that are related to the 10-year survival rate of breast cancer patients were explored based on the number of reads (expression levels) of these RNAs. The median age in this discovery cohort was 59 years old (IQR 49-68). - For each gene, the cohort was divided into two groups (a low expression group and a high expression group) at the median of the RNA read number. Then, survival curves for 10 years were generated for all genes by Kaplan-Meier Plots of the low expression group and the high expression group.
- Next, a significant difference by a Log-rank test was obtained for the survival curves, and candidate genes possibly related to a poor survival rate were extracted based on the p-value. As a result, 286 genes were extracted as candidates.
FIGs. 8a, 8b, 8c and 8d show Kaplan-Meier Plots of PGK1, TMEM65, BEND5, and ENOSF1, respectively, as examples of candidates genes. PGK1 and TMEM65 are examples in which the survival rate in breast cancer was worse in the high expression group than in the low expression group. BEND5 and ENOSF1 are examples in which the survival rate in breast cancer was worse in the low expression group than in the high expression group. InFIGs. 8a, 8b, 8c and 8d , the symbol H indicates the high expression group and the symbol L indicates the low expression group. - In
step 2, the 286 genes picked up by a Log-rank test were validated by a meta-analysis using the multicenter cohorts as validation cohorts, and 184 genes were further extracted as candidate genes (FIG. 8e ). Among the extracted genes, TMEM65 and RILPL2 showed the highest HR expression level (FIG. 9-1a ) and the lowest HR expression level (FIG. 9-1b ), respectively, in the multicenter cohorts, and were genes that are considered to be most closely related to the prognosis of breast cancer. These genes have not been addressed neither in basic cancer studies nor in clinical cancer studies. - A combination of genes that are considered to be second most closely related to the prognosis of breast cancer is that of TMEM65high and DCTPP1high, which was observed in 244 patients in the TCGA cohort. In the cohort having an expression pattern of this combination, the survival rate was poor (
FIG. 9-2c : HR=2.971). - Also, the cohort having an expression pattern of a combination of UBA7low and ENOSF1low, which was observed in 272 patients in the TCGA cohort, also had a poor survival rate (
FIG. 9-2d : HR=3.109). The HRs of other genes are shown inFIG. 10-1 toFIG. 10-4 . - In
step 3, feature values were extracted by a random forest for the 184 genes extracted instep 2 to extract genes that are related more closely to the survival rate of breast cancer. As training data, a cohort with n=952 extracted at random from the METABRIC cohort was used. The result obtained by a random forest was validated by a cross-validation. In this way, the 23 genes shown inFIG. 11-1a were selected as predictive genes for predicting a 10-year survival rate of breast cancer. 13 genes out of the 23 genes may lead to a poor prognosis when their expression is higher than the median and 10 genes may lead to a poor prognosis when their expression is lower than the median. - In
step 4, a neural network was used to calculate weights of the 23 genes extracted instep 3. As training data, a cohort with n=952 extracted at random from the METABRIC cohort, which was also used instep 3, was used. By deep learning with a neural network using the training data, a loss function of cross entropy of each gene was defined, and a weight of each gene "Gene_Weight" was calculated by a gradient descent method [FIG. 12 : Kourou, K., et al. Computational and )]. - To link the expression levels of the 23 genes shown in
FIG. 11-1a with the prognosis and score it, "Gene Scores" were set. Specifically, for genes that may lead to a poor prognosis when their expression is higher than the median, "1" is given as a "Gene_Score" when the expression of each gene in the breast cancer tissue of the patient is higher than the median, and "0" is given as a "Gene_Score" when the expression of each gene in the breast cancer tissue of the patient is lower than the median. For genes that may lead to a poor prognosis when their expression is lower than the median, "1" is given as a "Gene_Score" when the expression of each gene in the breast cancer tissue of the patient is lower than the median, and "0" is given as a "Gene_Score" when the expression of each gene in the breast cancer tissue of the patient is higher than the median. - Next, a discriminator for scoring the prognosis of the breast cancer of each patient based on the expression levels of the 23 genes shown in
FIG. 11-1a is established. In this specification, the score determined using the discriminator is referred to as "molecular prognostic score (mPS)." - The discriminator is a weighed sum of the "Gene_Scores" of the 23 genes shown in
FIG. 11-1a in the breast cancer tissue of each patient. In other words, it is represented by the following formula.
(wherein w represents a "Gene_Weight," GS indicates a "Gene_Score," n is 23, i indicates each gene, and wi*GSi represents the product of the weight and score of each biomarker. 23 indicates the 23 genes shown inFIG. 11-1a .). - In this weighed sum, the "Gene_Weight" was set such that the mPS falls within the range of 0 to 50 (
FIG. 11-1a ). The distribution of mPSs in the METABRIC cohort is shown inFIG. 11-2b . The mPSs had an average of 24.973, an interquartile range of 15.915-34.030, and a standard deviation of 11.297. -
FIG. 11-2c shows the stage classification of breast cancer and the distribution of cohort in each of six bins into which the mPS range of 0 to 50 is divided. The bins include a first bin with an mPS=0 to 5 (hereinafter represented by a symbol "1st" in the drawings), a second bin with an mPS=5 to 11 (hereinafter represented by a symbol "2nd" in the drawing), a third bin with an mPS=11 to 25 (hereinafter represented by a symbol "3rd" in the drawings), a fourth bin with an mPS=25 to 36 (hereinafter represented by a symbol "4th" in the drawings), a fifth bin with a mPS=36 to 45 (hereinafter represented by a symbol "5th" in the drawings), and a sixth bin with an mPS=45 to 50 (hereinafter represented by a symbol "6th" in the drawings). InFIG. 11-2c , the symbol S1 indicates breast cancer stage I, the symbol S2 indicates breast cancer stage II, and the symbol S3 indicates breast cancer stage III. - As shown in
FIG. 11-2c , the mPS exhibited a good correlation with the clinical stage. -
FIG. 11-3d shows the survival rates of the cohorts belonging to each bin of the first to sixth bins of mPS of the METABRIC cohort.FIG. 11-3e shows the survival rates of the cohorts belonging to each bin of the first to sixth bins of mPS of the TCGA cohort. In both cohorts, the mPS can stratify the survival rates. It was shown that the mPS can stratify a breast cancer cohort according to the survival rate even without clinical information. In addition, because a cohort can be stratified regardless of the type of the cohort, it was shown that the discriminator has a high generalization/versatile ability. - Also, because the discriminator shown by
Mathematical Formula 3 is generated using information from databases that are all known, it is believed that a discriminator can be generated for any cancer for which a database exists by a method similar to that used in this study. - In order to validate to which breast cancer subset the discriminator (Mathematical Formula 3) is applicable, the following examination was performed.
- Breast cancer is categorized into Luminal A (LumA), Luminal B (LumB), HER2-enriched, Claudin-low, Normal-like, and Basal-like subtypes based on PAM50 intrinsic subtypes. Thus, in each group of a cohort categorized according to each breast cancer subtype, it was examined whether the discriminator can stratify the cohort according to the survival rate. The results are shown in
FIG. 13-1a : METABRIC cohort·HER2-enriched (n=220),FIG. 13-1b : METABRIC cohort·Claudin-low (n=199), andFIG. 13-2c : METABRIC cohort·Normal-like (n=140). Even in HER2-enriched, Claudin-low, and Normal-like subtypes, the mPS exhibited a good correlation with the survival rate. This indicates that the discriminator has a possibility of being applicable to various breast cancer subtypes. - Also, in the treatment of breast cancer, the therapeutic choice for a pre-menopause cohort, e.g. younger than 50 years old and the therapeutic choice for an elder cohort, e.g. older than 70 years old may be different. Thus, a cohort is categorized according to the age group and it was examined whether the discriminator can stratify a cohort according to the survival rate using the METABRIC cohort. As shown in
FIG. 13-2d : METABRIC cohort·< 50 years old,FIG. 14a : METABRIC cohort·50s and 60s, andFIG. 14b : METABRIC cohort·older than 70 years old, the mPS also exhibited a correlation with the survival rate in a cohort younger than 50 years old, a cohort in their 50s and 60s, and an elder cohort (not younger than 70 years old). In addition, the 20-year survival rate was tracked for the cohort younger than 50 years old to examine whether the discriminator can stratify a cohort according to the survival rate. As shown inFIG. 14c : METABRIC, younger than 50 years (n=411), a cohort with a high mPS value has a poorer prognosis than a cohort with a low mPS value in the 20-year survival rate. This indicates that the discriminator can precisely stratify cohorts of various age groups even when the follow-up period is extended. - In histological categorization of breast cancer subtypes, most breast cancer tissue is categorized as invasive ductal carcinoma (IDC). As shown in
FIG. 15a : METABRIC, IDC (n=1,500), the mPS exhibited a good correlation with the survival rate even in a cohort of invasive ductal carcinoma. The second most frequent histological subtype of breast cancer is invasive lobular carcinoma (ILC) and mixed IDC and ILC (MDLC). ILC and MDLC are totally different from IDC in a histopathological sense. Thus, the application potentiality of the discriminator was examined for cohorts of these subtypes. As shown inFIG. 13-3e : METABRIC, ILC (n=141) andFIG. 15b : METABRIC, MDLC (n=87), the mPS also exhibited a good correlation with the survival rate in an ILC cohort and in an MDLC cohort. This indicates that the discriminator has a possibility of being applicable to various histopathological subtypes of breast cancer. - Histological subtypes of breast cancer are also categorized according to the malignancy diagnosed from histological appearance. The malignancy is divided into three grades depending on the degree of differentiation of cells constituting the cancer tissue: G1 (Grade 1: well differentiated), G2 (Grade 2: moderately differentiated) and G3 (Grade 3: poorly differentiated). Thus, a cohort was categorized according to these grades, and the correlation between the mPS and the survival rate was examined for the cohort of each grade after the categorization. The results are shown in
FIG. 15-2c : METABRIC, Grade 1 (n=165),FIG. 13-3f : METABRIC, Grade 2 (n=740) andFIG. 15-2d : METABRIC, Grade 3 (n=927). The mPS was well-correlated with the survival rate in all the grades. This indicates that the discriminator has a possibility of being applicable to various grades of breast cancer. - In general, the TNM categorization is applied to categorization showing the degree of progression (stage) of cancer not only in the case of breast cancer. However, the TNM categorization is a method for categorizing the degree of progression of cancer based on information such as histological appearance, metastasis in lymph nodes and so on regardless of the various subtypes of cancer as described above. The TNM categorization categorizes breast cancer tissue into stages I to VI by an academically determined method. For example, even in a stage I patient whose degree of progression of cancer is determined to be lowest by the TNM categorization, the result may be different from the grade of malignancy of cancer tissue because the degree of progression is determined based on the TNM categorization criteria independently of each subtype as described above.
- Thus, it is examined what relationship is there between the TNM categorization and the mPS.
- In the METABRIC cohort, a cohort with n=475 was categorized into stage I. In each patient with a survival rate of more than 10 years among patients belonging to stage I, about 90% of patients showed an mPS of lower than 11 (a good 10-year survival rate). However, the other patients had an mPS of higher than 25 and, consequently, a low 10-year survival rate even though they were categorized into stage I by the TNM categorization [
FIG. 17-1a : METABRIC, Stage I]. - In the METABRIC cohorts, a cohort with n=800 was categorized into stage II. Among patients belonging to stage II, patients with an mPS below 5 showed a very good survival rate. On the other hand, patients with an mPS of above 45 had a poor survival rate [
FIG. 17-1b : METABRIC, Stage II]. - In the METABRIC cohorts, a cohort with n=115 was categorized into stage III. Among patients belonging to stage III, patients with an mPS below 25 showed a relatively good survival rate. On the other hand, patients with an mPS above 25 had a poor survival rate [
FIG. 17-2c : METABRIC, Stage III]. - Similar examination was performed on the TCGA cohort. In the TCGA cohort, a cohort with n=545 was categorized into stage II, and showed a similar tendency to that of the METABRIC cohort [
FIG. 17-2d : TCGA, Stage II]. - For the TCGA cohort, a cohort including all of stages I-III was divided into three bins according to the mPS (first bin: mPS 0-11, second bin: mPS 11-36, and third bin: mPS 36-50), and the relationship with each stage was examined. As shown in
FIG. 17-3e : TCGA, Stage I-III, it was shown that the mPS increases and the survival rate becomes worse as the stage progressed. - Thus, it was proved that the mPS exhibits a correlation with the stage.
- Next, the relation between the Nottingham Prognostic Index (NPI) as a prognosis predictive factor for breast cancer and the mPS was validated. The NPI is calculated based on the size of the primary tumor, the number of lymph nodes involved and the tumor grade. The METABRIC cohort is categorized into five NPI groups [Excellent (NPI <2.41), Good (2.41-3.4), Moderate I (3.41-4.4), Moderate II (4.41-5.4), and Poor (NPI>5.4)], and the relationship with the mPS was examined. As a result, it was proved that the NPI is heterogeneous (non-uniform) grouping in the survival rate. A cohort categorized into the NPI Moderate II is shown in
FIG. 17-3f . Even taking a look only at the Moderate II (n=408) group, the mPS varied widely, and the survival rate also varied widely. The results of other groups are shown inFIG. 16-1a : METABRIC, Excellent,FIG. 16-1b : METABRIC, Good,FIG. 16-2c : METABRIC, Moderate I andFIG. 16-2d : METABRIC, Poor. - Finally, based on the mPS, a clinical stage categorization of breast cancer according to a new integrated score was created.
FIG. 18a shows the result of categorizing the clinical stages I to IV of cancer, based on the first bin (mPS 0-5) to the sixth bin (mPS 45-50) of the mPS, into 7 classes: A, B, C, D, E, F-I and F-II. The distribution of the first to sixth bins of the mPS was in excellent agreement with the clinical stage categorization.FIG. 18b shows the survival rate in a cohort with n=2340 combining the TCGA cohort and the METABRIC cohort. The clinical stage categorization also exhibited a good correlation with the survival rate. - From above, it was concluded that the mPS precisely reflects the survival rate of cancer patients within and after a predetermined period of time.
- In addition, it was shown that the mPS has a generalization/versatile ability because it exhibited a good correlation with the clinical stage categorization, clinical stage and pathological grade of cancer according to the integrated score.
Claims (32)
- A method for generating a discriminator, comprising:step 1 of determining, for a parent population of biomarkers derived from a test subject, whether each biomarker varies in relation with an event that will occur in a body of the test subject by a statistical method based on a measured value of each biomarker, and extracting a group of biomarkers determined to vary as a first subpopulation,step 2 of validating each biomarker belonging to the first subpopulation, and extracting a group of biomarkers statistically predicted to be related more closely to the event that will occur in the body as a second subpopulation, andstep 3 of calculating a weight of each biomarker belonging to the second subpopulation by a deep learning method,wherein the discriminator calculates a weighed sum of scores of biomarkers belonging to the second subpopulation using a score obtained from the measured value of each biomarker belonging to the second subpopulation and the weight of each biomarker calculated in step 3.
- A method for generating a discriminator, comprising:step A of determining, for a parent population of biomarkers derived from a test subject, whether each biomarker varies in relation with an event that will occur in a body of the test subject by a statistical method based on a measured value of each biomarker, and extracting a group of biomarkers determined to vary as a first subpopulation,step B of validating each biomarker belonging to the first subpopulation, and extracting a group of biomarkers statistically predicted to be related more closely to the event that will occur in the body as a second subpopulation,step C of extracting a group of biomarkers statistically predicted to be related much more closely to an event that will occur in the body from the biomarkers belonging to the second subpopulation as a third subpopulation by a machine learning method, andstep D of calculating a weight of each biomarker belonging to the third subpopulation by a deep learning method,wherein the discriminator calculates a weighed sum of scores of biomarkers belonging to the third subpopulation using a score obtained from the measured value of each biomarker belonging to the third subpopulation and the weight of each biomarker calculated in step D.
- The method for generating a discriminator according to Claim 1 or 2, wherein the machine learning method is a random forest.
- The method for generating a discriminator according to any one of Claims 1 to 3, wherein the deep learning method is a gradient descent method.
- The method for generating a discriminator according to any one of Claims 1 to 4, wherein the validation is a meta-analysis.
- The method for generating a discriminator according to any one of Claims 1 to 5, wherein the event that will occur in the body is a survival rate of a patient within or after a predetermined period of time.
- The method for generating a discriminator according to Claim 6, wherein a disease the patient is suffering from is cancer.
- The method for generating a discriminator according to any one of Claims 1 to 7, wherein the biomarkers are genes, and the measured value of the biomarker is an expression level of an mRNA or protein derived from the gene.
- A discriminator generation apparatus, comprising a processing unit, wherein the processing unit executes the method for generating a discriminator according to any one of Claims 1 to 8.
- A method of use in which a discriminator generated by the method for generating a discriminator according to any one of Claims 1 to 8 is used to predict the survival rate of a patient within or after a predetermined period of time.
- The method of use according to Claim 10, wherein the patient is a cancer patient.
- The method of use according to Claim 11, wherein the cancer is breast cancer.
- A method for predicting a survival rate of a patient, comprising the steps of:acquiring, for a patient, a weighed sum calculated using a discriminator generated by the method for generating a discriminator according to any one of Claims 1 to 8, anddetermining that the patient has a good survival rate when a weighed sum calculated using a discriminator generated by the method for generating a discriminator according to any one of Claims 1 to 8 takes a smaller value as the survival rate within or after a predetermined period of time is better and when the weighed sum of the patient is equal to or smaller than a reference value.
- A method for predicting a survival rate of a patient, comprising the steps of:acquiring, for a patient, a weighed sum calculated using a discriminator generated by the method for generating a discriminator according to any one of Claims 1 to 8, anddetermining that the patient has a poor survival rate when a weighed sum calculated using a discriminator generated by the method for generating a discriminator according to any one of Claims 1 to 8 takes a smaller value as the survival rate within or after a predetermined period of time is better and when the weighed sum of the patient is larger than a reference value.
- A method for predicting a survival rate of a patient, comprising the steps of:acquiring, for a patient, a weighed sum calculated using a discriminator generated by the method for generating a discriminator according to any one of Claims 1 to 8, anddetermining that the patient has a good survival rate when a weighed sum calculated using a discriminator generated by the method for generating a discriminator according to any one of Claims 1 to 8 takes a larger value as the survival rate within or after a predetermined period of time is better and when the weighed sum of the patient is equal to or larger than a reference value.
- A method for predicting a survival rate of a patient, comprising the steps of:acquiring, for a patient, a weighed sum calculated using a discriminator generated by the method for generating a discriminator according to any one of Claims 1 to 8, anddetermining that the patient has a poor survival rate when a weighed sum calculated using a discriminator generated by the method for generating a discriminator according to any one of Claims 1 to 8 takes a larger value as the survival rate within or after a predetermined period of time is better and when the weighed sum of the patient is smaller than a reference value.
- The prediction method according to any one of Claims 13 to 16, wherein the patient is a cancer patient.
- The prediction method according to Claim 17, wherein the cancer is breast cancer.
- The prediction method according to Claim 18, wherein the biomarkers extracted as a second subpopulation when a discriminator is generated include the genes shown in Table 1-1 and Table 1-2 below, and the measured value of the biomarker is the expression level of an mRNA or protein derived from the gene;
[Table 1-1] Gene name NCBI Gene ID Gene name NCBI Gene ID Gene name NCBI Gene ID 1 ADHFE1 137872 41 DCAF16 54876 81 LEF1 51176 2 AMD1 262 42 DCTPP1 79077 82 LEPROTL1 23484 3 ANKRD29 147463 43 DEF6 50619 83 LRP11 84918 4 ANLN 54443 44 DERL1 79139 84 LTF 4057 5 AP5S1 55317 45 DHRS1 115817 85 MAL2 114569 6 APOBEC3F 200316 46 DIRAS3 9077 86 MAP4K1 11184 7 APOBEC3G 60489 47 EEF1G 1937 87 MAPT 4137 8 APOL3 80833 48 EGR3 1960 88 MARS 4141 9 APOOL 139322 49 ENOSF1 55556 89 MAX 4149 10 ARHGAP26 23092 50 ESRP1 54845 90 MITD1 129531 11 ARMC1 55156 51 EVA1C 59271 91 MMGT1 93380 12 ATP5B 506 52 EZR 7430 92 MRPL13 28998 13 ATP6V1C1 528 53 FAXDC2 10826 93 MTDH 92140 14 BEND5 79656 54 FKBP5 2289 94 MTFR1 9650 15 BTF3 689 55 FOXM1 2305 95 NDUFAF6 137682 16 BTG1 694 56 GARS 2617 96 NEFH 4744 17 C1RL 51279 57 GRHL2 79977 97 NFKBIA 4792 18 CARD10 29775 58 GSTM4 2948 98 NKAP 79576 19 CASP9 842 59 GSTO1 9446 99 NONO 4841 20 CCDC115 84317 60 GTF2IRD2B 389524 100 NR1H3 10062 21 CCDC24 149473 61 H6PD 9563 101 NSA2 10412 22 CCDC69 26112 62 HCCS 3052 102 NSMCE2 286053 23 CCNE1 898 63 HILPDA 29923 103 OARD1 221443 24 CCT2 10576 64 HMGB3 3149 104 PARG 8505 25 CCT4 10575 65 HNRNPA1L2 144983 105 PARP3 10039 26 CCT6A 908 66 HSP90AA1 3320 106 PCMT1 5110 27 CD24 100133941 67 HSPA2 3306 107 PDCD2 5134 28 CD48 962 68 IARS 3376 108 PGK1 5230 29 CD52 1043 69 IGF2R 3482 109 PHF7 51533 30 CD6 923 70 IP6K2 51447 110 PLAT 5327 31 CD74 972 71 IRF2 3660 111 PLEKHA4 57664 32 CDK8 1024 72 ITGA10 8515 112 PLXNB3 5365 33 CIR1 9541 73 JAK1 3716 113 PNRC2 55629 34 CIRBP 1153 74 KANSL2 54934 114 POP1 10940 35 COG8 84342 75 KDM4B 23030 115 PRKAB2 5565 36 COPS6 10980 76 KIF21A 55605 116 PSMD10 5716 37 CPT1A 1374 77 KRCC1 51315 117 PSME1 5720 38 CRK 1398 78 LAMA3 3909 118 PTGER3 5733 39 CYB561 1534 79 LAMB3 3914 119 PTK2 5747 40 CYP27A1 1593 80 LARP4B 23185 120 PYCARD 29108 [Table 1-2] Gene name NCBI Gene ID Gene name NCBI Gene ID 121 QPRT 23475 161 TPRG1 285386 122 RAB2A 5862 162 TPT1 7178 123 RAC2 5880 163 TRAF5 7188 124 RAD1 5810 164 TRAPPC12 51112 125 RAPGEFL1 51195 165 TRIM34 53840 126 RARRES3 5920 166 TRIM35 23087 127 RBBP8 5932 167 TRIM45 80263 128 REPS1 85021 168 TVP23C 201158 129 RILPL2 196383 169 UBA7 7318 130 RPF1 80135 170 UBE2A 7319 131 RPL11 6135 171 UBTF 7343 132 RPL14 9045 172 UBXN1 51035 133 RPS6KA1 6195 173 UBXN11 91544 134 RTN4IP1 84816 174 UTP23 84294 135 SAV1 60485 175 VBP1 7411 136 SCUBE2 57758 176 WLS 79971 137 SERFINA1 5265 177 YTHDF3 253943 138 SH3D21 79729 178 ZBED6CL 113763 139 SHISA5 51246 179 ZDHHC9 51114 140 SKP1 6500 180 ZFHX3 463 141 SLC35A2 7355 181 ZMYND10 51364 142 SLC7A5 8140 182 ZNF496 84838 143 SPATA7 55812 183 ZNF552 79818 144 SPOCK2 9806 184 ZNF671 79891 145 STC2 8614 146 STEAP2 261729 147 STK3 6788 148 STK39 27347 149 STRAP 11171 150 SURF4 6836 151 SUSD3 203328 152 TAPBPL 55080 153 TARS 6897 154 TBC1D10C 374403 155 THG1L 54974 156 TMEM229B 161145 157 TMEM65 157378 158 TMEM69 51249 159 TNFRSF14 8764 160 TNIP1 10318 - The prediction method according to Claim 18, wherein the biomarkers that are extracted as a third subpopulation when a discriminator is generated include FOXM1, CPT1A, GARS, MARS, UTP23, ANLN, HMGB3, ATP5B, APOOL, CYB561, GRHL2, ESRP1, EZR, RBBP8, CIRBP, PTGER3, LAMA3, OARD1, ANKRD29, EGR3, DIRAS3, MITD1 and LAMB3, and the measured value of the biomarker is the expression level of an mRNA or protein derived from the gene.
- A patient survival rate prediction apparatus comprising a processing unit, wherein the processing unit is for executing the prediction method according to any one of Claims 13 to 20.
- A method for assisting stratification of patients according to their survival rates, comprising the steps of:comparing weighed sums calculated for the patients using a discriminator generated by the method for generating a discriminator according to any one of Claims 1 to 8 with corresponding reference ranges, anddetermining bins of the reference ranges to which the weighed sums of the patients belong.
- The method according to Claim 22, wherein the patients are cancer patients.
- The method according to Claim 22 or 23, wherein the reference ranges have been determined according to a category such as the clinical stage classification of cancer, the histological type, clinical stage or pathological tissue grade of cancer, or the age group, and
wherein the method further comprises a step of acquiring information on the clinical stage classification of the cancer of the test subject, the histological type, clinical stage or pathological tissue grade of the cancer, and the age group of the test subject according to the category. - Use of at least one selected from the genes shown in Table 2-1 and Table 2-2 below (with the proviso that an aspect consisting only of ANLN, FOXM1, RBBP8 or a combination of these genes is not included) as a biomarker for predicting a survival rate of a breast cancer patient;
[Table 2-1] Gene name NCBI Gene ID Gene name NCBI Gene ID Gene name NCBI Gene ID 1 ADHFE1 137872 41 DCAF16 54876 81 LEF1 51176 2 AMD1 262 42 DCTPP1 79077 82 LEPROTL1 23484 3 ANKRD29 147463 43 DEF6 50619 83 LRP11 84918 4 ANLN 54443 44 DERL1 79139 84 LTF 4057 5 AP5S1 55317 45 DHRS1 115817 85 MAL2 114569 6 APOBEC3F 200316 46 DIRAS3 9077 86 MAP4K1 11184 7 APOBEC3G 60489 47 EEF1G 1937 87 MAPT 4137 8 APOL3 80833 48 EGR3 1960 88 MARS 4141 9 APOOL 139322 49 ENOSF1 55556 89 MAX 4149 10 ARHGAP26 23092 50 ESRP1 54845 90 MITD1 129531 11 ARMC1 55156 51 EVA1C 59271 91 MMGT1 93380 12 ATP5B 506 52 EZR 7430 92 MRPL13 28998 13 ATP6V1C1 528 53 FAXDC2 10826 93 MTDH 92140 14 BEND5 79656 54 FKBP5 2289 94 MTFR1 9650 15 BTF3 689 55 FOXM1 2305 95 NDUFAF6 137682 16 BTG1 694 56 GARS 2617 96 NEFH 4744 17 C1RL 51279 57 GRHL2 79977 97 NFKBIA 4792 18 CARD10 29775 58 GSTM4 2948 98 NKAP 79576 19 CASP9 842 59 GSTO1 9446 99 NONO 4841 20 CCDC115 84317 60 GTF2IRD2B 389524 100 NR1H3 10062 21 CCDC24 149473 61 H6PD 9563 101 NSA2 10412 22 CCDC69 26112 62 HCCS 3052 102 NSMCE2 286053 23 CCNE1 898 63 HILPDA 29923 103 OARD1 221443 24 CCT2 10576 64 HMGB3 3149 104 PARG 8505 25 CCT4 10575 65 HNRNPA1L2 144983 105 PARP3 10039 26 CCT6A 908 66 HSP90AA1 3320 106 PCMT1 5110 27 CD24 100133941 67 HSPA2 3306 107 PDCD2 5134 28 CD48 962 68 IARS 3376 108 PGK1 5230 29 CD52 1043 69 IGF2R 3482 109 PHF7 51533 30 CD6 923 70 IP6K2 51447 110 PLAT 5327 31 CD74 972 71 IRF2 3660 111 PLEKHA4 57664 32 CDK8 1024 72 ITGA10 8515 112 PLXNB3 5365 33 CIR1 9541 73 JAK1 3716 113 PNRC2 55629 34 CIRBP 1153 74 KANSL2 54934 114 POP1 10940 35 COG8 84342 75 KDM4B 23030 115 PRKAB2 5565 36 COPS6 10980 76 KIF21A 55605 116 PSMD10 5716 37 CPT1A 1374 77 KRCC1 51315 117 PSME1 5720 38 CRK 1398 78 LAMA3 3909 118 PTGER3 5733 39 CYB561 1534 79 LAMB3 3914 119 PTK2 5747 40 CYP27A1 1593 80 LARP4B 23185 120 PYCARD 29108 [Table 2-2] Gene name NCBI Gene ID Gene name NCBI Gene ID 121 QPRT 23475 161 TPRG1 285386 122 RAB2A 5862 162 TPT1 7178 123 RAC2 5880 163 TRAF5 7188 124 RAD1 5810 164 TRAPPC12 51112 125 RAPGEFL1 51195 165 TRIM34 53840 126 RARRES3 5920 166 TRIM35 23087 127 RBBP8 5932 167 TRIM45 80263 128 REPS1 85021 168 TVP23C 201158 129 RILPL2 196383 169 UBA7 7318 130 RPF1 80135 170 UBE2A 7319 131 RPL11 6135 171 UBTF 7343 132 RPL14 9045 172 UBXN1 51035 133 RPS6KA1 6195 173 UBXN11 91544 134 RTN4IP1 84816 174 UTP23 84294 135 SAV1 60485 175 VBP1 7411 136 SCUBE2 57758 176 WLS 79971 137 SERPINA1 5265 177 YTH DF3 253943 138 SH3D21 79729 178 ZBED6CL 113763 139 SHISA5 51246 179 ZDHHC9 51114 140 SKP1 6500 180 ZFHX3 463 141 SLC35A2 7355 181 ZMYND10 51364 142 SLC7A5 8140 182 ZNF496 84838 143 SPATA7 55812 183 ZNF552 79818 144 SPOCK2 9806 184 ZNF671 79891 145 STC2 8614 146 STEAP2 261729 147 STK3 6788 148 STK39 27347 149 STRAP 11171 150 SURF4 6836 151 SUSD3 203328 152 TAPBPL 55080 153 TARS 6897 154 TBC1D10C 374403 155 THG1L 54974 156 TMEM229B 161145 157 TMEM65 157378 158 TMEM69 51249 159 TNFRSF14 8764 160 TNIP1 10318 - Use of at least one selected from the gene group consisting of FOXM1, CPT1A, GARS, MARS, UTP23, ANLN, HMGB3, ATP5B, APOOL, CYB561, GRHL2, ESRP1, EZR, RBBP8, CIRBP, PTGER3, LAMA3, OARD1, ANKRD29, EGR3, DIRAS3, MITD1 and LAMB3 (with the proviso that an aspect consisting only of ANLN, FOXM1, RBBP8 or a combination of these genes is not included) as a biomarker for predicting a survival rate of a breast cancer patient.
- An inspection reagent for use in predicting a survival rate of a breast cancer patient, comprising a probe, primer or antibody for detecting the expression level of an mRNA or protein derived from at least one selected from the genes shown in Table 3-1 and Table 3-2 below (with the proviso that an aspect consisting only of ANLN, FOXM1, RBBP8 or a combination of these genes is not included);
[Table 3-1] Gene name NCBI Gene ID Gene name NCBI Gene ID Gene name NCBI Gene ID 1 ADHFE1 137872 41 DCAF16 54876 81 LEF1 51176 2 AMD1 262 42 DCTPP1 79077 82 LEPROTL1 23484 3 ANKRD29 147463 43 DEF6 50619 83 LRP11 84918 4 ANLN 54443 44 DERL1 79139 84 LTF 4057 5 AP5S1 55317 45 DHRS1 115817 85 MAL2 114569 6 APOBEC3F 200316 46 DIRAS3 9077 86 MAP4K1 11184 7 APOBEC3G 60489 47 EEF1G 1937 87 MAPT 4137 8 APOL3 80833 48 EGR3 1960 88 MARS 4141 9 APOOL 139322 49 ENOSF1 55556 89 MAX 4149 10 ARHGAP26 23092 50 ESRP1 54845 90 MITD1 129531 11 ARMC1 55156 51 EVA1C 59271 91 MMGT1 93380 12 ATP5B 506 52 EZR 7430 92 MRPL13 28998 13 ATP6V1C1 528 53 FAXDC2 10826 93 MTDH 92140 14 BEND5 79656 54 FKBP5 2289 94 MTFR1 9650 15 BTF3 689 55 FOXM1 2305 95 NDUFAF6 137682 16 BTG1 694 56 GARS 2617 96 NEFH 4744 17 C1RL 51279 57 GRHL2 79977 97 NFKBIA 4792 18 CARD10 29775 58 GSTM4 2948 98 NKAP 79576 19 CASP9 842 59 GSTO1 9446 99 NONO 4841 20 CCDC115 84317 60 GTF2IRD2B 389524 100 NR1H3 10062 21 CCDC24 149473 61 H6PD 9563 101 NSA2 10412 22 CCDC69 26112 62 HCCS 3052 102 NSMCE2 286053 23 CCNE1 898 63 HILPDA 29923 103 OARD1 221443 24 CCT2 10576 64 HMGB3 3149 104 PARG 8505 25 CCT4 10575 65 HNRNPA1L2 144983 105 PARP3 10039 26 CCT6A 908 66 HSP90AA1 3320 106 PCMT1 5110 27 CD24 100133941 67 HSPA2 3306 107 PDCD2 5134 28 CD48 962 68 IARS 3376 108 PGK1 5230 29 CD52 1043 69 IGF2R 3482 109 PHF7 51533 30 CD6 923 70 IP6K2 51447 110 PLAT 5327 31 CD74 972 71 IRF2 3660 111 PLEKHA4 57664 32 CDK8 1024 72 ITGA10 8515 112 PLXNB3 5365 33 CIR1 9541 73 JAK1 3716 113 PNRC2 55629 34 CIRBP 1153 74 KANSL2 54934 114 POP1 10940 35 COG8 84342 75 KDM4B 23030 115 PRKAB2 5565 36 COPS6 10980 76 KIF21A 55605 116 PSMD10 5716 37 CPT1A 1374 77 KRCC1 51315 117 PSME1 5720 38 CRK 1398 78 LAMA3 3909 118 PTGER3 5733 39 CYB561 1534 79 LAMB3 3914 119 PTK2 5747 40 CYP27A1 1593 80 LARP4B 23185 120 PYCARD 29108 [Table 3-2] Gene name NCBI Gene ID Gene name NCBI Gene ID 121 QPRT 23475 161 TPRG1 285386 122 RAB2A 5862 162 TPT1 7178 123 RAC2 5880 163 TRAF5 7188 124 RAD1 5810 164 TRAPPC12 51112 125 RAPGEFL1 51195 165 TRIM34 53840 126 RARRES3 5920 166 TRIM35 23087 127 RBBP8 5932 167 TRIM45 80263 128 REPS1 85021 168 TVP23C 201158 129 RILPL2 196383 169 UBA7 7318 130 RPF1 80135 170 UBE2A 7319 131 RPL11 6135 171 UBTF 7343 132 RPL14 9045 172 UBXN1 51035 133 RPS6KA1 6195 173 UBXN11 91544 134 RTN4IP1 84816 174 UTP23 84294 135 SAV1 60485 175 VBP1 7411 136 SCUBE2 57758 176 WLS 79971 137 SERPINA1 5265 177 YTH DF3 253943 138 SH3D21 79729 178 ZBED6CL 113763 139 SHISA5 51246 179 ZDHHC9 51114 140 SKP1 6500 180 ZFHX3 463 141 SLC35A2 7355 181 ZMYND10 51364 142 SLC7A5 8140 182 ZNF496 84838 143 SPATA7 55812 183 ZNF552 79818 144 SPOCK2 9806 184 ZNF671 79891 145 STC2 8614 146 STEAP2 261729 147 STK3 6788 148 STK39 27347 149 STRAP 11171 150 SURF4 6836 151 SUSD3 203328 152 TAPBPL 55080 153 TARS 6897 154 TBC1D10C 374403 155 THG1L 54974 156 TMEM229B 161145 157 TMEM65 157378 158 TMEM69 51249 159 TNFRSF14 8764 160 TNIP1 10318 - An inspection reagent for use in predicting a survival rate of a breast cancer patient, comprising a probe, primer, or antibody for detecting the expression level of an mRNA or protein derived from at least one selected from a gene group consisting of FOXM1, CPT1A, GARS, MARS, UTP23, ANLN, HMGB3, ATP5B, APOOL, CYB561, GRHL2, ESRP1, EZR, RBBP8, CIRBP, PTGER3, LAMA3, OARD1, ANKRD29, EGR3, DIRAS3, MITD1 and LAMB3 (with the proviso that an aspect consisting only of ANLN, FOXM1, RBBP8 or a combination of these genes is not included).
- A discriminator generated by the method for generating a discriminator according to any one of Claims 1 to 8.
- A computer readable storage medium in which the discriminator according to Claim 29 has been stored.
- A computer program for generating a discriminator, which executes the method for generating a discriminator according to any one of Claims 1 to 8 when executed by a computer.
- A computer program for predicting a survival rate of a patient, which executes the prediction method according to any one of Claims 13 to 20 when executed by a computer.
Applications Claiming Priority (2)
| Application Number | Priority Date | Filing Date | Title |
|---|---|---|---|
| JP2018157870A JP2020028278A (en) | 2018-08-24 | 2018-08-24 | Method for generating classifier for predicting event occurring in subject, and method for stratifying subject using classifier |
| PCT/JP2019/033085 WO2020040300A1 (en) | 2018-08-24 | 2019-08-23 | Method for producing classifier for use in prediction of event occurring in subject, and method for stratifying subjects using said classifier |
Publications (2)
| Publication Number | Publication Date |
|---|---|
| EP3842540A1 true EP3842540A1 (en) | 2021-06-30 |
| EP3842540A4 EP3842540A4 (en) | 2022-10-05 |
Family
ID=69593239
Family Applications (1)
| Application Number | Title | Priority Date | Filing Date |
|---|---|---|---|
| EP19852485.2A Withdrawn EP3842540A4 (en) | 2018-08-24 | 2019-08-23 | METHOD FOR PRODUCING A CLASSIFIER FOR USE IN PREDICTING AN EVENT OCCURRING IN A SUBJECT, AND METHOD FOR STRATIFYING SUBJECTS USING SUCH CLASSIFIER |
Country Status (3)
| Country | Link |
|---|---|
| EP (1) | EP3842540A4 (en) |
| JP (1) | JP2020028278A (en) |
| WO (1) | WO2020040300A1 (en) |
Families Citing this family (1)
| Publication number | Priority date | Publication date | Assignee | Title |
|---|---|---|---|---|
| JP7444252B2 (en) * | 2020-06-03 | 2024-03-06 | 富士通株式会社 | Diagnostic support program, device, and method |
Family Cites Families (11)
| Publication number | Priority date | Publication date | Assignee | Title |
|---|---|---|---|---|
| US3884767A (en) | 1973-09-21 | 1975-05-20 | Jr John E Pottharst | Multi-effect flash evaporator |
| WO2007041238A2 (en) * | 2005-09-29 | 2007-04-12 | Stratagene California | Methods of identification and use of gene signatures |
| WO2008058384A1 (en) * | 2006-11-15 | 2008-05-22 | University Health Network | Materials and methods for prognosing lung cancer survival |
| WO2011120984A1 (en) * | 2010-03-31 | 2011-10-06 | Sividon Diagnostics Gmbh | Method for breast cancer recurrence prediction under endocrine treatment |
| BR112013018924A2 (en) * | 2011-01-25 | 2018-05-08 | Almac Diagnostics Limited | Colon cancer gene expression signatures and methods of use |
| WO2012154987A1 (en) * | 2011-05-10 | 2012-11-15 | Nestec Sa | Methods of disease activity profiling for personalized therapy management |
| CA2854805C (en) * | 2011-11-08 | 2021-04-27 | Genomic Health, Inc. | Method of predicting breast cancer prognosis |
| JP6065500B2 (en) * | 2012-09-28 | 2017-01-25 | サンケン電気株式会社 | Semiconductor device |
| US10806773B2 (en) * | 2014-10-09 | 2020-10-20 | Dana-Farber Cancer Institute, Inc. | Multiple-variable IL-2 dose regimen for treating immune disorders |
| WO2016094330A2 (en) * | 2014-12-08 | 2016-06-16 | 20/20 Genesystems, Inc | Methods and machine learning systems for predicting the liklihood or risk of having cancer |
| EP3325972B1 (en) * | 2015-07-22 | 2020-08-19 | Minomic International Ltd. | Biomarker combinations for prostate disease |
-
2018
- 2018-08-24 JP JP2018157870A patent/JP2020028278A/en not_active Ceased
-
2019
- 2019-08-23 WO PCT/JP2019/033085 patent/WO2020040300A1/en not_active Ceased
- 2019-08-23 EP EP19852485.2A patent/EP3842540A4/en not_active Withdrawn
Also Published As
| Publication number | Publication date |
|---|---|
| EP3842540A4 (en) | 2022-10-05 |
| WO2020040300A1 (en) | 2020-02-27 |
| JP2020028278A (en) | 2020-02-27 |
Similar Documents
| Publication | Publication Date | Title |
|---|---|---|
| US11180815B2 (en) | Methods for treating colorectal cancer using prognostic genetic markers | |
| van der Heijden et al. | A five-gene expression signature to predict progression in T1G3 bladder cancer | |
| AU2019250606B2 (en) | Improved classification and prognosis of prostate cancer | |
| Matsui | Genomic biomarkers for personalized medicine: development and validation in clinical studies | |
| CN117672539A (en) | Methods and machine learning systems for predicting the likelihood or risk of having cancer | |
| US9593377B2 (en) | Signatures and determinants associated with cancer and methods of use thereof | |
| US20160259883A1 (en) | Sense-antisense gene pairs for patient stratification, prognosis, and therapeutic biomarkers identification | |
| Mazza et al. | Clinical significance of circulating miR-1273g-3p and miR-122-5p in pancreatic cancer | |
| EP3465215A1 (en) | Method of prognosing and predicting breast cancer recurrence, markers employed therein and kit thereof | |
| AU2018200973A1 (en) | Prognosis prediction for colorectal cancer | |
| US20170183738A1 (en) | Process, Apparatus or System and Kit for Classification of Tumor Samples of Unknown and/or Uncertain Origin and Use of Genes of the Group of Biomarkers | |
| Du et al. | Discovery and validation of circulating EVL mRNA as a prognostic biomarker in pancreatic cancer | |
| US20240327927A1 (en) | Active surveillance and risk stratification for prostate cancer | |
| Boufaied et al. | Development of a predictive model for stromal content in prostate cancer samples to improve signature performance | |
| CN119487214A (en) | Bladder Cancer Biomarkers and Methods of Use | |
| Paul et al. | Multiplexed RNA-FISH-guided Laser Capture Microdissection RNA Sequencing Improves Breast Cancer Molecular Subtyping, Prognostic Classification, and Predicts Response to Antibody Drug Conjugates | |
| WO2020040300A1 (en) | Method for producing classifier for use in prediction of event occurring in subject, and method for stratifying subjects using said classifier | |
| Tseng et al. | Investigating multi-cancer biomarkers and their cross-predictability in the expression profiles of multiple cancer types | |
| Schummer et al. | Breast cancer genomics: normal tissue and cancer markers | |
| Baba et al. | Urinary miRNA Profiles with Machine Learning for Noninvasive Detection and Prognosis of Urological Malignancies | |
| Von Felden et al. | Unannotated small RNA clusters in circulating extracellular vesicles detect early stage liver cancer | |
| Malina et al. | Discovery of circulating cell-free DNA 5hmC biomarkers for peritoneal metastasis in colorectal and appendiceal cancer | |
| Sirieix | A systematic approach to therapeutic target selection in oesophago-gastric cancer | |
| Mustafa | A Nine-Gene Signature for Predicting the Response to Preoperative Chemoradiotherapy in Patients with Locally Advanced Rectal Cancer |
Legal Events
| Date | Code | Title | Description |
|---|---|---|---|
| STAA | Information on the status of an ep patent application or granted ep patent |
Free format text: STATUS: THE INTERNATIONAL PUBLICATION HAS BEEN MADE |
|
| PUAI | Public reference made under article 153(3) epc to a published international application that has entered the european phase |
Free format text: ORIGINAL CODE: 0009012 |
|
| STAA | Information on the status of an ep patent application or granted ep patent |
Free format text: STATUS: REQUEST FOR EXAMINATION WAS MADE |
|
| 17P | Request for examination filed |
Effective date: 20210324 |
|
| AK | Designated contracting states |
Kind code of ref document: A1 Designated state(s): AL AT BE BG CH CY CZ DE DK EE ES FI FR GB GR HR HU IE IS IT LI LT LU LV MC MK MT NL NO PL PT RO RS SE SI SK SM TR |
|
| DAV | Request for validation of the european patent (deleted) | ||
| DAX | Request for extension of the european patent (deleted) | ||
| REG | Reference to a national code |
Ref country code: DE Ref legal event code: R079 Free format text: PREVIOUS MAIN CLASS: C12Q0001680000 Ipc: G16H0050300000 |
|
| A4 | Supplementary search report drawn up and despatched |
Effective date: 20220905 |
|
| RIC1 | Information provided on ipc code assigned before grant |
Ipc: G01N 33/68 20060101ALI20220830BHEP Ipc: G01N 33/50 20060101ALI20220830BHEP Ipc: C12Q 1/68 20180101ALI20220830BHEP Ipc: G16H 50/20 20180101ALI20220830BHEP Ipc: G16H 50/30 20180101AFI20220830BHEP |
|
| STAA | Information on the status of an ep patent application or granted ep patent |
Free format text: STATUS: THE APPLICATION IS DEEMED TO BE WITHDRAWN |
|
| 18D | Application deemed to be withdrawn |
Effective date: 20230301 |