EP3827101B1 - Gene signatures for predicting metastasis of melanoma and patient prognosis - Google Patents
Gene signatures for predicting metastasis of melanoma and patient prognosis Download PDFInfo
- Publication number
- EP3827101B1 EP3827101B1 EP19787488.6A EP19787488A EP3827101B1 EP 3827101 B1 EP3827101 B1 EP 3827101B1 EP 19787488 A EP19787488 A EP 19787488A EP 3827101 B1 EP3827101 B1 EP 3827101B1
- Authority
- EP
- European Patent Office
- Prior art keywords
- gene expression
- individual
- slnb
- sln
- positive
- Prior art date
- Legal status (The legal status is an assumption and is not a legal conclusion. Google has not performed a legal analysis and makes no representation as to the accuracy of the status listed.)
- Active
Links
- 201000001441 melanoma Diseases 0.000 title claims description 74
- 206010027476 Metastases Diseases 0.000 title claims description 69
- 230000009401 metastasis Effects 0.000 title claims description 54
- 238000004393 prognosis Methods 0.000 title claims description 24
- 230000004547 gene signature Effects 0.000 title description 66
- 230000014509 gene expression Effects 0.000 claims description 180
- 238000000034 method Methods 0.000 claims description 72
- 101000801481 Homo sapiens Tissue-type plasminogen activator Proteins 0.000 claims description 66
- 102100033571 Tissue-type plasminogen activator Human genes 0.000 claims description 66
- 108090001007 Interleukin-8 Proteins 0.000 claims description 65
- 108091058560 IL8 Proteins 0.000 claims description 64
- 102100032999 Integrin beta-3 Human genes 0.000 claims description 64
- 101000893549 Homo sapiens Growth/differentiation factor 15 Proteins 0.000 claims description 63
- 102100040896 Growth/differentiation factor 15 Human genes 0.000 claims description 62
- 101001015004 Homo sapiens Integrin beta-3 Proteins 0.000 claims description 62
- 102000004890 Interleukin-8 Human genes 0.000 claims description 62
- 108090000623 proteins and genes Proteins 0.000 claims description 58
- 206010028980 Neoplasm Diseases 0.000 claims description 44
- 102100033299 Glia-derived nexin Human genes 0.000 claims description 35
- 102100028389 Melanoma antigen recognized by T-cells 1 Human genes 0.000 claims description 35
- 101000578784 Homo sapiens Melanoma antigen recognized by T-cells 1 Proteins 0.000 claims description 34
- 102100021968 Lysyl oxidase homolog 4 Human genes 0.000 claims description 33
- 101000997803 Homo sapiens Glia-derived nexin Proteins 0.000 claims description 31
- 102100033456 TGF-beta receptor type-1 Human genes 0.000 claims description 30
- 101001043351 Homo sapiens Lysyl oxidase homolog 4 Proteins 0.000 claims description 29
- 108010011702 Transforming Growth Factor-beta Type I Receptor Proteins 0.000 claims description 29
- 102100031786 Adiponectin Human genes 0.000 claims description 27
- 238000011282 treatment Methods 0.000 claims description 27
- 208000030381 cutaneous melanoma Diseases 0.000 claims description 24
- 201000003708 skin melanoma Diseases 0.000 claims description 24
- 101000775469 Homo sapiens Adiponectin Proteins 0.000 claims description 23
- 102100040557 Osteopontin Human genes 0.000 claims description 20
- 101710168942 Sphingosine-1-phosphate phosphatase 1 Proteins 0.000 claims description 20
- 201000011510 cancer Diseases 0.000 claims description 20
- 102100031112 Disintegrin and metalloproteinase domain-containing protein 12 Human genes 0.000 claims description 15
- 102100024923 Protein kinase C beta type Human genes 0.000 claims description 14
- 238000009169 immunotherapy Methods 0.000 claims description 12
- 108010001498 Galectin 1 Proteins 0.000 claims description 11
- 238000010837 poor prognosis Methods 0.000 claims description 11
- 108091007507 ADAM12 Proteins 0.000 claims description 10
- 101001051767 Homo sapiens Protein kinase C beta type Proteins 0.000 claims description 9
- 102100040445 Keratin, type I cytoskeletal 14 Human genes 0.000 claims description 7
- 102100037362 Fibronectin Human genes 0.000 claims description 6
- 101001027128 Homo sapiens Fibronectin Proteins 0.000 claims description 6
- 101000614436 Homo sapiens Keratin, type I cytoskeletal 14 Proteins 0.000 claims description 6
- 101001043354 Homo sapiens Lysyl oxidase homolog 3 Proteins 0.000 claims description 6
- 102100021949 Lysyl oxidase homolog 3 Human genes 0.000 claims description 6
- 238000010626 work up procedure Methods 0.000 claims description 6
- 238000002512 chemotherapy Methods 0.000 claims description 5
- FDKXTQMXEQVLRF-ZHACJKMWSA-N (E)-dacarbazine Chemical group CN(C)\N=N\c1[nH]cnc1C(N)=O FDKXTQMXEQVLRF-ZHACJKMWSA-N 0.000 claims description 4
- 102000004127 Cytokines Human genes 0.000 claims description 4
- 108090000695 Cytokines Proteins 0.000 claims description 4
- 229940076838 Immune checkpoint inhibitor Drugs 0.000 claims description 4
- 102000037984 Inhibitory immune checkpoint proteins Human genes 0.000 claims description 4
- 108091008026 Inhibitory immune checkpoint proteins Proteins 0.000 claims description 4
- BPEGJWRSRHCHSN-UHFFFAOYSA-N Temozolomide Chemical compound O=C1N(C)N=NC2=C(C(N)=O)N=CN21 BPEGJWRSRHCHSN-UHFFFAOYSA-N 0.000 claims description 4
- 229960002271 cobimetinib Drugs 0.000 claims description 4
- RESIMIUSNACMNW-BXRWSSRYSA-N cobimetinib fumarate Chemical compound OC(=O)\C=C\C(O)=O.C1C(O)([C@H]2NCCCC2)CN1C(=O)C1=CC=C(F)C(F)=C1NC1=CC=C(I)C=C1F.C1C(O)([C@H]2NCCCC2)CN1C(=O)C1=CC=C(F)C(F)=C1NC1=CC=C(I)C=C1F RESIMIUSNACMNW-BXRWSSRYSA-N 0.000 claims description 4
- BFSMGDJOXZAERB-UHFFFAOYSA-N dabrafenib Chemical compound S1C(C(C)(C)C)=NC(C=2C(=C(NS(=O)(=O)C=3C(=CC=CC=3F)F)C=CC=2)F)=C1C1=CC=NC(N)=N1 BFSMGDJOXZAERB-UHFFFAOYSA-N 0.000 claims description 4
- 229940079593 drug Drugs 0.000 claims description 4
- 239000003814 drug Substances 0.000 claims description 4
- 239000012274 immune-checkpoint protein inhibitor Substances 0.000 claims description 4
- 230000000174 oncolytic effect Effects 0.000 claims description 4
- 229960004964 temozolomide Drugs 0.000 claims description 4
- LIRYPHYGHXZJBZ-UHFFFAOYSA-N trametinib Chemical compound CC(=O)NC1=CC=CC(N2C(N(C3CC3)C(=O)C3=C(NC=4C(=CC(I)=CC=4)F)N(C)C(=O)C(C)=C32)=O)=C1 LIRYPHYGHXZJBZ-UHFFFAOYSA-N 0.000 claims description 4
- GPXBXXGIAQBQNI-UHFFFAOYSA-N vemurafenib Chemical compound CCCS(=O)(=O)NC1=CC=C(F)C(C(=O)C=2C3=CC(=CN=C3NC=2)C=2C=CC(Cl)=CC=2)=C1F GPXBXXGIAQBQNI-UHFFFAOYSA-N 0.000 claims description 4
- 101000984753 Homo sapiens Serine/threonine-protein kinase B-raf Proteins 0.000 claims description 3
- 102100027103 Serine/threonine-protein kinase B-raf Human genes 0.000 claims description 3
- 229960004562 carboplatin Drugs 0.000 claims description 3
- DQLATGHUWYMOKM-UHFFFAOYSA-L cisplatin Chemical compound N[Pt](N)(Cl)Cl DQLATGHUWYMOKM-UHFFFAOYSA-L 0.000 claims description 3
- 229960004316 cisplatin Drugs 0.000 claims description 3
- 229960002465 dabrafenib Drugs 0.000 claims description 3
- 229960003901 dacarbazine Drugs 0.000 claims description 3
- 239000003112 inhibitor Substances 0.000 claims description 3
- 239000002829 mitogen activated protein kinase inhibitor Substances 0.000 claims description 3
- 229960003301 nivolumab Drugs 0.000 claims description 3
- 229960002621 pembrolizumab Drugs 0.000 claims description 3
- 238000001959 radiotherapy Methods 0.000 claims description 3
- 238000002626 targeted therapy Methods 0.000 claims description 3
- RCINICONZNJXQF-MZXODVADSA-N taxol Chemical compound O([C@@H]1[C@@]2(C[C@@H](C(C)=C(C2(C)C)[C@H](C([C@]2(C)[C@@H](O)C[C@H]3OC[C@]3([C@H]21)OC(C)=O)=O)OC(=O)C)OC(=O)[C@H](O)[C@@H](NC(=O)C=1C=CC=CC=1)C=1C=CC=CC=1)O)C(=O)C1=CC=CC=C1 RCINICONZNJXQF-MZXODVADSA-N 0.000 claims description 3
- 229960004066 trametinib Drugs 0.000 claims description 3
- 229960003862 vemurafenib Drugs 0.000 claims description 3
- 108010078049 Interferon alpha-2 Proteins 0.000 claims description 2
- 102000000588 Interleukin-2 Human genes 0.000 claims description 2
- 108010002350 Interleukin-2 Proteins 0.000 claims description 2
- 229930012538 Paclitaxel Natural products 0.000 claims description 2
- JXLYSJRDGCGARV-WWYNWVTFSA-N Vinblastine Natural products O=C(O[C@H]1[C@](O)(C(=O)OC)[C@@H]2N(C)c3c(cc(c(OC)c3)[C@]3(C(=O)OC)c4[nH]c5c(c4CCN4C[C@](O)(CC)C[C@H](C3)C4)cccc5)[C@@]32[C@H]2[C@@]1(CC)C=CCN2CC3)C JXLYSJRDGCGARV-WWYNWVTFSA-N 0.000 claims description 2
- 229960003507 interferon alfa-2b Drugs 0.000 claims description 2
- 229960005386 ipilimumab Drugs 0.000 claims description 2
- 229960001592 paclitaxel Drugs 0.000 claims description 2
- MIXCUJKCXRNYFM-UHFFFAOYSA-M sodium;diiodomethanesulfonate;n-propyl-n-[2-(2,4,6-trichlorophenoxy)ethyl]imidazole-1-carboxamide Chemical compound [Na+].[O-]S(=O)(=O)C(I)I.C1=CN=CN1C(=O)N(CCC)CCOC1=C(Cl)C=C(Cl)C=C1Cl MIXCUJKCXRNYFM-UHFFFAOYSA-M 0.000 claims description 2
- 229960003048 vinblastine Drugs 0.000 claims description 2
- 102000000795 Galectin 1 Human genes 0.000 claims 1
- 190000008236 carboplatin Chemical compound 0.000 claims 1
- JXLYSJRDGCGARV-XQKSVPLYSA-N vincaleukoblastine Chemical compound C([C@@H](C[C@]1(C(=O)OC)C=2C(=CC3=C([C@]45[C@H]([C@@]([C@H](OC(C)=O)[C@]6(CC)C=CCN([C@H]56)CC4)(O)C(=O)OC)N3C)C=2)OC)C[C@@](C2)(O)CC)N2CCC2=C1NC1=CC=CC=C21 JXLYSJRDGCGARV-XQKSVPLYSA-N 0.000 claims 1
- 230000004083 survival effect Effects 0.000 description 104
- 210000005005 sentinel lymph node Anatomy 0.000 description 77
- 238000012549 training Methods 0.000 description 72
- 230000035945 sensitivity Effects 0.000 description 35
- 238000001574 biopsy Methods 0.000 description 25
- 239000000523 sample Substances 0.000 description 22
- 238000007477 logistic regression Methods 0.000 description 20
- 210000001165 lymph node Anatomy 0.000 description 20
- 108020004999 messenger RNA Proteins 0.000 description 19
- 238000012360 testing method Methods 0.000 description 18
- 241000282414 Homo sapiens Species 0.000 description 17
- 101150087983 SLN gene Proteins 0.000 description 17
- 102100021736 Galectin-1 Human genes 0.000 description 14
- 206010061289 metastatic neoplasm Diseases 0.000 description 14
- 208000025865 Ulcer Diseases 0.000 description 13
- 230000003902 lesion Effects 0.000 description 13
- 210000001519 tissue Anatomy 0.000 description 13
- 210000004027 cell Anatomy 0.000 description 12
- 238000004458 analytical method Methods 0.000 description 11
- 230000036269 ulceration Effects 0.000 description 11
- 108091032973 (ribonucleotides)n+m Proteins 0.000 description 10
- 210000004881 tumor cell Anatomy 0.000 description 10
- 238000002790 cross-validation Methods 0.000 description 9
- 230000000394 mitotic effect Effects 0.000 description 9
- 108020004707 nucleic acids Proteins 0.000 description 9
- 102000039446 nucleic acids Human genes 0.000 description 9
- 150000007523 nucleic acids Chemical class 0.000 description 9
- 238000001356 surgical procedure Methods 0.000 description 8
- 201000010099 disease Diseases 0.000 description 7
- 208000037265 diseases, disorders, signs and symptoms Diseases 0.000 description 7
- 238000010200 validation analysis Methods 0.000 description 7
- 230000009545 invasion Effects 0.000 description 6
- 239000003550 marker Substances 0.000 description 6
- 230000001394 metastastic effect Effects 0.000 description 6
- 238000010606 normalization Methods 0.000 description 6
- 101150072364 ADAM12 gene Proteins 0.000 description 5
- 101150112998 ADIPOQ gene Proteins 0.000 description 5
- 108700039887 Essential Genes Proteins 0.000 description 5
- 101100054857 Homo sapiens ADAM12 gene Proteins 0.000 description 5
- 101150044523 ITGB3 gene Proteins 0.000 description 5
- 101150108823 LGALS1 gene Proteins 0.000 description 5
- 101150046172 LOXL4 gene Proteins 0.000 description 5
- 101150075026 PRKCB gene Proteins 0.000 description 5
- 101150025327 SERPINE2 gene Proteins 0.000 description 5
- 101150031549 Tgfbr1 gene Proteins 0.000 description 5
- 230000008901 benefit Effects 0.000 description 5
- 239000002299 complementary DNA Substances 0.000 description 5
- 238000001514 detection method Methods 0.000 description 5
- 230000009467 reduction Effects 0.000 description 5
- 230000004044 response Effects 0.000 description 5
- 238000009098 adjuvant therapy Methods 0.000 description 4
- DVQHYTBCTGYNNN-UHFFFAOYSA-N azane;cyclobutane-1,1-dicarboxylic acid;platinum Chemical compound N.N.[Pt].OC(=O)C1(C(O)=O)CCC1 DVQHYTBCTGYNNN-UHFFFAOYSA-N 0.000 description 4
- 230000003247 decreasing effect Effects 0.000 description 4
- 238000010195 expression analysis Methods 0.000 description 4
- 238000001325 log-rank test Methods 0.000 description 4
- 230000001926 lymphatic effect Effects 0.000 description 4
- 238000013507 mapping Methods 0.000 description 4
- 102000004169 proteins and genes Human genes 0.000 description 4
- 238000003753 real-time PCR Methods 0.000 description 4
- 230000002829 reductive effect Effects 0.000 description 4
- 238000002271 resection Methods 0.000 description 4
- 102100025064 Cellular tumor antigen p53 Human genes 0.000 description 3
- 108020004635 Complementary DNA Proteins 0.000 description 3
- 208000014061 Extranodal Extension Diseases 0.000 description 3
- 101001008568 Homo sapiens Laminin subunit beta-1 Proteins 0.000 description 3
- 102100027448 Laminin subunit beta-1 Human genes 0.000 description 3
- 108091005461 Nucleic proteins Proteins 0.000 description 3
- -1 RPLPO Proteins 0.000 description 3
- 238000011529 RT qPCR Methods 0.000 description 3
- 108010078814 Tumor Suppressor Protein p53 Proteins 0.000 description 3
- 230000002411 adverse Effects 0.000 description 3
- 238000002224 dissection Methods 0.000 description 3
- 230000007774 longterm Effects 0.000 description 3
- 230000003211 malignant effect Effects 0.000 description 3
- 238000012163 sequencing technique Methods 0.000 description 3
- 210000003491 skin Anatomy 0.000 description 3
- 101150116295 CAT2 gene Proteins 0.000 description 2
- 101100326920 Caenorhabditis elegans ctl-1 gene Proteins 0.000 description 2
- WSFSSNUMVMOOMR-UHFFFAOYSA-N Formaldehyde Chemical compound O=C WSFSSNUMVMOOMR-UHFFFAOYSA-N 0.000 description 2
- 241000282412 Homo Species 0.000 description 2
- 101000756632 Homo sapiens Actin, cytoplasmic 1 Proteins 0.000 description 2
- 238000007476 Maximum Likelihood Methods 0.000 description 2
- 101100126846 Neurospora crassa (strain ATCC 24698 / 74-OR23-1A / CBS 708.71 / DSM 1257 / FGSC 987) katG gene Proteins 0.000 description 2
- 238000002123 RNA extraction Methods 0.000 description 2
- 208000037323 Rare tumor Diseases 0.000 description 2
- 230000003321 amplification Effects 0.000 description 2
- 150000001875 compounds Chemical class 0.000 description 2
- 238000013461 design Methods 0.000 description 2
- 210000002615 epidermis Anatomy 0.000 description 2
- 238000011223 gene expression profiling Methods 0.000 description 2
- 230000036541 health Effects 0.000 description 2
- 238000005259 measurement Methods 0.000 description 2
- 238000002493 microarray Methods 0.000 description 2
- 238000003199 nucleic acid amplification method Methods 0.000 description 2
- 210000000056 organ Anatomy 0.000 description 2
- 239000012188 paraffin wax Substances 0.000 description 2
- 230000001575 pathological effect Effects 0.000 description 2
- 230000008569 process Effects 0.000 description 2
- 238000012502 risk assessment Methods 0.000 description 2
- 238000000926 separation method Methods 0.000 description 2
- 238000003196 serial analysis of gene expression Methods 0.000 description 2
- 238000011272 standard treatment Methods 0.000 description 2
- 238000007920 subcutaneous administration Methods 0.000 description 2
- 238000012706 support-vector machine Methods 0.000 description 2
- 238000002560 therapeutic procedure Methods 0.000 description 2
- 238000011269 treatment regimen Methods 0.000 description 2
- JXLYSJRDGCGARV-CFWMRBGOSA-N vinblastine Chemical compound C([C@H](C[C@]1(C(=O)OC)C=2C(=CC3=C([C@]45[C@H]([C@@]([C@H](OC(C)=O)[C@]6(CC)C=CCN([C@H]56)CC4)(O)C(=O)OC)N3C)C=2)OC)C[C@@](C2)(O)CC)N2CCC2=C1NC1=CC=CC=C21 JXLYSJRDGCGARV-CFWMRBGOSA-N 0.000 description 2
- PCTMTFRHKVHKIS-BMFZQQSSSA-N (1s,3r,4e,6e,8e,10e,12e,14e,16e,18s,19r,20r,21s,25r,27r,30r,31r,33s,35r,37s,38r)-3-[(2r,3s,4s,5s,6r)-4-amino-3,5-dihydroxy-6-methyloxan-2-yl]oxy-19,25,27,30,31,33,35,37-octahydroxy-18,20,21-trimethyl-23-oxo-22,39-dioxabicyclo[33.3.1]nonatriaconta-4,6,8,10 Chemical compound C1C=C2C[C@@H](OS(O)(=O)=O)CC[C@]2(C)[C@@H]2[C@@H]1[C@@H]1CC[C@H]([C@H](C)CCCC(C)C)[C@@]1(C)CC2.O[C@H]1[C@@H](N)[C@H](O)[C@@H](C)O[C@H]1O[C@H]1/C=C/C=C/C=C/C=C/C=C/C=C/C=C/[C@H](C)[C@@H](O)[C@@H](C)[C@H](C)OC(=O)C[C@H](O)C[C@H](O)CC[C@@H](O)[C@H](O)C[C@H](O)C[C@](O)(C[C@H](O)[C@H]2C(O)=O)O[C@H]2C1 PCTMTFRHKVHKIS-BMFZQQSSSA-N 0.000 description 1
- QYAPHLRPFNSDNH-MRFRVZCGSA-N (4s,4as,5as,6s,12ar)-7-chloro-4-(dimethylamino)-1,6,10,11,12a-pentahydroxy-6-methyl-3,12-dioxo-4,4a,5,5a-tetrahydrotetracene-2-carboxamide;hydrochloride Chemical compound Cl.C1=CC(Cl)=C2[C@](O)(C)[C@H]3C[C@H]4[C@H](N(C)C)C(=O)C(C(N)=O)=C(O)[C@@]4(O)C(=O)C3=C(O)C2=C1O QYAPHLRPFNSDNH-MRFRVZCGSA-N 0.000 description 1
- 101150096316 5 gene Proteins 0.000 description 1
- 102100030755 5-aminolevulinate synthase, nonspecific, mitochondrial Human genes 0.000 description 1
- 102100040881 60S acidic ribosomal protein P0 Human genes 0.000 description 1
- 102100021206 60S ribosomal protein L19 Human genes 0.000 description 1
- 102100035931 60S ribosomal protein L8 Human genes 0.000 description 1
- 102100020979 ATP-binding cassette sub-family F member 1 Human genes 0.000 description 1
- 102100040026 Agrin Human genes 0.000 description 1
- 108091093088 Amplicon Proteins 0.000 description 1
- 101000798762 Anguilla anguilla Troponin C, skeletal muscle Proteins 0.000 description 1
- 102100026031 Beta-glucuronidase Human genes 0.000 description 1
- 102100031168 CCN family member 2 Human genes 0.000 description 1
- 101100075486 Caenorhabditis elegans lrp-1 gene Proteins 0.000 description 1
- 201000005947 Carney Complex Diseases 0.000 description 1
- 102100026127 Clathrin heavy chain 1 Human genes 0.000 description 1
- 102100022145 Collagen alpha-1(IV) chain Human genes 0.000 description 1
- 108010009392 Cyclin-Dependent Kinase Inhibitor p16 Proteins 0.000 description 1
- 108010016788 Cyclin-Dependent Kinase Inhibitor p21 Proteins 0.000 description 1
- 102100033270 Cyclin-dependent kinase inhibitor 1 Human genes 0.000 description 1
- 102100024458 Cyclin-dependent kinase inhibitor 2A Human genes 0.000 description 1
- 102100027700 DNA-directed RNA polymerase I subunit RPA2 Human genes 0.000 description 1
- 102100021429 DNA-directed RNA polymerase II subunit RPB1 Human genes 0.000 description 1
- 206010061818 Disease progression Diseases 0.000 description 1
- 238000002965 ELISA Methods 0.000 description 1
- 101710191461 F420-dependent glucose-6-phosphate dehydrogenase Proteins 0.000 description 1
- 241000282326 Felis catus Species 0.000 description 1
- 101150099704 Fn1 gene Proteins 0.000 description 1
- 101150085449 Gdf15 gene Proteins 0.000 description 1
- 102100035172 Glucose-6-phosphate 1-dehydrogenase Human genes 0.000 description 1
- 101710155861 Glucose-6-phosphate 1-dehydrogenase Proteins 0.000 description 1
- 101710174622 Glucose-6-phosphate 1-dehydrogenase, chloroplastic Proteins 0.000 description 1
- 101710137456 Glucose-6-phosphate 1-dehydrogenase, cytoplasmic isoform Proteins 0.000 description 1
- 102100031181 Glyceraldehyde-3-phosphate dehydrogenase Human genes 0.000 description 1
- 108010041834 Growth Differentiation Factor 15 Proteins 0.000 description 1
- 102000000597 Growth Differentiation Factor 15 Human genes 0.000 description 1
- 102100034221 Growth-regulated alpha protein Human genes 0.000 description 1
- 101000843649 Homo sapiens 5-aminolevulinate synthase, nonspecific, mitochondrial Proteins 0.000 description 1
- 101000673456 Homo sapiens 60S acidic ribosomal protein P0 Proteins 0.000 description 1
- 101001105789 Homo sapiens 60S ribosomal protein L19 Proteins 0.000 description 1
- 101000853659 Homo sapiens 60S ribosomal protein L8 Proteins 0.000 description 1
- 101000783783 Homo sapiens ATP-binding cassette sub-family F member 1 Proteins 0.000 description 1
- 101000959594 Homo sapiens Agrin Proteins 0.000 description 1
- 101000933465 Homo sapiens Beta-glucuronidase Proteins 0.000 description 1
- 101000777550 Homo sapiens CCN family member 2 Proteins 0.000 description 1
- 101000912851 Homo sapiens Clathrin heavy chain 1 Proteins 0.000 description 1
- 101000901150 Homo sapiens Collagen alpha-1(IV) chain Proteins 0.000 description 1
- 101000650600 Homo sapiens DNA-directed RNA polymerase I subunit RPA2 Proteins 0.000 description 1
- 101001106401 Homo sapiens DNA-directed RNA polymerase II subunit RPB1 Proteins 0.000 description 1
- 101000777457 Homo sapiens Disintegrin and metalloproteinase domain-containing protein 12 Proteins 0.000 description 1
- 101000896557 Homo sapiens Eukaryotic translation initiation factor 3 subunit B Proteins 0.000 description 1
- 101001069921 Homo sapiens Growth-regulated alpha protein Proteins 0.000 description 1
- 101000988834 Homo sapiens Hypoxanthine-guanine phosphoribosyltransferase Proteins 0.000 description 1
- 101001078133 Homo sapiens Integrin alpha-2 Proteins 0.000 description 1
- 101000994378 Homo sapiens Integrin alpha-3 Proteins 0.000 description 1
- 101000994369 Homo sapiens Integrin alpha-5 Proteins 0.000 description 1
- 101001090713 Homo sapiens L-lactate dehydrogenase A chain Proteins 0.000 description 1
- 101100343710 Homo sapiens LOXL3 gene Proteins 0.000 description 1
- 101001043321 Homo sapiens Lysyl oxidase homolog 1 Proteins 0.000 description 1
- 101000579123 Homo sapiens Phosphoglycerate kinase 1 Proteins 0.000 description 1
- 101000595913 Homo sapiens Procollagen glycosyltransferase Proteins 0.000 description 1
- 101000685323 Homo sapiens Succinate dehydrogenase [ubiquinone] flavoprotein subunit, mitochondrial Proteins 0.000 description 1
- 101000712674 Homo sapiens TGF-beta receptor type-1 Proteins 0.000 description 1
- 101000666340 Homo sapiens Tenascin Proteins 0.000 description 1
- 101000659879 Homo sapiens Thrombospondin-1 Proteins 0.000 description 1
- 101000633605 Homo sapiens Thrombospondin-2 Proteins 0.000 description 1
- 102100029098 Hypoxanthine-guanine phosphoribosyltransferase Human genes 0.000 description 1
- 102100025305 Integrin alpha-2 Human genes 0.000 description 1
- 102100032819 Integrin alpha-3 Human genes 0.000 description 1
- 102100032817 Integrin alpha-5 Human genes 0.000 description 1
- 108010020950 Integrin beta3 Proteins 0.000 description 1
- 102000008607 Integrin beta3 Human genes 0.000 description 1
- 101150040052 KRT14 gene Proteins 0.000 description 1
- 238000010824 Kaplan-Meier survival analysis Methods 0.000 description 1
- 108010066321 Keratin-14 Proteins 0.000 description 1
- 102100034671 L-lactate dehydrogenase A chain Human genes 0.000 description 1
- 235000019687 Lamb Nutrition 0.000 description 1
- 206010025282 Lymphoedema Diseases 0.000 description 1
- 102100021958 Lysyl oxidase homolog 1 Human genes 0.000 description 1
- 108010010995 MART-1 Antigen Proteins 0.000 description 1
- 101150066697 MLANA gene Proteins 0.000 description 1
- 241000124008 Mammalia Species 0.000 description 1
- 108010050345 Microphthalmia-Associated Transcription Factor Proteins 0.000 description 1
- 102000013760 Microphthalmia-Associated Transcription Factor Human genes 0.000 description 1
- 208000007256 Nevus Diseases 0.000 description 1
- 238000000636 Northern blotting Methods 0.000 description 1
- 102000004264 Osteopontin Human genes 0.000 description 1
- 108010081689 Osteopontin Proteins 0.000 description 1
- KJWZYMMLVHIVSU-IYCNHOCDSA-N PGK1 Chemical compound CCCCC[C@H](O)\C=C\[C@@H]1[C@@H](CCCCCCC(O)=O)C(=O)CC1=O KJWZYMMLVHIVSU-IYCNHOCDSA-N 0.000 description 1
- 102000035195 Peptidases Human genes 0.000 description 1
- 108091005804 Peptidases Proteins 0.000 description 1
- 102100028251 Phosphoglycerate kinase 1 Human genes 0.000 description 1
- 102100035199 Procollagen glycosyltransferase Human genes 0.000 description 1
- 239000004365 Protease Substances 0.000 description 1
- 108010024526 Protein Kinase C beta Proteins 0.000 description 1
- 208000003251 Pruritus Diseases 0.000 description 1
- 238000010802 RNA extraction kit Methods 0.000 description 1
- 238000003559 RNA-seq method Methods 0.000 description 1
- 102100023155 Succinate dehydrogenase [ubiquinone] flavoprotein subunit, mitochondrial Human genes 0.000 description 1
- 206010042553 Superficial spreading melanoma stage unspecified Diseases 0.000 description 1
- 102100038126 Tenascin Human genes 0.000 description 1
- 102100036034 Thrombospondin-1 Human genes 0.000 description 1
- 102100029529 Thrombospondin-2 Human genes 0.000 description 1
- 206010064390 Tumour invasion Diseases 0.000 description 1
- 238000013459 approach Methods 0.000 description 1
- 238000003705 background correction Methods 0.000 description 1
- 239000000090 biomarker Substances 0.000 description 1
- 239000001045 blue dye Substances 0.000 description 1
- 238000004364 calculation method Methods 0.000 description 1
- 230000009400 cancer invasion Effects 0.000 description 1
- 230000008859 change Effects 0.000 description 1
- 238000006243 chemical reaction Methods 0.000 description 1
- 238000000546 chi-square test Methods 0.000 description 1
- 238000010835 comparative analysis Methods 0.000 description 1
- 230000000052 comparative effect Effects 0.000 description 1
- 230000021615 conjugation Effects 0.000 description 1
- 238000010276 construction Methods 0.000 description 1
- 238000011109 contamination Methods 0.000 description 1
- 238000012937 correction Methods 0.000 description 1
- 230000001351 cycling effect Effects 0.000 description 1
- 230000001419 dependent effect Effects 0.000 description 1
- 238000011161 development Methods 0.000 description 1
- 230000005750 disease progression Effects 0.000 description 1
- 238000002651 drug therapy Methods 0.000 description 1
- 238000013399 early diagnosis Methods 0.000 description 1
- 230000002500 effect on skin Effects 0.000 description 1
- 230000000694 effects Effects 0.000 description 1
- 238000011156 evaluation Methods 0.000 description 1
- 230000001747 exhibiting effect Effects 0.000 description 1
- 238000001914 filtration Methods 0.000 description 1
- 238000000684 flow cytometry Methods 0.000 description 1
- 239000012520 frozen sample Substances 0.000 description 1
- 238000007429 general method Methods 0.000 description 1
- 108020004445 glyceraldehyde-3-phosphate dehydrogenase Proteins 0.000 description 1
- 230000002962 histologic effect Effects 0.000 description 1
- 238000003365 immunocytochemistry Methods 0.000 description 1
- 238000003364 immunohistochemistry Methods 0.000 description 1
- 238000007901 in situ hybridization Methods 0.000 description 1
- 230000002401 inhibitory effect Effects 0.000 description 1
- 229940096397 interleukin-8 Drugs 0.000 description 1
- XKTZWUACRZHVAN-VADRZIEHSA-N interleukin-8 Chemical compound C([C@H](NC(=O)[C@H](CC(O)=O)NC(=O)[C@H](CC=1C2=CC=CC=C2NC=1)NC(=O)[C@@H](NC(C)=O)CCSC)C(=O)N[C@@H](CC(O)=O)C(=O)N[C@@H](CC(O)=O)C(=O)N[C@@H](CC(C)C)C(=O)N[C@@H](CC(N)=O)C(=O)N[C@@H](CC=1C=CC=CC=1)C(=O)N[C@@H]([C@@H](C)O)C(=O)NCC(=O)N[C@@H](CCSC)C(=O)N1[C@H](CCC1)C(=O)N1[C@H](CCC1)C(=O)N[C@@H](C)C(=O)N[C@H](CC(O)=O)C(=O)N[C@H](CCC(O)=O)C(=O)N[C@H](CC(O)=O)C(=O)N[C@H](CC=1C=CC(O)=CC=1)C(=O)N[C@H](CO)C(=O)N1[C@H](CCC1)C(N)=O)C1=CC=CC=C1 XKTZWUACRZHVAN-VADRZIEHSA-N 0.000 description 1
- 238000007918 intramuscular administration Methods 0.000 description 1
- 238000007913 intrathecal administration Methods 0.000 description 1
- 230000007803 itching Effects 0.000 description 1
- 230000000670 limiting effect Effects 0.000 description 1
- 210000002751 lymph Anatomy 0.000 description 1
- 208000002502 lymphedema Diseases 0.000 description 1
- 238000010841 mRNA extraction Methods 0.000 description 1
- 238000010801 machine learning Methods 0.000 description 1
- 238000004949 mass spectrometry Methods 0.000 description 1
- 229940083118 mekinist Drugs 0.000 description 1
- 230000011278 mitosis Effects 0.000 description 1
- 238000012544 monitoring process Methods 0.000 description 1
- 238000000491 multivariate analysis Methods 0.000 description 1
- 238000011369 optimal treatment Methods 0.000 description 1
- 239000000049 pigment Substances 0.000 description 1
- 229940063179 platinol Drugs 0.000 description 1
- 238000003752 polymerase chain reaction Methods 0.000 description 1
- 238000007781 pre-processing Methods 0.000 description 1
- 238000012545 processing Methods 0.000 description 1
- 238000000746 purification Methods 0.000 description 1
- 239000000700 radioactive tracer Substances 0.000 description 1
- 238000003757 reverse transcription PCR Methods 0.000 description 1
- 230000002441 reversible effect Effects 0.000 description 1
- 238000012552 review Methods 0.000 description 1
- 238000012216 screening Methods 0.000 description 1
- 238000011270 sentinel node biopsy Methods 0.000 description 1
- 238000001228 spectrum Methods 0.000 description 1
- 101150063780 spp1 gene Proteins 0.000 description 1
- 238000000528 statistical test Methods 0.000 description 1
- 210000000438 stratum basale Anatomy 0.000 description 1
- 208000030457 superficial spreading melanoma Diseases 0.000 description 1
- 208000024891 symptom Diseases 0.000 description 1
- 230000009897 systematic effect Effects 0.000 description 1
- 229940081616 tafinlar Drugs 0.000 description 1
- 230000000699 topical effect Effects 0.000 description 1
- 238000013518 transcription Methods 0.000 description 1
- 230000035897 transcription Effects 0.000 description 1
- 230000004614 tumor growth Effects 0.000 description 1
- 231100000397 ulcer Toxicity 0.000 description 1
- 230000009790 vascular invasion Effects 0.000 description 1
- 238000001262 western blot Methods 0.000 description 1
- 229940055760 yervoy Drugs 0.000 description 1
- 229940034727 zelboraf Drugs 0.000 description 1
Images


Classifications
-
- C—CHEMISTRY; METALLURGY
- C12—BIOCHEMISTRY; BEER; SPIRITS; WINE; VINEGAR; MICROBIOLOGY; ENZYMOLOGY; MUTATION OR GENETIC ENGINEERING
- C12Q—MEASURING OR TESTING PROCESSES INVOLVING ENZYMES, NUCLEIC ACIDS OR MICROORGANISMS; COMPOSITIONS OR TEST PAPERS THEREFOR; PROCESSES OF PREPARING SUCH COMPOSITIONS; CONDITION-RESPONSIVE CONTROL IN MICROBIOLOGICAL OR ENZYMOLOGICAL PROCESSES
- C12Q1/00—Measuring or testing processes involving enzymes, nucleic acids or microorganisms; Compositions therefor; Processes of preparing such compositions
- C12Q1/68—Measuring or testing processes involving enzymes, nucleic acids or microorganisms; Compositions therefor; Processes of preparing such compositions involving nucleic acids
- C12Q1/6876—Nucleic acid products used in the analysis of nucleic acids, e.g. primers or probes
- C12Q1/6883—Nucleic acid products used in the analysis of nucleic acids, e.g. primers or probes for diseases caused by alterations of genetic material
- C12Q1/6886—Nucleic acid products used in the analysis of nucleic acids, e.g. primers or probes for diseases caused by alterations of genetic material for cancer
-
- C—CHEMISTRY; METALLURGY
- C12—BIOCHEMISTRY; BEER; SPIRITS; WINE; VINEGAR; MICROBIOLOGY; ENZYMOLOGY; MUTATION OR GENETIC ENGINEERING
- C12Q—MEASURING OR TESTING PROCESSES INVOLVING ENZYMES, NUCLEIC ACIDS OR MICROORGANISMS; COMPOSITIONS OR TEST PAPERS THEREFOR; PROCESSES OF PREPARING SUCH COMPOSITIONS; CONDITION-RESPONSIVE CONTROL IN MICROBIOLOGICAL OR ENZYMOLOGICAL PROCESSES
- C12Q1/00—Measuring or testing processes involving enzymes, nucleic acids or microorganisms; Compositions therefor; Processes of preparing such compositions
- C12Q1/68—Measuring or testing processes involving enzymes, nucleic acids or microorganisms; Compositions therefor; Processes of preparing such compositions involving nucleic acids
- C12Q1/6806—Preparing nucleic acids for analysis, e.g. for polymerase chain reaction [PCR] assay
-
- C—CHEMISTRY; METALLURGY
- C12—BIOCHEMISTRY; BEER; SPIRITS; WINE; VINEGAR; MICROBIOLOGY; ENZYMOLOGY; MUTATION OR GENETIC ENGINEERING
- C12Q—MEASURING OR TESTING PROCESSES INVOLVING ENZYMES, NUCLEIC ACIDS OR MICROORGANISMS; COMPOSITIONS OR TEST PAPERS THEREFOR; PROCESSES OF PREPARING SUCH COMPOSITIONS; CONDITION-RESPONSIVE CONTROL IN MICROBIOLOGICAL OR ENZYMOLOGICAL PROCESSES
- C12Q1/00—Measuring or testing processes involving enzymes, nucleic acids or microorganisms; Compositions therefor; Processes of preparing such compositions
- C12Q1/68—Measuring or testing processes involving enzymes, nucleic acids or microorganisms; Compositions therefor; Processes of preparing such compositions involving nucleic acids
- C12Q1/6844—Nucleic acid amplification reactions
- C12Q1/686—Polymerase chain reaction [PCR]
-
- C—CHEMISTRY; METALLURGY
- C12—BIOCHEMISTRY; BEER; SPIRITS; WINE; VINEGAR; MICROBIOLOGY; ENZYMOLOGY; MUTATION OR GENETIC ENGINEERING
- C12Q—MEASURING OR TESTING PROCESSES INVOLVING ENZYMES, NUCLEIC ACIDS OR MICROORGANISMS; COMPOSITIONS OR TEST PAPERS THEREFOR; PROCESSES OF PREPARING SUCH COMPOSITIONS; CONDITION-RESPONSIVE CONTROL IN MICROBIOLOGICAL OR ENZYMOLOGICAL PROCESSES
- C12Q2600/00—Oligonucleotides characterized by their use
- C12Q2600/112—Disease subtyping, staging or classification
-
- C—CHEMISTRY; METALLURGY
- C12—BIOCHEMISTRY; BEER; SPIRITS; WINE; VINEGAR; MICROBIOLOGY; ENZYMOLOGY; MUTATION OR GENETIC ENGINEERING
- C12Q—MEASURING OR TESTING PROCESSES INVOLVING ENZYMES, NUCLEIC ACIDS OR MICROORGANISMS; COMPOSITIONS OR TEST PAPERS THEREFOR; PROCESSES OF PREPARING SUCH COMPOSITIONS; CONDITION-RESPONSIVE CONTROL IN MICROBIOLOGICAL OR ENZYMOLOGICAL PROCESSES
- C12Q2600/00—Oligonucleotides characterized by their use
- C12Q2600/118—Prognosis of disease development
-
- C—CHEMISTRY; METALLURGY
- C12—BIOCHEMISTRY; BEER; SPIRITS; WINE; VINEGAR; MICROBIOLOGY; ENZYMOLOGY; MUTATION OR GENETIC ENGINEERING
- C12Q—MEASURING OR TESTING PROCESSES INVOLVING ENZYMES, NUCLEIC ACIDS OR MICROORGANISMS; COMPOSITIONS OR TEST PAPERS THEREFOR; PROCESSES OF PREPARING SUCH COMPOSITIONS; CONDITION-RESPONSIVE CONTROL IN MICROBIOLOGICAL OR ENZYMOLOGICAL PROCESSES
- C12Q2600/00—Oligonucleotides characterized by their use
- C12Q2600/158—Expression markers
-
- C—CHEMISTRY; METALLURGY
- C12—BIOCHEMISTRY; BEER; SPIRITS; WINE; VINEGAR; MICROBIOLOGY; ENZYMOLOGY; MUTATION OR GENETIC ENGINEERING
- C12Q—MEASURING OR TESTING PROCESSES INVOLVING ENZYMES, NUCLEIC ACIDS OR MICROORGANISMS; COMPOSITIONS OR TEST PAPERS THEREFOR; PROCESSES OF PREPARING SUCH COMPOSITIONS; CONDITION-RESPONSIVE CONTROL IN MICROBIOLOGICAL OR ENZYMOLOGICAL PROCESSES
- C12Q2600/00—Oligonucleotides characterized by their use
- C12Q2600/166—Oligonucleotides used as internal standards, controls or normalisation probes
Definitions
- the disclosure provides gene signatures of classifying an individual afflicted with cutaneous melanoma.
- the "SLN gene signatures” provided herein classify an individual based on prognosis and/or classify an individual as having a metastasis-positive or - negative sentinel lymph node (SLN).
- the "N-SLN gene signatures” provided herein classify an individual as having a metastasis-positive or -negative non-sentinel lymph node (N-SLN).
- Cutaneous melanoma is a malignant tumor that arises from the pigment producing melanocytic cells located mostly in the stratum basale of the skin's epidermis. Most lesions appear with signs as described by the ABCDE rules: Asymmetry, Border irregularity, Color variegation, Diameter larger than 6 mm and Evolution, i.e. the tendency to change rapidly Abbasi NR, Shaw HM, Rigel DS, et al. Early Diagnosis of Cutaneous Melanoma Revisiting the ABCD Criteria. JAMA. 2004;292(22):2771-2776 ). The sites are typically asymptomatic, however they can cause itching and/or bleeding-especially in later stages.
- the detection of suspicious lesions is usually done by self-examination of the skin, which is recommended to perform routinely on the basis of the ABCDE criteria or "ugly duckling signs" ( Grob J. The ⁇ Ugly Duckling' Sign: Identification of the Common Characteristics of Nevi in an Individual as a Basis for Melanoma Screening. Arch Dermatol. 1998;134:103-104 ).
- melanoma is subsequently formally diagnosed by a physician, it is important to determine the specific subtype, since there are multiple clinical and pathological varieties known.
- the most common form is cutaneous melanoma - a superficial spreading melanoma which comprises about 70% of cases - and which is especially frequently occurring in fair skinned people.
- the severity of the condition greatly depends on the ability of melanoma cells to migrate out of the primary region. For this reason assessing whether the tumor is localized or has spread to lymph nodes or organs is of paramount significance.
- stage I Staging of melanoma is crucial for patient prognosis and to decide on further monitoring and treatment strategies. This is also reflected in the striking contrast in the reported 5-year overall survival numbers in a systematic literature review of 9 European countries: 95%-100% (stage I), 65%-92.8% (stage II), 41%-71% (stage III), and 9%-28% (stage IV). These differences are greatly dependent on the ability of the melanoma to metastasize, opposed to localized melanoma lesions. The accurate discrimination between the different stage classes is important and is most commonly based on the TNM system, referring to the thickness of the primary Tumor (T), the presence and/or extent of tumor cells to the lymph Nodes (N) and the presence of distant Metastasis to other organs (M).
- TNM thickness of the primary Tumor
- N lymph Nodes
- M distant Metastasis to other organs
- prognosis refers to a prediction of the medical outcome of the patient. For example, an individual may be classified as having a poor prognosis or a good prognosis.
- the prognosis of a patient afflicted with melanoma indicates, e.g., likelihood of long-term survival, overall survival, progression free survival, prediction of relapse versus disease remission, and disease progression.
- SLNB Sestinel Lymph Node biopsy
- the management of cutaneous melanoma patients has progressed significantly since the inclusion of lymphatic mapping by the SLNB procedure in the early 1990s ( Morton DL, Wen DR, Wong JH, et al. Technical details of intraoperative lymphatic mapping for early stage melanoma. Arch Surg. 1992;127(4):392-399 ).
- the surgical technique has been improved by the implementation of a dual-modality, intraoperative approach using blue dye and a radiotracer with gamma probe detection.
- the pathological assessment was upgraded by the employment of serial sectioning of the SLN and immunohistochemistry. This has resulted in the better identification of the draining first lymph node or group of nodes that is situated in close proximity of the tumor (i.e., the SLN) and is therefore a likely site of metastatic disease. This procedure is also referred to as "sentinel lymph node mapping".
- SLNB cutaneous melanoma of ⁇ 0.8 mm
- Gershenwald JE, Scolyer RA, Hess KR, et al. Melanoma Staging: Evidence-Based Changes in the American Joint Committee on Cancer Eighth Edition Cancer Staging Manual. CA Cancer J Clin. 2017;67(6):472-492 a SLNB procedure is generally performed and further treatment depends on the level of metastases. Within the borderline group, SLNB can be considered, particularly if the melanoma is presented with additional adverse prognostic parameters.
- resection is understood to mean surgical removal of malignant tissue characteristic of melanoma from a human patient. According to one embodiment, resection shall be understood to mean removal of malignant tissue such that the presence of remaining malignant tissue within said patient is undetectable with available methods.
- the rate at which the SLNBs are classified as positive are highly variable and depending to a great extent on the known prognostic factors of the primary tumor.
- the percentage of SLN metastasis is 15-30%, whereas in thin melanomas it is shown to be 5.2%.
- the current edition of the Melanoma Expert Panel staging guidelines noted the clinical relevance of the subcategorization of T1 melanomas at 0.8 mm. This is based on the detected trend in several survival studies of T1 melanomas that there is a potential clinical intercept in the region of 0.7 to 0.8 mm.
- SLNB is not only a method to potentially stage cutaneous melanoma, but is also part of a treatment, which depending on the metastatic classification of the SLN, may or may not be necessary.
- the SLNB procedure can cause complications for a patient and is costly. Therefore, this procedure is only performed on a select group of patients that are considered to have a higher risk for metastatic spread - from the vast majority of low risk lesions.
- the risk for metastasis may be assessed by the evaluation of clinicopathologic factors including the tumor invasion depth, known as the Breslow depth, and ulceration of the tumor surface. Ulcerating tumors and melanomas that grow deeper vertically into the skin are associated with higher risk of an adverse outcome.
- SLN biopsies are not recommended for T1a thin melanomas, 'may be recommended' for a T1b thin-melanoma patients, are recommended for T2 and T3 intermediate thickness melanoma patients and 'may be recommended' for T4 thick-melanoma patients.
- a further object of the present invention is to predict the prognosis of an individual afflicted with primary cutaneous melanoma. This information is useful, e.g., in order to determine an optimal treatment strategy.
- US 2016/222457 A1 discloses a method to differentiate between melanoma with high and low risk of regional metastasis using an expression signature comprising eight marker genes, including ITGB3 and PLAT.
- the invention provides a method for classifying an individual afflicted with primary cutaneous melanoma, comprising determining in a melanoma tissue sample from said individual a gene expression signature, wherein the gene expression signature comprises ITGB3, PLAT, GDF15 and IL8 and wherein individual is classified as having a metastasis-positive SLN or is classified as having a metastasis-negative SLN.
- the invention also provides a method for determining a treatment and/or diagnostic work-up schedule for an individual afflicted with cutaneous melanoma, comprising determining in a melanoma tissue sample from said individual a gene expression signature comprising determining the level of expression of ITGB3, PLAT, GDF15 and IL8 and determining a treatment and/or diagnostic work-up schedule based on the expression levels.
- the invention also provides a method for predicting the prognosis of an individual afflicted with primary cutaneous melanoma, comprising determining in a melanoma tissue sample from said individual a gene expression signature, wherein the gene expression signature comprises ITGB3, PLAT, GDF15 and IL8 and the prognosis of the individual is determined based on the gene expression levels.
- the invention also provides a cancer treatment for use in treating an individual afflicted with primary cutaneous melanoma, comprising
- the disclosure provides, in part, methods, kits, gene signatures and means of detecting such gene signatures to perform an analysis of a primary cutaneous melanoma tumor tissue sample.
- the disclosure provides an "SLN gene signature".
- the SLN gene signature classifies an individual afflicted with primary cutaneous melanoma, in particular, the gene signature classifies the risk of the individual having a metastasis-positive SLN and/or a poor prognosis. This risk assessment is useful for physicians and patients when deciding whether an SLNB procedure and/or an alternative treatment strategy is warranted. This assessment is also useful when selecting patients for inclusion in clinical trials.
- the SLN is the first lymph node (or set of first lymph nodes) to receive lymphatic drainage from a tumor and is the first lymph node (or set of first lymph nodes) where cancer is likely to spread.
- a N-SLN is a lymph node that is not the first lymph node to receive lymphatic drainage from a tumor. Such N-SLN is often a node in the same nodal basin or in close proximity to the SLN.
- the gene signature classifies the risk of metastasis-positive SLN.
- the methods disclosed herein classify an individual as having a metastasis-positive SLN or having a metastasis-negative SLN.
- the gene signatures classifies the prognosis of the individual.
- prognosis refers to the prediction of a medical outcome and can be based on measures such as overall survival, melanoma specific survival, recurrence free survival, relapse free survival and distant relapse free survival.
- SLN gene signature can reduce the number of surgical procedures for patients classified as metastasis-negative SLN (and/or classified as having a good prognosis).
- patients having intermediate lesions would likely have undergone an SLNB procedure with a good chance that the SLN was, in fact, metastasis negative.
- Accurate classification of such patients with the SLN gene signature avoids the need for an SLNB procedure and can be used to replace the SLNB as the current standard of care for intermediate lesions.
- the reduction of unnecessary SLNBs reduces the overall health care costs and reduces the number of patients suffering from complications caused by the removal of SLNs.
- the classification of an individual as SLN metastasis positive or negative also provides prognostic information and can be used to for determining a treatment or diagnostic work-up schedule.
- the SLN gene signature is able to more accurately predict prognosis than the standard of care SLN biopsies (see Example 7). While not wishing to be bound by theory, one possible explanation as to the improved prognostic power of the gene signature over SLN biopsies relates to the technical limitation of performing such biopsies (e.g., identifying the correct lymph node to biopsy, limitations of tumor cell detection, human error in processing/classifying samples). In addition to or in the alternative, the disclosed gene signature may be able to predict SLN metastasis at a stage before it can be detected in a biopsy (e.g., the tumor has metastasized and tumor cells are in route to the SLN). In this regard, the SLN signature can be used to replace the SLNB as a criterion for inclusion in clinical trials and/or additional treatment.
- a further advantage of the SLN gene signature is that it can identify patients with thin thickness melanoma that in current standard of care may not be eligible for SLNB based on clinical parameters, but based on the gene signature are high risk for metastasis-positive SLN.
- the gene signature will greatly increase the identification of metastasis-positive SLN in thin ( ⁇ 0.8mm) melanoma patients, that are currently not eligible for SLNB procedures according to the guidelines. The early detection and treatment of such patients will increase progression free and overall survival for this patient sub-population.
- a gene expression signature (i.e., the SLN gene signature) comprising one or more of the following genes: ITGB3, PLAT, GDF15 and IL8, is useful to classify individuals and predict prognosis and in particular to classify the SLN as metastasis positive or negative. Accordingly, in one aspect the disclosure provides a gene signature comprising ITGB3, PLAT, GDF15 and IL8. In some embodiments, the SLN gene signature comprises all the following genes: ITGB3, PLAT, SPP1, GDF15 and IL8.
- the gene expression signature comprises GDF15, MLANA, PLAT, IL8, ITGB3, LOXL4, SERPINE2, and TGFBR1, more preferably wherein the gene expression signature comprises GDF15, MLANA, PLAT, IL8, ITGB3, LOXL4, ADIPOQ, SERPINE2, and TGFBR1, more preferably wherein the gene expression signature comprises GDF15, MLANA, PLAT, IL8, ITGB3, LOXL4, ADIPOQ, PRKCB, SERPINE2, ADAM12, LGALS1 and TGFBR1.
- the gene signature comprises all of the following: GDF15, MLANA, PLAT, IL8, ITGB3, LOXL4, ADIPOQ, SERPINE2, and TGFBR1.
- the inventors also demonstrate that a gene signature lacking ADIPOQ performs similarly.
- the gene signature comprises:
- the gene signature comprises all of the following: GDF15, MLANA, PLAT, IL8, ITGB3, LOXL4, ADIPOQ, PRKCB, SERPINE2, ADAM12, LGALS1 and TGFBR1.
- the gene signature comprises or all of the following: GDF15, MLANA, PLAT, IL8, ITGB3, LOXL4, PRKCB, SERPINE2, ADAM12, LGALS1 and TGFBR1.
- the gene signature consists of the above mentioned genes.
- methods for performing an analysis may comprise measuring the expression of additional genes (e.g., for normalization) but only the gene signature is used to classify an individual.
- the ITGB3 gene encodes Integrin beta-3.
- An exemplary Homo sapiens mRNA sequence can be found at the NCBI database under NM_000212.2 (17 June 2018).
- the SPP1 gene encodes secreted phosphoprotein 1.
- An exemplary Homo sapiens mRNA sequence can be found at the NCBI database under NM_001040058.1 (24 June 2018).
- the GDF15 gene encodes growth differentiation factor 15.
- An exemplary Homo sapiens mRNA sequence can be found at the NCBI database under NM_004864.3 (17 June 2018).
- the IL8 gene encodes interleukin 8.
- An exemplary homo sapiens mRNA sequence can be found at the NCBI database under AF043337.1 (1 February 2001).
- the MLANA gene encodes melan-A.
- An exemplary homo sapiens mRNA sequence can be found at the NCBI database under NM_005511 (20 Oct 2018).
- the LOXL4 gene encode lysyl oxidase like 4.
- An exemplary homo sapiens mRNA sequence can be found at the NCBI database under NM_032211 (22 Nov 2018).
- the ADIPOQ gene encodes adiponectin, C1Q and collagen domain containing.
- An exemplary homo sapiens mRNA sequence can be found at the NCBI database under NM_004797 (2 Dec 2018).
- the PRKCB gene encodes protein kinase C beta.
- An exemplary homo sapiens mRNA sequence can be found at the NCBI database under NM_212535 (12 Nov 2018).
- the SERPINE2 gene encodes serpin family E member 2.
- An exemplary homo sapiens mRNA sequence can be found at the NCBI database under NM_006216 (17 Nov 2018).
- the ADAM12 gene encodes ADAM metallopeptidase domain 12.
- An exemplary homo sapiens mRNA sequence can be found at the NCBI database under NM_003474 (5 Aug 2018).
- the LGALS1 gene encodes galectin 1.
- An exemplary homo sapiens mRNA sequence can be found at the NCBI database under NM_002305 (22 Nov 2018).
- the TGFBR1 gene encodes transforming growth factor beta receptor 1.
- An exemplary homo sapiens mRNA sequence can be found at the NCBI database under NM_004612 (28 Oct 2018).
- the disclosure further provides methods of classifying an individual comprising determining in a sample the SLN gene signature.
- the individual may be classified as having metastasis-positive SLN or metastasis-negative SLN.
- the individual may be classified as having good or poor prognosis.
- a gene signature associated with SLN metastasis was previously reported ( Meves et al. J Clinical Oncology 2015 33:2509-2516 ). The algorithm uses the clinicopathological variables age, Breslow depth and ulceration combined with primary melanoma gene expression of four genes ITGB3, LAMB1, PLAT and TP53, to predict SLN metastasis. As shown in Figure 3 , the present SLN gene signature outperforms the previously reported signature.
- the disclosure provides an "N-SLN gene signature".
- the N-SLN gene signature classifies an individual afflicted with primary cutaneous melanoma, in particular, the gene signature classifies the risk of the individual having a metastasis-positive non-sentinel lymph node (N-SLN). This risk assessment is useful for physicians and patients when deciding treatment options and to determine the patient's prognosis.
- the N-SLN gene signature classifies the risk of metastasis-positive N-SLN.
- An individual may be classified as having metastasis-positive N-SLN or metastasis-negative N-SLN.
- the invasion of tumor cells to distantly located lymph nodes is an indicator of poor prognosis and suggests the use of more aggressive forms of treatment. Early detection and treatment is expected to improve patient outcome.
- a gene expression signature (i.e., the N-SLN gene signature) comprising one or more of the following genes: KRT14, SPP1, FN1, LOXL3, is useful to classify individuals and in particular to determine risk of metastasis-positive N-SLN.
- the KRT14 gene encodes keratin 14.
- An exemplary Homo sapiens mRNA sequence can be found at the NCBI database under NM_000526.4 (17 June 2018).
- the FN1 gene encodes fibronectin 1.
- An exemplary Homo sapiens mRNA sequence can be found at the NCBI database under NM_001306129.1 (3 June 2018).
- the LOXL3 gene encodes lysyl oxidase like 3.
- An exemplary homo sapiens mRNA sequence can be found at the NCBI database under NM_001289165.1 (30 June 2018).
- the disclosure further provides methods of classifying an individual comprising determining in a sample the N-SLN gene signature.
- the individual may be classified as having metastasis-positive N-SLN or metastasis-negative N-SLN.
- methods are provided which determine both the SLN gene signature and the N-SLN gene signature.
- Analysis of the gene signatures disclosed herein may be performed in any individual, including mammals and humans, although humans are preferred.
- the individual has been diagnosed with a cutaneous melanoma of T1-T3.
- the individual has not yet undergone a biopsy of the SLN of the primary melanoma, in particular when the gene signature is the SLN gene signature.
- the gene signature is particularly useful to classify individuals with a young age, with a high mitotic rate (e.g., above 2/mm 2 ), previous history of disease, familial history of disease with poor outcome, and/or with lymph vascular invasion.
- the gene expression signatures are useful for predicting the risk or likelihood that tumor cells have metastasized to an SLN or N-SLN.
- the classification of an individual refers to a probability or "risk of” and not that 100% of all patients that are predicted to be at risk will in fact have detectable metastases (referred to as sensitivity or Positive Percent Agreement) nor that 0% of all patients that are predicted not to have metastases will in fact be clear of metastases (referred to as specificity or Negative Percent Agreement).
- the SLN and N-SLN gene expression signatures exhibit high performance levels for both sensitivity and specificity.
- the SLN gene signature is able to better predict the prognosis of an individual afflicted with melanoma than the standard of care SLN biopsy.
- the disclosure thus demonstrates that the gene expression signature is useful for predicting the prognosis of an individual.
- metastasis refers to the presence of tumor cell clusters and does not include lymph nodes which only contain isolated or rare tumor cells. In some embodiments, metastasis refers to the presence of cell clusters that are at least 0.1mm in diameter either with or without extra-capsular extension.
- Suitable samples include primary cutaneous melanoma lesion biopsies. Such biopsies include a resected lesion (e.g., wide-excision removal of a tumor). Samples may be processes or preserved by any means known in the art to be compatible with gene expression profiling.
- the sample may be a formalin fixed paraffin embedded primary cutaneous melanoma lesion biopsy, as well as a frozen sample.
- the sample is an RNA-containing sample.
- RNA isolation can be performed using purification kit, buffer set and protease from commercial manufacturers, such as Qiagen, according to the manufacturer's instructions (QIAGEN Inc., Valencia, Calif.). For example, total RNA from cells in culture can be isolated using Qiagen RNeasy mini-columns. Numerous RNA isolation kits are commercially available and can be used in the methods of the invention.
- the methods disclosed herein comprise determining a gene expression signature.
- the methods comprise determining a level of gene expression.
- Gene expression levels can be determined by measuring the level of nucleic acid or protein expression.
- the level of mRNA expression is determined.
- nucleic acid or protein is purified from the sample and gene expression is measured by nucleic acid or protein expression analysis.
- the level of protein expression can be determined by any method known in the art including ELISAs, immunocytochemistry, flow cytometry, Western blotting, proteomic, and mass spectrometry.
- nucleic acid expression levels are determined.
- the level of nucleic acid expression may be determined by any method known in the art including RT-PCR, quantitative PCR, Northern blotting, gene sequencing, in particular RNA sequencing, and gene expression profiling techniques.
- Representative methods for sequencing-based gene expression analysis include Serial Analysis of Gene Expression (SAGE), and gene expression analysis by massively parallel signature sequencing (MPSS).
- the nucleic acid is RNA, such as mRNA or pre-mRNA.
- the level of RNA expression determined may be detected directly or it may be determined indirectly, for example, by first generating cDNA and/or by amplifying the RNA/cDNA.
- a primary melanoma sample is obtained; RNA is extracted from the tissue sample; followed by reverse transcribing an RNA transcript of the genes of interest (e.g., biomarkers and housekeeping genes) to produce cDNAs of the RNA transcripts; and amplifying the cDNAs to produce amplicons from the cDNAs for determination of expression levels of the RNA transcripts.
- gene expression may be determined by NanoString gene expression analysis.
- NanoString is a multiplexed method for detecting gene expression and provides a method for direct measurement of mRNAs without the use of transcription or amplification. NanoString and aspects thereof are described in Geiss et al., "Direct multiplexed measurement of gene expression with color- coded probe pairs" Nature Biotechnology 26, 317 - 325 (2008 );
- the level of expression need not be an absolute value but may rather be a normalized expression value or a relative value.
- the levels of expression can be normalized against housekeeping or reference gene expression.
- genes include ABCF1, ACTB, ALAS1, CLTC, G6PD, GAPDH, GUSB, HPRT1, LDHA, PGK1, POLR1B, POLR2A, RPL19, RPLPO, SDHA, TBP, and TUBB.
- Normalization is also useful when expression is determined based on microarray data. Normalization allows for correction for variation within microarrays and across samples so that data from different chips can be simultaneously analyzed.
- the robust multi-array analysis (RMA) algorithm may be used to pre-process probe set data into gene expression levels for all samples. ( Irizarry R A, et al., Biostatistics (2003 ) and Irizarry R A, et al., Nucleic Acids Res. (2003 )).
- RMA multi-array analysis
- Affymetrix's default preprocessing algorithm MAS 5.0
- Additional methods of normalizing expression data are described in US20060136145 .
- the expression levels are determined using Real-time PCR (i.e., quantitative PCR or qPCR).
- qPCR real-time PCR
- reactions are characterized by the point in time during cycling when amplification of a target is first detected rather than the amount of target accumulated after a fixed number of cycles. This point when the signal is first detected is referred to as the threshold cycle (Ct).
- expression of the gene signature is quantified relative to each other by normalization against the expression of housekeeping genes by subtracting the Ct of the signature genes from the averaged Ct of the housekeeping genes. In some embodiments, these ⁇ Ct values are then combined with the patient's age and melanoma lesion's Breslow Depth in an algorithm to calculate the prediction of SLN metastasis.
- the housekeeping genes used for normalization are ACTB, RPLP0 and RPL8. However, other housekeeping genes may be used.
- the ratios of the gene expression signals may be subsequently combined with clinical variables in an algorithm to calculate the prediction of the outcome of a patient SLNB. Results are expressed as a binary classification (negative or positive).
- a "negative” result would indicate that the individual has a low risk of metastasis-positive SLN or rather that the individual has a good prognosis, whereas a "positive” result would indicate that the individual has a high risk of a metastasis-positive SLN or rather a poor prognosis.
- the methods described herein classify an individual based on gene expression signatures.
- the differential expression of one or more genes of the signature in an individual indicates that the individual is at risk of metastasis, or rather, indicates the prognosis of the individual.
- “differentially-expressed” means that the measured expression level in a subject differs significantly from a reference.
- the reference may be a single value or a numerical range. It is within the purview of a skilled person to determine the appropriate reference value.
- the reference value is a predetermined value.
- the reference value is the average of the expression value in a particular patient class.
- the reference value may be the average of the expression value in a class of patients that have clinically confirmed SLN metastasis (or for the N-SLN signature, patients that have clinically confirmed N-SLN metastasis).
- a reference value may also be in the form of or derived from an equation. It is within the purview of one skilled in the art to determine whether the expression level in the patient differs "significantly" from a reference.
- the reference value is determined from a cohort of melanoma patients who underwent an SLNB as described in the examples. It is clear to a skilled person that data from similar studies may also be used.
- the strength of the correlation between the expression level of a differentially-expressed gene and a specific patient response class may be determined by a statistical test of significance. For example, a chi square test may be used to assign a chi square value to each differentially-expressed marker, indicating the strength of the correlation of the expression of that marker to a specific patient response class. Similarly, the T-statistics metric and the Wilkins' metric both provide a value or score indicative of the strength of the correlation between the expression of the marker and its specific patient response class. In addition, SAM or PAM analysis tools may be used to determine the strength of correlations.
- the gene expression signature from an individual is compared to the reference expression signature to determine whether the gene expression signature from an individual is sufficiently similar to the reference profile.
- the gene expression signature from an individual is compared to a plurality of reference expression signatures to select the reference expression profile that is most similar to the gene expression profile from an individual. Any method known in the art for comparing two or more data sets to detect similarity between them may be used to compare the gene expression signature from an individual to the reference expression profiles.
- classification refers to identifying to which set of categories a new observation belongs, on the basis of a training set of data containing observations (or instances) whose category membership is known.
- An algorithm that implements classification, especially in a concrete implementation, is known as a classifier.
- Many classifiers are known in the art, with linear or non-linear classifier boundaries, such as but not limited to: ClaNC, nearest mean classifier, weighted voting method, simple Bayes classifier, linear discriminant analysis (LDA), quadratic discriminant analysis (QDA), Support Vector Machines (SVM), or the k-nearest neighbor (k-nn) classifier.
- LDA linear discriminant analysis
- QDA quadratic discriminant analysis
- SVM Support Vector Machines
- k-nn k-nearest neighbor
- a logistic regression classifier is used. Exemplary embodiments implementing a logistic regression classifier are described in the examples.
- Sensitivity refers to the proportion of actual positives that are correctly identified as such and high sensitivity is desired to avoid false negatives (e.g., patients classified as metastasis negative that are in fact positive).
- Specificity refers to the proportion of actual negatives that are correctly identified as such and high specificity is desired to avoid false positives (e.g., patients classified as metastasis positive that are in fact negative).
- the classifiers are trained for high sensitivity in order to identify individuals with metastasis.
- the methods for classifying an individual further utilize the age of the individual and/or the Breslow depth of the tumor.
- the ulceration and/or the mitotic rate may be determined.
- Breslow depth is measured from the top of the granular layer of the epidermis (or, if the surface is ulcerated, from the base of the ulcer) to the deepest invasive cell across the broad base of the tumor (dermal/subcutaneous). Ulceration refers to the sloughing of dead tissue and is thought to reflect rapid tumor growth, leading to the death of cells in the center of the melanoma.
- the mitotic rate may be measured by examining the excised tumor and counting the number of cells exhibiting mitosis.
- a combined model which comprises the gene signature comprising GDF15, MLANA, PLAT, IL8,ITGB3,LOXL4, SERPINE2 and TGFBR1 and the clinical variables of age and Breslow depth.
- the gene signature additionally comprises AIDPOQ.
- kits for determining the gene expression signatures disclosed herein comprise primer pairs for performing qPCR on the gene signatures disclosed herein.
- the kits comprise a control nucleic acid for one or more, preferably for each, primer pair.
- the control nucleic acid is cDNA and more preferably the cDNA corresponds to a sequence that spans at least one intron/exon boundary of the respective gene.
- Such cDNA is useful to distinguish gene expression from genomic contamination.
- one or more primers of the primer pair are chemically modified. Such modified primers include fluorescently or radioactively labeled primers.
- results of the gene expression analyzes disclosed herein are useful for determining a diagnostic work-up schedule.
- an individual classified as have metastasis-positive SLN or a poor prognosis can undergo a SLNB.
- immunotherapy is administered to an individual that is predicted to be SLN positive or rather predicted to have poor prognosis.
- a subsequent SLNB readout can be a measure of response to the immunotherapy.
- an appropriate treatment regime can be determined.
- treatment refers to reversing, alleviating, delaying the onset of, or inhibiting the progress of melanoma, or one or more symptoms thereof.
- individuals classified as having metastatic-positive SLN or rather a poor prognosis may be treated with SLNB.
- the location of the SLN may be determined based on the location of the melanoma and/or with methods such as "SLN mapping", as known to a skilled person and described herein.
- a metastasis-positive N-SLN can be treated by performing a surgical procedure, for instance a surgical lymph node dissection.
- Metastatic-N-SLN may be treated with a complete lymph node dissection and/or other therapies for treating melanoma .
- a cancer treatment is administered to the individual.
- an "adjuvant treatment" is administered to an individual.
- Adjuvant treatment refers to the administration of one or more drugs to a patient after surgical resection of one or more cancerous tumors, where all detectable and resectable disease (e.g. cancer) has been removed from the patient, but where there remains a statistical risk of relapse.
- Adjuvant treatment is useful to diminish the likelihood or the severity of reoccurrence or the disease.
- melanoma therapies which may be indicated based on the gene expression signatures include:
- Suitable routes include oral, rectal, nasal, topical (including buccal and sublingual), vaginal, and parenteral (including subcutaneous, intramuscular, intraveneous, intradermal, intrathecal, and epidural).
- to comprise and its conjugations is used in its non-limiting sense to mean that items following the word are included, but items not specifically mentioned are not excluded.
- verb "to consist” may be replaced by "to consist essentially of” meaning that a compound or adjunct compound as defined herein may comprise additional component(s) than the ones specifically identified, said additional component(s) not altering the unique characteristic of the invention.
- an element means one element or more than one element.
- Example 1 Gene signature to predict SLN metastasis status
- the following 29 genes were measured: KRT14, MLANA, MITF, ITGB3, PLAT, LAMB1, TP53, AGRN, THBS2, PTK2, SPP1, COL4A1, CDKN1A, CDKN2A, PLOD3, GDF15, FN1, TNC, THBS1, CTGF, LOXL1, LOXL3, ITGA5, ITGA3, ITGA2, CSRC, CXCL1, IL8, LAMB.
- PPA Positive Percent Agreement
- NPA Netowder Percent Agreement
- PPA 100 TP TP + FN
- NPA 100 TN TN + FP
- TP represents the number of True Positives
- FN the number of False Negatives
- TN the number of True Negatives
- FP the number of False Positives.
- the formulas for the PPA and NPA criteria are equivalent to the sensitivity and specificity, respectively. However, since a comparison is made relative to a non-golden standard reference (FISH data), the terms PPA and NPA will be used.
- a single performance criterion is required that should be maximized (or minimized in case of an error criterion).
- Classifier Logistic regression with penalized maximum likelihood
- Wessels et al. [ Wessels et al. Bioinformatics, Volume 21, Issue 19, 2005, Pages 3755-3762 ] described a generally applicable framework for building diagnostic classifiers from high throughput data by means of double loop cross validation (DLCV).
- DLCV double loop cross validation
- a DLCV exercise enables the developer to estimate/predict the performance (in terms of generalized error) of the classifier for future applicability on data independent from the training data set.
- This methodology was adopted combined with forward filtering as feature selector, the t-statistic as criterion to evaluate the individual genes, and different classifiers.
- the training and validation procedure was performed employing 100 repeats of 3 folds cross validation in the outer (validation) loop, and 10 fold cross validation in the inner loop.
- the algorithm learns the optimal parameter lambda for LASSO regularization. At all points data splits were stratified with respect to the class prior probabilities.
- the double loop cross validation method can be described in a few steps:
- Table1 depicts the performance of the of the final classifier trained on the entire 770 patient cohort classifier for four different operating points: 1) max bACC: max balanced accuracy, 2) SEeqSP, sensitivity equal to specificity, 3) NPV97, NPV set to 0.97 in training, 4) LRNn025, log likelihood ratio for the negative test result set to 0.25 in training. If the coefficient is positive, then higher value implies increased risk. If the coefficient is negative, then the reduced value implies decreased risk. Variables with larger (absolute) coefficients have a larger contribution.
- Table 2 depicts the performance of the classifiers trained in DLCV, averaged over 100 repeats, for four different operating points: 1) max bACC: max balanced accuracy, 2) SEeqSP, sensitivity equal to specificity, 3) NPV97, NPV set to 0.97 in training, 4) LRNn025, log likelihood ratio for the negative test result set to 0.25 in training.
- Table 3 The parameter "Age” is entered in years and the "Breslow depth” in millimetres. Ulceration is a Boolean variable (yes/no).
- the table depicts the performance of the of the final classifier trained on the entire 770 patient cohort classifier for four different operating points: 1) max bACC: max balanced accuracy, 2) SEeqSP, sensitivity equal to specificity, 3) NPV97, NPV set to 0.97 in training, 4) LRNn025, log likelihood ratio for the negative test result set to 0.25 in training.
- Table 4 depicts the performance of the classifiers trained in DLCV, averaged over 100 repeats, for four different operating points: 1) max bACC: max balanced accuracy, 2) SEeqSP, sensitivity equal to specificity, 3) NPV97, NPV set to 0.97 in training, 4) LRNn025, log likelihood ratio for the negative test result set to 0.25 in training.
- Table 5 depicts the performance of the of the final classifier trained on the entire 770 patient cohort classifier for four different operating points: 1) max bACC: max balanced accuracy, 2) SEeqSP, sensitivity equal to specificity, 3) NPV97, NPV set to 0.97 in training, 4) LRNn025, log likelihood ratio for the negative test result set to 0.25 in training.
- Table 6 depicts the performance of the classifiers trained in DLCV, averaged over 100 repeats, for four different operating points: 1) max bACC: max balanced accuracy, 2) SEeqSP, sensitivity equal to specificity, 3) NPV97, NPV set to 0.97 in training, 4) LRNn025, log likelihood ratio for the negative test result set to 0.25 in training.
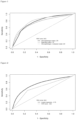
- Figure 1 depicts the ROC curves for the logistic regression classifiers trained in DLCV on: 1) gene expression, 2) clinic-pathological variables, 3) gene expression and clinic-pathological variables combined.
- Table 7 depicts the average performance of the classifiers trained in DLCV on: 1) gene expression ("GE”; i.e., ITGB3, PLAT, SPP1, GDF15 and IL8 gene signature, 2) clinic-pathological variables ("CL”; i.e., age and Breslow depth), 3) gene expression and clinic-pathological variables combined (“GECL”).
- GE gene expression
- CL clinic-pathological variables
- NPV97 NPV set to 0.97 in training.
- Table 8 depicts the performance of the of the ITLP score on the entire 770 patient cohort.
- Table 9 depicts the performance of the of the final classifier trained on the entire 770 patient cohort classifier for four different operating points: 1) max bACC: max balanced accuracy, 2) SEeqSP, sensitivity equal to specificity, 3) NPV97, NPV set to 0.97 in training, 4) LRNn025, log likelihood ratio for the negative test result set to 0.25 in training.
- Table 10 depicts the performance of the classifiers trained in DLCV, averaged over 100 repeats, for four different operating points: 1) max bACC: max balanced accuracy, 2) SEeqSP, sensitivity equal to specificity, 3) NPV97, NPV set to 0.97 in training, 4) LRNn025, log likelihood ratio for the negative test result set to 0.25 in training.
- ITLP vs. ITGB3, PLAT, GDF15, SPP1 and IL8 gene signature
- Figure 2 depicts the ROC curves for the ITLP score and for the ITGB3, PLAT, GDF15, SPP1 and IL8 gene signature ("referred to as logistic regression" in the figure).
- the ITGB3, PLAT, GDF15, SPP1 and IL8 gene signature clearly outperforms the ITLP signature.
- the previous examples used 5 genes: ITGB3, PLAT, GDF15, SPP1 and IL8 for the gene signature.
- ITGB3, PLAT, GDF15, SPP1 and IL8 was investigated the performance of all possible subsets of 2, 3 and 4 genes.
- the number of subsets of a specific dimension that can be selected from the total number of genes for the following signatures is as follows: 10 subsets from signatures with two genes, 10 subsets from signatures with three genes, 5 subsets from signatures with four genes and one signature comprising all 5.
- the AUC (or range thereof) was 0.68 for ITLP, 0.72-0.75 for all subsets of 2, 0.74-0.77 for all subsets of 3, 0.76-0.77 for all subsets of 4, and 0.77 for the 5 gene signature. This is also shown in Figure 3 . Accordingly, all gene signatures comprising at least two of the following genes: ITGB3, PLAT, GDF15, SPP1 and IL8 outperform the ITLP signature.
- Example 5 Performance for the 43 samples with low volume of metastatic disease Patients with low volume of metastatic disease (volume 1 & 2) have been excluded, in first instance, from the cohort used for training the classifier. It remains controversial whether samples having cell clusters less than 0.1 mm in diameter should be considered metastatic positive and from a clinical viewpoint are generally considered negative. In the present study, 43 patients were initially excluded from the analysis since they have a volume 1 or 2. Applying the ITGB3, PLAT, GDF15, SPP1 and IL8 classifier on such patients, resulted in the classification of 29 as positive and 14 as negative.
- misclassified positive samples are mostly from patients with thin melanomas (less than 2 mm), without ulceration, and with no angio-lymphatic invasion. In other words, these are patients that present a very low a priori risk of developing metastasis. There are a few sample misclassified in all the 100 repetitions of the algorithm.
- misclassified negative samples are mostly from patients with thick melanomas (more than 2 mm), with ulceration, and with angio-lymphatic invasion. In other words, these are patients that present a high a priori risk of developing metastasis. There are a few sample misclassified in all the 100 repetitions of the algorithm.
- the distribution of the predicted probability is uni-modal not Gaussian with a long right tale.
- the threshold used to choose the operating point falls nearby the mean of the distribution.
- the estimated probabilities do not exceed 0.6.
- Kaplan-Meier survival estimates for three types of survival were generated for the SLN classifier comprising the genes GDF15, MLANA, PLAT, IL8, ITGB3, LOXL4, ADIPOQ, PRKCB, SERPINE2, ADAM12, LGALS1, and TGFBR1 (referred to in the example as "GECL") (Tables 19-21), SLNB status (Tables 19-21), and the combination of those two (Table 22-24).
- Tables 19-26(b) describes the results with an NPV set to 0.97 in training
- Tables 19-26(c) describes the results with an NPV set to 0.98 in training. See example 8 for further discussion on this classifier.
- Kaplan-Meier method is used in order to estimate survival probability at several time intervals.
- the log-rank test is a nonparametric test used in comparing survival curves between two or more groups.
- the hazard ratio has been defined as the ratio of (risk of outcome in one group)/(risk of outcome in another group), occurring at a given interval of time.
- Hazard ratio of 1 means lack of association, a hazard ratio greater than 1 suggests an increased risk, and hazard ratio below 1 suggests a smaller risk.
- Hazard ratio is used to represent the relative difference between only two groups.
- Example 8 Refinement of SLN classifier
- the parameters of the logistic classifier model based on clinical-pathological variables are as follows. features parameters (Intercept) -2.0547083 age -0.0112913 breslow_depth 0.6116335 angiolymphatic_invasionyes 0.1205238
- Table 27 depicts the performance of the final classifier trained on the entire 754 patient cohort for four different operating points: 1) max bACC: max balanced accuracy, 2) SEeqSP, sensitivity equal to specificity, 3) NPV97, NPV set to 0.97 in training, 4) NPV98, NPV set to 0.98 in training. If the coefficient is positive, then higher value implies increased risk. If the coefficient is negative, then the reduced value implies decreased risk. Variables with larger (absolute) coefficients have a larger contribution.
- Table 28 depicts the performance of the classifiers trained in DLCV, averaged over 100 repeats, for four different operating points: 1) max bACC: max balanced accuracy, 2) SEeqSP, sensitivity equal to specificity, 3) NPV97, NPV set to 0.97 in training, 4) NPV98, NPV set to 0.98 in training.
- Parameters of the logistic classifier model based on gene expression are as follows. features parameters features parameters (Intercept) 0.2163637 ADIPOQ 0.0011397 GDF15 -0.0043387 PRKCB 0.0070037 MLANA -0.0075059 SERPINE2 -0.2954317 PLAT -0.1181693 ADAM12 -0.0088591 IL8 -0.0413252 LGALS1 -0.0291427 ITGB3 -0.0725009 TGFBR1 -0.0003869 LOXL4 -0.0211895
- Table 29 depicts the performance of the final classifier trained on the entire 754 patient cohort for four different operating points: 1) max bACC: max balanced accuracy, 2) SEeqSP, sensitivity equal to specificity, 3) NPV97, NPV set to 0.97 in training, 4) NPV98, NPV set to 0.98 in training. If the coefficient is positive, then higher value implies increased risk. If the coefficient is negative, then the reduced value implies decreased risk. Variables with larger (absolute) coefficients have a larger contribution.
- Table 30 depicts the performance of the classifiers trained in DLCV, averaged over 100 repeats, for four different operating points: 1) max bACC: max balanced accuracy, 2) SEeqSP, sensitivity equal to specificity, 3) NPV97, NPV set to 0.97 in training, 4) NPV98, NPV set to 0.98 in training.
- Parameters of the logistic classifier model based on gene expression and clinical-pathological variables are as follows. features parameters features parameters (Intercept) -0.1712118 IL8 -0.0299491 age -0.0119619 ITGB3 -0.0650425 breslow_depth 0.4152354 LOXL4 -0.0090683 GDF15 -0.0034702 ADIPOQ 0.0042436 MLANA -0.0203507 SERPINE2 -0.2287815 PLAT -0.1176641 TGFBR 1 -0.0095219
- Table 31 depicts the performance of the final classifier trained on the entire 754 patient cohort for four different operating points: 1) max bACC: max balanced accuracy, 2) SEeqSP, sensitivity equal to specificity, 3) NPV97, NPV set to 0.97 in training, 4) NPV98, NPV set to 0.98 in training. If the coefficient is positive, then higher value implies increased risk. If the coefficient is negative, then the reduced value implies decreased risk. Variables with larger (absolute) coefficients have a larger contribution.
- Table 32 depicts the performance of the classifiers trained in DLCV, averaged over 100 repeats, for four different operating points: 1) max bACC: max balanced accuracy, 2) SEeqSP, sensitivity equal to specificity, 3) NPV97, NPV set to 0.97 in training, 4) NPV98, NPV set to 0.98 in training.
- Figure 6 depicts the ROC curves for the logistic regression classifiers trained in DLCV on: 1) gene expression, 2) clinic-pathological variables, 3) gene expression and clinic-pathological variables combined and
- Figure 7 depicts the Negative Predictive Value (NPV) versus the Sentinel Lymph Node reduction Rate (SLNB RR) for the logistic regression classifiers trained in DLCV on: 1) gene expression, 2) clinic-pathological variables, 3) gene expression and clinic-pathological variables combined.
- NPV Negative Predictive Value
- SLNB RR Sentinel Lymph Node reduction Rate
- Table 33 depicts the average performance of the classifiers trained in DLCV on: 1) gene expression ("GE”; i.e., GDF15, MLANA, PLAT, IL8,ITGB3,LOXL4 ,ADIPOQ ,PRKCB,SERPINE2,ADAM12,LGALS1 and TGFBR1 gene signature, 2) clinic-pathological variables (“CL”; i.e., age, Breslow depth and presence of angiolymphatic_invasion), 3) gene expression and clinic-pathological variables combined (“GECL”: i.e. age, Breslow depth, GDF15, MLANA, PLAT, IL8,ITGB3,LOXL4 ,ADIPOQ, SERPINE2 and TGFBR1).
- GE gene expression
- MLANA i.e., GDF15, MLANA, PLAT, IL8,ITGB3,LOXL4 ,ADIPOQ, SERPINE2 and TGFBR1
- Table 34 depicts the average performance of the classifiers trained in DLCV on: 1) gene expression ("GE”; i.e., GDF15, MLANA, PLAT, IL8,ITGB3,LOXL4,ADIPOQ, PRKCB,SERPINE2,ADAM12,LGALS1 and TGFBR1 gene signature, 2) clinic-pathological variables ("CL”; i.e., age, Breslow depth and presence of angiolymphatic_invasion), 3) gene expression and clinic-pathological variables combined (“GECL”: i.e. age, Breslow depth, GDF15, MLANA, PLAT, IL8,ITGB3,LOXL4 ,ADIPOQ ,SERPINE2 and TGFBR1).
- SEeqSP specificity
- Table 35 depicts the average performance of the classifiers trained in DLCV on: 1) gene expression ("GE”; i.e., GDF15, MLANA, PLAT, IL8, ITGB3, LOXL4, ADIPOQ, PRKCB, SERPINE2, ADAM12, LGALS1 and TGFBR1 gene signature, 2) clinic-pathological variables (“CL”; i.e., age, Breslow depth and presence of angiolymphatic_invasion), 3) gene expression and clinic-pathological variables combined (“GECL”: i.e. age, Breslow depth, GDF15, MLANA, PLAT, IL8,ITGB3,LOXL4 ,ADIPOQ ,SERPINE2 and TGFBR1). For an operating points with NPV set to 0.97 in training (NPV97).
- Table 36 depicts the average performance of the classifiers trained in DLCV on: 1) gene expression ("GE”; i.e., GDF15, MLANA, PLAT, IL8,ITGB3,LOXL4 ,ADIPOQ ,PRKCB,SERPINE2,ADAM12,LGALS1 and TGFBR1 gene signature, 2) clinic-pathological variables (“CL”; i.e., age, Breslow depth and presence of angiolymphatic_invasion), 3) gene expression and clinic-pathological variables combined (“GECL”: i.e. age, Breslow depth, GDF15, MLANA, PLAT, IL8,ITGB3,LOXL4 ,ADIPOQ ,SERPINE2 and TGFBR1). For an operating points with NPV set to 0.98 in training (NPV98).
- Table 37 depicts the average performance stratified by T stage of the classifiers trained in DLCV on clinic-pathological variables ("CL"; i.e., age, Breslow depth and presence of angiolymphatic_invasion). For an operating point with NPV set to 0.97 in training (NPV97).
- CL clinic-pathological variables
- NPV97 For an operating point with NPV set to 0.97 in training (NPV97).
- Table 38 depicts the average performance stratified by T stage of the classifiers trained in DLCV on gene expression ("GE”; i.e., GDF15, MLANA, PLAT, IL8, ITGB3,LOXL4,ADIPOQ ,PRKCB,SERPINE2,ADAM12,LGALS1 and TGFBR1.
- GE gene expression
- NPV97 For an operating point with NPV set to 0.97 in training (NPV97).
- Table 39 depicts the average performance stratified by T stage of the classifiers trained in DLCV on gene expression and clinic-pathological variables combined ("GECL”: i.e. age, Breslow depth, GDF15, MLANA, PLAT, IL8,ITGB3,LOXL4 ,ADIPOQ ,SERPINE2 and TGFBR1). For an operating points with NPV set to 0.97 in training (NPV97).
- GECL i.e. age, Breslow depth, GDF15, MLANA, PLAT, IL8,ITGB3,LOXL4 ,ADIPOQ ,SERPINE2 and TGFBR1.
- Table 40 depicts the average performance stratified by T stage of the classifiers trained in DLCV on clinic-pathological variables ("CL"; i.e., age, Breslow depth and presence of angiolymphatic_invasion). For an operating point with NPV set to 0.98 in training (NPV98).
- CL clinic-pathological variables
- Table 41 depicts the average performance stratified by T stage of the classifiers trained in DLCV on gene expression ("GE”; i.e., GDF15, MLANA, PLAT, IL8,ITGB3,LOXL4 ,ADIPOQ ,PRKCB,SERPINE2,ADAM12,LGALS1 and TGFBR1.
- GE gene expression
- NPV98 For an operating point with NPV set to 0.98 in training (NPV98).
- Table 42 depicts the average performance stratified by T stage of the classifiers trained in DLCV on gene expression and clinic-pathological variables combined ("GECL”: i.e. age, Breslow depth, GDF15, MLANA, PLAT, IL8,ITGB3,LOXL4 ,ADIPOQ ,SERPINE2 and TGFBR1). For an operating points with NPV set to 0.98 in training (NPV98).
- GECL i.e. age, Breslow depth, GDF15, MLANA, PLAT, IL8,ITGB3,LOXL4 ,ADIPOQ ,SERPINE2 and TGFBR1
- Table 43 depicts the average performance stratified by clinical stage of the classifiers trained in DLCV on clinic-pathological variables ("CL"; i.e., age, Breslow depth and presence of angiolymphatic_invasion). For an operating point with NPV set to 0.97 in training (NPV97).
- CL clinic-pathological variables
- NPV97 For an operating point with NPV set to 0.97 in training (NPV97).
- Table 44 depicts the average performance stratified by clinical stage of the classifiers trained in DLCV on gene expression ("GE”; i.e., GDF15, MLANA, PLAT, IL8,ITGB3, LOXL4 ,ADIPOQ ,PRKCB,SERPINE2,ADAM12,LGALS1 and TGFBR1.
- GE gene expression
- NPV97 For an operating point with NPV set to 0.97 in training (NPV97).
- Table 45 depicts the average performance stratified by clinical stage of the classifiers trained in DLCV on gene expression and clinic-pathological variables combined ("GECL”: i.e. age, Breslow depth, GDF15, MLANA, PLAT, IL8,ITGB3,LOXL4 ,ADIPOQ ,SERPINE2 and TGFBR1). For an operating points with NPV set to 0.97 in training (NPV97).
- GECL i.e. age, Breslow depth, GDF15, MLANA, PLAT, IL8,ITGB3,LOXL4 ,ADIPOQ ,SERPINE2 and TGFBR1.
- Table 46 depicts the average performance stratified by clinical stage of the classifiers trained in DLCV on clinic-pathological variables ("CL"; i.e., age, Breslow depth and presence of angiolymphatic_invasion). For an operating point with NPV set to 0.98 in training (NPV98).
- CL clinic-pathological variables
- NPV98 For an operating point with NPV set to 0.98 in training (NPV98).
- Table 47 depicts the average performance stratified by clinical stage of the classifiers trained in DLCV on gene expression ("GE”; i.e., GDF15, MLANA, PLAT, IL8,ITGB3,LOXL4 ,ADIPOQ ,PRKCP,SERPINE2,ADAM12,LGALS1 and TGFBR1.
- GE gene expression
- NPV98 For an operating point with NPV set to 0.98 in training (NPV98).
- Table 48 depicts the average performance stratified by clinical stage of the classifiers trained in DLCV on gene expression and clinic-pathological variables combined ("GECL”: i.e. age, Breslow depth, GDF15, MLANA, PLAT, IL8,ITGB3,LOXL4 ,ADIPOQ, SERPINE2 and TGFBR1). For an operating points with NPV set to 0.98 in training (NPV98).
- GECL i.e. age, Breslow depth, GDF15, MLANA, PLAT, IL8,ITGB3,LOXL4 ,ADIPOQ, SERPINE2 and TGFBR1
- Figure 8 depicts the boxplots of the Area Under the Curve (AUC) of the ROC curve for logistic regression classifiers with subsets of 2,3,4,5,6,7,8 genes selected from GDF15, MLANA, PLAT, IL8, ITGB3, LOXL4, ADIPOQ, SERPINE2, and TGFBR1 and trained on the entire cohort.
- AUC Area Under the Curve
- Table 49 depicts the Number of subsets of a specific dimension that can be selected from the total number of genes in each the signature, and the performance in terms of minimum and maximum area under the ROC curve.
- Example 9 Non-sentinel lymph-node (N-SLN) profiler.
- Completion lymph node dissection with the removal of Non-Sentinel Lymph Node (N-SLN), has been standard for clinically node-negative melanoma patients with positive sentinel lymph nodes (SLN).
- SLN biopsy followed by immediate CLND improves regional disease control, and randomized clinical trials have shown that early surgery for lower volume SLN-positive disease results in fewer long-term sequelae (e.g. lymphedema) than surgery at nodal relapse.
- SLN and N-SLN metastasis is an adverse prognostic factor used to select patients for adjuvant therapy.
- the number of patients in the entire cohort was 140.
- Table 11 depicts the performance of the classifiers trained in DLCV, averaged over 100 repeats, for four different operating points: 1) max bACC: max balanced accuracy, 2) SEeqSP, sensitivity equal to specificity, 3) NPV97, NPV set to 0.97 in training, 4) LRNn025, log likelihood ratio for the negative test result set to 0.25 in training.
- Table 12 depicts the performance of the classifiers trained in DLCV, averaged over 100 repeats, for four different operating points: 1) max bACC: max balanced accuracy, 2) SEeqSP, sensitivity equal to specificity, 3) NPV97, NPV set to 0.97 in training, 4) LRNn025, log likelihood ratio for the negative test result set to 0.25 in training.
- Table 13 depicts the performance of the final classifier trained on the entire 140 patients cohort classifier for four different operating points: 1) max bACC: max balanced accuracy, 2) SEeqSP, sensitivity equal to specificity, 3) NPV97, NPV set to 0.97 in training, 4) LRNn025, log likelihood ratio for the negative test result set to 0.25 in training.
- Table 14 depicts the performance of the classifiers trained in DLCV, averaged over 100 repeats, for four different operating points: 1) max bACC: max balanced accuracy, 2) SEeqSP, sensitivity equal to specificity, 3) NPV97, NPV set to 0.97 in training, 4) LRNn025, log likelihood ratio for the negative test result set to 0.25 in training.
- Table 15 depicts performance of the of the final classifier trained on the entire 140 patients cohort classifier for four different operating points: 1) max bACC: max balanced accuracy, 2) SEeqSP, sensitivity equal to specificity, 3) NPV97, NPV set to 0.97 in training, 4) LRNn025, log likelihood ratio for the negative test result set to 0.25 in training.
- Table 16 depicts performance of the classifiers trained in DLCV, averaged over 100 repeats, for four different operating points: 1) max bACC: max balanced accuracy, 2) SEeqSP, sensitivity equal to specificity, 3) NPV97, NPV set to 0.97 in training, 4) LRNn025, log likelihood ratio for the negative test result set to 0.25 in training.
- Figure 4 depicts average ROC curves for the logistic regression classifiers trained in DLCV on: 1) gene expression, 2) clinic-pathological variables, 3) gene expression and clinic-pathological variables combined.
- the x-axis represents the false positive discovery rate (i.e. 1- specificity), the y-axis the true discovery rate (i.e. sensitivity).
- Figure 5 Boxplots of the area under the ROC curves for the different gene subsets and for the full set of 4 genes.
- Table 17 depicts average performance of the classifiers trained in DLCV on: 1) gene expression, 2) clinic-pathological variables, 3) gene expression and clinic-pathological variables combined. Three different operating points have been considered: 1) max bACC: max balanced accuracy, 2) SEeqSP, sensitivity equal to specificity, 3) NPV97, NPV set to 0.97 in training.
- the N-SLNprofiler profiler signature comprises 4 genes: KRT14, SPP1, FN1 and LOXL3. We have looked as well at all possible subsets of 2, 3 and 4 genes Marker Subsets of 2 Subsets of 3 Genes in Signature NSLNB 6 4 4
- AUC Area Under the Curve
- Figure 5 depicts boxplots of the area under the ROC curves for the different gene subsets and for the full set of 4 genes.
- N-SLNprofiler can be used to select which patients should undergo the CLND procedure.
- the performance of the classifier based on gene expression is of interest, since at the moment (i) there are no methods available to select the patients that would benefit from the CLND procedure, and (ii) the clinicopathologic variables used by the classifier might not be always available in the clinic.
- Table 18a depicts an average performance of the classifiers trained in DLCV on: 1) gene expression, 2) clinic-pathological variables, 3) gene expression and clinicopathologic variables combined. The chosen operating point is NPV97, namely, NPV set to 0.97 in training.
- Table 18b depicts an average performance of the classifiers trained in DLCV on: 1) gene expression, 2) clinic-pathological variables, 3) gene expression and clinicopathologic variables combined. The chosen operating point has been selected such that it maximizes the balanced accuracy.
- Fictitious data (see Table) is used as an example for the classification method, using 2 genes for simplicity, to predict whether a sample will be labeled as lymph node positive or lymph node negative by the classifier (the method/model is the same for both SLN profiler and for N-SLN profiler, just the parameters and the identities of the genes and clinical variables are different).
- the log odd-ratio and probability is calculated based on equation 1, and the probability is calculated using equation 2.
- the output label is assigned by comparing the estimated probability to the cutoff ⁇ : if the estimated probability is greater than or equal to ⁇ , then the sample is classified as node positive; if the estimated probability is smaller than ⁇ then the sample is classified as node negative.
- Model parameters ⁇ 0 , ⁇ 1 , ⁇ 2 , gene expression data ⁇ C t for genes x , y , estimated log odd-ratio log p 1 ⁇ p , estimated probability p, and the estimated output class based on a cutoff ⁇ 0.19.
- SLNB.RR SLNB Reduction Rate
- Table 19a Survival estimates at different timepoints for groups based on GECL classifier status or SLNB status. Survival curves were compared using a Cox Proportional Hazards model, see Table 25.
- Melanoma Specific Survival Time (Months) 0 40 80 120 160 Survival Probability: GECL Negative 1 0.977 0.966 0.966 0.966 Survival Probability: GECL Positive 1 0.933 0.802 0.717 0.645 Survival Probability: SLNB Negative 1 0.962 0.906 0.859 0.859 Survival Probability: SLNB Positive 1 0.903 0.704 0.704 N/A
- Table 19b Melanoma Specific Survival Time (Months) 0 40 80 120 160 Survival Probability: GECL Negative 1 0.969 0.958 0.958 0.958 Survival Probability: GECL Positive 1 0.934 0.786 0.704 N/A Survival Probability: SLNB Negative 1 0.962 0.905 0.866 0.866 Survival Probability: SLNB Positive 1 0.901
Landscapes
- Chemical & Material Sciences (AREA)
- Life Sciences & Earth Sciences (AREA)
- Health & Medical Sciences (AREA)
- Organic Chemistry (AREA)
- Proteomics, Peptides & Aminoacids (AREA)
- Engineering & Computer Science (AREA)
- Zoology (AREA)
- Wood Science & Technology (AREA)
- Analytical Chemistry (AREA)
- Immunology (AREA)
- Genetics & Genomics (AREA)
- Pathology (AREA)
- General Engineering & Computer Science (AREA)
- General Health & Medical Sciences (AREA)
- Microbiology (AREA)
- Molecular Biology (AREA)
- Biotechnology (AREA)
- Biophysics (AREA)
- Physics & Mathematics (AREA)
- Biochemistry (AREA)
- Bioinformatics & Cheminformatics (AREA)
- Oncology (AREA)
- Hospice & Palliative Care (AREA)
- Chemical Kinetics & Catalysis (AREA)
- Measuring Or Testing Involving Enzymes Or Micro-Organisms (AREA)
- Investigating Or Analysing Biological Materials (AREA)
- Medicines That Contain Protein Lipid Enzymes And Other Medicines (AREA)
Description
- The disclosure provides gene signatures of classifying an individual afflicted with cutaneous melanoma. The "SLN gene signatures" provided herein classify an individual based on prognosis and/or classify an individual as having a metastasis-positive or - negative sentinel lymph node (SLN). The "N-SLN gene signatures" provided herein classify an individual as having a metastasis-positive or -negative non-sentinel lymph node (N-SLN).
- Cutaneous melanoma is a malignant tumor that arises from the pigment producing melanocytic cells located mostly in the stratum basale of the skin's epidermis. Most lesions appear with signs as described by the ABCDE rules: Asymmetry, Border irregularity, Color variegation, Diameter larger than 6 mm and Evolution, i.e. the tendency to change rapidly Abbasi NR, Shaw HM, Rigel DS, et al. Early Diagnosis of Cutaneous Melanoma Revisiting the ABCD Criteria. JAMA. 2004;292(22):2771-2776). The sites are typically asymptomatic, however they can cause itching and/or bleeding-especially in later stages. The detection of suspicious lesions is usually done by self-examination of the skin, which is recommended to perform routinely on the basis of the ABCDE criteria or "ugly duckling signs" (Grob J. The `Ugly Duckling' Sign: Identification of the Common Characteristics of Nevi in an Individual as a Basis for Melanoma Screening. Arch Dermatol. 1998;134:103-104). When melanoma is subsequently formally diagnosed by a physician, it is important to determine the specific subtype, since there are multiple clinical and pathological varieties known. The most common form is cutaneous melanoma - a superficial spreading melanoma which comprises about 70% of cases - and which is especially frequently occurring in fair skinned people. The severity of the condition greatly depends on the ability of melanoma cells to migrate out of the primary region. For this reason assessing whether the tumor is localized or has spread to lymph nodes or organs is of paramount significance.
- Staging of melanoma is crucial for patient prognosis and to decide on further monitoring and treatment strategies. This is also reflected in the striking contrast in the reported 5-year overall survival numbers in a systematic literature review of 9 European countries: 95%-100% (stage I), 65%-92.8% (stage II), 41%-71% (stage III), and 9%-28% (stage IV). These differences are greatly dependent on the ability of the melanoma to metastasize, opposed to localized melanoma lesions. The accurate discrimination between the different stage classes is important and is most commonly based on the TNM system, referring to the thickness of the primary Tumor (T), the presence and/or extent of tumor cells to the lymph Nodes (N) and the presence of distant Metastasis to other organs (M).
- When the extent of the primary tumor-stage is evaluated, physicians take into account the tumor thickness but also additional characteristics such as presence of ulceration and the mitotic rate of the primary tumor cells. Normally, only in patients with a high tumor-stage, due to a thick melanoma and/or other variables such as ulceration, the lymph nodes and metastatic spread will be evaluated. As is understood in the art, prognosis refers to a prediction of the medical outcome of the patient. For example, an individual may be classified as having a poor prognosis or a good prognosis. The prognosis of a patient afflicted with melanoma indicates, e.g., likelihood of long-term survival, overall survival, progression free survival, prediction of relapse versus disease remission, and disease progression.
- Currently, a widely applied procedure to accurately stratify patients and predict prognosis is to determine the presence of metastases in the SLNs via the SLNB (Sentinel Lymph Node biopsy) method. The management of cutaneous melanoma patients has progressed significantly since the inclusion of lymphatic mapping by the SLNB procedure in the early 1990s (Morton DL, Wen DR, Wong JH, et al. Technical details of intraoperative lymphatic mapping for early stage melanoma. Arch Surg. 1992;127(4):392-399). The surgical technique has been improved by the implementation of a dual-modality, intraoperative approach using blue dye and a radiotracer with gamma probe detection. In addition, the pathological assessment was upgraded by the employment of serial sectioning of the SLN and immunohistochemistry. This has resulted in the better identification of the draining first lymph node or group of nodes that is situated in close proximity of the tumor (i.e., the SLN) and is therefore a likely site of metastatic disease. This procedure is also referred to as "sentinel lymph node mapping".
- The significant impact of SLN positivity was also shown in the MSLT-1 study, which indicated a difference of 5-year survival rate for patients with tumor-positive SLNs of 72.3% and patients with tumor negative SLNs 90.2%, respectively (Morton DL, Thompson JF, Cochran AJ, et al. Sentinel-Node Biopsy or Nodal Observation in Melanoma. new engl J Med. 2006;355(13):1307-1317). According to the 8th edition of the American Joint Committee on Cancer (AJCC) melanoma guidelines, the SLNB procedure is recommended for patients with a cutaneous melanoma of ≥0.8 mm (Gershenwald JE, Scolyer RA, Hess KR, et al. Melanoma Staging: Evidence-Based Changes in the American Joint Committee on Cancer Eighth Edition Cancer Staging Manual. CA Cancer J Clin. 2017;67(6):472-492). For this group of patients, a SLNB procedure is generally performed and further treatment depends on the level of metastases. Within the borderline group, SLNB can be considered, particularly if the melanoma is presented with additional adverse prognostic parameters. For patients with a melanoma thickness of <0.8 mm, the standard treatment is generally considered to be sufficient and SLNB is not recommended. The standard treatment involves local excision of the primary melanoma with wide margins, i.e., surgical resection of the tumor. As used herein, "resection" is understood to mean surgical removal of malignant tissue characteristic of melanoma from a human patient. According to one embodiment, resection shall be understood to mean removal of malignant tissue such that the presence of remaining malignant tissue within said patient is undetectable with available methods.
- The rate at which the SLNBs are classified as positive are highly variable and depending to a great extent on the known prognostic factors of the primary tumor. For clinical stage I or II patients the percentage of SLN metastasis is 15-30%, whereas in thin melanomas it is shown to be 5.2%. The current edition of the Melanoma Expert Panel staging guidelines noted the clinical relevance of the subcategorization of T1 melanomas at 0.8 mm. This is based on the detected trend in several survival studies of T1 melanomas that there is a potential clinical intercept in the region of 0.7 to 0.8 mm. However, based on the long term follow up of patients after a SLNB it was shown that regional nodal recurrence takes place in patients with sentinel nodes that were initially tumor-free. This information enabled the calculation of the SLBN test performance, which was established to have an overall false-negative rate of 12.5%. More recently, Morton et al. reported that in intermediate thickness melanomas with a 16.0% positive SLNB, 4.8% had a false negative test result based on recurrence within a 10 years follow-up period. For the 32.9% positive SLNB of the thick melanomas, the false negative rate was 10.3%.
- SLNB is not only a method to potentially stage cutaneous melanoma, but is also part of a treatment, which depending on the metastatic classification of the SLN, may or may not be necessary. The SLNB procedure can cause complications for a patient and is costly. Therefore, this procedure is only performed on a select group of patients that are considered to have a higher risk for metastatic spread - from the vast majority of low risk lesions. The risk for metastasis may be assessed by the evaluation of clinicopathologic factors including the tumor invasion depth, known as the Breslow depth, and ulceration of the tumor surface. Ulcerating tumors and melanomas that grow deeper vertically into the skin are associated with higher risk of an adverse outcome. For example, SLN biopsies are not recommended for T1a thin melanomas, 'may be recommended' for a T1b thin-melanoma patients, are recommended for T2 and T3 intermediate thickness melanoma patients and 'may be recommended' for T4 thick-melanoma patients.
- Although this concept of using clinicopathologic variables is generally able to identify high risk patients at the extreme ends of the tumor spectrum, this method is not accurate for intermediate lesions. Moreover, there also exceptions within the high - or low risk groups. For example, it is known that 5% of 'thin' melanomas (<0.8 mm invasion depth) metastasize regionally, despite the fact that they are commonly classified as having a low risk profile based on the standard clinicopathologic variables. In order to better distinguish the higher risk lesions from the 95% biologically indolent lesions, additional histologic variables such as the mitotic rate of the tumor (mitoses/mm2) and additional molecular methods such as fluorescence in-situ hybridization (FISH) have been introduced. Unfortunately, these techniques were only partially successfully, resulting in the fact that up to 95% of SLNB are negative. As a result, there is overtreatment with the current diagnostic criteria leading to a majority of patients undergoing unnecessary SLNB surgeries and developing associated side effects that could have been avoided. Vice versa, a fraction of the patients that are currently not referred to a SLNB based on their clinicopathologic factors, can still present with metastases at the SLNs or distant metastasis at a later stage. Therefore, although the SLNB procedure is accurate in identifying SLN positive nodes in resected tissue, the selection of patients eligible for this SLNB procedure remains a challenge. It is one object of the present invention to classify individuals as to their risk of having a metastasis-positive SLN and thus in need of the SLNB procedure. A further object of the present invention is to predict the prognosis of an individual afflicted with primary cutaneous melanoma. This information is useful, e.g., in order to determine an optimal treatment strategy.
-
US 2016/222457 A1 discloses a method to differentiate between melanoma with high and low risk of regional metastasis using an expression signature comprising eight marker genes, including ITGB3 and PLAT. - The invention provides a method for classifying an individual afflicted with primary cutaneous melanoma, comprising determining in a melanoma tissue sample from said individual a gene expression signature, wherein the gene expression signature comprises ITGB3, PLAT, GDF15 and IL8 and wherein individual is classified as having a metastasis-positive SLN or is classified as having a metastasis-negative SLN.
- The invention also provides a method for determining a treatment and/or diagnostic work-up schedule for an individual afflicted with cutaneous melanoma, comprising determining in a melanoma tissue sample from said individual a gene expression signature comprising determining the level of expression of ITGB3, PLAT, GDF15 and IL8 and determining a treatment and/or diagnostic work-up schedule based on the expression levels.
- The invention also provides a method for predicting the prognosis of an individual afflicted with primary cutaneous melanoma, comprising determining in a melanoma tissue sample from said individual a gene expression signature, wherein the gene expression signature comprises ITGB3, PLAT, GDF15 and IL8 and the prognosis of the individual is determined based on the gene expression levels.
- The invention also provides a cancer treatment for use in treating an individual afflicted with primary cutaneous melanoma, comprising
- determining in a melanoma tissue sample from said individual a gene expression signature, wherein the gene expression signature comprises ITGB3, PLAT, GDF15 and IL8,
- classifying said individual as having a metastasis-positive SLN and/or a poor prognosis based on the gene expression signature, and
- treating said individual by performing a SLNB and/or providing a cancer treatment to said individual, wherein said cancer treatment is selected from
- chemotherapy, preferably wherein said chemotherapy is selected from dacarbazine, temozolomide, carboplatin, paclitaxel, cisplatin, and vinblastine;
- radiation therapy;
- immunotherapy, preferably wherein said immunotherapy is selected from cytokines, immune checkpoint inhibitors, and oncolytic immunotherapy; and
- targeted therapy drugs selected from BRAF inhibitors, preferably selected from vemurafenib or dabrafenib, and MEK inhibitors, preferably selected from cobimetinib and trametinib.
-
-
Figure 1 :Average ROC curves for the logistic regression classifiers trained in DLCV on: 1) ITGB3, PLAT, SPP1, GDF15 and IL8 gene signature (molecular model), 2) clinic-pathological variables (age and Breslow depth), 3) ITGB3, PLAT, SPP1, GDF15 and IL8 gene signature and clinic-pathological variables combined. The x-axis represents the false positive discovery rate (i.e. 1- specificity), the y-axis the true discovery rate (i.e. sensitivity). -
Figure 2 : ROC curves for the ITLP score and for the SLN gene signature (referred to as the "logistic regression model"), on the entire 770 patient cohort. The x-axis represents the false positive discovery rate (i.e. 1- specificity), the y-axis the true discovery rate (i.e. sensitivity). -
Figure 3 : Boxplots of the area under the ROC curves for the different ITGB3, PLAT, SPP1, GDF15 and IL8 gene subsets, for the full set of 5 ITGB3, PLAT, SPP1, GDF15 and IL8 genes and for the ITLP signature. -
Figure 4 : Average ROC curves for the logistic regression classifiers trained in DLCV on: 1) gene expression, 2) clinic-pathological variables, 3) gene expression and clinic-pathological variables combined. The x-axis represents the false positive discovery rate (i.e. 1- specificity), the y-axis the true discovery rate (i.e. sensitivity). -
Figure 5 : Boxplots of the area under the ROC curves for the different gene subsets and for the full set of 4 genes. -
Figure 6 : OVERALL PERFORMANCE COMPARISON: CL VS GE VS GECL. ROC curves for the logistic regression classifiers trained in DLCV on: 1) gene expression, 2) clinic-pathological variables, 3) gene expression and clinic-pathological variables combined. -
Figure 7 : NPV vs SLNBRR. Negative Predictive Value (NPV) versus the Sentinel Lymph Node reduction Rate (SLNB RR) for the logistic regression classifiers trained in DLCV on: 1) gene expression, 2) clinic-pathological variables, 3) gene expression and clinic-pathological variables combined. -
Figure 8 : GENE SUBSETS- AUC BOXPLOTS. Boxplots of the Area Under the Curve (AUC) of the ROC curve for logistic regression classifiers with subsets of 2,3,4,5,6,7,8 genes trained on the entire cohort. - The disclosure provides, in part, methods, kits, gene signatures and means of detecting such gene signatures to perform an analysis of a primary cutaneous melanoma tumor tissue sample. In one aspect, the disclosure provides an "SLN gene signature". The SLN gene signature classifies an individual afflicted with primary cutaneous melanoma, in particular, the gene signature classifies the risk of the individual having a metastasis-positive SLN and/or a poor prognosis. This risk assessment is useful for physicians and patients when deciding whether an SLNB procedure and/or an alternative treatment strategy is warranted. This assessment is also useful when selecting patients for inclusion in clinical trials.
- As used herein, the SLN is the first lymph node (or set of first lymph nodes) to receive lymphatic drainage from a tumor and is the first lymph node (or set of first lymph nodes) where cancer is likely to spread. A N-SLN is a lymph node that is not the first lymph node to receive lymphatic drainage from a tumor. Such N-SLN is often a node in the same nodal basin or in close proximity to the SLN.
- In some embodiments, the gene signature classifies the risk of metastasis-positive SLN. In some embodiments, the methods disclosed herein classify an individual as having a metastasis-positive SLN or having a metastasis-negative SLN. In some embodiments, the gene signatures classifies the prognosis of the individual. As used herein, prognosis refers to the prediction of a medical outcome and can be based on measures such as overall survival, melanoma specific survival, recurrence free survival, relapse free survival and distant relapse free survival.
- One advantage of the SLN gene signature is that it can reduce the number of surgical procedures for patients classified as metastasis-negative SLN (and/or classified as having a good prognosis). In particular, patients having intermediate lesions would likely have undergone an SLNB procedure with a good chance that the SLN was, in fact, metastasis negative. Accurate classification of such patients with the SLN gene signature avoids the need for an SLNB procedure and can be used to replace the SLNB as the current standard of care for intermediate lesions. The reduction of unnecessary SLNBs reduces the overall health care costs and reduces the number of patients suffering from complications caused by the removal of SLNs. In addition, the classification of an individual as SLN metastasis positive or negative also provides prognostic information and can be used to for determining a treatment or diagnostic work-up schedule.
- Surprisingly, the SLN gene signature is able to more accurately predict prognosis than the standard of care SLN biopsies (see Example 7). While not wishing to be bound by theory, one possible explanation as to the improved prognostic power of the gene signature over SLN biopsies relates to the technical limitation of performing such biopsies (e.g., identifying the correct lymph node to biopsy, limitations of tumor cell detection, human error in processing/classifying samples). In addition to or in the alternative, the disclosed gene signature may be able to predict SLN metastasis at a stage before it can be detected in a biopsy (e.g., the tumor has metastasized and tumor cells are in route to the SLN). In this regard, the SLN signature can be used to replace the SLNB as a criterion for inclusion in clinical trials and/or additional treatment.
- A further advantage of the SLN gene signature is that it can identify patients with thin thickness melanoma that in current standard of care may not be eligible for SLNB based on clinical parameters, but based on the gene signature are high risk for metastasis-positive SLN. In particular, the gene signature will greatly increase the identification of metastasis-positive SLN in thin (<0.8mm) melanoma patients, that are currently not eligible for SLNB procedures according to the guidelines. The early detection and treatment of such patients will increase progression free and overall survival for this patient sub-population.
- The examples disclosed herein demonstrate that a gene expression signature (i.e., the SLN gene signature) comprising one or more of the following genes: ITGB3, PLAT, GDF15 and IL8, is useful to classify individuals and predict prognosis and in particular to classify the SLN as metastasis positive or negative. Accordingly, in one aspect the disclosure provides a gene signature comprising ITGB3, PLAT, GDF15 and IL8. In some embodiments, the SLN gene signature comprises all the following genes: ITGB3, PLAT, SPP1, GDF15 and IL8. Preferably, wherein the gene expression signature comprises GDF15, MLANA, PLAT, IL8, ITGB3, LOXL4, SERPINE2, and TGFBR1, more preferably wherein the gene expression signature comprises GDF15, MLANA, PLAT, IL8, ITGB3, LOXL4, ADIPOQ, SERPINE2, and TGFBR1, more preferably wherein the gene expression signature comprises GDF15, MLANA, PLAT, IL8, ITGB3, LOXL4, ADIPOQ, PRKCB, SERPINE2, ADAM12, LGALS1 and TGFBR1.
- In some embodiments the gene signature comprises all of the following: GDF15, MLANA, PLAT, IL8, ITGB3, LOXL4, ADIPOQ, SERPINE2, and TGFBR1. The inventors also demonstrate that a gene signature lacking ADIPOQ performs similarly. In some embodiment the gene signature comprises:
- ITGB3, PLAT, GDF15, IL8, MLANA, and one or both of LOXL4 and SERPINE2;
- ITGB3, PLAT, GDF15, IL8, MLANA, and one or both of SERPINE2 and TGFBR1;
- ITGB3, PLAT, GDF15, IL8, and one or both of MLANA and TGFBR1;
- ITGB3, PLAT, GDF15, IL8, and one or both of TGFBR1 and SERPINE2;
- ITGB3, PLAT, GDF15, IL8, SERPINE2, and one or both of LOXL4 and TGFBR1
- ITGB3, PLAT, GDF15, IL8, LOXL4;
- ITGB3, PLAT, GDF15, IL8, SERPINE2:
- ITGB3, PLAT, GDF15, IL8, TGFBR1; or
- ITGB3, PLAT, GDF15, IL8, MLANA.
- In some embodiments the gene signature comprises all of the following: GDF15, MLANA, PLAT, IL8, ITGB3, LOXL4, ADIPOQ, PRKCB, SERPINE2, ADAM12, LGALS1 and TGFBR1. In some embodiments the gene signature comprises or all of the following: GDF15, MLANA, PLAT, IL8, ITGB3, LOXL4, PRKCB, SERPINE2, ADAM12, LGALS1 and TGFBR1.
- In some embodiments, the gene signature consists of the above mentioned genes. As is understood to a skilled person, when the SLN gene signature consists of the above mentioned genes, methods for performing an analysis may comprise measuring the expression of additional genes (e.g., for normalization) but only the gene signature is used to classify an individual.
- The ITGB3 gene encodes Integrin beta-3. An exemplary Homo sapiens mRNA sequence can be found at the NCBI database under NM_000212.2 (17 June 2018).
- The SPP1 gene encodes secreted
phosphoprotein 1. An exemplary Homo sapiens mRNA sequence can be found at the NCBI database under NM_001040058.1 (24 June 2018). The GDF15 gene encodes growth differentiation factor 15. An exemplary Homo sapiens mRNA sequence can be found at the NCBI database under NM_004864.3 (17 June 2018). - The IL8 gene encodes
interleukin 8. An exemplary homo sapiens mRNA sequence can be found at the NCBI database under AF043337.1 (1 February 2001). - The MLANA gene encodes melan-A. An exemplary homo sapiens mRNA sequence can be found at the NCBI database under NM_005511 (20 Oct 2018).
- The LOXL4 gene encode lysyl oxidase like 4. An exemplary homo sapiens mRNA sequence can be found at the NCBI database under NM_032211 (22 Nov 2018).
- The ADIPOQ gene encodes adiponectin, C1Q and collagen domain containing. An exemplary homo sapiens mRNA sequence can be found at the NCBI database under NM_004797 (2 Dec 2018).
- The PRKCB gene encodes protein kinase C beta. An exemplary homo sapiens mRNA sequence can be found at the NCBI database under NM_212535 (12 Nov 2018).
- The SERPINE2 gene encodes serpin
family E member 2. An exemplary homo sapiens mRNA sequence can be found at the NCBI database under NM_006216 (17 Nov 2018). The ADAM12 gene encodes ADAM metallopeptidase domain 12. An exemplary homo sapiens mRNA sequence can be found at the NCBI database under NM_003474 (5 Aug 2018). - The LGALS1 gene encodes
galectin 1. An exemplary homo sapiens mRNA sequence can be found at the NCBI database under NM_002305 (22 Nov 2018). - The TGFBR1 gene encodes transforming growth
factor beta receptor 1. An exemplary homo sapiens mRNA sequence can be found at the NCBI database under NM_004612 (28 Oct 2018). - The disclosure further provides methods of classifying an individual comprising determining in a sample the SLN gene signature. In some embodiments, the individual may be classified as having metastasis-positive SLN or metastasis-negative SLN. In another embodiment, the individual may be classified as having good or poor prognosis. A gene signature associated with SLN metastasis was previously reported (Meves et al. J Clinical Oncology 2015 33:2509-2516). The algorithm uses the clinicopathological variables age, Breslow depth and ulceration combined with primary melanoma gene expression of four genes ITGB3, LAMB1, PLAT and TP53, to predict SLN metastasis. As shown in
Figure 3 , the present SLN gene signature outperforms the previously reported signature. - In one aspect, the disclosure provides an "N-SLN gene signature". The N-SLN gene signature classifies an individual afflicted with primary cutaneous melanoma, in particular, the gene signature classifies the risk of the individual having a metastasis-positive non-sentinel lymph node (N-SLN). This risk assessment is useful for physicians and patients when deciding treatment options and to determine the patient's prognosis.
- In some embodiments, the N-SLN gene signature classifies the risk of metastasis-positive N-SLN. An individual may be classified as having metastasis-positive N-SLN or metastasis-negative N-SLN. The invasion of tumor cells to distantly located lymph nodes is an indicator of poor prognosis and suggests the use of more aggressive forms of treatment. Early detection and treatment is expected to improve patient outcome.
- The examples disclosed herein demonstrate that a gene expression signature (i.e., the N-SLN gene signature) comprising one or more of the following genes: KRT14, SPP1, FN1, LOXL3, is useful to classify individuals and in particular to determine risk of metastasis-positive N-SLN.
- The KRT14 gene encodes keratin 14. An exemplary Homo sapiens mRNA sequence can be found at the NCBI database under NM_000526.4 (17 June 2018).
- The FN1 gene encodes
fibronectin 1. An exemplary Homo sapiens mRNA sequence can be found at the NCBI database under NM_001306129.1 (3 June 2018). - The LOXL3 gene encodes lysyl oxidase like 3. An exemplary homo sapiens mRNA sequence can be found at the NCBI database under NM_001289165.1 (30 June 2018).
- The disclosure further provides methods of classifying an individual comprising determining in a sample the N-SLN gene signature. In some embodiments, the individual may be classified as having metastasis-positive N-SLN or metastasis-negative N-SLN. In some embodiments, methods are provided which determine both the SLN gene signature and the N-SLN gene signature.
- Analysis of the gene signatures disclosed herein may be performed in any individual, including mammals and humans, although humans are preferred. In some embodiments, the individual has been diagnosed with a cutaneous melanoma of T1-T3. In some embodiments, the individual has not yet undergone a biopsy of the SLN of the primary melanoma, in particular when the gene signature is the SLN gene signature. The gene signature is particularly useful to classify individuals with a young age, with a high mitotic rate (e.g., above 2/mm2), previous history of disease, familial history of disease with poor outcome, and/or with lymph vascular invasion.
- The gene expression signatures are useful for predicting the risk or likelihood that tumor cells have metastasized to an SLN or N-SLN. As is clear to a skilled person, the classification of an individual refers to a probability or "risk of" and not that 100% of all patients that are predicted to be at risk will in fact have detectable metastases (referred to as sensitivity or Positive Percent Agreement) nor that 0% of all patients that are predicted not to have metastases will in fact be clear of metastases (referred to as specificity or Negative Percent Agreement). As disclosed in the examples, the SLN and N-SLN gene expression signatures exhibit high performance levels for both sensitivity and specificity. As disclosed in the examples, the SLN gene signature is able to better predict the prognosis of an individual afflicted with melanoma than the standard of care SLN biopsy. The disclosure thus demonstrates that the gene expression signature is useful for predicting the prognosis of an individual.
- As is known to a skilled person, the load of metastasis as measured by the volume of metastatic disease can differ among individuals. In some embodiments, metastasis refers to the presence of tumor cell clusters and does not include lymph nodes which only contain isolated or rare tumor cells. In some embodiments, metastasis refers to the presence of cell clusters that are at least 0.1mm in diameter either with or without extra-capsular extension.
- It is within the purview of one of skill in the art to obtain a suitable sample for determining gene expression. Suitable samples include primary cutaneous melanoma lesion biopsies. Such biopsies include a resected lesion (e.g., wide-excision removal of a tumor). Samples may be processes or preserved by any means known in the art to be compatible with gene expression profiling. For example, the sample may be a formalin fixed paraffin embedded primary cutaneous melanoma lesion biopsy, as well as a frozen sample.
- Preferably, the sample is an RNA-containing sample. General methods for mRNA extraction are well known in the art and are disclosed in standard textbooks of molecular biology, including Ausubel et al. (1997) Current Protocols of Molecular Biology, John Wiley and Sons. Methods for RNA extraction from paraffin embedded tissues are disclosed, for example, in Rupp & Locker (1987) Lab Invest. 56:A67, and De Andres et al., BioTechniques 18:42044 (1995). In particular, RNA isolation can be performed using purification kit, buffer set and protease from commercial manufacturers, such as Qiagen, according to the manufacturer's instructions (QIAGEN Inc., Valencia, Calif.). For example, total RNA from cells in culture can be isolated using Qiagen RNeasy mini-columns. Numerous RNA isolation kits are commercially available and can be used in the methods of the invention.
- The methods disclosed herein comprise determining a gene expression signature. In particular, the methods comprise determining a level of gene expression. Gene expression levels can be determined by measuring the level of nucleic acid or protein expression. Preferably, the level of mRNA expression is determined. In some embodiments, nucleic acid or protein is purified from the sample and gene expression is measured by nucleic acid or protein expression analysis. The level of protein expression can be determined by any method known in the art including ELISAs, immunocytochemistry, flow cytometry, Western blotting, proteomic, and mass spectrometry.
- Preferably, nucleic acid expression levels are determined. The level of nucleic acid expression may be determined by any method known in the art including RT-PCR, quantitative PCR, Northern blotting, gene sequencing, in particular RNA sequencing, and gene expression profiling techniques. Representative methods for sequencing-based gene expression analysis include Serial Analysis of Gene Expression (SAGE), and gene expression analysis by massively parallel signature sequencing (MPSS).
- Preferably, the nucleic acid is RNA, such as mRNA or pre-mRNA. As is understood by a skilled person, the level of RNA expression determined may be detected directly or it may be determined indirectly, for example, by first generating cDNA and/or by amplifying the RNA/cDNA. In some embodiments, a primary melanoma sample is obtained; RNA is extracted from the tissue sample; followed by reverse transcribing an RNA transcript of the genes of interest (e.g., biomarkers and housekeeping genes) to produce cDNAs of the RNA transcripts; and amplifying the cDNAs to produce amplicons from the cDNAs for determination of expression levels of the RNA transcripts.
- In some embodiments, gene expression may be determined by NanoString gene expression analysis. NanoString is a multiplexed method for detecting gene expression and provides a method for direct measurement of mRNAs without the use of transcription or amplification. NanoString and aspects thereof are described in Geiss et al., "Direct multiplexed measurement of gene expression with color- coded probe pairs" Nature Biotechnology 26, 317 - 325 (2008);
- The level of expression need not be an absolute value but may rather be a normalized expression value or a relative value. For example, the levels of expression can be normalized against housekeeping or reference gene expression. Such genes include ABCF1, ACTB, ALAS1, CLTC, G6PD, GAPDH, GUSB, HPRT1, LDHA, PGK1, POLR1B, POLR2A, RPL19, RPLPO, SDHA, TBP, and TUBB.
- Normalization is also useful when expression is determined based on microarray data. Normalization allows for correction for variation within microarrays and across samples so that data from different chips can be simultaneously analyzed. The robust multi-array analysis (RMA) algorithm may be used to pre-process probe set data into gene expression levels for all samples. (Irizarry R A, et al., Biostatistics (2003) and Irizarry R A, et al., Nucleic Acids Res. (2003)). In addition, Affymetrix's default preprocessing algorithm (MAS 5.0), may also be employed. Additional methods of normalizing expression data are described in
US20060136145 . - In some embodiments, the expression levels are determined using Real-time PCR (i.e., quantitative PCR or qPCR). In real-time PCR (qPCR), reactions are characterized by the point in time during cycling when amplification of a target is first detected rather than the amount of target accumulated after a fixed number of cycles. This point when the signal is first detected is referred to as the threshold cycle (Ct).
- In some embodiments, expression of the gene signature is quantified relative to each other by normalization against the expression of housekeeping genes by subtracting the Ct of the signature genes from the averaged Ct of the housekeeping genes. In some embodiments, these ΔCt values are then combined with the patient's age and melanoma lesion's Breslow Depth in an algorithm to calculate the prediction of SLN metastasis. In some embodiments, the housekeeping genes used for normalization are ACTB, RPLP0 and RPL8. However, other housekeeping genes may be used. The ratios of the gene expression signals may be subsequently combined with clinical variables in an algorithm to calculate the prediction of the outcome of a patient SLNB. Results are expressed as a binary classification (negative or positive). A "negative" result would indicate that the individual has a low risk of metastasis-positive SLN or rather that the individual has a good prognosis, whereas a "positive" result would indicate that the individual has a high risk of a metastasis-positive SLN or rather a poor prognosis.
- The methods described herein classify an individual based on gene expression signatures. In some embodiments, the differential expression of one or more genes of the signature in an individual indicates that the individual is at risk of metastasis, or rather, indicates the prognosis of the individual. As used herein, "differentially-expressed" means that the measured expression level in a subject differs significantly from a reference. The reference may be a single value or a numerical range. It is within the purview of a skilled person to determine the appropriate reference value. In some embodiments, the reference value is a predetermined value. In some embodiments, the reference value is the average of the expression value in a particular patient class. For example, the reference value may be the average of the expression value in a class of patients that have clinically confirmed SLN metastasis (or for the N-SLN signature, patients that have clinically confirmed N-SLN metastasis). A reference value may also be in the form of or derived from an equation. It is within the purview of one skilled in the art to determine whether the expression level in the patient differs "significantly" from a reference.
- In an exemplary embodiment, the reference value is determined from a cohort of melanoma patients who underwent an SLNB as described in the examples. It is clear to a skilled person that data from similar studies may also be used.
- The strength of the correlation between the expression level of a differentially-expressed gene and a specific patient response class may be determined by a statistical test of significance. For example, a chi square test may be used to assign a chi square value to each differentially-expressed marker, indicating the strength of the correlation of the expression of that marker to a specific patient response class. Similarly, the T-statistics metric and the Wilkins' metric both provide a value or score indicative of the strength of the correlation between the expression of the marker and its specific patient response class. In addition, SAM or PAM analysis tools may be used to determine the strength of correlations.
- In some embodiments, the gene expression signature from an individual is compared to the reference expression signature to determine whether the gene expression signature from an individual is sufficiently similar to the reference profile. Alternatively, the gene expression signature from an individual is compared to a plurality of reference expression signatures to select the reference expression profile that is most similar to the gene expression profile from an individual. Any method known in the art for comparing two or more data sets to detect similarity between them may be used to compare the gene expression signature from an individual to the reference expression profiles.
- In machine learning and statistics, classification refers to identifying to which set of categories a new observation belongs, on the basis of a training set of data containing observations (or instances) whose category membership is known. An algorithm that implements classification, especially in a concrete implementation, is known as a classifier. Many classifiers are known in the art, with linear or non-linear classifier boundaries, such as but not limited to: ClaNC, nearest mean classifier, weighted voting method, simple Bayes classifier, linear discriminant analysis (LDA), quadratic discriminant analysis (QDA), Support Vector Machines (SVM), or the k-nearest neighbor (k-nn) classifier. In a preferred embodiment, a logistic regression classifier is used. Exemplary embodiments implementing a logistic regression classifier are described in the examples.
- As is understood by a skilled person, training of a gene expression signature can be performed to favor sensitivity or specificity. Sensitivity refers to the proportion of actual positives that are correctly identified as such and high sensitivity is desired to avoid false negatives (e.g., patients classified as metastasis negative that are in fact positive).
- Specificity refers to the proportion of actual negatives that are correctly identified as such and high specificity is desired to avoid false positives (e.g., patients classified as metastasis positive that are in fact negative). Preferably, the classifiers are trained for high sensitivity in order to identify individuals with metastasis.
- In some embodiments, the methods for classifying an individual further utilize the age of the individual and/or the Breslow depth of the tumor. Optionally the ulceration and/or the mitotic rate may be determined. Breslow depth is measured from the top of the granular layer of the epidermis (or, if the surface is ulcerated, from the base of the ulcer) to the deepest invasive cell across the broad base of the tumor (dermal/subcutaneous). Ulceration refers to the sloughing of dead tissue and is thought to reflect rapid tumor growth, leading to the death of cells in the center of the melanoma. The mitotic rate may be measured by examining the excised tumor and counting the number of cells exhibiting mitosis. The higher the mitotic count, the more likely the tumor is to have metastasized. In particular embodiments, a combined model is used which comprises the gene signature comprising GDF15, MLANA, PLAT, IL8,ITGB3,LOXL4, SERPINE2 and TGFBR1 and the clinical variables of age and Breslow depth. In some embodiments, the gene signature additionally comprises AIDPOQ.
- The disclosure also provides kits for determining the gene expression signatures disclosed herein. In some embodiments, the kits comprise primer pairs for performing qPCR on the gene signatures disclosed herein. In some embodiments, the kits comprise a control nucleic acid for one or more, preferably for each, primer pair. Preferably, the control nucleic acid is cDNA and more preferably the cDNA corresponds to a sequence that spans at least one intron/exon boundary of the respective gene. Such cDNA is useful to distinguish gene expression from genomic contamination. In some embodiments, one or more primers of the primer pair are chemically modified. Such modified primers include fluorescently or radioactively labeled primers.
- The results of the gene expression analyzes disclosed herein are useful for determining a diagnostic work-up schedule. For example, an individual classified as have metastasis-positive SLN or a poor prognosis can undergo a SLNB. In some embodiments, immunotherapy is administered to an individual that is predicted to be SLN positive or rather predicted to have poor prognosis. A subsequent SLNB readout can be a measure of response to the immunotherapy.
- Based on the gene expression signatures, an appropriate treatment regime can be determined. As used herein, the terms "treatment," "treat," and "treating" refer to reversing, alleviating, delaying the onset of, or inhibiting the progress of melanoma, or one or more symptoms thereof. In some embodiments, individuals classified as having metastatic-positive SLN or rather a poor prognosis may be treated with SLNB. The location of the SLN may be determined based on the location of the melanoma and/or with methods such as "SLN mapping", as known to a skilled person and described herein.
- A metastasis-positive N-SLN can be treated by performing a surgical procedure, for instance a surgical lymph node dissection. Metastatic-N-SLN may be treated with a complete lymph node dissection and/or other therapies for treating melanoma . In some embodiments a cancer treatment is administered to the individual. In some embodiments, an "adjuvant treatment" is administered to an individual. Adjuvant treatment, as used herein, refers to the administration of one or more drugs to a patient after surgical resection of one or more cancerous tumors, where all detectable and resectable disease (e.g. cancer) has been removed from the patient, but where there remains a statistical risk of relapse. Adjuvant treatment is useful to diminish the likelihood or the severity of reoccurrence or the disease.
- Known melanoma therapies which may be indicated based on the gene expression signatures include:
- Chemotherapy: e.g., dacarbazine (DTIC), temozolomide (Temodal), carboplatin (Paraplatin, Paraplatin AQ), paclitaxel (Taxol), cisplatin (Platinol AQ), andvinblastine and (Velbe);
- Targeted therapy drugs: e.g., BRAF inhibitors (vemurafenib (Zelboraf) and dabrafenib (Tafinlar)) and MEK inhibitors (cobimetinib (Cotellic) and trametinib (Mekinist));
- Radiation therapy;
- Immunotherapy: e.g., cytokines (e.g., Interferon alfa-2b or Interleukin-2) immune checkpoint inhibitors (e.g., Ipilimumab (Yervoy), Nivolumab (Opdivo), Pembrolizumab (Keytruda)), or oncolytic immunotherapy.
- The administration of a suitable drug therapy may be administered by any appropriate route. Suitable routes include oral, rectal, nasal, topical (including buccal and sublingual), vaginal, and parenteral (including subcutaneous, intramuscular, intraveneous, intradermal, intrathecal, and epidural).
- As used herein, "to comprise" and its conjugations is used in its non-limiting sense to mean that items following the word are included, but items not specifically mentioned are not excluded. In addition the verb "to consist" may be replaced by "to consist essentially of" meaning that a compound or adjunct compound as defined herein may comprise additional component(s) than the ones specifically identified, said additional component(s) not altering the unique characteristic of the invention.
- The articles "a" and "an" are used herein to refer to one or to more than one (i.e., to at least one) of the grammatical object of the article. By way of example, "an element" means one element or more than one element.
- The word "approximately" or "about" when used in association with a numerical value (approximately 10, about 10) preferably means that the value may be the given value of 10 more or less 1% of the value.
- The invention is further explained in the following examples. These examples do not limit the scope of the invention, but merely serve to clarify the invention.
- We assembled a cohort of 813 consecutive melanoma patients who underwent SLN biopsy at tertiary care centers. Outcomes of interest were SLN and metastasis identified histologically at SLN biopsy. Expression of 29 metastasis-promoting stromal response genes in primary melanoma diagnostic biopsy tissue was by polymerase chain reaction. Logistic regression with regularization was applied to clinicopathologic variables and molecular data in a double-loop-cross-validation (DLCV) training-validation scheme.
- Out of the above clinical variables only 6 show significant difference between SLNB positive and SLNB negative:
- Age,
- Breslow Depth
- Ulceration
- Mitotic rate
- Clark level
- Angio-lymphatic invasion
- Of the 6 variables, we decide to consider only age, Breslow Depth, ulceration and mitotic rate, but not Clark level and angio-lymphatic invasion since the latter variables are not always available and their quality may differ depending on the health care provider performing the SLNB.
- We quantified gene expression by delta Ct and not by Copy number as in Meves et al. 2015, since there is no significant difference in performance in using copy number with our signature but only an increase experimental burden. KRT14 background correction has also been dropped compared to Meves et al. 2015. The so-called ITLP-normalization has been also dropped since it is based on ad-hoc over-ruling of the measured expression and it does require many arbitrary parameters mostly in the form of thresholds.
- Among the patients with positive sentinel lymph node biopsy, the load of the metastasis, as measured by the volume of metastatic disease can differ significantly:
Volume Definition 1 Isolated tumor cells or rare tumor cells only 2 Cell clusters < 0.1 mm in diameter 3 Cell clusters >=0.1 mm w/ o extra-capsular extension 4 Cell clusters >=0.1 mm with extra-capsular extension 9 Unknown - It remains controversial whether samples having cell clusters less than 0.1 mm in diameter should be considered metastatic positive and from a clinical viewpoint are generally considered negative. Therefore, we decided to exclude from the training set of the classifier the 43 patients out of 813 with volume of metastatic disease equal to 1 or 2, and evaluated separately the performance of classifier on this set. The following 29 genes were measured:
KRT14, MLANA, MITF, ITGB3, PLAT, LAMB1, TP53, AGRN, THBS2, PTK2, SPP1, COL4A1, CDKN1A, CDKN2A, PLOD3, GDF15, FN1, TNC, THBS1, CTGF, LOXL1, LOXL3, ITGA5, ITGA3, ITGA2, CSRC, CXCL1, IL8, LAMB. - In order to evaluate the performance of a classifier, contingency tables have been constructed. From these contingency tables two criteria have been derived, namely the PPA (Positive Percent Agreement) and NPA (Negative Percent Agreement): which are defined as:


- To optimize the training of a classifier, a single performance criterion is required that should be maximized (or minimized in case of an error criterion). To this end, the average of the PPA and NPA will be used:

- Other performance measures:
- Negative predictive value
- Positive predictive value
- Accuracy
- Balanced accuracy
- Log likelihood ratio for negative outcome
- Log likelihood ratio for positive outcome
- Area under ROC curve.
- All classifiers are trained on the expression levels of the 29 genes, on the clinical-pathological variables and on both.
- We used logistic regression classifiers as implemented in the R package glmnet. The parameters are estimated by maximum likelihood estimation with a L1-norm penalty term (LASSO regularization) in order to get a parsimonious representation.
- Wessels et al. [Wessels et al. Bioinformatics, Volume 21, Issue 19, 2005, Pages 3755-3762] described a generally applicable framework for building diagnostic classifiers from high throughput data by means of double loop cross validation (DLCV). A DLCV exercise enables the developer to estimate/predict the performance (in terms of generalized error) of the classifier for future applicability on data independent from the training data set. This methodology was adopted combined with forward filtering as feature selector, the t-statistic as criterion to evaluate the individual genes, and different classifiers. The training and validation procedure was performed employing 100 repeats of 3 folds cross validation in the outer (validation) loop, and 10 fold cross validation in the inner loop. In the inner loop, the algorithm learns the optimal parameter lambda for LASSO regularization. At all points data splits were stratified with respect to the class prior probabilities.
- The double loop cross validation method can be described in a few steps:
- 1. For each repeat, the data is split (stratified) into 3 parts (different splits for each repeat).
- 2. For each fold, 2 parts are used for the inner loop (training set); the 3th is used in the outer loop for validation (validation set).
- 3. On the training set data, a 10-fold cross validation is performed to estimate the optimal lambda used in the LASSO penalty term (construction of a learning curve).
- 4. Next, a classifier is trained on the complete training set, using the top optimal lambda.
- 5. Finally, the performance of that classifier is assessed on the validation set.
- 6. After all repeats are completed, a final classifier is created using all samples with the average optimal lambda. The average number of n that were obtained are used to train the classifier. This classifier will then be applied on an external validation set. Typically, datasets are unbalanced with respect to the class priors. Therefore, the balanced accuracy is a better classification performance than the accuracy since it takes the class priors into account. In each iteration, in the inner loop, we used the Brier score as performance criterion.
- Parameters of the logistic classifier model based on gene expression were as follows:
(Intercept) 0.78199268 ITGB3 -0.19497568 PLAT -0.12305874 SPP1 -0.00831690 GDF15 -0.04554275 IL8 -0.03306434 - Table1 depicts the performance of the of the final classifier trained on the entire 770 patient cohort classifier for four different operating points: 1) max bACC: max balanced accuracy, 2) SEeqSP, sensitivity equal to specificity, 3) NPV97, NPV set to 0.97 in training, 4) LRNn025, log likelihood ratio for the negative test result set to 0.25 in training. If the coefficient is positive, then higher value implies increased risk. If the coefficient is negative, then the reduced value implies decreased risk. Variables with larger (absolute) coefficients have a larger contribution.
- Table 2 depicts the performance of the classifiers trained in DLCV, averaged over 100 repeats, for four different operating points: 1) max bACC: max balanced accuracy, 2) SEeqSP, sensitivity equal to specificity, 3) NPV97, NPV set to 0.97 in training, 4) LRNn025, log likelihood ratio for the negative test result set to 0.25 in training.
- The parameters of the logistic classifier model based on clinical variables were as follows:
(Intercept) -1.86716485 Age -0.01919991 Breslow depth 0.72079160 Ulceration-yes 0.14301462 - Table 3 The parameter "Age" is entered in years and the "Breslow depth" in millimetres. Ulceration is a Boolean variable (yes/no). The table depicts the performance of the of the final classifier trained on the entire 770 patient cohort classifier for four different operating points: 1) max bACC: max balanced accuracy, 2) SEeqSP, sensitivity equal to specificity, 3) NPV97, NPV set to 0.97 in training, 4) LRNn025, log likelihood ratio for the negative test result set to 0.25 in training. Table 4 depicts the performance of the classifiers trained in DLCV, averaged over 100 repeats, for four different operating points: 1) max bACC: max balanced accuracy, 2) SEeqSP, sensitivity equal to specificity, 3) NPV97, NPV set to 0.97 in training, 4) LRNn025, log likelihood ratio for the negative test result set to 0.25 in training.
- The parameters of the logistic classifier model based on clinical variables and gene expression were as follows:
(Intercept) 0.59189841 Age -0.01356918 Breslow depth 0.4722686 ITGB3 -0.15443565 PLAT -0.13580062 SPP1 -0.00778917 GDF15 -0.05924340 IL8 -.003781148 - Table 5 depicts the performance of the of the final classifier trained on the entire 770 patient cohort classifier for four different operating points: 1) max bACC: max balanced accuracy, 2) SEeqSP, sensitivity equal to specificity, 3) NPV97, NPV set to 0.97 in training, 4) LRNn025, log likelihood ratio for the negative test result set to 0.25 in training.
- Table 6 depicts the performance of the classifiers trained in DLCV, averaged over 100 repeats, for four different operating points: 1) max bACC: max balanced accuracy, 2) SEeqSP, sensitivity equal to specificity, 3) NPV97, NPV set to 0.97 in training, 4) LRNn025, log likelihood ratio for the negative test result set to 0.25 in training.
-
Figure 1 depicts the ROC curves for the logistic regression classifiers trained in DLCV on: 1) gene expression, 2) clinic-pathological variables, 3) gene expression and clinic-pathological variables combined. - Table 7 depicts the average performance of the classifiers trained in DLCV on: 1) gene expression ("GE"; i.e., ITGB3, PLAT, SPP1, GDF15 and IL8 gene signature, 2) clinic-pathological variables ("CL"; i.e., age and Breslow depth), 3) gene expression and clinic-pathological variables combined ("GECL"). Three different operating points have been considered: 1) max bACC: max balanced accuracy, 2) SEeqSP, sensitivity equal to specificity, 3) NPV97, NPV set to 0.97 in training.
- Table 8 depicts the performance of the of the ITLP score on the entire 770 patient cohort.
- The parameters of the logistic classifier model based on clinical variables and gene expression were as follows:
(Intercept) -2.07660948 Age -0.0111771 Breslow depth 0.52425831 ITLP 0.50016404 - Table 9 depicts the performance of the of the final classifier trained on the entire 770 patient cohort classifier for four different operating points: 1) max bACC: max balanced accuracy, 2) SEeqSP, sensitivity equal to specificity, 3) NPV97, NPV set to 0.97 in training, 4) LRNn025, log likelihood ratio for the negative test result set to 0.25 in training.
- Table 10 depicts the performance of the classifiers trained in DLCV, averaged over 100 repeats, for four different operating points: 1) max bACC: max balanced accuracy, 2) SEeqSP, sensitivity equal to specificity, 3) NPV97, NPV set to 0.97 in training, 4) LRNn025, log likelihood ratio for the negative test result set to 0.25 in training.
-
Figure 2 depicts the ROC curves for the ITLP score and for the ITGB3, PLAT, GDF15, SPP1 and IL8 gene signature ("referred to as logistic regression" in the figure). The ITGB3, PLAT, GDF15, SPP1 and IL8 gene signature clearly outperforms the ITLP signature. - The previous examples used 5 genes: ITGB3, PLAT, GDF15, SPP1 and IL8 for the gene signature. We investigated the performance of all possible subsets of 2, 3 and 4 genes. The number of subsets of a specific dimension that can be selected from the total number of genes for the following signatures is as follows: 10 subsets from signatures with two genes, 10 subsets from signatures with three genes, 5 subsets from signatures with four genes and one signature comprising all 5. We evaluated the performance in terms of area under the ROC curve and compared to the ITLP signature. The AUC (or range thereof) was 0.68 for ITLP, 0.72-0.75 for all subsets of 2, 0.74-0.77 for all subsets of 3, 0.76-0.77 for all subsets of 4, and 0.77 for the 5 gene signature. This is also shown in
Figure 3 . Accordingly, all gene signatures comprising at least two of the following genes: ITGB3, PLAT, GDF15, SPP1 and IL8 outperform the ITLP signature. - Example 5: Performance for the 43 samples with low volume of metastatic disease Patients with low volume of metastatic disease (
volume 1 & 2) have been excluded, in first instance, from the cohort used for training the classifier. It remains controversial whether samples having cell clusters less than 0.1 mm in diameter should be considered metastatic positive and from a clinical viewpoint are generally considered negative. In the present study, 43 patients were initially excluded from the analysis since they have avolume - False negative. The misclassified positive samples are mostly from patients with thin melanomas (less than 2 mm), without ulceration, and with no angio-lymphatic invasion. In other words, these are patients that present a very low a priori risk of developing metastasis. There are a few sample misclassified in all the 100 repetitions of the algorithm.
- False positive. The misclassified negative samples are mostly from patients with thick melanomas (more than 2 mm), with ulceration, and with angio-lymphatic invasion. In other words, these are patients that present a high a priori risk of developing metastasis. There are a few sample misclassified in all the 100 repetitions of the algorithm.
- The distribution of the predicted probability is uni-modal not Gaussian with a long right tale. The threshold used to choose the operating point falls nearby the mean of the distribution. The estimated probabilities do not exceed 0.6.
- Kaplan-Meier survival estimates for three types of survival were generated for the SLN classifier comprising the genes ITGB3, PLAT, SPP1, GDF15 and IL8 (referred to in the example as "GECL") (Tables 19-21 (a)), SLNB status (Tables 19-21 (a)), and the combination of those two (Table 22-24 (a)). As known in the literature, a positive SLNB status is associated with inferior survival. Strikingly, the GECL model provided a much stronger separation in survival estimates, which is also evident from the larger Hazard Ratios (Table 25 (a)). In addition, in a multivariate analysis, the GECL classifier also has a much larger hazard ration and more significant p-value (see Table 26 (a)). Of particular note is the very good Melanoma Specific Survival of the GECL negative group, with survival estimates of 0.966 at 160 months (Table 19 (a)).
- Similarly, Kaplan-Meier survival estimates for three types of survival were generated for the SLN classifier comprising the genes GDF15, MLANA, PLAT, IL8, ITGB3, LOXL4, ADIPOQ, PRKCB, SERPINE2, ADAM12, LGALS1, and TGFBR1 (referred to in the example as "GECL") (Tables 19-21), SLNB status (Tables 19-21), and the combination of those two (Table 22-24). Tables 19-26(b) describes the results with an NPV set to 0.97 in training, whereas Tables 19-26(c) describes the results with an NPV set to 0.98 in training. See example 8 for further discussion on this classifier.
- Combining the results from the GECL classifier output with the SLNB status provided four groups, True Positives (TP), False Positives (FP), False Negatives (FN), and True Negatives (TN). As indicated earlier, there are very few FN cases, and a substantial percentage of FP cases. Strikingly, the False Positive group (positive by GECL, negative SLNB status), has survival estimates very similar to the True Negative group. This indicates that the GECL classifier output is superior over the SLNB status as a means to provide a prognosis to Melanoma patients.
- Kaplan-Meier method is used in order to estimate survival probability at several time intervals. The log-rank test is a nonparametric test used in comparing survival curves between two or more groups.
- The hazard ratio (HR) has been defined as the ratio of (risk of outcome in one group)/(risk of outcome in another group), occurring at a given interval of time. Hazard ratio of 1 means lack of association, a hazard ratio greater than 1 suggests an increased risk, and hazard ratio below 1 suggests a smaller risk. Hazard ratio is used to represent the relative difference between only two groups.
- Four gene panels have been measured on the entire 855 cohort for a total of 109 unique genes. However, gene expression could not be measured for some of the samples because the samples could not be retrieved at the time of the analysis or there was not enough RNA. Therefore, the discovery has been done on a cohort of 754 patients instead of 770. The discovery cohort does not include patients with low volume of metastatic disease.
- For each classifier, we report
- Performance of the final classifier trained o the entire cohort
- Average performance in cross validation (100 repeats of double loop cross validation with 3 folds for the external loop and 10 fold for the internal loop). The performance in the 3 folds are concatenated to cover the whole cohort.
- For each claasifier the performance are calculated at 4 different operating points:
- MaxbACC: Maximum balanced accuracy
- SEeqSP: Sensitivity equal to specificity
- NPV97: Negative predictive value equal to 97% in training • NPV98: Negative predictive value equal to 98% in training
- The parameters of the logistic classifier model based on clinical-pathological variables are as follows.
features parameters (Intercept) -2.0547083 age -0.0112913 breslow_depth 0.6116335 angiolymphatic_invasionyes 0.1205238 - Table 27 depicts the performance of the final classifier trained on the entire 754 patient cohort for four different operating points: 1) max bACC: max balanced accuracy, 2) SEeqSP, sensitivity equal to specificity, 3) NPV97, NPV set to 0.97 in training, 4) NPV98, NPV set to 0.98 in training. If the coefficient is positive, then higher value implies increased risk. If the coefficient is negative, then the reduced value implies decreased risk. Variables with larger (absolute) coefficients have a larger contribution.
- Table 28 depicts the performance of the classifiers trained in DLCV, averaged over 100 repeats, for four different operating points: 1) max bACC: max balanced accuracy, 2) SEeqSP, sensitivity equal to specificity, 3) NPV97, NPV set to 0.97 in training, 4) NPV98, NPV set to 0.98 in training.
-
Parameters of the logistic classifier model based on gene expression are as follows. features parameters features parameters (Intercept) 0.2163637 ADIPOQ 0.0011397 GDF15 -0.0043387 PRKCB 0.0070037 MLANA -0.0075059 SERPINE2 -0.2954317 PLAT -0.1181693 ADAM12 -0.0088591 IL8 -0.0413252 LGALS1 -0.0291427 ITGB3 -0.0725009 TGFBR1 -0.0003869 LOXL4 -0.0211895 - Table 29 depicts the performance of the final classifier trained on the entire 754 patient cohort for four different operating points: 1) max bACC: max balanced accuracy, 2) SEeqSP, sensitivity equal to specificity, 3) NPV97, NPV set to 0.97 in training, 4) NPV98, NPV set to 0.98 in training. If the coefficient is positive, then higher value implies increased risk. If the coefficient is negative, then the reduced value implies decreased risk. Variables with larger (absolute) coefficients have a larger contribution.
- Table 30 depicts the performance of the classifiers trained in DLCV, averaged over 100 repeats, for four different operating points: 1) max bACC: max balanced accuracy, 2) SEeqSP, sensitivity equal to specificity, 3) NPV97, NPV set to 0.97 in training, 4) NPV98, NPV set to 0.98 in training.
-
Parameters of the logistic classifier model based on gene expression and clinical-pathological variables are as follows. features parameters features parameters (Intercept) -0.1712118 IL8 -0.0299491 age -0.0119619 ITGB3 -0.0650425 breslow_depth 0.4152354 LOXL4 -0.0090683 GDF15 -0.0034702 ADIPOQ 0.0042436 MLANA -0.0203507 SERPINE2 -0.2287815 PLAT -0.1176641 TGFBR 1 -0.0095219 - Table 31 depicts the performance of the final classifier trained on the entire 754 patient cohort for four different operating points: 1) max bACC: max balanced accuracy, 2) SEeqSP, sensitivity equal to specificity, 3) NPV97, NPV set to 0.97 in training, 4) NPV98, NPV set to 0.98 in training. If the coefficient is positive, then higher value implies increased risk. If the coefficient is negative, then the reduced value implies decreased risk. Variables with larger (absolute) coefficients have a larger contribution.
- Table 32 depicts the performance of the classifiers trained in DLCV, averaged over 100 repeats, for four different operating points: 1) max bACC: max balanced accuracy, 2) SEeqSP, sensitivity equal to specificity, 3) NPV97, NPV set to 0.97 in training, 4) NPV98, NPV set to 0.98 in training.
-
Figure 6 depicts the ROC curves for the logistic regression classifiers trained in DLCV on: 1) gene expression, 2) clinic-pathological variables, 3) gene expression and clinic-pathological variables combined andFigure 7 depicts the Negative Predictive Value (NPV) versus the Sentinel Lymph Node reduction Rate (SLNB RR) for the logistic regression classifiers trained in DLCV on: 1) gene expression, 2) clinic-pathological variables, 3) gene expression and clinic-pathological variables combined. - Table 33 depicts the average performance of the classifiers trained in DLCV on: 1) gene expression ("GE"; i.e., GDF15, MLANA, PLAT, IL8,ITGB3,LOXL4 ,ADIPOQ ,PRKCB,SERPINE2,ADAM12,LGALS1 and TGFBR1 gene signature, 2) clinic-pathological variables ("CL"; i.e., age, Breslow depth and presence of angiolymphatic_invasion), 3) gene expression and clinic-pathological variables combined ("GECL": i.e. age, Breslow depth, GDF15, MLANA, PLAT, IL8,ITGB3,LOXL4 ,ADIPOQ, SERPINE2 and TGFBR1). For operating point max balanced accuracy (max bACC). Table 34 depicts the average performance of the classifiers trained in DLCV on: 1) gene expression ("GE"; i.e., GDF15, MLANA, PLAT, IL8,ITGB3,LOXL4,ADIPOQ, PRKCB,SERPINE2,ADAM12,LGALS1 and TGFBR1 gene signature, 2) clinic-pathological variables ("CL"; i.e., age, Breslow depth and presence of angiolymphatic_invasion), 3) gene expression and clinic-pathological variables combined ("GECL": i.e. age, Breslow depth, GDF15, MLANA, PLAT, IL8,ITGB3,LOXL4 ,ADIPOQ ,SERPINE2 and TGFBR1). For operating point with sensitivity equal to specificity (SEeqSP).
- Table 35 depicts the average performance of the classifiers trained in DLCV on: 1) gene expression ("GE"; i.e., GDF15, MLANA, PLAT, IL8, ITGB3, LOXL4, ADIPOQ, PRKCB, SERPINE2, ADAM12, LGALS1 and TGFBR1 gene signature, 2) clinic-pathological variables ("CL"; i.e., age, Breslow depth and presence of angiolymphatic_invasion), 3) gene expression and clinic-pathological variables combined ("GECL": i.e. age, Breslow depth, GDF15, MLANA, PLAT, IL8,ITGB3,LOXL4 ,ADIPOQ ,SERPINE2 and TGFBR1). For an operating points with NPV set to 0.97 in training (NPV97).
- Table 36 depicts the average performance of the classifiers trained in DLCV on: 1) gene expression ("GE"; i.e., GDF15, MLANA, PLAT, IL8,ITGB3,LOXL4 ,ADIPOQ ,PRKCB,SERPINE2,ADAM12,LGALS1 and TGFBR1 gene signature, 2) clinic-pathological variables ("CL"; i.e., age, Breslow depth and presence of angiolymphatic_invasion), 3) gene expression and clinic-pathological variables combined ("GECL": i.e. age, Breslow depth, GDF15, MLANA, PLAT, IL8,ITGB3,LOXL4 ,ADIPOQ ,SERPINE2 and TGFBR1). For an operating points with NPV set to 0.98 in training (NPV98).
- Table 37 depicts the average performance stratified by T stage of the classifiers trained in DLCV on clinic-pathological variables ("CL"; i.e., age, Breslow depth and presence of angiolymphatic_invasion). For an operating point with NPV set to 0.97 in training (NPV97).
- Table 38 depicts the average performance stratified by T stage of the classifiers trained in DLCV on gene expression ("GE"; i.e., GDF15, MLANA, PLAT, IL8, ITGB3,LOXL4,ADIPOQ ,PRKCB,SERPINE2,ADAM12,LGALS1 and TGFBR1. For an operating point with NPV set to 0.97 in training (NPV97).
- Table 39 depicts the average performance stratified by T stage of the classifiers trained in DLCV on gene expression and clinic-pathological variables combined ("GECL": i.e. age, Breslow depth, GDF15, MLANA, PLAT, IL8,ITGB3,LOXL4 ,ADIPOQ ,SERPINE2 and TGFBR1). For an operating points with NPV set to 0.97 in training (NPV97).
- Table 40 depicts the average performance stratified by T stage of the classifiers trained in DLCV on clinic-pathological variables ("CL"; i.e., age, Breslow depth and presence of angiolymphatic_invasion). For an operating point with NPV set to 0.98 in training (NPV98).
- Table 41 depicts the average performance stratified by T stage of the classifiers trained in DLCV on gene expression ("GE"; i.e., GDF15, MLANA, PLAT, IL8,ITGB3,LOXL4 ,ADIPOQ ,PRKCB,SERPINE2,ADAM12,LGALS1 and TGFBR1. For an operating point with NPV set to 0.98 in training (NPV98).
- Table 42 depicts the average performance stratified by T stage of the classifiers trained in DLCV on gene expression and clinic-pathological variables combined ("GECL": i.e. age, Breslow depth, GDF15, MLANA, PLAT, IL8,ITGB3,LOXL4 ,ADIPOQ ,SERPINE2 and TGFBR1). For an operating points with NPV set to 0.98 in training (NPV98).
- Table 43 depicts the average performance stratified by clinical stage of the classifiers trained in DLCV on clinic-pathological variables ("CL"; i.e., age, Breslow depth and presence of angiolymphatic_invasion). For an operating point with NPV set to 0.97 in training (NPV97).
- Table 44 depicts the average performance stratified by clinical stage of the classifiers trained in DLCV on gene expression ("GE"; i.e., GDF15, MLANA, PLAT, IL8,ITGB3, LOXL4 ,ADIPOQ ,PRKCB,SERPINE2,ADAM12,LGALS1 and TGFBR1. For an operating point with NPV set to 0.97 in training (NPV97).
- Table 45 depicts the average performance stratified by clinical stage of the classifiers trained in DLCV on gene expression and clinic-pathological variables combined ("GECL": i.e. age, Breslow depth, GDF15, MLANA, PLAT, IL8,ITGB3,LOXL4 ,ADIPOQ ,SERPINE2 and TGFBR1). For an operating points with NPV set to 0.97 in training (NPV97).
- Table 46 depicts the average performance stratified by clinical stage of the classifiers trained in DLCV on clinic-pathological variables ("CL"; i.e., age, Breslow depth and presence of angiolymphatic_invasion). For an operating point with NPV set to 0.98 in training (NPV98).
- Table 47 depicts the average performance stratified by clinical stage of the classifiers trained in DLCV on gene expression ("GE"; i.e., GDF15, MLANA, PLAT, IL8,ITGB3,LOXL4 ,ADIPOQ ,PRKCP,SERPINE2,ADAM12,LGALS1 and TGFBR1. For an operating point with NPV set to 0.98 in training (NPV98).
- Table 48 depicts the average performance stratified by clinical stage of the classifiers trained in DLCV on gene expression and clinic-pathological variables combined ("GECL": i.e. age, Breslow depth, GDF15, MLANA, PLAT, IL8,ITGB3,LOXL4 ,ADIPOQ, SERPINE2 and TGFBR1). For an operating points with NPV set to 0.98 in training (NPV98).
-
Figure 8 depicts the boxplots of the Area Under the Curve (AUC) of the ROC curve for logistic regression classifiers with subsets of 2,3,4,5,6,7,8 genes selected from GDF15, MLANA, PLAT, IL8, ITGB3, LOXL4, ADIPOQ, SERPINE2, and TGFBR1 and trained on the entire cohort. - Table 49 depicts the Number of subsets of a specific dimension that can be selected from the total number of genes in each the signature, and the performance in terms of minimum and maximum area under the ROC curve.
- Completion lymph node dissection (CLND), with the removal of Non-Sentinel Lymph Node (N-SLN), has been standard for clinically node-negative melanoma patients with positive sentinel lymph nodes (SLN). SLN biopsy followed by immediate CLND improves regional disease control, and randomized clinical trials have shown that early surgery for lower volume SLN-positive disease results in fewer long-term sequelae (e.g. lymphedema) than surgery at nodal relapse. Moreover, SLN and N-SLN metastasis is an adverse prognostic factor used to select patients for adjuvant therapy. However, for patients enrolled in MSLT-II no survival benefit was imparted by CLND, which has a higher complication rate than SLN surgery alone. New methods are needed to identify patients likely to benefit from CLND, i.e. those at risk of regional metastasis in N-SLN, to improve patient selection for CLND. Here we design three classifiers based on gene expression (KRT14, SPP1, FN1 and LOXL3), clinicopathologic variables (age, number of positive SLN, largest dimension of the SLN, max Breslow depth and max mitotic rate) and on both, to predict the status of N-SLN, namely presence of absence of metastasis. These classifiers can be used to select which patients should undergo the CLND procedure.
- The methods used were largely the same as indicated in example 1. The same 29 genes were evaluated. Parameters of the logistic regression classifier model based on gene expression are as follows:
Intercept -0.94837538 KRT14_3 0,06687021 SPP1_3 -0.02696531 FN1_3 -0,20982959 LOXL_3.3 -0,01722991 - The number of patients in the entire cohort was 140.
- Table 11 depicts the performance of the classifiers trained in DLCV, averaged over 100 repeats, for four different operating points: 1) max bACC: max balanced accuracy, 2) SEeqSP, sensitivity equal to specificity, 3) NPV97, NPV set to 0.97 in training, 4) LRNn025, log likelihood ratio for the negative test result set to 0.25 in training.
- Table 12 depicts the performance of the classifiers trained in DLCV, averaged over 100 repeats, for four different operating points: 1) max bACC: max balanced accuracy, 2) SEeqSP, sensitivity equal to specificity, 3) NPV97, NPV set to 0.97 in training, 4) LRNn025, log likelihood ratio for the negative test result set to 0.25 in training.
- The parameters of the logistic classifier model based on clinical variables were as follows:
(Intercept) -4,60115005 Age 0,03787092 Max breslow depth 0,04057410 slnb_num_positive.cat2+ 1,14121008 Lymph_node_largest_ 0,90937183 dim.cat2.5+ Max_mitotic.cat>6 0,35332099 - Table 13 depicts the performance of the final classifier trained on the entire 140 patients cohort classifier for four different operating points: 1) max bACC: max balanced accuracy, 2) SEeqSP, sensitivity equal to specificity, 3) NPV97, NPV set to 0.97 in training, 4) LRNn025, log likelihood ratio for the negative test result set to 0.25 in training.
- Table 14 depicts the performance of the classifiers trained in DLCV, averaged over 100 repeats, for four different operating points: 1) max bACC: max balanced accuracy, 2) SEeqSP, sensitivity equal to specificity, 3) NPV97, NPV set to 0.97 in training, 4) LRNn025, log likelihood ratio for the negative test result set to 0.25 in training.
-
Intercept -2.34454707 Age 0.02009938 slnb_num_positive.cat2+ 0.70415832 Lymph_node_largest_dim .cat2.5+ 0.67873684 KRT14_3 0.06115660 SPP1_3 -0.01572158 FN1_3 -0.22148054 LOXL3_3 -0.04907296 - Parameters of the logistic classifier model based on gene expression.
- Table 15 depicts performance of the of the final classifier trained on the entire 140 patients cohort classifier for four different operating points: 1) max bACC: max balanced accuracy, 2) SEeqSP, sensitivity equal to specificity, 3) NPV97, NPV set to 0.97 in training, 4) LRNn025, log likelihood ratio for the negative test result set to 0.25 in training.
- Table 16 depicts performance of the classifiers trained in DLCV, averaged over 100 repeats, for four different operating points: 1) max bACC: max balanced accuracy, 2) SEeqSP, sensitivity equal to specificity, 3) NPV97, NPV set to 0.97 in training, 4) LRNn025, log likelihood ratio for the negative test result set to 0.25 in training.
-
Figure 4 depicts average ROC curves for the logistic regression classifiers trained in DLCV on: 1) gene expression, 2) clinic-pathological variables, 3) gene expression and clinic-pathological variables combined. The x-axis represents the false positive discovery rate (i.e. 1- specificity), the y-axis the true discovery rate (i.e. sensitivity). -
Figure 5 : Boxplots of the area under the ROC curves for the different gene subsets and for the full set of 4 genes. - Table 17 depicts average performance of the classifiers trained in DLCV on: 1) gene expression, 2) clinic-pathological variables, 3) gene expression and clinic-pathological variables combined. Three different operating points have been considered: 1) max bACC: max balanced accuracy, 2) SEeqSP, sensitivity equal to specificity, 3) NPV97, NPV set to 0.97 in training.
- The N-SLNprofiler profiler signature comprises 4 genes: KRT14, SPP1, FN1 and LOXL3. We have looked as well at all possible subsets of 2, 3 and 4 genes
Marker Subsets of 2 Subsets of 3 Genes in Signature NSLNB 6 4 4 - Number of subsets of a specific dimension that can be selected from the total number of genes in each the signature.
- We have evaluated the performance in terms of area under the ROC curve (see table and figure)
Performance Measure Subset of 2 Subset of 3 Genes in signature AUC range 0.72-0.76 0.77-0.80 0.81 - Area Under the Curve (AUC) range for the different gene subsets, for the full set of 4 genes.
-
Figure 5 depicts boxplots of the area under the ROC curves for the different gene subsets and for the full set of 4 genes. - We describe the discovery, design and development of the N-SLNprofiler. We have shown that the N-SLNprofiler can be used to select which patients should undergo the CLND procedure.
- The performance of the classifier based on gene expression is of interest, since at the moment (i) there are no methods available to select the patients that would benefit from the CLND procedure, and (ii) the clinicopathologic variables used by the classifier might not be always available in the clinic.
- Breslow Depth (BD) is an important clinicopathologic variable characterizing the primary cutaneous melanoma, and it is known that thin melanomas (BD<=2mm) can have molecular and physiologically different characteristics compared to thick melanomas (BD>2mm). Therefore, it would make sense to choose two different operating points for thin and thick melanomas. For thin melanomas with a Breslow depth <= 2 mm (cohort of 561 samples), we keep using the classifier as described in previous section (7.8), with operating point chosen such that the NPV is 0.97 in training:
Table 18a depicts an average performance of the classifiers trained in DLCV on: 1) gene expression, 2) clinic-pathological variables, 3) gene expression and clinicopathologic variables combined. The chosen operating point is NPV97, namely, NPV set to 0.97 in training. - For thick melanomas with BD>2mm (cohort of 209 samples), we use the same classifier but with a different operating point, namely a point chosen to maximize the balanced accuracy:
Table 18b depicts an average performance of the classifiers trained in DLCV on: 1) gene expression, 2) clinic-pathological variables, 3) gene expression and clinicopathologic variables combined. The chosen operating point has been selected such that it maximizes the balanced accuracy. - The performance for Breslow depth >2 though inferior to the performance for Breslow depth <=2 mm is still acceptable since the classifier achieves a NPV of 90% in a sub-population with a prior probability of SLNB positivity of 35%: upon taking the test and having a negative outcome, the probability of having a positive SLN drops from 35% to 10%.
- Fictitious data (see Table) is used as an example for the classification method, using 2 genes for simplicity, to predict whether a sample will be labeled as lymph node positive or lymph node negative by the classifier (the method/model is the same for both SLN profiler and for N-SLN profiler, just the parameters and the identities of the genes and clinical variables are different). The table describes the model parameters β 0, β 1, β 2 for a two genes (x, y) toy model, the fictitious gene expression data ΔCt , the estimated log odd-
ratio 
equation 1, and the probability is calculated usingequation 2. The output label is assigned by comparing the estimated probability to the cutoff θ: if the estimated probability is greater than or equal to θ, then the sample is classified as node positive; if the estimated probability is smaller than θ then the sample is classified as node negative.Gene ID Parameters Gene expression (ΔCt ) 
p p ≥ θ β 0 = 0.78 x β 1 = -0.19 7.2 -1.272 0.21 Node + y β 2 = -0.12 5.7 - Table. Model parameters β 0, β 1, β 2, gene expression data ΔCt for genes x, y, estimated log odd-
ratio 


- Equivalent to the analysis performed in Example 8, a preferred embodiment of the invention was found which employs 8 genes, and 2 clinicopathologic variables (Age and Breslow Depth), comprising the following set of genes: GDF15, MLANA, PLAT, IL8, ITGB3, LOXL4, SERPINE2, and TGFBR1, The parameters of the logistic regression model are as provided below:

- Different operating points were evaluated, revealing that multiple operating points provide clinically relevant classifiers, with high NPV, and substantial reduction of the number of SLNB procedures (SLNB.RR = SLNB Reduction Rate). The NPV975 operating point of 0.116 is specifically preferred, see Table below.
- Table with performances of the GECL model with 8 genes and 2 clinicopathologic variables

- Comparing the performance of this GECL model with 8 genes and 2 clinicopathologic variables to those from Example 1 and 8, indicates that it outperforms (NPV and SLNB.RR) the expression only (GE), or clinicopathologic only (CL) models, and performs very similar to the GECL model from Example 1.
- A Kaplan-Meier analysis was performed to assess the GECL model intersected with SLNB relative to RFS, DRFS, and MSS. The 5-year / 60 month survival rates are reported in the Table below. Both the GECL and SLNB individually have a large separation between the Pos/Neg groups. More importantly, those patients identified as Pos by GECL that are SLNB Neg (and missed as such), have a very poor survival. This demonstrates the clinical relevance of the GECL model as a prognostic marker.
MSS DRFS RFS 5 year 5 year 5 year GECL = Neg & SLNB = Neg 0.96 0.95 0.88 GECL = Neg & SLNB = Pos 0.83 0.50 0.34 GECL = Pos & SLNB = Neg 0.90 0.79 0.70 GECL = Pos & SLNB = Pos 0.84 0.72 0.50 -


Table 19a: Survival estimates at different timepoints for groups based on GECL classifier status or SLNB status. Survival curves were compared using a Cox Proportional Hazards model, see Table 25. Melanoma Specific Survival Time (Months) 0 40 80 120 160 Survival Probability: GECL Negative 1 0.977 0.966 0.966 0.966 Survival Probability: GECL Positive 1 0.933 0.802 0.717 0.645 Survival Probability: SLNB Negative 1 0.962 0.906 0.859 0.859 Survival Probability: SLNB Positive 1 0.903 0.704 0.704 N/A Table 19b: Melanoma Specific Survival Time (Months) 0 40 80 120 160 Survival Probability: GECL Negative 1 0.969 0.958 0.958 0.958 Survival Probability: GECL Positive 1 0.934 0.786 0.704 N/A Survival Probability: SLNB Negative 1 0.962 0.905 0.866 0.866 Survival Probability: SLNB Positive 1 0.901 0.695 0.695 N/A Table 19c: Melanoma Specific Survival Time (Months) 0 40 80 120 160 Survival Probability: GECL Negative 1 0.970 0.962 0.962 0.962 Survival Probability: GECL Positive 1 0.941 0.816 0.754 0.678 Survival Probability: SLNB Negative 1 0.962 0.905 0.866 0.866 Survival Probability: SLNB Positive 1 0.901 0.695 0.695 N/A Table 20a: Survival estimates at different timepoints for groups based on GECL classifier status or SLNB status. Survival curves were compared using a Cox Proportional Hazards model, see Table 25. Distant Relapse Free Survival Time (Months) 0 40 80 120 160 Survival Probability: GECL Negative 1 0.970 0.905 0.862 0.862 Survival Probability: GECL Positive 1 0.830 0.611 0.503 0.503 Survival Probability: SLNB Negative 1 0.913 0.796 0.711 0.711 Survival Probability: SLNB Positive 1 0.769 0.458 0.407 N/A Table 20b Distant Relapse Free Survival Time (Months) 0 40 80 120 160 Survival Probability: GECL Negative 1 0.955 0.894 0.854 0.854 Survival Probability: GECL Positive 1 0.819 0.583 0.469 N/A Survival Probability: SLNB Negative 1 0.912 0.793 0.716 0.716 Survival Probability: SLNB Positive 1 0.751 0.464 0.385 N/A Table 20c: Distant Relapse Free Survival Time (Months) 0 40 80 120 160 Survival Probability: GECL Negative 1 0.955 0.896 0.842 0.842 Survival Probability: GECL Positive 1 0.846 0.639 0.544 0.544 Survival Probability: SLNB Negative 1 0.912 0.793 0.716 0.716 Survival Probability: SLNB Positive 1 0.751 0.464 0.385 N/A Table 21a: Survival estimates at different timepoints for groups based on GECL classifier status or SLNB status. Survival curves were compared using a Cox Proportional Hazards model, see Table 25. Relapse Free Survival Time (Months) 0 40 80 120 160 Survival Probability: GECL Negative 1 0.933 0.893 0.851 0.851 Survival Probability: GECL Positive 1 0.690 0.601 0.531 0.531 Survival Probability: SLNB Negative 1 0.834 0.783 0.712 0.712 Survival Probability: SLNB Positive 1 0.590 0.442 0.442 N/A Table 21b: Relapse Free Survival Time (Months) 0 40 80 120 160 Survival Probability: GECL Negative 1 0.911 0.870 0.832 0.832 Survival Probability: GECL Positive 1 0.674 0.584 0.518 N/A Survival Probability: SLNB Negative 1 0.832 0.778 0.716 0.716 Survival Probability: SLNB Positive 1 0.582 0.459 0.459 N/A Table 21c: Relapse Free Survival Time (Months) 0 40 80 120 160 Survival Probability: GECL Negative 1 0.924 0.870 0.818 0.818 Survival Probability: GECL Positive 1 0.717 0.643 0.591 0.591 Survival Probability: SLNB Negative 1 0.832 0.778 0.716 0.716 Survival Probability: SLNB Positive 1 0.582 0.459 0.459 N/A Table 22a: Survival estimates at different timepoints for groups based on SLNB and GECL classifier status. Survival curves were compared using a logrank test, p<0.0001. Melanoma Specific Survival Time (Months) 0 40 80 120 160 True negative SLNB (negative) & GECL (negative) 1 0.981 0.969 0.969 0.969 False Negative SLNB (positive) & GECL (negative) 1 0.857 0.857 N/A N/A False Positive 1 SLNB (negative) & GECL (positive) 1 0.942 0.842 0.725 0.7259 True Positive SLNB (positive) & GECL (positive) 1 0.908 0.691 0.691 N/A Table 22b: Melanoma Specific Survival Time (Months) 0 40 80 120 160 True negative SLNB (negative) & GECL (negative) 1 0.973 0.961 0.961 0.961 False Negative SLNB (positive) & GECL (negative) 1 0.833 N/A N/A N/A False Positive SLNB (negative) & GECL (positive) 1 0.945 0.825 0.705 N/A True Positive SLNB (positive) & GECL (positive) 1 0.907 0.697 0.697 N/A Table 22c: Melanoma Specific Survival Time (Months) 0 40 80 120 160 True negative SLNB (negative) & GECL (negative) 1 0.975 0.967 0.967 0.967 False Negative 1 0.750 N/A N/A N/A SLNB (positive) & GECL (negative) False Positive SLNB (negative) & GECL (positive) 1 0.951 0.855 0.774 0.774 ue Positive SLNB (positive) & GECL (positive) 1 0.910 0.699 0.699 N/A Table 23a: Survival estimates at different timepoints for groups based on SLNB and GECL classifier status. Survival curves were compared using a logrank test, p<0.0001. Distant Relapse Free Survival Time (Months) 0 40 80 120 160 True negative SLNB (negative) & GECL (negative) 1 0.980 0.922 0.877 0.877 False Negat ive SLNB (positive) & GECL (negative) 1 0.667 0.500 N/A N/A False Pos itive SLNB (negative) & GECL (positive) 1 0.850 0.677 0.547 0.547 True Positive SLNB(positive) & GECL (positive) 1 0.778 0.453 0.396 N/A Table 23b: Distant Relapse Free Survival Time (Months) 0 40 80 120 160 120 160 True negative SLNB (negative) & GECL (negative) 1 0.963 0.910 0.869 0.869 False Negative SLNB (positive) & GECL (negative) 1 0.500 N/A N/A N/A False Positive SLNB (negative) & GECL (positive) 1 0.844 0.637 0.507 N/A True Positive SLNB(positive) & GECL (positive) 1 0.763 0.479 0.398 N/A Table 23c: Distant Relapse Free Survival Time (Months) 0 40 80 120 160 True negat ive SLNB (negative) & GECL (negative) 1 0.96 7 0.916 0.86 1 0.861 False Negat Negative SLNB (positive) & GECL (negative) 1 0.50 0 N/A N/A N/A False Pos itive SLNB (negative) & GECL (positive) 1 0.87 3 0.700 0.60 1 0.601 True Pos itive SLNB(positive) & GECL (positive) 1 0.76 5 0.48032 0 0.39 8 N/A Table 24a: Survival estimates at different timepoints for groups based on SLNB and GECL classifier status. Survival curves were compared using a logrank test, p<0.0001. Relapse Free Survival Time (Months) 0 40 80 120 160 True negative SLNB (negative) & GECL (negative) 1 False Negative SLNB (positive) & GECL (negative) 1 0.438 0.438 N/A N/A False Positive ative) & GECL (positive) 1 0.723 0.663 0.563 0.563 TruePositive SLNB (position) & GECL (positive) 1 0.604 0.436 0.436 N/A Table 24b: Relapse Free Survival Time (Months) 0 40 80 120 160 True negative SLNB (negative) & GECL (negative) 1 0.925 0.883 0.845 0.845 False Negative SLNB (positive) & GECL (negative) 1 0.233 N/A N/A N/A False Positive SLNB (negative) & GECL (positive) 1 0.707 0.636 0.537 N/A True Positive SLNB (positive) & GECL (positive) 1 0.602 0.473 0.473 N/A Table 24c: Relapse Free Survival Time (Months) 0 40 80 120 160 True negative SLNB (negative) & GECL (negative) 1 0.939 0.884 0.831 0.831 False Negative SLNB (positive) & GECL (negative) 1 0.266 N/A N/A N/A False Positive SLNB (negative) & GECL (positive) 1 0.757 0.704 0.632 0.632 True Positive SLNB (positive) & GECL (positive) 1 0.597 0.470 0.470 N/A Table 25a: Hazard Ratios and p-values for the 2 curves from the GECL classifier outputs and SLNB biopsy results. Melanoma Specific Survival Hazard Ratio (p-Value) Distant Relapse Free Survival Hazard Ratio (p-Value) Relapse Free Survival Hazard Ratio (p-Value) Gene Expression & Clinical Variable (GECL) 6.03 (p<0.0001) 5.28 (p<0.0001) 4.60 (p<0.0001) Sentinel Lymph nodes Biopsy Finding (SLNB) 3.21 (p<0.0001) 3.27 (p<0.0001) 3.14 (p<0.0001) Table 25b: Melanoma Specific Survival Hazard Ratio (p-Value) Distant Relapse Free Survival Hazard Ratio (p-Value) Relapse Free Survival Hazard Ratio (p-Value) Gene Expression & Clinical Variable (GECL) 4.69 (p<0.0001) 4.72 (p<0.0001) 3.95 (p<0.0001) Sentinel Lymph nodes Biopsy Finding (SLNB) 3.36 (p<0.0001) 3.46 (p<0.0001) 3.17 (p<0.0001) Table 25c: Melanoma Specific Survival Hazard Ratio (p-Value) Distant Relapse Free Survival Hazard Ratio (p-Value) Relapse Free Survival Hazard Ratio (p-Value) Gene Expression & Clinical Variable (GECL) 4.48 (p<0.0001) 4.00 (p<0.0001) 3.30 (p<0.0001) Sentinel Lymph nodes Biopsy Finding (SLNB) 3.36 (p<0.0001) 3.46 (p<0.0001) 3.17 (p<0.0001) Table 26a: Multivariate Hazard Ratios and p-values for the 2 curves from the GECL classifier outputs and SLNB biopsy Table 26a Melanoma Specific Survival Hazard Ratio (p-Value) Distant Relapse Free Survival Hazard Ratio (p-Value) Relapse Free Survival Hazard Ratio (p-Value) Gene Expression & Clinical Variable (GECL) 4.92 (p=0.0003) 4.26 (p<0.0001) 3.76 (p<0.0001) Sentinel Lymph nodes Biopsy Finding (SLNB) 2.00 (p=0.0229) 2.10 (p=0.0005) 2.04 (p<0.0001) Table 26b: Gene Expression & Clinical Variable (GECL) 3.70 (p=0.0009) 3.68 (p<0.0001) 3.18 (p<0.0001) Sentinel Lymph nodes Biopsy Finding (SLNB) 1.94 (p=0.03641) 2.00 (p=0.0015) 1.90 (p=0.0011) Table 26c: Gene Expression & Clinical Variable (GECL) 3.45 (p= 0.00628) 3.03 (p=0.00021) 2.59 (p=0.00013) Sentinel Lymph nodes Biopsy Finding (SLNB) 2.33 (p= 0.00611) 2.48 (p<0.0001) 2.35 (p<0.0001) Table 27 Input P% P N TP FP TN FN SE SP NPV PPV ACC bACC SLNB.RR ER AUC cutoff LRn LRp maxbACC 0.17 128 626 90 167 459 38 0.7 0.73 0.92 0.35 0.73 0.72 0.66 0.05 0.79 0.17 0.4 2.6 SEeqSP 0.17 128 626 91 176 450 37 0.71 0.72 0.92 0.34 0.72 0.71 0.65 0.049 0.79 0.17 0.4 2.5 NPV97 0.17 128 626 122 420 206 6 0.95 0.33 0.97 0.23 0.44 0.64 0.28 0.008 0.79 0.11 0.14 1.4 NPV98 0.17 128 626 125 506 120 3 0.98 0.19 0.98 0.2 0.32 0.58 0.16 0.004 0.79 0.1 0.12 1.2 Table 28 Input P% P N TP FP TN FN SE SP NPV PPV ACC bACC SLNB.RR ER AUC cutoff LRn LRp maxbACC 0.17 128 626 89 170 456 39 0.7 0.73 0.92 0.35 0.72 0.71 0.66 0.051 0.77 0.17 0.41 2.6 SEeqSP 0.17 128 626 90 174 452 38 0.71 0.72 0.92 0.34 0.72 0.71 0.65 0.05 0.77 0.17 0.41 2.5 NPV97 0.17 128 626 120 407 219 8.4 0.93 0.35 0.96 0.23 0.45 0.64 0.3 0.011 0.77 0.11 0.19 1.4 NPV98 0.17 128 626 123 478 148 5 0.96 0.24 0.97 0.2 0.36 0.6 0.2 0.0066 0.77 0.1 0.16 1.3 Table 29 Input P% P N TP FP TN FN SE SP NPV PPV ACC bACC SLNB.RR ER AUC cutoff LRn LRp maxbACC 0.17 128 626 97 188 438 31 0.76 0.7 0.93 0.34 0.71 0.73 0.62 0.041 0.8 0.18 0.35 2.5 SEeqSP 0.17 128 626 95 171 455 33 0.74 0.73 0.93 0.36 0.73 0.73 0.65 0.044 0.8 0.19 0.35 2.7 NPV97 0.17 128 626 120 319 307 8 0.94 0.49 0.97 0.27 0.57 0.71 0.42 0.011 0.8 0.13 0.13 1.8 NPV98 0.17 128 626 124 431 195 4 0.97 0.31 0.98 0.22 0.42 0.64 0.26 0.0053 0.8 0.099 0.1 1.4 Table 30 Input P% P N TP FP TN FN SE SP NPV PPV ACC bACC SLNB.RR ER AUC cutoff LRn LRp maxbACC 0.17 128 626 88 181 445 40 0.69 0.71 0.92 0.33 0.71 0.7 0.64 0.053 0.78 0.18 0.44 2.4 SEeqSP 0.17 128 626 86 167 459 42 0.67 0.73 0.92 0.34 0.72 0.7 0.67 0.056 0.78 0.19 0.45 2.5 NPV97 0.17 128 626 112 305 321 16 0.87 0.51 0.95 0.27 0.57 0.69 0.45 0.022 0.78 0.13 0.25 1.8 NPV98 0.17 128 626 120 408 218 7.6 0.94 0.35 0.97 0.23 0.45 0.64 0.3 0.01 0.78 0.099 0.17 1.5 Table 31 Input P% P N TP FP TN FN SE SP NPV PPV ACC bACC SLNB.RR ER AUC cutoff LRn LRp maxbACC 0.17 128 626 102 150 476 26 0.8 0.76 0.95 0.4 0.77 0.78 0.67 0.034 0.84 0.19 0.27 3.3 SEeqSP 0.17 128 626 99 139 487 29 0.77 0.78 0.94 0.42 0.78 0.78 0.68 0.038 0.84 0.19 0.29 3.5 NPV97 0.17 128 626 114 267 359 14 0.89 0.57 0.96 0.3 0.63 0.73 0.49 0.019 0.84 0.13 0.19 2.1 NPV98 0.17 128 626 122 383 243 6 0.95 0.39 0.98 0.24 0.48 0.67 0.33 0.008 0.84 0.096 0.12 1.6 Table 32 Input P% P N TP FP TN FN SE SP NPV PPV ACC bACC SLNB.RR ER AUC cutoff LRn LRp maxbACC 0.17 128 626 94 150 476 34 0.73 0.76 0.93 0.39 0.76 0.75 0.68 0.045 0.82 0.19 0.35 3.1 SEeqSP 0.17 128 626 92 142 484 36 0.72 0.77 0.93 0.39 0.76 0.74 0.69 0.048 0.82 0.19 0.37 3.2 NPV97 0.17 128 626 112 255 371 16 0.87 0.59 0.96 0.31 0.64 0.73 0.51 0.022 0.82 0.13 0.22 2.2 NPV98 0.17 128 626 119 369 257 8.8 0.93 0.41 0.97 0.24 0.5 0.67 0.35 0.012 0.82 0.097 0.17 1.6 Table 33 maxbACC Input P% P N TP FP TN FN SE SP NPV PPV ACC bACC SLNB.RR ER AUC cutoff LRn LRp CL 0.17 128 626 89 170 456 39 0.7 0.73 0.92 0.35 0.72 0.71 0.66 0.051 0.77 0.17 0.41 2.6 GE 0.17 128 626 88 181 445 40 0.69 0.71 0.92 0.33 0.71 0.7 0.64 0.053 0.78 0.18 0.44 2.4 GECL 0.17 128 626 94 150 476 34 0.73 0.76 0.93 0.39 0.76 0.75 0.68 0.045 0.82 0.19 0.35 3.1 Table 34 SEeqSP Input P% P N TP FP TN FN SE SP NPV PPV ACC bACC SLNB.RR ER AUC cutoff LRn LRp CL 0.17 128 626 90 174 452 38 0.71 0.72 0.92 0.34 0.72 0.71 0.65 0.05 0.77 0.17 0.41 2.5 GE 0.17 128 626 86 167 459 42 0.67 0.73 0.92 0.34 0.72 0.7 0.67 0.056 0.78 0.19 0.45 2.5 GECL 0.17 128 626 92 142 484 36 0.72 0.77 0.93 0.39 0.76 0.74 0.69 0.048 0.82 0.19 0.37 3.2 Table 35 NPV 97 Input P% P N TP FP TN FN SE SP NPV PPV ACC bACC SLNB.RR ER AUC cutoff LRn LRp CL 0.17 128 626 120 407 219 8.4 0.93 0.35 0.96 0.23 0.45 0.64 0.3 0.011 0.77 0.11 0.19 1.4 GE 0.17 128 626 112 305 321 16 0.87 0.51 0.95 0.27 0.57 0.69 0.45 0.022 0.78 0.13 0.25 1.8 GECL 0.17 128 626 112 255 371 16 0.87 0.59 0.96 0.31 0.64 0.73 0.51 0.022 0.82 0.13 0.22 2.2 Table 36 NPV 98 Input P% P N TP FP TN FN SE SP NPV PPV ACC bACC SLNB.RR ER AUC cutoff LRn LRp CL 0.17 128 626 123 478 148 5 0.96 0.24 0.97 0.2 0.36 0.6 0.2 0.0066 0.77 0.1 0.16 1.3 GE 0.17 128 626 120 408 21.8 7.6 0.94 0.35 0.97 0.23 0.45 0.64 0.3 0.01 0.78 0.099 0.17 1.5 GECL 0.17 128 626 119 369 257 8.8 0.93 0.41 0.97 0.24 0.5 0.67 0.35 0.012 0.82 0.097 0.17 1.6 Table 37 CL Input P% P N TP FP TN FN SE SP NPV PPV ACC bACC SLNB.RR ER AUC cutoff LRn LRp 1 T1b 0.033 6 178 3.4 47 131 2.6 0.57 0.74 0.98 0.07 0.73 0.66 0.73 0.014 0.68 0.11 0.57 2.3 11 T2a 0.13 39 253 34 176 77 5.1 0.87 0.31 0.94 0.16 0.38 0.59 0.28 0.017 0.68 0.11 0.42 1.3 12 T2b 0.17 11 55 10 48 7.3 0.79 0.93 0.13 0.89 0.18 0.27 0.53 0.12 0.012 0.7 0.11 0.66 1.1 13 T3a 0.31 38 85 38 85 0.04 0 1 0.00048 1 0.31 0.31 0.5 0.00032 0 0.62 0.11 0 1 14 T3b 0.43 34 45 34 45 0.01 0 1 0.00022 1 0.43 0.43 0.5 0.00013 0 0.6 0.11 0 1 Table 38GE Input P% P N TP FP TN FN SE SP NPV PPV ACC bACC SLNB.RR ER AUC cutoff LRn LRp T1b 0.033 6 178 2.3 51 127 3.7 0.38 0.71 0.97 0.042 0.7 0.55 0.71 0.02 0.55 0.13 0.87 1.3 T2a 0.13 39 253 30 119 134 8.9 0.77 0.53 0.94 0.2 0.56 0.65 0.49 0.03 0.71 0.13 0.43 1.6 T2b 0.17 11 55 11 39 16 0.19 0.98 0.28 0.99 0.21 0.4 0.63 0.24 0.0029 0.66 0.13 0.059 1.4 T3a 0.31 38 85 35 56 29 3.2 0.91 0.34 0.9 0.38 0.51 0.63 0.26 0.026 0.73 0.13 0.25 1.4 T3b 0.43 34 45 34 36 9.1 0.27 0.99 0.2 0.98 0.49 0.54 0.6 0.12 0.0035 0.73 0.13 0.037 1.2 Table 39 GECL Input P% P N TP FP TN FN SE SP NPV PPV ACC bACC SLNB.RR ER AUC cutoff LRn LRp T1b 0.033 6 178 1.7 19 159 4.3 0.28 0.89 0.97 0.082 0.87 0.58 0.89 0.024 0.59 0.13 0.81 2.7 T2a 0.13 39 253 29 88 165 9.8 0.75 0.65 0.94 0.25 0.66 0.7 0.6 0.034 0.75 0.13 0.39 2.2 T2b 0.17 11 55 9.8 35 20 1.2 0.89 0.36 0.94 0.22 0.45 0.62 0.32 0.019 0.72 0.13 0.31 1.4 T3a 0.31 38 85 37 70 15 1.1 0.97 0.17 0.94 0.35 0.42 0.57 0.13 0.0084 0.75 0.13 0.15 1.2 T3b 0.43 34 45 34 40 5.1 0.03 1 0.11 1 0.46 0.49 0.56 0.065 0.00039 0.74 0.13 0.0067 1.1 Table 40CL Input P% P N TP FP TN FN SE SP NPV PPV ACC bACC SLNB.RR ER AUC cutoff LRn LRp T1b 0.033 6 178 4.2 80 98 1.9 0.69 0.55 0.98 0.051 0.56 0.62 0.54 0.01 0.68 0.1 0.56 1.6 T2a 0.13 39 253 36 209 44 2.8 0.93 0.17 0.94 0.15 0.28 0.55 0.16 0.0094 0.68 0.1 0.4 1.1 T2b 0.17 11 55 11 52 3.3 0.34 0.97 0.06 0.92 0.17 0.21 0.52 0.056 0.0051 0.7 0.1 0.56 1 T3a 0.31 38 85 38 85 0.01 0 1 0.00012 1 0.31 0.31 0.5 8.1e-05 0 0.62 0.1 0 1 T3b 0.43 34 45 34 45 0.01 0 1 0.00022 1 0.43 0.43 0.5 0.00013 0 0.6 0.1 0 1 Table 41 GE Input P% P N TP FP TN FN SE SP NPV PPV ACC bACC SLNB.RR ER AUC cutoff LRn LRp T1b 0.033 6 178 3.6 84 94 2.4 0.61 0.53 0.98 0.042 0.53 0.57 0.52 0.013 0.55 0.099 0.75 1.3 T2a 0.13 39 253 35 166 87 4.3 0.89 0.35 0.95 0.17 0.42 0.62 0.31 0.015 0.71 0.099 0.32 1.4 T2b 0.17 11 55 11 45 9.5 0.02 1 0.17 1 0.19 0.31 0.59 0.15 3e-04 0.66 0.099 0.0083 1.2 Table 41 GE Input P% P N TP FP TN FN SE SP NPV PPV ACC bACC SLNB.RR ER AUC cutoff LRn LRp T3a 0.31 38 85 37 69 16 0.86 0.98 0.19 0.96 0.35 0.43 0.58 0.14 0.0069 0.73 0.099 0.11 1.2 T3b 0.43 34 45 34 40 5 0.05 1 0.11 0.99 0.46 0.49 0.55 0.063 0.00065 0.73 0.099 0.014 1.1 Table 42 GECL Input P% P N TP FP TN FN SE SP NPV PPV ACC bACC SLNB.RR ER AUC cutoff LRn LRp T1b 0.033 6 178 2.8 52 126 3.2 0.47 0.71 0.98 0.053 0.7 0.59 0.7 0.017 0.59 0.097 0.75 1.7 T2a 0.13 39 253 34 147 106 5.2 0.87 0.42 0.95 0.19 0.48 0.64 0.38 0.018 0.75 0.097 0.32 1.5 T2b 0.17 11 55 11 44 11 0.26 0.98 0.2 0.98 0.2 0.33 0.59 0.17 0.0039 0.72 0.097 0.1 1.2 T3a 0.31 38 85 38 79 5.9 0.13 1 0.069 0.99 0.32 0.36 0.53 0.049 0.0011 0.75 0.097 0.037 1.1 T3b 0.43 34 45 34 43 2.4 0 1 0.054 1 0.44 0.46 0.52 0.031 0 0.74 0.097 0 1 Table 43 CL Input P% P N TP FP TN FN SE SP NPV PPV ACC bACC SLNB.RR ER AUC cutoff LRn LRp stageIB 0.095 45 431 37 222 209 7.6 0.83 0.48 0.96 0.14 0.52 0.66 0.45 0.016 0.73 0.11 0.35 1.6 stageIIA 0.26 49 140 48 133 7.4 0.79 0.98 0.053 0.89 0.27 0.3 0.52 0.043 0.0042 0.67 0.11 0.37 1 stageIIB 0.43 34 45 34 45 0.01 0 1 0.00022 1 0.43 0.43 0.5 0.00013 0 0.6 0.11 0 1 Table 44 GE Input P% P N TP FP TN FN SE SP NPV PPV ACC bACC SLNB.RR ER AUC cutoff LRn LRp stageIB 0.095 45 431 32 171 260 13 0.72 0.6 0.95 0.16 0.62 0.66 0.57 0.026 0.72 0.13 0.46 1.8 stageIIA 0.26 49 140 46 96 44 3.4 0.93 0.32 0.93 0.32 0.47 0.62 0.25 0.018 0.71 0.13 0.22 1.4 stageIIB 0.43 34 45 34 36 9.1 0.27 0.99 0.2 0.98 0.49 0.54 0.6 0.12 0.0035 0.73 0.13 0.037 1.2 Table 45 GECL Input P% P N TP FP TN FN SE SP NPV PPV ACC bACC SLNB.RR ER AUC cutoff LRn LRp stageIB 0.095 45 431 31 108 323 14 0.69 0.75 0.96 0.23 0.74 0.72 0.71 0.03 0.77 0.13 0.42 2.8 stageIIA 0.26 49 140 47 105 35 2.3 0.95 0.25 0.94 0.31 0.43 0.6 0.19 0.012 0.76 0.13 0.18 1.3 stageIIB 0.43 34 45 34 40 5.1 0.03 1 0.11 1 0.46 0.49 0.56 0.065 0.00039 0.74 0.13 0.0067 1.1 Table 46 CL Input P% P N TP FP TN FN SE SP NPV PPV ACC bACC SLNB.RR ER AUC cutoff LRn LRp stageIB 0.095 45 431 40 289 142 4.6 0.9 0.33 0.97 0.12 0.38 0.61 0.31 0.0099 0.73 0.1 0.31 1.3 stageIIA 0.26 49 140 49 137 3.3 0.34 0.99 0.024 0.92 0.26 0.28 0.51 0.019 0.0018 0.67 0.1 0.31 1 stageIIB 0.43 34 45 34 45 0.01 0 1 0.00022 1 0.43 0.43 0.5 0.00013 0 0.6 0.1 0 1 Table 47 GE Input P% P N TP FP TN FN SE SP NPV PPV ACC bACC SLNB.RR ER AUC cutoff LRn LRp stageIB 0.095 45 431 38 250 181 6.7 0.85 0.42 0.96 0.13 0.46 0.64 0.4 0.014 0.72 0.099 0.35 1.5 stageIIA 0.26 49 140 48 114 26 0.88 0.98 0.18 0.97 0.3 0.39 0.58 0.14 0.0047 0.71 0.099 0.088 1.2 stageIIB 0.43 34 45 34 40 5 0.05 1 0.11 0.99 0.46 0.49 0.55 0.063 0.00065 0.73 0.099 0.014 1.1 Table 48 CLGE Input P% P N TP FP TN FN SE SP NPV PPV ACC bACC SLNB.RR ER AUC cutoff LRn LRp stageIB 0.095 45 431 37 200 231 8.4 0.81 0.54 0.97 0.16 0.56 0.68 0.5 0.018 0.77 0.097 0.34 1.8 stageIIA 0.26 49 140 49 123 17 0.39 0.99 0.12 0.98 0.28 0.35 0.56 0.092 0.0021 0.76 0.097 0.055 1.1 stageIIB 0.43 34 45 34 43 2.4 0 1 0.054 1 0.44 0.46 0.52 0.031 0 0.74 0.097 0 1 Table 49 Min and max AUC subset of 2 subset of 3 subset of 4 subset of 5 subset of 6 subset of 7 subset of 8 n subsets 36 84 126 126 84 36 9 min AUC 0.68 0.71 0.73 0.76 0.78 0.79 0.81 max AUC 0.79 0.8 0.8 0.81 0.81 0.82 0.82
Claims (14)
- A method for classifying an individual afflicted with primary cutaneous melanoma, comprising determining in a melanoma tissue sample from said individual a gene expression signature, wherein the gene expression signature comprises ITGB3, PLAT, GDF15 and IL8 and wherein the individual is classified as having a metastasis-positive SLN or is classified as having a metastasis-negative SLN.
- A method for determining a treatment and/or diagnostic work-up schedule for an individual afflicted with cutaneous melanoma, comprising determining in a melanoma tissue sample from said individual a gene expression signature comprising determining the level of expression of ITGB3, PLAT, GDF15 and IL8 and determining a treatment and/or diagnostic work-up schedule based on the expression levels.
- A method for predicting the prognosis of an individual afflicted with primary cutaneous melanoma, comprising determining in a melanoma tissue sample from said individual a gene expression signature, wherein the gene expression signature comprises ITGB3, PLAT, GDF15 and IL8 and the prognosis of the individual is determined based on the gene expression levels.
- The method of claim 2 or 3, wherein the individual is classified as having a metastasis-positive SLN or is classified as having a metastasis-negative SLN.
- The method of any of the preceding claims, wherein the individual is selected for SLNB based on said classification and/or expression levels.
- The method of any of the preceding claims, wherein an individual classified as having a metastasis-positive SLN is treated by performing a SLNB.
- The method of any one of claims 2-5, wherein an individual is classified as having a poor prognosis or a good prognosis.
- The method of any of the preceding claims, further comprising classifying an individual afflicted with primary cutaneous melanoma, comprising determining in a sample from said individual a gene expression signature, wherein the gene expression signature comprises at least one of the following genes: KRT14, SPP1, FN1, LOXL3.
- A cancer treatment for use in treating an individual afflicted with primary cutaneous melanoma, comprising:- determining in a melanoma tissue sample from said individual a gene expression signature, wherein the gene expression signature comprises ITGB3, PLAT, GDF15 and IL8,- classifying said individual as having a metastasis-positive SLN and/or a poor prognosis based on the gene expression signature, and- treating said individual by performing a SLNB and/or providing a cancer treatment to said individual, wherein said cancer treatment is selected from- chemotherapy, preferably wherein said chemotherapy is selected from dacarbazine, temozolomide, carboplatin, paclitaxel, cisplatin, and vinblastine;- radiation therapy;- immunotherapy, preferably wherein said immunotherapy is selected from cytokines, immune checkpoint inhibitors, and oncolytic immunotherapy; and- targeted therapy drugs selected from BRAF inhibitors, preferably selected from vemurafenib or dabrafenib, and MEK inhibitors, preferably selected from cobimetinib and trametinib.
- The cancer treatment of claim 9, wherein said immunotherapy is selected from cytokines, preferably Interferon alfa-2b or Interleukin-2; immune checkpoint inhibitors; or oncolytic immunotherapy.
- The cancer treatment of claim 9, wherein said cancer treatment is selected from ipilimumab, nivolumab, and pembrolizumab.
- The method of any one of claims 1-8 or the cancer treatment for use of any one of claims 9-11, wherein the gene expression signature further comprises MLANA, LOXL4, SERPINE2, and TGFBR1.
- The method or the cancer treatment for use of claim 12, wherein the gene expression signature further comprises ADIPOQ.
- The method or the cancer treatment for use of claim 12 or 13 wherein the gene expression signature further comprises PRKCB, ADAM12, LGALS1.
Applications Claiming Priority (4)
| Application Number | Priority Date | Filing Date | Title |
|---|---|---|---|
| US201862703221P | 2018-07-25 | 2018-07-25 | |
| US201862750294P | 2018-10-25 | 2018-10-25 | |
| US201862778777P | 2018-12-12 | 2018-12-12 | |
| PCT/NL2019/050487 WO2020022895A2 (en) | 2018-07-25 | 2019-07-25 | Gene signatures for predicting metastasis of melanoma and patient prognosis |
Publications (2)
| Publication Number | Publication Date |
|---|---|
| EP3827101A2 EP3827101A2 (en) | 2021-06-02 |
| EP3827101B1 true EP3827101B1 (en) | 2023-11-08 |
Family
ID=68242821
Family Applications (1)
| Application Number | Title | Priority Date | Filing Date |
|---|---|---|---|
| EP19787488.6A Active EP3827101B1 (en) | 2018-07-25 | 2019-07-25 | Gene signatures for predicting metastasis of melanoma and patient prognosis |
Country Status (11)
| Country | Link |
|---|---|
| US (1) | US20210301353A1 (en) |
| EP (1) | EP3827101B1 (en) |
| JP (1) | JP2021531831A (en) |
| KR (1) | KR20210044233A (en) |
| CN (1) | CN113039289A (en) |
| AU (1) | AU2019310636A1 (en) |
| CA (1) | CA3107401A1 (en) |
| DK (1) | DK3827101T3 (en) |
| ES (1) | ES2966015T3 (en) |
| IL (1) | IL280377A (en) |
| WO (1) | WO2020022895A2 (en) |
Families Citing this family (3)
| Publication number | Priority date | Publication date | Assignee | Title |
|---|---|---|---|---|
| CA3240376A1 (en) * | 2021-12-08 | 2023-06-15 | Alexander MEVES | Assessing and treating melanoma |
| WO2023107329A1 (en) * | 2021-12-08 | 2023-06-15 | Mayo Foundation For Medical Education And Research | Assessing and treating melanoma |
| WO2024108191A1 (en) * | 2022-11-18 | 2024-05-23 | University Of Virginia Patent Foundation | Machine learning approach to predicting lymph node metastases |
Family Cites Families (4)
| Publication number | Priority date | Publication date | Assignee | Title |
|---|---|---|---|---|
| US20060136145A1 (en) | 2004-12-20 | 2006-06-22 | Kuo-Jang Kao | Universal reference standard for normalization of microarray gene expression profiling data |
| EP2619321B1 (en) * | 2010-09-20 | 2018-08-01 | Advanced Cell Diagnostics, Inc. | Biomarkers for differentiating melanoma from benign nevus in the skin |
| WO2014077915A1 (en) * | 2012-11-14 | 2014-05-22 | Mayo Foundation For Medical Education And Research | Methods and materials for identifying malignant skin lesions |
| WO2016025717A1 (en) * | 2014-08-14 | 2016-02-18 | Mayo Foundation For Medical Education And Research | Methods and materials for identifying metastatic malignant skin lesions and treating skin cancer |
-
2019
- 2019-07-25 JP JP2021528324A patent/JP2021531831A/en active Pending
- 2019-07-25 EP EP19787488.6A patent/EP3827101B1/en active Active
- 2019-07-25 US US17/262,175 patent/US20210301353A1/en active Pending
- 2019-07-25 CN CN201980062825.7A patent/CN113039289A/en active Pending
- 2019-07-25 AU AU2019310636A patent/AU2019310636A1/en active Pending
- 2019-07-25 ES ES19787488T patent/ES2966015T3/en active Active
- 2019-07-25 KR KR1020217005548A patent/KR20210044233A/en unknown
- 2019-07-25 DK DK19787488.6T patent/DK3827101T3/en active
- 2019-07-25 WO PCT/NL2019/050487 patent/WO2020022895A2/en active Application Filing
- 2019-07-25 CA CA3107401A patent/CA3107401A1/en active Pending
-
2021
- 2021-01-24 IL IL280377A patent/IL280377A/en unknown
Also Published As
| Publication number | Publication date |
|---|---|
| ES2966015T3 (en) | 2024-04-17 |
| IL280377A (en) | 2021-03-25 |
| WO2020022895A3 (en) | 2020-04-02 |
| US20210301353A1 (en) | 2021-09-30 |
| EP3827101A2 (en) | 2021-06-02 |
| DK3827101T3 (en) | 2023-12-11 |
| CN113039289A (en) | 2021-06-25 |
| JP2021531831A (en) | 2021-11-25 |
| CA3107401A1 (en) | 2020-01-30 |
| KR20210044233A (en) | 2021-04-22 |
| WO2020022895A2 (en) | 2020-01-30 |
| AU2019310636A1 (en) | 2021-02-04 |
Similar Documents
| Publication | Publication Date | Title |
|---|---|---|
| Vachani et al. | A 10-gene classifier for distinguishing head and neck squamous cell carcinoma and lung squamous cell carcinoma | |
| US7537894B2 (en) | Methods and kits for monitoring Barrett's metaplasia | |
| CA2693847C (en) | Bladder cancer diagnosis and/or prognosis method | |
| EP3827101B1 (en) | Gene signatures for predicting metastasis of melanoma and patient prognosis | |
| AU2020202536B2 (en) | Methods For Predicting Risk Of Metastasis In Cutaneous Melanoma | |
| SG192108A1 (en) | Colon cancer gene expression signatures and methods of use | |
| KR20180009762A (en) | Methods and compositions for diagnosing or detecting lung cancer | |
| EP3047040B1 (en) | Multigene assay for prognosis of renal cancer | |
| US20180230545A1 (en) | Method for the prediction of progression of bladder cancer | |
| JP2011509689A (en) | Molecular staging and prognosis of stage II and III colon cancer | |
| KR101860238B1 (en) | Use of ZFP28, FAM155A and DPP6 for Prognostic Marker Diagnosis of renal cell carcinoma | |
| EP4097260A1 (en) | Methods of diagnosing and treating patients with cutaneous squamous cell carcinoma | |
| US10597728B2 (en) | Methylation site regulating expression of mda-9/syntenin | |
| US20120201750A1 (en) | Serum biomarkers for melanoma metastasis | |
| US20210079479A1 (en) | Compostions and methods for diagnosing lung cancers using gene expression profiles | |
| Ghantous et al. | A robust and interpretable gene signature for predicting the lymph node status of primary T1/T2 oral cavity squamous cell carcinoma | |
| EP3631017B1 (en) | Methods for melanoma detection | |
| US20160281177A1 (en) | Gene signatures for renal cancer prognosis | |
| CN116926190A (en) | Prognosis marker for measuring breast cancer remote metastasis risk and application thereof | |
| CN116936086A (en) | Construction method and risk prediction method of breast cancer distant metastasis risk prediction gene model |
Legal Events
| Date | Code | Title | Description |
|---|---|---|---|
| STAA | Information on the status of an ep patent application or granted ep patent |
Free format text: STATUS: UNKNOWN |
|
| STAA | Information on the status of an ep patent application or granted ep patent |
Free format text: STATUS: THE INTERNATIONAL PUBLICATION HAS BEEN MADE |
|
| STAA | Information on the status of an ep patent application or granted ep patent |
Free format text: STATUS: THE INTERNATIONAL PUBLICATION HAS BEEN MADE |
|
| PUAI | Public reference made under article 153(3) epc to a published international application that has entered the european phase |
Free format text: ORIGINAL CODE: 0009012 |
|
| STAA | Information on the status of an ep patent application or granted ep patent |
Free format text: STATUS: REQUEST FOR EXAMINATION WAS MADE |
|
| 17P | Request for examination filed |
Effective date: 20210127 |
|
| AK | Designated contracting states |
Kind code of ref document: A2 Designated state(s): AL AT BE BG CH CY CZ DE DK EE ES FI FR GB GR HR HU IE IS IT LI LT LU LV MC MK MT NL NO PL PT RO RS SE SI SK SM TR |
|
| DAV | Request for validation of the european patent (deleted) | ||
| DAX | Request for extension of the european patent (deleted) | ||
| REG | Reference to a national code |
Ref country code: HK Ref legal event code: DE Ref document number: 40046957 Country of ref document: HK |
|
| STAA | Information on the status of an ep patent application or granted ep patent |
Free format text: STATUS: EXAMINATION IS IN PROGRESS |
|
| 17Q | First examination report despatched |
Effective date: 20220531 |
|
| GRAP | Despatch of communication of intention to grant a patent |
Free format text: ORIGINAL CODE: EPIDOSNIGR1 |
|
| STAA | Information on the status of an ep patent application or granted ep patent |
Free format text: STATUS: GRANT OF PATENT IS INTENDED |
|
| INTG | Intention to grant announced |
Effective date: 20221123 |
|
| GRAJ | Information related to disapproval of communication of intention to grant by the applicant or resumption of examination proceedings by the epo deleted |
Free format text: ORIGINAL CODE: EPIDOSDIGR1 |
|
| STAA | Information on the status of an ep patent application or granted ep patent |
Free format text: STATUS: EXAMINATION IS IN PROGRESS |
|
| INTC | Intention to grant announced (deleted) | ||
| GRAP | Despatch of communication of intention to grant a patent |
Free format text: ORIGINAL CODE: EPIDOSNIGR1 |
|
| STAA | Information on the status of an ep patent application or granted ep patent |
Free format text: STATUS: GRANT OF PATENT IS INTENDED |
|
| INTG | Intention to grant announced |
Effective date: 20230614 |
|
| GRAS | Grant fee paid |
Free format text: ORIGINAL CODE: EPIDOSNIGR3 |
|
| GRAA | (expected) grant |
Free format text: ORIGINAL CODE: 0009210 |
|
| STAA | Information on the status of an ep patent application or granted ep patent |
Free format text: STATUS: THE PATENT HAS BEEN GRANTED |
|
| AK | Designated contracting states |
Kind code of ref document: B1 Designated state(s): AL AT BE BG CH CY CZ DE DK EE ES FI FR GB GR HR HU IE IS IT LI LT LU LV MC MK MT NL NO PL PT RO RS SE SI SK SM TR |
|
| REG | Reference to a national code |
Ref country code: GB Ref legal event code: FG4D |
|
| REG | Reference to a national code |
Ref country code: CH Ref legal event code: EP |
|
| REG | Reference to a national code |
Ref country code: DE Ref legal event code: R096 Ref document number: 602019041139 Country of ref document: DE |
|
| REG | Reference to a national code |
Ref country code: IE Ref legal event code: FG4D |
|
| REG | Reference to a national code |
Ref country code: DK Ref legal event code: T3 Effective date: 20231205 |
|
| REG | Reference to a national code |
Ref country code: SE Ref legal event code: TRGR |
|
| REG | Reference to a national code |
Ref country code: NL Ref legal event code: FP |
|
| P01 | Opt-out of the competence of the unified patent court (upc) registered |
Effective date: 20231130 |
|
| REG | Reference to a national code |
Ref country code: LT Ref legal event code: MG9D |
|
| PG25 | Lapsed in a contracting state [announced via postgrant information from national office to epo] |
Ref country code: GR Free format text: LAPSE BECAUSE OF FAILURE TO SUBMIT A TRANSLATION OF THE DESCRIPTION OR TO PAY THE FEE WITHIN THE PRESCRIBED TIME-LIMIT Effective date: 20240209 |
|
| PG25 | Lapsed in a contracting state [announced via postgrant information from national office to epo] |
Ref country code: IS Free format text: LAPSE BECAUSE OF FAILURE TO SUBMIT A TRANSLATION OF THE DESCRIPTION OR TO PAY THE FEE WITHIN THE PRESCRIBED TIME-LIMIT Effective date: 20240308 |
|
| PG25 | Lapsed in a contracting state [announced via postgrant information from national office to epo] |
Ref country code: LT Free format text: LAPSE BECAUSE OF FAILURE TO SUBMIT A TRANSLATION OF THE DESCRIPTION OR TO PAY THE FEE WITHIN THE PRESCRIBED TIME-LIMIT Effective date: 20231108 |
|
| REG | Reference to a national code |
Ref country code: AT Ref legal event code: MK05 Ref document number: 1629645 Country of ref document: AT Kind code of ref document: T Effective date: 20231108 |
|
| REG | Reference to a national code |
Ref country code: ES Ref legal event code: FG2A Ref document number: 2966015 Country of ref document: ES Kind code of ref document: T3 Effective date: 20240417 |
|
| PG25 | Lapsed in a contracting state [announced via postgrant information from national office to epo] |
Ref country code: AT Free format text: LAPSE BECAUSE OF FAILURE TO SUBMIT A TRANSLATION OF THE DESCRIPTION OR TO PAY THE FEE WITHIN THE PRESCRIBED TIME-LIMIT Effective date: 20231108 |
|
| PG25 | Lapsed in a contracting state [announced via postgrant information from national office to epo] |
Ref country code: LT Free format text: LAPSE BECAUSE OF FAILURE TO SUBMIT A TRANSLATION OF THE DESCRIPTION OR TO PAY THE FEE WITHIN THE PRESCRIBED TIME-LIMIT Effective date: 20231108 Ref country code: IS Free format text: LAPSE BECAUSE OF FAILURE TO SUBMIT A TRANSLATION OF THE DESCRIPTION OR TO PAY THE FEE WITHIN THE PRESCRIBED TIME-LIMIT Effective date: 20240308 Ref country code: GR Free format text: LAPSE BECAUSE OF FAILURE TO SUBMIT A TRANSLATION OF THE DESCRIPTION OR TO PAY THE FEE WITHIN THE PRESCRIBED TIME-LIMIT Effective date: 20240209 Ref country code: BG Free format text: LAPSE BECAUSE OF FAILURE TO SUBMIT A TRANSLATION OF THE DESCRIPTION OR TO PAY THE FEE WITHIN THE PRESCRIBED TIME-LIMIT Effective date: 20240208 Ref country code: AT Free format text: LAPSE BECAUSE OF FAILURE TO SUBMIT A TRANSLATION OF THE DESCRIPTION OR TO PAY THE FEE WITHIN THE PRESCRIBED TIME-LIMIT Effective date: 20231108 Ref country code: PT Free format text: LAPSE BECAUSE OF FAILURE TO SUBMIT A TRANSLATION OF THE DESCRIPTION OR TO PAY THE FEE WITHIN THE PRESCRIBED TIME-LIMIT Effective date: 20240308 |
|
| PG25 | Lapsed in a contracting state [announced via postgrant information from national office to epo] |
Ref country code: RS Free format text: LAPSE BECAUSE OF FAILURE TO SUBMIT A TRANSLATION OF THE DESCRIPTION OR TO PAY THE FEE WITHIN THE PRESCRIBED TIME-LIMIT Effective date: 20231108 Ref country code: PL Free format text: LAPSE BECAUSE OF FAILURE TO SUBMIT A TRANSLATION OF THE DESCRIPTION OR TO PAY THE FEE WITHIN THE PRESCRIBED TIME-LIMIT Effective date: 20231108 Ref country code: NO Free format text: LAPSE BECAUSE OF FAILURE TO SUBMIT A TRANSLATION OF THE DESCRIPTION OR TO PAY THE FEE WITHIN THE PRESCRIBED TIME-LIMIT Effective date: 20240208 Ref country code: LV Free format text: LAPSE BECAUSE OF FAILURE TO SUBMIT A TRANSLATION OF THE DESCRIPTION OR TO PAY THE FEE WITHIN THE PRESCRIBED TIME-LIMIT Effective date: 20231108 Ref country code: HR Free format text: LAPSE BECAUSE OF FAILURE TO SUBMIT A TRANSLATION OF THE DESCRIPTION OR TO PAY THE FEE WITHIN THE PRESCRIBED TIME-LIMIT Effective date: 20231108 |
|
| PGFP | Annual fee paid to national office [announced via postgrant information from national office to epo] |
Ref country code: NL Payment date: 20240521 Year of fee payment: 6 |
|
| PG25 | Lapsed in a contracting state [announced via postgrant information from national office to epo] |
Ref country code: CZ Free format text: LAPSE BECAUSE OF FAILURE TO SUBMIT A TRANSLATION OF THE DESCRIPTION OR TO PAY THE FEE WITHIN THE PRESCRIBED TIME-LIMIT Effective date: 20231108 |
|
| PG25 | Lapsed in a contracting state [announced via postgrant information from national office to epo] |
Ref country code: SK Free format text: LAPSE BECAUSE OF FAILURE TO SUBMIT A TRANSLATION OF THE DESCRIPTION OR TO PAY THE FEE WITHIN THE PRESCRIBED TIME-LIMIT Effective date: 20231108 |
|
| PG25 | Lapsed in a contracting state [announced via postgrant information from national office to epo] |
Ref country code: SM Free format text: LAPSE BECAUSE OF FAILURE TO SUBMIT A TRANSLATION OF THE DESCRIPTION OR TO PAY THE FEE WITHIN THE PRESCRIBED TIME-LIMIT Effective date: 20231108 Ref country code: SK Free format text: LAPSE BECAUSE OF FAILURE TO SUBMIT A TRANSLATION OF THE DESCRIPTION OR TO PAY THE FEE WITHIN THE PRESCRIBED TIME-LIMIT Effective date: 20231108 Ref country code: RO Free format text: LAPSE BECAUSE OF FAILURE TO SUBMIT A TRANSLATION OF THE DESCRIPTION OR TO PAY THE FEE WITHIN THE PRESCRIBED TIME-LIMIT Effective date: 20231108 Ref country code: EE Free format text: LAPSE BECAUSE OF FAILURE TO SUBMIT A TRANSLATION OF THE DESCRIPTION OR TO PAY THE FEE WITHIN THE PRESCRIBED TIME-LIMIT Effective date: 20231108 Ref country code: CZ Free format text: LAPSE BECAUSE OF FAILURE TO SUBMIT A TRANSLATION OF THE DESCRIPTION OR TO PAY THE FEE WITHIN THE PRESCRIBED TIME-LIMIT Effective date: 20231108 |
|
| PLBE | No opposition filed within time limit |
Free format text: ORIGINAL CODE: 0009261 |
|
| STAA | Information on the status of an ep patent application or granted ep patent |
Free format text: STATUS: NO OPPOSITION FILED WITHIN TIME LIMIT |