EP3775840B1 - Verfahren zur detektion von zellen mit mindestens einer anomalie in einer zytologischen probe - Google Patents
Verfahren zur detektion von zellen mit mindestens einer anomalie in einer zytologischen probe Download PDFInfo
- Publication number
- EP3775840B1 EP3775840B1 EP19719349.3A EP19719349A EP3775840B1 EP 3775840 B1 EP3775840 B1 EP 3775840B1 EP 19719349 A EP19719349 A EP 19719349A EP 3775840 B1 EP3775840 B1 EP 3775840B1
- Authority
- EP
- European Patent Office
- Prior art keywords
- sample
- anomaly
- cells
- nucleus
- image
- Prior art date
- Legal status (The legal status is an assumption and is not a legal conclusion. Google has not performed a legal analysis and makes no representation as to the accuracy of the status listed.)
- Active
Links
Images


Classifications
-
- G—PHYSICS
- G01—MEASURING; TESTING
- G01N—INVESTIGATING OR ANALYSING MATERIALS BY DETERMINING THEIR CHEMICAL OR PHYSICAL PROPERTIES
- G01N15/00—Investigating characteristics of particles; Investigating permeability, pore-volume or surface-area of porous materials
- G01N15/10—Investigating individual particles
- G01N15/14—Optical investigation techniques, e.g. flow cytometry
- G01N15/1429—Signal processing
- G01N15/1433—Signal processing using image recognition
-
- G—PHYSICS
- G01—MEASURING; TESTING
- G01N—INVESTIGATING OR ANALYSING MATERIALS BY DETERMINING THEIR CHEMICAL OR PHYSICAL PROPERTIES
- G01N21/00—Investigating or analysing materials by the use of optical means, i.e. using sub-millimetre waves, infrared, visible or ultraviolet light
- G01N21/17—Systems in which incident light is modified in accordance with the properties of the material investigated
- G01N21/25—Colour; Spectral properties, i.e. comparison of effect of material on the light at two or more different wavelengths or wavelength bands
- G01N21/251—Colorimeters; Construction thereof
-
- G—PHYSICS
- G01—MEASURING; TESTING
- G01N—INVESTIGATING OR ANALYSING MATERIALS BY DETERMINING THEIR CHEMICAL OR PHYSICAL PROPERTIES
- G01N21/00—Investigating or analysing materials by the use of optical means, i.e. using sub-millimetre waves, infrared, visible or ultraviolet light
- G01N21/17—Systems in which incident light is modified in accordance with the properties of the material investigated
- G01N21/25—Colour; Spectral properties, i.e. comparison of effect of material on the light at two or more different wavelengths or wavelength bands
- G01N21/29—Colour; Spectral properties, i.e. comparison of effect of material on the light at two or more different wavelengths or wavelength bands using visual detection
-
- G—PHYSICS
- G06—COMPUTING OR CALCULATING; COUNTING
- G06V—IMAGE OR VIDEO RECOGNITION OR UNDERSTANDING
- G06V20/00—Scenes; Scene-specific elements
- G06V20/60—Type of objects
- G06V20/69—Microscopic objects, e.g. biological cells or cellular parts
- G06V20/695—Preprocessing, e.g. image segmentation
-
- G—PHYSICS
- G06—COMPUTING OR CALCULATING; COUNTING
- G06V—IMAGE OR VIDEO RECOGNITION OR UNDERSTANDING
- G06V20/00—Scenes; Scene-specific elements
- G06V20/60—Type of objects
- G06V20/69—Microscopic objects, e.g. biological cells or cellular parts
- G06V20/698—Matching; Classification
-
- G—PHYSICS
- G01—MEASURING; TESTING
- G01N—INVESTIGATING OR ANALYSING MATERIALS BY DETERMINING THEIR CHEMICAL OR PHYSICAL PROPERTIES
- G01N15/00—Investigating characteristics of particles; Investigating permeability, pore-volume or surface-area of porous materials
- G01N15/10—Investigating individual particles
- G01N2015/1006—Investigating individual particles for cytology
-
- G—PHYSICS
- G01—MEASURING; TESTING
- G01N—INVESTIGATING OR ANALYSING MATERIALS BY DETERMINING THEIR CHEMICAL OR PHYSICAL PROPERTIES
- G01N15/00—Investigating characteristics of particles; Investigating permeability, pore-volume or surface-area of porous materials
- G01N15/10—Investigating individual particles
- G01N15/14—Optical investigation techniques, e.g. flow cytometry
- G01N2015/1402—Data analysis by thresholding or gating operations performed on the acquired signals or stored data
Definitions
- the present invention relates to a method for detecting cells exhibiting at least one abnormality in a cytological sample, from a digitized image or from several digitized images of the same sample.
- the invention also relates to a device implementing this method.
- the invention relates to the field of cytology which is the study by microscopy of the cells of a cytological sample after fixation on a slide. More precisely, it concerns the study of the morphological, radiometric or biochemical aspects of normal or atypical cells, i.e. cells exhibiting at least one anomaly.
- An example is disclosed in US 5,933,519 A .
- Cancer screening is one of the fields of application of cytology, and consists of searching for and highlighting cancer using cytological samples taken from a subject. Screening is carried out partly in an anatomic pathology laboratory by cytotechnicians and cytopathologists trained in methods of detecting atypical cells. Cytology is widely used for the detection of certain cancers because it allows them to be diagnosed at different stages, some cancers having for example an early stage called “low grade” and a more advanced stage called “high grade” (the grade can also correspond to a type of cancer). It is obvious that the early diagnosis of cancer is a major issue with important repercussions linked to the survival rate of the subjects affected and also to the corresponding cost of treating them. For example, each year in the context of bladder cancer, 10 million urine cytologies are performed worldwide to help diagnose it, with the analysis of cytology slides of samples from spontaneous urination to diagnose bladder cancer being a common practice.
- one of the aims of the invention is to provide a method for detecting cells exhibiting at least one cellular abnormality in a cytological sample that can subsequently help detect cancer, in particular bladder cancer, from images of digitized slides.
- the invention advantageously allows, using a processing module implemented by computer, an automated and exhaustive analysis of the cells of the sample present on the slide.
- this method ensures standardization of the result of the cytological analysis of the sample.
- this method also makes it possible to help with the early diagnosis of so-called low-grade cancer, in particular low-grade bladder cancer, by detecting cells exhibiting slight abnormalities.
- a first aspect of the invention proposes a method for detecting cells presenting at at least one abnormality in a cytological sample from at least one first digitized electron microscopy image of the sample, according to claim 1.
- the method is performed using a computer-implemented processing module, in particular fully executed by the processing module implemented by computer.
- the detection method ultimately classifies the cytological sample according to a level of cellular abnormality from the analysis of at least one first image, preferably with a second image.
- the processing module used in the invention is capable of combining data calculated from the first digitized transmission electron microscopy image and/or a second digitized fluorescence microscopy image of the sample with known reference data in cytology.
- This solution allows to benefit from the classification of the sample according to two classes and to diagnose if the sample has a level of cellular anomaly that is zero or proven. Subsequently, this result will significantly help the diagnosis of cancer or not by a specialist.
- an expert characteristic of anomaly of a cell can be considered as a good indicator of the conformity of a cell.
- one of the expert features of anomaly is a surface ratio of the nucleus in the cell or an irregularity of the nucleus or a mottled colorimetry or a hyper colorimetry of the nucleus.
- Mottled colorimetry means the measurement of the intensity of coloration of certain points or spots.
- the expert anomaly characteristic is a characteristic of the nucleus, in particular, a ratio of the size of the nucleus with respect to the size of the cell, a positioning of the nucleus in the cell, or a colorimetry characteristic of the nucleus. More precisely, the expert anomaly characteristic is a surface ratio of the nucleus in the cell or an irregularity of the nucleus or a mottled colorimetry or a hyper colorimetry of the nucleus.
- At least one of the expert anomaly characteristics is an irregularity of the nucleus
- the calculation of said irregularity of the nucleus is a calculation of deviation corresponding to the comparison between each nucleus of the analyzed cell and a so-called reference type nucleus of a so-called "reference" cell in cytology.
- This calculation of deviation is chosen from the following list: a difference in surface area, a difference in perimeter, a difference in the convexity of the nucleus, a difference in barycenter, a difference between a length of the contour of each detected nucleus, a difference in irregularity of a contour of the nucleus, a difference in the number of pixels in each nucleus and a difference in eccentricity of the nucleus in the cell.
- the invention comprises a step of recommending the exploitability of the sample according to a number of cells comprising a nucleus and according to a minimum exploitability threshold value, preferably the minimum exploitability threshold value is equal to at least seven cells comprising a nucleus in the first image.
- the method using the processing module, combines all of the data obtained and classifies the cytological sample analyzed from the first image and the second image, into one of the three classes associated with the level of cellular abnormality, zero, low or high.
- a second aspect of the invention proposes a method for detecting cells exhibiting at least one anomaly in a cytological sample from a first image and/or a second image using a deep learning method, using a processing module implemented by computer, to assign the sample to one of the three classes associated with a level of cellular anomaly of the sample, zero, low or high.
- This method is advantageous in that it uses data provided by at least one of the variants of the first aspect of the invention.
- the cytological sample is a spontaneous voiding urine sample.
- a third aspect of the invention provides a device implementing a method as described above.
- a fourth aspect of the invention provides a use of the method as described below to aid in the diagnosis of bladder cancer.
- the present invention falls within the general framework of the application of computer vision of digitized images of complex and numerous objects.
- the invention relates to an original method for detecting cells exhibiting at least one anomaly in a cytological sample from a first digitized image, and preferably using a second digital image of the same sample.
- the first image is obtained using a transmission electron microscope and the second image is obtained using fluorescence microscopy.
- the images used are derived from the specific digitalization of a cytological sample that has undergone a preparation adapted for the method, which has then been spread on a cytology slide.
- the method according to the invention can use a cytological sample originating indifferently from fluid or from a sample of elements of the human body depending on the desired analysis.
- a sample of urine from spontaneous urination is taken.
- the result of this method of detecting cells presenting at least one anomaly in a cytological sample will help in the diagnosis of bladder cancer, in particular at an early or so-called low-grade stage of bladder cancer.
- the detection method according to the invention comprises steps executed using a processing module implemented by a computer capable of combining data calculated from the sample with reference data known in cytology.
- the so-called calculated data are calculated and collected from at least one digitized image of a slide of at least one sample by the processing module.
- the processing module can thus combine all the data calculated and collected from the sample or several samples, and with reference data known in cytology.
- the detection method according to the invention comprises a preliminary processing step of image 110.
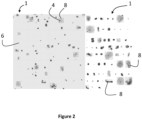
- This preliminary image processing step 110 illustrated in the Figures 1 to 3 , aims to refine as much as possible the initial selection of cells for cell detection, in particular by removing elements 4 constituting a first digitized image 1 which could interfere and reduce the fineness of the result of the detection method.
- this preliminary processing step 110 comprises a sub-step 112 of detecting the elements 4 present in the first image 1.
- This detection sub-step 112 is at least partly based on a colorimetric detection which may consist at least partly of a segmentation into several groups of all the colors of the first image 1, the lightest and most widespread group corresponding to the color of the background of the image 6 and the darkest group corresponding to the color of the cell nuclei. It was considered that any pixel not being a pixel of the background of the image 6 is a pixel of an element 4, that is to say of a biological object. Thus, the background of image 6 is determined and everything that is not part of the background of image 6 corresponds to an element 4, that is, a cell, a group of cells, a cluster of cells or an element to be rejected.
- a colorimetric detection which may consist at least partly of a segmentation into several groups of all the colors of the first image 1, the lightest and most widespread group corresponding to the color of the background of the image 6 and the darkest group corresponding to the color of the cell nuclei. It was considered that any pixel not being a pixel of the background of
- this first sub-step of core detection i.e. colorimetric detection
- this first sub-step of core detection can be combined with measurements of the dimensions of each of the detected elements 4. For example, if several cores are detected by colorimetric detection, the measurement of this element will help to identify the type of element 4 detected.
- the figure 3 illustrates an example of a first image 1 undergoing the preliminary processing step 110.
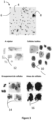
- the first image 1 undergoes segmentation to obtain the imagettes 8 surrounding the elements 4 having a dark color, these imagettes 8 are then pre-classified into four classes: elements to be rejected 12, isolated cells 10, grouping of cells 14 and clusters of cells 16 (which will also be rejected).
- the detection method according to the invention must be done from cells necessarily isolated or individualized from a grouping of cells and comprising a nucleus.
- the isolated cells 10 and the groupings of cells 14 are filtered during a filtering sub-step 114 using colorimetric detection.
- the pre-classified cell grouping 14 undergoes an individualization sub-step 116 after the filtering sub-step 114.
- This sub-step 116 consists in individualizing the cells of the cell group 14.
- individualizing we mean extracting from the cell group 14 at least one cell comprising a nucleus.
- this individualization sub-step 116 is not executed for the pre-class of “cell clusters” 16. Indeed, the cell clusters 16 are structures that are too complex to individualize and taking them into account would generate many more errors than relevant information to use. This is why the clusters 16 are not used according to the invention.
- the individualization sub-step 116 of the cells is done using a new segmentation which is based on the detection of contours via the calculation of the gradient of the first image or via the use of a mathematical transform which has a multidirectional aspect such as Radon, Gabor or multi-scale multi-directional transforms.
- a mathematical transform which has a multidirectional aspect such as Radon, Gabor or multi-scale multi-directional transforms.
- an optional step of recommending the usability 120 of the sample to detect potentially cancerous cells can be executed.
- this step of recommending the usability 120 can intervene one or more times at several levels during the progress of the method according to the invention, preferably at the end of the preliminary processing step 110.
- This step of recommending the usability 120 amounts to estimating whether the first image 1 contains a number of cells comprising a nucleus, sufficient so that the detection in the sample is not biased. To do this, the total number of cells with nucleus present in the first image 1 is determined. This total number of cells will be communicated to a user who will validate or not the continuation of the method. according to the invention.
- this total number of cells with core is compared to a value of a minimum exploitability threshold which will be determined previously by the user.
- the user may enter the value of the minimum exploitability threshold of the desired sample in the processing module to allow the automatic continuation or not of the inventive method. Consequently, the detection method can continue even if there are only very few cells with nuclei in the first image 1, insofar as the total number of these cells is greater than or equal to the value of the minimum exploitability threshold.
- the value of the minimum exploitability threshold is equal to at least seven cells with nuclei detected in the sample, thus the method continues if the total number of cells with nuclei is greater than or equal to seven.
- the exploitability recommendation step 120 can interrupt the detection method.
- an optional preliminary typological selection step 130 for detecting cells of a chosen cell type in the sample with at least one cellular abnormality, more precisely, potentially cancerous can be executed.
- the cells of the sample are measured and then classified according to their sizes, step 132.
- the processing module uses the processing module, the cells classified according to their sizes are affiliated with cell types, then selected according to the chosen cell type, such as urothelial or any other cell type whose level of cellular abnormality may be correlated with a type of cancer, step 134.
- the user will be able to define the preferred cell type himself.
- the preferred cell type will be the urothelial type.
- the study of urothelial cells is a good indicator to help in the diagnosis of bladder cancer, in particular to determine the stage of the cancer based on the abnormalities encountered.
- the optional sample usability recommendation step 120 and the optional preliminary step of typological classification 130 we obtain a fine selection of isolated or individualized cells, comprising a nucleus and of a chosen cell type.
- the method according to the invention results in the detection of cells exhibiting at least one anomaly in the cytological sample from at least one first image.
- the level of cellular anomaly of the sample is correlated with the number and type of cellular anomaly encountered in the cytological sample.
- the method according to the invention can make it possible to classify the sample either in a class of level of cellular anomaly said to be proven, or in a class of level of cellular anomaly said to be zero.
- a cell exhibiting an anomaly is defined as a cell exhibiting an expert anomaly characteristic divergent from a so-called reference data, i.e. divergent from the standard.
- it is a cell which exhibits at least one anomaly, i.e. a so-called expert anomaly characteristic which is abnormal.
- the calculation of an expert anomaly characteristic allows to obtain data that helps determine a deviation from the norm and therefore the presence or absence of an anomaly.
- the calculation of expert anomaly characteristics means measurement or any other type of mathematical methods.
- the expert anomaly characteristic that is calculated is a characteristic of the nucleus, in particular it corresponds to a size ratio between the nucleus and the cytoplasm of the cell or to a measurement of the positioning of the nucleus or to a colorimetric measurement of the nucleus. More precisely, the expert anomaly characteristic corresponds to a surface ratio of the nucleus in the cell, or to an irregularity of the nucleus, or to a mottled colorimetry or a hyper colorimetry of the nucleus.
- the different expert anomaly characteristics mentioned above may reveal anomalies depending on the values calculated in the sample. It will be understood that other types of expert characteristics of anomalies may be indifferently calculated and used as parameters to classify the cells.
- the anomalies sought and detected in each cell will, more particularly, concern its nucleus. To do this, it is therefore necessary to have a fine detection of the nucleus in order to be able to detect the anomalies linked to it.
- Fine detection of the nucleus is done by segmentation. This segmentation can in particular be done by refinement from the coarse segmentation using only colorimetry.
- This technique described earlier in the description consists of starting from an enclosing envelope, preferably forming a rectangle around the nucleus. This enclosing envelope will delimit an area around the nucleus, always included in the cell, and overflowing from the nucleus by 10 to 40% (of the total surface area of the nucleus), preferably between 20 and 30%.
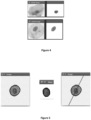
- Figures 4 and 5 each illustrate the result of a fine core detection.
- the kernel may have already been detected in the preliminary image processing step 110 during the coarse detection of the kernels using a first segmentation.
- An exemplary embodiment consists in taking into account the bounding box used for the coarse detection of the kernel and in estimating in this envelope the color distribution of the kernel as well as that of the background using a Gaussian mixture model. Subsequently, it is used to construct a Markov random field on the pixel labels, with an energy function that prefers connected regions having the same label, and performing a Graph cut-based optimization to interfere their values. Since this estimate is likely to be more accurate than the original extracted from the bounding box, these two steps are repeated until convergence.
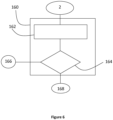
- the step of detecting cellular anomaly 140 in the cells of the sample is done in part by calculating at least two distinct expert anomaly characteristics, step 142.
- RNC ratio Cell Nucleus Ratio
- FIG. 5 illustrates an example of how to calculate the RNC ratio.
- RNC Surface of core/surface of there cell 1 / 2
- the nucleus/cell ratio is calculated from the ratio between the largest diameter of the cell and the largest diameter of the nucleus.
- the cell is not very spherical, we do not take the actual diameter but the distance or length from end to end of the cell, corresponding to the largest diameter of the cell. All ratios included between 0.9 and 1 will not be interpretable since this will correspond to bare cores. Ratios greater than 0.7 correspond to a strong anomaly and ratios between 0.5 and 0.7 correspond to a weak anomaly.
- An irregular core is any core whose contour deviates from a classic shape of a so-called reference core contour that is very smooth and regular. It can also be seen as a contour having angular points or corners.
- the calculated difference can be a surface difference or a perimeter difference or any other difference such as the barycenter difference, the pixel difference in each region of the kernel, the difference between the length of the contours of each kernel (reference and real), the linear difference between the center of gravity of each kernel, the difference between the number of pixels of the convex regions related to each kernel, the difference between the eccentricity of the real kernel and that of the reference kernel.
- This method is based, among other things, on the calculation of the difference between the real contour of the core and the reference contour of the core corresponding to a closed convex curve of rank C2 included in an envelope core bounding box.
- the core bounding box is defined as a bounding rectangle whose drawn length corresponds to the largest diameter of the core. Using the bounding rectangle, the processing module will determine the curve C2 inside the latter, forming the core contour.
- contour of the kernel is extracted by any contour extraction method such as: gradient detectors by linear or mask filtering (like Sobel, Prewitt or Roberts), analytical approaches to contour extraction (like canny or Deriche filter), active contours by taking as initial contour the bounding envelope seen previously, level sets, contours extracted by multiscale and multidirectional transforms...etc.
- contour extraction method such as: gradient detectors by linear or mask filtering (like Sobel, Prewitt or Roberts), analytical approaches to contour extraction (like canny or Deriche filter), active contours by taking as initial contour the bounding envelope seen previously, level sets, contours extracted by multiscale and multidirectional transforms...etc
- a classifier of the large margin separator type supervised learning technique which is based on the maximization of the margin.
- the margin is the distance between the separation boundary and the closest samples which are called support vectors.
- the technique consists in finding the separation boundary of maximum margin from the training examples.) and/or by neural networks which will determine the irregularity of the kernel by learning.
- the idea here is to detect angular points by detecting characteristic points of the "corner” type, to calculate the corresponding formed angle and to estimate the degree of irregularity of the core by taking into account the number of detected corners and their corresponding angles.
- a corner is here defined as an angle of a nuclear membrane contour.
- a corner corresponds to the intersection of two lines or two contours of the nuclear membrane, of quite different orientation in the close vicinity of the corner.
- Harris detector Another major drawback of the Harris detector is that it generally produces an over-detection of corners. To remedy this, it is proposed to use, after the Harris detector, the FAST (Features from Accelerated Segment Test) algorithm initially developed by Edward Rosten and Tom Drummond. Indeed, this latter algorithm can be useful to remove redundant corners. Consequently, it will be applied to eliminate false corners detected by the Haris detector.
- FAST Features from Accelerated Segment Test
- the transform is therefore a multiscale and multidirectional transform of the contourlet type that perfectly represents the curves and contours. It is a multiscale geometric analysis tool that allows a decomposition according to different orientation angles for each scale. Unlike the classic wavelet transform, contourlets perfectly capture the anisotropic characteristics of the images (contour, edge, texture information). Thus, their use to highlight the irregularity of the contour of the nucleus is undoubtedly very appropriate.
- all of the calculated expert anomaly features are combined with reference data consisting of known reference data in cytology.
- these calculated data can be used either as they are, or by a classifier, or merged with other calculated features generated by deep learning to determine whether the cell is normal or has at least one anomaly, step 144. If the sample does not include at least one cell having at least one anomaly, then the detection method stops here and if the sample has at least one cell with at least one anomaly, the detection method continues.
- the processing module determines a total number of cells exhibiting at least one anomaly in the cytological sample, step 146.
- a first step of characterization of the sample 150 can take place here according to the level of anomaly of the sample as a whole.
- the total number of detected cells presenting at least one anomaly is compared to a threshold value of a sample anomaly level.
- This threshold value of the sample anomaly level is defined in advance by the user for the method. It corresponds to at least three cells each presenting at least one anomaly.
- This threshold value of the anomaly level can be defined in advance by the user according to the desired fineness of the classification result.
- the cytological sample is classified in a class representative of a sample with a zero abnormality level 152, if the total number of cells with at least one abnormality is greater than or equal to the threshold value of the abnormality level, the cytological sample is classified in a class representative of a sample with a class with a non-negligible abnormality level 154, i.e. a low abnormality level and a high abnormality level 154.
- the invention at this stage thus makes it possible to classify the cytological sample according to two classes: a class with a zero level of cellular abnormality 152 and a class with a non-negligible level of cellular abnormality 154.
- This result makes it possible to highlight cellular abnormalities which are characteristic of cancer cells.
- it makes it possible to assist cytotechnicians and cytopathologists in the diagnosis of cancer, by providing a reliable and rapid standardized result.
- the detection method may comprise a second step of characterizing the sample 160 according to the level of cellular anomaly of the sample, in particular specifically highlighting a low level of cellular anomaly in the sample.
- This level of anomaly corresponds to cells that have not yet undergone pronounced morphological deformations.
- the invention makes it possible to classify the sample more precisely either in a class of level of cellular anomaly called "low", or in a class of level of cellular anomaly called "high”, or in a class of level of cellular anomaly called "zero".
- the classification of the sample according to the level of morphological or radiometric abnormality of these cells in the sample provides real assistance to the doctor regarding the diagnosis of cancer.
- the level of cellular abnormality called “low” can be associated with the early stage called “low-grade” of the cancer and the level of abnormality called “high” can be associated with the advanced stage of the cancer called “high-grade”.
- the invention uses a second digitized fluorescence imaging image 2. From this second image 2, the cells of at least one chosen cell type, such as urothelial, are selected in a typological selection step 162, thanks to their predefined locations in the sample in the first digitized image 1. The first image 1 and the second image are then recalibrated, possibly using a conventional computer-implemented recalibration method.
- a second digitized fluorescence imaging image 2 From this second image 2, the cells of at least one chosen cell type, such as urothelial, are selected in a typological selection step 162, thanks to their predefined locations in the sample in the first digitized image 1.
- the first image 1 and the second image are then recalibrated, possibly using a conventional computer-implemented recalibration method.
- the preliminary typological selection step 130 from the first image 1 must necessarily have been executed earlier in the method according to the invention in order to be able to locate the cells of the chosen cell type.
- This sub-step of typological selection 162 of a cell type is followed by a sub-step of detection of a fluorescence halo 164 around each cell selected previously.
- halo is defined as a phenomenon resulting in the presence of a fluorescent halo which surrounds the cell and which is well contrasted.
- the strength of the halo, the fluorescence rate or the fluorescence spreading rate is measured.
- the sample is classified in a class representative of a sample with a low level of anomaly 168.
- the cells not exhibiting fluorescence are classified in the class of zero and high level of anomaly 166.
- three methods are proposed for carrying out the second characterization step of the sample 160 using the processing module.
- the Radon transform represents an image as a collection of projections in various directions. Each projection along a line represents a Radon profile.
- the second characterization step of the sample 160 executed by the processing module consists of a method based on the calculation of the irregularity of the contour of the fluorescence “halo” present.
- this third method consists of one of the three methods of calculating the irregularity of the nucleus presented previously.
- the results obtained to determine the class of the sample are compared to threshold values of the level of fluorescence intensity and/or spreading which are predetermined or entered in advance by a user.
- This second characterization step of the sample 160 thus makes it possible to obtain, ultimately, the classification of the slide of the sample, therefore of the sample in three possible classes, that is to say: either in the class of zero anomaly level, which can be associated with a sample originating from a healthy subject; or in the class of low cellular anomaly level, which can be associated with a sample presenting cancer cells at an early stage or called “low-grade” cancer; or in the class of high cellular anomaly level, which can be associated with a sample presenting cancer cells at an advanced stage or called “high-grade” cancer.
- a second aspect of the invention proposes to use a second method of detecting cellular abnormality in the cytological sample by using a deep learning method to directly classify an image of a cytological sample slide according to a level of cellular abnormality encountered.
- a method Deep learning teaches a computer model how to perform tasks such as classification directly from images.
- the originality of this second method is that it classifies a set of thumbnails without making a prior classification of each of the thumbnails constituting the entire image. More precisely, this method allows the direct classification of the image of the cytological sample of the slide, that is to say of all the cells included in the image of the sample without go through a classification of each image or cell of the sample.
- this classification method is particularly useful when the detection of anomalies or pathologies can only be done by looking at an entire slide or the image of the slide, and not by looking at each cell independently of each other.
- this second method of detecting cells presenting at least one anomaly in the sample uses a deep learning computer model, taking a set of observations as input and producing a classification of this set as output. These observations can directly be raw image images of the cytological sample and/or a list of values characterizing the image (or descriptor data), for example values calculated using the first method (it will be understood that the latter descriptor data will be used to teach the computer model).
- this second method uses a deep learning method using a deep neural network (NN) architecture.
- NN deep neural network
- this deep neural network When this deep neural network (NN) is used on raw image files, it is a deep convolutional neural network (CNN).
- the CNN convolves the learned features with the input data of the descriptor, and uses 2D convolutional layers, which are well-suited for processing 2D data such as images.
- the convolutional neural network can extract expert representations of images directly via a learning.
- the deep learning method requires considerable computing power. Since the calculations are highly parallelizable, they are usually done on a graphics processor or GPU.
- the GPU has high performance and is equipped with an architecture parallel, which is efficient for implementing this learning method.
- the GPU is integrated into a processing unit or CPU.
- this second method of cellular anomaly detection classifies the image, i.e. the set of thumbnails without prior detection of each of them.
- this second detection method proposes to detect cells presenting at least one cellular anomaly and to directly classify not one thumbnail but a set of thumbnails (the raw thumbnail and/or characterized by values calculated in another way) representing the image of a slide of a cytological sample (slide).
- the training of the deep learning computer model is carried out using a large set of labeled slides. Without this training, the second classification method cannot work.
- the input is a set of thumbnails (raw and/or characterized by the first method) and the output is a probability distribution according to classes to ultimately assign a class to each image of the set of thumbnails of the sample analyzed.
- the classes will be chosen from a class with a low cellular anomaly level, a class with a high cellular anomaly level and/or a class with a zero cellular anomaly level.
- this method performs "end-to-end” learning: that is, directly connecting the input to the output without going through an intermediate phase of analyzing each image of an image of a cytological sample. More precisely, from a set of image of cells of the cytological sample, a network is assigned tasks to accomplish (a classification, for example) and learns how to automate them. Another major advantage of this method is the fact that the algorithms of the learning method evolve with the data and continue to improve at the same time as the volume of data increases. Preferably, this data comes at least in part from the data obtained using the detection method according to the first aspect described above. More preferably, this second aspect of the detection method can advantageously couple the data of a transmission image and a fluorescence image, that is to say of a first and a second image.
- the second aspect of the detection method here proposes the implementation of a deep learning method, diverting the batch functionality to be able to process a set.
- the 4Dimensional (4D) tensor is composed of 2D for the spatial component of the image (1D for the height of the image and 1D for the width), 1D for the channels (RGB if we use Red Green Blue), and 1D for the batch “B” (B corresponding to the number of images to build a batch or a packet).
- the use of the 4D tensor has the sole purpose of accelerating calculations.
- the originality of our method is to use this tensor for another purpose, which is to classify populations, here sets of thumbnails.
- This tensor for another purpose, which is to classify populations, here sets of thumbnails.
- B corresponding to the number of thumbnails constituting the whole image
- the originality proposed here is precisely to use this functionality of making batches which initially exists for reasons of calculation time and to divert its functionality by using it for another goal and another purpose.
- B ⁇ RGB ⁇ H ⁇ W B: number of imagettes, RGB: for the three-color channels Red Green Blue, H and W respectively for the height and width of the imagettes. It is also possible to consider any number of classic RGB channels for transmission electron microscopy images but also any number of RGB channels associated with F (F: Fluorescence) for a pair of transmission electron microscopy and fluorescence microscopy images, such as RGB (Red Green Fluo). Then, if we transfer this batch into the neural network up to a fully connected layer (i.e.
- the output will therefore have the size B ⁇ F where F is the size of this fully connected layer (thus the 4D tensor has been transformed into a 2D tensor).
- this 2D tensor B ⁇ F as a tensor 1 ⁇ F ⁇ B and to apply a symmetric operation on B for example a 1D pool (max or average).
- This transposition is useful insofar as the symmetric operations are natively programmed to take place on dimensions 3 and 4 and not on dimension 1 - the need to use a fully connected layer being precisely to free these dimensions 3 and 4 for the transposition.
- This result thus gives a tensor 1 ⁇ F, where the characteristics F should contain information concerning the set of thumbnails. It will be understood that, this 1 results from the fact that this set must lead to a single classification decision affiliated with the batch of B thumbnails. In this way, it is possible to use a classic deep learning method to train an end-to-end network for a classification problem of a cytological sample image, that is to say a set of thumbnails.
- FIG. 7 summarizes the implementation methodology for deep learning applied to the classification of a cytological sample image corresponding to a set of thumbnails.
- the final class is assigned to a set of thumbnails. It will be understood that this implementation method is applied here to the classification of cytological sample images but can be applied to other domains in a non-limiting manner.
- the invention proposes according to a first aspect a method for classifying a cytological sample making it possible to extract and calculate expert characteristics of cellular abnormality present in a sample to contribute to the diagnosis of cancer, using computer vision.
- the invention proposes, here, also according to a second aspect, a second method for classifying a cytological sample according to levels of cellular abnormality encountered in the sample, using a deep learning method, which can contribute to the diagnosis of cancer, using computer vision.
- the invention also relates to a device for classifying a cytological sample, from at least a digitized image, suitable for the implementation of such a method.
- Each user can define the thresholds that he takes into account to carry out the classification method.
- a general approach is proposed that adapts to each user according to the need, that is to say according to the field of application and the fineness of the desired classification result.
Landscapes
- Engineering & Computer Science (AREA)
- Physics & Mathematics (AREA)
- Life Sciences & Earth Sciences (AREA)
- General Health & Medical Sciences (AREA)
- Health & Medical Sciences (AREA)
- General Physics & Mathematics (AREA)
- Chemical & Material Sciences (AREA)
- Pathology (AREA)
- Immunology (AREA)
- Biochemistry (AREA)
- Analytical Chemistry (AREA)
- Molecular Biology (AREA)
- Theoretical Computer Science (AREA)
- Multimedia (AREA)
- Biomedical Technology (AREA)
- Signal Processing (AREA)
- Dispersion Chemistry (AREA)
- Spectroscopy & Molecular Physics (AREA)
- Investigating Or Analysing Biological Materials (AREA)
- Image Analysis (AREA)
- Computer Vision & Pattern Recognition (AREA)
- Measuring Or Testing Involving Enzymes Or Micro-Organisms (AREA)
- Image Processing (AREA)
Claims (9)
- Verfahren zum Erkennen von Zellen mit mindestens einer Anomalie in einer zytologischen Probe aus mindestens einem ersten digitalisierten elektronenmikroskopischen Bild (1) der Probe, wobei das Verfahren mit Hilfe eines computerimplementierten Verarbeitungsmoduls durchgeführt wird,das Verfahren umfassend einen Schritt der Verarbeitung des ersten Bildes (110), umfassend die folgenden Unterschritte:- aus dem ersten Bild (1), Erkennen jedes Elements (4), das in der Probe vorhanden ist (Schritt 112), und dann Filtern jedes Elements (4), das aus mindestens einer isolierten Zelle (10) oder einer Gruppe von Zellen (14) ausgewählt ist, unter Verwendung eines kalorimetrischen Erkennens,- aus jedem erkannten Zellverband (14), Individualisieren mindestens einer Zelle mit ihrem Kern unter Verwendung mindestens eines Segmentierungsverfahrens, das auf dem Erkennen von Konturen in der Zellgruppe (14) basiert (Schritt 116),das Verfahren ferner einen Zellanomalie-Detektionsschritt (Schritt 140) umfasst, umfassend die folgenden Unterschritte:- für jede isolierte (10) oder im vorherigen Schritt individualisierte Zelle, Berechnen von Daten von mindestens zwei unterschiedlichen Anomaliemerkmalen, die als "Expertenanomaliemerkmale" bezeichnet werden, und Bestimmen, ob die Zelle mindestens eine Anomalie aufweist (Schritt 144), indem diese berechneten Daten mit Referenzdaten verglichen werden (Schritt 142),- und dann Zählen der Gesamtzahl der Zellen in der Probe, die mindestens eine Anomalie aufweisen (Schritt 146),das Verfahren ferner einen ersten Schritt zur Charakterisierung der Probe (Schritt 150) entsprechend einem Grad der Anomalie der Probe umfasst, umfassend die folgenden Unterschritte:- Vergleichen der Gesamtzahl der Zellen, die mindestens eine Anomalie aufweisen, mit einem Schwellenwert für das Anomalieniveau, vorzugsweise einem Schwellenwert, der gleich mindestens drei Zellen ist, die jeweils mindestens eine Anomalie aufweisen,- wenn die Gesamtzahl der Zellen mit mindestens einer Anomalie unter dem Schwellenwert des Anomalieniveaus liegt, Klassifizieren der Probe in eine Klasse, die für eine Probe mit einem Anomalieniveau von Null repräsentativ (152) ist,- wenn die Gesamtzahl der Zellen, die mindestens eine Anomalie aufweisen, über dem Schwellenwert des Anomalieniveaus liegt, Klassifizieren der Probe in eine Klasse, die repräsentativ für eine Probe mit einem nachgewiesenen Anomalieniveau (154) ist,das Verfahren ferner einen typologischen Auswahlschritt (Schritt 130) umfasst, umfassend die folgenden Unterschritte:- aus dem ersten digitalisierten Bild (1) der Probe, Messen der Größe der Zellen und dann Klassifizieren der Zellen nach ihrer Größe (Schritt 132),- Zuordnen jeder Klasse von gemessenen Zellen zu einem entsprechenden Zelltyp und dann Auswählen von mindestens einem ausgewählten Zelltyp, wie beispielsweise dem urothelialen Zelltyp (Schritt 134),dadurch gekennzeichnet, dass das Verfahren einen zweiten Schritt der Charakterisierung der Probe (Schritt 160) gemäß einem Anomalieniveau der Zellen in der Probe umfasst, ferner umfassend die folgenden Unterschritte:- aus einem zweiten digitalisierten Fluoreszenzbild (2) der Probe, Auswählen aller Zellen des ausgewählten Zelltyps gemäß ihrer Lokalisierung in der Probe, die zuvor in dem ersten digitalisierten Bild (1) (Schritt 162) definiert wurde (Schritt 134),- Erkennen des Vorhandenseins eines Fluoreszenzhalos um jede zuvor ausgewählte Zelle,- wenn ein Fluoreszenzhalo erkannt wird, Klassifizieren der Probe in eine Klasse, die repräsentativ für eine Probe mit einem niedrigen Anomalieniveau der Zellen (168) ist.
- Verfahren nach Anspruch 1, dadurch gekennzeichnet, dass mindestens eines der Expertenmerkmale für die Anomalie ein Oberflächenverhältnis des Kerns in der Zelle oder eine Unregelmäßigkeit des Kerns oder eine Klumpenkolorimetrie oder eine Hyperkolorimetrie des Kerns ist.
- Verfahren nach Anspruch 1 oder 2, dadurch gekennzeichnet, dass mindestens eines der Expertenmerkmale der Anomalie eine Kernunregelmäßigkeit ist, die Berechnung der Kernunregelmäßigkeit eine Abweichungsberechnung ist, die dem Vergleich zwischen jedem analysierten Zellkern und einem Standardkern einer sogenannten "Referenz"-Zelle entspricht, wobei diese Abweichungsberechnung aus der folgenden Liste ausgewählt wird: eine Oberflächendifferenz, eine Umfangsdifferenz, eine Kernkonvexitätsdifferenz, eine Schwerpunktdifferenz, eine Differenz zwischen einer Länge der Kontur jedes erkannten Kerns, eine Differenz der Unregelmäßigkeit einer Kontur des Kerns, eine Differenz der Anzahl von Pixeln in jedem Kern und eine Differenz der Exzentrizität des Kerns in der Zelle.
- Verfahren nach einem der vorstehenden Ansprüche, wobei im zweiten Schritt der Charakterisierung der Probe (Schritt 160) der ausgewählte Zelltyp der Zellen, die aus dem zweiten digitalisierten Fluoreszenzbild (2) der Probe ausgewählt wurden, ein Urothel-Typ ist.
- Verfahren nach einem der vorstehenden Ansprüche, wobei im zweiten Schritt der Charakterisierung der Probe (Schritt 160) der Unterschritt des Erkennens des Vorhandenseins eines Fluoreszenzhalos um jede zuvor ausgewählte Zelle das Messen einer Fluoreszenzrate umfasst (Schritt 164), und wobei die Probe in eine Klasse eingestuft wird, die repräsentativ für eine Probe mit niedrigem Anomalieniveau der Zellen (168) ist, wenn die gemessene Fluoreszenzrate größer als eine minimale Referenzfluoreszenzrate ist.
- Verfahren nach einem der vorstehenden Ansprüche, wobei im zweiten Schritt der Charakterisierung der Probe (Schritt 160) der Unterschritt des Erkennens des Vorhandenseins eines Fluoreszenzhalos um jede zuvor ausgewählte Zelle das Messen einer Fluoreszenzspreizrate (Schritt 164) umfasst,
und wobei die Probe in eine Klasse klassifiziert wird, die repräsentativ für eine Probe mit einem niedrigen Anomalieniveau der Zellen (168) ist, wenn die gemessene Fluoreszenzausbreitungsrate größer als eine minimale Fluoreszenzausbreitungsrate ist. - Verfahren nach einem der vorstehenden Ansprüche, dadurch gekennzeichnet, dass es einen Schritt zur Empfehlung der Auswertbarkeit (Schritt 120) der zytologischen Probe gemäß einer Anzahl von Zellen, die einen Kern umfassen, und gemäß einem minimalen Auswertbarkeitsschwellenwert umfasst, wobei vorzugsweise der minimale Auswertbarkeitsschwellenwert gleich mindestens sieben Zellen ist, die einen Kern umfassen, der in dem ersten Bild (1) erkannt wurde.
- Verfahren nach einem der vorstehenden Ansprüche, dadurch gekennzeichnet, dass das Verfahren mit Hilfe des Verarbeitungsmoduls alle erhaltenen Daten kombiniert und die zytologische Probe, die aus dem ersten Bild (1) und dem zweiten Bild (2) analysiert wurde, in eine von drei Klassen einordnet, die mit einem zellulären Anomalieniveau der Probe, null, schwach oder stark, verbunden ist.
- Verfahren nach einem der vorstehenden Ansprüche, dadurch gekennzeichnet, dass die zytologische Probe eine Urinprobe von spontanem Urinieren ist.
Applications Claiming Priority (2)
| Application Number | Priority Date | Filing Date | Title |
|---|---|---|---|
| FR1800251A FR3079617B1 (fr) | 2018-03-29 | 2018-03-29 | Methode de detection de cellules presentant au moins une anomalie dans un echantillon cytologique |
| PCT/FR2019/050718 WO2019186073A1 (fr) | 2018-03-29 | 2019-03-28 | Methode de detection de cellules presentant au moins une anomalie dans un echantilllon cytologique |
Publications (3)
| Publication Number | Publication Date |
|---|---|
| EP3775840A1 EP3775840A1 (de) | 2021-02-17 |
| EP3775840C0 EP3775840C0 (de) | 2024-10-23 |
| EP3775840B1 true EP3775840B1 (de) | 2024-10-23 |
Family
ID=63014596
Family Applications (1)
| Application Number | Title | Priority Date | Filing Date |
|---|---|---|---|
| EP19719349.3A Active EP3775840B1 (de) | 2018-03-29 | 2019-03-28 | Verfahren zur detektion von zellen mit mindestens einer anomalie in einer zytologischen probe |
Country Status (9)
| Country | Link |
|---|---|
| US (1) | US11790673B2 (de) |
| EP (1) | EP3775840B1 (de) |
| JP (1) | JP7326316B2 (de) |
| KR (1) | KR102624956B1 (de) |
| CN (1) | CN112088296A (de) |
| CA (1) | CA3095089A1 (de) |
| ES (1) | ES3001012T3 (de) |
| FR (1) | FR3079617B1 (de) |
| WO (1) | WO2019186073A1 (de) |
Families Citing this family (7)
| Publication number | Priority date | Publication date | Assignee | Title |
|---|---|---|---|---|
| CN116097086A (zh) * | 2020-07-13 | 2023-05-09 | 阿奎雷生物科学公司 | 细胞诊断和分析方法 |
| US11663838B2 (en) * | 2020-10-29 | 2023-05-30 | PAIGE.AI, Inc. | Systems and methods for processing images to determine image-based computational biomarkers from liquid specimens |
| CN114813515A (zh) * | 2021-01-28 | 2022-07-29 | 桂林优利特医疗电子有限公司 | 一种微粒子分析方法 |
| CN114332852A (zh) * | 2021-03-10 | 2022-04-12 | 孙玏涵 | 采集样本有效性检测方法、设备及存储介质 |
| CN114241478B (zh) * | 2021-11-25 | 2025-02-25 | 上海浦东发展银行股份有限公司 | 宫颈细胞图像中异常细胞图像识别方法、装置 |
| JPWO2023195405A1 (de) * | 2022-04-04 | 2023-10-12 | ||
| JPWO2024075274A1 (de) * | 2022-10-07 | 2024-04-11 |
Citations (1)
| Publication number | Priority date | Publication date | Assignee | Title |
|---|---|---|---|---|
| US20120262705A1 (en) * | 2011-04-15 | 2012-10-18 | Constitution Medical, Inc. | Measuring Volume and Constituents of Cells |
Family Cites Families (14)
| Publication number | Priority date | Publication date | Assignee | Title |
|---|---|---|---|---|
| WO1996009598A1 (en) * | 1994-09-20 | 1996-03-28 | Neopath, Inc. | Cytological slide scoring apparatus |
| WO2000003246A2 (en) * | 1998-07-13 | 2000-01-20 | Cellomics, Inc. | A system for cell-based screening |
| US20060073509A1 (en) * | 1999-11-18 | 2006-04-06 | Michael Kilpatrick | Method for detecting and quantitating multiple subcellular components |
| AU1918100A (en) * | 1999-11-18 | 2001-05-30 | Ikonisys Inc. | Method and apparatus for computer controlled cell based diagnosis |
| KR20020080574A (ko) * | 2001-04-16 | 2002-10-26 | 디엑스오 텔레콤(주) | 자동 영상 분류를 통한 디지털 컬러 영상 화질 개선 방법 |
| US20050136549A1 (en) * | 2003-10-30 | 2005-06-23 | Bioimagene, Inc. | Method and system for automatically determining diagnostic saliency of digital images |
| US7760927B2 (en) * | 2003-09-10 | 2010-07-20 | Bioimagene, Inc. | Method and system for digital image based tissue independent simultaneous nucleus cytoplasm and membrane quantitation |
| CN101484806A (zh) * | 2006-05-17 | 2009-07-15 | 协乐民公司 | 一种对组织进行自动分析的方法 |
| US9567651B2 (en) * | 2011-09-13 | 2017-02-14 | Koninklijke Philips N.V. | System and method for the detection of abnormalities in a biological sample |
| KR101677171B1 (ko) * | 2015-04-24 | 2016-11-17 | 국방과학연구소 | 픽셀 기반의 배경추정을 통한 이동물체 분할 방법 |
| KR101700887B1 (ko) * | 2015-07-24 | 2017-02-02 | 한밭대학교 산학협력단 | 영상 처리를 이용한 세포 계수 장치 및 방법, 이를 실행시키기 위한 프로그램을 기록한 컴퓨터로 판독 가능한 기록매체 |
| CN115198018A (zh) | 2016-05-09 | 2022-10-18 | 法国国家卫生及研究医学协会 | 患有实体癌症的患者的分类方法 |
| US20170371886A1 (en) * | 2016-06-22 | 2017-12-28 | Agency For Science, Technology And Research | Methods for identifying clusters in a dataset, methods of analyzing cytometry data with the aid of a computer and methods of detecting cell sub-populations in a plurality of cells |
| WO2018005389A1 (en) * | 2016-06-30 | 2018-01-04 | General Automation Lab Technologies, Inc. | High resolution systems, kits, apparatus, and methods using combinatorial media strategies for high throughput microbiology applications |
-
2018
- 2018-03-29 FR FR1800251A patent/FR3079617B1/fr active Active
-
2019
- 2019-03-28 WO PCT/FR2019/050718 patent/WO2019186073A1/fr not_active Ceased
- 2019-03-28 US US17/041,936 patent/US11790673B2/en active Active
- 2019-03-28 CN CN201980028142.XA patent/CN112088296A/zh active Pending
- 2019-03-28 CA CA3095089A patent/CA3095089A1/fr active Pending
- 2019-03-28 ES ES19719349T patent/ES3001012T3/es active Active
- 2019-03-28 EP EP19719349.3A patent/EP3775840B1/de active Active
- 2019-03-28 JP JP2020552248A patent/JP7326316B2/ja active Active
- 2019-03-28 KR KR1020207030477A patent/KR102624956B1/ko active Active
Patent Citations (1)
| Publication number | Priority date | Publication date | Assignee | Title |
|---|---|---|---|---|
| US20120262705A1 (en) * | 2011-04-15 | 2012-10-18 | Constitution Medical, Inc. | Measuring Volume and Constituents of Cells |
Also Published As
| Publication number | Publication date |
|---|---|
| CA3095089A1 (fr) | 2019-10-03 |
| FR3079617B1 (fr) | 2023-12-22 |
| ES3001012T3 (es) | 2025-03-04 |
| JP7326316B2 (ja) | 2023-08-15 |
| CN112088296A (zh) | 2020-12-15 |
| EP3775840C0 (de) | 2024-10-23 |
| EP3775840A1 (de) | 2021-02-17 |
| US11790673B2 (en) | 2023-10-17 |
| BR112020019709A2 (pt) | 2021-02-09 |
| KR20200136004A (ko) | 2020-12-04 |
| JP2021519920A (ja) | 2021-08-12 |
| FR3079617A1 (fr) | 2019-10-04 |
| KR102624956B1 (ko) | 2024-01-12 |
| US20210012088A1 (en) | 2021-01-14 |
| WO2019186073A1 (fr) | 2019-10-03 |
Similar Documents
| Publication | Publication Date | Title |
|---|---|---|
| EP3775840B1 (de) | Verfahren zur detektion von zellen mit mindestens einer anomalie in einer zytologischen probe | |
| US12229959B2 (en) | Systems and methods for determining cell number count in automated stereology z-stack images | |
| US10621412B2 (en) | Dot detection, color classification of dots and counting of color classified dots | |
| Ghalejoogh et al. | A hierarchical structure based on stacking approach for skin lesion classification | |
| JP5315411B2 (ja) | 有糸分裂像検出装置および計数システム、および有糸分裂像を検出して計数する方法 | |
| JP5394485B2 (ja) | 印環細胞検出器及び関連する方法 | |
| JP4948647B2 (ja) | 尿中粒子画像の領域分割方法及び装置 | |
| Ishikawa et al. | Detection of pancreatic tumor cell nuclei via a hyperspectral analysis of pathological slides based on stain spectra | |
| CN107977682A (zh) | 基于极坐标变换数据增强的淋巴类细胞分类方法及其装置 | |
| WO2011051382A1 (fr) | Procede et dispositif d'analyse d'images hyper-spectrales. | |
| WO2013098512A1 (fr) | Procédé et dispositif de détection et de quantification de signes cutanés sur une zone de peau | |
| Kolluru et al. | Machine learning for segmenting cells in corneal endothelium images | |
| Chatterjee et al. | A novel method for IDC prediction in breast cancer histopathology images using deep residual neural networks | |
| Barın et al. | An improved hair removal algorithm for dermoscopy images | |
| Liu et al. | Adaptive and automatic red blood cell counting method based on microscopic hyperspectral imaging technology | |
| CN114881984A (zh) | 一种大米加工精度的检测方法、装置、电子设备及介质 | |
| FR2952217A1 (fr) | Dispositif et procede de compensation de relief d'images hyper-spectrales. | |
| Dey et al. | Automated detection of early oral cancer trends in habitual smokers | |
| CN114723952A (zh) | 一种高速tdi ccd相机图像暗弱条纹噪声识别的模型构建方法与系统 | |
| Beevi et al. | Analysis of nuclei detection with stain normalization in histopathology images | |
| CN116645294B (zh) | 病理图像瑕疵修复方法、装置、电子设备和存储介质 | |
| Das et al. | Semi-Unsupervised Microscopy Segmentation with Fuzzy Logic and Spatial Statistics for Cross-Domain Analysis Using a GUI | |
| Poorani et al. | Count Based Analysis of PCOM Using Blob-Based Detection Method in 2D Ultrasound Images of Ovary | |
| Verma et al. | Fruits Classification and Analysis in Hyperspectral Imaging Using Deep Convolutional Neural Networks | |
| Xue et al. | Fusion and pure feature extraction framework for intraoperative hyperspectral of thyroid lesion |
Legal Events
| Date | Code | Title | Description |
|---|---|---|---|
| STAA | Information on the status of an ep patent application or granted ep patent |
Free format text: STATUS: UNKNOWN |
|
| STAA | Information on the status of an ep patent application or granted ep patent |
Free format text: STATUS: THE INTERNATIONAL PUBLICATION HAS BEEN MADE |
|
| PUAI | Public reference made under article 153(3) epc to a published international application that has entered the european phase |
Free format text: ORIGINAL CODE: 0009012 |
|
| STAA | Information on the status of an ep patent application or granted ep patent |
Free format text: STATUS: REQUEST FOR EXAMINATION WAS MADE |
|
| 17P | Request for examination filed |
Effective date: 20200914 |
|
| AK | Designated contracting states |
Kind code of ref document: A1 Designated state(s): AL AT BE BG CH CY CZ DE DK EE ES FI FR GB GR HR HU IE IS IT LI LT LU LV MC MK MT NL NO PL PT RO RS SE SI SK SM TR |
|
| AX | Request for extension of the european patent |
Extension state: BA ME |
|
| RIN1 | Information on inventor provided before grant (corrected) |
Inventor name: HERBIN, STEPHANE Inventor name: HADDAD, ZEHIRA Inventor name: CHAN-HON-TONG, ADRIEN |
|
| DAV | Request for validation of the european patent (deleted) | ||
| DAX | Request for extension of the european patent (deleted) | ||
| RIN1 | Information on inventor provided before grant (corrected) |
Inventor name: HADDAD, ZEHIRA Inventor name: HERBIN, STEPHANE Inventor name: CHAN-HON-TONG, ADRIEN |
|
| STAA | Information on the status of an ep patent application or granted ep patent |
Free format text: STATUS: EXAMINATION IS IN PROGRESS |
|
| 17Q | First examination report despatched |
Effective date: 20221011 |
|
| GRAP | Despatch of communication of intention to grant a patent |
Free format text: ORIGINAL CODE: EPIDOSNIGR1 |
|
| STAA | Information on the status of an ep patent application or granted ep patent |
Free format text: STATUS: GRANT OF PATENT IS INTENDED |
|
| INTG | Intention to grant announced |
Effective date: 20240523 |
|
| GRAS | Grant fee paid |
Free format text: ORIGINAL CODE: EPIDOSNIGR3 |
|
| GRAA | (expected) grant |
Free format text: ORIGINAL CODE: 0009210 |
|
| STAA | Information on the status of an ep patent application or granted ep patent |
Free format text: STATUS: THE PATENT HAS BEEN GRANTED |
|
| AK | Designated contracting states |
Kind code of ref document: B1 Designated state(s): AL AT BE BG CH CY CZ DE DK EE ES FI FR GB GR HR HU IE IS IT LI LT LU LV MC MK MT NL NO PL PT RO RS SE SI SK SM TR |
|
| REG | Reference to a national code |
Ref country code: GB Ref legal event code: FG4D Free format text: NOT ENGLISH |
|
| REG | Reference to a national code |
Ref country code: CH Ref legal event code: EP |
|
| REG | Reference to a national code |
Ref country code: DE Ref legal event code: R096 Ref document number: 602019060762 Country of ref document: DE |
|
| REG | Reference to a national code |
Ref country code: IE Ref legal event code: FG4D Free format text: LANGUAGE OF EP DOCUMENT: FRENCH |
|
| U01 | Request for unitary effect filed |
Effective date: 20241122 |
|
| U07 | Unitary effect registered |
Designated state(s): AT BE BG DE DK EE FI FR IT LT LU LV MT NL PT RO SE SI Effective date: 20241129 |
|
| REG | Reference to a national code |
Ref country code: ES Ref legal event code: FG2A Ref document number: 3001012 Country of ref document: ES Kind code of ref document: T3 Effective date: 20250304 |
|
| PG25 | Lapsed in a contracting state [announced via postgrant information from national office to epo] |
Ref country code: IS Free format text: LAPSE BECAUSE OF FAILURE TO SUBMIT A TRANSLATION OF THE DESCRIPTION OR TO PAY THE FEE WITHIN THE PRESCRIBED TIME-LIMIT Effective date: 20250223 Ref country code: HR Free format text: LAPSE BECAUSE OF FAILURE TO SUBMIT A TRANSLATION OF THE DESCRIPTION OR TO PAY THE FEE WITHIN THE PRESCRIBED TIME-LIMIT Effective date: 20241023 |
|
| PG25 | Lapsed in a contracting state [announced via postgrant information from national office to epo] |
Ref country code: NO Free format text: LAPSE BECAUSE OF FAILURE TO SUBMIT A TRANSLATION OF THE DESCRIPTION OR TO PAY THE FEE WITHIN THE PRESCRIBED TIME-LIMIT Effective date: 20250123 |
|
| PG25 | Lapsed in a contracting state [announced via postgrant information from national office to epo] |
Ref country code: GR Free format text: LAPSE BECAUSE OF FAILURE TO SUBMIT A TRANSLATION OF THE DESCRIPTION OR TO PAY THE FEE WITHIN THE PRESCRIBED TIME-LIMIT Effective date: 20250124 |
|
| PG25 | Lapsed in a contracting state [announced via postgrant information from national office to epo] |
Ref country code: PL Free format text: LAPSE BECAUSE OF FAILURE TO SUBMIT A TRANSLATION OF THE DESCRIPTION OR TO PAY THE FEE WITHIN THE PRESCRIBED TIME-LIMIT Effective date: 20241023 |
|
| PGFP | Annual fee paid to national office [announced via postgrant information from national office to epo] |
Ref country code: GB Payment date: 20250327 Year of fee payment: 7 |
|
| PG25 | Lapsed in a contracting state [announced via postgrant information from national office to epo] |
Ref country code: RS Free format text: LAPSE BECAUSE OF FAILURE TO SUBMIT A TRANSLATION OF THE DESCRIPTION OR TO PAY THE FEE WITHIN THE PRESCRIBED TIME-LIMIT Effective date: 20250123 |
|
| U20 | Renewal fee for the european patent with unitary effect paid |
Year of fee payment: 7 Effective date: 20250327 |
|
| PG25 | Lapsed in a contracting state [announced via postgrant information from national office to epo] |
Ref country code: SM Free format text: LAPSE BECAUSE OF FAILURE TO SUBMIT A TRANSLATION OF THE DESCRIPTION OR TO PAY THE FEE WITHIN THE PRESCRIBED TIME-LIMIT Effective date: 20241023 |
|
| PGFP | Annual fee paid to national office [announced via postgrant information from national office to epo] |
Ref country code: ES Payment date: 20250528 Year of fee payment: 7 |
|
| PG25 | Lapsed in a contracting state [announced via postgrant information from national office to epo] |
Ref country code: SK Free format text: LAPSE BECAUSE OF FAILURE TO SUBMIT A TRANSLATION OF THE DESCRIPTION OR TO PAY THE FEE WITHIN THE PRESCRIBED TIME-LIMIT Effective date: 20241023 |
|
| PG25 | Lapsed in a contracting state [announced via postgrant information from national office to epo] |
Ref country code: CZ Free format text: LAPSE BECAUSE OF FAILURE TO SUBMIT A TRANSLATION OF THE DESCRIPTION OR TO PAY THE FEE WITHIN THE PRESCRIBED TIME-LIMIT Effective date: 20241023 |
|
| PLBE | No opposition filed within time limit |
Free format text: ORIGINAL CODE: 0009261 |
|
| STAA | Information on the status of an ep patent application or granted ep patent |
Free format text: STATUS: NO OPPOSITION FILED WITHIN TIME LIMIT |
|
| 26N | No opposition filed |
Effective date: 20250724 |
|
| PG25 | Lapsed in a contracting state [announced via postgrant information from national office to epo] |
Ref country code: MC Free format text: LAPSE BECAUSE OF FAILURE TO SUBMIT A TRANSLATION OF THE DESCRIPTION OR TO PAY THE FEE WITHIN THE PRESCRIBED TIME-LIMIT Effective date: 20241023 |
|
| REG | Reference to a national code |
Ref country code: CH Ref legal event code: H13 Free format text: ST27 STATUS EVENT CODE: U-0-0-H10-H13 (AS PROVIDED BY THE NATIONAL OFFICE) Effective date: 20251024 |