EP3771061A1 - Power system stabilization system and power system stabilization method using calculated power system sensitivity - Google Patents
Power system stabilization system and power system stabilization method using calculated power system sensitivity Download PDFInfo
- Publication number
- EP3771061A1 EP3771061A1 EP20173898.6A EP20173898A EP3771061A1 EP 3771061 A1 EP3771061 A1 EP 3771061A1 EP 20173898 A EP20173898 A EP 20173898A EP 3771061 A1 EP3771061 A1 EP 3771061A1
- Authority
- EP
- European Patent Office
- Prior art keywords
- sensitivity
- power
- power system
- dynamic
- stabilization
- Prior art date
- Legal status (The legal status is an assumption and is not a legal conclusion. Google has not performed a legal analysis and makes no representation as to the accuracy of the status listed.)
- Granted
Links
Images




Classifications
-
- H—ELECTRICITY
- H02—GENERATION; CONVERSION OR DISTRIBUTION OF ELECTRIC POWER
- H02J—ELECTRIC POWER NETWORKS; CIRCUIT ARRANGEMENTS OR SYSTEMS FOR SUPPLYING OR DISTRIBUTING ELECTRIC POWER; SYSTEMS FOR STORING ELECTRIC ENERGY
- H02J3/00—Circuit arrangements for AC mains or AC distribution networks
- H02J3/001—Arrangements for handling faults or abnormalities, e.g. emergencies or contingencies
-
- H—ELECTRICITY
- H02—GENERATION; CONVERSION OR DISTRIBUTION OF ELECTRIC POWER
- H02J—ELECTRIC POWER NETWORKS; CIRCUIT ARRANGEMENTS OR SYSTEMS FOR SUPPLYING OR DISTRIBUTING ELECTRIC POWER; SYSTEMS FOR STORING ELECTRIC ENERGY
- H02J2103/00—Details of circuit arrangements for mains or AC distribution networks
- H02J2103/30—Simulating, planning, modelling, reliability check or computer assisted design [CAD] of electric power networks
-
- Y—GENERAL TAGGING OF NEW TECHNOLOGICAL DEVELOPMENTS; GENERAL TAGGING OF CROSS-SECTIONAL TECHNOLOGIES SPANNING OVER SEVERAL SECTIONS OF THE IPC; TECHNICAL SUBJECTS COVERED BY FORMER USPC CROSS-REFERENCE ART COLLECTIONS [XRACs] AND DIGESTS
- Y02—TECHNOLOGIES OR APPLICATIONS FOR MITIGATION OR ADAPTATION AGAINST CLIMATE CHANGE
- Y02E—REDUCTION OF GREENHOUSE GAS [GHG] EMISSIONS, RELATED TO ENERGY GENERATION, TRANSMISSION OR DISTRIBUTION
- Y02E60/00—Enabling technologies; Technologies with a potential or indirect contribution to GHG emissions mitigation
-
- Y—GENERAL TAGGING OF NEW TECHNOLOGICAL DEVELOPMENTS; GENERAL TAGGING OF CROSS-SECTIONAL TECHNOLOGIES SPANNING OVER SEVERAL SECTIONS OF THE IPC; TECHNICAL SUBJECTS COVERED BY FORMER USPC CROSS-REFERENCE ART COLLECTIONS [XRACs] AND DIGESTS
- Y04—INFORMATION OR COMMUNICATION TECHNOLOGIES HAVING AN IMPACT ON OTHER TECHNOLOGY AREAS
- Y04S—SYSTEMS INTEGRATING TECHNOLOGIES RELATED TO POWER NETWORK OPERATION, COMMUNICATION OR INFORMATION TECHNOLOGIES FOR IMPROVING THE ELECTRICAL POWER GENERATION, TRANSMISSION, DISTRIBUTION, MANAGEMENT OR USAGE, i.e. SMART GRIDS
- Y04S40/00—Systems for electrical power generation, transmission, distribution or end-user application management characterised by the use of communication or information technologies, or communication or information technology specific aspects supporting them
- Y04S40/20—Information technology specific aspects, e.g. CAD, simulation, modelling, system security
Definitions
- the present invention relates to a power system stabilization system and a power system stabilization method.
- Patent Literature 1 discloses an object in this context of "efficiently controlling overload of power transmission and substation facilities due to both short cycle and long cycle load fluctuations while satisfying the operational constraints of the power system, thereby improving controllability and economic efficiency.”
- the MMI 5 sets an operational limit value 52 for overload prevention, which is 98% of the operational limit value 53 of the power transmission and substation facilities 411 to 41n.
- the overload prevention countermeasure unit 37 calculates a value of overload prevention countermeasure when the online power flow value of the power transmission and substation facilities 411 to 41n exceeds the operational limit value 52 for overload prevention.
- the overload prevention countermeasure unit 37 achieves overload resolution of the power transmission and substation facilities 411 to 41n at the time of short cycle load fluctuation, and at the same time, complements the cycle period of the overload resolution processing of the power transmission and substation facilities 411 to 41n by economic load distribution control at the time of long cycle load fluctuation" (see Abstract in Patent Literature 1).
- Patent Literature 2 also describes a similar object of "providing a system operation support device and a method in a power system capable of performing operation support for a power system operator in order to stabilize the power system, and an application system thereof.”
- a system operation support device in a power system stabilizing the power system and characterized be being provided with: a predicted accident time system state calculation unit receiving measurement data, a system topology, and a target accident type as inputs and calculating a system state and a predicted accident time system state; a control menu calculation unit receiving the results of the predicted accident time system state calculation unit as inputs and calculating a control menu; a restoration control means calculation unit receiving the result of the control menu calculation as an input and calculating a restoration control procedure; a restoration prevention control procedure calculation unit receiving the result of the restoration control means calculation unit and a target restoration time parameter as inputs and performing a power generator output adjustment time simulation, a necessary prevention control amount calculation, and a prevention control procedure calculation; and a display unit displaying control procedure calculation;
- Non Patent Literature 1 discloses that "power flow Jacobian calculation is carried out by the least squares method using time-synchronized voltage and current phasor data".
- Non Patent Literature 1 Yu Christine Chen, Jianhui Wang, Alejandro D. Dominguez-Garcia, Peter W. Sauer, "Measurement-Based Estimation of the Power Flow Jacobian Matrix," IEEE Transactionson Smart Grid, vol. 7, no. 5, pp. 2507-2515, Sept. 2016 .
- Patent Literature 1 based on the fact that the sensitivity coefficient is a generator output with respect to power flow change, if the power flow of the power transmission and substation facilities exceeds the operational limit value, the target output value of the most sensitive generator among generators is calculated in order to resolve the overload in the power system.
- the influence of voltage fluctuations and the propagation delay time of measurement information are not taken into account in calculating the sensitivity coefficient, and the case where unstable vibration may occur when the generator output fluctuates is not assumed, which leads to a possibility that the power system cannot be appropriately stabilized.
- Patent Literature 2 the output from the generator and the sensitivity of the phase in the system are used in calculating the recovery control means, and the output change constraint of the generator is considered, making it possible to perform the recovery control earlier.
- Patent Literature 2 similar to Patent Literature 1, the effects of voltage fluctuations are not taken into account in calculating the sensitivity coefficient, and changes in the system impedance due to meteorological changes are not assumed, which leads to a possibility that the power system cannot be appropriately stabilized.
- Non Patent Literature 1 power flow Jacobian calculation is carried out by the least squares method using time-synchronized voltage and current phasor data.
- power flow Jacobian calculation has the same role as the power flow sensitivity described in Patent Literature 1 and Patent Literature 2 and can calculate the power flow sensitivity from the movement during the occurrence of a system event, but the effects of voltage fluctuations are not fully taken into account, which leads to a possibility that the power system cannot be appropriately stabilized.
- an object of the present invention is to more appropriately support operation for stabilizing a power system.
- a power system stabilization system that supports stabilization of a power system, includes: a dynamic system sensitivity generation unit that generates dynamic system sensitivity of the power system by using measurement data obtained by a measurement unit installed in the power system and a sensitivity calculation parameter as inputs; a system abnormality resolution procedure generation unit that, using the dynamic system sensitivity, a controllable device list indicating a controllable device in the power system, and a system abnormality resolution procedure generation policy as inputs, generates a system abnormality resolution procedure with which the power system is operated with the controllable device controlled to resolve a system abnormality in the power system; and/or an output unit that outputs the system abnormality resolution procedure.
- an operation for stabilizing a power system can be more appropriately supported.
- Fig. 1 is a diagram illustrating an example of a configuration of a power system 12 adopting a system stabilization system 1 according to first to fourth embodiments.
- the power system 12 according to the first to the fourth embodiments is connected with generators G1 to G3, power lines L1 to L12, bus lines B1 to B17 connecting the power lines or distribution lines with each other, circuit breakers CB1 to CB26, transformers T1 to T7 that transform AC voltage, measurement units M1 to M14 that measures various parameters in the power system, relays R1 to R14 adapted to control facilities in the power system, a wind generator WT1 that generates power from wind, a solar power generator PV1 that generates power from sunlight, a pumped-storage generator WP1 that stores electricity using water, a power storage system BS1 that stores electricity, a reactive power supplier ST1 used for voltage adjustment, a consumer DM1 that consumes power, an electric vehicle EV1 that consumes power, an electric vehicle charging station EVC1 through which the electric vehicle EV1 is
- Fig. 2 is a diagram illustrating an example of a power flow (flow of power) in the power system 12.
- the power generated by the generators G1 to G3 is transmitted to the consumer DM1, the electric vehicle EV1, the pumped-storage generator WP1, and the power storage system BS1, via the transformers T1 to T7, the power lines L1 to L12, the bus lines B1 to B17, the electric vehicle charging station EVC1, and the DC power line DC1.
- the load of this power flow in the power system is within an appropriate range, whereby stability of the power system is achieved.
- Fig. 3 is a diagram illustrating an example of overload in the power system 12.
- a system failure has occurred in the power line L1 to activate the circuit breakers CB13 to CB14 to disconnect the power line L7, leading to a limited transmission route, resulting in another power line L6 overloaded.
- the circuit breakers CB11 to CB12 connected to the power line L6 disconnect the power line L6 for power line protection.
- other power lines will be similarly overloaded. In this manner a chain reaction of failure may occur. This is known as a cascade failure.
- Fig. 4 is a diagram illustrating an example of a change in impedance of a power line.
- the impedance of a power line rises due to temperature rise caused by overload or weather fluctuation, and becomes higher than the impedance of a system model.
- a controllable device needs to be controlled in accordance with the impedance change due to the temperature rise caused by the overload and the like, to resolve the overload and the like of the power line.
- a first embodiment of the present invention will be described with reference to Fig. 5 to Fig. 13 .
- Fig. 3 an example of resolution of the overload of the power line L6 (an example of system abnormality) caused by disconnection of the power line L7 will be described.
- Fig. 5 is a diagram illustrating an example of a configuration including the power system 12 and the system stabilization system 1 according to the first embodiment.
- the system stabilization system 1 is a computer that supports the operation of the power system 12.
- Various devices in the power system 12 illustrated in Fig. 1 are connected to the system stabilization system 1 via a communication network CN11.
- Fig. 5 illustrates an example in which the measurement unit M1, the measurement unit M2, the measurement unit M9, the generator G1, and the generator G2 are connected to the system stabilization system 1 via the communication network CN11.
- Other devices not illustrated in Fig. 5 are similarly connected to the system stabilization system 1 via the communication network CN11.
- the system stabilization system 1 has a communication unit H2 serving as an interface for communications with the communication network CN11, an input unit H3 through which information from a user or another system is input, a Central Processing Unit (CPU) 91 for calculation processing, a memory H1 for holding data during calculation, an output unit 6 that outputs calculation results, and various databases.
- the various databases include a measurement database DB1, a dynamic system sensitivity database DB2, a controllable device list database DB3, a dynamic system sensitivity generation program database DB4, a system abnormality resolution procedure generation program database DB5, a system abnormality resolution procedure database DB6, a sensitivity calculation parameter database DB7, and a system abnormality resolution procedure generation policy database DB8 that are connected to a data bus H4.
- the communication unit H2 includes a circuit for connecting to the communication network 11 and a communication protocol.
- the memory H1 is configured as a Random Access Memory (RAM), and stores a computer program loaded from each program database, calculation result data necessary for each processing, image data, and the like.
- the memory H1 is a memory for temporarily storing measurement data D1 stored in the measurement database DB1, image data for display on the output unit 6, calculation temporary data and calculation result data obtained by the CPU 91, and the like.
- the CPU 91 reads and executes a predetermined computer program from each program database.
- the CPU 91 may be configured as one or a plurality of semiconductor chips, or may be configured as a computer device such as a calculation server.
- the CPU 91 executes each program loaded from each program database onto the memory H1, and executes arithmetic processing on data obtained from various databases. In the arithmetic processing, the CPU 91 uses a physical memory of the memory H1, but may also use a virtual memory.
- the CPU 91 generates necessary image data and outputs it to the output unit 6 (for example, a display screen). Screen data stored in the memory H1 is sent to the output unit 6 to be displayed.
- the output unit 6 is configured as, for example, one or more of a display, a printer device, an audio output device, a mobile terminal, and a wearable.
- the system stabilization system 1 may cooperate with an external system or an external function by using the communication unit H2.
- the measurement database DB1 includes the measurement data D1 in power system 12.
- the measurement data D1 is measurement data including information such as "voltage”, “current”, “phase”, “frequency”, “frequency change rate”, “active power”, “reactive power”, and “generator angular velocity” at each timing obtained from the measurement units M1 to M14 of the power system 12.
- the measurement unit 10 is a measurement device or a measurement instrument examples of which including Phasor Measurement Units (PMU), Voltage Transformer (VT), a Potential Transformer (PT), a Current Transformer (CT), and telemeter (TM), provided in the power system.
- PMU Phasor Measurement Units
- VT Voltage Transformer
- PT Potential Transformer
- CT Current Transformer
- TM telemeter
- the measurement data D1 obtained from the measurement units M1 to M14 is aggregated and collected by a measurement value collection device, such as Supervisory Control And Data Acquisition (SCADA), provided in the power system 12.
- SCADA Supervisory Control And Data Acquisition
- the dynamic system sensitivity database DB2 stores dynamic system sensitivity D2 generated by executing a dynamic system sensitivity generation program D4 stored in the dynamic system sensitivity generation program database DB4.
- the dynamic system sensitivity D2 represents a function of an amount change one variable in the measurement data D1 with respect to that of another variable, and is represented by, for example, a matrix, a polynomial, and a neural network.
- the controllable device list database DB3 stores a controllable device list D3.
- the controllable device list D3 includes a list of devices that can be controlled by the system stabilization system 1 or devices that can be controlled using the output of the system stabilization system 1.
- examples of controllable devices include the circuit breakers, transformers, generators, chargers, power storage systems, pumped-storage generators, reactive power supplier, relays, and phase regulators illustrated in Fig. 1 .
- the dynamic system sensitivity generation program database DB4 stores a dynamic system sensitivity generation program D4 for generating the dynamic system sensitivity D2.
- the system abnormality resolution procedure generation program database DB5 stores a system abnormality resolution procedure generation program D5 for generating a system abnormality resolution procedure D6.
- the system abnormality resolution procedure database DB6 stores the system abnormality resolution procedure D6 generated by executing the system abnormality resolution procedure generation program D5.
- the system abnormality resolution procedure D6 includes a procedure for resolving an abnormality of the power system 12 including overload, and the power system 12 is operated in accordance with the procedure in an aim to resolve the abnormality of the power system 12.
- the sensitivity calculation parameter database DB7 stores a sensitivity calculation parameter D7 for generating the dynamic system sensitivity D2.
- the sensitivity calculation parameter D7 is for defining "range of types and range on time series of pieces of measurement data used as input and output”, “propagation delay time to be taken into consideration between input and output”, “method of removing noise from measurement data”, “recalculation condition”, “format of sensitivity function”, and “method of calculating sensitivity function” for generating the dynamic system sensitivity D2.
- the system abnormality resolution procedure generation policy database DB8 stores a system abnormality resolution procedure generation policy D8.
- the system abnormality resolution procedure generation policy D8 includes policies related to the system abnormality resolution procedure D6, such as target "system abnormality type”, “recalculation cycle of system abnormality resolution procedure”, “allowable operation amount”, “desirable system abnormality resolution time period”, and "standby time before the start of abnormality resolution”.
- the measurement units M1 to M14 included in the power system 12 transmit the measurement values obtained at their respective installation locations in the power system 12, to the communication unit H2 of the system stabilization system 1 via the communication network CN11.
- the system stabilization system 1 temporarily stores the received measurement data in the memory H1, and then stores it as the measurement data D1 in the measurement database DB1.
- the input unit H3 may be configured to include, for example, at least one of a keyboard switch, a pointing device such as a mouse, a touch panel, a tablet, an eye-gaze estimation device using a camera, an electroencephalogram conversion device, and a voice instruction device.
- the input unit H3 may be a user interface other than those described the above.
- Fig. 6 is a diagram illustrating an example of a configuration including the system stabilization system 1 according to the first embodiment.
- Fig. 5 illustrates the system stabilization system 1 in terms of hardware configuration
- Fig. 6 illustrates the system stabilization system 1 in terms of processing function configuration with a part of the configuration omitted.
- the system stabilization system 1 includes the measurement data D1, the controllable device list D3, the sensitivity calculation parameter D7, the system abnormality resolution procedure generation policy D8, a dynamic system sensitivity generation unit 2, a system abnormality resolution procedure generation unit 3, and the output unit 6.
- the system stabilization system 1 includes the measurement database DB1, the dynamic system sensitivity database DB2, the controllable device list database DB3, the system abnormality resolution procedure database DB6, the sensitivity calculation parameter database DB7, and the system abnormality resolution procedure generation policy database DB8.
- the data in these databases is prepared in advance, generated by an intermediate process, or generated as a final output.
- the dynamic system sensitivity generation unit 2 generates the dynamic system sensitivity D2 by using the measurement data D1 and the sensitivity calculation parameter D7 as inputs.
- the system abnormality resolution procedure generation unit 3 generates the system abnormality resolution procedure D6 by using the controllable device list D3 and the system abnormality resolution procedure generation policy D8 as inputs. Details of the processing of the dynamic system sensitivity generation unit 2 and the system abnormality resolution procedure generation unit 3 will be described later.
- Fig. 7 is a flowchart illustrating an example of overall processing of the system stabilization system 1 according to the first embodiment. The overall processing of the system stabilization system 1 is periodically executed.
- step S1 the dynamic system sensitivity generation unit 2 generates and outputs the dynamic system sensitivity D2 by using the measurement data D1 and the sensitivity calculation parameter D7 as inputs.
- step S2 the system abnormality resolution procedure generation unit 3 generates and outputs the system abnormality resolution procedure D6 by using the dynamic system sensitivity D2 generated by the dynamic system sensitivity generation unit 2, controllable device list D3, and the system abnormality resolution procedure generation policy D8 as inputs.
- step S3 the output unit 6 outputs the system abnormality resolution procedure D6 generated by the system abnormality resolution procedure generation unit 3, and the like.
- Fig. 8 is a flowchart illustrating an example of dynamic system sensitivity calculation processing according to the first embodiment.
- the dynamic system sensitivity generation unit 2 reads the measurement data D1 and the sensitivity calculation parameter D7.
- step S102 the dynamic system sensitivity generation unit 2 determines whether the "recalculation condition" designated by the sensitivity calculation parameter D7 is satisfied.
- the dynamic system sensitivity generation unit 2 proceeds to step S103 when the recalculation condition is satisfied (step S102 Yes), and proceeds to step S107 when the recalculation condition is not satisfied (step S102 No).
- step S102 whether the recalculation of the dynamic system sensitivity D2 is required is determined, for example, based on "recalculation condition" such as whether a predetermined time period has elapsed after the previous calculation of the dynamic system sensitivity D2. This is because, elapse of a predetermined time period after the previous calculation might lead to a change in temperature of power lines and devices, resulting in a change in impedance as illustrated in Fig. 4 .
- whether the recalculation of the dynamic system sensitivity D2 is required may be determined based on "recalculation condition" such as whether the measurement data D1 has changed significantly.
- step S103 the dynamic system sensitivity generation unit 2 selects, as an input variable x and an output variable y, one or more of the voltage, current, phase, frequency, frequency change rate, active power, reactive power, and generator angular velocity, from the measurement data D1, based on the target time point and the type of the measurement data D1, based on the sensitivity calculation parameter D7.
- the input variable x at least includes voltage.
- the power system 12 can be more appropriately stabilized even without the system model sensitivity, with an influence of voltage fluctuation taken into consideration by using the dynamic system sensitivity.
- step S103 will be described in detail.
- the ultimate goal of the dynamic system sensitivity generation unit 2 is to calculate a sensitivity function f represented by the following Formula (1).
- ⁇ y f ⁇ x
- ⁇ y represents the amount of change in the output variable
- ⁇ x represents the amount of change in the input variable.
- measurement data of the voltage and active power has been obtained by the measurement units M1 and M2 in the power system 12 in Fig. 3
- measurement data of the active power has been obtained by the measurement unit M9.
- a range on time series and of measurement types of the measurement data to be input, and a range on time series and of measurement types of the measurement data to be output are designated. Note that the time series for the input and the time series for the output need not to match. In the example of Fig.
- the input variable x is assumed to be the active power obtained by the measurement unit M1, the voltage and the active power obtained by the measurement unit M2, and the output variable y is assumed to be the active power obtained by the measurement unit M9.
- the range of the measurement type of the input variable x includes the active power obtained by the measurement unit M1 and the voltage and the active power obtained by the measurement unit M2.
- the time series range is a time range indicated by an enclosed broken line BL1 illustrated in Fig. 9 .
- the range of the measurement type of the output variable y includes the active power obtained by the measurement unit M9.
- the time series range is a time range indicated by an enclosed broken line BL2 illustrated in Fig. 9 .
- step S104 based on the sensitivity calculation parameter D7, the dynamic system sensitivity generation unit 2 calculates an amount of change in each input variable x and each output variable y with propagation delay and noise removed.
- step S104 because the input variable x calculated in step S103 may have calculation error and noise, the dynamic system sensitivity generation unit 2 first removes the noise by using the functions of the following Formulae (2) and (3).
- the dynamic system sensitivity generation unit 2 calculates an amount ⁇ x of change in the input variable x and an amount ⁇ y of change in the output variable y by using a propagation delay time di and a change value calculation interval T designated by the sensitivity calculation parameter D7.
- xi ⁇ represents the ith input variable in 1 filtered input variables
- yj ⁇ represents the jth output variable in m filtered output variables.
- the value of the propagation delay time di is prepared to be different among the input variables xi ⁇ . Alternatively, the value may be the same among the input variables xi ⁇ .
- a shorter propagation delay time may be provided for an input variable x corresponding to a measurement unit existing in a predetermined vicinity range from the measurement unit corresponding to the output variable y, and a longer propagation delay time may be provided to the input variable x corresponding to the measurement unit outside the predetermined vicinity range.
- step S105 based on the sensitivity calculation parameter D7, the dynamic system sensitivity generation unit 2 calculates the dynamic system sensitivity by calculating a pseudo-inverse matrix, learning a neural network, or performing a polynomial approximation using error minimization.
- step S105 the format of the sensitivity function of the above Formula (1) is designated, and the dynamic system sensitivity is calculated according to the designated format.
- the format of the sensitivity function is designated as in the following Formula (6).
- the sensitivity function may be represented by a norm polynomial of ⁇ x as in the following Formula (7).
- Formula (7) a norm polynomial of ⁇ x as in the following Formula (7).
- LSTM Long Short Term Memory
- step S106 the dynamic system sensitivity generation unit 2 outputs the dynamic system sensitivity calculated in step S105.
- step S106 ends, the dynamic system sensitivity generation unit 2 proceeds to step S2 in Fig. 7 and to step S107.
- step S107 the dynamic system sensitivity generation unit 2 stands by for a predetermined period of time and then proceeds to step S101 at the next recalculation timing.
- Fig. 11 is a flowchart illustrating an example of a system abnormality resolution procedure generation processing.
- the system abnormality resolution procedure generation unit 3 reads the dynamic system sensitivity D2, the controllable device list D3, and the system abnormality resolution procedure generation policy D8.
- step S202 the system abnormality resolution procedure generation unit 3 checks whether there is "system abnormality".
- the system abnormality resolution procedure generation unit 3 proceeds to step S203 when there is a system abnormality (step S202 YES), and proceeds to step S207 when there is no system abnormality (step S202 NO).
- step S202 will be described in detail.
- the "system abnormality" in step S202 is, for example, occurrence of overload, voltage exceeding or falling below the upper or lower limit, deterioration of the voltage stability, deterioration of the frequency stability, frequency exceeding or falling below the upper or lower limit, deterioration of the synchronization stability, and the like at one or more installation locations of the measurement unit(s) in the power system 12.
- Methods usable as a method for checking a system abnormality include a method of setting a threshold value for measurement data measured by a measurement unit, extracting a feature through signal processing, determining from a statistical value, and the like.
- step S203 based on the system abnormality resolution procedure generation policy D8, the system abnormality resolution procedure generation unit 3 generates a satisfaction problem with dynamic system sensitivity being objective function or an optimization problem with dynamic system sensitivity being constraint expression.
- the system abnormality resolution procedure generation policy D8 includes an allowable operation amount for resolving a system abnormality, a desirable system abnormality resolution time period, and the like.
- the system abnormality resolution procedure generation unit 3 formulates an optimization problem in Formula (9) with Formula (10) being the constraint expression by using the allowable operation amount and the desirable system abnormality resolution time period.
- Formula (10) being the constraint expression by using the allowable operation amount and the desirable system abnormality resolution time period.
- cost (f( ⁇ x)) in the above Formula (9) represents the cost required for the operation procedure, which means, for example, the time required for resolving the overload.
- the above Formula (10) indicates that when the input variable ⁇ x is changed from the current state y now based on the sensitivity function f, the output variable y falls within the normal range.
- An optimization problem or a satisfactory solution problem may be formulated not only with a constraint for resolution of the system abnormality which is the main object, but also with another constraint for preventing further system abnormality from occurring.
- step S204 the system abnormality resolution procedure generation unit 3 generates a system abnormality resolution procedure by solving the problem formulated in step S203.
- step S205 the system abnormality resolution procedure generation unit 3 estimates the cost of the system abnormality resolution procedure generated in step S204 (time required for system abnormality resolution).
- step S206 the system abnormality resolution procedure generation unit 3 outputs the system abnormality resolution procedure and the like generated in step S204 to the output unit 6.
- step S207 the processing proceeds to step S201 at the next recalculation timing, after a predetermined standby period.
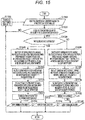
- Figs. 12A and 12B are diagrams illustrating an example of display 6a of the system abnormality resolution procedure.
- the power system stabilization system 1 which is assumed to be installed at a command center related to the operation of the power system 12, displays the display 6a as illustrated in Figs. 12A and 12B to a power system operator (user).
- the display 6a in Figs. 12A and 12B is for displaying, to the power system operator, a power system model 6a1, an input variable 6a2, a sensitivity calculation parameter 6a3, a controllable device list 6a4, dynamic system sensitivity 6a5, a system abnormality resolution procedure 6a6, a system abnormality resolution cost 6a7, automatic control 6a8, and the like.
- the power system model 6a1 indicates the current state of the power system 12 in which the power line L6 is overloaded as in the example illustrated in Fig. 3 .
- the input variable 6a2 indicates the type of data to be the input variable, among pieces of measurement data measured by the measurement units installed within a predetermined vicinity area of the controllable device selected from the controllable device list D3 for the calculation of the dynamic system sensitivity D2.
- the input variable 6a2 includes the active power measured by the measurement unit M1 installed in the vicinity of the generator G1 and the voltage and the active power measured by the measurement unit M2 installed in the vicinity of the generator G2, as in the example illustrated in Fig. 9 .
- the sensitivity calculation parameter 6a3 indicates, for example, "3 seconds” as the value of the "recalculation condition" in the sensitivity calculation parameter D7.
- the controllable device list 6a4 indicates the generators G1 and G2 selected as controllable devices from the controllable device list D3 for the calculation of the dynamic system sensitivity D2.
- the dynamic system sensitivity 6a5 indicates the dynamic system sensitivity D2 generated by the dynamic system sensitivity generation unit 2 based on the input variable as indicated by the input variables 6a2 and the output variable.
- the dynamic system sensitivity 6a5 indicates the amount of change in the active power of the power line L6 with respect to an output operation amount of the generator G1, and the amount of change in the power of the power line L6 with respect to an output operation amount of the generator G2.
- L6/G1:0.8 MW/MW indicates that a change in the power generation amount of the generator G1 by 1 MW results in the active power of the power line L6 changed by 0.8 MW.
- L6/G1:0.8 MW/MW indicates that a change in the power generation amount of the generator G1 by 1 MW results in the active power of the power line L6 changed by 0.8 MW.
- L6/G1:0.8 MW/MW for generator G2.
- the system abnormality resolution procedure 6a6 is a system abnormality resolution procedure generated by the system abnormality resolution procedure generation unit 3.
- the system abnormality resolution procedure 6a6 indicates a system abnormality resolution procedure including incrementing the output of the generator G1 by +10 MW and decrementing the output of the generator G2 by - 10 MW.
- the system abnormality resolution cost 6a7 indicates a time period between the start of the procedure indicated by the system abnormality resolution procedure 6a6 and the resolution of the system abnormality, and is "five minutes" in the example illustrated in Fig. 12B .
- the automatic control 6a8 indicates whether a function of automatically executing the system abnormality resolution procedure 6a6, described later in a third embodiment, is active or not.
- the power system operator can refer to the display 6a when drafting countermeasures for a system abnormality.
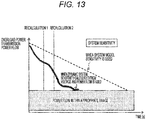
- Fig. 13 is a diagram illustrating an example of the effect of the first embodiment.
- the graph in Fig. 13 illustrates a comparative image for overload resolution, with the horizontal axis representing time, the vertical axis representing the power flow in the overloaded power line, the dashed line representing a change in power flow in a case where the system model sensitivity based on the system impedance (system model base) is used, and a solid line representing a change in the power flow current in a case where the dynamic system sensitivity is used.
- the present embodiment can provide the system stabilization system 1 that can provide appropriate operation support to systems, devices, people, and the like related to the operation of the power system for the sake of stabilization of the power system. Furthermore, with the present embodiment, no power system impedance information is required, and the system abnormality can be resolved based on the measurement value measured by the measurement units. Thus, the power system can be stabilized even in a system with incomplete impedance information. A method of linking with a system model including an impedance map will be described later as a second embodiment.
- overload is the target, but as described above, other events in the power system can be addressed.
- the second embodiment of the present invention will be described with reference to Figs. 14 and 15 .
- a case where an existing dynamic system model sensitivity is combined with the dynamic system sensitivity according to the first embodiment will be described.
- Fig. 14 is a diagram illustrating an example of a configuration including the system stabilization system 1B according to the second embodiment.
- the system stabilization system 1B is different from the system stabilization system 1 according to the first embodiment, in that a system model database DB9 is further provided, that a dynamic system sensitivity generation unit 2B is provided instead of the dynamic system sensitivity generation unit 2, and that a sensitivity calculation parameter database DB7B is provided instead of the sensitivity calculation parameter database DB7.
- the system model database DB9 stores a system model D9 including one or more pieces of impedance information between branches and connection information between nodes in a target power system.
- the system model D9 is input to the dynamic system sensitivity generation unit 2B.
- the sensitivity calculation parameter D7B stored in the sensitivity calculation parameter database DB7B includes a policy of partially utilizing the system model.
- Fig. 15 is a flowchart illustrating an example of dynamic system sensitivity calculation processing according to the second embodiment.
- dynamic system sensitivity calculation processing illustrated in Fig. 15 is executed instead of the dynamic system sensitivity calculation processing according to the first embodiment illustrated in Fig. 8 .
- step S101B the dynamic system sensitivity generation unit 2B reads the measurement data D1, the sensitivity calculation parameter D7B, and the system model D9.
- step S102B the dynamic system sensitivity generation unit 2B determines whether the "recalculation condition" designated by the sensitivity calculation parameter D7B is satisfied.
- the dynamic system sensitivity generation unit 2B proceeds to step S103B when the recalculation condition is satisfied (step S102B Yes), and proceeds to step S115B when the recalculation condition is not satisfied (step S102B No).
- step S103B the dynamic system sensitivity generation unit 2B determines whether the partial utilization of the system model D9, read in step S101B, is designated by the sensitivity calculation parameter D7B.
- the dynamic system sensitivity generation unit 2B proceeds to step S104B when the system model D9 is partially used (step S103B YES), and proceeds to step S109B when the system model D9 is not partially used (step S103B NO).
- the dynamic system sensitivity generation unit 2B executes processing that is the same processing as that in steps S103 to S105 in Fig. 8 on a part of the system as a target of the dynamic system sensitivity is calculation.
- step S107B the dynamic system sensitivity generation unit 2B combines the system model sensitivity with the dynamic system sensitivity calculated in step S107B to generate the system sensitivity as the dynamic system sensitivity D2 of the target power system.
- step S107B will be described in detail.
- the sensitivity of the system model D9 (system model sensitivity) can be obtained from an inverse impedance matrix based on a DC method.
- step S108B the dynamic system sensitivity generation unit 2B outputs the dynamic system sensitivity D2 generated in step S107B.
- steps S109B to S111B the dynamic system sensitivity generation unit 2B performs processing that is the same as that in steps S103 to S105 in Fig. 8 , respectively.
- step S112B based on the error between the dynamic system sensitivity calculated in step S111B and the system model sensitivity of the system model D9, the dynamic system sensitivity generation unit 2B determines whether the dynamic system sensitivity calculated in step S111B is within an effective range.
- step S112B the dynamic system sensitivity generation unit 2B calculates the absolute value of the difference between the system model sensitivity calculated with the above Formula (14) and the dynamic system sensitivity calculated in step S111B with an error range ⁇ included in the sensitivity calculation parameter D7B. Then, when the following Formula (16) holds true, the dynamic system sensitivity generation unit 2B determines that the dynamic system sensitivity calculated in step S111B is within the effective range (step S112B YES), and proceeds to step S113B. On the other hand, when the following Formula (16) does not holds true, the dynamic system sensitivity generation unit 2B determines that the dynamic system sensitivity calculated in step S111B is outside the effective range (step S112B NO), and proceeds to step S114B. [Formula 16] A ⁇ ⁇ P i ⁇ f ⁇ P i ⁇ V i ⁇ ⁇
- step S113B the dynamic system sensitivity generation unit 2B outputs the dynamic system sensitivity D2 calculated in step S111B.
- the dynamic system sensitivity generation unit 2B outputs the system model sensitivity calculated based on the system model D9 read in step S101B instead of the dynamic system sensitivity D2.
- step S108B, 113B, or 114B ends, the dynamic system sensitivity generation unit 2B proceeds to step S2 in Fig. 7 and to step S115B.
- the processing in step S115B is the same as that in step S107 in Fig. 8 .
- the dynamic system sensitivity is combined with the system model sensitivity, so that occurrence of an abnormality in the dynamic system sensitivity due to an abnormality in the measurement data and the like can be prevented, whereby the reliability of the system stabilization system 1B can further be improved.
- a system stabilization system 1C obtained by adding an automatic control function for the power system 12 is added to the system stabilization system 1 of the first embodiment or the system stabilization system 1B of the second embodiment will be described.
- Fig. 16 is a diagram illustrating an example of a configuration including the system stabilization system 1C according to the third embodiment.
- Fig. 16 illustrates a functional block diagram in which a control unit 4 is added to the system stabilization system 1 according to the first embodiment.
- the control unit 4 transmits a control signal to control target devices in various parts of the power system 12 via the communication network CN11 based on the system abnormality resolution procedure D6 calculated by the system abnormality resolution procedure generation unit 3.
- the control unit 4 may receive a command to activate automatic control input by a user.
- the system stabilization system 1C can more quickly and accurately stabilize the power system 12 by directly controlling the power system 12, in response to a system abnormality. Furthermore, the DC power line DC1, the power storage system BS1, the pumped-storage generator WP1, the solar power generation facility PV1, the wind generator WT1, the electric vehicle charging station EVC1, and the like, as shown in Fig. 1 , that are difficult to directly control by the decision of the user can be controlled.
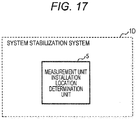
- Fig. 17 is a diagram illustrating an example of a configuration including the system stabilization system 1D according to the fourth embodiment.
- the system stabilization system 1D has a configuration in which the measurement unit installation location determination unit 5 is added to the system stabilization systems 1 to 1C of the first to third embodiments.
- configurations other than a measurement unit installation location determination unit 5 is omitted.
- the measuring unit installation location determination unit 5 is a non-von Neumann computer that outputs an installation location of a measurement unit by using the connection configuration, the number of redundant measurements, and the positions of the existing measurement units of the system as inputs.
- a measurement unit is installed on the bus line, so that the power flow of the power line and the voltage of the bus can be measured.
- the PMU described in the first embodiment can be installed on a single bus line to be capable of measuring the power flow of all the power lines and distribution lines connected to the bus line on which the PMU is installed.
- the measurement units are installed on all the bus lines.
- the measuring units that can be installed may be limited due to various restrictions.
- the optimum installation locations of the measurement units are determined as follows. Specifically, the user of the system stabilization system 1D inputs the connection configuration of the power system 12, the number of redundant measurements, and the positions of the existing measurement units. Then, a single objective function corresponding to conditions that the required number of measurement units is minimum, the measurement units can monitor all bus lines, and that the required number of measurement units are able to be secured with the value of the variable only capable of being 0 or 1 is obtained and converted into an Ising model with which the value of the variable can be represented by -1 or 1, and calculation is performed by the non-von Neumann computer.
- di represents the cost required for installing a measurement unit on the i-th bus line
- qi represents whether to install the measuring unit on the i-th bus line.
- the measuring unit needs to be installed on one or more of the bus lines connected via the power line.
- a matrix C as in the following Expression (18), which represents a connection state between the bus lines, is introduced. [Formula 18] C i , j ⁇ 1
- Bus i and j are connected or i j 0
- ⁇ i 1 N C i , j q i ⁇ 1
- Vi may be appropriately reduced.
- Formula (21) represents the Quadratic Unconstrained Binary Optimization (QUBO) formulation of such a constraint.
- QUBO Quadratic Unconstrained Binary Optimization
- the objective function as in the above Formula (22) is an NP-hard problem, and thus is difficult to calculate directly.
- the function is input to a non-von Neumann computer that minimizes the energy of the Ising model, to obtain a solution.
- the present invention is not limited to the embodiments described above, but includes various modifications. Furthermore, for example, the above-described embodiment is described in detail in order to explain the present invention in an easily understandable manner, and the present invention is not necessarily limited to a system having all the described configurations. As long as there is no contradiction, a part of the configuration of one embodiment can be replaced with the configuration of another embodiment, and a configuration of one embodiment can be added to the configuration of another embodiment. Furthermore, for a part of the configuration of each embodiment, a configuration can be added, deleted, replaced, integrated, or distributed. The configurations and processing described in the embodiments can be appropriately distributed or integrated based on processing efficiency or mounting efficiency.
Landscapes
- Engineering & Computer Science (AREA)
- Power Engineering (AREA)
- Supply And Distribution Of Alternating Current (AREA)
- Remote Monitoring And Control Of Power-Distribution Networks (AREA)
- Management, Administration, Business Operations System, And Electronic Commerce (AREA)
- Control Of Eletrric Generators (AREA)
Abstract
Description
- The present invention relates to a power system stabilization system and a power system stabilization method.
- Power systems are becoming more and more complicated due to factors such as recent introduction of renewable energy, despite the fact that their facilities are aging. Thus, the power systems are becoming difficult to stabilize.
- For example,
Patent Literature 1 discloses an object in this context of "efficiently controlling overload of power transmission and substation facilities due to both short cycle and long cycle load fluctuations while satisfying the operational constraints of the power system, thereby improving controllability and economic efficiency." Disclosed as a solution to this are "theMMI 5 sets an operational limit value 52 for overload prevention, which is 98% of the operational limit value 53 of the power transmission and substation facilities 411 to 41n. The overload prevention countermeasure unit 37 calculates a value of overload prevention countermeasure when the online power flow value of the power transmission and substation facilities 411 to 41n exceeds the operational limit value 52 for overload prevention. The overload prevention countermeasure unit 37 achieves overload resolution of the power transmission and substation facilities 411 to 41n at the time of short cycle load fluctuation, and at the same time, complements the cycle period of the overload resolution processing of the power transmission and substation facilities 411 to 41n by economic load distribution control at the time of long cycle load fluctuation" (see Abstract in Patent Literature 1). -
Patent Literature 2 also describes a similar object of "providing a system operation support device and a method in a power system capable of performing operation support for a power system operator in order to stabilize the power system, and an application system thereof." Disclosed as a solution to this is "a system operation support device in a power system stabilizing the power system and characterized be being provided with: a predicted accident time system state calculation unit receiving measurement data, a system topology, and a target accident type as inputs and calculating a system state and a predicted accident time system state; a control menu calculation unit receiving the results of the predicted accident time system state calculation unit as inputs and calculating a control menu; a restoration control means calculation unit receiving the result of the control menu calculation as an input and calculating a restoration control procedure; a restoration prevention control procedure calculation unit receiving the result of the restoration control means calculation unit and a target restoration time parameter as inputs and performing a power generator output adjustment time simulation, a necessary prevention control amount calculation, and a prevention control procedure calculation; and a display unit displaying control procedure calculation; and a display unit displaying the restoration control procedure and the prevention control procedure" (see Abstract in Patent Literature 2). -
Non Patent Literature 1 discloses that "power flow Jacobian calculation is carried out by the least squares method using time-synchronized voltage and current phasor data". -
- Patent Literature 1:
JP 2010-063320 A - Patent Literature 2:
JP 2019-017194 A - Non Patent Literature 1: Yu Christine Chen, Jianhui Wang, Alejandro D. Dominguez-Garcia, Peter W. Sauer, "Measurement-Based Estimation of the Power Flow Jacobian Matrix," IEEE Transactionson Smart Grid, vol. 7, no. 5, pp. 2507-2515, Sept. 2016.
- However, in the above-described related art, there is a possibility that the power system cannot be appropriately stabilized.
- For example, in
Patent Literature 1, based on the fact that the sensitivity coefficient is a generator output with respect to power flow change, if the power flow of the power transmission and substation facilities exceeds the operational limit value, the target output value of the most sensitive generator among generators is calculated in order to resolve the overload in the power system. On the other hand, inPatent Literature 1, the influence of voltage fluctuations and the propagation delay time of measurement information are not taken into account in calculating the sensitivity coefficient, and the case where unstable vibration may occur when the generator output fluctuates is not assumed, which leads to a possibility that the power system cannot be appropriately stabilized. - For example, in
Patent Literature 2, the output from the generator and the sensitivity of the phase in the system are used in calculating the recovery control means, and the output change constraint of the generator is considered, making it possible to perform the recovery control earlier. On the other hand, inPatent Literature 2, similar toPatent Literature 1, the effects of voltage fluctuations are not taken into account in calculating the sensitivity coefficient, and changes in the system impedance due to meteorological changes are not assumed, which leads to a possibility that the power system cannot be appropriately stabilized. - For example, in
Non Patent Literature 1, power flow Jacobian calculation is carried out by the least squares method using time-synchronized voltage and current phasor data. Here, power flow Jacobian calculation has the same role as the power flow sensitivity described inPatent Literature 1 andPatent Literature 2 and can calculate the power flow sensitivity from the movement during the occurrence of a system event, but the effects of voltage fluctuations are not fully taken into account, which leads to a possibility that the power system cannot be appropriately stabilized. - In view of the foregoing, an object of the present invention is to more appropriately support operation for stabilizing a power system.
- As one mode for achieving one object in the present invention for solving the problem, a power system stabilization system that supports stabilization of a power system, includes: a dynamic system sensitivity generation unit that generates dynamic system sensitivity of the power system by using measurement data obtained by a measurement unit installed in the power system and a sensitivity calculation parameter as inputs; a system abnormality resolution procedure generation unit that, using the dynamic system sensitivity, a controllable device list indicating a controllable device in the power system, and a system abnormality resolution procedure generation policy as inputs, generates a system abnormality resolution procedure with which the power system is operated with the controllable device controlled to resolve a system abnormality in the power system; and/or an output unit that outputs the system abnormality resolution procedure.
- According to the present invention, for example, an operation for stabilizing a power system can be more appropriately supported.
-
-
Fig. 1 is a diagram illustrating an example of a configuration of a power system adopting a system stabilization system according to first to fourth embodiments. -
Fig. 2 is a diagram illustrating an example of a power flow in the power system. -
Fig. 3 is a diagram illustrating an example of overload in the power system. -
Fig. 4 is a diagram illustrating an example of a change in impedance of a power line. -
Fig. 5 is a diagram illustrating an example of a configuration including the power system and the system stabilization system according to the first embodiment. -
Fig. 6 is a diagram illustrating an example of a configuration including the system stabilization system according to the first embodiment. -
Fig. 7 is a flowchart illustrating an example of overall processing of the system stabilization system according to the first embodiment. -
Fig. 8 is a flowchart illustrating an example of dynamic system sensitivity calculation processing according to the first embodiment. -
Fig. 9 is a diagram illustrating an example of an input variable and an output variable. -
Fig. 10 is a diagram illustrating an example of a neural network. -
Fig. 11 is a flowchart illustrating an example of a system abnormality resolution procedure generation processing. -
Figs. 12A and12B are diagrams illustrating an example of display of a system abnormality resolution procedure. -
Fig. 13 is a diagram illustrating an example of the effect of the first embodiment. -
Fig. 14 is a diagram illustrating an example of a configuration including the system stabilization system according to the second embodiment. -
Fig. 15 is a flowchart illustrating an example of system stabilization processing according to the second embodiment. -
Fig. 16 is a diagram illustrating an example of a configuration including the system stabilization system according to the third embodiment. -
Fig. 17 is a diagram illustrating an example of a configuration including the system stabilization system according to the fourth embodiment. - Hereinafter, embodiments of the present invention will be described with reference to the drawings. In the following description, the same or similar elements and processes are basically denoted by the same reference numerals. In addition, redundant descriptions of the same functions and processes will be omitted. Note that the configuration and processing described below are merely examples, and embodiments of the present invention are not intended to be limited to the following embodiments. In addition, some or all of the embodiments and modifications can be combined within the scope of the technical idea of the present invention and without contradicting.
- Prior to description of an embodiment of the present invention, an example of a configuration and a power flow of a power system adopting the embodiment is applied, and an example of a phenomenon to be controlled will be described.
-
Fig. 1 is a diagram illustrating an example of a configuration of apower system 12 adopting asystem stabilization system 1 according to first to fourth embodiments. Thepower system 12 according to the first to the fourth embodiments is connected with generators G1 to G3, power lines L1 to L12, bus lines B1 to B17 connecting the power lines or distribution lines with each other, circuit breakers CB1 to CB26, transformers T1 to T7 that transform AC voltage, measurement units M1 to M14 that measures various parameters in the power system, relays R1 to R14 adapted to control facilities in the power system, a wind generator WT1 that generates power from wind, a solar power generator PV1 that generates power from sunlight, a pumped-storage generator WP1 that stores electricity using water, a power storage system BS1 that stores electricity, a reactive power supplier ST1 used for voltage adjustment, a consumer DM1 that consumes power, an electric vehicle EV1 that consumes power, an electric vehicle charging station EVC1 through which the electric vehicle EV1 is connected to the power system, and a DC power line DC1. The types and numbers of elements included in thepower system 12 illustrated inFig. 1 are examples, and are not limited to those in the figure. Thepower system 12 may include a phase regulator. -
Fig. 2 is a diagram illustrating an example of a power flow (flow of power) in thepower system 12. The power generated by the generators G1 to G3 is transmitted to the consumer DM1, the electric vehicle EV1, the pumped-storage generator WP1, and the power storage system BS1, via the transformers T1 to T7, the power lines L1 to L12, the bus lines B1 to B17, the electric vehicle charging station EVC1, and the DC power line DC1. The load of this power flow in the power system is within an appropriate range, whereby stability of the power system is achieved. -
Fig. 3 is a diagram illustrating an example of overload in thepower system 12. In this example, a system failure has occurred in the power line L1 to activate the circuit breakers CB13 to CB14 to disconnect the power line L7, leading to a limited transmission route, resulting in another power line L6 overloaded. When the power line L6 is overloaded for a while, the circuit breakers CB11 to CB12 connected to the power line L6 disconnect the power line L6 for power line protection. As a result, other power lines will be similarly overloaded. In this manner a chain reaction of failure may occur. This is known as a cascade failure. -
Fig. 4 is a diagram illustrating an example of a change in impedance of a power line. As illustrated inFig. 4 , generally, the impedance of a power line rises due to temperature rise caused by overload or weather fluctuation, and becomes higher than the impedance of a system model. To prevent the cascade failure, a controllable device needs to be controlled in accordance with the impedance change due to the temperature rise caused by the overload and the like, to resolve the overload and the like of the power line. - Hereinafter, a first embodiment of the present invention will be described with reference to
Fig. 5 to Fig. 13 . In the first embodiment, as illustrated inFig. 3 , an example of resolution of the overload of the power line L6 (an example of system abnormality) caused by disconnection of the power line L7 will be described. -
Fig. 5 is a diagram illustrating an example of a configuration including thepower system 12 and thesystem stabilization system 1 according to the first embodiment. Thesystem stabilization system 1 is a computer that supports the operation of thepower system 12. Various devices in thepower system 12 illustrated inFig. 1 are connected to thesystem stabilization system 1 via a communication network CN11.Fig. 5 illustrates an example in which the measurement unit M1, the measurement unit M2, the measurement unit M9, the generator G1, and the generator G2 are connected to thesystem stabilization system 1 via the communication network CN11. Other devices not illustrated inFig. 5 are similarly connected to thesystem stabilization system 1 via the communication network CN11. - The
system stabilization system 1 has a communication unit H2 serving as an interface for communications with the communication network CN11, an input unit H3 through which information from a user or another system is input, a Central Processing Unit (CPU) 91 for calculation processing, a memory H1 for holding data during calculation, anoutput unit 6 that outputs calculation results, and various databases. The various databases include a measurement database DB1, a dynamic system sensitivity database DB2, a controllable device list database DB3, a dynamic system sensitivity generation program database DB4, a system abnormality resolution procedure generation program database DB5, a system abnormality resolution procedure database DB6, a sensitivity calculation parameter database DB7, and a system abnormality resolution procedure generation policy database DB8 that are connected to a data bus H4. - The communication unit H2 includes a circuit for connecting to the communication network 11 and a communication protocol. The memory H1 is configured as a Random Access Memory (RAM), and stores a computer program loaded from each program database, calculation result data necessary for each processing, image data, and the like. The memory H1 is a memory for temporarily storing measurement data D1 stored in the measurement database DB1, image data for display on the
output unit 6, calculation temporary data and calculation result data obtained by theCPU 91, and the like. - The
CPU 91 reads and executes a predetermined computer program from each program database. TheCPU 91 may be configured as one or a plurality of semiconductor chips, or may be configured as a computer device such as a calculation server. TheCPU 91 executes each program loaded from each program database onto the memory H1, and executes arithmetic processing on data obtained from various databases. In the arithmetic processing, theCPU 91 uses a physical memory of the memory H1, but may also use a virtual memory. - Furthermore, the
CPU 91 generates necessary image data and outputs it to the output unit 6 (for example, a display screen). Screen data stored in the memory H1 is sent to theoutput unit 6 to be displayed. Theoutput unit 6 is configured as, for example, one or more of a display, a printer device, an audio output device, a mobile terminal, and a wearable. Furthermore, thesystem stabilization system 1 may cooperate with an external system or an external function by using the communication unit H2. - The measurement database DB1 includes the measurement data D1 in
power system 12. Here, the measurement data D1 is measurement data including information such as "voltage", "current", "phase", "frequency", "frequency change rate", "active power", "reactive power", and "generator angular velocity" at each timing obtained from the measurement units M1 to M14 of thepower system 12. The measurement unit 10 is a measurement device or a measurement instrument examples of which including Phasor Measurement Units (PMU), Voltage Transformer (VT), a Potential Transformer (PT), a Current Transformer (CT), and telemeter (TM), provided in the power system. The measurement data D1 obtained from the measurement units M1 to M14 is aggregated and collected by a measurement value collection device, such as Supervisory Control And Data Acquisition (SCADA), provided in thepower system 12. - The dynamic system sensitivity database DB2 stores dynamic system sensitivity D2 generated by executing a dynamic system sensitivity generation program D4 stored in the dynamic system sensitivity generation program database DB4. As will be described in detail later, the dynamic system sensitivity D2 represents a function of an amount change one variable in the measurement data D1 with respect to that of another variable, and is represented by, for example, a matrix, a polynomial, and a neural network.
- The controllable device list database DB3 stores a controllable device list D3. The controllable device list D3 includes a list of devices that can be controlled by the
system stabilization system 1 or devices that can be controlled using the output of thesystem stabilization system 1. Here, examples of controllable devices include the circuit breakers, transformers, generators, chargers, power storage systems, pumped-storage generators, reactive power supplier, relays, and phase regulators illustrated inFig. 1 . - The dynamic system sensitivity generation program database DB4 stores a dynamic system sensitivity generation program D4 for generating the dynamic system sensitivity D2. The system abnormality resolution procedure generation program database DB5 stores a system abnormality resolution procedure generation program D5 for generating a system abnormality resolution procedure D6.
- The system abnormality resolution procedure database DB6 stores the system abnormality resolution procedure D6 generated by executing the system abnormality resolution procedure generation program D5. As will be described later, the system abnormality resolution procedure D6 includes a procedure for resolving an abnormality of the
power system 12 including overload, and thepower system 12 is operated in accordance with the procedure in an aim to resolve the abnormality of thepower system 12. - The sensitivity calculation parameter database DB7 stores a sensitivity calculation parameter D7 for generating the dynamic system sensitivity D2. The sensitivity calculation parameter D7 is for defining "range of types and range on time series of pieces of measurement data used as input and output", "propagation delay time to be taken into consideration between input and output", "method of removing noise from measurement data", "recalculation condition", "format of sensitivity function", and "method of calculating sensitivity function" for generating the dynamic system sensitivity D2.
- The system abnormality resolution procedure generation policy database DB8 stores a system abnormality resolution procedure generation policy D8. The system abnormality resolution procedure generation policy D8 includes policies related to the system abnormality resolution procedure D6, such as target "system abnormality type", "recalculation cycle of system abnormality resolution procedure", "allowable operation amount", "desirable system abnormality resolution time period", and "standby time before the start of abnormality resolution".
- The measurement units M1 to M14 included in the
power system 12 transmit the measurement values obtained at their respective installation locations in thepower system 12, to the communication unit H2 of thesystem stabilization system 1 via the communication network CN11. Thesystem stabilization system 1 temporarily stores the received measurement data in the memory H1, and then stores it as the measurement data D1 in the measurement database DB1. - In the configuration illustrated in
Fig. 5 , the input unit H3 may be configured to include, for example, at least one of a keyboard switch, a pointing device such as a mouse, a touch panel, a tablet, an eye-gaze estimation device using a camera, an electroencephalogram conversion device, and a voice instruction device. The input unit H3 may be a user interface other than those described the above. -
Fig. 6 is a diagram illustrating an example of a configuration including thesystem stabilization system 1 according to the first embodiment.Fig. 5 illustrates thesystem stabilization system 1 in terms of hardware configuration, whereasFig. 6 illustrates thesystem stabilization system 1 in terms of processing function configuration with a part of the configuration omitted. - The
system stabilization system 1 includes the measurement data D1, the controllable device list D3, the sensitivity calculation parameter D7, the system abnormality resolution procedure generation policy D8, a dynamic systemsensitivity generation unit 2, a system abnormality resolutionprocedure generation unit 3, and theoutput unit 6. - As databases related to these types of data, the
system stabilization system 1 includes the measurement database DB1, the dynamic system sensitivity database DB2, the controllable device list database DB3, the system abnormality resolution procedure database DB6, the sensitivity calculation parameter database DB7, and the system abnormality resolution procedure generation policy database DB8. The data in these databases is prepared in advance, generated by an intermediate process, or generated as a final output. - The dynamic system
sensitivity generation unit 2 generates the dynamic system sensitivity D2 by using the measurement data D1 and the sensitivity calculation parameter D7 as inputs. The system abnormality resolutionprocedure generation unit 3 generates the system abnormality resolution procedure D6 by using the controllable device list D3 and the system abnormality resolution procedure generation policy D8 as inputs. Details of the processing of the dynamic systemsensitivity generation unit 2 and the system abnormality resolutionprocedure generation unit 3 will be described later. - Next, an example of a flow of overall processing of the
system stabilization system 1 in the present embodiment will be described with reference toFig. 7. Fig. 7 is a flowchart illustrating an example of overall processing of thesystem stabilization system 1 according to the first embodiment. The overall processing of thesystem stabilization system 1 is periodically executed. - First of all, in step S1, the dynamic system
sensitivity generation unit 2 generates and outputs the dynamic system sensitivity D2 by using the measurement data D1 and the sensitivity calculation parameter D7 as inputs. Then, in step S2, the system abnormality resolutionprocedure generation unit 3 generates and outputs the system abnormality resolution procedure D6 by using the dynamic system sensitivity D2 generated by the dynamic systemsensitivity generation unit 2, controllable device list D3, and the system abnormality resolution procedure generation policy D8 as inputs. Subsequently, in step S3, theoutput unit 6 outputs the system abnormality resolution procedure D6 generated by the system abnormality resolutionprocedure generation unit 3, and the like. - Next, a detailed flow of step S1 in
Fig. 7 will be described with reference toFig. 8. Fig. 8 is a flowchart illustrating an example of dynamic system sensitivity calculation processing according to the first embodiment. First of all, in step S101, the dynamic systemsensitivity generation unit 2 reads the measurement data D1 and the sensitivity calculation parameter D7. - Next, in step S102, the dynamic system
sensitivity generation unit 2 determines whether the "recalculation condition" designated by the sensitivity calculation parameter D7 is satisfied. The dynamic systemsensitivity generation unit 2 proceeds to step S103 when the recalculation condition is satisfied (step S102 Yes), and proceeds to step S107 when the recalculation condition is not satisfied (step S102 No). - Here, in step S102, whether the recalculation of the dynamic system sensitivity D2 is required is determined, for example, based on "recalculation condition" such as whether a predetermined time period has elapsed after the previous calculation of the dynamic system sensitivity D2. This is because, elapse of a predetermined time period after the previous calculation might lead to a change in temperature of power lines and devices, resulting in a change in impedance as illustrated in
Fig. 4 . Alternatively, whether the recalculation of the dynamic system sensitivity D2 is required may be determined based on "recalculation condition" such as whether the measurement data D1 has changed significantly. The elapse of a predetermined period of time after the previous calculation or the significant change in the measurement data D1 might lead to a significant change in the state of thepower system 12, resulting in the previously calculated dynamic system sensitivity D2 being already invalid or starting to have an error. The same applies to a case where a result of checking the sensitivity function indicates an error exceeding a predetermined error. - Therefore, with "recalculation condition" designated in advance by the sensitivity calculation parameter D7, these factors can be taken into consideration. Thus, a disadvantageous situation where an external system using the
system stabilization system 1 or the dynamic system sensitivity D2 executes processing based on inappropriate dynamic system sensitivity D2 can be avoided. Furthermore, with the sensitivity calculation parameter D7 periodically updated and input, a situation where the sensitivity calculation parameter D7 is required at a shorter cycle due to an increase in renewable energy sources can also be handled for example. - In step S103, the dynamic system
sensitivity generation unit 2 selects, as an input variable x and an output variable y, one or more of the voltage, current, phase, frequency, frequency change rate, active power, reactive power, and generator angular velocity, from the measurement data D1, based on the target time point and the type of the measurement data D1, based on the sensitivity calculation parameter D7. - It is more preferable that the input variable x at least includes voltage. In such a case, the
power system 12 can be more appropriately stabilized even without the system model sensitivity, with an influence of voltage fluctuation taken into consideration by using the dynamic system sensitivity. - Now, step S103 will be described in detail. The ultimate goal of the dynamic system
sensitivity generation unit 2 is to calculate a sensitivity function f represented by the following Formula (1).
[Formula 1]
- In the formula, Δy represents the amount of change in the output variable, and Δx represents the amount of change in the input variable. When the sensitivity function f is calculated based on the measurement data D1, the measurement data D1 used for calculating the sensitivity function f needs to be designated. How the input variable and the output variable are designated will be described with reference to
Fig. 9 . - For example, as shown in
Fig. 9 , measurement data of the voltage and active power has been obtained by the measurement units M1 and M2 in thepower system 12 inFig. 3 , and measurement data of the active power has been obtained by the measurement unit M9. Under this condition, in the sensitivity calculation parameter D7, a range on time series and of measurement types of the measurement data to be input, and a range on time series and of measurement types of the measurement data to be output are designated. Note that the time series for the input and the time series for the output need not to match. In the example ofFig. 9 , the input variable x is assumed to be the active power obtained by the measurement unit M1, the voltage and the active power obtained by the measurement unit M2, and the output variable y is assumed to be the active power obtained by the measurement unit M9. Thus, the range of the measurement type of the input variable x includes the active power obtained by the measurement unit M1 and the voltage and the active power obtained by the measurement unit M2. The time series range is a time range indicated by an enclosed broken line BL1 illustrated inFig. 9 . The range of the measurement type of the output variable y includes the active power obtained by the measurement unit M9. The time series range is a time range indicated by an enclosed broken line BL2 illustrated inFig. 9 . - The description is given by referring back to
Fig. 8 . Next, in step S104, based on the sensitivity calculation parameter D7, the dynamic systemsensitivity generation unit 2 calculates an amount of change in each input variable x and each output variable y with propagation delay and noise removed. - Now, step S104 will be described in detail. In step S104, because the input variable x calculated in step S103 may have calculation error and noise, the dynamic system
sensitivity generation unit 2 first removes the noise by using the functions of the following Formulae (2) and (3).
[Formula 2]

- In the above Formulae (2) and (3), as a function n (·) used for noise removal, a function such as a band-pass filter for removing or suppressing noise at a specific frequency is used. Next, the dynamic system
sensitivity generation unit 2 calculates an amount Δx of change in the input variable x and an amount Δy of change in the output variable y by using a propagation delay time di and a change value calculation interval T designated by the sensitivity calculation parameter D7.
[Formula 4]

- In the formulae, xi∼ represents the ith input variable in 1 filtered input variables, and yj∼ represents the jth output variable in m filtered output variables. Furthermore, the value of the propagation delay time di is prepared to be different among the input variables xi∼. Alternatively, the value may be the same among the input variables xi∼. When using measurement data over a wide range, a shorter propagation delay time may be provided for an input variable x corresponding to a measurement unit existing in a predetermined vicinity range from the measurement unit corresponding to the output variable y, and a longer propagation delay time may be provided to the input variable x corresponding to the measurement unit outside the predetermined vicinity range.
- Next, in step S105, based on the sensitivity calculation parameter D7, the dynamic system
sensitivity generation unit 2 calculates the dynamic system sensitivity by calculating a pseudo-inverse matrix, learning a neural network, or performing a polynomial approximation using error minimization. - Now, step S105 will be described in detail. In step S105, the format of the sensitivity function of the above Formula (1) is designated, and the dynamic system sensitivity is calculated according to the designated format.
- For example, it is assumed that the format of the sensitivity function is designated as in the following Formula (6). In the case of the following Formula (6), for example, the dynamic system sensitivity can be calculated using a pseudo inverse matrix.
[Formula 6]
- As another example, the sensitivity function may be represented by a norm polynomial of Δx as in the following Formula (7).
[Formula 7]
- In this case, linear regression analysis cannot be used, and thus the dynamic system sensitivity is calculated by solving the error minimization problem as in the following Formula (8).
[Formula 8]
- When the neural network is designated as the format in the sensitivity calculation parameter D7, a Long Short Term Memory (LSTM) -based neural network as illustrated in
Fig. 10 is learned, and the learned neural network itself may be used as the dynamic system sensitivity D2. - The description is given by referring back to
Fig. 8 . Next, in step S106, the dynamic systemsensitivity generation unit 2 outputs the dynamic system sensitivity calculated in step S105. When step S106 ends, the dynamic systemsensitivity generation unit 2 proceeds to step S2 inFig. 7 and to step S107. In step S107, the dynamic systemsensitivity generation unit 2 stands by for a predetermined period of time and then proceeds to step S101 at the next recalculation timing. - Next, a detailed flow of step S2 in
Fig. 7 will be described with reference toFig. 11. Fig. 11 is a flowchart illustrating an example of a system abnormality resolution procedure generation processing. First, in step S201, the system abnormality resolutionprocedure generation unit 3 reads the dynamic system sensitivity D2, the controllable device list D3, and the system abnormality resolution procedure generation policy D8. - Next, in step S202, the system abnormality resolution
procedure generation unit 3 checks whether there is "system abnormality". The system abnormality resolutionprocedure generation unit 3 proceeds to step S203 when there is a system abnormality (step S202 YES), and proceeds to step S207 when there is no system abnormality (step S202 NO). - Now, step S202 will be described in detail. The "system abnormality" in step S202 is, for example, occurrence of overload, voltage exceeding or falling below the upper or lower limit, deterioration of the voltage stability, deterioration of the frequency stability, frequency exceeding or falling below the upper or lower limit, deterioration of the synchronization stability, and the like at one or more installation locations of the measurement unit(s) in the
power system 12. Methods usable as a method for checking a system abnormality include a method of setting a threshold value for measurement data measured by a measurement unit, extracting a feature through signal processing, determining from a statistical value, and the like. - The description is given by referring back to
Fig. 11 . Next, in step S203, based on the system abnormality resolution procedure generation policy D8, the system abnormality resolutionprocedure generation unit 3 generates a satisfaction problem with dynamic system sensitivity being objective function or an optimization problem with dynamic system sensitivity being constraint expression. - Now, step S203 will be described in detail. The system abnormality resolution procedure generation policy D8 includes an allowable operation amount for resolving a system abnormality, a desirable system abnormality resolution time period, and the like. The system abnormality resolution
procedure generation unit 3 formulates an optimization problem in Formula (9) with Formula (10) being the constraint expression by using the allowable operation amount and the desirable system abnormality resolution time period.
[Formula 9]

- Here, cost (f(Δx)) in the above Formula (9) represents the cost required for the operation procedure, which means, for example, the time required for resolving the overload. The above Formula (10) indicates that when the input variable Δx is changed from the current state ynow based on the sensitivity function f, the output variable y falls within the normal range.
- If the system abnormality resolution procedure generation policy D8 requires no optimality, the objective function itself of the above Formula (9) may be used as the constraint, and the Formula (10) may be replaced with the following Formula (11). Thus, a satisfaction problem corresponding to Formula (9) with the following Formula (11) being the constraint expression may be formulated.
[Formula 11]
- A case is described as an example where an optimization problem is formulated for resolving the overload of the power line by using the dynamic system sensitivity calculated from the voltage V and the active power P as the input variable x and the active power P as the output variable y as shown in
Fig. 9 . In the case ofFig. 9 , the optimization problem corresponding to Formula (12) using the following Formula (13) as a constraint expression is formulated.
[Formula 12]

- An optimization problem or a satisfactory solution problem may be formulated not only with a constraint for resolution of the system abnormality which is the main object, but also with another constraint for preventing further system abnormality from occurring.
- The description will be given while referring back to
Fig. 11 . Next, in step S204, the system abnormality resolutionprocedure generation unit 3 generates a system abnormality resolution procedure by solving the problem formulated in step S203. Next, in step S205, the system abnormality resolutionprocedure generation unit 3 estimates the cost of the system abnormality resolution procedure generated in step S204 (time required for system abnormality resolution). Next, in step S206, the system abnormality resolutionprocedure generation unit 3 outputs the system abnormality resolution procedure and the like generated in step S204 to theoutput unit 6. When step S206 ends, the system abnormality resolutionprocedure generation unit 3 proceeds to step S3 inFig. 7 and proceeds to step S207. In step S207, the processing proceeds to step S201 at the next recalculation timing, after a predetermined standby period. - Next, a display example displayed on the
output unit 6 in step S3 ofFig. 7 will be described with reference toFigs. 12A and12B .Figs. 12A and12B are diagrams illustrating an example ofdisplay 6a of the system abnormality resolution procedure. The powersystem stabilization system 1, which is assumed to be installed at a command center related to the operation of thepower system 12, displays thedisplay 6a as illustrated inFigs. 12A and12B to a power system operator (user). - The
display 6a inFigs. 12A and12B is for displaying, to the power system operator, a power system model 6a1, an input variable 6a2, a sensitivity calculation parameter 6a3, a controllable device list 6a4, dynamic system sensitivity 6a5, a system abnormality resolution procedure 6a6, a system abnormality resolution cost 6a7, automatic control 6a8, and the like. - The power system model 6a1 indicates the current state of the
power system 12 in which the power line L6 is overloaded as in the example illustrated inFig. 3 . The input variable 6a2 indicates the type of data to be the input variable, among pieces of measurement data measured by the measurement units installed within a predetermined vicinity area of the controllable device selected from the controllable device list D3 for the calculation of the dynamic system sensitivity D2. The input variable 6a2 includes the active power measured by the measurement unit M1 installed in the vicinity of the generator G1 and the voltage and the active power measured by the measurement unit M2 installed in the vicinity of the generator G2, as in the example illustrated inFig. 9 . - The sensitivity calculation parameter 6a3 indicates, for example, "3 seconds" as the value of the "recalculation condition" in the sensitivity calculation parameter D7. The controllable device list 6a4 indicates the generators G1 and G2 selected as controllable devices from the controllable device list D3 for the calculation of the dynamic system sensitivity D2.
- The dynamic system sensitivity 6a5 indicates the dynamic system sensitivity D2 generated by the dynamic system
sensitivity generation unit 2 based on the input variable as indicated by the input variables 6a2 and the output variable. InFig. 12B , the dynamic system sensitivity 6a5 indicates the amount of change in the active power of the power line L6 with respect to an output operation amount of the generator G1, and the amount of change in the power of the power line L6 with respect to an output operation amount of the generator G2. For example, L6/G1:0.8 MW/MW indicates that a change in the power generation amount of the generator G1 by 1 MW results in the active power of the power line L6 changed by 0.8 MW. The same applies to L6/G1:0.8 MW/MW for generator G2. - The system abnormality resolution procedure 6a6 is a system abnormality resolution procedure generated by the system abnormality resolution
procedure generation unit 3. InFig. 12B , the system abnormality resolution procedure 6a6 indicates a system abnormality resolution procedure including incrementing the output of the generator G1 by +10 MW and decrementing the output of the generator G2 by - 10 MW. - The system abnormality resolution cost 6a7 indicates a time period between the start of the procedure indicated by the system abnormality resolution procedure 6a6 and the resolution of the system abnormality, and is "five minutes" in the example illustrated in
Fig. 12B . The automatic control 6a8 indicates whether a function of automatically executing the system abnormality resolution procedure 6a6, described later in a third embodiment, is active or not. - The power system operator can refer to the
display 6a when drafting countermeasures for a system abnormality. - Next, the effects of the present embodiment will be described with reference to
Fig. 13. Fig. 13 is a diagram illustrating an example of the effect of the first embodiment. The graph inFig. 13 illustrates a comparative image for overload resolution, with the horizontal axis representing time, the vertical axis representing the power flow in the overloaded power line, the dashed line representing a change in power flow in a case where the system model sensitivity based on the system impedance (system model base) is used, and a solid line representing a change in the power flow current in a case where the dynamic system sensitivity is used. - When the system model sensitivity is used, it takes time to complete the countermeasure. On the other hand, when the dynamic system sensitivity is used, the countermeasure can be reviewed ("
RECALCULATION 1" and "RECALCULATION 2" inFigs. 12A and12B (corresponding to the execution cycle of the dynamic system sensitivity calculation processing inFig. 8 )) in accordance with a trend of the measurement data D1 based on the setting of the sensitivity calculation parameter D7. Therefore, a countermeasure can be taken more swiftly, so that the power system can be mode effectively stabilized. - The present embodiment can provide the
system stabilization system 1 that can provide appropriate operation support to systems, devices, people, and the like related to the operation of the power system for the sake of stabilization of the power system. Furthermore, with the present embodiment, no power system impedance information is required, and the system abnormality can be resolved based on the measurement value measured by the measurement units. Thus, the power system can be stabilized even in a system with incomplete impedance information. A method of linking with a system model including an impedance map will be described later as a second embodiment. - In this embodiment, overload is the target, but as described above, other events in the power system can be addressed.
- The second embodiment of the present invention will be described with reference to
Figs. 14 and15 . In the second embodiment, a case where an existing dynamic system model sensitivity is combined with the dynamic system sensitivity according to the first embodiment will be described. -
Fig. 14 is a diagram illustrating an example of a configuration including thesystem stabilization system 1B according to the second embodiment. Thesystem stabilization system 1B is different from thesystem stabilization system 1 according to the first embodiment, in that a system model database DB9 is further provided, that a dynamic systemsensitivity generation unit 2B is provided instead of the dynamic systemsensitivity generation unit 2, and that a sensitivity calculation parameter database DB7B is provided instead of the sensitivity calculation parameter database DB7. - The system model database DB9 stores a system model D9 including one or more pieces of impedance information between branches and connection information between nodes in a target power system. The system model D9 is input to the dynamic system
sensitivity generation unit 2B. The sensitivity calculation parameter D7B stored in the sensitivity calculation parameter database DB7B includes a policy of partially utilizing the system model. - Next, dynamic system sensitivity calculation processing according to the second embodiment will be described with reference to
Fig. 15. Fig. 15 is a flowchart illustrating an example of dynamic system sensitivity calculation processing according to the second embodiment. In the second embodiment, dynamic system sensitivity calculation processing illustrated inFig. 15 is executed instead of the dynamic system sensitivity calculation processing according to the first embodiment illustrated inFig. 8 . - First of all, in step S101B, the dynamic system
sensitivity generation unit 2B reads the measurement data D1, the sensitivity calculation parameter D7B, and the system model D9. Next, in step S102B, the dynamic systemsensitivity generation unit 2B determines whether the "recalculation condition" designated by the sensitivity calculation parameter D7B is satisfied. The dynamic systemsensitivity generation unit 2B proceeds to step S103B when the recalculation condition is satisfied (step S102B Yes), and proceeds to step S115B when the recalculation condition is not satisfied (step S102B No). - In step S103B, the dynamic system
sensitivity generation unit 2B determines whether the partial utilization of the system model D9, read in step S101B, is designated by the sensitivity calculation parameter D7B. The dynamic systemsensitivity generation unit 2B proceeds to step S104B when the system model D9 is partially used (step S103B YES), and proceeds to step S109B when the system model D9 is not partially used (step S103B NO). - In steps S104B to S106B, the dynamic system
sensitivity generation unit 2B executes processing that is the same processing as that in steps S103 to S105 inFig. 8 on a part of the system as a target of the dynamic system sensitivity is calculation. - In step S107B following step S106B, the dynamic system
sensitivity generation unit 2B combines the system model sensitivity with the dynamic system sensitivity calculated in step S107B to generate the system sensitivity as the dynamic system sensitivity D2 of the target power system. - Now, step S107B will be described in detail. When the impedance in the power system is known, the sensitivity of the system model D9 (system model sensitivity) can be obtained from an inverse impedance matrix based on a DC method. As a result, system model sensitivity A as represented by the following Formula (14) is obtained.
[Formula 14]
- When the dynamic system sensitivity as calculated in the first embodiment is used for a j-th partial system, the term of the system model sensitivity of the j-th partial system in the above Formula (14) is replaced with the dynamic system sensitivity function f, whereby the following Formula (15) is obtained.
[Formula 15]
- The description will be given by referring back to
Fig. 15 . Next, in step S108B, the dynamic systemsensitivity generation unit 2B outputs the dynamic system sensitivity D2 generated in step S107B. - In steps S109B to S111B, the dynamic system
sensitivity generation unit 2B performs processing that is the same as that in steps S103 to S105 inFig. 8 , respectively. - Next, in step S112B, based on the error between the dynamic system sensitivity calculated in step S111B and the system model sensitivity of the system model D9, the dynamic system
sensitivity generation unit 2B determines whether the dynamic system sensitivity calculated in step S111B is within an effective range. - Specifically, in step S112B, the dynamic system
sensitivity generation unit 2B calculates the absolute value of the difference between the system model sensitivity calculated with the above Formula (14) and the dynamic system sensitivity calculated in step S111B with an error range ε included in the sensitivity calculation parameter D7B. Then, when the following Formula (16) holds true, the dynamic systemsensitivity generation unit 2B determines that the dynamic system sensitivity calculated in step S111B is within the effective range (step S112B YES), and proceeds to step S113B. On the other hand, when the following Formula (16) does not holds true, the dynamic systemsensitivity generation unit 2B determines that the dynamic system sensitivity calculated in step S111B is outside the effective range (step S112B NO), and proceeds to step S114B.
[Formula 16]
- In step S113B, the dynamic system
sensitivity generation unit 2B outputs the dynamic system sensitivity D2 calculated in step S111B. In step S114B, the dynamic systemsensitivity generation unit 2B outputs the system model sensitivity calculated based on the system model D9 read in step S101B instead of the dynamic system sensitivity D2. When step S108B, 113B, or 114B ends, the dynamic systemsensitivity generation unit 2B proceeds to step S2 inFig. 7 and to step S115B. The processing in step S115B is the same as that in step S107 inFig. 8 . - According to the present embodiment, the dynamic system sensitivity is combined with the system model sensitivity, so that occurrence of an abnormality in the dynamic system sensitivity due to an abnormality in the measurement data and the like can be prevented, whereby the reliability of the
system stabilization system 1B can further be improved. - In the third embodiment, a
system stabilization system 1C obtained by adding an automatic control function for thepower system 12 is added to thesystem stabilization system 1 of the first embodiment or thesystem stabilization system 1B of the second embodiment will be described.Fig. 16 is a diagram illustrating an example of a configuration including thesystem stabilization system 1C according to the third embodiment. -
Fig. 16 illustrates a functional block diagram in which a control unit 4 is added to thesystem stabilization system 1 according to the first embodiment. The control unit 4 transmits a control signal to control target devices in various parts of thepower system 12 via the communication network CN11 based on the system abnormality resolution procedure D6 calculated by the system abnormality resolutionprocedure generation unit 3. The control unit 4 may receive a command to activate automatic control input by a user. - According to the present embodiment, the
system stabilization system 1C can more quickly and accurately stabilize thepower system 12 by directly controlling thepower system 12, in response to a system abnormality. Furthermore, the DC power line DC1, the power storage system BS1, the pumped-storage generator WP1, the solar power generation facility PV1, the wind generator WT1, the electric vehicle charging station EVC1, and the like, as shown inFig. 1 , that are difficult to directly control by the decision of the user can be controlled. - In the fourth embodiment, a method for determining an installation location of a measurement unit for efficiently acquiring system status data in a system stabilization system will be described.
Fig. 17 is a diagram illustrating an example of a configuration including thesystem stabilization system 1D according to the fourth embodiment. Thesystem stabilization system 1D has a configuration in which the measurement unit installationlocation determination unit 5 is added to thesystem stabilization systems 1 to 1C of the first to third embodiments. InFig. 17 , configurations other than a measurement unit installationlocation determination unit 5 is omitted. - As described below, the measuring unit installation
location determination unit 5 is a non-von Neumann computer that outputs an installation location of a measurement unit by using the connection configuration, the number of redundant measurements, and the positions of the existing measurement units of the system as inputs. - In order to monitor the state of the
power system 12, generally, by a measurement unit is installed on the bus line, so that the power flow of the power line and the voltage of the bus can be measured. The PMU described in the first embodiment can be installed on a single bus line to be capable of measuring the power flow of all the power lines and distribution lines connected to the bus line on which the PMU is installed. - In power system operation, ideally, the measurement units are installed on all the bus lines. However, the measuring units that can be installed may be limited due to various restrictions.
- Therefore, in the present embodiment, the optimum installation locations of the measurement units are determined as follows. Specifically, the user of the
system stabilization system 1D inputs the connection configuration of thepower system 12, the number of redundant measurements, and the positions of the existing measurement units. Then, a single objective function corresponding to conditions that the required number of measurement units is minimum, the measurement units can monitor all bus lines, and that the required number of measurement units are able to be secured with the value of the variable only capable of being 0 or 1 is obtained and converted into an Ising model with which the value of the variable can be represented by -1 or 1, and calculation is performed by the non-von Neumann computer. - Therefore, basically, the installation location of the measurement unit needs to be determined based on the objective function represented by the following Formula (17) .
[Formula 17]
- In the formula, di represents the cost required for installing a measurement unit on the i-th bus line, and qi represents whether to install the measuring unit on the i-th bus line. Furthermore, N represents the number of bus lines in the system. It should be noted that qi = {0, 1} holds, qi = 1 holds when the measurement unit is installed on the i-th bus line, and qi = 0 holds when the measuring unit is not installed.
- In addition, in order to determine a required measurement unit, the measuring unit needs to be installed on one or more of the bus lines connected via the power line. A matrix C as in the following Expression (18), which represents a connection state between the bus lines, is introduced.
[Formula 18]
- For example, C1,2 = 1 indicates that a
bus line 1 and abus line 2 are connected, and C1,2 = 0 indicates that thebus line 1 andbus line 2 are not connected. In order to monitor each bus line, at least one of the bus lines connected to the connected bus line i needs to be selected. Thus, a constraint as in the following Formula (19) is required.
[Formula 19]
- The constraint as in the above Formula (19) indicates that the total value of the installed measurement units capable of monitoring the bus line i is 1 or more. Using the same principle, for example, when the number of units is desired to be Vi or more in preparation for an emergency device failure, the following Formula (20) is used.
[Formula 20]
- Here, it is assumed that 1 ≤ Vi ≤ N|Vi ∈ the set of all natural numbers. If there is already one or more measurement units in the same group, Vi may be appropriately reduced.
- The following Formula (21) represents the Quadratic Unconstrained Binary Optimization (QUBO) formulation of such a constraint.
[Formula 21]
- Through combination with the objective function assuming that yi = {0,1} holds, the objective function expressed by the following Formula (22) is formulated.
[Formula 22]
- The objective function as in the above Formula (22) is an NP-hard problem, and thus is difficult to calculate directly. Thus, the function is input to a non-von Neumann computer that minimizes the energy of the Ising model, to obtain a solution.
- The Ising model minimizes the energy represented by the following Formula (23). It is assumed that σi = {-1,1}. The objective function is converted to an Ising model using qi = (σi + 1)/2 to determine qi and calculate the required position of the measurement unit.
[Formula 23]
- The present invention is not limited to the embodiments described above, but includes various modifications. Furthermore, for example, the above-described embodiment is described in detail in order to explain the present invention in an easily understandable manner, and the present invention is not necessarily limited to a system having all the described configurations. As long as there is no contradiction, a part of the configuration of one embodiment can be replaced with the configuration of another embodiment, and a configuration of one embodiment can be added to the configuration of another embodiment. Furthermore, for a part of the configuration of each embodiment, a configuration can be added, deleted, replaced, integrated, or distributed. The configurations and processing described in the embodiments can be appropriately distributed or integrated based on processing efficiency or mounting efficiency.
-
- 1, 1B, 1C, 1D System stabilization system
- 2, 2B Dynamic system sensitivity generation unit
- 3 System abnormality resolution procedure generation unit
- 4 Control unit
- 5 Measurement unit installation location determination unit
- 12 Power system
Claims (15)
- A power system stabilization system that supports stabilization of a power system (12), the power system stabilization system comprising:a dynamic system sensitivity generation unit (2) that generates dynamic system sensitivity of the power system (12) by using measurement data obtained by a measurement unit installed in the power system (12) and a sensitivity calculation parameter as inputs;a system abnormality resolution procedure generation unit (3) that, using the dynamic system sensitivity, a controllable device list indicating a controllable device in the power system (12), and a system abnormality resolution procedure generation policy as inputs, generates a system abnormality resolution procedure with which the power system is operated with the controllable device controlled to resolve a system abnormality in the power system (12); andan output unit (6) that outputs the system abnormality resolution procedure.
- The power system stabilization system according to claim 1, wherein the dynamic system sensitivity is a sensitivity function that, assuming that measurement data obtained by one measurement unit in the power system (12) is an input variable and measurement data obtained by another measurement unit is an output variable, indicates an amount of change in the output variable relative to an amount of change in the input variable.
- The power system stabilization system according to claim 2, wherein a format of the sensitivity function is any of a matrix, a polynomial, and a neural network.
- The power system stabilization system according to claim 1, wherein the controllable device includes one or more of a breaker, a transformer, a generator, a charger, a power storage system, a pumped-storage generator, a reactive power supplier, a phase regulator, and a relay.
- The power system stabilization system according to claim 2, wherein the sensitivity calculation parameter includes a range of types and range on time series of pieces of the measurement data as the input and the output for generating the dynamic system sensitivity, a propagation delay time to be taken into consideration between the input and the output, a method of removing noise from the measurement data, a recalculation condition of the dynamic system sensitivity, a format of the sensitivity function, and a method of calculating the sensitivity function.
- The power system stabilization system according to claim 5, wherein the dynamic system sensitivity generation unit (2) calculates, when the recalculation condition designated by the sensitivity calculation parameter is satisfied, the dynamic system sensitivity from an amount of change in an output variable relative to an input variable, the input variable and the output variable being selected as one or more of voltage, current, phase, frequency, frequency change rate, active power, reactive power, and generator angular velocity from the measurement data, based on a range of types and a range on a time series of pieces of the measurement data designated to be the input and the output by the sensitivity calculation parameter.
- The power system stabilization system according to claim 6, wherein the input variable at least includes the voltage.
- The power system stabilization system according to claim 7, wherein when calculating the amount of change, the dynamic system sensitivity generation unit (2) designates a range of types and a range on a time series of pieces of the measurement data used as the input and the output based on the sensitivity calculation parameter to select the input variable and the output variable, and removes propagation delay and noise from the pieces of measurement data as the input variable and the output variable.
- The power system stabilization system according to claim 1, wherein the system abnormality resolution procedure generation policy includes at least one of a type of the system abnormality, a recalculation cycle of the system abnormality resolution procedure, a time required for resolving the system abnormality, and a standby time until the system abnormality starts to be resolved.
- The power system stabilization system according to claim 9, wherein based on the system abnormality resolution procedure generation policy, the system abnormality resolution procedure generation unit (3) checks whether there is the system abnormality, and when there is the system abnormality, generates a satisfaction problem with the dynamic system sensitivity being an objective function or an optimization problem with the dynamic system sensitivity being a constraint expression, generates the system abnormality resolution procedure from a solution of the satisfaction problem or the optimization problem, and calculates a cost of the system abnormality resolution procedure.
- The power system stabilization system according to claim 1, wherein
the dynamic system sensitivity generation unit (2)
generates dynamic system sensitivity of a partial system of the power system, and
outputs system sensitivity as a result of replacing a part of system model sensitivity generated from a system model of the power system corresponding to the partial system with the dynamic system sensitivity of the partial system. - The power system stabilization system according to claim 1, wherein
the dynamic system sensitivity generation unit (2)
determines whether the dynamic system sensitivity is within an effective range based on an error of the dynamic system sensitivity with respect to system model sensitivity generated from a system model of the power system (12), and
outputs the dynamic system sensitivity when the dynamic system sensitivity is within the effective range and outputs the system model sensitivity when the dynamic system sensitivity is outside the effective range. - The power system stabilization system according to claim 1 further comprising a control unit (4) that controls the controllable device based on the system abnormality resolution procedure.
- The power system stabilization system according to claim 1, wherein an installation location of the measurement unit in the power system (12) is determined by: obtaining an objective function corresponding to conditions that the required number of measurement units is minimum, the measurement units can monitor all bus lines, and that the required number of measurement units are able to be secured with a variable only capable of being 0 or 1 by using a connection configuration of the power system (12), the number of redundant measurements of the measurement unit, and locations of existing measurement units as inputs; converting the objective function into an Ising model with which a value of the variable of the objective function is represented by any of -1 and 1; and calculating the Ising model with a non-von Neumann computer.
- A power system stabilization method executed by a power system stabilization system that supports stabilization of a power system (12), the method comprising:generating dynamic system sensitivity of the power system (12) by using measurement data obtained by a measurement unit installed in the power system (12) and a sensitivity calculation parameter as inputs;generating, using the dynamic system sensitivity, a controllable device list indicating a controllable device in the power system (12), and a system abnormality resolution procedure generation policy as inputs, a system abnormality resolution procedure with which the power system (12) is operated with the controllable device controlled to resolve a system abnormality in the power system (12); andoutputting the system abnormality resolution procedure.
Applications Claiming Priority (1)
| Application Number | Priority Date | Filing Date | Title |
|---|---|---|---|
| JP2019137862A JP7174677B2 (en) | 2019-07-26 | 2019-07-26 | Power system stabilization system and power system stabilization method |
Publications (2)
| Publication Number | Publication Date |
|---|---|
| EP3771061A1 true EP3771061A1 (en) | 2021-01-27 |
| EP3771061B1 EP3771061B1 (en) | 2023-08-23 |
Family
ID=70681660
Family Applications (1)
| Application Number | Title | Priority Date | Filing Date |
|---|---|---|---|
| EP20173898.6A Active EP3771061B1 (en) | 2019-07-26 | 2020-05-11 | Power system stabilization system and power system stabilization method using calculated power system sensitivity |
Country Status (3)
| Country | Link |
|---|---|
| EP (1) | EP3771061B1 (en) |
| JP (1) | JP7174677B2 (en) |
| ES (1) | ES2955405T3 (en) |
Cited By (3)
| Publication number | Priority date | Publication date | Assignee | Title |
|---|---|---|---|---|
| CN117134502A (en) * | 2023-10-23 | 2023-11-28 | 国网四川雅安电力(集团)股份有限公司荥经县供电分公司 | Electric power data monitoring method and monitoring system |
| CN117540220A (en) * | 2024-01-09 | 2024-02-09 | 巨洋神州科技集团有限公司 | Near-zero carbon park source network load matching method and system |
| CN119315562A (en) * | 2024-10-08 | 2025-01-14 | 连云港智源电力设计有限公司 | A voltage control method for active distribution network based on power flow prediction |
Families Citing this family (1)
| Publication number | Priority date | Publication date | Assignee | Title |
|---|---|---|---|---|
| JP7716357B2 (en) * | 2022-03-09 | 2025-07-31 | 株式会社日立製作所 | Grid violation resolution control calculation system, grid violation resolution system, fault calculation system, grid stabilization system, preventive control system, and grid violation resolution control calculation method |
Citations (4)
| Publication number | Priority date | Publication date | Assignee | Title |
|---|---|---|---|---|
| JP2006101619A (en) * | 2004-09-29 | 2006-04-13 | Hitachi Ltd | Power system stability diagnosis device, power system stabilization device, and power system contraction support device |
| JP2010063320A (en) | 2008-09-05 | 2010-03-18 | Toshiba Corp | Method and apparatus for controlling supply and demand for power system |
| WO2017182918A1 (en) * | 2016-04-22 | 2017-10-26 | Depsys Sa | Method of determining mutual voltage sensitivity coefficients between a plurality of measuring nodes of an electric power network |
| JP2019017194A (en) | 2017-07-07 | 2019-01-31 | 株式会社日立製作所 | System operation support device and method in electric power system, and wide area monitoring protection control system |
-
2019
- 2019-07-26 JP JP2019137862A patent/JP7174677B2/en active Active
-
2020
- 2020-05-11 ES ES20173898T patent/ES2955405T3/en active Active
- 2020-05-11 EP EP20173898.6A patent/EP3771061B1/en active Active
Patent Citations (4)
| Publication number | Priority date | Publication date | Assignee | Title |
|---|---|---|---|---|
| JP2006101619A (en) * | 2004-09-29 | 2006-04-13 | Hitachi Ltd | Power system stability diagnosis device, power system stabilization device, and power system contraction support device |
| JP2010063320A (en) | 2008-09-05 | 2010-03-18 | Toshiba Corp | Method and apparatus for controlling supply and demand for power system |
| WO2017182918A1 (en) * | 2016-04-22 | 2017-10-26 | Depsys Sa | Method of determining mutual voltage sensitivity coefficients between a plurality of measuring nodes of an electric power network |
| JP2019017194A (en) | 2017-07-07 | 2019-01-31 | 株式会社日立製作所 | System operation support device and method in electric power system, and wide area monitoring protection control system |
Non-Patent Citations (1)
| Title |
|---|
| YU CHRISTINE CHENJIANHUI WANGALEJANDRO D. DOMINGUEZ-GARCIAPETER W. SAUER: "Measurement-Based Estimation of the Power Flow Jacobian Matrix", IEEE TRANSACTIONSON SMART GRID, vol. 7, no. 5, September 2016 (2016-09-01), pages 2507 - 2515, XP011620719, DOI: 10.1109/TSG.2015.2502484 |
Cited By (5)
| Publication number | Priority date | Publication date | Assignee | Title |
|---|---|---|---|---|
| CN117134502A (en) * | 2023-10-23 | 2023-11-28 | 国网四川雅安电力(集团)股份有限公司荥经县供电分公司 | Electric power data monitoring method and monitoring system |
| CN117134502B (en) * | 2023-10-23 | 2023-12-22 | 国网四川雅安电力(集团)股份有限公司荥经县供电分公司 | Power data monitoring method and monitoring system |
| CN117540220A (en) * | 2024-01-09 | 2024-02-09 | 巨洋神州科技集团有限公司 | Near-zero carbon park source network load matching method and system |
| CN117540220B (en) * | 2024-01-09 | 2024-04-05 | 巨洋神州科技集团有限公司 | Near-zero carbon park source network load matching method and system |
| CN119315562A (en) * | 2024-10-08 | 2025-01-14 | 连云港智源电力设计有限公司 | A voltage control method for active distribution network based on power flow prediction |
Also Published As
| Publication number | Publication date |
|---|---|
| JP7174677B2 (en) | 2022-11-17 |
| EP3771061B1 (en) | 2023-08-23 |
| ES2955405T3 (en) | 2023-11-30 |
| JP2021023023A (en) | 2021-02-18 |
Similar Documents
| Publication | Publication Date | Title |
|---|---|---|
| EP3771061B1 (en) | Power system stabilization system and power system stabilization method using calculated power system sensitivity | |
| Liu et al. | A wide area monitoring system based load restoration method | |
| JP5984601B2 (en) | System control device and system control method | |
| US7096175B2 (en) | Stability prediction for an electric power network | |
| US20180152020A1 (en) | Power System Voltage Reactive Power Monitoring Control Device and Method | |
| JP6387617B2 (en) | Distribution system accident recovery method, and distribution system's actual load and its width estimating device, method and program | |
| EP1381132B1 (en) | Power network parameter estimation | |
| Adewole et al. | Adaptive under‐voltage load shedding scheme for large interconnected smart grids based on wide area synchrophasor measurements | |
| JP2011019362A (en) | System stabilization system with posteriori correction function | |
| US20230018146A1 (en) | Method and central computer arrangement for predicting a grid state, and computer program product | |
| Sass et al. | Automated corrective actions by VSC-HVDC-systems: A novel remedial action scheme | |
| Parizad et al. | An intelligent load and generation shedding procedure in an islanded network using a smart power management system | |
| WO2016063660A1 (en) | Power system monitoring device and power system monitoring method | |
| JP2001103669A (en) | Power system frequency stabilizer | |
| JP6356517B2 (en) | System monitoring and control device | |
| Riquelme-Dominguez et al. | Improved harmony search algorithm to compute the underfrequency load shedding parameters | |
| JP7450504B2 (en) | Grid stabilization system and grid stabilization method | |
| Giroletti et al. | A hybrid frequency/power based method for industrial load shedding | |
| CN117044060A (en) | Preemptive Power Conversion Switching | |
| US10228673B2 (en) | Method, system and computer program product for controlling and/or regulating an electric energy system | |
| Mohammad Zaheri et al. | Two‐stage coupling of coordinated energy management and self‐healing strategies in a smart distribution network considering coupling neighbouring microgrids according to autonomous decentralized restoration technique | |
| Hamilton | Optimization-based operation and control approaches for improving the resilience of electric power systems | |
| Dedović Muftić et al. | Adaptive Under Frequency Load Shedding Using Center-of-Inertia Frequency | |
| Moradzadeh et al. | Coordinated voltage control via distributed model predictive control | |
| JP2011244511A (en) | Local area power supply recovery demand-supply balancing apparatus |
Legal Events
| Date | Code | Title | Description |
|---|---|---|---|
| PUAI | Public reference made under article 153(3) epc to a published international application that has entered the european phase |
Free format text: ORIGINAL CODE: 0009012 |
|
| STAA | Information on the status of an ep patent application or granted ep patent |
Free format text: STATUS: REQUEST FOR EXAMINATION WAS MADE |
|
| 17P | Request for examination filed |
Effective date: 20200710 |
|
| AK | Designated contracting states |
Kind code of ref document: A1 Designated state(s): AL AT BE BG CH CY CZ DE DK EE ES FI FR GB GR HR HU IE IS IT LI LT LU LV MC MK MT NL NO PL PT RO RS SE SI SK SM TR |
|
| AX | Request for extension of the european patent |
Extension state: BA ME |
|
| STAA | Information on the status of an ep patent application or granted ep patent |
Free format text: STATUS: EXAMINATION IS IN PROGRESS |
|
| 17Q | First examination report despatched |
Effective date: 20210803 |
|
| GRAP | Despatch of communication of intention to grant a patent |
Free format text: ORIGINAL CODE: EPIDOSNIGR1 |
|
| STAA | Information on the status of an ep patent application or granted ep patent |
Free format text: STATUS: GRANT OF PATENT IS INTENDED |
|
| INTG | Intention to grant announced |
Effective date: 20230317 |
|
| GRAS | Grant fee paid |
Free format text: ORIGINAL CODE: EPIDOSNIGR3 |
|
| GRAA | (expected) grant |
Free format text: ORIGINAL CODE: 0009210 |
|
| STAA | Information on the status of an ep patent application or granted ep patent |
Free format text: STATUS: THE PATENT HAS BEEN GRANTED |
|
| AK | Designated contracting states |
Kind code of ref document: B1 Designated state(s): AL AT BE BG CH CY CZ DE DK EE ES FI FR GB GR HR HU IE IS IT LI LT LU LV MC MK MT NL NO PL PT RO RS SE SI SK SM TR |
|
| REG | Reference to a national code |
Ref country code: GB Ref legal event code: FG4D |
|
| REG | Reference to a national code |
Ref country code: CH Ref legal event code: EP |
|
| REG | Reference to a national code |
Ref country code: IE Ref legal event code: FG4D |
|
| REG | Reference to a national code |
Ref country code: DE Ref legal event code: R096 Ref document number: 602020016063 Country of ref document: DE |
|
| REG | Reference to a national code |
Ref country code: ES Ref legal event code: FG2A Ref document number: 2955405 Country of ref document: ES Kind code of ref document: T3 Effective date: 20231130 |
|
| REG | Reference to a national code |
Ref country code: LT Ref legal event code: MG9D |
|
| REG | Reference to a national code |
Ref country code: NL Ref legal event code: MP Effective date: 20230823 |
|
| REG | Reference to a national code |
Ref country code: AT Ref legal event code: MK05 Ref document number: 1603711 Country of ref document: AT Kind code of ref document: T Effective date: 20230823 |
|
| PG25 | Lapsed in a contracting state [announced via postgrant information from national office to epo] |
Ref country code: GR Free format text: LAPSE BECAUSE OF FAILURE TO SUBMIT A TRANSLATION OF THE DESCRIPTION OR TO PAY THE FEE WITHIN THE PRESCRIBED TIME-LIMIT Effective date: 20231124 |
|
| PG25 | Lapsed in a contracting state [announced via postgrant information from national office to epo] |
Ref country code: IS Free format text: LAPSE BECAUSE OF FAILURE TO SUBMIT A TRANSLATION OF THE DESCRIPTION OR TO PAY THE FEE WITHIN THE PRESCRIBED TIME-LIMIT Effective date: 20231223 |
|
| PG25 | Lapsed in a contracting state [announced via postgrant information from national office to epo] |
Ref country code: SE Free format text: LAPSE BECAUSE OF FAILURE TO SUBMIT A TRANSLATION OF THE DESCRIPTION OR TO PAY THE FEE WITHIN THE PRESCRIBED TIME-LIMIT Effective date: 20230823 Ref country code: RS Free format text: LAPSE BECAUSE OF FAILURE TO SUBMIT A TRANSLATION OF THE DESCRIPTION OR TO PAY THE FEE WITHIN THE PRESCRIBED TIME-LIMIT Effective date: 20230823 Ref country code: PT Free format text: LAPSE BECAUSE OF FAILURE TO SUBMIT A TRANSLATION OF THE DESCRIPTION OR TO PAY THE FEE WITHIN THE PRESCRIBED TIME-LIMIT Effective date: 20231226 Ref country code: NO Free format text: LAPSE BECAUSE OF FAILURE TO SUBMIT A TRANSLATION OF THE DESCRIPTION OR TO PAY THE FEE WITHIN THE PRESCRIBED TIME-LIMIT Effective date: 20231123 Ref country code: NL Free format text: LAPSE BECAUSE OF FAILURE TO SUBMIT A TRANSLATION OF THE DESCRIPTION OR TO PAY THE FEE WITHIN THE PRESCRIBED TIME-LIMIT Effective date: 20230823 Ref country code: LV Free format text: LAPSE BECAUSE OF FAILURE TO SUBMIT A TRANSLATION OF THE DESCRIPTION OR TO PAY THE FEE WITHIN THE PRESCRIBED TIME-LIMIT Effective date: 20230823 Ref country code: LT Free format text: LAPSE BECAUSE OF FAILURE TO SUBMIT A TRANSLATION OF THE DESCRIPTION OR TO PAY THE FEE WITHIN THE PRESCRIBED TIME-LIMIT Effective date: 20230823 Ref country code: IS Free format text: LAPSE BECAUSE OF FAILURE TO SUBMIT A TRANSLATION OF THE DESCRIPTION OR TO PAY THE FEE WITHIN THE PRESCRIBED TIME-LIMIT Effective date: 20231223 Ref country code: HR Free format text: LAPSE BECAUSE OF FAILURE TO SUBMIT A TRANSLATION OF THE DESCRIPTION OR TO PAY THE FEE WITHIN THE PRESCRIBED TIME-LIMIT Effective date: 20230823 Ref country code: GR Free format text: LAPSE BECAUSE OF FAILURE TO SUBMIT A TRANSLATION OF THE DESCRIPTION OR TO PAY THE FEE WITHIN THE PRESCRIBED TIME-LIMIT Effective date: 20231124 Ref country code: FI Free format text: LAPSE BECAUSE OF FAILURE TO SUBMIT A TRANSLATION OF THE DESCRIPTION OR TO PAY THE FEE WITHIN THE PRESCRIBED TIME-LIMIT Effective date: 20230823 Ref country code: AT Free format text: LAPSE BECAUSE OF FAILURE TO SUBMIT A TRANSLATION OF THE DESCRIPTION OR TO PAY THE FEE WITHIN THE PRESCRIBED TIME-LIMIT Effective date: 20230823 |
|
| PG25 | Lapsed in a contracting state [announced via postgrant information from national office to epo] |
Ref country code: PL Free format text: LAPSE BECAUSE OF FAILURE TO SUBMIT A TRANSLATION OF THE DESCRIPTION OR TO PAY THE FEE WITHIN THE PRESCRIBED TIME-LIMIT Effective date: 20230823 |
|
| PG25 | Lapsed in a contracting state [announced via postgrant information from national office to epo] |
Ref country code: SM Free format text: LAPSE BECAUSE OF FAILURE TO SUBMIT A TRANSLATION OF THE DESCRIPTION OR TO PAY THE FEE WITHIN THE PRESCRIBED TIME-LIMIT Effective date: 20230823 Ref country code: RO Free format text: LAPSE BECAUSE OF FAILURE TO SUBMIT A TRANSLATION OF THE DESCRIPTION OR TO PAY THE FEE WITHIN THE PRESCRIBED TIME-LIMIT Effective date: 20230823 Ref country code: EE Free format text: LAPSE BECAUSE OF FAILURE TO SUBMIT A TRANSLATION OF THE DESCRIPTION OR TO PAY THE FEE WITHIN THE PRESCRIBED TIME-LIMIT Effective date: 20230823 Ref country code: DK Free format text: LAPSE BECAUSE OF FAILURE TO SUBMIT A TRANSLATION OF THE DESCRIPTION OR TO PAY THE FEE WITHIN THE PRESCRIBED TIME-LIMIT Effective date: 20230823 Ref country code: CZ Free format text: LAPSE BECAUSE OF FAILURE TO SUBMIT A TRANSLATION OF THE DESCRIPTION OR TO PAY THE FEE WITHIN THE PRESCRIBED TIME-LIMIT Effective date: 20230823 Ref country code: SK Free format text: LAPSE BECAUSE OF FAILURE TO SUBMIT A TRANSLATION OF THE DESCRIPTION OR TO PAY THE FEE WITHIN THE PRESCRIBED TIME-LIMIT Effective date: 20230823 |
|
| REG | Reference to a national code |
Ref country code: DE Ref legal event code: R097 Ref document number: 602020016063 Country of ref document: DE |
|
| PG25 | Lapsed in a contracting state [announced via postgrant information from national office to epo] |
Ref country code: IT Free format text: LAPSE BECAUSE OF FAILURE TO SUBMIT A TRANSLATION OF THE DESCRIPTION OR TO PAY THE FEE WITHIN THE PRESCRIBED TIME-LIMIT Effective date: 20230823 |
|
| PLBE | No opposition filed within time limit |
Free format text: ORIGINAL CODE: 0009261 |
|
| STAA | Information on the status of an ep patent application or granted ep patent |
Free format text: STATUS: NO OPPOSITION FILED WITHIN TIME LIMIT |
|
| 26N | No opposition filed |
Effective date: 20240524 |
|
| PG25 | Lapsed in a contracting state [announced via postgrant information from national office to epo] |
Ref country code: SI Free format text: LAPSE BECAUSE OF FAILURE TO SUBMIT A TRANSLATION OF THE DESCRIPTION OR TO PAY THE FEE WITHIN THE PRESCRIBED TIME-LIMIT Effective date: 20230823 |
|
| PG25 | Lapsed in a contracting state [announced via postgrant information from national office to epo] |
Ref country code: BG Free format text: LAPSE BECAUSE OF FAILURE TO SUBMIT A TRANSLATION OF THE DESCRIPTION OR TO PAY THE FEE WITHIN THE PRESCRIBED TIME-LIMIT Effective date: 20230823 |
|
| PG25 | Lapsed in a contracting state [announced via postgrant information from national office to epo] |
Ref country code: BG Free format text: LAPSE BECAUSE OF FAILURE TO SUBMIT A TRANSLATION OF THE DESCRIPTION OR TO PAY THE FEE WITHIN THE PRESCRIBED TIME-LIMIT Effective date: 20230823 |
|
| REG | Reference to a national code |
Ref country code: CH Ref legal event code: PL |
|
| PG25 | Lapsed in a contracting state [announced via postgrant information from national office to epo] |
Ref country code: MC Free format text: LAPSE BECAUSE OF FAILURE TO SUBMIT A TRANSLATION OF THE DESCRIPTION OR TO PAY THE FEE WITHIN THE PRESCRIBED TIME-LIMIT Effective date: 20230823 |
|
| PG25 | Lapsed in a contracting state [announced via postgrant information from national office to epo] |
Ref country code: LU Free format text: LAPSE BECAUSE OF NON-PAYMENT OF DUE FEES Effective date: 20240511 |
|
| PG25 | Lapsed in a contracting state [announced via postgrant information from national office to epo] |
Ref country code: MC Free format text: LAPSE BECAUSE OF FAILURE TO SUBMIT A TRANSLATION OF THE DESCRIPTION OR TO PAY THE FEE WITHIN THE PRESCRIBED TIME-LIMIT Effective date: 20230823 Ref country code: LU Free format text: LAPSE BECAUSE OF NON-PAYMENT OF DUE FEES Effective date: 20240511 Ref country code: CH Free format text: LAPSE BECAUSE OF NON-PAYMENT OF DUE FEES Effective date: 20240531 |
|
| PG25 | Lapsed in a contracting state [announced via postgrant information from national office to epo] |
Ref country code: IE Free format text: LAPSE BECAUSE OF NON-PAYMENT OF DUE FEES Effective date: 20240511 |
|
| PG25 | Lapsed in a contracting state [announced via postgrant information from national office to epo] |
Ref country code: FR Free format text: LAPSE BECAUSE OF NON-PAYMENT OF DUE FEES Effective date: 20240531 |
|
| PGFP | Annual fee paid to national office [announced via postgrant information from national office to epo] |
Ref country code: GB Payment date: 20250327 Year of fee payment: 6 |
|
| PGFP | Annual fee paid to national office [announced via postgrant information from national office to epo] |
Ref country code: DE Payment date: 20250402 Year of fee payment: 6 |
|
| PGFP | Annual fee paid to national office [announced via postgrant information from national office to epo] |
Ref country code: ES Payment date: 20250602 Year of fee payment: 6 |
|
| PGFP | Annual fee paid to national office [announced via postgrant information from national office to epo] |
Ref country code: BE Payment date: 20250410 Year of fee payment: 6 |
|
| PG25 | Lapsed in a contracting state [announced via postgrant information from national office to epo] |
Ref country code: CY Free format text: LAPSE BECAUSE OF FAILURE TO SUBMIT A TRANSLATION OF THE DESCRIPTION OR TO PAY THE FEE WITHIN THE PRESCRIBED TIME-LIMIT; INVALID AB INITIO Effective date: 20200511 |
|
| PG25 | Lapsed in a contracting state [announced via postgrant information from national office to epo] |
Ref country code: HU Free format text: LAPSE BECAUSE OF FAILURE TO SUBMIT A TRANSLATION OF THE DESCRIPTION OR TO PAY THE FEE WITHIN THE PRESCRIBED TIME-LIMIT; INVALID AB INITIO Effective date: 20200511 |