EP3767283A1 - Measuring apparatus, measuring apparatus adjustment method and computer program product - Google Patents
Measuring apparatus, measuring apparatus adjustment method and computer program product Download PDFInfo
- Publication number
- EP3767283A1 EP3767283A1 EP20185928.7A EP20185928A EP3767283A1 EP 3767283 A1 EP3767283 A1 EP 3767283A1 EP 20185928 A EP20185928 A EP 20185928A EP 3767283 A1 EP3767283 A1 EP 3767283A1
- Authority
- EP
- European Patent Office
- Prior art keywords
- value
- fluorescence
- control sample
- measuring apparatus
- positive control
- Prior art date
- Legal status (The legal status is an assumption and is not a legal conclusion. Google has not performed a legal analysis and makes no representation as to the accuracy of the status listed.)
- Granted
Links
Images




Classifications
-
- G—PHYSICS
- G01—MEASURING; TESTING
- G01N—INVESTIGATING OR ANALYSING MATERIALS BY DETERMINING THEIR CHEMICAL OR PHYSICAL PROPERTIES
- G01N21/00—Investigating or analysing materials by the use of optical means, i.e. using sub-millimetre waves, infrared, visible or ultraviolet light
- G01N21/62—Systems in which the material investigated is excited whereby it emits light or causes a change in wavelength of the incident light
- G01N21/63—Systems in which the material investigated is excited whereby it emits light or causes a change in wavelength of the incident light optically excited
- G01N21/64—Fluorescence; Phosphorescence
- G01N21/6428—Measuring fluorescence of fluorescent products of reactions or of fluorochrome labelled reactive substances, e.g. measuring quenching effects, using measuring "optrodes"
-
- G—PHYSICS
- G01—MEASURING; TESTING
- G01J—MEASUREMENT OF INTENSITY, VELOCITY, SPECTRAL CONTENT, POLARISATION, PHASE OR PULSE CHARACTERISTICS OF INFRARED, VISIBLE OR ULTRAVIOLET LIGHT; COLORIMETRY; RADIATION PYROMETRY
- G01J3/00—Spectrometry; Spectrophotometry; Monochromators; Measuring colours
- G01J3/28—Investigating the spectrum
-
- G—PHYSICS
- G01—MEASURING; TESTING
- G01J—MEASUREMENT OF INTENSITY, VELOCITY, SPECTRAL CONTENT, POLARISATION, PHASE OR PULSE CHARACTERISTICS OF INFRARED, VISIBLE OR ULTRAVIOLET LIGHT; COLORIMETRY; RADIATION PYROMETRY
- G01J3/00—Spectrometry; Spectrophotometry; Monochromators; Measuring colours
- G01J3/28—Investigating the spectrum
- G01J3/30—Measuring the intensity of spectral lines directly on the spectrum itself
- G01J3/36—Investigating two or more bands of a spectrum by separate detectors
-
- G—PHYSICS
- G01—MEASURING; TESTING
- G01J—MEASUREMENT OF INTENSITY, VELOCITY, SPECTRAL CONTENT, POLARISATION, PHASE OR PULSE CHARACTERISTICS OF INFRARED, VISIBLE OR ULTRAVIOLET LIGHT; COLORIMETRY; RADIATION PYROMETRY
- G01J3/00—Spectrometry; Spectrophotometry; Monochromators; Measuring colours
- G01J3/28—Investigating the spectrum
- G01J3/44—Raman spectrometry; Scattering spectrometry ; Fluorescence spectrometry
- G01J3/4406—Fluorescence spectrometry
-
- G—PHYSICS
- G01—MEASURING; TESTING
- G01J—MEASUREMENT OF INTENSITY, VELOCITY, SPECTRAL CONTENT, POLARISATION, PHASE OR PULSE CHARACTERISTICS OF INFRARED, VISIBLE OR ULTRAVIOLET LIGHT; COLORIMETRY; RADIATION PYROMETRY
- G01J3/00—Spectrometry; Spectrophotometry; Monochromators; Measuring colours
- G01J3/28—Investigating the spectrum
- G01J3/44—Raman spectrometry; Scattering spectrometry ; Fluorescence spectrometry
- G01J3/4412—Scattering spectrometry
-
- G—PHYSICS
- G01—MEASURING; TESTING
- G01N—INVESTIGATING OR ANALYSING MATERIALS BY DETERMINING THEIR CHEMICAL OR PHYSICAL PROPERTIES
- G01N15/00—Investigating characteristics of particles; Investigating permeability, pore-volume or surface-area of porous materials
- G01N15/10—Investigating individual particles
- G01N15/1012—Calibrating particle analysers; References therefor
-
- G—PHYSICS
- G01—MEASURING; TESTING
- G01N—INVESTIGATING OR ANALYSING MATERIALS BY DETERMINING THEIR CHEMICAL OR PHYSICAL PROPERTIES
- G01N15/00—Investigating characteristics of particles; Investigating permeability, pore-volume or surface-area of porous materials
- G01N15/10—Investigating individual particles
- G01N15/14—Optical investigation techniques, e.g. flow cytometry
- G01N15/1434—Optical arrangements
- G01N15/1436—Optical arrangements the optical arrangement forming an integrated apparatus with the sample container, e.g. a flow cell
-
- G—PHYSICS
- G01—MEASURING; TESTING
- G01N—INVESTIGATING OR ANALYSING MATERIALS BY DETERMINING THEIR CHEMICAL OR PHYSICAL PROPERTIES
- G01N15/00—Investigating characteristics of particles; Investigating permeability, pore-volume or surface-area of porous materials
- G01N15/10—Investigating individual particles
- G01N15/14—Optical investigation techniques, e.g. flow cytometry
- G01N15/1456—Optical investigation techniques, e.g. flow cytometry without spatial resolution of the texture or inner structure of the particle, e.g. processing of pulse signals
- G01N15/1459—Optical investigation techniques, e.g. flow cytometry without spatial resolution of the texture or inner structure of the particle, e.g. processing of pulse signals the analysis being performed on a sample stream
-
- G—PHYSICS
- G01—MEASURING; TESTING
- G01N—INVESTIGATING OR ANALYSING MATERIALS BY DETERMINING THEIR CHEMICAL OR PHYSICAL PROPERTIES
- G01N21/00—Investigating or analysing materials by the use of optical means, i.e. using sub-millimetre waves, infrared, visible or ultraviolet light
- G01N21/17—Systems in which incident light is modified in accordance with the properties of the material investigated
- G01N21/25—Colour; Spectral properties, i.e. comparison of effect of material on the light at two or more different wavelengths or wavelength bands
- G01N21/27—Colour; Spectral properties, i.e. comparison of effect of material on the light at two or more different wavelengths or wavelength bands using photo-electric detection ; circuits for computing concentration
- G01N21/274—Calibration, base line adjustment, drift correction
-
- G—PHYSICS
- G01—MEASURING; TESTING
- G01N—INVESTIGATING OR ANALYSING MATERIALS BY DETERMINING THEIR CHEMICAL OR PHYSICAL PROPERTIES
- G01N33/00—Investigating or analysing materials by specific methods not covered by groups G01N1/00 - G01N31/00
- G01N33/48—Biological material, e.g. blood, urine; Haemocytometers
- G01N33/50—Chemical analysis of biological material, e.g. blood, urine; Testing involving biospecific ligand binding methods; Immunological testing
- G01N33/58—Chemical analysis of biological material, e.g. blood, urine; Testing involving biospecific ligand binding methods; Immunological testing involving labelled substances
- G01N33/582—Chemical analysis of biological material, e.g. blood, urine; Testing involving biospecific ligand binding methods; Immunological testing involving labelled substances with fluorescent label
-
- G—PHYSICS
- G01—MEASURING; TESTING
- G01N—INVESTIGATING OR ANALYSING MATERIALS BY DETERMINING THEIR CHEMICAL OR PHYSICAL PROPERTIES
- G01N15/00—Investigating characteristics of particles; Investigating permeability, pore-volume or surface-area of porous materials
- G01N15/10—Investigating individual particles
- G01N2015/1006—Investigating individual particles for cytology
-
- G—PHYSICS
- G01—MEASURING; TESTING
- G01N—INVESTIGATING OR ANALYSING MATERIALS BY DETERMINING THEIR CHEMICAL OR PHYSICAL PROPERTIES
- G01N15/00—Investigating characteristics of particles; Investigating permeability, pore-volume or surface-area of porous materials
- G01N15/10—Investigating individual particles
- G01N15/14—Optical investigation techniques, e.g. flow cytometry
- G01N15/1434—Optical arrangements
- G01N2015/144—Imaging characterised by its optical setup
-
- G—PHYSICS
- G01—MEASURING; TESTING
- G01N—INVESTIGATING OR ANALYSING MATERIALS BY DETERMINING THEIR CHEMICAL OR PHYSICAL PROPERTIES
- G01N21/00—Investigating or analysing materials by the use of optical means, i.e. using sub-millimetre waves, infrared, visible or ultraviolet light
- G01N21/62—Systems in which the material investigated is excited whereby it emits light or causes a change in wavelength of the incident light
- G01N21/63—Systems in which the material investigated is excited whereby it emits light or causes a change in wavelength of the incident light optically excited
- G01N21/64—Fluorescence; Phosphorescence
- G01N2021/6417—Spectrofluorimetric devices
- G01N2021/6419—Excitation at two or more wavelengths
-
- G—PHYSICS
- G01—MEASURING; TESTING
- G01N—INVESTIGATING OR ANALYSING MATERIALS BY DETERMINING THEIR CHEMICAL OR PHYSICAL PROPERTIES
- G01N21/00—Investigating or analysing materials by the use of optical means, i.e. using sub-millimetre waves, infrared, visible or ultraviolet light
- G01N21/62—Systems in which the material investigated is excited whereby it emits light or causes a change in wavelength of the incident light
- G01N21/63—Systems in which the material investigated is excited whereby it emits light or causes a change in wavelength of the incident light optically excited
- G01N21/64—Fluorescence; Phosphorescence
- G01N2021/6417—Spectrofluorimetric devices
- G01N2021/6421—Measuring at two or more wavelengths
-
- G—PHYSICS
- G01—MEASURING; TESTING
- G01N—INVESTIGATING OR ANALYSING MATERIALS BY DETERMINING THEIR CHEMICAL OR PHYSICAL PROPERTIES
- G01N21/00—Investigating or analysing materials by the use of optical means, i.e. using sub-millimetre waves, infrared, visible or ultraviolet light
- G01N21/62—Systems in which the material investigated is excited whereby it emits light or causes a change in wavelength of the incident light
- G01N21/63—Systems in which the material investigated is excited whereby it emits light or causes a change in wavelength of the incident light optically excited
- G01N21/64—Fluorescence; Phosphorescence
- G01N21/6428—Measuring fluorescence of fluorescent products of reactions or of fluorochrome labelled reactive substances, e.g. measuring quenching effects, using measuring "optrodes"
- G01N2021/6439—Measuring fluorescence of fluorescent products of reactions or of fluorochrome labelled reactive substances, e.g. measuring quenching effects, using measuring "optrodes" with indicators, stains, dyes, tags, labels, marks
- G01N2021/6441—Measuring fluorescence of fluorescent products of reactions or of fluorochrome labelled reactive substances, e.g. measuring quenching effects, using measuring "optrodes" with indicators, stains, dyes, tags, labels, marks with two or more labels
-
- G—PHYSICS
- G01—MEASURING; TESTING
- G01N—INVESTIGATING OR ANALYSING MATERIALS BY DETERMINING THEIR CHEMICAL OR PHYSICAL PROPERTIES
- G01N21/00—Investigating or analysing materials by the use of optical means, i.e. using sub-millimetre waves, infrared, visible or ultraviolet light
- G01N21/17—Systems in which incident light is modified in accordance with the properties of the material investigated
- G01N21/47—Scattering, i.e. diffuse reflection
- G01N21/49—Scattering, i.e. diffuse reflection within a body or fluid
- G01N21/53—Scattering, i.e. diffuse reflection within a body or fluid within a flowing fluid, e.g. smoke
- G01N21/532—Scattering, i.e. diffuse reflection within a body or fluid within a flowing fluid, e.g. smoke with measurement of scattering and transmission
-
- G—PHYSICS
- G01—MEASURING; TESTING
- G01N—INVESTIGATING OR ANALYSING MATERIALS BY DETERMINING THEIR CHEMICAL OR PHYSICAL PROPERTIES
- G01N2201/00—Features of devices classified in G01N21/00
- G01N2201/12—Circuits of general importance; Signal processing
- G01N2201/124—Sensitivity
- G01N2201/1241—Multirange
Definitions
- the present invention relates to a measuring apparatus, a measuring apparatus adjustment method, and a computer program product.
- Japanese Patent Application Publication No. 2004-205508 discloses a flow cytometer for irradiating a laser light on a fluorescence-labeled sample to measure the fluorescence generated from each cell.
- This flow cytometer is provided with a fluorescence detector corresponding to each fluorescent dye to be detected in order to detect the fluorescence from a plurality of fluorescent dyes having different spectra.
- This flow cytometer uses a fluorescence detector such as a photomultiplier tube (PMT) or an avalanche diode capable of amplifying the detected signal in order to detect low level fluorescence.
- a fluorescence detector such as a photomultiplier tube (PMT) or an avalanche diode capable of amplifying the detected signal in order to detect low level fluorescence.
- the detection sensitivity of each fluorescence detector that is, the degree of signal amplification, is adjusted according to the fluorescent dye to be detected so that the measured value of the fluorescence from each cell falls within the dynamic range.
- the signal amplification degree of the PMT is changed by adjusting the voltage applied to the PMT.
- the PMT is set to a plurality of different applied voltages during setup, the fluorescence from the fluorescently labeled beads is measured at each applied voltage, and the linear functional relationship between the applied voltage and the output fluorescence value is experimentally determined and stored. Then, when the target fluorescence value is set for each PMT, the applied voltage that will output the target fluorescence value from the fluorescence detector is calculated using the determined functional relationship.
- the present invention relates to a measuring apparatus comprising: a flow cell through which a sample containing particles flows; a light source to irradiate light on the sample flowing through the flow cell; a fluorescence detector to detect fluorescence generated from the sample irradiated with light from the light source; and a controller programmed to carry out a sensitivity adjustment comprising: causing a positive control sample containing a fluorescent dye to flow through the flow cell, obtaining a measurement value of the fluorescence generated from the positive control sample irradiated by the light from the light source via the fluorescence detector, comparing the measurement value and a reference value, and adjusting a sensitivity of the fluorescence detector according to a comparison result.
- the present invention relates to a method for adjusting measuring apparatus comprising: flowing a positive control sample containing a fluorescent dye through a flow cell; irradiating the positive control sample flowing through the flow cell with light; measuring the fluorescence generated from the positive control sample irradiated with light by a fluorescence detector to obtain a measurement value; comparing the measurement value with a reference value; and adjusting a sensitivity of the fluorescence detector according to the comparison result.
- the present invention relates to a computer program product, comprising: a computer hardware storage device having stored therein computer usable program code for adjusting a measuring apparatus, the computer usable program code, which when executed by a computer hardware system in a measuring apparatus, causes the measuring apparatus to perform: flowing a positive control sample containing a fluorescent dye through a flow cell; irradiating the positive control sample flowing through the flow cell with light; measuring the fluorescence generated from the positive control sample irradiated with light by a fluorescence detector to obtain a measurement value; comparing the measurement value with a reference value; and adjusting a sensitivity of the fluorescence detector according to the comparison result.
- the detection sensitivity used for detecting light from a sample can be easily adjusted.
- FIG. 1A and FIG. 1B are schematic views summarizing the sensitivity adjustment method of the fluorescence detector of the measuring apparatus. Described below is a case of measuring a positive control sample containing a bead population labeled with a predetermined amount of fluorescein isothiocyante (hereinafter, FITC bead population) in a flow cytometer provided with a PE detector for detecting the fluorescent dye phycoerythrin (hereinafter, PE) and a FITC detector for detecting the fluorescent dye fluorescein isothiocyanate (hereinafter FITC).
- PE fluorescent dye phycoerythrin
- FITC detector for detecting the fluorescent dye fluorescein isothiocyanate
- FIG. 1B show the dot-plotted appearance of the fluorescence intensity obtained from each bead by measuring a positive control sample containing an FITC bead population, wherein a fluorescence intensity (FL1) based on the output of the FITC detector is set on the horizontal axis, and a fluorescence intensity (FL2) based on the output of the PE detector is set on the vertical axis.
- a fluorescence intensity (FL1) based on the output of the FITC detector is set on the horizontal axis
- FL2 fluorescence intensity
- the measuring apparatus compares a statistical value A (for example, the median value of the fluorescence intensity) of the fluorescence intensity (FL1) generated from the FITC bead population and a reference value, and adjusts the detection sensitivity of the FITC detector so that the statistical value A is substantially equal to the reference value in accordance with the comparison result, as shown in FIG. 1B .
- a statistical value A for example, the median value of the fluorescence intensity
- FL1 the fluorescence intensity
- the detection sensitivity used for detecting the light from the sample can be easily adjusted by carrying out such an adjustment method.
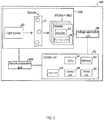
- the measuring apparatus 100 will be described with reference to FIG. 2 .
- the measuring apparatus 100 is a multi-color flow cytometer.
- the flow cytometer optically measures a sample by a flow cytometric method.
- the measuring apparatus 100 includes an optical system unit 200, a sample preparation unit 400, a voltage application unit 50, and a control unit 40.
- the control unit 40 controls the operations of the optical system unit 200, the sample preparation unit 400, and the voltage application unit 50.
- the control unit 40 is a computer and includes a CPU (Central Processing Unit) 41, a memory 42, an input unit 43, a display unit 44, and a storage unit 45.
- CPU Central Processing Unit
- the CPU 41 performs the control process by the control unit 40.
- the memory 42 is used as a work area for performing the control process by the CPU 41.
- the memory 42 includes a RAM (Random Access Memory).
- the input unit 43 receives instructions input from the user.
- the input unit 43 also reads the information attached to the sample container.
- the input unit 43 includes, for example, a keyboard, a mouse, and a reader such as a barcode or RFID.
- the display unit 44 displays the measurement result of the optical system unit 200.
- the display unit 44 also displays screens for operations.
- the storage unit 45 stores a program for processing, measurement results, and information for measurement.
- the storage unit 45 is a ROM (Read Only Memory) is included.
- the sample preparation unit 400 mixes a fluorescent reagent into the sample to be measured, labels the sample with a fluorescent dye, and prepares a sample suitable for measurement by the optical system unit 200.
- the optical system unit 200 includes a flow cell 10, a light source 20, and a plurality of detectors 30 (30a to 30p).
- the detector 30 includes a light receiving element 34 that outputs an electric signal corresponding to the intensity of the detected light, and an amplification unit 33 that amplifies the electric signal output from the light receiving element 34.
- the detector 30 used for fluorescence detection is a photomultiplier tube (PMT), the light receiving element 34 includes a photocathode, and the amplification unit 33 includes a dynode.
- the optical system unit 200 will be described in more detail with reference to FIG. 3 .
- the optical system unit 200 includes the flow cell 10, light sources 20a, 20b, and 20c, and detectors 30a to 30p.
- the flow cell 10 receives the sample prepared by the sample preparation unit 400.
- the light sources 20a to 20c irradiate light on the sample passing through the flow cell 10.
- the detectors 30a to 30p detect light from the sample and output a detection signal converted into an electric signal.
- the detector 30a is a detector that detects forward scattered light
- the detector 30b is a detector that detects side scattered light.
- the detector 30a and the detector 30b are photodiodes.
- the detectors 30c, 30d, 30e, 30f, 30g, 30h, 30i, 30j, 30k, 301, 30m, 30n, 30o, and 30p are detectors that detect fluorescence.
- the detectors 30c to 30p are photomultiplier tubes (PMT).
- the detectors 30c to 30p have different fluorescent dyes to be detected.
- the PMT includes a photocathode, a dynode, and an anode.
- the photoelectrons generated by the photocathode are amplified by the dynode and output from the anode.
- the detection sensitivity of each of the detectors 30c to 30p is adjusted by changing the voltage applied to the dynode. That is, the light receiving element 34 shown in FIG.
- the voltage application unit 50 applies a voltage of a designated magnitude to the dynodes of the detectors 30c to 30p based on instruction from the control unit 40.
- the light sources 20a to 20c emit light having different wavelengths.
- the light source 20a emits light having a wavelength of about 488 nm.
- the light source 20b emits light having a wavelength of about 642 nm.
- the light source 20c emits light having a wavelength of about 405 nm.
- the light emitted from the light source 20a passes through a collimator lens 301a, dichroic mirrors 303a and 303b, and a condenser lens 302, and is applied to the flow cell 10.
- the light emitted from the light source 20b is transmitted through a collimator lens 301b, reflected by the dichroic mirror 303a, transmitted through the dichroic mirror 303b, transmitted through the condensing lens 302, and emitted to the flow cell 10.
- the light emitted from the light source 20c passes through a collimator lens 301c, reflected by the dichroic mirror 303b, passes through the condenser lens 302, and is emitted to the flow cell 10.
- the forward scattered light of the light originating from the sample passing through the flow cell 10 passes through a condenser lens 304a, a beam stopper 305a, a pinhole plate 305b, and a bandpass filter 307a, and enters the detector 30a.
- the side scattered light and fluorescent light originating from the particles contained in the sample passing through the flow cell 10 are condensed by a condenser lens 304b.
- the side scattered light incident on the detector 30b passes through dichroic mirrors 308a and 308b from the condenser lens 304b, then is reflected by a dichroic mirror 308c, passes through dichroic mirrors 308d and 308e, and the bandpass filter 307b, and is incident on the detector 30b.
- the fluorescence incident on each of the detectors 30c to 30p is divided into mutually different wavelength bands by the dichroic mirrors 308a to 308n.
- the fluorescence incident on the detector 30c passes through the dichroic mirrors 308a and 308b from the condenser lens 304b, then is reflected by the dichroic mirror 308c, transmitted through the dichroic mirror 308d, reflected by the dichroic mirror 308e, and transmitted through the bandpass filter 307c, whereupon the light enters the detector 30c.
- the fluorescence incident on the detector 30d passes through the dichroic mirrors 308a and 308b from the condenser lens 304b, then is reflected by the dichroic mirror 308c,reflected by the dichroic mirror 308d, and transmitted through the bandpass filter 307d, whereupon the light enters the detector 30d.
- the fluorescence incident on the detector 30e passes through the dichroic mirrors 308a, 308b, 308c, and 308f from the condenser lens 304b, then passes through the bandpass filter 307e, whereupon the light enters the detector 30e.
- the fluorescence incident on the detector 30f passes through the dichroic mirrors 308a, 308b, and 308c from the condenser lens 304b, then is reflected by the dichroic mirror 308f, reflected by the dichroic mirror 308g, transmitted through the bandpass filter 307f, whereupon the light enters the detector 30f.
- the fluorescence incident on the detector 30g passes through the dichroic mirrors 308a, 308b and 308c from the condenser lens 304b, then is reflected by the dichroic mirror 308f, passes through the dichroic mirror 308g and the band pass filter 307g, whereupon the light enters the detector 30g.
- the fluorescence incident on the detector 30h is reflected from the condensing lens 304b to the dichroic mirror 308a, transmitted through the dichroic mirror 308b, reflected by the dichroic mirror 308h, transmitted through the bandpass filter 307h, whereupon the light enters the detector 30h.
- the fluorescence incident on the detector 30i is reflected from the condenser lens 304b to the dichroic mirror 308a, transmitted through the dichroic mirrors 308b and 308h, reflected by the dichroic mirror 308i, transmitted through the bandpass filter 307i, whereupon the light enters the detector 30i.
- the fluorescence incident on the detector 30j is reflected from the condenser lens 304b to the dichroic mirror 308a, transmitted through the dichroic mirrors 308b, 308h and 308i, transmitted through the bandpass filter 307j, whereupon the light enters the detector 30j.
- the fluorescence incident to the detector 30k is reflected from the condenser lens 304b to the dichroic mirror 308b, transmitted through the dichroic mirror 308a, reflected by the dichroic mirror 308j, transmitted through the dichroic mirrors 308k, 3081, and the bandpass filter 307k, whereupon the light enters the detector 30k.
- the fluorescence incident on the detector 301 is reflected from the condensing lens 304b to the dichroic mirror 308b, transmitted through the dichroic mirror 308a, reflected by the dichroic mirror 308j, transmitted through the dichroic mirror 308k, and reflected by the dichroic mirror 3081, passes through the pass filter 3071, whereupon the light enters the detector 301.
- the fluorescence incident on the detector 30m is reflected from the condenser lens 304b to the dichroic mirror 308b, transmitted through the dichroic mirror 308a, reflected by the dichroic mirror 308j, reflected by the dichroic mirror 308k, and transmitted through the bandpass filter 307m, whereupon the light enters the detector 30m.
- the fluorescence incident on the detector 30n is reflected from the condenser lens 304b to the dichroic mirror 308b, transmitted through the dichroic mirror 308a, transmitted through the dichroic mirrors 308j and 308m and the bandpass filter 307n, whereupon the light enters the detector 30n.
- the fluorescence incident on the detector 30o is reflected from the condenser lens 304b to the dichroic mirror 308b, transmitted through the dichroic mirror 308a, transmitted through the dichroic mirror 308j, reflected by the dichroic mirror 308m, reflected by the dichroic mirror 308n, passes through the bandpass filter 307o, whereupon the light enters the detector 30o.
- the fluorescence incident on the detector 30p is reflected from the condenser lens 304b to the dichroic mirror 308b, transmitted through the dichroic mirror 308a, transmitted through the dichroic mirror 308j, reflected by the dichroic mirror 308m, transmitted through the dichroic mirror 308n, and transmitted through the bandpass filter 307p, whereupon the light enters the detector 30p.
- the respective detection signals output from the detectors 30a to 30p are transmitted to the control unit 40, the control unit 40 acquires parameters such as light intensity from the detection signals, and the sample is analyzed based on the acquired parameters.
- the number of light sources 20 may be one, two, or four or more.
- the flow cytometer is equipped with at least three light sources 20.
- the light source 20 is selected according to the wavelength range of the light originating from the sample. When there are two or more light sources 20, these light sources 20 preferably emit light having different peak wavelengths.
- the number of photodiodes, dichroic mirrors, and bandpass filters may be changed according to the number of peak wavelengths of light originating from the sample.
- the types of photodiode, dichroic mirror, and bandpass filter may also be selected according to the peak wavelength or wavelength region of light originating from the sample and the fluorescence intensity.
- the control unit 40 controls the optical system unit 200 to obtain and store appropriate optical information according to the antigen based on information relating to detection sensitivity when the detector 30 detects scattered light or fluorescence, information relating to fluorescence correction according to a combination of detected fluorescences, and information relating to gating for selecting a distribution region of a sample to be detected.
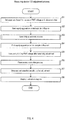
- the adjustment process of the measuring apparatus 100 will be described with reference to FIG. 4 .
- the process will be described for adjusting the detection sensitivity of the fluorescence detector (30c, 30d, 30e, 30f, 30g, 30h, 30i, 30j, 30k, 301, 30m, 30n, 30o, and 30p) by the control unit 40 of the measuring apparatus 100.
- the detection sensitivity of each fluorescence detector is adjusted so that particles labeled with a fluorescent dye and unlabeled particles are reliably separated in the fluorescence measurement at a specific wavelength.
- the sensitivity adjustment in the case of performing multi-color analysis by combining FITC and PE will be described by way of an example.
- the fluorescence of FITC is detected by the fluorescence detector 30c, and the fluorescence of PE is detected by the fluorescence detector 30d.
- the control unit 40 sets the reference value of the fluorescence intensity, which is the target of sensitivity adjustment, and the upper limit value and lower limit value of the voltage (hereinafter, PMT voltage) applied to the fluorescence detector 30c for the FITC fluorescence detector 30c.
- the reference value is a value at which the fluorescence intensity obtained from a positive control sample containing a bead population labeled with a predetermined amount of FITC is sufficiently higher than the fluorescence intensity from a negative control sample containing an unlabeled bead population.
- the reference value is increased, the amplification factor of the noise signal also increases, so the setting is made within a range in which the effect of the amplified noise signal is small.
- the reference value is input by the user via the input unit 43.
- the control unit 40 sets the PMT voltage such that a measurement value larger than the input reference value is output from the fluorescence detector 30c, as the initial value of the upper limit value.
- the control unit 40 also sets the PMT voltage such that a measurement value smaller than the input reference value is output from the fluorescence detector 30c, as the initial value of the lower limit value.
- step S2 the control unit 40 performs controls to start supplying the positive control sample to the flow cell 10.
- step S3 the control unit 40 adjusts the detection sensitivity of the fluorescence detector 30c by adjusting the applied voltage (PMT voltage) to the fluorescence detector 30c for FITC.
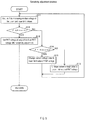
- step S3 of FIG. 4 will be described with reference to FIG. 5 .
- step S11 of FIG. 5 the control unit 40 sets the median value of the upper limit value and the lower limit value as the PMT voltage of the fluorescence detector 30c, and measures the positive control sample. In this way the statistical value A of the fluorescence intensity obtained from the FITC bead population contained in the positive control sample is acquired. The median value of the fluorescence intensity obtained from each bead of the bead population is used as the statistical value A.
- step S12 the control unit 40 compares the statistical value A with the reference value and determines whether the statistical value A is substantially equal to the reference value. That is, the control unit 40 determines whether the difference between the statistical value A and the reference value is within a predetermined range. When the difference between the statistical value A and the reference value is within the predetermined range, the process proceeds to step S13, whereas the process proceeds to step S14 when the difference between the statistical value A and the reference value is not within the predetermined range.
- step S13 the control unit 40 sets the PMT voltage at the time of obtaining the statistical value A as the PMT voltage after the sensitivity adjustment. Thereafter, the routine returns to the flowchart of FIG. 4 .
- step S14 the control unit 40 determines whether the statistical value A is smaller than the reference value. When the statistical value A is less than the reference value, the process proceeds to step S15, whereas the process proceeds to step S16 when the statistical value A is greater than the reference value.
- step S15 the control unit 40 changes the current PMT voltage (the median value of the upper limit value and the lower limit value set in step S1 of FIG. 4 ) to the lower limit value of the PMT voltage. Thereafter, the routine returns to step S11.
- step S16 the control unit 40 changes the current PMT voltage (the median value of the upper limit value and the lower limit value) to the upper limit value of the PMT voltage. Thereafter, the routine returns to step S11.
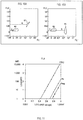
- the sensitivity adjustment will be described in more detail with reference to FIGS. 6 and 7 .
- the horizontal axis shows the fluorescence intensity (FL1) based on the output of the FITC fluorescence detector 30c, and the vertical axis shows the fluorescence intensity (FL2) based on the output of the PE fluorescence detector 30d.
- the initial value of the lower limit value of the PMT voltage set in step S1 of FIG. 4 is 100 V and the initial value of the upper limit value is 1000 V will be described.
- the fluorescence intensity (FL1) of the positive control sample was measured by the median value VC1 (550V) of the lower limit value VL1 (100V) and the upper limit value VH1 (1000V) of the PMT voltage.
- the statistical value A1 of the measurement value group 61 is smaller than the reference value, so the PMT voltage (550 V) used for the measurement is set to the next lower limit value.
- the fluorescence intensity (FL1) of the positive control sample was measured by the updated lower limit value VL2 (550V) of the PMT voltage and the median value VC2 (775V) of the upper limit value VH2 (1000V).
- the PMT voltage is measured at 775 V, the statistical value A2 of the measurement value group 61 is smaller than the reference value, so the PMT voltage (775 V) used for the measurement is set to the next lower limit value.
- the fluorescence intensity (FL1) of the positive control sample was measured by the updated lower limit value VL3 (775 V) of the PMT voltage and the median value VC3 (887 V) of the upper limit value VH3 (1000 V).
- the PMT voltage is 887 V
- the statistical value A3 of the measurement value group 61 is larger than the reference value, so the PMT voltage (887 V) used for the measurement is set to the next upper limit value.
- the fluorescence intensity (FL1) of the positive control sample was measured by the updated lower limit value VL4 (775 V) of the PMT voltage and the median value VC4 (831 V) of the upper limit value VH4 (887 V).
- the PMT voltage is 831V
- the statistical value A4 of the measurement value group 61 is larger than the reference value, so the PMT voltage (831V) used for the measurement is set to the next upper limit value.
- the fluorescence intensity (FL1) of the positive control sample was measured by the updated PMT voltage lower limit value VL5 (775 V) and the upper limit value VH5 (831 V) median value VC5 (803 V).
- the statistical value A5 of the measurement value group 61 is substantially equal to the reference value. In this way the sensitivity adjustment ends, and the process proceeds to step S4 in the flowchart of FIG. 4 .
- the condition that the statistical value A is substantially equal to the reference value is such that the difference between them is less than 5% of the reference value.
- a binary search is used to search for the PMT voltage that matches the reference value.
- the search method also may be another search method.
- the search method also may be linear search or bidirectional search.
- the median value is used as the statistical value A, the mode value or the average value also may be used as the statistical value A.
- step S4 of the flowchart of FIG. 4 the control unit 40 performs control for ending the supply of the positive control sample to the flow cell.
- step S5 the control unit 40 measures the statistical value A of the fluorescence intensity of the FITC bead population in the positive control sample by the FITC fluorescence detector 30c after the detection sensitivity adjustment, measures the statistical value B of the fluorescence intensity of the FITC bead population in the same positive control sample by the PE fluorescence detector 30d after the detection sensitivity adjustment, measures the statistical value C of the fluorescence intensity of the bead population in the negative control sample by the PE fluorescence detector 30d after detection sensitivity adjustment, and stores the statistical values A, B, and C in the storage unit 45. These values are used in the fluorescence correction process in step S6. In this measurement, a mixed sample of the positive control sample and the negative control sample is supplied to the flow cell 10.
- step S6 the control unit 40 performs a fluorescence correction process.
- a sample is multi-stained and fluorescences emitted from the plurality of fluorescent dyes is simultaneously detected. Since the fluorescence of each of the fluorescent dyes has a spectrum, the fluorescence emitted from the fluorescent dyes other than the fluorescent dye bound to the target molecule also may leak even when the fluorescent dyes are separated for each wavelength range by an optical system.
- the fluorescent dye F1 is measured by detecting light in the wavelength range FL1.
- the fluorescent dye F2 is measured by detecting the light in the wavelength range FL2.
- Apart of the fluorescence of the fluorescent dye F1 is included in the wavelength range FL2.
- Apart of the fluorescence of the fluorescent dye F2 also is included in the wavelength range FL1. Therefore, the light from the fluorescent dye F1 can be detected by excluding the light from the fluorescent dye F2 in the detection of the light in the wavelength range FL1.
- the light of the fluorescent dye F2 also can be detected by excluding the light of the fluorescent dye F1 in the detection of the light in the wavelength range FL2.
- step S6 of FIG. 4 will be described with reference to FIG. 9 .
- a fluorescence correction value for subtracting the fluorescence from FITC leaking into the fluorescence detector for PE is calculated.
- step S21 of FIG. 9 the control unit 40 reads and stores the statistical values A, B, and C acquired in step S5 of FIG. 4 , that is, statistic value A of the fluorescence intensity of the FITC bead population in the positive control sample measured by the FITC fluorescence detector 30c after detection sensitivity adjustment, statistic value B of the fluorescence intensity of the FITC bead population in the same positive control sample measured by PE fluorescence detector 30d after detection sensitivity adjustment, and statistical value C of fluorescence intensity of the bead population in the negative control sample measured by PE fluorescence detector 30d after detection sensitivity adjustment.
- the relation matrix can be expressed as in Expression (3).
- Expression (6) can be derived from Expression (5).
- step S22 the control unit 40 confirms the history of the correction value tS 21 calculated using the same type of positive control sample and negative control sample or the correction value tS 2 1 initially set by the user.
- the routine proceeds to step S23.
- the routine proceeds to step S24.
- step S23 the control unit 40 calculates the correction value S 21 to subtract the fluorescence from FITC value S for subtracting from FITC the fluorescence leaking into the fluorescence the PE fluorescence detector based on the above-mentioned statistical value A, statistical value B, and statistical value C.
- step S24 the control unit 40 calculates a new correction value tS 21 based on the correction value tS 21 stored in the storage unit 45, and the statistical value A, the statistical value B, and the statistical value C.
- the control unit 40 calculates the correction value S 21 based on the value (B-C) related to the statistical value B of fluorescence intensity from the FITC bead population in the positive control sample measured by the PE fluorescence detector 30d, and the statistical value C of the fluorescence intensity from the bead population in the negative control sample.
- control unit 40 calculates the correction value S 21 by accounting for the fluorescence intensity from the FITC bead population in the positive control sample measured by the FITC fluorescence detector.
- the controller 40 stores the calculated correction value S 21 in the storage unit 45. In this way the calculated correction value S 21 may easily be used in the calculation of the correction value S 21 or measuring the sample.
- step S25 the control unit 40 corrects statistical value B using the correction value S 21 as shown in FIGS. 10A and 10B . Then, the process proceeds to step S7 in the flowchart of FIG. 4 .
- step S7 the control unit 40 stores the detection sensitivity of each fluorescence detector whose detection sensitivity has been adjusted in the storage unit 45.
- the control unit 40 sets the detection sensitivity of the fluorescence detector to the detection sensitivity stored in the storage unit 45 when measuring the sample collected from the subject.
- step S8 the control unit 40 displays on the display unit 44 a distribution chart (for example, the distribution chart shown in FIG. 6E ) with the fluorescence intensity (FL1) and the fluorescence intensity (FL2) after detection sensitivity adjustment and fluorescence correction plotted as axes.
- a distribution chart for example, the distribution chart shown in FIG. 6E
- the fluorescence intensity (FL1) and the fluorescence intensity (FL2) after detection sensitivity adjustment and fluorescence correction plotted as axes.
- the measuring apparatus 100 also is configured to accept manual correction of the detection sensitivity and correction value S 21 .
- an operation can be performed to adjust the correction value S 21 and the like. This allows the user to check the distribution map and correct the detection sensitivity and the correction value S 21 more precisely so that the detection sensitivity and the correction value S 21 can be more accurately set.
- step S2 After the supply of the positive control is started in step S2 of the flowchart shown in FIG. 4 and the sensitivity control is completed in step S3, the supply of the positive control is terminated in step S4, and a mixture of the positive control and a negative control is supplied.
- the present invention is not limited to this sequence inasmuch as the supply of the mixed solution of the positive control and the negative control may be started in step S2, and the supply of the mixed solution may be terminated after the sensitivity adjustment processing of step S3 and the fluorescence correction processing of step S6 are completed. In this way the number of times the user supplies the control sample to the measuring apparatus can be reduced, and the adjustment work can be further simplified.
- PMTs are used as the detectors 30c to 30p for detecting fluorescence in the above embodiment, avalanche photodiodes also may be used.
- the electric signal output from the detector also may be amplified by an amplifier circuit, or the electric signal output from the detector may be digitized and amplified by the control unit 40.
- the sample to be measured by the measuring apparatus 100 is not limited to a sample containing cells collected from a subject, and may be a sample containing particles such as microorganisms, animal cells, plant cells, pollen, plankton, and the like.
- any sample that emits fluorescence may be used, for example, a measurement sample containing fluorescence-labeled cells may be used as a positive control sample.
- the beads labeled with a fluorescent dye are not limited to the beads to which a fluorescent dye is directly bound, inasmuch as beads to which a fluorescent labeled antibody is bound also may be used. Beads with a fluorescent dye embedded therein also may be used.
- the fluorescently labeled cells are not limited to cells to which a fluorescent dye is directly bound, inasmuch as cells to which a fluorescently labeled antibody is bound also may be used.
- a fluorescent dye is bound to a cell surface antigen
- cells in which a fluorescent dye is bound to an antigen (cytokine or transcription factor) existing in the cytoplasm or nucleus also may be used.
- the target of fluorescent labeling is not limited to beads and cells, and may be any particle that can be fluorescently labeled.
- a droplet containing DNA or cells to which a fluorescent dye is bound may be used as the fluorescently labeled particle.
Landscapes
- Physics & Mathematics (AREA)
- Spectroscopy & Molecular Physics (AREA)
- Health & Medical Sciences (AREA)
- Chemical & Material Sciences (AREA)
- General Physics & Mathematics (AREA)
- Life Sciences & Earth Sciences (AREA)
- Immunology (AREA)
- Pathology (AREA)
- Analytical Chemistry (AREA)
- General Health & Medical Sciences (AREA)
- Biochemistry (AREA)
- Engineering & Computer Science (AREA)
- Dispersion Chemistry (AREA)
- Biomedical Technology (AREA)
- Hematology (AREA)
- Molecular Biology (AREA)
- Urology & Nephrology (AREA)
- Chemical Kinetics & Catalysis (AREA)
- Optics & Photonics (AREA)
- Nuclear Medicine, Radiotherapy & Molecular Imaging (AREA)
- Medicinal Chemistry (AREA)
- Food Science & Technology (AREA)
- Microbiology (AREA)
- Cell Biology (AREA)
- Biotechnology (AREA)
- Mathematical Physics (AREA)
- Theoretical Computer Science (AREA)
- Investigating, Analyzing Materials By Fluorescence Or Luminescence (AREA)
Abstract
Description
- This application claims priority from prior Japanese Patent Application No.
2019-132474, filed on July 18, 2019 - The present invention relates to a measuring apparatus, a measuring apparatus adjustment method, and a computer program product.
- Japanese Patent Application Publication No.
2004-205508 - This flow cytometer uses a fluorescence detector such as a photomultiplier tube (PMT) or an avalanche diode capable of amplifying the detected signal in order to detect low level fluorescence. The detection sensitivity of each fluorescence detector, that is, the degree of signal amplification, is adjusted according to the fluorescent dye to be detected so that the measured value of the fluorescence from each cell falls within the dynamic range.
- The signal amplification degree of the PMT is changed by adjusting the voltage applied to the PMT. In this flow cytometer, the PMT is set to a plurality of different applied voltages during setup, the fluorescence from the fluorescently labeled beads is measured at each applied voltage, and the linear functional relationship between the applied voltage and the output fluorescence value is experimentally determined and stored. Then, when the target fluorescence value is set for each PMT, the applied voltage that will output the target fluorescence value from the fluorescence detector is calculated using the determined functional relationship.
- In the flow cytometer of Japanese Patent Application Publication No.
2004-205508 - The present invention relates to a measuring apparatus comprising: a flow cell through which a sample containing particles flows; a light source to irradiate light on the sample flowing through the flow cell; a fluorescence detector to detect fluorescence generated from the sample irradiated with light from the light source; and a controller programmed to carry out a sensitivity adjustment comprising: causing a positive control sample containing a fluorescent dye to flow through the flow cell, obtaining a measurement value of the fluorescence generated from the positive control sample irradiated by the light from the light source via the fluorescence detector, comparing the measurement value and a reference value, and adjusting a sensitivity of the fluorescence detector according to a comparison result.
- The present invention relates to a method for adjusting measuring apparatus comprising: flowing a positive control sample containing a fluorescent dye through a flow cell; irradiating the positive control sample flowing through the flow cell with light; measuring the fluorescence generated from the positive control sample irradiated with light by a fluorescence detector to obtain a measurement value; comparing the measurement value with a reference value; and adjusting a sensitivity of the fluorescence detector according to the comparison result.
- The present invention relates to a computer program product, comprising: a computer hardware storage device having stored therein computer usable program code for adjusting a measuring apparatus, the computer usable program code, which when executed by a computer hardware system in a measuring apparatus, causes the measuring apparatus to perform: flowing a positive control sample containing a fluorescent dye through a flow cell; irradiating the positive control sample flowing through the flow cell with light; measuring the fluorescence generated from the positive control sample irradiated with light by a fluorescence detector to obtain a measurement value; comparing the measurement value with a reference value; and adjusting a sensitivity of the fluorescence detector according to the comparison result.
- According to the measuring apparatus, the method for adjusting measuring apparatus, and the computer program product of the present invention, the detection sensitivity used for detecting light from a sample can be easily adjusted.
-
-
FIG. 1 is a schematic diagram describing an outline of a sensitivity adjustment method of a fluorescence detector of a measuring apparatus; -
FIG. 2 is a block diagram for illustrating a measuring apparatus; -
FIG. 3 is a diagram for describing an optical system of the measuring apparatus; -
FIG. 4 is a flowchart describing an adjustment process of the measuring apparatus; -
FIG. 5 is a flowchart describing the sensitivity adjustment process in step S3 ofFIG. 4 ; -
FIG. 6 is a diagram showing an example of sensitivity adjustment of the measuring apparatus; -
FIG. 7 is a diagram showing a relationship between voltage and fluorescence intensity in sensitivity adjustment of the measuring apparatus; -
FIG. 8 is a diagram showing an outline of fluorescence correction of the measuring apparatus; -
FIG. 9 is a flowchart showing the fluorescence correction process of step S6 ofFIG. 5 ; -
FIG. 10 is a diagram showing an example of fluorescence correction of the measurement apparatus; and -
FIG. 11 is a block diagram showing a conventional fluorescence analyzer. - Hereinafter, embodiment will be described with reference to the drawings.
-
FIG. 1A and FIG. 1B are schematic views summarizing the sensitivity adjustment method of the fluorescence detector of the measuring apparatus. Described below is a case of measuring a positive control sample containing a bead population labeled with a predetermined amount of fluorescein isothiocyante (hereinafter, FITC bead population) in a flow cytometer provided with a PE detector for detecting the fluorescent dye phycoerythrin (hereinafter, PE) and a FITC detector for detecting the fluorescent dye fluorescein isothiocyanate (hereinafter FITC). InFIG. 1A and FIG. 1B show the dot-plotted appearance of the fluorescence intensity obtained from each bead by measuring a positive control sample containing an FITC bead population, wherein a fluorescence intensity (FL1) based on the output of the FITC detector is set on the horizontal axis, and a fluorescence intensity (FL2) based on the output of the PE detector is set on the vertical axis. As shown inFIG. 1A , the measurement result of the FITC bead population of the positive control sample is represented as ameasurement value group 61. The measuring apparatus compares a statistical value A (for example, the median value of the fluorescence intensity) of the fluorescence intensity (FL1) generated from the FITC bead population and a reference value, and adjusts the detection sensitivity of the FITC detector so that the statistical value A is substantially equal to the reference value in accordance with the comparison result, as shown inFIG. 1B . - The detection sensitivity used for detecting the light from the sample can be easily adjusted by carrying out such an adjustment method.
- The
measuring apparatus 100 will be described with reference toFIG. 2 . Themeasuring apparatus 100 is a multi-color flow cytometer. The flow cytometer optically measures a sample by a flow cytometric method. Themeasuring apparatus 100 includes anoptical system unit 200, asample preparation unit 400, avoltage application unit 50, and acontrol unit 40. - The
control unit 40 controls the operations of theoptical system unit 200, thesample preparation unit 400, and thevoltage application unit 50. Thecontrol unit 40 is a computer and includes a CPU (Central Processing Unit) 41, amemory 42, aninput unit 43, adisplay unit 44, and astorage unit 45. - The
CPU 41 performs the control process by thecontrol unit 40. Thememory 42 is used as a work area for performing the control process by theCPU 41. Thememory 42 includes a RAM (Random Access Memory). Theinput unit 43 receives instructions input from the user. Theinput unit 43 also reads the information attached to the sample container. Theinput unit 43 includes, for example, a keyboard, a mouse, and a reader such as a barcode or RFID. Thedisplay unit 44 displays the measurement result of theoptical system unit 200. Thedisplay unit 44 also displays screens for operations. Thestorage unit 45 stores a program for processing, measurement results, and information for measurement. Thestorage unit 45 is a ROM (Read Only Memory) is included. - The
sample preparation unit 400 mixes a fluorescent reagent into the sample to be measured, labels the sample with a fluorescent dye, and prepares a sample suitable for measurement by theoptical system unit 200. - The
optical system unit 200 includes aflow cell 10, alight source 20, and a plurality of detectors 30 (30a to 30p). Thedetector 30 includes alight receiving element 34 that outputs an electric signal corresponding to the intensity of the detected light, and anamplification unit 33 that amplifies the electric signal output from thelight receiving element 34. Thedetector 30 used for fluorescence detection is a photomultiplier tube (PMT), thelight receiving element 34 includes a photocathode, and theamplification unit 33 includes a dynode. - The
optical system unit 200 will be described in more detail with reference toFIG. 3 . Theoptical system unit 200 includes theflow cell 10,light sources detectors 30a to 30p. Theflow cell 10 receives the sample prepared by thesample preparation unit 400. Thelight sources 20a to 20c irradiate light on the sample passing through theflow cell 10. Thedetectors 30a to 30p detect light from the sample and output a detection signal converted into an electric signal. Thedetector 30a is a detector that detects forward scattered light, and thedetector 30b is a detector that detects side scattered light. Thedetector 30a and thedetector 30b are photodiodes. Thedetectors detectors 30c to 30p are photomultiplier tubes (PMT). Thedetectors 30c to 30p have different fluorescent dyes to be detected. The PMT includes a photocathode, a dynode, and an anode. The photoelectrons generated by the photocathode are amplified by the dynode and output from the anode. The detection sensitivity of each of thedetectors 30c to 30p is adjusted by changing the voltage applied to the dynode. That is, thelight receiving element 34 shown inFIG. 2 includes a photocathode, and theamplification unit 33 includes a dynode. Thevoltage application unit 50 applies a voltage of a designated magnitude to the dynodes of thedetectors 30c to 30p based on instruction from thecontrol unit 40. - The
light sources 20a to 20c emit light having different wavelengths. Thelight source 20a emits light having a wavelength of about 488 nm. Thelight source 20b emits light having a wavelength of about 642 nm. Thelight source 20c emits light having a wavelength of about 405 nm. The light emitted from thelight source 20a passes through acollimator lens 301a,dichroic mirrors condenser lens 302, and is applied to theflow cell 10. The light emitted from thelight source 20b is transmitted through acollimator lens 301b, reflected by thedichroic mirror 303a, transmitted through thedichroic mirror 303b, transmitted through the condensinglens 302, and emitted to theflow cell 10. The light emitted from thelight source 20c passes through acollimator lens 301c, reflected by thedichroic mirror 303b, passes through thecondenser lens 302, and is emitted to theflow cell 10. - The forward scattered light of the light originating from the sample passing through the
flow cell 10 passes through acondenser lens 304a, abeam stopper 305a, apinhole plate 305b, and abandpass filter 307a, and enters thedetector 30a. - The side scattered light and fluorescent light originating from the particles contained in the sample passing through the
flow cell 10 are condensed by acondenser lens 304b. The side scattered light incident on thedetector 30b passes throughdichroic mirrors condenser lens 304b, then is reflected by adichroic mirror 308c, passes throughdichroic mirrors bandpass filter 307b, and is incident on thedetector 30b. - The fluorescence incident on each of the
detectors 30c to 30p is divided into mutually different wavelength bands by thedichroic mirrors 308a to 308n. The fluorescence incident on thedetector 30c passes through thedichroic mirrors condenser lens 304b, then is reflected by thedichroic mirror 308c, transmitted through thedichroic mirror 308d, reflected by thedichroic mirror 308e, and transmitted through thebandpass filter 307c, whereupon the light enters thedetector 30c. The fluorescence incident on thedetector 30d passes through thedichroic mirrors condenser lens 304b, then is reflected by thedichroic mirror 308c,reflected by thedichroic mirror 308d, and transmitted through thebandpass filter 307d, whereupon the light enters thedetector 30d. - The fluorescence incident on the
detector 30e passes through thedichroic mirrors condenser lens 304b, then passes through thebandpass filter 307e, whereupon the light enters thedetector 30e. The fluorescence incident on thedetector 30f passes through thedichroic mirrors condenser lens 304b, then is reflected by thedichroic mirror 308f, reflected by thedichroic mirror 308g, transmitted through thebandpass filter 307f, whereupon the light enters thedetector 30f. - The fluorescence incident on the
detector 30g passes through thedichroic mirrors condenser lens 304b, then is reflected by thedichroic mirror 308f, passes through thedichroic mirror 308g and theband pass filter 307g, whereupon the light enters thedetector 30g. The fluorescence incident on thedetector 30h is reflected from the condensinglens 304b to thedichroic mirror 308a, transmitted through thedichroic mirror 308b, reflected by thedichroic mirror 308h, transmitted through thebandpass filter 307h, whereupon the light enters thedetector 30h. - The fluorescence incident on the
detector 30i is reflected from thecondenser lens 304b to thedichroic mirror 308a, transmitted through thedichroic mirrors dichroic mirror 308i, transmitted through thebandpass filter 307i, whereupon the light enters thedetector 30i. The fluorescence incident on thedetector 30j is reflected from thecondenser lens 304b to thedichroic mirror 308a, transmitted through thedichroic mirrors bandpass filter 307j, whereupon the light enters thedetector 30j. - The fluorescence incident to the
detector 30k is reflected from thecondenser lens 304b to thedichroic mirror 308b, transmitted through thedichroic mirror 308a, reflected by thedichroic mirror 308j, transmitted through thedichroic mirrors 308k, 3081, and thebandpass filter 307k, whereupon the light enters thedetector 30k. The fluorescence incident on the detector 301 is reflected from the condensinglens 304b to thedichroic mirror 308b, transmitted through thedichroic mirror 308a, reflected by thedichroic mirror 308j, transmitted through thedichroic mirror 308k, and reflected by the dichroic mirror 3081, passes through the pass filter 3071, whereupon the light enters the detector 301. - The fluorescence incident on the detector 30m is reflected from the
condenser lens 304b to thedichroic mirror 308b, transmitted through thedichroic mirror 308a, reflected by thedichroic mirror 308j, reflected by thedichroic mirror 308k, and transmitted through thebandpass filter 307m, whereupon the light enters the detector 30m. The fluorescence incident on thedetector 30n is reflected from thecondenser lens 304b to thedichroic mirror 308b, transmitted through thedichroic mirror 308a, transmitted through thedichroic mirrors bandpass filter 307n, whereupon the light enters thedetector 30n. - The fluorescence incident on the detector 30o is reflected from the
condenser lens 304b to thedichroic mirror 308b, transmitted through thedichroic mirror 308a, transmitted through thedichroic mirror 308j, reflected by thedichroic mirror 308m, reflected by thedichroic mirror 308n, passes through the bandpass filter 307o, whereupon the light enters the detector 30o. The fluorescence incident on thedetector 30p is reflected from thecondenser lens 304b to thedichroic mirror 308b, transmitted through thedichroic mirror 308a, transmitted through thedichroic mirror 308j, reflected by thedichroic mirror 308m, transmitted through thedichroic mirror 308n, and transmitted through thebandpass filter 307p, whereupon the light enters thedetector 30p. - The respective detection signals output from the
detectors 30a to 30p are transmitted to thecontrol unit 40, thecontrol unit 40 acquires parameters such as light intensity from the detection signals, and the sample is analyzed based on the acquired parameters. - The number of
light sources 20 may be one, two, or four or more. Preferably, the flow cytometer is equipped with at least threelight sources 20. Thelight source 20 is selected according to the wavelength range of the light originating from the sample. When there are two or morelight sources 20, theselight sources 20 preferably emit light having different peak wavelengths. - The number of photodiodes, dichroic mirrors, and bandpass filters may be changed according to the number of peak wavelengths of light originating from the sample. The types of photodiode, dichroic mirror, and bandpass filter may also be selected according to the peak wavelength or wavelength region of light originating from the sample and the fluorescence intensity.
- The
control unit 40 controls theoptical system unit 200 to obtain and store appropriate optical information according to the antigen based on information relating to detection sensitivity when thedetector 30 detects scattered light or fluorescence, information relating to fluorescence correction according to a combination of detected fluorescences, and information relating to gating for selecting a distribution region of a sample to be detected. - The adjustment process of the measuring
apparatus 100 will be described with reference toFIG. 4 . - First, the process will be described for adjusting the detection sensitivity of the fluorescence detector (30c, 30d, 30e, 30f, 30g, 30h, 30i, 30j, 30k, 301, 30m, 30n, 30o, and 30p) by the
control unit 40 of the measuringapparatus 100. In the adjustment of the detection sensitivity, the detection sensitivity of each fluorescence detector is adjusted so that particles labeled with a fluorescent dye and unlabeled particles are reliably separated in the fluorescence measurement at a specific wavelength. Here, the sensitivity adjustment in the case of performing multi-color analysis by combining FITC and PE will be described by way of an example. The fluorescence of FITC is detected by thefluorescence detector 30c, and the fluorescence of PE is detected by thefluorescence detector 30d. - In step S1 of
FIG. 4 , thecontrol unit 40 sets the reference value of the fluorescence intensity, which is the target of sensitivity adjustment, and the upper limit value and lower limit value of the voltage (hereinafter, PMT voltage) applied to thefluorescence detector 30c for theFITC fluorescence detector 30c. The reference value is a value at which the fluorescence intensity obtained from a positive control sample containing a bead population labeled with a predetermined amount of FITC is sufficiently higher than the fluorescence intensity from a negative control sample containing an unlabeled bead population. However, if the reference value is increased, the amplification factor of the noise signal also increases, so the setting is made within a range in which the effect of the amplified noise signal is small. The reference value is input by the user via theinput unit 43. - The
control unit 40 sets the PMT voltage such that a measurement value larger than the input reference value is output from thefluorescence detector 30c, as the initial value of the upper limit value. Thecontrol unit 40 also sets the PMT voltage such that a measurement value smaller than the input reference value is output from thefluorescence detector 30c, as the initial value of the lower limit value. In step S2, thecontrol unit 40 performs controls to start supplying the positive control sample to theflow cell 10. - In step S3, the
control unit 40 adjusts the detection sensitivity of thefluorescence detector 30c by adjusting the applied voltage (PMT voltage) to thefluorescence detector 30c for FITC. - The process of step S3 of
FIG. 4 will be described with reference toFIG. 5 . - In step S11 of
FIG. 5 , thecontrol unit 40 sets the median value of the upper limit value and the lower limit value as the PMT voltage of thefluorescence detector 30c, and measures the positive control sample. In this way the statistical value A of the fluorescence intensity obtained from the FITC bead population contained in the positive control sample is acquired. The median value of the fluorescence intensity obtained from each bead of the bead population is used as the statistical value A. In step S12, thecontrol unit 40 compares the statistical value A with the reference value and determines whether the statistical value A is substantially equal to the reference value. That is, thecontrol unit 40 determines whether the difference between the statistical value A and the reference value is within a predetermined range. When the difference between the statistical value A and the reference value is within the predetermined range, the process proceeds to step S13, whereas the process proceeds to step S14 when the difference between the statistical value A and the reference value is not within the predetermined range. - In step S13, the
control unit 40 sets the PMT voltage at the time of obtaining the statistical value A as the PMT voltage after the sensitivity adjustment. Thereafter, the routine returns to the flowchart ofFIG. 4 . In step S14, thecontrol unit 40 determines whether the statistical value A is smaller than the reference value. When the statistical value A is less than the reference value, the process proceeds to step S15, whereas the process proceeds to step S16 when the statistical value A is greater than the reference value. - In step S15, the
control unit 40 changes the current PMT voltage (the median value of the upper limit value and the lower limit value set in step S1 ofFIG. 4 ) to the lower limit value of the PMT voltage. Thereafter, the routine returns to step S11. In step S16, thecontrol unit 40 changes the current PMT voltage (the median value of the upper limit value and the lower limit value) to the upper limit value of the PMT voltage. Thereafter, the routine returns to step S11. - The sensitivity adjustment will be described in more detail with reference to
FIGS. 6 and7 . The horizontal axis shows the fluorescence intensity (FL1) based on the output of theFITC fluorescence detector 30c, and the vertical axis shows the fluorescence intensity (FL2) based on the output of thePE fluorescence detector 30d. The measurement results of the FITC beads, which are the positive control beads, appeared as shown in themeasurement value group 61. Hereinafter, an example in which the initial value of the lower limit value of the PMT voltage set in step S1 ofFIG. 4 is 100 V and the initial value of the upper limit value is 1000 V will be described. - First, as shown in
FIG. 7 , the fluorescence intensity (FL1) of the positive control sample was measured by the median value VC1 (550V) of the lower limit value VL1 (100V) and the upper limit value VH1 (1000V) of the PMT voltage. As shown inFIG. 6A , when the PMT voltage is measured at 550 V, the statistical value A1 of themeasurement value group 61 is smaller than the reference value, so the PMT voltage (550 V) used for the measurement is set to the next lower limit value. - Next, as shown in
FIG. 7 , the fluorescence intensity (FL1) of the positive control sample was measured by the updated lower limit value VL2 (550V) of the PMT voltage and the median value VC2 (775V) of the upper limit value VH2 (1000V). As shown inFIG. 6B , when the PMT voltage is measured at 775 V, the statistical value A2 of themeasurement value group 61 is smaller than the reference value, so the PMT voltage (775 V) used for the measurement is set to the next lower limit value. - Next, as shown in
FIG. 7 , the fluorescence intensity (FL1) of the positive control sample was measured by the updated lower limit value VL3 (775 V) of the PMT voltage and the median value VC3 (887 V) of the upper limit value VH3 (1000 V). As shown inFIG. 6C , when the PMT voltage is 887 V, the statistical value A3 of themeasurement value group 61 is larger than the reference value, so the PMT voltage (887 V) used for the measurement is set to the next upper limit value. - Next, as shown in
FIG. 7 , the fluorescence intensity (FL1) of the positive control sample was measured by the updated lower limit value VL4 (775 V) of the PMT voltage and the median value VC4 (831 V) of the upper limit value VH4 (887 V). As shown inFIG. 6D , when the PMT voltage is 831V, the statistical value A4 of themeasurement value group 61 is larger than the reference value, so the PMT voltage (831V) used for the measurement is set to the next upper limit value. - Next, as shown in
FIG. 7 , the fluorescence intensity (FL1) of the positive control sample was measured by the updated PMT voltage lower limit value VL5 (775 V) and the upper limit value VH5 (831 V) median value VC5 (803 V). As shown inFIG. 6E , when the PMT voltage is 803 V, the statistical value A5 of themeasurement value group 61 is substantially equal to the reference value. In this way the sensitivity adjustment ends, and the process proceeds to step S4 in the flowchart ofFIG. 4 . Note that, in this embodiment, the condition that the statistical value A is substantially equal to the reference value is such that the difference between them is less than 5% of the reference value. - Note that, in the present embodiment, a binary search is used to search for the PMT voltage that matches the reference value. By the binary search method, it is possible quickly to search for an applied voltage that meets the conditions while narrowing the search range. As a result, the time it takes time to adjust the detection sensitivity of the fluorescence detector can be reduced. The search method also may be another search method. For example, the search method also may be linear search or bidirectional search.
- Although the median value is used as the statistical value A, the mode value or the average value also may be used as the statistical value A.
- Next, in step S4 of the flowchart of
FIG. 4 , thecontrol unit 40 performs control for ending the supply of the positive control sample to the flow cell. - Next, in step S5, the
control unit 40 measures the statistical value A of the fluorescence intensity of the FITC bead population in the positive control sample by theFITC fluorescence detector 30c after the detection sensitivity adjustment, measures the statistical value B of the fluorescence intensity of the FITC bead population in the same positive control sample by thePE fluorescence detector 30d after the detection sensitivity adjustment, measures the statistical value C of the fluorescence intensity of the bead population in the negative control sample by thePE fluorescence detector 30d after detection sensitivity adjustment, and stores the statistical values A, B, and C in thestorage unit 45. These values are used in the fluorescence correction process in step S6. In this measurement, a mixed sample of the positive control sample and the negative control sample is supplied to theflow cell 10. - Next, in step S6, the
control unit 40 performs a fluorescence correction process. - In a multi-color flow cytometer, a sample is multi-stained and fluorescences emitted from the plurality of fluorescent dyes is simultaneously detected. Since the fluorescence of each of the fluorescent dyes has a spectrum, the fluorescence emitted from the fluorescent dyes other than the fluorescent dye bound to the target molecule also may leak even when the fluorescent dyes are separated for each wavelength range by an optical system.
- In the example shown in
FIG. 8 , a case where two fluorescences of the fluorescent dye F1 and the fluorescent dye F2 leak into each other will be considered. The fluorescent dye F1 is measured by detecting light in the wavelength range FL1. The fluorescent dye F2 is measured by detecting the light in the wavelength range FL2. Apart of the fluorescence of the fluorescent dye F1 is included in the wavelength range FL2. Apart of the fluorescence of the fluorescent dye F2 also is included in the wavelength range FL1. Therefore, the light from the fluorescent dye F1 can be detected by excluding the light from the fluorescent dye F2 in the detection of the light in the wavelength range FL1. The light of the fluorescent dye F2 also can be detected by excluding the light of the fluorescent dye F1 in the detection of the light in the wavelength range FL2. - The process of step S6 of
FIG. 4 will be described with reference toFIG. 9 . Here, a case will be described in which a fluorescence correction value for subtracting the fluorescence from FITC leaking into the fluorescence detector for PE is calculated. - In step S21 of
FIG. 9 , thecontrol unit 40 reads and stores the statistical values A, B, and C acquired in step S5 ofFIG. 4 , that is, statistic value A of the fluorescence intensity of the FITC bead population in the positive control sample measured by theFITC fluorescence detector 30c after detection sensitivity adjustment, statistic value B of the fluorescence intensity of the FITC bead population in the same positive control sample measured byPE fluorescence detector 30d after detection sensitivity adjustment, and statistical value C of fluorescence intensity of the bead population in the negative control sample measured byPE fluorescence detector 30d after detection sensitivity adjustment. - Here, the relationship matrix of the fluorescence correction can be expressed as shown in Expression (1).
-
Expression 1
- tS21: Correction value for correcting leakage into the PE fluorescence detector by the FITC (correction value set last time or correction value initially set by user) tS12: Correction value for correcting leakage of PE into the fluorescence detector for FITC (correction value set last time or correction value initially set by the user)
- tFL1: Value regarded as true fluorescence intensity from FITC
- tFL2: value regarded as true fluorescence intensity from PE
- PMT1: Actual measurement value by the FITC fluorescence detector
- PMT2: Actual measurement value by the PE fluorescence detector
- Assuming that the fluorescence leakage has been removed by correction value tS21, the statistical value A is substituted into tFL1 and the statistical value B is substituted into tFL2. The actual measurement value PMT2 from Expression (1) is expressed as Expression (2).
-
Expression 2
- In the case of the optimum fluorescence correction value, the relation matrix can be expressed as in Expression (3).
-
Expression 3
- S21: Correction value for correcting leakage of FITC into the PE fluorescence detector
- S12: Correction value for correcting leakage of PE into the FITC fluorescence detector
- FL1: True fluorescence intensity from FITC
- FL2: True fluorescence intensity from PE
- PMT1: Actual measurement value by the FITC fluorescence detector
- PMT2: Actual measurement value by the PE fluorescence detector
- In this case, there is no difference between the fluorescence intensity from the FITC bead population in the positive control sample measured by the PE fluorescence detector and the fluorescence intensity from the bead population in the negative control sample, hence, B=C. Then, the actual measurement value PMT2 from Expression (3) is expressed as Expression (4).
- Expression 4

- In Expressions (2) and (4), the measured values PMT2 are equal such that Expression (5) is derived.
- Expression 5

- Then, Expression (6) can be derived from Expression (5).
- Expression 6

- Note that when setting the fluorescence correction value for the first time, tS21=0. Therefore, S21=(BC)/A. This S21 value of is used as tS21 at the next calculation.
- In step S22, the
control unit 40 confirms the history of the correction value tS21 calculated using the same type of positive control sample and negative control sample or the correction value tS 2 1 initially set by the user. When there is no history of the correction value tS21 and correction value tS21 initially set by the user, the routine proceeds to step S23. On the other hand, when there is a history of the correction value tS21 or correction value tS21 initially set by the user, the routine proceeds to step S24. - In step S23, the
control unit 40 calculates the correction value S21 to subtract the fluorescence from FITC value S for subtracting from FITC the fluorescence leaking into the fluorescence the PE fluorescence detector based on the above-mentioned statistical value A, statistical value B, and statistical value C. In step S24, thecontrol unit 40 calculates a new correction value tS21 based on the correction value tS21 stored in thestorage unit 45, and the statistical value A, the statistical value B, and the statistical value C. - As described above, in the fluorescence correction of subtracting the fluorescence from FITC for the
PE fluorescence detector 30d, thecontrol unit 40 calculates the correction value S21 based on the value (B-C) related to the statistical value B of fluorescence intensity from the FITC bead population in the positive control sample measured by thePE fluorescence detector 30d, and the statistical value C of the fluorescence intensity from the bead population in the negative control sample. - In the above fluorescence correction, the
control unit 40 calculates the correction value S21 by accounting for the fluorescence intensity from the FITC bead population in the positive control sample measured by the FITC fluorescence detector. - Note that although the negative control is used to obtain the statistical value C in the present embodiment, the correction value S21 also may be calculated with the statistical value C set as C=0 without using the negative control.
- The
controller 40 stores the calculated correction value S21 in thestorage unit 45. In this way the calculated correction value S21 may easily be used in the calculation of the correction value S21 or measuring the sample. - In step S25, the
control unit 40 corrects statistical value B using the correction value S21 as shown inFIGS. 10A and 10B . Then, the process proceeds to step S7 in the flowchart ofFIG. 4 . - In step S7, the
control unit 40 stores the detection sensitivity of each fluorescence detector whose detection sensitivity has been adjusted in thestorage unit 45. Thecontrol unit 40 sets the detection sensitivity of the fluorescence detector to the detection sensitivity stored in thestorage unit 45 when measuring the sample collected from the subject. - In step S8, the
control unit 40 displays on the display unit 44 a distribution chart (for example, the distribution chart shown inFIG. 6E ) with the fluorescence intensity (FL1) and the fluorescence intensity (FL2) after detection sensitivity adjustment and fluorescence correction plotted as axes. In this way the user can check the distribution map to easily determine whether the calculation of the correction value S21 and the sensitivity adjustment of the fluorescence detector has been performed correctly. - The measuring
apparatus 100 also is configured to accept manual correction of the detection sensitivity and correction value S21. For example, while the user is checking the distribution map, an operation can be performed to adjust the correction value S21 and the like. This allows the user to check the distribution map and correct the detection sensitivity and the correction value S21 more precisely so that the detection sensitivity and the correction value S21 can be more accurately set. - Note that the embodiment disclosed this time are examples in all respects and not restrictive. The scope of the present invention is not restricted by the above description of the embodiment but by the scope of the claims, and includes meanings equivalent to the scope of the claims and all modifications (exemplary examples) therein.
- For example, in the above embodiment, after the supply of the positive control is started in step S2 of the flowchart shown in
FIG. 4 and the sensitivity control is completed in step S3, the supply of the positive control is terminated in step S4, and a mixture of the positive control and a negative control is supplied. The present invention is not limited to this sequence inasmuch as the supply of the mixed solution of the positive control and the negative control may be started in step S2, and the supply of the mixed solution may be terminated after the sensitivity adjustment processing of step S3 and the fluorescence correction processing of step S6 are completed. In this way the number of times the user supplies the control sample to the measuring apparatus can be reduced, and the adjustment work can be further simplified. - Although PMTs are used as the
detectors 30c to 30p for detecting fluorescence in the above embodiment, avalanche photodiodes also may be used. - Although the detection sensitivity is adjusted by adjusting the voltage applied to the dynode of the PMT, the electric signal output from the detector also may be amplified by an amplifier circuit, or the electric signal output from the detector may be digitized and amplified by the
control unit 40. - The sample to be measured by the measuring
apparatus 100 is not limited to a sample containing cells collected from a subject, and may be a sample containing particles such as microorganisms, animal cells, plant cells, pollen, plankton, and the like. - Although a sample containing fluorescence-labeled beads is used as a positive control sample used for detection sensitivity adjustment, any sample that emits fluorescence may be used, for example, a measurement sample containing fluorescence-labeled cells may be used as a positive control sample. Moreover, the beads labeled with a fluorescent dye are not limited to the beads to which a fluorescent dye is directly bound, inasmuch as beads to which a fluorescent labeled antibody is bound also may be used. Beads with a fluorescent dye embedded therein also may be used. Similarly, the fluorescently labeled cells are not limited to cells to which a fluorescent dye is directly bound, inasmuch as cells to which a fluorescently labeled antibody is bound also may be used. Not only cells in which a fluorescent dye is bound to a cell surface antigen, but cells in which a fluorescent dye is bound to an antigen (cytokine or transcription factor) existing in the cytoplasm or nucleus also may be used. The target of fluorescent labeling is not limited to beads and cells, and may be any particle that can be fluorescently labeled. For example, a droplet containing DNA or cells to which a fluorescent dye is bound may be used as the fluorescently labeled particle.
Claims (15)
- A measuring apparatus comprising:a flow cell through which a sample containing particles flows;a light source to irradiate light on the sample flowing through the flow cell;a fluorescence detector to detect fluorescence generated from the sample irradiated with light from the light source; anda controller programmed to carry out a sensitivity adjustment comprising: causing a positive control sample containing a fluorescent dye to flow through the flow cell, obtaining a measurement value of the fluorescence generated from the positive control sample irradiated by the light from the light source via the fluorescence detector, comparing the measurement value and a reference value, and adjusting a sensitivity of the fluorescence detector according to a comparison result.
- The measuring apparatus according to claim 1, wherein
the controller repeats the sensitivity adjustment until the comparison result between the measurement value and the reference value satisfies a condition. - The measuring apparatus according to claim 2, wherein
the controller determines that the comparison result satisfies the condition when a difference between the measured value and the reference value is smaller than a threshold value. - The measuring apparatus according to any one of claims 1 to 3, whereinthe controller obtains, in the sensitivity adjustment, a measurement value of the fluorescence generated from the positive control sample by the fluorescence detector with a first detection sensitivity, andin response to the comparison result not satisfying a condition, the controller obtains the measurement value of the fluorescence generated from the positive control sample by the fluorescence detector with a second detection sensitivity that brings the measurement value closer to the reference value than when using the first detection sensitivity according to the detection result, and compares the measurement value and the reference value.
- The measuring apparatus according to any one of claims 2 to 4, wherein
the controller adjusts the sensitivity of the fluorescence detector by using a search method. - The measuring apparatus according to any one of claims 1 to 5, whereinthe positive control sample contains a plurality of particles labeled with a fluorescent dye; andthe controller obtains a value of the fluorescence generated from each particle in the positive control sample by the fluorescence detector to obtain, as the measurement value of the positive control sample, a statistical value calculated over the values of respective particles, and compares the statistical value with the reference value.
- The measuring apparatus according to claim 6, wherein the statistical value is a median value, a mode value, or an average value of measured values obtained from each particle in the positive control sample.
- The measuring apparatus according to any one of claims 1 to 7, wherein
the controller adjusts the sensitivity of the fluorescence detector by controlling a voltage applied to the fluorescence detector. - The measuring apparatus according to claim 8, whereinthe controller applies a voltage within a range defined with an upper limit and a lower limit to the fluorescence detector, and lowers the upper limit in response to the measurement value being higher than the reference value and raises the lower limit in response to the measurement value being lower than the reference value, whereinthe controller repeats lowering and raising the upper and lower limits until the difference between the measurement value and the reference value is smaller than a threshold value.
- The measuring apparatus according to any one of claims 1 to 9, wherein
the controller adjusts the sensitivity of the fluorescence detector by switching the detection sensitivity of the fluorescence detector while the positive control sample is flowing through the flow cell. - The measuring apparatus according to any one of claims 1 to 10, whereinthe flow cell is configured to flow the sample containing particles that are multiply stained with the fluorescent dye and another fluorescent dye; andthe controller causes another positive control sample containing the other fluorescent dye to flow through the flow cell after adjusting the sensitivity of the fluorescence detector, obtains a measurement value of the fluorescence generated from the other positive control sample irradiated by the light source via the fluorescence detector, and determines a correction value for correcting leakage into the fluorescence detector due to fluorescence from the other fluorescent dye based on the measurement value.
- The measuring apparatus according to claim 11, wherein
the controller causes a negative control sample free of fluorescent dye to flow through the flow cell after adjusting the sensitivity of the fluorescence detector, obtains a measurement value of the fluorescence generated from the negative control sample irradiated by light from the light source via the fluorescence detector, and determines the correction value based on a measurement value obtained from a negative control sample and the measurement value obtained from the other positive control sample. - The measuring apparatus according to claim 12, wherein
the controller causes a mixed sample of the negative control sample and the other positive control sample to flow through the flow cell. - A method for adjusting measuring apparatus comprising:flowing a positive control sample containing a fluorescent dye through a flow cell;irradiating the positive control sample flowing through the flow cell with light;measuring the fluorescence generated from the positive control sample irradiated with light by a fluorescence detector to obtain a measurement value;comparing the measurement value with a reference value; andadjusting a sensitivity of the fluorescence detector according to the comparison result.
- A computer program product, comprising:a computer hardware storage device having stored therein computer usable program code for adjusting a measuring apparatus,the computer usable program code, which when executed by a computer hardware system in a measuring apparatus, causes the measuring apparatus to perform:flowing a positive control sample containing a fluorescent dye through a flow cell;irradiating the positive control sample flowing through the flow cell with light;measuring the fluorescence generated from the positive control sample irradiated with light by a fluorescence detector to obtain a measurement value;comparing the measurement value with a reference value; andadjusting a sensitivity of the fluorescence detector according to the comparison result.
Applications Claiming Priority (1)
| Application Number | Priority Date | Filing Date | Title |
|---|---|---|---|
| JP2019132474A JP7347979B2 (en) | 2019-07-18 | 2019-07-18 | Measuring device, measuring device adjustment method and program |
Publications (2)
| Publication Number | Publication Date |
|---|---|
| EP3767283A1 true EP3767283A1 (en) | 2021-01-20 |
| EP3767283B1 EP3767283B1 (en) | 2025-06-18 |
Family
ID=71620285
Family Applications (1)
| Application Number | Title | Priority Date | Filing Date |
|---|---|---|---|
| EP20185928.7A Active EP3767283B1 (en) | 2019-07-18 | 2020-07-15 | Measuring apparatus, measuring apparatus adjustment method and computer program product |
Country Status (4)
| Country | Link |
|---|---|
| US (1) | US11598724B2 (en) |
| EP (1) | EP3767283B1 (en) |
| JP (1) | JP7347979B2 (en) |
| CN (1) | CN112240863B (en) |
Families Citing this family (6)
| Publication number | Priority date | Publication date | Assignee | Title |
|---|---|---|---|---|
| JP7352340B2 (en) * | 2018-09-28 | 2023-09-28 | シスメックス株式会社 | Measuring device and accuracy control method |
| JP7057926B1 (en) * | 2021-03-26 | 2022-04-21 | 株式会社汀線科学研究所 | Fluorescence measuring device |
| WO2022264539A1 (en) * | 2021-06-17 | 2022-12-22 | ソニーグループ株式会社 | Information processing system, information processing method, and fluorescent substance structure |
| GB202113627D0 (en) * | 2021-09-24 | 2021-11-10 | Stratec Se | Adaptive light barrier processing |
| CN114624431B (en) * | 2022-05-11 | 2022-10-18 | 深圳市帝迈生物技术有限公司 | Immunoassay analyzer and correction method thereof |
| CN120883042A (en) * | 2023-03-02 | 2025-10-31 | 贝克曼库尔特有限公司 | QC Granules and Usage Instructions |
Citations (3)
| Publication number | Priority date | Publication date | Assignee | Title |
|---|---|---|---|---|
| JP2004205508A (en) | 2002-12-20 | 2004-07-22 | Becton Dickinson & Co | Fluorescence analyzer and fluorescence analysis method |
| EP1851545A2 (en) * | 2005-02-25 | 2007-11-07 | Dako Denmark A/S | Cell counting |
| US20100256943A1 (en) * | 2009-04-06 | 2010-10-07 | University Of Pittsburgh - Of The Commonwealth System Of Higher Education | Configuration of initial control parameters in photodetectors for multi-color flow cytometry |
Family Cites Families (12)
| Publication number | Priority date | Publication date | Assignee | Title |
|---|---|---|---|---|
| JP4660694B2 (en) * | 2005-06-28 | 2011-03-30 | コニカミノルタセンシング株式会社 | Spectrometer wavelength calibration method and spectrometer |
| JP4887319B2 (en) * | 2008-03-17 | 2012-02-29 | 株式会社日立ハイテクノロジーズ | Analysis system using automatic analyzer and photomultiplier tube |
| JP5251729B2 (en) * | 2008-06-20 | 2013-07-31 | 株式会社島津製作所 | Spectrophotometer |
| US8415161B2 (en) | 2008-11-13 | 2013-04-09 | Becton, Dickinson And Company | Instrument setup system for a fluorescence analyzer |
| JP5529505B2 (en) | 2008-11-13 | 2014-06-25 | ベクトン・ディキンソン・アンド・カンパニー | Instrument setup system for fluorescence analyzer |
| JP5985140B2 (en) * | 2010-04-28 | 2016-09-06 | ソニー株式会社 | Fluorescence intensity correction method, fluorescence intensity calculation method, and fluorescence intensity calculation apparatus |
| JP5433517B2 (en) * | 2010-07-14 | 2014-03-05 | 株式会社日立ハイテクノロジーズ | Analysis apparatus and analysis method |
| JP5772425B2 (en) * | 2011-09-13 | 2015-09-02 | ソニー株式会社 | Fine particle measuring device |
| JP6264152B2 (en) * | 2014-03-31 | 2018-01-24 | 日立金属株式会社 | Mass flow meter and mass flow controller using the mass flow meter |
| CN106644901A (en) * | 2015-10-14 | 2017-05-10 | 北京信息科技大学 | Fluorescence compensation method for flow cytometer |
| JP6719203B2 (en) * | 2015-12-25 | 2020-07-08 | リオン株式会社 | Method for calibrating biological particle counter and apparatus for calibrating biological particle counter |
| EP3680645B1 (en) | 2017-09-08 | 2025-05-07 | Sony Group Corporation | Microparticle measurement device, information processing device, and information processing method |
-
2019
- 2019-07-18 JP JP2019132474A patent/JP7347979B2/en active Active
-
2020
- 2020-07-15 EP EP20185928.7A patent/EP3767283B1/en active Active
- 2020-07-17 US US16/931,672 patent/US11598724B2/en active Active
- 2020-07-17 CN CN202010693205.8A patent/CN112240863B/en active Active
Patent Citations (3)
| Publication number | Priority date | Publication date | Assignee | Title |
|---|---|---|---|---|
| JP2004205508A (en) | 2002-12-20 | 2004-07-22 | Becton Dickinson & Co | Fluorescence analyzer and fluorescence analysis method |
| EP1851545A2 (en) * | 2005-02-25 | 2007-11-07 | Dako Denmark A/S | Cell counting |
| US20100256943A1 (en) * | 2009-04-06 | 2010-10-07 | University Of Pittsburgh - Of The Commonwealth System Of Higher Education | Configuration of initial control parameters in photodetectors for multi-color flow cytometry |
Also Published As
| Publication number | Publication date |
|---|---|
| CN112240863A (en) | 2021-01-19 |
| EP3767283B1 (en) | 2025-06-18 |
| US11598724B2 (en) | 2023-03-07 |
| JP7347979B2 (en) | 2023-09-20 |
| CN112240863B (en) | 2025-03-14 |
| JP2021018090A (en) | 2021-02-15 |
| US20210018438A1 (en) | 2021-01-21 |
Similar Documents
| Publication | Publication Date | Title |
|---|---|---|
| EP3767283B1 (en) | Measuring apparatus, measuring apparatus adjustment method and computer program product | |
| JP4389991B2 (en) | Method and apparatus for optical measurement of fine particles | |
| USRE49543E1 (en) | Fine particle measuring apparatus | |
| JP5540952B2 (en) | Fluorescence intensity correction method and fluorescence intensity calculation apparatus | |
| US20100256943A1 (en) | Configuration of initial control parameters in photodetectors for multi-color flow cytometry | |
| US20250347613A1 (en) | Particle analysis system and particle analysis method | |
| JP7010293B2 (en) | Information processing equipment, information processing methods and programs | |
| JP6708983B2 (en) | Microparticle measuring device, information processing device and information processing method | |
| JP2025508346A (en) | Method and system for identifying a fluorochrome panel - Patents.com | |
| US20240280468A1 (en) | Biological sample analyzer | |
| US12510476B2 (en) | Particle analysis system, information processing method, and program | |
| WO2022270009A1 (en) | Biological sample analysis device | |
| JP2021063664A (en) | Information processing device, particle measurement device, information processing method, particle measurement method, and computer program | |
| US20260140053A1 (en) | Particle analysis system, information processing method, and program | |
| US20250334519A1 (en) | Information processing device and information processing system | |
| US20250180461A1 (en) | Biological sample analysis system, method for setting light data acquisition section in biological sample analysis system, and information processing device | |
| Maciorowski | Multicolor Flow Cytometry and Panel Design | |
| CN121231809A (en) | Methods and systems for determining the velocity of flow at location. | |
| WO2024111263A1 (en) | Biological sample analysis device, biological sample analysis system, and method for verifying status of biological sample analysis device | |
| WO2025068668A1 (en) | Single-molecule fluorescence detection system and method | |
| CN120334184A (en) | Method and system for spectrally resolving sample fluorophores via generalized least squares | |
| CN120457328A (en) | Biological sample analyzer, biological sample analysis system, and method for verifying status of biological sample analyzer | |
| HK1118337B (en) | Methods for altering one or more parameters of a measurement system | |
| HK1118337A1 (en) | Methods for altering one or more parameters of a measurement system |
Legal Events
| Date | Code | Title | Description |
|---|---|---|---|
| PUAI | Public reference made under article 153(3) epc to a published international application that has entered the european phase |
Free format text: ORIGINAL CODE: 0009012 |
|
| STAA | Information on the status of an ep patent application or granted ep patent |
Free format text: STATUS: THE APPLICATION HAS BEEN PUBLISHED |
|
| AK | Designated contracting states |
Kind code of ref document: A1 Designated state(s): AL AT BE BG CH CY CZ DE DK EE ES FI FR GB GR HR HU IE IS IT LI LT LU LV MC MK MT NL NO PL PT RO RS SE SI SK SM TR |
|
| AX | Request for extension of the european patent |
Extension state: BA ME |
|
| STAA | Information on the status of an ep patent application or granted ep patent |
Free format text: STATUS: REQUEST FOR EXAMINATION WAS MADE |
|
| 17P | Request for examination filed |
Effective date: 20210720 |
|
| RBV | Designated contracting states (corrected) |
Designated state(s): AL AT BE BG CH CY CZ DE DK EE ES FI FR GB GR HR HU IE IS IT LI LT LU LV MC MK MT NL NO PL PT RO RS SE SI SK SM TR |
|
| STAA | Information on the status of an ep patent application or granted ep patent |
Free format text: STATUS: EXAMINATION IS IN PROGRESS |
|
| 17Q | First examination report despatched |
Effective date: 20230216 |
|
| GRAP | Despatch of communication of intention to grant a patent |
Free format text: ORIGINAL CODE: EPIDOSNIGR1 |
|
| STAA | Information on the status of an ep patent application or granted ep patent |
Free format text: STATUS: GRANT OF PATENT IS INTENDED |
|
| RIC1 | Information provided on ipc code assigned before grant |
Ipc: G01N 21/53 20060101ALN20241212BHEP Ipc: G01N 33/58 20060101ALI20241212BHEP Ipc: G01N 15/14 20060101ALI20241212BHEP Ipc: G01N 15/10 20060101ALI20241212BHEP Ipc: G01J 3/44 20060101ALI20241212BHEP Ipc: G01J 3/36 20060101ALI20241212BHEP Ipc: G01J 3/28 20060101ALI20241212BHEP Ipc: G01N 21/27 20060101ALI20241212BHEP Ipc: G01N 21/64 20060101AFI20241212BHEP |
|
| INTG | Intention to grant announced |
Effective date: 20250110 |
|
| GRAS | Grant fee paid |
Free format text: ORIGINAL CODE: EPIDOSNIGR3 |
|
| GRAA | (expected) grant |
Free format text: ORIGINAL CODE: 0009210 |
|
| STAA | Information on the status of an ep patent application or granted ep patent |
Free format text: STATUS: THE PATENT HAS BEEN GRANTED |
|
| AK | Designated contracting states |
Kind code of ref document: B1 Designated state(s): AL AT BE BG CH CY CZ DE DK EE ES FI FR GB GR HR HU IE IS IT LI LT LU LV MC MK MT NL NO PL PT RO RS SE SI SK SM TR |
|
| REG | Reference to a national code |
Ref country code: GB Ref legal event code: FG4D |
|
| REG | Reference to a national code |
Ref country code: CH Ref legal event code: EP |
|
| REG | Reference to a national code |
Ref country code: DE Ref legal event code: R096 Ref document number: 602020052829 Country of ref document: DE |
|
| REG | Reference to a national code |
Ref country code: CH Ref legal event code: EP |
|
| REG | Reference to a national code |
Ref country code: IE Ref legal event code: FG4D |
|
| PG25 | Lapsed in a contracting state [announced via postgrant information from national office to epo] |
Ref country code: FI Free format text: LAPSE BECAUSE OF FAILURE TO SUBMIT A TRANSLATION OF THE DESCRIPTION OR TO PAY THE FEE WITHIN THE PRESCRIBED TIME-LIMIT Effective date: 20250618 |
|
| PGFP | Annual fee paid to national office [announced via postgrant information from national office to epo] |
Ref country code: DE Payment date: 20250728 Year of fee payment: 6 |
|
| REG | Reference to a national code |
Ref country code: LT Ref legal event code: MG9D |
|
| PG25 | Lapsed in a contracting state [announced via postgrant information from national office to epo] |
Ref country code: NO Free format text: LAPSE BECAUSE OF FAILURE TO SUBMIT A TRANSLATION OF THE DESCRIPTION OR TO PAY THE FEE WITHIN THE PRESCRIBED TIME-LIMIT Effective date: 20250918 Ref country code: GR Free format text: LAPSE BECAUSE OF FAILURE TO SUBMIT A TRANSLATION OF THE DESCRIPTION OR TO PAY THE FEE WITHIN THE PRESCRIBED TIME-LIMIT Effective date: 20250919 |
|
| PG25 | Lapsed in a contracting state [announced via postgrant information from national office to epo] |
Ref country code: BG Free format text: LAPSE BECAUSE OF FAILURE TO SUBMIT A TRANSLATION OF THE DESCRIPTION OR TO PAY THE FEE WITHIN THE PRESCRIBED TIME-LIMIT Effective date: 20250618 |
|
| PGFP | Annual fee paid to national office [announced via postgrant information from national office to epo] |
Ref country code: GB Payment date: 20250728 Year of fee payment: 6 |
|
| PG25 | Lapsed in a contracting state [announced via postgrant information from national office to epo] |
Ref country code: HR Free format text: LAPSE BECAUSE OF FAILURE TO SUBMIT A TRANSLATION OF THE DESCRIPTION OR TO PAY THE FEE WITHIN THE PRESCRIBED TIME-LIMIT Effective date: 20250618 |
|
| PGFP | Annual fee paid to national office [announced via postgrant information from national office to epo] |
Ref country code: FR Payment date: 20250728 Year of fee payment: 6 |
|
| PG25 | Lapsed in a contracting state [announced via postgrant information from national office to epo] |
Ref country code: RS Free format text: LAPSE BECAUSE OF FAILURE TO SUBMIT A TRANSLATION OF THE DESCRIPTION OR TO PAY THE FEE WITHIN THE PRESCRIBED TIME-LIMIT Effective date: 20250918 |
|
| REG | Reference to a national code |
Ref country code: NL Ref legal event code: MP Effective date: 20250618 |
|
| PG25 | Lapsed in a contracting state [announced via postgrant information from national office to epo] |
Ref country code: LV Free format text: LAPSE BECAUSE OF FAILURE TO SUBMIT A TRANSLATION OF THE DESCRIPTION OR TO PAY THE FEE WITHIN THE PRESCRIBED TIME-LIMIT Effective date: 20250618 |
|
| PG25 | Lapsed in a contracting state [announced via postgrant information from national office to epo] |
Ref country code: NL Free format text: LAPSE BECAUSE OF FAILURE TO SUBMIT A TRANSLATION OF THE DESCRIPTION OR TO PAY THE FEE WITHIN THE PRESCRIBED TIME-LIMIT Effective date: 20250618 |
|
| PG25 | Lapsed in a contracting state [announced via postgrant information from national office to epo] |
Ref country code: PT Free format text: LAPSE BECAUSE OF FAILURE TO SUBMIT A TRANSLATION OF THE DESCRIPTION OR TO PAY THE FEE WITHIN THE PRESCRIBED TIME-LIMIT Effective date: 20251020 |
|
| REG | Reference to a national code |
Ref country code: AT Ref legal event code: MK05 Ref document number: 1804582 Country of ref document: AT Kind code of ref document: T Effective date: 20250618 |
|
| PG25 | Lapsed in a contracting state [announced via postgrant information from national office to epo] |
Ref country code: IS Free format text: LAPSE BECAUSE OF FAILURE TO SUBMIT A TRANSLATION OF THE DESCRIPTION OR TO PAY THE FEE WITHIN THE PRESCRIBED TIME-LIMIT Effective date: 20251018 |
|
| PG25 | Lapsed in a contracting state [announced via postgrant information from national office to epo] |
Ref country code: AT Free format text: LAPSE BECAUSE OF FAILURE TO SUBMIT A TRANSLATION OF THE DESCRIPTION OR TO PAY THE FEE WITHIN THE PRESCRIBED TIME-LIMIT Effective date: 20250618 Ref country code: SM Free format text: LAPSE BECAUSE OF FAILURE TO SUBMIT A TRANSLATION OF THE DESCRIPTION OR TO PAY THE FEE WITHIN THE PRESCRIBED TIME-LIMIT Effective date: 20250618 |
|
| PG25 | Lapsed in a contracting state [announced via postgrant information from national office to epo] |
Ref country code: CZ Free format text: LAPSE BECAUSE OF FAILURE TO SUBMIT A TRANSLATION OF THE DESCRIPTION OR TO PAY THE FEE WITHIN THE PRESCRIBED TIME-LIMIT Effective date: 20250618 |
|
| PG25 | Lapsed in a contracting state [announced via postgrant information from national office to epo] |
Ref country code: PL Free format text: LAPSE BECAUSE OF FAILURE TO SUBMIT A TRANSLATION OF THE DESCRIPTION OR TO PAY THE FEE WITHIN THE PRESCRIBED TIME-LIMIT Effective date: 20250618 |
|
| PG25 | Lapsed in a contracting state [announced via postgrant information from national office to epo] |
Ref country code: EE Free format text: LAPSE BECAUSE OF FAILURE TO SUBMIT A TRANSLATION OF THE DESCRIPTION OR TO PAY THE FEE WITHIN THE PRESCRIBED TIME-LIMIT Effective date: 20250618 |
|
| PG25 | Lapsed in a contracting state [announced via postgrant information from national office to epo] |
Ref country code: RO Free format text: LAPSE BECAUSE OF FAILURE TO SUBMIT A TRANSLATION OF THE DESCRIPTION OR TO PAY THE FEE WITHIN THE PRESCRIBED TIME-LIMIT Effective date: 20250618 Ref country code: SK Free format text: LAPSE BECAUSE OF FAILURE TO SUBMIT A TRANSLATION OF THE DESCRIPTION OR TO PAY THE FEE WITHIN THE PRESCRIBED TIME-LIMIT Effective date: 20250618 |
|
| PG25 | Lapsed in a contracting state [announced via postgrant information from national office to epo] |
Ref country code: ES Free format text: LAPSE BECAUSE OF FAILURE TO SUBMIT A TRANSLATION OF THE DESCRIPTION OR TO PAY THE FEE WITHIN THE PRESCRIBED TIME-LIMIT Effective date: 20250618 |
|
| REG | Reference to a national code |
Ref country code: CH Ref legal event code: H13 Free format text: ST27 STATUS EVENT CODE: U-0-0-H10-H13 (AS PROVIDED BY THE NATIONAL OFFICE) Effective date: 20260224 |
|
| PG25 | Lapsed in a contracting state [announced via postgrant information from national office to epo] |
Ref country code: LU Free format text: LAPSE BECAUSE OF NON-PAYMENT OF DUE FEES Effective date: 20250715 |
|
| REG | Reference to a national code |
Ref country code: DE Ref legal event code: R097 Ref document number: 602020052829 Country of ref document: DE |
|
| REG | Reference to a national code |
Ref country code: BE Ref legal event code: MM Effective date: 20250731 |
|
| PG25 | Lapsed in a contracting state [announced via postgrant information from national office to epo] |
Ref country code: MC Free format text: LAPSE BECAUSE OF FAILURE TO SUBMIT A TRANSLATION OF THE DESCRIPTION OR TO PAY THE FEE WITHIN THE PRESCRIBED TIME-LIMIT Effective date: 20250618 |
|
| PG25 | Lapsed in a contracting state [announced via postgrant information from national office to epo] |
Ref country code: DK Free format text: LAPSE BECAUSE OF FAILURE TO SUBMIT A TRANSLATION OF THE DESCRIPTION OR TO PAY THE FEE WITHIN THE PRESCRIBED TIME-LIMIT Effective date: 20250618 |
|
| PG25 | Lapsed in a contracting state [announced via postgrant information from national office to epo] |
Ref country code: BE Free format text: LAPSE BECAUSE OF NON-PAYMENT OF DUE FEES Effective date: 20250731 Ref country code: IT Free format text: LAPSE BECAUSE OF FAILURE TO SUBMIT A TRANSLATION OF THE DESCRIPTION OR TO PAY THE FEE WITHIN THE PRESCRIBED TIME-LIMIT Effective date: 20250618 |
|
| PG25 | Lapsed in a contracting state [announced via postgrant information from national office to epo] |
Ref country code: CH Free format text: LAPSE BECAUSE OF NON-PAYMENT OF DUE FEES Effective date: 20250731 |
|
| PLBE | No opposition filed within time limit |
Free format text: ORIGINAL CODE: 0009261 |
|
| STAA | Information on the status of an ep patent application or granted ep patent |
Free format text: STATUS: NO OPPOSITION FILED WITHIN TIME LIMIT |
|
| REG | Reference to a national code |
Ref country code: CH Ref legal event code: L10 Free format text: ST27 STATUS EVENT CODE: U-0-0-L10-L00 (AS PROVIDED BY THE NATIONAL OFFICE) Effective date: 20260430 |