EP3748912A1 - System and method for monitoring and analyzing a data flow in a network - Google Patents
System and method for monitoring and analyzing a data flow in a network Download PDFInfo
- Publication number
- EP3748912A1 EP3748912A1 EP19179059.1A EP19179059A EP3748912A1 EP 3748912 A1 EP3748912 A1 EP 3748912A1 EP 19179059 A EP19179059 A EP 19179059A EP 3748912 A1 EP3748912 A1 EP 3748912A1
- Authority
- EP
- European Patent Office
- Prior art keywords
- network
- network node
- analyzing
- representation
- further configured
- Prior art date
- Legal status (The legal status is an assumption and is not a legal conclusion. Google has not performed a legal analysis and makes no representation as to the accuracy of the status listed.)
- Pending
Links
Images


Classifications
-
- H—ELECTRICITY
- H04—ELECTRIC COMMUNICATION TECHNIQUE
- H04L—TRANSMISSION OF DIGITAL INFORMATION, e.g. TELEGRAPHIC COMMUNICATION
- H04L63/00—Network architectures or network communication protocols for network security
- H04L63/14—Network architectures or network communication protocols for network security for detecting or protecting against malicious traffic
- H04L63/1408—Network architectures or network communication protocols for network security for detecting or protecting against malicious traffic by monitoring network traffic
-
- H—ELECTRICITY
- H04—ELECTRIC COMMUNICATION TECHNIQUE
- H04L—TRANSMISSION OF DIGITAL INFORMATION, e.g. TELEGRAPHIC COMMUNICATION
- H04L43/00—Arrangements for monitoring or testing data switching networks
- H04L43/04—Processing captured monitoring data, e.g. for logfile generation
- H04L43/045—Processing captured monitoring data, e.g. for logfile generation for graphical visualisation of monitoring data
-
- G—PHYSICS
- G06—COMPUTING OR CALCULATING; COUNTING
- G06T—IMAGE DATA PROCESSING OR GENERATION, IN GENERAL
- G06T11/00—Two-dimensional [2D] image generation
- G06T11/60—Creating or editing images; Combining images with text
- G06T11/65—Creating or editing images; Combining images with text on geographic maps
-
- H—ELECTRICITY
- H04—ELECTRIC COMMUNICATION TECHNIQUE
- H04L—TRANSMISSION OF DIGITAL INFORMATION, e.g. TELEGRAPHIC COMMUNICATION
- H04L41/00—Arrangements for maintenance, administration or management of data switching networks, e.g. of packet switching networks
- H04L41/14—Network analysis or design
-
- H—ELECTRICITY
- H04—ELECTRIC COMMUNICATION TECHNIQUE
- H04L—TRANSMISSION OF DIGITAL INFORMATION, e.g. TELEGRAPHIC COMMUNICATION
- H04L41/00—Arrangements for maintenance, administration or management of data switching networks, e.g. of packet switching networks
- H04L41/22—Arrangements for maintenance, administration or management of data switching networks, e.g. of packet switching networks comprising specially adapted graphical user interfaces [GUI]
-
- H—ELECTRICITY
- H04—ELECTRIC COMMUNICATION TECHNIQUE
- H04L—TRANSMISSION OF DIGITAL INFORMATION, e.g. TELEGRAPHIC COMMUNICATION
- H04L43/00—Arrangements for monitoring or testing data switching networks
- H04L43/06—Generation of reports
- H04L43/065—Generation of reports related to network devices
-
- H—ELECTRICITY
- H04—ELECTRIC COMMUNICATION TECHNIQUE
- H04L—TRANSMISSION OF DIGITAL INFORMATION, e.g. TELEGRAPHIC COMMUNICATION
- H04L43/00—Arrangements for monitoring or testing data switching networks
- H04L43/12—Network monitoring probes
-
- H—ELECTRICITY
- H04—ELECTRIC COMMUNICATION TECHNIQUE
- H04L—TRANSMISSION OF DIGITAL INFORMATION, e.g. TELEGRAPHIC COMMUNICATION
- H04L63/00—Network architectures or network communication protocols for network security
- H04L63/14—Network architectures or network communication protocols for network security for detecting or protecting against malicious traffic
- H04L63/1408—Network architectures or network communication protocols for network security for detecting or protecting against malicious traffic by monitoring network traffic
- H04L63/1416—Event detection, e.g. attack signature detection
-
- H—ELECTRICITY
- H04—ELECTRIC COMMUNICATION TECHNIQUE
- H04L—TRANSMISSION OF DIGITAL INFORMATION, e.g. TELEGRAPHIC COMMUNICATION
- H04L63/00—Network architectures or network communication protocols for network security
- H04L63/14—Network architectures or network communication protocols for network security for detecting or protecting against malicious traffic
- H04L63/1408—Network architectures or network communication protocols for network security for detecting or protecting against malicious traffic by monitoring network traffic
- H04L63/1425—Traffic logging, e.g. anomaly detection
-
- H—ELECTRICITY
- H04—ELECTRIC COMMUNICATION TECHNIQUE
- H04L—TRANSMISSION OF DIGITAL INFORMATION, e.g. TELEGRAPHIC COMMUNICATION
- H04L63/00—Network architectures or network communication protocols for network security
- H04L63/14—Network architectures or network communication protocols for network security for detecting or protecting against malicious traffic
- H04L63/1441—Countermeasures against malicious traffic
-
- H—ELECTRICITY
- H04—ELECTRIC COMMUNICATION TECHNIQUE
- H04L—TRANSMISSION OF DIGITAL INFORMATION, e.g. TELEGRAPHIC COMMUNICATION
- H04L67/00—Network arrangements or protocols for supporting network services or applications
- H04L67/01—Protocols
- H04L67/12—Protocols specially adapted for proprietary or special-purpose networking environments, e.g. medical networks, sensor networks, networks in vehicles or remote metering networks
Definitions
- the invention relates to monitoring and analyzing of data in a computer network. More specifically, the present invention relates to indicating a status or a type of a network node or a network connection to a user. In particular, network anomalies or security incidents can be indicated, e.g. in a factory or an industry 4.0 environment.
- US 9973430 B2 discloses a method and an apparatus for deep packet inspection for network intrusion detection.
- the information provided by these conventional solutions is intended for a system administrator or a computer scientist who has experience in the field of IT security.
- a production manager who is responsible for a manufacturing execution system (MES) is not experienced in IT security but needs to be informed about security incidents and be able to take countermeasures.
- MES manufacturing execution system
- the object of the invention is to provide a system for monitoring and analyzing a data flow in a network, which effectively and efficiently visualizes a status and/or a type of a network node or network connection in the network, e.g. to a user such as a production manager. Moreover, the object is to provide an according method.
- An inventive system for monitoring and analyzing a data flow in a network comprises: a network probe connected to the network and configured to obtain network traffic corresponding to a network node of the network; a packet analyzing unit configured to analyze the network traffic to obtain an analyzing result; and a visualization unit configured to visualize a representation of the network node and a representation of a network connection of the network node based on the analyzing result; wherein the visualization unit is further configured to visualize a status and/or a type of the network node and/or the network connection based on highlighting and/or color coding.
- a data flow comprises a set of packets with common characteristics.
- the characteristics include at least one of: a source IP, a destination IP, a protocol type, a multicast group, a broadcast domain.
- network traffic that corresponds to a network node is network traffic that is sent or received by the network node.
- the packet analyzing unit is configured to apply deep packet inspection to analyze the network traffic and to obtain an analyzing result.
- deep packet inspection is a method in network technology for monitoring and/or filtering data packets.
- the data part and the header part of the data packet can be examined for specific features such as protocol violations, computer viruses, spam and other unwanted content.
- the network probe is a passive network probe.
- the network probe is implemented using port mirroring or an optical splitter.
- the packet analyzing unit is configured to analyze all traffic that is processed in the computer network
- the visualization unit is configured to perform visualization in real time.
- highlighting comprises attracting a user's attention based on a visual indication or alert.
- color coding comprises visualizing the status and/or type using at least one predefined color.
- the network is a packet oriented network.
- the network is a computer network.
- the network traffic includes a network packet.
- the visualization unit is further configured to visualize the representation of the network node in spatial arrangement to other nodes.
- the visualization unit is configured to visualize the representation of the network node on a floor plan and/or a map.
- the spatial arrangement is indicated by the floor plan and/or the map.
- the spatial arrangement is based on a real world scenario, e.g. on the arrangement of machines (that e.g. comprise network nodes) in a factory.
- the floor plan or map may be segmented into security zones
- the visualization unit is further configured to obtain an image or a video, and to visualize the representation of the network node, the representation of the network connection, the status, or the type as an overlay of the image or the video.
- the image or the video shows a spatial arrangement of network nodes, more specifically a view of network nodes on a floor of a factory.
- the overlay is generated using an augmented reality mechanism.
- the system further comprises data glasses configured to obtain the image or the video, and to output the overlay.
- data glasses also called smart glasses
- data glasses are wearable devices that add information to a user's field of vision. They enable augmented reality or mixed reality.
- the visual representation of the network node and/or the visual representation of the network connection includes a context menu.
- the context menu comprises information regarding the related network node or network connection.
- the information regarding the related network node or network connection includes at least one of: protocol, encryption, address, running application, anomaly history.
- the visualization unit is further configured to determine whether a status and/or a type of the network node and/or the network connection complies with a predefined rule, and to visualize the status and/or the type based on the result of the determination.
- the rule is a security rule and/or an anomaly rule.
- the rule can be obtained by user input or by a network connection.
- the visualization unit is able to store security / anomaly rules for data flows and show connections fulfilling the rules and not fulfilling the rules based on color coding or highlighting.
- the visualization unit is further configured to visualize at least one data flow corresponding to an application executed by the network node or corresponding to data received from an external network, based on the analyzing result.
- the at least one flow is visualized based on highlighting and/or color coding.
- the external network is separated from the network by a router or firewall.
- the external network relates to the internet.
- the at least one data flow is a flow between two nodes of the network.
- the visualization unit is further configured to visualize the at least one data flow based on a protocol layer of the at least one data flow.
- highlighting and/or color coding of the at least one flow is based on the protocol layer.
- the system further comprises a processing unit, and the packet analyzing unit is further configured to obtain anomaly information relating to the network node and/or the network connection, based on the analyzing result, and to provide the anomaly information to the processing unit.
- the packet analyzing unit can also provide anomaly information for further processing in the processing unit.
- the anomaly information includes information regarding a network anomaly and/or a security incident in the plurality of network packets.
- the anomaly information relates to a network flow in the network.
- the processing unit is further configured to obtain an anomaly fixing instruction from a database of the system based on the anomaly information and to provide the anomaly fixing instruction to a user, or to apply the anomaly fixing instruction to the system.
- the anomaly fixing instruction is machine learned based on previous anomaly data or network security incidents.
- AI artificial intelligence
- a system which uses artificial intelligence (AI) to detect and respond to cyberattacks (e.g. by blocking them, or by diverting them into a sandbox or honeypot).
- AI artificial intelligence
- a user can see reports of which actions were taken by the AI.
- a user is are able to manually override these actions.
- This combines human decision making with automated data analysis (network flow segmentation).
- the database comprises several sets of anomaly information, anomaly fixing instruction, and a corresponding fixing result.
- the anomaly fixing instruction is further obtained based on a desired fixing result.
- the anomaly fixing instruction includes instructions for a user how to fix a network anomaly or security incident.
- the anomaly fixing instruction includes instructions for the processing unit (e.g. an algorithm) to fix a network anomaly or security incident.
- the processing unit is configured to indicate consequences for a network node in the anomaly fixing instruction, based on the anomaly information.
- a consequence e.g. includes that a production line stops or is in a slower redundancy mode, if a network node is made offline due to a network anomaly or security incident.
- the visualization unit is further configured to notify a predefined user based on the determination result according to the predefined rule, and/or the processing unit is further configured to notify a predefined user based on the anomaly information.
- An inventive method for monitoring and analyzing a data flow in a network comprises the steps of obtaining, by a network probe of a system, network traffic corresponding to a network node of the network, wherein the network probe is connected to the network; analyzing, by a packet analyzing unit of the system, the network traffic to obtain an analyzing result; visualizing, by a visualization unit of the system, a representation of the network node and a representation of a network connection of the network node based on the analyzing result; and visualizing, by the visualization unit, a status and/or a type of the network node and/or the network connection based on highlighting and/or color coding.
- the inventive method comprises the same advantages as the inventive device.
- An inventive computer program comprises program code for performing the previously described method, when the computer program runs on a computer or a digital signal processor.
- the inventive computer program comprises the same advantages as the inventive device.
- FIG. 1 shows a system 100 for monitoring and analyzing a data flow in a network 101.
- the system 100 comprises a network probe 102, a packet analyzing unit 104 and a visualization unit 106.
- the network probe 102 is connected to the network 101 and configured to obtain network traffic corresponding to a network node 103 of the network 101. That is, the network 101 and the network node 103 are external to the system 100.
- the network traffic which is obtained by the network probe 102 is analyzed by the packet analyzing unit 104 to obtain an analyzing result 105. This can e.g. be done by deep packet inspection.
- the visualization unit 106 visualizes a representation 107 of the network node 103 and a representation 108 of a network connection 109 of the network node 103 based on the analyzing result 105.
- the network node 103 can generally be any communication node, but e.g. also be a manufacturing device in a factory.
- the network connection 109 may be any kind of network connection connecting manufacturing devices in a factory.
- the visualization unit 106 implements highlighting and/or color coding. That is, an analyzing result of the network is output by means of highlighting or color coding, by which a user can be easily informed about a status and or type.
- the highlighting and/or color coding thereby depends on the status and/or type.
- the representation 107 of the network node 103 and the representation 108 of a network connection 109 of the network node 103 may e.g. be output on a display, where a user can recognize them.
- FIG. 2 shows the system 100 in more detail.
- the system 100 described in FIG. 2 includes all features and functionality of the system 100 of FIG. 1 . Therefore, corresponding features are labeled with identical reference signs.
- the system 100 optionally further includes data glasses 201 (also called smart glasses) which can be used to display the content output by the visualization unit 104. That is, the data glasses 201 can display the representation 107 of the network node 103 and the representation 108 of a network connection 109 of the network node 103, as well as the highlighting and color coding.
- data glasses 201 also called smart glasses
- the visualization unit 106 can obtain an image or a video, and visualize the representation 107 of the network node 103, the representation 108 of the network connection 109, the status, or the type as an overlay of the image or the video.
- the image can e.g. be an image of a factory floor, or a map, as it is going to be described in FIG. 3 below.
- the image or video can be obtained by the visualization unit 106 e.g. by means of user input (via an external camera).
- the image or video can also be obtained by means of the data glasses 201.
- the data glasses can comprise a camera.
- the data glasses 201 can also be used to output the overlay.
- the visualization unit 106 can visualize at least one data flow corresponding to an application executed by the network node 103.
- the visualization unit 106 can visualize a data flow corresponding to data received from an external network 202, as illustrated in FIG. 2 .
- the external network 202 can e.g. be the internet, to which the network 101 can be connected.
- the at least one data flow can be visualized based on a protocol layer of the at least one data flow.
- the system 100 can optionally comprise a processing unit 203.
- the packet analyzing unit 104 can obtain anomaly information relating to the network node 103 and/or the network connection 109, and to provide the anomaly information 204 to the processing unit 203.
- the system 100 optionally can include a database 206 from which the processing unit 203 can obtain an anomaly fixing instruction 205 based on the anomaly information 204.
- the processing unit 203 then provides the anomaly fixing instruction 205 to a user, or applies the anomaly fixing instruction 205 to the network 101, or nodes 103 of the network.
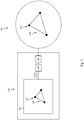
- FIG. 3 shows a schematic view of an operating scenario according to the present invention.
- a visual representation 107 of the network node 103 in spatial arrangement to other nodes 107', 107" (i.e. to their representations) is shown.
- Such a visualization can be output by the visualization unit 106.
- the output of the visualization unit 106 is shown as an overlay over an image 301 of a factory floor.
- the image 301 also shows a visual representation 108 of a network connection 109.
- FIG. 4 shows another schematic view of an operating scenario according to the present invention.
- manufacturing devices on a factory floor are shown.
- Each manufacturing device can include a network node 103 as described above.
- lines connecting these devices are shown as an overlay. These lines are representations 108 of network connections 109.
- the nodes at which the lines meet are representations 107 of network nodes 103.
- FIG. 4 shows an overlay of the representations over an image of a factory floor, which is generated by means of an augmented reality mechanism.
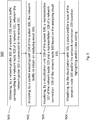
- FIG. 5 schematically shows a method 500 according to an embodiment of the present invention.
- the method 500 is for monitoring and analyzing a data flow in a network 101. Therefore, the method 500 comprises a step of obtaining 501, by a network probe 102 of a system 100, network traffic corresponding to a network node 103 of the network 101, wherein the network probe 102 is connected to the network 101.
- the method 500 further comprises a step of analyzing 502, by a packet analyzing unit 104 of the system 100, the network traffic to obtain an analyzing result 105.
- the method further comprises a step of visualizing 503, by a visualization unit 106 of the system 100, a representation 107 of the network node 103 and a representation 108 of a network connection 109 of the network node 103 based on the analyzing result 105.
- the method 500 comprises a last step of visualizing 504, by the visualization unit 106, a status and/or a type of the network node 103 and/or the network connection 109 based on highlighting and/or color coding.
- the invention is not limited by the examples and especially not by a specific number of network nodes 103 or network connections 109.
- the characteristics of the exemplary embodiments can be used in any advantageous combination.
Landscapes
- Engineering & Computer Science (AREA)
- Computer Networks & Wireless Communication (AREA)
- Signal Processing (AREA)
- Computer Security & Cryptography (AREA)
- Data Mining & Analysis (AREA)
- Computing Systems (AREA)
- Computer Hardware Design (AREA)
- General Engineering & Computer Science (AREA)
- Physics & Mathematics (AREA)
- General Physics & Mathematics (AREA)
- Theoretical Computer Science (AREA)
- Medical Informatics (AREA)
- General Health & Medical Sciences (AREA)
- Health & Medical Sciences (AREA)
- Human Computer Interaction (AREA)
- Data Exchanges In Wide-Area Networks (AREA)
Abstract
Description
- The invention relates to monitoring and analyzing of data in a computer network. More specifically, the present invention relates to indicating a status or a type of a network node or a network connection to a user. In particular, network anomalies or security incidents can be indicated, e.g. in a factory or an industry 4.0 environment.
- Conventional solutions for monitoring and analyzing a computer network allow for obtaining information about a security incident in the computer network. For example,
US 9973430 B2 - The object of the invention is to provide a system for monitoring and analyzing a data flow in a network, which effectively and efficiently visualizes a status and/or a type of a network node or network connection in the network, e.g. to a user such as a production manager. Moreover, the object is to provide an according method.
- The object is solved by the features of the first independent claim for the system and by the features of the second independent claim for the method. Further, it is solved by the features of an associated computer program. The dependent claims contain further developments.
- An inventive system for monitoring and analyzing a data flow in a network comprises: a network probe connected to the network and configured to obtain network traffic corresponding to a network node of the network; a packet analyzing unit configured to analyze the network traffic to obtain an analyzing result; and a visualization unit configured to visualize a representation of the network node and a representation of a network connection of the network node based on the analyzing result; wherein the visualization unit is further configured to visualize a status and/or a type of the network node and/or the network connection based on highlighting and/or color coding.
- This is beneficial, because visualizing the status or the type of the network node or the network connection based on highlighting or color coding allows for effective and efficient signaling of a system state to a user. This also enables to automatically highlight network flows, vulnerabilities and machine status.
- In particular, a data flow comprises a set of packets with common characteristics.
- In particular, the characteristics include at least one of: a source IP, a destination IP, a protocol type, a multicast group, a broadcast domain.
- In particular, network traffic that corresponds to a network node is network traffic that is sent or received by the network node.
- In particular, the packet analyzing unit is configured to apply deep packet inspection to analyze the network traffic and to obtain an analyzing result.
- In particular, deep packet inspection is a method in network technology for monitoring and/or filtering data packets. At the same time, the data part and the header part of the data packet can be examined for specific features such as protocol violations, computer viruses, spam and other unwanted content.
- In particular, the network probe is a passive network probe. In particular, the network probe is implemented using port mirroring or an optical splitter.
- In particular, the packet analyzing unit is configured to analyze all traffic that is processed in the computer network
- In particular, the visualization unit is configured to perform visualization in real time.
- In particular, highlighting comprises attracting a user's attention based on a visual indication or alert. In particular, color coding comprises visualizing the status and/or type using at least one predefined color.
- Advantageously and preferably, the network is a packet oriented network.
- This is beneficial, since a packet oriented network, which is often used in MES, can be analyzed by the system.
- In particular, the network is a computer network. In particular, the network traffic includes a network packet.
- In particular, only a predefined subset of network connections can be visualized. That is, that system can be configured to only show unusual network connections.
- Advantageously and preferably, the visualization unit is further configured to visualize the representation of the network node in spatial arrangement to other nodes.
- This is beneficial as it supports a user in determining a geographic position of the network node if which a status or type is visualized.
- In particular, the visualization unit is configured to visualize the representation of the network node on a floor plan and/or a map. In particular, the spatial arrangement is indicated by the floor plan and/or the map. In particular, the spatial arrangement is based on a real world scenario, e.g. on the arrangement of machines (that e.g. comprise network nodes) in a factory. In particular, the floor plan or map may be segmented into security zones Advantageously and preferably, the visualization unit is further configured to obtain an image or a video, and to visualize the representation of the network node, the representation of the network connection, the status, or the type as an overlay of the image or the video.
- This is beneficial as the position of the network node can even more easily be located by means of the overlaid picture or video.
- In particular, the image or the video shows a spatial arrangement of network nodes, more specifically a view of network nodes on a floor of a factory.
- Advantageously and preferably, the overlay is generated using an augmented reality mechanism.
- This is beneficial as it guarantees high quality of the overlay.
- Advantageously and preferably, the system further comprises data glasses configured to obtain the image or the video, and to output the overlay.
- This is beneficial as a convenient way is provided to a user to obtain the visualized information.
- In particular, data glasses (also called smart glasses) are wearable devices that add information to a user's field of vision. They enable augmented reality or mixed reality.
- Advantageously and preferably, the visual representation of the network node and/or the visual representation of the network connection includes a context menu.
- This is beneficial as even more information can be presented by means of the context menu, in particular in a structured manner.
- Advantageously and preferably, the context menu comprises information regarding the related network node or network connection.
- This is beneficial as even more information can be presented to a user in an efficient and effective way.
- In particular, the information regarding the related network node or network connection includes at least one of: protocol, encryption, address, running application, anomaly history.
- Advantageously and preferably, the visualization unit is further configured to determine whether a status and/or a type of the network node and/or the network connection complies with a predefined rule, and to visualize the status and/or the type based on the result of the determination.
- This is beneficial as also the compliance of network traffic with rules can be presented.
- In particular, the rule is a security rule and/or an anomaly rule. In particular, the rule can be obtained by user input or by a network connection.
- In particular, the visualization unit is able to store security / anomaly rules for data flows and show connections fulfilling the rules and not fulfilling the rules based on color coding or highlighting.
- Advantageously and preferably, the visualization unit is further configured to visualize at least one data flow corresponding to an application executed by the network node or corresponding to data received from an external network, based on the analyzing result.
- This is beneficial, as information is visualized in a more fine grained manner (i.e. on a data-flow or application level).
- In particular, the at least one flow is visualized based on highlighting and/or color coding. In particular, the external network is separated from the network by a router or firewall. In particular, the external network relates to the internet. In particular, the at least one data flow is a flow between two nodes of the network.
- Advantageously and preferably, the visualization unit is further configured to visualize the at least one data flow based on a protocol layer of the at least one data flow.
- This is beneficial, as information is visualized in a more fine grained manner (i.e. on protocol layer level).
- In particular, highlighting and/or color coding of the at least one flow is based on the protocol layer.
- Advantageously and preferably, the system further comprises a processing unit, and the packet analyzing unit is further configured to obtain anomaly information relating to the network node and/or the network connection, based on the analyzing result, and to provide the anomaly information to the processing unit.
- This is beneficial as the packet analyzing unit can also provide anomaly information for further processing in the processing unit.
- In particular, the anomaly information includes information regarding a network anomaly and/or a security incident in the plurality of network packets.
- In particular, the anomaly information relates to a network flow in the network.
- Advantageously and preferably, the processing unit is further configured to obtain an anomaly fixing instruction from a database of the system based on the anomaly information and to provide the anomaly fixing instruction to a user, or to apply the anomaly fixing instruction to the system.
- This is beneficial, as a user can be guided to take countermeasures against a network incident, or as the countermeasures even can be taken automatically.
- In particular, the anomaly fixing instruction is machine learned based on previous anomaly data or network security incidents.
- This ensures that a system can be provided which uses artificial intelligence (AI) to detect and respond to cyberattacks (e.g. by blocking them, or by diverting them into a sandbox or honeypot). In order to trust the AI, a user can see reports of which actions were taken by the AI. A user is are able to manually override these actions. This combines human decision making with automated data analysis (network flow segmentation).
- In particular, the database comprises several sets of anomaly information, anomaly fixing instruction, and a corresponding fixing result. In particular, the anomaly fixing instruction is further obtained based on a desired fixing result.
- In particular, the anomaly fixing instruction includes instructions for a user how to fix a network anomaly or security incident. In particular, the anomaly fixing instruction includes instructions for the processing unit (e.g. an algorithm) to fix a network anomaly or security incident.
- In particular, the processing unit is configured to indicate consequences for a network node in the anomaly fixing instruction, based on the anomaly information. A consequence e.g. includes that a production line stops or is in a slower redundancy mode, if a network node is made offline due to a network anomaly or security incident.
- Advantageously and preferably, the visualization unit is further configured to notify a predefined user based on the determination result according to the predefined rule, and/or the processing unit is further configured to notify a predefined user based on the anomaly information.
- This is beneficial, as a predefined user can efficiently and effectively be informed about a security incident or a network anomaly.
- An inventive method for monitoring and analyzing a data flow in a network comprises the steps of obtaining, by a network probe of a system, network traffic corresponding to a network node of the network, wherein the network probe is connected to the network; analyzing, by a packet analyzing unit of the system, the network traffic to obtain an analyzing result; visualizing, by a visualization unit of the system, a representation of the network node and a representation of a network connection of the network node based on the analyzing result; and visualizing, by the visualization unit, a status and/or a type of the network node and/or the network connection based on highlighting and/or color coding.
- The inventive method comprises the same advantages as the inventive device.
- An inventive computer program comprises program code for performing the previously described method, when the computer program runs on a computer or a digital signal processor.
- The inventive computer program comprises the same advantages as the inventive device.
- An exemplary embodiment of the invention is now further explained with respect to the drawings by way of examples only, in which
- FIG. 1
- shows a schematic view of a system according to an embodiment of the present invention;
- FIG. 2
- shows a schematic view of a system according to an embodiment of the present invention in more detail;
- FIG. 3
- shows a schematic view of an operating scenario of the present invention;
- FIG. 4
- shows another schematic view of an operating scenario of the present invention;
- FIG. 5
- shows a schematic view of a method according to an embodiment of the present invention.
-
FIG. 1 shows asystem 100 for monitoring and analyzing a data flow in anetwork 101. As illustrated, thesystem 100 comprises anetwork probe 102, apacket analyzing unit 104 and avisualization unit 106. - The
network probe 102 is connected to thenetwork 101 and configured to obtain network traffic corresponding to anetwork node 103 of thenetwork 101. That is, thenetwork 101 and thenetwork node 103 are external to thesystem 100. - The network traffic which is obtained by the
network probe 102 is analyzed by thepacket analyzing unit 104 to obtain an analyzingresult 105. This can e.g. be done by deep packet inspection. - The
visualization unit 106 visualizes arepresentation 107 of thenetwork node 103 and arepresentation 108 of anetwork connection 109 of thenetwork node 103 based on the analyzingresult 105. Thenetwork node 103 can generally be any communication node, but e.g. also be a manufacturing device in a factory. Thenetwork connection 109 may be any kind of network connection connecting manufacturing devices in a factory. - To indicate or visualize a status and/or a type of the
network node 103 and/or thenetwork connection 109 to a user, thevisualization unit 106 implements highlighting and/or color coding. That is, an analyzing result of the network is output by means of highlighting or color coding, by which a user can be easily informed about a status and or type. The highlighting and/or color coding thereby depends on the status and/or type. - The
representation 107 of thenetwork node 103 and therepresentation 108 of anetwork connection 109 of thenetwork node 103 may e.g. be output on a display, where a user can recognize them. -
FIG. 2 shows thesystem 100 in more detail. Thesystem 100 described inFIG. 2 includes all features and functionality of thesystem 100 ofFIG. 1 . Therefore, corresponding features are labeled with identical reference signs. - As shown in
FIG. 2 , thesystem 100 optionally further includes data glasses 201 (also called smart glasses) which can be used to display the content output by thevisualization unit 104. That is, thedata glasses 201 can display therepresentation 107 of thenetwork node 103 and therepresentation 108 of anetwork connection 109 of thenetwork node 103, as well as the highlighting and color coding. - The
visualization unit 106 can obtain an image or a video, and visualize therepresentation 107 of thenetwork node 103, therepresentation 108 of thenetwork connection 109, the status, or the type as an overlay of the image or the video. The image can e.g. be an image of a factory floor, or a map, as it is going to be described inFIG. 3 below. - The image or video can be obtained by the
visualization unit 106 e.g. by means of user input (via an external camera). The image or video can also be obtained by means of thedata glasses 201. To this end, the data glasses can comprise a camera. - In case that the visualization unit includes the
data glasses 201, thedata glasses 201 can also be used to output the overlay. - Optionally, the
visualization unit 106 can visualize at least one data flow corresponding to an application executed by thenetwork node 103. - Additionally or alternatively, the
visualization unit 106 can visualize a data flow corresponding to data received from anexternal network 202, as illustrated inFIG. 2 . - The
external network 202 can e.g. be the internet, to which thenetwork 101 can be connected. The at least one data flow can be visualized based on a protocol layer of the at least one data flow. - As it is illustrated in
FIG. 2 , thesystem 100 can optionally comprise aprocessing unit 203. In this case, thepacket analyzing unit 104 can obtain anomaly information relating to thenetwork node 103 and/or thenetwork connection 109, and to provide theanomaly information 204 to theprocessing unit 203. - The
system 100 optionally can include adatabase 206 from which theprocessing unit 203 can obtain ananomaly fixing instruction 205 based on theanomaly information 204. - The
processing unit 203 then provides theanomaly fixing instruction 205 to a user, or applies theanomaly fixing instruction 205 to thenetwork 101, ornodes 103 of the network. -
FIG. 3 shows a schematic view of an operating scenario according to the present invention. InFIG. 3 , avisual representation 107 of thenetwork node 103 in spatial arrangement toother nodes 107', 107" (i.e. to their representations) is shown. Such a visualization can be output by thevisualization unit 106. In particular, the output of thevisualization unit 106 is shown as an overlay over animage 301 of a factory floor. Theimage 301 also shows avisual representation 108 of anetwork connection 109. -
FIG. 4 shows another schematic view of an operating scenario according to the present invention. InFIG. 4 , manufacturing devices on a factory floor are shown. Each manufacturing device can include anetwork node 103 as described above. InFIG. 4 , lines connecting these devices are shown as an overlay. These lines arerepresentations 108 ofnetwork connections 109. The nodes at which the lines meet arerepresentations 107 ofnetwork nodes 103. In other words,FIG. 4 shows an overlay of the representations over an image of a factory floor, which is generated by means of an augmented reality mechanism. -
FIG. 5 schematically shows amethod 500 according to an embodiment of the present invention. Themethod 500 is for monitoring and analyzing a data flow in anetwork 101. Therefore, themethod 500 comprises a step of obtaining 501, by anetwork probe 102 of asystem 100, network traffic corresponding to anetwork node 103 of thenetwork 101, wherein thenetwork probe 102 is connected to thenetwork 101. Themethod 500 further comprises a step of analyzing 502, by apacket analyzing unit 104 of thesystem 100, the network traffic to obtain an analyzingresult 105. The method further comprises a step of visualizing 503, by avisualization unit 106 of thesystem 100, arepresentation 107 of thenetwork node 103 and arepresentation 108 of anetwork connection 109 of thenetwork node 103 based on the analyzingresult 105. Themethod 500 comprises a last step of visualizing 504, by thevisualization unit 106, a status and/or a type of thenetwork node 103 and/or thenetwork connection 109 based on highlighting and/or color coding. - It is important to note that the inventive system and method very closely correspond. Therefore, all of the above said regarding the system is also applicable to the method. Everything which is described in the description and/or claimed in the claims and/or drawn in the drawings can be combined.
- The invention is not limited by the examples and especially not by a specific number of
network nodes 103 ornetwork connections 109. The characteristics of the exemplary embodiments can be used in any advantageous combination.
Claims (15)
- A system (100) for monitoring and analyzing a data flow in a network (101), wherein the system (100) comprises:- a network probe (102) connected to the network (101) and configured to obtain network traffic corresponding to a network node (103) of the network (101);- a packet analyzing unit (104) configured to analyze the network traffic to obtain an analyzing result (105); and- a visualization unit (106) configured to visualize a representation (107) of the network node (103) and a representation (108) of a network connection (109) of the network node (103) based on the analyzing result (105);wherein the visualization unit (106) is further configured to visualize a status and/or a type of the network node (103) and/or the network connection (109) based on highlighting and/or color coding.
- The system (100) according to claim 1, wherein the network (101) is a packet oriented network.
- The system (100) according to claim 1 or 2, wherein the visualization unit (106) is further configured to visualize the representation (107) of the network node (103) in spatial arrangement to other nodes (107', 107").
- The system (100) according to any one of the preceding claims, wherein the visualization unit (106) is further configured to obtain an image (301) or a video, and to visualize the representation (107) of the network node (103), the representation (108) of the network connection (109), the status, or the type as an overlay of the image (301) or the video.
- The system (100) according to any one of the preceding claims, wherein the overlay is generated using an augmented reality mechanism.
- The system (100) according to claim 5, further comprising data glasses (201) configured to obtain the image or the video, and to output the overlay.
- The system (100) according to any one of the preceding claims, wherein the representation (107) of the network node (103) and/or the representation (108) of the network connection (109) includes a context menu.
- The system (100) according to claim 7, wherein the context menu comprises information regarding the related network node (103) or network connection (109).
- The system (100) according to any one of the preceding claims, wherein the visualization unit (106) is further configured to determine whether a status and/or a type of the network node (103) and/or the network connection (109) complies with a predefined rule, and to visualize the status and/or the type based on the result of the determination.
- The system (100) according to any one of the preceding claims, wherein the visualization unit (106) is further configured to visualize at least one data flow corresponding to an application executed by the network node (103) or corresponding to data received from an external network (202), based on the analyzing result (105) .
- The system (100) according to claim 10, wherein the visualization unit (106) is further configured to visualize the at least one data flow based on a protocol layer of the at least one data flow.
- The system (100) according to any one of the preceding claims, wherein the system (100) further comprises a processing unit (203), and wherein the packet analyzing unit (104) is further configured to obtain anomaly information relating to the network node (103) and/or the network connection (109), based on the analyzing result (105), and to provide the anomaly information (204) to the processing unit (203).
- The system (100) according to any one of the preceding claims, wherein the processing unit (203) is further configured to obtain an anomaly fixing instruction (205) from a database (206) of the system (100) based on the anomaly information (204) and to provide the anomaly fixing instruction (205) to a user, or to apply the anomaly fixing instruction (205) to the network (101).
- The system (100) according to any one of the preceding claims, wherein the visualization unit (106) is further configured to notify a predefined user based on the determination result according to the predefined rule, and/or
wherein the processing unit (203) is further configured to notify a predefined user based on the anomaly information (204) . - A method (500) for monitoring and analyzing a data flow in a network (101), wherein the method (500) comprises the steps of:- obtaining (501), by a network probe (102) of a system (100), network traffic corresponding to a network node (103) of the network (101), wherein the network probe (102) is connected to the network (101);- analyzing (502), by a packet analyzing unit (104) of the system (100), the network traffic to obtain an analyzing result (105);- visualizing (503), by a visualization unit (106) of the system (100), a representation (107) of the network node (103) and a representation (108) of a network connection (109) of the network node (103) based on the analyzing result (105); and- visualizing (504), by the visualization unit (106), a status and/or a type of the network node (103) and/or the network connection (109) based on highlighting and/or color coding.
Priority Applications (3)
| Application Number | Priority Date | Filing Date | Title |
|---|---|---|---|
| EP19179059.1A EP3748912A1 (en) | 2019-06-07 | 2019-06-07 | System and method for monitoring and analyzing a data flow in a network |
| CN202010317358.2A CN112054987A (en) | 2019-06-07 | 2020-04-21 | System and method for monitoring and analyzing data flows in a network |
| US16/868,225 US20200389377A1 (en) | 2019-06-07 | 2020-05-06 | System and method for monitoring and analyzing a data flow in a network |
Applications Claiming Priority (1)
| Application Number | Priority Date | Filing Date | Title |
|---|---|---|---|
| EP19179059.1A EP3748912A1 (en) | 2019-06-07 | 2019-06-07 | System and method for monitoring and analyzing a data flow in a network |
Publications (1)
| Publication Number | Publication Date |
|---|---|
| EP3748912A1 true EP3748912A1 (en) | 2020-12-09 |
Family
ID=66951770
Family Applications (1)
| Application Number | Title | Priority Date | Filing Date |
|---|---|---|---|
| EP19179059.1A Pending EP3748912A1 (en) | 2019-06-07 | 2019-06-07 | System and method for monitoring and analyzing a data flow in a network |
Country Status (3)
| Country | Link |
|---|---|
| US (1) | US20200389377A1 (en) |
| EP (1) | EP3748912A1 (en) |
| CN (1) | CN112054987A (en) |
Families Citing this family (2)
| Publication number | Priority date | Publication date | Assignee | Title |
|---|---|---|---|---|
| US12652307B1 (en) * | 2023-01-24 | 2026-06-09 | Cybral IP LLC | Automated system to assess network systems security, exploit vulnerabilities, and provide security recommendations |
| US20240323108A1 (en) * | 2023-03-21 | 2024-09-26 | International Business Machines Corporation | Visualization tool for network traffic |
Citations (5)
| Publication number | Priority date | Publication date | Assignee | Title |
|---|---|---|---|---|
| US8874722B2 (en) * | 2007-09-28 | 2014-10-28 | International Business Machines Corporation | Interactive tool for visualizing performance data in real-time to enable adaptive performance optimization and feedback |
| US20170063640A1 (en) * | 2015-08-31 | 2017-03-02 | The Boeing Company | Computing architecture visualization system |
| US20180077119A1 (en) * | 2016-09-15 | 2018-03-15 | Arbor Networks, Inc. | Visualization of traffic flowing through a host |
| US9973430B2 (en) | 2007-02-15 | 2018-05-15 | Marvell Israel (M.I.S.L) Ltd. | Method and apparatus for deep packet inspection for network intrusion detection |
| US20180248905A1 (en) * | 2017-02-24 | 2018-08-30 | Ciena Corporation | Systems and methods to detect abnormal behavior in networks |
Family Cites Families (11)
| Publication number | Priority date | Publication date | Assignee | Title |
|---|---|---|---|---|
| US6900822B2 (en) * | 2001-03-14 | 2005-05-31 | Bmc Software, Inc. | Performance and flow analysis method for communication networks |
| CN102208989A (en) * | 2010-03-30 | 2011-10-05 | 国际商业机器公司 | Network visualization processing method and device |
| CN102932201B (en) * | 2012-09-26 | 2016-08-03 | 迈普通信技术股份有限公司 | The display control program of a kind of network monitoring data and method |
| US10375591B2 (en) * | 2016-05-20 | 2019-08-06 | 7Signal Solutions, Inc. | System and method for wireless network performance measurement and management using remote devices |
| US10319128B2 (en) * | 2016-09-26 | 2019-06-11 | Rockwell Automation Technologies, Inc. | Augmented reality presentation of an industrial environment |
| CN107181612A (en) * | 2017-05-08 | 2017-09-19 | 深圳市众泰兄弟科技发展有限公司 | A kind of visual network method for safety monitoring based on big data |
| CN108777643A (en) * | 2018-06-08 | 2018-11-09 | 武汉思普崚技术有限公司 | A kind of traffic visualization plateform system |
| CN108696531A (en) * | 2018-06-08 | 2018-10-23 | 武汉思普崚技术有限公司 | A kind of security strategy adaptive analysis and big data Visualization Platform system |
| CN109639587A (en) * | 2018-12-11 | 2019-04-16 | 国网河南省电力公司开封供电公司 | A kind of flow monitoring system based on electric automatization |
| CN109768880B (en) * | 2018-12-17 | 2022-03-01 | 国网重庆市电力公司 | A remote visual monitoring method of network topology for power monitoring system |
| CN109474479A (en) * | 2018-12-22 | 2019-03-15 | 王丹 | A kind of network equipment monitoring method and system |
-
2019
- 2019-06-07 EP EP19179059.1A patent/EP3748912A1/en active Pending
-
2020
- 2020-04-21 CN CN202010317358.2A patent/CN112054987A/en active Pending
- 2020-05-06 US US16/868,225 patent/US20200389377A1/en not_active Abandoned
Patent Citations (5)
| Publication number | Priority date | Publication date | Assignee | Title |
|---|---|---|---|---|
| US9973430B2 (en) | 2007-02-15 | 2018-05-15 | Marvell Israel (M.I.S.L) Ltd. | Method and apparatus for deep packet inspection for network intrusion detection |
| US8874722B2 (en) * | 2007-09-28 | 2014-10-28 | International Business Machines Corporation | Interactive tool for visualizing performance data in real-time to enable adaptive performance optimization and feedback |
| US20170063640A1 (en) * | 2015-08-31 | 2017-03-02 | The Boeing Company | Computing architecture visualization system |
| US20180077119A1 (en) * | 2016-09-15 | 2018-03-15 | Arbor Networks, Inc. | Visualization of traffic flowing through a host |
| US20180248905A1 (en) * | 2017-02-24 | 2018-08-30 | Ciena Corporation | Systems and methods to detect abnormal behavior in networks |
Also Published As
| Publication number | Publication date |
|---|---|
| CN112054987A (en) | 2020-12-08 |
| US20200389377A1 (en) | 2020-12-10 |
Similar Documents
| Publication | Publication Date | Title |
|---|---|---|
| CN110611651B (en) | Network monitoring method, network monitoring device and electronic equipment | |
| KR102749514B1 (en) | Automated packetless network reachability analysis | |
| US12113833B2 (en) | Distributed network and security operations platform | |
| JP6821800B2 (en) | Systems and methods for interactive network analytics platforms | |
| US7930752B2 (en) | Method for the detection and visualization of anomalous behaviors in a computer network | |
| RU2677378C2 (en) | Systems and methods for network analysis and reporting | |
| US11223643B2 (en) | Managing a segmentation policy based on attack pattern detection | |
| US20230022134A1 (en) | Framework for validating and troubleshooting network policy configurations | |
| US20090198707A1 (en) | System and method for managing firewall log records | |
| US20080022357A1 (en) | Assessing network and device compliance with security policies | |
| US11425007B2 (en) | Label-based rules for squelching visible traffic in a segmented network environment | |
| KR20090065668A (en) | IP address splitting display device and method | |
| CN109787809B (en) | Intelligent operation and maintenance system | |
| JP2023164212A (en) | Cloud security topology visualization device and integrated cloud workload management and security management system using it | |
| TWI719421B (en) | Monitoring method and system for data transmission | |
| Kim et al. | Firewall ruleset visualization analysis tool based on segmentation | |
| CN113315760A (en) | Situation awareness method, system, equipment and medium based on knowledge graph | |
| US20200389377A1 (en) | System and method for monitoring and analyzing a data flow in a network | |
| Thompson et al. | Command line or pretty lines? Comparing textual and visual interfaces for intrusion detection | |
| US20070094724A1 (en) | It network security system | |
| US20250150353A1 (en) | System and method for anomaly detection in a distributed cloud environment | |
| Lee et al. | HSViz: Hierarchy simplified visualizations for firewall policy analysis | |
| EP4557680A1 (en) | Network monitoring system and method including software agents | |
| Shukla et al. | Cisco Cloud Infrastructure | |
| Abad et al. | Correlation between netflow system and network views for intrusion detection |
Legal Events
| Date | Code | Title | Description |
|---|---|---|---|
| PUAI | Public reference made under article 153(3) epc to a published international application that has entered the european phase |
Free format text: ORIGINAL CODE: 0009012 |
|
| STAA | Information on the status of an ep patent application or granted ep patent |
Free format text: STATUS: THE APPLICATION HAS BEEN PUBLISHED |
|
| AK | Designated contracting states |
Kind code of ref document: A1 Designated state(s): AL AT BE BG CH CY CZ DE DK EE ES FI FR GB GR HR HU IE IS IT LI LT LU LV MC MK MT NL NO PL PT RO RS SE SI SK SM TR |
|
| AX | Request for extension of the european patent |
Extension state: BA ME |
|
| STAA | Information on the status of an ep patent application or granted ep patent |
Free format text: STATUS: REQUEST FOR EXAMINATION WAS MADE |
|
| 17P | Request for examination filed |
Effective date: 20210409 |
|
| RBV | Designated contracting states (corrected) |
Designated state(s): AL AT BE BG CH CY CZ DE DK EE ES FI FR GB GR HR HU IE IS IT LI LT LU LV MC MK MT NL NO PL PT RO RS SE SI SK SM TR |
|
| STAA | Information on the status of an ep patent application or granted ep patent |
Free format text: STATUS: EXAMINATION IS IN PROGRESS |
|
| 17Q | First examination report despatched |
Effective date: 20220407 |
|
| P01 | Opt-out of the competence of the unified patent court (upc) registered |
Effective date: 20230525 |