EP3748639A1 - Verfahren zum bestimmen eines konservierungszustandes eines produkts zu einem aktuellen zeitpunkt und computersystem zur durchführung des verfahrens - Google Patents
Verfahren zum bestimmen eines konservierungszustandes eines produkts zu einem aktuellen zeitpunkt und computersystem zur durchführung des verfahrens Download PDFInfo
- Publication number
- EP3748639A1 EP3748639A1 EP19305709.8A EP19305709A EP3748639A1 EP 3748639 A1 EP3748639 A1 EP 3748639A1 EP 19305709 A EP19305709 A EP 19305709A EP 3748639 A1 EP3748639 A1 EP 3748639A1
- Authority
- EP
- European Patent Office
- Prior art keywords
- model
- data set
- quantitative attribute
- attribute value
- experimental
- Prior art date
- Legal status (The legal status is an assumption and is not a legal conclusion. Google has not performed a legal analysis and makes no representation as to the accuracy of the status listed.)
- Withdrawn
Links
Images

Classifications
-
- G—PHYSICS
- G16—INFORMATION AND COMMUNICATION TECHNOLOGY [ICT] SPECIALLY ADAPTED FOR SPECIFIC APPLICATION FIELDS
- G16C—COMPUTATIONAL CHEMISTRY; CHEMOINFORMATICS; COMPUTATIONAL MATERIALS SCIENCE
- G16C20/00—Chemoinformatics, i.e. ICT specially adapted for the handling of physicochemical or structural data of chemical particles, elements, compounds or mixtures
- G16C20/50—Molecular design, e.g. of drugs
-
- G—PHYSICS
- G16—INFORMATION AND COMMUNICATION TECHNOLOGY [ICT] SPECIALLY ADAPTED FOR SPECIFIC APPLICATION FIELDS
- G16C—COMPUTATIONAL CHEMISTRY; CHEMOINFORMATICS; COMPUTATIONAL MATERIALS SCIENCE
- G16C20/00—Chemoinformatics, i.e. ICT specially adapted for the handling of physicochemical or structural data of chemical particles, elements, compounds or mixtures
- G16C20/10—Analysis or design of chemical reactions, syntheses or processes
-
- G—PHYSICS
- G16—INFORMATION AND COMMUNICATION TECHNOLOGY [ICT] SPECIALLY ADAPTED FOR SPECIFIC APPLICATION FIELDS
- G16C—COMPUTATIONAL CHEMISTRY; CHEMOINFORMATICS; COMPUTATIONAL MATERIALS SCIENCE
- G16C20/00—Chemoinformatics, i.e. ICT specially adapted for the handling of physicochemical or structural data of chemical particles, elements, compounds or mixtures
- G16C20/30—Prediction of properties of chemical compounds, compositions or mixtures
Definitions
- the invention generally relates to groups of products made in a batch according to a predefined specification.
- the invention relates more specifically to such groups in which the products have a quantitative attribute taking a value representative of the preservation state of the product, the quantitative attribute value evolving as a function of time and temperature, the product having a preservation state (for instance meeting or not meeting acceptance criteria) depending on the quantitative attribute value.
- ICH International Council for Harmonisation of Technical Requirements for Pharmaceuticals for Human Use
- ICH stability study The purpose of a ICH stability study is to establish, based on testing a minimum of three batches of the drug substance or product, a retest period (drug substance) or shelf life (drug product) and label storage instructions applicable to all future batches manufactured and packaged under similar circumstances.
- Q1A(R2) guideline details principles for generating stability data and Q1E describes when and how extrapolation can be considered when proposing a retest period (drug substance) or a shelf life (drug product) that extends beyond the period covered by the available data generated from a stability study under the so-called long-term storage condition, such as twelve months in a refrigerator at 5°C ⁇ 3°C.
- the stability data are generated for the critical quality attributes likely to influence the quality and performance of the drug substance or product.
- Q1 E guideline explains that in general, certain quantitative chemical attributes (e.g., assay, degradation products, preservative content) for a drug substance or product can be assumed to follow zero-order kinetics during long-term storage.
- certain quantitative chemical attributes e.g., assay, degradation products, preservative content
- Q1E guideline further explains that data for these attributes are therefore amenable to the type of statistical analysis described in its Appendix B, including linear regression and poolability testing; that although the kinetics of other quantitative attributes (e.g., pH, dissolution) is generally not known, the same statistical analysis can be applied, if appropriate; and that qualitative attributes and microbiological attributes are not amenable to this kind of statistical analysis.
- quantitative attributes e.g., pH, dissolution
- Q1 E guideline thus discloses a way of extrapolating a law of evolution - as a function of time - of a quantitative attribute value.
- the extrapolated law of evolution it is possible to determine the quantitative attribute value at time points different from the experimental time points at which the stability data were generated, in particular time points beyond the period covered by the stability data.
- the preservation state of the product (for instance within or out of acceptance criteria) can thus be determined at a current time point different from the experimental time points.
- Such extrapolation is very useful for knowing the preservation state of one product in predefined conditions of storage, for instance the so-called long-term storage condition, such as twelve months in a refrigerator at 5°C ⁇ 3°C.
- the invention is directed to an improved method for determining the preservation state of this kind of products, such method having good precision performance even with a limited amount of experimental stability data.
- the invention provides accordingly a method for determining at a current time point a preservation state of one product of a group of products made in a batch according to a predefined specification, each product of said group of products having a quantitative attribute taking a value evolving as a function of time and temperature, said preservation state of said one product depending on said quantitative attribute value of said one product at said current time point, said method including:
- the method according to the invention enables determining the preservation state of the product also in conditions of storage in which the temperature did not remain constant within predefined tolerances, for instance with a period of storage in a refrigerator followed by a period of travel at ambient temperature followed by a period of storage in a refrigerator.
- the determined law of evolution is a function of time and temperature (and not of time only) and the successive temperatures taken by the product as from the initial time are used for determining the quantitative attribute value at the current time point.
- the invention Unlike commercially available software, even based on Arrhenius law (such as software commercialized by companies called AKTS and ASAP), the invention enables to obtain good precision performance even with a limited amount of experimental stability data.
- the invention is based on the observation that having - as in commercially available software - a single model involving an important number of parameters while providing a single statistical score for evaluating the quality of the found law of evolution, is not appropriate here because the amount of the experimental data set is low; and that in fact it is better to have a plurality of phenomenological models and to provide a plurality of estimators for discriminating the most appropriate model.
- a parameter is a constant value initially unknown making part of a relation which becomes - further to the determination of the value of each parameter on the basis of an experimental data set - a law of evolution giving the quantitative attribute value as a function of time and temperature.
- the invention is also directed, in a second aspect, to a computer system for carrying out the method as disclosed above, including a phenomenological library in which is stored a plurality of phenomenological models of evolution of a quantitative attribute value as a function of time and temperature, each said model having between three and nine parameters, said parameters including a quantitative attribute value at an initial time point, hereinafter termed initial quantitative attribute value parameter, said computer system further including an interface for entering an experimental stability data set, an equation resolution tool for computing a previously entered experimental stability data set for finding for each said model best fitting values for its parameters, and including an estimator production tool for finding predetermined estimators for each model, said estimators including a physico-chemical parameter likelihood estimator and a fit distance, said physico-chemical parameter likelihood estimator being based at least on a comparison between initial quantitative attribute values in the experimental data set and the best fitting value found for said each model for the initial quantitative attribute value parameter, said fit distance being based on a comparison between the values in the experimental data set and the corresponding values
- Figure 1 illustrates a group 10 of products 11 made in a batch according to a predefined specification, so that the products 11 are identical.
- the products 11 are perishable and there is thus a need to determine at a current time point, such as the present time point or a time point in the future, if a product 11 still has a good preservation state.
- the preservation state of a product 11 at a current time point depends on the value taken by a quantitative attribute of the product 11 evolving as a function of time and temperature.
- the product 11 is a vaccine dose to be administered to a patient and the quantitative attribute is the concentration of an active component in the vaccine dose.
- the preservation state of the product 11 is considered good if the concentration of active component is over the threshold and considered bad if the concentration of active component is below the threshold.
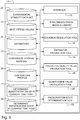
- This known method includes:
- step (i) experiments are conducted on the stability of the products 11.
- each data being a quantitative attribute value at time t for a product 11 stored at a temperature T.
- step (i) is finalised by carrying out the step of extrapolating the law of evolution from the experimental data set, assuming that the quantitative attribute value follows zero-order kinetics during long-term storage and that the quantitative attribute value is amenable to certain type of statistical analysis described in Appendix B of Q1E ICH guideline, including linear regression and poolability testing.
- step (ii) enables to determine the quantitative attribute value at time points different from the experimental time points at which the experimental stability data were generated, in particular time points beyond the period covered by the experimental stability data.
- step (iii) gives the preservation state of the product, for instance within or out of acceptance criteria involving a threshold for the quantitative attribute value.
- the determined law of evolution remains the same when it is determined from experimental stability data set generated from samples taken in other groups of products made in a batch according to the same predefined specification, for instance the determined law of evolution is determined with three successive groups of products made in a batch according to the same predefined specification.
- the law of evolution is also extrapolated from an experimental data set but on basis much more advanced than merely assuming that the quantitative attribute value follows zero-order kinetics during long-term storage and that the quantitative attribute value is amenable to certain type of statistical analysis described in Appendix B of Q1E ICH guideline, including linear regression and poolability testing.
- Figure 3 illustrates schematically a computer system 15 for helping to extrapolate from an experimental data set as described above a law of evolution of the quantitative attribute value as a function of time and temperature.
- the computer system 15 includes an interface 16 for input and output of data, a phenomenological models library 17, an equation resolution tool 18, an estimator production tool 19, a storage 20 for the experimental stability data set, a storage 21 for best fitting values of parameters found by the equation resolution tool 18 and a storage 22 for estimators found by the estimator production tool 19.
- the computer system 15 further includes a predictive quality value production tool 26 and a storage 27 for a confidence interval mapping produced by the predictive quality value production tool 26.
- the computer system 15 is also able to determine at a current time point the quantitative attribute value using the previously determined law of evolution and to determine the preservation state of one product 11 at this current time point using the previously determined quantitative attribute value at this current time point.
- the computer system 15 further includes accordingly a quantitative value calculation tool 28, a preservation state determination tool 29, a storage 30 for a temperature profile, a storage 31 for a determined quantitative value at a current time point and a storage 32 for a determined preservation state at a current time point.
- a distinct computer system such as an electronic Time Temperature Indicator (eTTI) can be configured with a similar quantitative value calculation tool, a similar preservation state determination tool, a similar storage for a temperature profile, a similar storage for a determined quantitative value at a current time point and a similar storage for a determined preservation state at a current time point, with of course an interface for input and output of data.
- eTTI electronic Time Temperature Indicator
- the computer system 15 is carried out here with a stand-alone computer such as a PC or Mac running a suitable program (for instance based on Matlab®), the interface 16 being the local display, keyboard and ports of the stand-alone computer.
- a stand-alone computer such as a PC or Mac running a suitable program (for instance based on Matlab®)
- the interface 16 being the local display, keyboard and ports of the stand-alone computer.
- the computer system is carried out differently, for instance with a server running a suitable program (for instance based on Matlab®), the interface 16 being carried out with a client, a communication link and the local interface of the server for connecting the client through the communication link.
- the library 17 are stored a plurality of phenomenological models of evolution of the quantitative attribute value of a product 11, here the concentration of active component in a vaccine dose.
- the phenomenological models are each based on the Arrhenius relationship between the kinetic constant k of a reaction and the temperature T.
- the Arrhenius relationship is based on the collision theory explaining that, for a reaction to occur between two particles or more, it is necessary that a collision occurs between these particles, in the right direction and with enough energy.
- Table 1 gives for each of these five models the expression of f(C), the expression of dC/dt and the expression of C(t) which is the analytic solution of integrating dC/dt at constant temperature.
- Table 1 Name of model Expression of f(C) Expression of dC/dt Expression of C(t) Order 0 -1 -k C0-kt Order 1 -C -kC C0 exp(-kt) Order 2 -C 2 -kC 2 1/(1/C0 + kt) Order 3 -C 3 -kC 3 1/(1/C0 2 + 2k t) 1/2 Order n -C n -kC n 1/(1/C0 n-1 + k (n-1) t) 1/(n-1)
- C0 is the quantitative attribute value (concentration of active component in a vaccine dose) at the initial time point.
- the value of the temperature T at which the product is stored and the values of parameters A, Ea and C0 (and also n for the model called Order n) enable to determine the quantitative attribute value C at a time t.
- the quantitative attribute value C at a time t if the temperature did not remain constant, provided that the temperature profile over the time is known (for example 60 days at 5°C as from the initial time, then 1 day at 25°C and then 10 days at 5°C) and provided that the determination is made iteratively, that is successively for each temperature step (for instance in the above example first determining the quantitative attribute value at 60 days starting with C0, then determining the quantitative attribute value at 61 days starting with the quantitative attribute value at 60 days for a duration of 1 day, then determining the quantitative attribute value at 71 days starting with the quantitative attribute value at 61 days for a duration of 10 days).
- Order 0 corresponds to a reaction of which the kinetics is independent of the concentrations of the components of the couple reactant/substrate. In biology, this is the case for certain enzyme-catalyzed reactions. In practice, this model applies as long as the substrate concentration remains high, for instance at the beginning of the reaction.
- Order 1 corresponds to a reaction of which the kinetics depends on the concentration of only one of the components of the couple reactant/substrate. This is the case for certain reactions of the same type as hydrolysis in aqueous media, oxidation at the air/water interface or enzyme catalysis.
- the model called Order 2 corresponds to a reaction of which the kinetics depends on the concentrations of both of the components of the couple reactant/substrate if the reaction is of the same type as polysaccharide saponification or as protein deamidation, or depends on the concentration of only one of the components of the couple reactant/substrate if the reaction is of the same type as protein dimerization.
- Order 3 corresponds to a reaction of which the kinetics depends on the concentration of both of the components of the couple reactant/substrate if one of them is bimolecular and if the reaction is of the same type as protein trimerisation.
- Order n corresponds to a reaction of which the kinetics depends on the concentration of both of the components of the couple reactant/substrate if one or both of them is/are bimolecular or multimolecular and if the reaction is of the same type as an ⁇ -helix protein structure break or an oligomerization greater than 3.
- Order n gives the same law of evolution as the model called Order 0, Order 1, Order 2 and Order 3 if n is respectively equal to zero, one, two and three.
- the model called Order n is useful for n which is not an integer number and/or is greater than three.
- the value of the temperature T at which the product is stored and the values of parameters C0, ⁇ , A1, Ea1, n1, A2, Ea2 and n2 enable to determine the quantitative attribute value C at a time t, by numerical integration.
- Finke-Watzky There are thus five parameters for the model called Finke-Watzky, namely C0, A1, Ea1, A2 and Ea2.
- the value of the temperature T at which the product is stored and the values of parameters C0, A1, Ea1, A2 and Ea2 enable to determine the quantitative attribute value C at a time t, by numerical integration.
- Finke-Watzky corresponds to a reaction of aggregation, like nucleation or germination, which is common in media with proteins, in particular if the latter are concentrated.
- Prout-Tompkins There are thus six parameters for the model called Prout-Tompkins, namely C0, A, Ea, n, m and ⁇ .
- the value of the temperature T at which the product is stored and the values of parameters C0, A, Ea, n, m and ⁇ enable to determine the quantitative attribute value C at a time t, by numerical integration.
- Prout-Tompkins corresponds to a reaction that is autocatalytic or progressively accelerated.
- Sestak n/p There are thus six parameters for the model called Sestak n/p, namely C0, A, Ea, n, p and ⁇ .
- the value of the temperature T at which the product is stored and the values of parameters C0, A, Ea, n, p and ⁇ enable to determine the quantitative attribute value C at a time t, by numerical integration.
- Sestak n/p corresponds to a reaction of order n that is progressively accelerated with a factor p limiting the diffusion of the reactants or of the degradation products. This reaction is of the same type as a hydrolysis in solid formulation.
- Sestak m/p There are thus six parameters for the model called Sestak m/p, namely C0, A, Ea, m, p and ⁇ .
- the value of the temperature T at which the product is stored and the values of parameters C0, A, Ea, m, p and ⁇ enable to determine the quantitative attribute value C at a time t, by numerical integration.
- Sestak m/p corresponds to a reaction of order m that is autocatalytic with a factor p limiting the reaction product or the diffusion of the reactant or of the degradation products. This reaction is of the same type as an oligomerization in solid formulation.
- Table 2 below recapitulates the parameters in the ten phenomenological models in the library 17: Table 2 Name of model Model parameters Order 0 A Ea C0 Order 1 A Ea C0 Order 2 A Ea C0 Order 3 A Ea C0 Order n A Ea C0 n Finke-Watzky A1 Ea1 C0 A2 Ea2 Prout-Tompkins A Ea C0 n m ⁇ Sestak n/p A Ea C0 n p ⁇ Sestak m/p A Ea C0 m p ⁇ Parallel reaction A1 Ea1 C0 A2 Ea2 ⁇ n1 n2
- the phenomenological models in the library 17 thus have between three and height parameters.
- the equation resolution tool 18 is able to compute a previously entered stability data set present in the storage 20 so as to find for each model in the library 17 best fitting values for the parameters.
- the best fitting values for the parameters are found by optimizing a function of the parameters selected as representative of the fit of C(t) to the experimental data set; the best fitting values of the parameters being the values for which the function is optimized.
- such function is the sum of the square of the differences between the values in the experimental data set and the corresponding values given by C(t); and the function is optimized by minimizing the sum of the square of the differences.
- the optimization of the function is performed by running an iterative algorithm, here carried out with the fminsearch function of Matlab® which is based on the Nelder-Mead simplex algorithm, from a starting set of values for the parameters.
- the values of the starting set are here randomly generated by the computer system 15, for instance by using a clock drift as a source of randomness.
- the iterative algorithm is then run for each model from this starting set of values and the found best fitting values are recorded in the storage 21.
- the estimator production tool 19 is able to find for each model in the library 17 various estimators for helping to evaluate the modelling quality of the model.
- One estimator is directed to the physico-chemical likelihood of the found parameters. It is recalled that since the models are phenomenological, the parameters each have a physico-chemical meaning so that it is possible to assign to each parameter a range of likely values, the values out of the range being unlikely, for instance a negative value for the activation energy Ea.
- estimators are based on quantitative statistics and qualitative (probabilistic) statistics.
- This estimator can be positive (good likelihood) or negative (bad likelihood).
- the physico-chemical likelihood estimator is positive except in the cases stated below for which the physico-chemical likelihood estimator is negative.
- the physico-chemical likelihood estimator is negative if the difference between the found initial quantitative attribute value parameter C0 and the initial experimental quantitative attribute value is greater than a predetermined threshold.
- the physico-chemical likelihood estimator is also negative if the found initial quantitative attribute value parameter C0 is lesser than 0.
- the threshold is 30% of the initial experimental quantitative attribute value (or 0.3 if the values are given on a logarithmic scale).
- the threshold is the value of the analytical standard deviation.
- the analytical standard deviation is conventionally a statistical measure of the precision of the measurements from which was obtained the experimental stability data set.
- the physico-chemical likelihood estimator is negative if Ea is lesser than 50 or greater than 1000 kJ/mol.
- the range 50-1000 kJ/mol is replaced by a narrower range, such as 50-500 kJ/mol or 50-300 kJ/mol.
- the physico-chemical likelihood estimator is negative if A is lesser than 1 or greater than 300 kJ/mol.
- the range 1-300 kJ/mol is replaced by a narrower range, such as 20-200 kJ/mol.
- the physico-chemical likelihood estimator is negative if ⁇ is lesser than 0 or greater than 1.
- the physico-chemical likelihood estimator is negative if n, m or p is lesser than 0 or greater than 10.
- the range 0-10 is replaced by a narrower range, such as 0-3.
- One estimator based on qualitative statistics is a fit distance based on a comparison between the values in the experimental stability data set present in the storage 20 and the corresponding values given by the model.
- the fit distance is here the square root of the sum of the squares of the differences between the values in the experimental stability data set and the corresponding values given by the model. The smaller the value of the fit distance, the better the model fits to the experimental data set.
- BIC Bayesian Information Criterion
- the BIC is interesting when comparing two models having a different number of parameters: if the lowest value of the BIC is for the model having the highest number of parameters, the modelling quality is in principle better for the model having the highest number of parameters.
- estimators based on qualitative statistics useful for comparing two models are the well known Akaike Information Criterion (AIC) and the likelihood ratio test (LLH).
- AIC Akaike Information Criterion
- LH likelihood ratio test
- the Fisher test is based on a comparison of the standard deviation of the values in the experimental stability data set (analytical standard deviation) with the standard deviation of the set of values given by the model at the corresponding time points (model standard deviation), so as to determine whether the analytical standard deviation is similar or lesser than the model standard deviation.
- Another estimator based on qualitative statistics is the result (positive or negative) of the Student t-test.
- the Student t-test is made only if the result of the Fisher test is positive.
- the Student t-test is based on a comparison of the mean of the values in the experimental stability data set (analytical mean) with the mean of the set of values given by the model at the corresponding time points (model mean).
- the Student t-test is here made using a 95% confidence level.
- the estimators found by the estimator production tool 19 are recorded in storage 22.
- the predictive quality value production tool 26 is able to find for a selected model in the library 17 for which best fitting values are found a confidence interval mapping.
- the confidence interval mapping includes a confidence interval (CI) for each of the found best fitting values.
- Such confidence intervals include each a lower value and an upper value between which is the best fitting value.
- the lower and upper values are here found using a Bayesian method.
- a Bootstrap method or a Jackknife method may be used instead of a Bayesian method.
- the experimental data set does not enable to find lower and upper values of the confidence interval which are significant, in particular for the models having the most numerous parameters.
- the found confidence interval mapping or the absence of significant interval mapping is stored in the storage 27.
- the experimental data set does not enable to find significant confidence intervals for the parameters, it could be tried to modify the experimental data set such as by adding one or more experimental point(s) and/or decided to select another model for which the experimental data set enables to find significant confidence intervals.
- the selected best model with the found best fitting values for its parameters thus becomes the determined law of evolution of the quantitative attribute value.
- the quantitative value calculation tool 28 is accordingly configured through the interface 16.
- the computer system 15 and in particular the quantitative value calculation tool 28 is thus aware of the determined law of evolution together with the confidence interval of each parameter value.
- the quantitative value calculation tool 28 determines the quantitative attribute value C at a current time point t by entering into the computer system 15 through the interface 16 the time t and a temperature profile over the time (for example 60 days at 5°C as from the initial time, then 1 day at 25°C and then 10 days at 5°C), this profile being recorded in the storage 30.
- the quantitative value calculation tool 28 determines the quantitative attribute value C at the current time point t by successive iterations, that is successively for each temperature step (for instance in the above example first determining the quantitative attribute value at 60 days starting with C0, then determining the quantitative attribute value at 61 days starting with the quantitative attribute value at 60 days for a duration of 1 day, then determining the quantitative attribute value at 71 days starting with the quantitative attribute value at 61 days for a duration of 10 days).
- the determined quantitative attribute value C at the current time point t is recorded in the storage 31.
- the quantitative value calculation tool is able, from the confidence intervals of the parameter values, to determine the confidence interval of the found quantitative attribute value C at the current time point.
- the determined confidence interval is recorded in the storage 31 together with determined quantitative attribute value C.
- the preservation state determination tool 29 is able to determine the preservation state of the product, for instance within or out of acceptance criteria involving a threshold for the quantitative attribute value taking into account the associated confidence interval.
- the determined preservation state of the product is recorded in the storage 32 and communicated to the user through the interface 16.
- certain products 11 randomly selected in the group 10 were stored at different constant temperatures within predefined tolerances and at a plurality of different experimental time points - including an experimental initial time point - the concentration in active component of the respective products under experiment were determined and recorded.
- Table 3 Time (days) Temperature (°C) SRD ( ⁇ g HA/ml) 0 4 798 5 4 769 12 4 670 20 4 906 27 4 766 37 4 635 0 25 798 2 25 755 5 25 746 8 25 650 12 25 578 16 25 569 20 25 630 23 25 543 27 25 524 34 25 548 37 25 460 0 37 798 2 37 603 5 37 574 8 3 288 12 37 333 16 37 332 20 37 316 23 37 316 27 37 297 34 37 274 37 37 261 0 45 798 2 45 350 5 45 248 8 45 167 12 45 119 16 45 96 20 45 70 23 45 78 27 45 59 34 45 53 37 45 45 45
- the quantitative attribute in the experimental data set listed in Table 3 is the HA Flu potency, determined by the SRID assay.
- the initial HA Flu potency (value at the initial time point) is the same, namely 798 ⁇ g/ml.
- the HA Flu potency decreases over time but it is noted that certain values in the experimental data set are over the initial HA Flu potency value or over preceding values (see for instance at 20 days for 4 °C and for 25°C). This is due to incertitude of measurement.
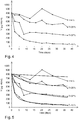
- Figure 4 of the drawings is a graph of the experimental data set listed in Table 3 with the HA Flu potency (in ⁇ g/ml) on the vertical axis and the time (in days) on the horizontal axis.
- the estimator production tool 19 was used for finding for each model the physico-chemical likelihood estimator, the fit distance, the BIC and the Fisher test and the t-test.
- Table 14 lists for each model the found distance, an aggregated likelihood estimator, the statistical distance, the BIC and a combined result of the Fisher test and the t-test. Also listed is the found initial quantitative attribute value parameter C0.
- the combined result of the Fisher test and the t-test is positive if the result of the Fisher test is positive and the result of the t-test is positive.
- the combined result of the Fisher test and the t-test is negative if the result of the Fisher test is negative (it is recalled that here the t-test is made only if the result of the Fisher test is positive).
- the aggregated likelihood estimator is positive except if at least one of the physico-chemical likelihood estimator and the combined result of the Fisher test and the t-test is negative.
- Table 14 Name of model Aggregated likelihood estimator C0 Fit distance BIC Result of Fisher and t-test Order 0 Negative 666.5354 677.0105 487.1686 Negative Order 1 Negative 726.1937 511.7331 465.3376 Negative Order 2 Negative 759.4342 382.5033 442.6345 Negative Order 3 Negative 769.7236 362.4647 438.4366 Negative Order n Negative 768.1091 360.0872 441.5876 Negative Parallel reaction Positive 796.3003 294.8143 440.6418 Positive Finke-Watzky Negative 726.1937 511.7331 472.6648 Negative Prout-Tompkins Negative 2657.0543 383.6597 453.8606 Negative Sestak n/p Negative 779.613 360.912 449.09
- the computer system 15 displays Table 14 to the user so as to give him a basis for selecting one model amongst the ten models in the library 17.
- One possibility for displaying the aggregated likelihood estimator is in the same column as the name of the models, with each cell giving the name of a respective model having a background taking one out of two predetermined colors, such as green for positive and orange for negative.
- Table 14 lists also the found initial quantitative attribute value parameter C0.
- the user might thus keep a model despite a negative aggregated likelihood estimator.
- the aggregated likelihood estimator is positive only for Parallel reaction (it is negative for all the other models).
- the model having the lowest fit distance is Parallel reaction (294.81) followed by Order n (360.09), Sestak n/p (360.91) and Order 3 (362.46).
- the model having the lowest BIC is Order 3 (438.43) followed by Parallel reaction (440.64), Order n (441.5876) and Order 2 (442.63).
- Figure 5 of the drawings is similar to Figure 4 but shows also the curves given by the model called Parallel reaction with the found best fitting values for the parameters.
- the preservation state determination tool 29 is able to determine the preservation state of the product, for instance within or out of acceptance criteria involving a threshold for the quantitative attribute value taking into account the associated confidence interval.
- the determined preservation state of the product is recorded in the storage 32 and communicated to the user through the interface 16.
- the modified experimental stability data set is:
- the modified experimental data set is for instance determined:
- the product is different from a vaccine dose to be administered to a patient, for instance another pharmaceutical product, a cosmetic product, a synthetic chemistry product or a food product, such products different from a vaccine dose having a degradation following the Arrhenius law, with in particular the direction of variation of the quantitative attribute value remaining the same (always decrease or always growth), unlike microbiological degradation for which there is a change in the direction of variation.
- the phenomenological models of evolution of the quantitative attribute value as a function of time and temperature are different, for instance with up to nine parameters.
- the computer system includes also models of evolution of the quantitative attribute value as a function of time and temperature which are phenomenological and include more than nine parameters, for example ten parameters; and/or models that are not phenomenological; and/or models of evolution of the quantitative attribute value as a function of time and temperature and other factors such as residual moisture, lighting and/or radiation.
- the estimators are different and/or displayed differently, for instance the display of the aggregated likelihood estimator is replaced by the display of the physico-chemical parameter likelihood estimator.
Landscapes
- Chemical & Material Sciences (AREA)
- Engineering & Computer Science (AREA)
- Bioinformatics & Cheminformatics (AREA)
- Computing Systems (AREA)
- Theoretical Computer Science (AREA)
- Bioinformatics & Computational Biology (AREA)
- Life Sciences & Earth Sciences (AREA)
- Crystallography & Structural Chemistry (AREA)
- Spectroscopy & Molecular Physics (AREA)
- Pharmacology & Pharmacy (AREA)
- Medicinal Chemistry (AREA)
- General Health & Medical Sciences (AREA)
- Physics & Mathematics (AREA)
- Health & Medical Sciences (AREA)
- Analytical Chemistry (AREA)
- Chemical Kinetics & Catalysis (AREA)
- Management, Administration, Business Operations System, And Electronic Commerce (AREA)
Priority Applications (7)
| Application Number | Priority Date | Filing Date | Title |
|---|---|---|---|
| EP19305709.8A EP3748639A1 (de) | 2019-06-03 | 2019-06-03 | Verfahren zum bestimmen eines konservierungszustandes eines produkts zu einem aktuellen zeitpunkt und computersystem zur durchführung des verfahrens |
| US17/615,989 US20220328139A1 (en) | 2019-06-03 | 2020-06-03 | Method for determining at a current time point a preservation state of one product and computer system for carrying out said method |
| JP2021571664A JP7494217B2 (ja) | 2019-06-03 | 2020-06-03 | 1つの製品の保存状態を現在の時点で特定する方法及び前記方法を実行するためのコンピュータシステム |
| CN202080040784.4A CN114026649A (zh) | 2019-06-03 | 2020-06-03 | 用于确定一个产品在当前时间点的保存状态的方法和用于执行所述方法的计算机系统 |
| EP20728787.1A EP3977465B1 (de) | 2019-06-03 | 2020-06-03 | Verfahren zum bestimmen eines konservierungszustandes eines produkts zu einem aktuellen zeitpunkt und computersystem zur durchführung des verfahrens |
| DK20728787.1T DK3977465T3 (da) | 2019-06-03 | 2020-06-03 | Fremgangsmåde til bestemmelse af et produkts bevaringstilstand på et givet tidspunkt og computersystem til udførelse af fremgangsmåden |
| PCT/EP2020/065263 WO2020245140A1 (en) | 2019-06-03 | 2020-06-03 | Method for determining at a current time point a preservation state of one product and computer system for carrying out said method |
Applications Claiming Priority (1)
| Application Number | Priority Date | Filing Date | Title |
|---|---|---|---|
| EP19305709.8A EP3748639A1 (de) | 2019-06-03 | 2019-06-03 | Verfahren zum bestimmen eines konservierungszustandes eines produkts zu einem aktuellen zeitpunkt und computersystem zur durchführung des verfahrens |
Publications (1)
| Publication Number | Publication Date |
|---|---|
| EP3748639A1 true EP3748639A1 (de) | 2020-12-09 |
Family
ID=67060345
Family Applications (2)
| Application Number | Title | Priority Date | Filing Date |
|---|---|---|---|
| EP19305709.8A Withdrawn EP3748639A1 (de) | 2019-06-03 | 2019-06-03 | Verfahren zum bestimmen eines konservierungszustandes eines produkts zu einem aktuellen zeitpunkt und computersystem zur durchführung des verfahrens |
| EP20728787.1A Active EP3977465B1 (de) | 2019-06-03 | 2020-06-03 | Verfahren zum bestimmen eines konservierungszustandes eines produkts zu einem aktuellen zeitpunkt und computersystem zur durchführung des verfahrens |
Family Applications After (1)
| Application Number | Title | Priority Date | Filing Date |
|---|---|---|---|
| EP20728787.1A Active EP3977465B1 (de) | 2019-06-03 | 2020-06-03 | Verfahren zum bestimmen eines konservierungszustandes eines produkts zu einem aktuellen zeitpunkt und computersystem zur durchführung des verfahrens |
Country Status (6)
| Country | Link |
|---|---|
| US (1) | US20220328139A1 (de) |
| EP (2) | EP3748639A1 (de) |
| JP (1) | JP7494217B2 (de) |
| CN (1) | CN114026649A (de) |
| DK (1) | DK3977465T3 (de) |
| WO (1) | WO2020245140A1 (de) |
Cited By (1)
| Publication number | Priority date | Publication date | Assignee | Title |
|---|---|---|---|---|
| JP2023127482A (ja) * | 2022-03-01 | 2023-09-13 | 株式会社島津製作所 | 試料分析装置、試料分析方法、医薬分析装置および医薬分析方法 |
Families Citing this family (3)
| Publication number | Priority date | Publication date | Assignee | Title |
|---|---|---|---|---|
| JP7600875B2 (ja) * | 2021-06-01 | 2024-12-17 | 株式会社島津製作所 | 試料分析装置、試料分析方法、医薬分析装置および医薬分析方法 |
| CN118395717B (zh) * | 2024-05-10 | 2024-11-05 | 山东法默康医药咨询有限公司 | 一种药品稳定性试验的数据处理方法、系统、装置及介质 |
| CN118260975B (zh) * | 2024-05-31 | 2024-08-06 | 上海交通大学四川研究院 | 基于自适应预分区机理的发动机燃烧室数值模拟方法 |
Citations (2)
| Publication number | Priority date | Publication date | Assignee | Title |
|---|---|---|---|---|
| US20040212509A1 (en) * | 2003-04-25 | 2004-10-28 | Zweig Stephen Eliot | Electronic time-temperature indicator and logger |
| KR20060087098A (ko) * | 2005-01-28 | 2006-08-02 | 주식회사 태평양 | 유효성분의 변성 거동 예측 방법 |
Family Cites Families (2)
| Publication number | Priority date | Publication date | Assignee | Title |
|---|---|---|---|---|
| JP3322242B2 (ja) * | 1998-06-15 | 2002-09-09 | 住友化学工業株式会社 | 化学物質の残存率の予測方法 |
| US20030158670A1 (en) | 2001-12-04 | 2003-08-21 | Philip Hougaard | Method of planning and performing stability studies |
-
2019
- 2019-06-03 EP EP19305709.8A patent/EP3748639A1/de not_active Withdrawn
-
2020
- 2020-06-03 US US17/615,989 patent/US20220328139A1/en active Pending
- 2020-06-03 JP JP2021571664A patent/JP7494217B2/ja active Active
- 2020-06-03 EP EP20728787.1A patent/EP3977465B1/de active Active
- 2020-06-03 DK DK20728787.1T patent/DK3977465T3/da active
- 2020-06-03 CN CN202080040784.4A patent/CN114026649A/zh active Pending
- 2020-06-03 WO PCT/EP2020/065263 patent/WO2020245140A1/en not_active Ceased
Patent Citations (2)
| Publication number | Priority date | Publication date | Assignee | Title |
|---|---|---|---|---|
| US20040212509A1 (en) * | 2003-04-25 | 2004-10-28 | Zweig Stephen Eliot | Electronic time-temperature indicator and logger |
| KR20060087098A (ko) * | 2005-01-28 | 2006-08-02 | 주식회사 태평양 | 유효성분의 변성 거동 예측 방법 |
Non-Patent Citations (4)
| Title |
|---|
| CLANCY DON ET AL: "Kinetic Model Development for Accelerated Stability Studies", AAPS PHARMSCITECH, SPRINGER US, NEW YORK, vol. 18, no. 4, 15 July 2016 (2016-07-15), pages 1158 - 1176, XP036223790, DOI: 10.1208/S12249-016-0565-4 * |
| EGAN W ET AL: "Basic principles of stability", BIOLOGICALS, ACADEMIC PRESS LTD., LONDON, GB, vol. 37, no. 6, 1 November 2009 (2009-11-01), pages 379 - 386, XP026748615, ISSN: 1045-1056, [retrieved on 20090831], DOI: 10.1016/J.BIOLOGICALS.2009.08.012 * |
| NAVERSNIK KLEMEN ET AL: "Humidity-corrected Arrhenius equation: The reference condition approach", INTERNATIONAL JOURNAL OF PHARMACEUTICS, ELSEVIER, NL, vol. 500, no. 1, 21 January 2016 (2016-01-21), pages 360 - 365, XP029416981, ISSN: 0378-5173, DOI: 10.1016/J.IJPHARM.2016.01.047 * |
| QUINTAS ET AL: "Modelling autocatalytic behaviour of a food model system-Sucrose thermal degradation at high concentrations", JOURNAL OF FOOD ENGINEERING, BARKING, ESSEX, GB, vol. 78, no. 2, 1 January 2007 (2007-01-01), pages 537 - 545, XP005584404, ISSN: 0260-8774, DOI: 10.1016/J.JFOODENG.2005.10.031 * |
Cited By (2)
| Publication number | Priority date | Publication date | Assignee | Title |
|---|---|---|---|---|
| JP2023127482A (ja) * | 2022-03-01 | 2023-09-13 | 株式会社島津製作所 | 試料分析装置、試料分析方法、医薬分析装置および医薬分析方法 |
| US12580052B2 (en) | 2022-03-01 | 2026-03-17 | Shimadzu Corporation | Sample analysis device, sample analysis method, pharmaceutical analysis device and pharmaceutical analysis method |
Also Published As
| Publication number | Publication date |
|---|---|
| EP3977465B1 (de) | 2025-08-27 |
| EP3977465A1 (de) | 2022-04-06 |
| JP2022535058A (ja) | 2022-08-04 |
| US20220328139A1 (en) | 2022-10-13 |
| WO2020245140A1 (en) | 2020-12-10 |
| DK3977465T3 (da) | 2025-11-17 |
| JP7494217B2 (ja) | 2024-06-03 |
| CN114026649A (zh) | 2022-02-08 |
Similar Documents
| Publication | Publication Date | Title |
|---|---|---|
| EP3977465B1 (de) | Verfahren zum bestimmen eines konservierungszustandes eines produkts zu einem aktuellen zeitpunkt und computersystem zur durchführung des verfahrens | |
| Possolo | Simple guide for evaluating and expressing the uncertainty of NIST measurement results | |
| Kupis et al. | Assessing the usability of the automated self-administered dietary assessment tool (ASA24) among low-income adults | |
| Rettew et al. | Meta‐analyses of agreement between diagnoses made from clinical evaluations and standardized diagnostic interviews | |
| Läer et al. | The in silico child: using simulation to guide pediatric drug development and manage pediatric pharmacotherapy | |
| Tang et al. | Use of machine learning for dosage individualization of vancomycin in neonates | |
| CA3122737C (en) | System and method for producing statistically valid assay means and ranges for quality control materials | |
| Medcalf et al. | Plasma metabolome normalization in rheumatoid arthritis following initiation of methotrexate and the identification of metabolic biomarkers of efficacy | |
| Boström et al. | Child's positive and negative impacts on parents—A person-oriented approach to understanding temperament in preschool children with intellectual disabilities | |
| Kweekel et al. | Busulfan interlaboratory proficiency testing program revealed worldwide errors in drug quantitation and dose recommendations | |
| Carter et al. | A patient-reported experience measure for community pharmacy including development of a short-form: The perceived service quality scale | |
| Cafaro et al. | A novel LC–MS/MS-based method for the diagnosis of ADA2 deficiency from dried plasma spot | |
| US10957217B2 (en) | Population-sample regression in the estimation of population proportions | |
| Olney et al. | 2023 APHL/ISNS newborn screening symposium | |
| Metayer et al. | One-carbon (folate) metabolism pathway at birth and risk of childhood acute lymphoblastic leukemia: a biomarker study in newborns | |
| Chen et al. | The sensitivity of three methods to nonnormality and unequal variances in interval estimation of effect sizes | |
| Schum et al. | Standardization of the co-parenting behavior questionnaire | |
| Veldman et al. | A Delphi survey study to formulate statements on the treatability of inherited metabolic disorders to decide on eligibility for newborn screening | |
| HK40065758B (en) | Method for determining at a current time point a preservation state of one product and computer system for carrying out said method | |
| HK40065758A (en) | Method for determining at a current time point a preservation state of one product and computer system for carrying out said method | |
| Hattemer et al. | Evaluation of hematocrit influence on self-monitoring of blood glucose based on ISO 15197: 2013: comparison of a novel system with five systems with different hematocrit ranges | |
| Mauliņa et al. | Experience of vancomycin therapeutic drug monitoring in two multidisciplinary hospitals in Latvia | |
| Braisted et al. | Effects of preanalytical sample collection and handling on comprehensive metabolite measurements in human urine biospecimens | |
| Eissa | Statistical comparison of parallel-line symmetrical microbiological models: Analysis of agar diffusion assay in 8 x 8 large rectangular plates | |
| Carstensen et al. | The effects of response burden–collecting life history data in a Self-Administered Mixed-Device Survey |
Legal Events
| Date | Code | Title | Description |
|---|---|---|---|
| PUAI | Public reference made under article 153(3) epc to a published international application that has entered the european phase |
Free format text: ORIGINAL CODE: 0009012 |
|
| STAA | Information on the status of an ep patent application or granted ep patent |
Free format text: STATUS: THE APPLICATION HAS BEEN PUBLISHED |
|
| AK | Designated contracting states |
Kind code of ref document: A1 Designated state(s): AL AT BE BG CH CY CZ DE DK EE ES FI FR GB GR HR HU IE IS IT LI LT LU LV MC MK MT NL NO PL PT RO RS SE SI SK SM TR |
|
| AX | Request for extension of the european patent |
Extension state: BA ME |
|
| STAA | Information on the status of an ep patent application or granted ep patent |
Free format text: STATUS: REQUEST FOR EXAMINATION WAS MADE |
|
| 17P | Request for examination filed |
Effective date: 20210517 |
|
| RBV | Designated contracting states (corrected) |
Designated state(s): AL AT BE BG CH CY CZ DE DK EE ES FI FR GB GR HR HU IE IS IT LI LT LU LV MC MK MT NL NO PL PT RO RS SE SI SK SM TR |
|
| STAA | Information on the status of an ep patent application or granted ep patent |
Free format text: STATUS: EXAMINATION IS IN PROGRESS |
|
| 17Q | First examination report despatched |
Effective date: 20210706 |
|
| STAA | Information on the status of an ep patent application or granted ep patent |
Free format text: STATUS: THE APPLICATION IS DEEMED TO BE WITHDRAWN |
|
| 18D | Application deemed to be withdrawn |
Effective date: 20211117 |