EP3745409A1 - Procédés et appareil pour générer une représentation graphique - Google Patents
Procédés et appareil pour générer une représentation graphique Download PDFInfo
- Publication number
- EP3745409A1 EP3745409A1 EP19177341.5A EP19177341A EP3745409A1 EP 3745409 A1 EP3745409 A1 EP 3745409A1 EP 19177341 A EP19177341 A EP 19177341A EP 3745409 A1 EP3745409 A1 EP 3745409A1
- Authority
- EP
- European Patent Office
- Prior art keywords
- treatment
- effectiveness
- graphical representation
- predicted
- indicator
- Prior art date
- Legal status (The legal status is an assumption and is not a legal conclusion. Google has not performed a legal analysis and makes no representation as to the accuracy of the status listed.)
- Withdrawn
Links
Images


Classifications
-
- G—PHYSICS
- G16—INFORMATION AND COMMUNICATION TECHNOLOGY [ICT] SPECIALLY ADAPTED FOR SPECIFIC APPLICATION FIELDS
- G16H—HEALTHCARE INFORMATICS, i.e. INFORMATION AND COMMUNICATION TECHNOLOGY [ICT] SPECIALLY ADAPTED FOR THE HANDLING OR PROCESSING OF MEDICAL OR HEALTHCARE DATA
- G16H20/00—ICT specially adapted for therapies or health-improving plans, e.g. for handling prescriptions, for steering therapy or for monitoring patient compliance
- G16H20/40—ICT specially adapted for therapies or health-improving plans, e.g. for handling prescriptions, for steering therapy or for monitoring patient compliance relating to mechanical, radiation or invasive therapies, e.g. surgery, laser therapy, dialysis or acupuncture
-
- G—PHYSICS
- G16—INFORMATION AND COMMUNICATION TECHNOLOGY [ICT] SPECIALLY ADAPTED FOR SPECIFIC APPLICATION FIELDS
- G16H—HEALTHCARE INFORMATICS, i.e. INFORMATION AND COMMUNICATION TECHNOLOGY [ICT] SPECIALLY ADAPTED FOR THE HANDLING OR PROCESSING OF MEDICAL OR HEALTHCARE DATA
- G16H50/00—ICT specially adapted for medical diagnosis, medical simulation or medical data mining; ICT specially adapted for detecting, monitoring or modelling epidemics or pandemics
- G16H50/20—ICT specially adapted for medical diagnosis, medical simulation or medical data mining; ICT specially adapted for detecting, monitoring or modelling epidemics or pandemics for computer-aided diagnosis, e.g. based on medical expert systems
-
- G—PHYSICS
- G16—INFORMATION AND COMMUNICATION TECHNOLOGY [ICT] SPECIALLY ADAPTED FOR SPECIFIC APPLICATION FIELDS
- G16H—HEALTHCARE INFORMATICS, i.e. INFORMATION AND COMMUNICATION TECHNOLOGY [ICT] SPECIALLY ADAPTED FOR THE HANDLING OR PROCESSING OF MEDICAL OR HEALTHCARE DATA
- G16H50/00—ICT specially adapted for medical diagnosis, medical simulation or medical data mining; ICT specially adapted for detecting, monitoring or modelling epidemics or pandemics
- G16H50/30—ICT specially adapted for medical diagnosis, medical simulation or medical data mining; ICT specially adapted for detecting, monitoring or modelling epidemics or pandemics for calculating health indices; for individual health risk assessment
-
- G—PHYSICS
- G16—INFORMATION AND COMMUNICATION TECHNOLOGY [ICT] SPECIALLY ADAPTED FOR SPECIFIC APPLICATION FIELDS
- G16H—HEALTHCARE INFORMATICS, i.e. INFORMATION AND COMMUNICATION TECHNOLOGY [ICT] SPECIALLY ADAPTED FOR THE HANDLING OR PROCESSING OF MEDICAL OR HEALTHCARE DATA
- G16H50/00—ICT specially adapted for medical diagnosis, medical simulation or medical data mining; ICT specially adapted for detecting, monitoring or modelling epidemics or pandemics
- G16H50/50—ICT specially adapted for medical diagnosis, medical simulation or medical data mining; ICT specially adapted for detecting, monitoring or modelling epidemics or pandemics for simulation or modelling of medical disorders
Definitions
- Embodiments herein relate to computer implemented methods for generating a graphical representation of a predicted effectiveness of a treatment, and systems and computer programs for the same.
- a medical professional may use various considerations to try to quantify the expected outcome of the selected treatment for the particular patient being treated. These may be patient specific such as the patient's age, their fitness for treatment or the expected improvement in quality of life following the treatment. A medical professional may also take into consideration factors specific to the disease or illness of the patient, such as the aggressiveness of the disease or the expected progression of the disease after treatment.
- a multitude of clinical models (or risk models) are available to support clinicians in their decision making. Examples of models may be found, for example, in the paper Lughezzani G et al.
- clinical models are available that can provide various indicators related to outcomes of a treatment
- these may be cumbersome to use, particularly if the medical professional has to interact with multiple disparate web pages, desktop applications or other application programming interfaces.
- it may be difficult to collate and compare information from different clinical models in order to select a treatment if the clinical models come from different sources in this way.
- a computer implemented method for generating a graphical representation of a predicted effectiveness of a first treatment comprises using a clinical model to determine at least one indicator related to an outcome of a first treatment, predicting an effectiveness of the first treatment, based on the at least one indicator, and displaying the effectiveness of the first treatment to a user using a first graphical representation.
- indications from clinical models may be combined into a single predicted effectiveness and displayed in a user-friendly manner in order to improve the decision making process of a medical professional.
- the medical professional may be able to make a more informed decision in a shorter time frame. This may provide a better user interface for selecting a treatment for a patient.
- predicting an effectiveness of the first treatment may comprise using a machine learning model to predict the effectiveness, based on the at least one indicator.
- the machine learning model may be trained to predict a survival outcome, a pathological outcome and/or a functional outcome of the first treatment.
- the machine learning model may comprise an ensemble classifier.
- predicting an effectiveness of the first treatment may comprise summing values of the at least one indicator and/or taking a weighted average of values of the at least one indicator.
- a height, width and/or area of a first portion of the first graphical representation may be determined by the predicted effectiveness of the first treatment.
- the first graphical representation may be divided into portions related to a survival outcome, pathological outcome and/or functional outcome of the treatment.
- the first graphical representation may be divided into portions corresponding to values of the at least one indicator.
- the method may further comprise predicting an effectiveness of a second treatment, and displaying the effectiveness of the second treatment to a user, using a second graphical representation.
- one of: a height, width and/or area of a second portion of the second graphical representation may be determined by a relative value of the predicted effectiveness of the first treatment and the predicted effectiveness of the second treatment.
- the method may further comprise: predicting an effectiveness of a second treatment, and displaying the effectiveness of the first treatment and the effectiveness of the second treatment in the first graphical representation.
- the effectiveness of the second treatment may be represented by a second portion in the first graphical representation and the second portion may be overlain on top of the first portion.
- the method may further comprise selecting a treatment for the patient, based on the predicted effectiveness of the first treatment and the predicted effectiveness of the second treatment.
- a system for generating a graphical representation of a predicted effectiveness of a first treatment comprises: a memory comprising instruction data representing a set of instructions, a user interface, and a processor configured to communicate with the memory and to execute the set of instructions.
- the set of instructions when executed by the processor, cause the processor to: use a clinical model to determine at least one indicator related to an outcome of a first treatment, predict an effectiveness of the first treatment, based on the at least one indicator, and send an instruction to the user interface to cause the user interface to display the effectiveness of the first treatment using a first graphical representation.
- a computer program product comprising a computer readable medium, the computer readable medium having computer readable code embodied therein, the computer readable code being configured such that, on execution by a suitable computer or processor, the computer or processor is caused to perform the method of the first aspect.
- Fig. 1 illustrates a computer-implemented method 100 of generating a graphical representation of a predicted effectiveness of a first treatment.
- the method comprises using a clinical model to determine at least one indicator related to an outcome of a first treatment (in block 102 of Fig. 1 ) and predicting an effectiveness of the first treatment, based on the at least one indicator (block 104 of Fig. 1 ).
- Method 100 also comprises displaying the effectiveness of the first treatment to a user, using a first graphical representation (block 106 of Fig. 1 ).
- indicators from different clinical models may be combined into a single overall prediction of an effectiveness of the treatment.
- the user e.g. medical professional
- the user is able to quickly obtain a summary of the underlying clinical models without the need to consult the individual clinical models directly (which may require different log-in details, different web pages or different desktop applications to be consulted).
- a medical professional's interactions with clinical models may be improved, enabling them to make more informed and quicker treatment selections for their patients.
- the first treatment may comprise any prospective treatment, treatment strategy or procedure that could be performed on a patient.
- the treatment may relate, for example, to oncology, and may comprise, for example a cancer treatment, such as a surgical procedure to remove a tumour.
- the treatment comprises a treatment for prostate cancer.
- the first treatment may comprise one of robotic surgery, retropubic surgery, brachytherapy or external beam radiotherapy.
- the first treatment may comprise a treatment strategy such as, for example, a nerve sparing plan or pelvic lymph node dissection.
- Clinical models include any model or framework that may be used to determine (e.g. predict or calculate) an indicator related to an outcome of the first treatment.
- a clinical model may link patient characteristics to an outcome of the treatment for the patient.
- Clinical models may take patient characteristics such as age, height, weight of the patient as input features and output an indicator related to an outcome (e.g. a clinical outcome, or quality of life outcome) of the first treatment.
- Examples of clinical models include, but are not limited to, those found in the following references: Lughezzani G et al (2010) "Predictive and Prognostic Models in Radical Prostatectomy Candidates: A Critical Analysis of the Literature "; Tosoian et al.
- An indicator may be in the form of a score, prediction, weighting, or any other indicator that may be used to provide an indicator of an outcome of the first treatment.
- examples of indicators of outcomes of the first treatment include, but are not limited to, measures of potency recovery at 6, 12 or 24 months, measures of continence recovery at 1, 3 or 12 months, lymph node invasion, Gleason score, and seminal vesicle invasion.
- measures of potency recovery at 6, 12 or 24 months measures of potency recovery at 6, 12 or 24 months
- measures of continence recovery at 1, 3 or 12 months measures of continence recovery at 1, 3 or 12 months
- lymph node invasion e.g., lymph node invasion, Gleason score, and seminal vesicle invasion.
- using (102) a clinical model to determine at least one indicator related to an outcome of a first treatment may comprise providing patient characteristics to the clinical model.
- the clinical model may process the patient characteristics and provide the at least one indicator based on the patient characteristics.
- Patient characteristics may be provided to the at least one clinical model in many ways, for example, by calling an application programming interface, API, associated with the model.
- the predicted effectiveness may comprise a score, rating or ranking derived from the at least one indicator (e.g. a combined score, rating or ranking derived from the output(s) of the clinical model(s)).
- the predicted effectiveness may relate to a survival outcome, a pathological outcome and/or a functional outcome (e.g. describing the working order of a body part) of the first treatment.
- predicting 104 an effectiveness of the first treatment, based on the at least one indicator may comprise combining or summarising one or more indicators into the predicted effectiveness.
- predicting 104 an effectiveness of the first treatment may comprise summing values of the at least one indicator and/or taking a weighted average of values of the at least one indicator.
- a plurality of indicators may be combined to form a prediction of the overall efficacy of the treatment.
- a combined prediction e.g. score or ranking
- different indicators may be grouped into different categories, for example functional, oncological or quality of life outcomes and the predicted effectiveness may be split into measures for each category.
- the number of categories and associated name of the category may be determined by the user (e.g. by receiving user input).
- the user may update (e.g. change) which indicators are associated with which categories.
- the medical professional may be able to configure the predicted effectiveness according to their needs and preferences.
- predicting an effectiveness of the first treatment may comprise using a machine learning model to predict the effectiveness, based on the at least one indicator.
- machine learning models comprise computer implemented mathematical models that may be trained to classify or make predictions based on a set of input features.
- the machine learning model takes the features as input and outputs a predicted classification or score.
- a machine learning model may be trained to predict the effectiveness of the first treatment based on the at least one indicator.
- the outputs of clinical models may be used as input features to a machine learning model.
- machine learning model that may be used to predict the effectiveness of the first treatment from input features comprising indicator(s) (e.g. outputs) from a clinical model.
- machine learning models include, but are not limited to, supervised machine learning models such as deep neural networks, logistic regression models, random forest models or ensemble classifiers.
- the machine learning model comprises an ensemble classifier.
- the method 100 may further comprise training the machine learning model to predict an effectiveness of the treatment from the at least one indicator.
- the machine learning model may be trained using training data comprising indicators and ground truth outcomes (e.g. the actual effectiveness of the treatment) for previous patients that have been treated using the same treatment.
- the first treatment comprises a treatment for prostate cancer
- the user comprises a urologist.
- predicting 104 an effectiveness of the first treatment, based on the at least one indicator comprises using an ensemble classifier.
- the ensemble classifier uses indicators of outcomes (e.g. predictions) from clinical models that are grouped into functional and oncological outcomes.
- An optimal weighted average of the indicators is learnt by the ensemble classifier by training the ensemble classifier on the indicators of each clinical model (e.g. the indicators produced by the clinical models are input features for the ensemble classifier).
- three ensemble classifiers are trained for predicting:
- survival endpoints e.g. the ground truth outcomes of the first treatment
- survival endpoints are defined as (classes represent increasingly worse outcomes):
- Using a machine model in this way allows a clinician to combine indicators into an overall predicted effectiveness of the treatment, reducing the complexity of multiple clinical models and multiple indications. Furthermore, the effectiveness in this sense may be defined by the training data and ground truth examples provided to the machine learning model. Thus the predicted effectiveness of the treatment may be tuned to reflect a particular medical professional's interests and preferred outcomes by defining the ground truth in the training examples.
- the machine learning model may be trained to predict a survival outcome, a pathological outcome and/or a functional outcome of the first treatment.
- a medical professional may be provided with different predictions allowing them to easily assess and weigh up the survival, pathological and functional prognosis associated with a treatment, This may help the medical professional to find an optimal balance between functional and oncological outcomes of a selected treatment.
- the method then comprises displaying the predicted effectiveness of the first treatment to a user, using a first graphical representation.
- the predicted effectiveness may be displayed using any suitable user interface (e.g. computer display screen), such as interface 806 as will be described below with respect to system 800.
- the predicted effectiveness may be displayed on a graphical user interface (GUI).
- GUI graphical user interface
- the GUI may be a user interactive GUI which may be configured to receive user input from the user (e.g. mouse clicks etc).
- a graphical representation may comprise any graph, chart, or any other diagram that may be used to visually display the predicted effectiveness to the user.
- the graphical representation may comprise a bar char, a pie chart, a scatter diagram or any other type of graph.
- the graphical representation may comprise a circular bar chart.
- a height, width and/or area of a first portion of the first graphical representation may be determined by the predicted effectiveness of the first treatment.
- the graphical representation comprises a circular bar chart
- the height, width or area of a bar in the circular bar chart may positively correlate with improved predicted outcomes.
- the first graphical representation may be divided into portions related to a survival outcome, pathological outcome and/or functional outcome of the treatment.
- the graphical representation comprises a circular bar chart
- method 100 may further comprise predicting an effectiveness of a second treatment, and displaying the effectiveness of the second treatment to a user, using a second graphical representation.
- the second treatment may, for example, comprise an alternative or competing treatment or treatment strategy to the first treatment.
- the user or medical professional may need to determine which of the first and second treatments is appropriate for the patient and select an appropriate treatment from the first and second treatment.
- Predicting an effectiveness of a second treatment may comprise any of the blocks outlined above for predicting an effectiveness of the first treatment, and the details of blocs 102 and 104 will be understood to apply equally to predicting the effectiveness of the second treatment.
- a height, width and/or area of a second bar in the second graphical representation may be determined by a relative value of the predicted effectiveness of the first treatment and the predicted effectiveness of the second treatment.
- the height, width or area of second bar in the second circular bar chart may be larger than the height, width or area of first bar in the first circular bar chart if the predicted effectiveness of the second treatment is greater than the predicted effectiveness of the first treatment.
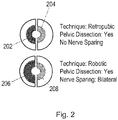
- Fig.2 shows an example embodiment where the first and second graphical representations comprise circular bar charts.
- the predicted effectiveness of two types of surgery e.g. two different surgical strategies
- Each treatment option has a different impact on quality of life and curability of the disease.
- the predicted effectiveness of a Retropubic procedure e.g. first treatment
- the predicted effectiveness of a Robotic procedure e.g. second treatment
- the predicted effectiveness comprises a predicted quality of life effectiveness and a predicted oncological effectiveness.
- the predicted quality of life effectiveness of the Retropubic and Robotic procedures are illustrated by bars 202 and 206 respectively and the predicted oncological effectiveness of the Retropubic and Robotic procedures are illustrated by bars 204 and 208 respectively.
- the two graphical representations visually embody the total quality of life impact and oncological impact of the respective treatments.
- the Robotic surgery (robotic with a bilateral nerve sparing surgery) has a more positive impact on quality of life, visualized as a larger portion (or bar) 206 compared to the quality of life portion 202 for the Retropubic option, as shown in Fig. 2 .
- the predicted effectiveness measures are calculated by summing of all indicators relating to quality of life and oncological outcome respectively.
- the method 100 may further comprise predicting an effectiveness of a second treatment, and displaying the effectiveness of the first treatment and the effectiveness of the second treatment in the first graphical representation.
- the user or medical professional may more quickly be able to compare the effectiveness of the two treatments.
- the effectiveness of the second treatment may be represented by a second portion in the first graphical representation and the second portion may be overlain on top of the first portion.
- Fig. 3 shows an embodiment wherein the first graphical representation comprises a circular bar chart 300.
- a first treatment is represented by the first portion (e.g. first bar) 302 shaded in light grey and a second treatment is represented by a second portion (e.g. second bar) 304 shaded in dark grey.
- the first and second portions 302, 304 represent the predicted functional effectiveness of the first treatment and the predicted functional effectiveness of the second treatment respectively.
- the portions 302, 304 are overlain for direct comparison such that it can easily be seen that the predicted functional effectiveness of the first treatment is better than that of the second treatment.
- the first graphical representation may be divided (or further divided) into portions corresponding to values of the at least one indicator. This enables a medical professional to consider both the predicted effectiveness of the first treatment and the underlying indicators related to individual outcomes (e.g. clinical model outputs) when selecting a treatment for a patient.
- portions (e.g. bars) 306, 308 on the right hand half of the graphical representation 300 represent the indicator "localised disease" of the first and second treatments respectively.
- Fig. 4 illustrates a further embodiment of the method 100.
- the graphical representation comprises a circular bar chart and the predicted effectiveness of a first and second treatment are represented by first and second portions 402, 404 respectively that are overlain on top of each other.
- the method comprises displaying a tool tip 406 displaying confidence intervals for the predicted effectiveness.
- the tool tip is displayed, for example, when the user hovers over or clicks on (e.g. with a mouse or other user input) a portion of the graphical display.
- Fig. 5 illustrates a further embodiment of the method 100.
- clicking on a portion representing a predicted effectiveness shows a tooltip 502 with first level details of the underlying clinical model(s) used in block 102.
- These may include a description of the clinical model(s) and the discriminating performance of the clinical model(s).
- the indicators produced by the clinical models may be accompanied by a colour code 506, for example, green, yellow and red corresponding to a discriminating performance larger than 80% (good performance), between 70% and 80% (moderate performance) and below 70% (poor performance), respectively.
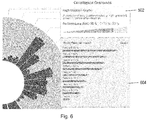
- clicking on the first level details 502 may reveal further details 604 of the underlying clinical model(s) that provide the indicators that are used to produce the predicted effectiveness.
- the further details may include the input patient characteristics used by the clinical models to produce the indicators and/or the relative impact each patient characteristic has on the discriminating performance of the respective clinical model.
- a user may be able to interact with the predicted effectiveness, clinical models and the underlying patient data used for training and testing the clinical models with real-time feedback.
- displaying 106 the predicted effectiveness of the first treatment to a user may comprise displaying the predicted effectiveness using a user interactive graphical user interface, GUI.
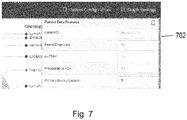
- the user may be able to provide user input, for example to change or modify, one or more patient characteristics that are used by the clinical model(s) to determine the at least one indicator. Modifying a patient characteristic in this way may, for example, update all indicators from clinical models that take the updated patient characteristic as an input parameter.
- the user input may be obtained using a text input field, 702.
- the user input may be used in real time to update the at least one indicator and thus update the predicted effectiveness of the first treatment.
- the user (medical professional) may thus modify a patient characteristic and observe in real-time the impact on the predicted effectiveness.
- the user may further modify the predicted effectiveness by adding and/or removing patient characteristics.
- the method 100 may then comprise real-time training and testing of a clinical model in order to determine an updated indicator related to an outcome of the first treatment. In this way, the user (medical professional) can determine how the predictive effectiveness is influenced by changes to the clinical models.
- the method 100 may further comprise selecting a treatment for the patient, based on the predicted effectiveness of the first treatment and the predicted effectiveness of the second treatment.
- the method may comprise selecting a treatment from a plurality of treatment options whereby the selected treatment has the highest predicted effectiveness. The selection may be made by the computer (or for example, by the System 800 as described below), thus providing a balanced treatment recommendation based on outputs from the one or more clinical models.
- the system 800 comprises a memory 804 comprising instruction data representing a set of instructions.
- the system 800 further comprises a processor 802 configured to communicate with the memory 804 and to execute the set of instructions.
- the set of instructions when executed by the processor may cause the processor to perform any of the embodiments of the method 100 as described above.
- the system 800 further comprises a user interface 806.
- the system 800 may comprise, for example, a personal desktop computer, a laptop, a tablet computer or a mobile phone.
- the system 800 may also be a distributed system, for example, one or more parts may be accessible over the internet. The skilled person will appreciate however that these are only examples of the system 800 and that other configurations are possible.
- the instruction data can comprise a plurality of software and/or hardware modules that are each configured to perform, or are for performing, individual or multiple blocks of the method described herein.
- the memory 804 may be part of a device that also comprises one or more other components of the system 800 (for example, the processor 802 and/or one or more other components of the system 800). In alternative embodiments, the memory 804 may be part of a separate device to the other components of the system 800.
- the memory 804 may comprise a plurality of sub-memories, each sub-memory being capable of storing a piece of instruction data.
- instruction data representing the set of instructions may be stored at a single sub-memory.
- instruction data representing the set of instructions may be stored at multiple sub-memories.
- the instruction data representing different instructions may be stored at one or more different locations in the system 800.
- the memory 804 may be used to store information, such as data relevant to calculations or determinations made by the processor 802 of the system 800 or from any other components of the system 800.
- the processor 802 can comprise one or more processors, processing units, multi-core processors and/or modules that are configured or programmed to control the system 800 in the manner described herein.
- the processor 802 may comprise a plurality of (for example, interoperated) processors, processing units, multi-core processors and/or modules configured for distributed processing. It will be appreciated by a person skilled in the art that such processors, processing units, multi-core processors and/or modules may be located in different locations and may perform different blocks and/or different parts of a single block of the method described herein.
- the system 800 further comprises a user interface (804) that may comprise a computer display, a screen or any other user interface that can be used to display information (e.g. such as the effectiveness of the first treatment, the graphical representation and/or the at least one indicator) to a user.
- a user interface 804 that may comprise a computer display, a screen or any other user interface that can be used to display information (e.g. such as the effectiveness of the first treatment, the graphical representation and/or the at least one indicator) to a user.
- system 800 may comprise other components.
- other components that may be comprised in system 800 include but are not limited to a user interface for inputting user information (e.g. such as a keyboard, touch-screen keyboard, mouse etc.), a communications interface for sending and/or receiving information and/or a power supply (e.g. a battery or power connection).
- user information e.g. such as a keyboard, touch-screen keyboard, mouse etc.
- communications interface for sending and/or receiving information and/or a power supply (e.g. a battery or power connection).
- a power supply e.g. a battery or power connection
- the set of instructions when executed by the processor 802, cause the processor 802 to use a clinical model to determine at least one indicator related to an outcome of a first treatment, predict an effectiveness of the first treatment, based on the at least one indicator, and send an instruction to the user interface 806 to cause the user interface to display the effectiveness of the first treatment using a first graphical representation.
- a clinical model predicting an effectiveness and sending an instruction to a user interface were described above with respect to the method 100 and the details therein will be understood to apply equally to the operation of the system 800.
- a computer program product comprising a non-transitory computer readable medium, the computer readable medium having computer readable code embodied therein, the computer readable code being configured such that, on execution by a suitable computer or processor, the computer or processor is caused to perform the method 100.
- module is intended to include a hardware component, such as a processor or a component of a processor configured to perform a particular function, or a software component, such as a set of instruction data that has a particular function when executed by a processor.
- the embodiments of the invention also apply to computer programs, particularly computer programs on or in a carrier, adapted to put the invention into practice.
- the program may be in the form of a source code, an object code, a code intermediate source and an object code such as in a partially compiled form, or in any other form suitable for use in the implementation of the method according to embodiments of the invention.
- a program may have many different architectural designs.
- a program code implementing the functionality of the method or system according to the invention may be sub-divided into one or more sub-routines. Many different ways of distributing the functionality among these sub-routines will be apparent to the skilled person.
- the sub-routines may be stored together in one executable file to form a self-contained program.
- Such an executable file may comprise computer-executable instructions, for example, processor instructions and/or interpreter instructions (e.g. Java interpreter instructions).
- one or more or all of the sub-routines may be stored in at least one external library file and linked with a main program either statically or dynamically, e.g. at run-time.
- the main program contains at least one call to at least one of the sub-routines.
- the sub-routines may also comprise function calls to each other.
- An embodiment relating to a computer program product comprises computer-executable instructions corresponding to each processing stage of at least one of the methods set forth herein.
- These instructions may be sub-divided into sub-routines and/or stored in one or more files that may be linked statically or dynamically.
- Another embodiment relating to a computer program product comprises computer-executable instructions corresponding to each means of at least one of the systems and/or products set forth herein. These instructions may be sub-divided into sub-routines and/or stored in one or more files that may be linked statically or dynamically.
- the carrier of a computer program may be any entity or device capable of carrying the program.
- the carrier may include a data storage, such as a ROM, for example, a CD ROM or a semiconductor ROM, or a magnetic recording medium, for example, a hard disk.
- the carrier may be a transmissible carrier such as an electric or optical signal, which may be conveyed via electric or optical cable or by radio or other means.
- the carrier may be constituted by such a cable or other device or means.
- the carrier may be an integrated circuit in which the program is embedded, the integrated circuit being adapted to perform, or used in the performance of, the relevant method.
- a computer program may be stored/distributed on a suitable medium, such as an optical storage medium or a solid-state medium supplied together with or as part of other hardware, but may also be distributed in other forms, such as via the Internet or other wired or wireless telecommunication systems. Any reference signs in the claims should not be construed as limiting the scope.
Landscapes
- Health & Medical Sciences (AREA)
- Engineering & Computer Science (AREA)
- Medical Informatics (AREA)
- Public Health (AREA)
- Epidemiology (AREA)
- Primary Health Care (AREA)
- General Health & Medical Sciences (AREA)
- Biomedical Technology (AREA)
- Databases & Information Systems (AREA)
- Pathology (AREA)
- Data Mining & Analysis (AREA)
- Nuclear Medicine, Radiotherapy & Molecular Imaging (AREA)
- Surgery (AREA)
- Urology & Nephrology (AREA)
- User Interface Of Digital Computer (AREA)
- Medical Treatment And Welfare Office Work (AREA)
Priority Applications (5)
| Application Number | Priority Date | Filing Date | Title |
|---|---|---|---|
| EP19177341.5A EP3745409A1 (fr) | 2019-05-29 | 2019-05-29 | Procédés et appareil pour générer une représentation graphique |
| PCT/EP2020/064061 WO2020239573A1 (fr) | 2019-05-29 | 2020-05-20 | Procédés et appareil pour générer une représentation graphique |
| CN202080040070.3A CN113892145A (zh) | 2019-05-29 | 2020-05-20 | 用于生成图形表示的方法和装置 |
| EP20726145.4A EP3977468A1 (fr) | 2019-05-29 | 2020-05-20 | Procédés et appareil pour générer une représentation graphique |
| US17/613,774 US20220230728A1 (en) | 2019-05-29 | 2020-05-20 | Methods and apparatus for generating a graphical representation |
Applications Claiming Priority (1)
| Application Number | Priority Date | Filing Date | Title |
|---|---|---|---|
| EP19177341.5A EP3745409A1 (fr) | 2019-05-29 | 2019-05-29 | Procédés et appareil pour générer une représentation graphique |
Publications (1)
| Publication Number | Publication Date |
|---|---|
| EP3745409A1 true EP3745409A1 (fr) | 2020-12-02 |
Family
ID=66676406
Family Applications (2)
| Application Number | Title | Priority Date | Filing Date |
|---|---|---|---|
| EP19177341.5A Withdrawn EP3745409A1 (fr) | 2019-05-29 | 2019-05-29 | Procédés et appareil pour générer une représentation graphique |
| EP20726145.4A Pending EP3977468A1 (fr) | 2019-05-29 | 2020-05-20 | Procédés et appareil pour générer une représentation graphique |
Family Applications After (1)
| Application Number | Title | Priority Date | Filing Date |
|---|---|---|---|
| EP20726145.4A Pending EP3977468A1 (fr) | 2019-05-29 | 2020-05-20 | Procédés et appareil pour générer une représentation graphique |
Country Status (4)
| Country | Link |
|---|---|
| US (1) | US20220230728A1 (fr) |
| EP (2) | EP3745409A1 (fr) |
| CN (1) | CN113892145A (fr) |
| WO (1) | WO2020239573A1 (fr) |
Citations (4)
| Publication number | Priority date | Publication date | Assignee | Title |
|---|---|---|---|---|
| WO2018201083A1 (fr) * | 2017-04-28 | 2018-11-01 | University Of Southern California | Système et procédé de prédiction de temps de survie |
| KR101943222B1 (ko) * | 2017-10-31 | 2019-01-28 | 고려대학교 산학협력단 | 치료 예측결과 및 근거 자료 일괄 제공 방법 및 시스템 |
| WO2019025270A1 (fr) * | 2017-08-01 | 2019-02-07 | Siemens Healthcare Gmbh | Évaluation non invasive et guidage de thérapie pour une coronaropathie dans des lésions diffuses et en tandem |
| US20190117151A1 (en) * | 2017-09-12 | 2019-04-25 | Bluesleep Ny, Llc | Method and System for Diagnosis and Prediction of Treatment Effectiveness for Sleep Apnea |
Family Cites Families (5)
| Publication number | Priority date | Publication date | Assignee | Title |
|---|---|---|---|---|
| US9256645B2 (en) * | 2013-08-15 | 2016-02-09 | Universal Research Solutions, Llc | Patient-to-patient communities |
| US9504529B2 (en) * | 2014-02-24 | 2016-11-29 | Vida Diagnostics, Inc. | Treatment outcome prediction for lung volume reduction procedures |
| US20170351835A1 (en) * | 2016-06-06 | 2017-12-07 | Accenture Global Solutions Limited | Disruption assessment tool |
| WO2020142551A1 (fr) * | 2018-12-31 | 2020-07-09 | Tempus Labs | Procédé et processus permettant de prédire et d'analyser une réponse, une progression et la survie de cohorte de patients |
| WO2020180471A1 (fr) * | 2019-03-01 | 2020-09-10 | Sanofi | Procédés permettant d'estimer l'efficacité d'un traitement médical |
-
2019
- 2019-05-29 EP EP19177341.5A patent/EP3745409A1/fr not_active Withdrawn
-
2020
- 2020-05-20 EP EP20726145.4A patent/EP3977468A1/fr active Pending
- 2020-05-20 US US17/613,774 patent/US20220230728A1/en active Pending
- 2020-05-20 WO PCT/EP2020/064061 patent/WO2020239573A1/fr unknown
- 2020-05-20 CN CN202080040070.3A patent/CN113892145A/zh active Pending
Patent Citations (4)
| Publication number | Priority date | Publication date | Assignee | Title |
|---|---|---|---|---|
| WO2018201083A1 (fr) * | 2017-04-28 | 2018-11-01 | University Of Southern California | Système et procédé de prédiction de temps de survie |
| WO2019025270A1 (fr) * | 2017-08-01 | 2019-02-07 | Siemens Healthcare Gmbh | Évaluation non invasive et guidage de thérapie pour une coronaropathie dans des lésions diffuses et en tandem |
| US20190117151A1 (en) * | 2017-09-12 | 2019-04-25 | Bluesleep Ny, Llc | Method and System for Diagnosis and Prediction of Treatment Effectiveness for Sleep Apnea |
| KR101943222B1 (ko) * | 2017-10-31 | 2019-01-28 | 고려대학교 산학협력단 | 치료 예측결과 및 근거 자료 일괄 제공 방법 및 시스템 |
Non-Patent Citations (4)
| Title |
|---|
| ALEMOZAFFAR ET AL.: "Prediction of erectile function following treatment for prostate cancer", JAMA, 2011 |
| LUGHEZZANI G ET AL., PREDICTIVE AND PROGNOSTIC MODELS IN RADICAL PROSTATECTOMY CANDIDATES: A CRITICAL ANALYSIS OF THE LITERATURE, 2010 |
| MARTINI ET AL.: "Development and internal validation of a side-specific, multiparametric magnetic resonance imaging-based nomogram for the prediction of extracapsular extension ofprostate cancer", BJU INT., 2018 |
| TOSOIAN ET AL.: "Prediction of pathological stage based on clinical stage, serum prostate -specific antigen, and biopsy Gleason score: Partin Tables in the contemporary era", BJU INT, 2017 |
Also Published As
| Publication number | Publication date |
|---|---|
| CN113892145A (zh) | 2022-01-04 |
| EP3977468A1 (fr) | 2022-04-06 |
| WO2020239573A1 (fr) | 2020-12-03 |
| US20220230728A1 (en) | 2022-07-21 |
Similar Documents
| Publication | Publication Date | Title |
|---|---|---|
| Barbati et al. | Optimization of multiple satisfaction levels in portfolio decision analysis | |
| US20170053064A1 (en) | Personalized content-based patient retrieval system | |
| US20200151186A1 (en) | Cognitive Computer Assisted Attribute Acquisition Through Iterative Disclosure | |
| CA3179983A1 (fr) | Plate-forme d'apprentissage automatique pour generation de modeles de risque | |
| JP2014512624A (ja) | 予測モデリング | |
| US10971255B2 (en) | Multimodal learning framework for analysis of clinical trials | |
| US20200074313A1 (en) | Determining features to be included in a risk assessment instrument | |
| US20130282404A1 (en) | Integrated access to and interation with multiplicity of clinica data analytic modules | |
| CN107578140A (zh) | 引导分析系统和方法 | |
| Lagani et al. | Realization of a service for the long-term risk assessment of diabetes-related complications | |
| JP2023550009A (ja) | 前立腺がん転帰の人工知能予測 | |
| Coccoli et al. | Adopting cognitive computing solutions in healthcare | |
| Kaye et al. | Association between early confirmatory testing and the adoption of active surveillance for men with favorable-risk prostate cancer | |
| Marti-Bonmati et al. | Considerations for artificial intelligence clinical impact in oncologic imaging: an AI4HI position paper | |
| Raith et al. | Integrating Data Envelopment Analysis into radiotherapy treatment planning for head and neck cancer patients | |
| Santander-Jiménez et al. | Performance evaluation of dominance-based and indicator-based multiobjective approaches for phylogenetic inference | |
| Macchia et al. | Multidisciplinary tumor board smart virtual assistant in locally advanced cervical cancer: A proof of concept | |
| US11842810B1 (en) | Real-time feedback systems for tracking behavior change | |
| US20220230728A1 (en) | Methods and apparatus for generating a graphical representation | |
| Wong et al. | Patient centered care for prostate cancer—how can artificial intelligence and machine learning help make the right decision for the right patient? | |
| Kruzikas et al. | Using agent-based modeling to inform regional health care system investment and planning | |
| Hasannejadasl et al. | A comparison of machine learning models for predicting urinary incontinence in men with localized prostate cancer | |
| Dubey et al. | Using machine learning for healthcare treatment planning | |
| Haq et al. | Towards survival prediction of cancer patients using medical images | |
| Imperiale et al. | Risk stratification strategies for colorectal cancer screening: from logistic regression to artificial intelligence |
Legal Events
| Date | Code | Title | Description |
|---|---|---|---|
| PUAI | Public reference made under article 153(3) epc to a published international application that has entered the european phase |
Free format text: ORIGINAL CODE: 0009012 |
|
| STAA | Information on the status of an ep patent application or granted ep patent |
Free format text: STATUS: THE APPLICATION HAS BEEN PUBLISHED |
|
| AK | Designated contracting states |
Kind code of ref document: A1 Designated state(s): AL AT BE BG CH CY CZ DE DK EE ES FI FR GB GR HR HU IE IS IT LI LT LU LV MC MK MT NL NO PL PT RO RS SE SI SK SM TR |
|
| AX | Request for extension of the european patent |
Extension state: BA ME |
|
| STAA | Information on the status of an ep patent application or granted ep patent |
Free format text: STATUS: THE APPLICATION IS DEEMED TO BE WITHDRAWN |
|
| 18D | Application deemed to be withdrawn |
Effective date: 20210603 |