EP3739682A1 - Battery system, vehicle, and method for controlling battery system - Google Patents
Battery system, vehicle, and method for controlling battery system Download PDFInfo
- Publication number
- EP3739682A1 EP3739682A1 EP20171038.1A EP20171038A EP3739682A1 EP 3739682 A1 EP3739682 A1 EP 3739682A1 EP 20171038 A EP20171038 A EP 20171038A EP 3739682 A1 EP3739682 A1 EP 3739682A1
- Authority
- EP
- European Patent Office
- Prior art keywords
- cell
- distribution
- current
- resistance
- salt concentration
- Prior art date
- Legal status (The legal status is an assumption and is not a legal conclusion. Google has not performed a legal analysis and makes no representation as to the accuracy of the status listed.)
- Pending
Links
Images





Classifications
-
- H—ELECTRICITY
- H01—ELECTRIC ELEMENTS
- H01M—PROCESSES OR MEANS, e.g. BATTERIES, FOR THE DIRECT CONVERSION OF CHEMICAL ENERGY INTO ELECTRICAL ENERGY
- H01M10/00—Secondary cells; Manufacture thereof
- H01M10/42—Methods or arrangements for servicing or maintenance of secondary cells or secondary half-cells
- H01M10/425—Structural combination with electronic components, e.g. electronic circuits integrated to the outside of the casing
- H01M10/4257—Smart batteries, e.g. electronic circuits inside the housing of the cells or batteries
-
- H—ELECTRICITY
- H02—GENERATION; CONVERSION OR DISTRIBUTION OF ELECTRIC POWER
- H02J—ELECTRIC POWER NETWORKS; CIRCUIT ARRANGEMENTS OR SYSTEMS FOR SUPPLYING OR DISTRIBUTING ELECTRIC POWER; SYSTEMS FOR STORING ELECTRIC ENERGY
- H02J7/00—Circuit arrangements for charging or discharging batteries or for supplying loads from batteries
- H02J7/80—Circuit arrangements for charging or discharging batteries or for supplying loads from batteries including monitoring or indicating arrangements
-
- B—PERFORMING OPERATIONS; TRANSPORTING
- B60—VEHICLES IN GENERAL
- B60L—PROPULSION OF ELECTRICALLY-PROPELLED VEHICLES; SUPPLYING ELECTRIC POWER FOR AUXILIARY EQUIPMENT OF ELECTRICALLY-PROPELLED VEHICLES; ELECTRODYNAMIC BRAKE SYSTEMS FOR VEHICLES IN GENERAL; MAGNETIC SUSPENSION OR LEVITATION FOR VEHICLES; MONITORING OPERATING VARIABLES OF ELECTRICALLY-PROPELLED VEHICLES; ELECTRIC SAFETY DEVICES FOR ELECTRICALLY-PROPELLED VEHICLES
- B60L50/00—Electric propulsion with power supplied within the vehicle
- B60L50/50—Electric propulsion with power supplied within the vehicle using propulsion power supplied by batteries or fuel cells
- B60L50/60—Electric propulsion with power supplied within the vehicle using propulsion power supplied by batteries or fuel cells using power supplied by batteries
- B60L50/66—Arrangements of batteries
-
- B—PERFORMING OPERATIONS; TRANSPORTING
- B60—VEHICLES IN GENERAL
- B60L—PROPULSION OF ELECTRICALLY-PROPELLED VEHICLES; SUPPLYING ELECTRIC POWER FOR AUXILIARY EQUIPMENT OF ELECTRICALLY-PROPELLED VEHICLES; ELECTRODYNAMIC BRAKE SYSTEMS FOR VEHICLES IN GENERAL; MAGNETIC SUSPENSION OR LEVITATION FOR VEHICLES; MONITORING OPERATING VARIABLES OF ELECTRICALLY-PROPELLED VEHICLES; ELECTRIC SAFETY DEVICES FOR ELECTRICALLY-PROPELLED VEHICLES
- B60L58/00—Methods or circuit arrangements for monitoring or controlling batteries or fuel cells, specially adapted for electric vehicles
- B60L58/10—Methods or circuit arrangements for monitoring or controlling batteries or fuel cells, specially adapted for electric vehicles for monitoring or controlling batteries
-
- H—ELECTRICITY
- H01—ELECTRIC ELEMENTS
- H01M—PROCESSES OR MEANS, e.g. BATTERIES, FOR THE DIRECT CONVERSION OF CHEMICAL ENERGY INTO ELECTRICAL ENERGY
- H01M10/00—Secondary cells; Manufacture thereof
- H01M10/42—Methods or arrangements for servicing or maintenance of secondary cells or secondary half-cells
- H01M10/4207—Methods or arrangements for servicing or maintenance of secondary cells or secondary half-cells for several batteries or cells simultaneously or sequentially
-
- H—ELECTRICITY
- H01—ELECTRIC ELEMENTS
- H01M—PROCESSES OR MEANS, e.g. BATTERIES, FOR THE DIRECT CONVERSION OF CHEMICAL ENERGY INTO ELECTRICAL ENERGY
- H01M10/00—Secondary cells; Manufacture thereof
- H01M10/42—Methods or arrangements for servicing or maintenance of secondary cells or secondary half-cells
- H01M10/425—Structural combination with electronic components, e.g. electronic circuits integrated to the outside of the casing
-
- H—ELECTRICITY
- H01—ELECTRIC ELEMENTS
- H01M—PROCESSES OR MEANS, e.g. BATTERIES, FOR THE DIRECT CONVERSION OF CHEMICAL ENERGY INTO ELECTRICAL ENERGY
- H01M10/00—Secondary cells; Manufacture thereof
- H01M10/42—Methods or arrangements for servicing or maintenance of secondary cells or secondary half-cells
- H01M10/44—Methods for charging or discharging
-
- H—ELECTRICITY
- H01—ELECTRIC ELEMENTS
- H01M—PROCESSES OR MEANS, e.g. BATTERIES, FOR THE DIRECT CONVERSION OF CHEMICAL ENERGY INTO ELECTRICAL ENERGY
- H01M10/00—Secondary cells; Manufacture thereof
- H01M10/42—Methods or arrangements for servicing or maintenance of secondary cells or secondary half-cells
- H01M10/44—Methods for charging or discharging
- H01M10/441—Methods for charging or discharging for several batteries or cells simultaneously or sequentially
-
- H—ELECTRICITY
- H01—ELECTRIC ELEMENTS
- H01M—PROCESSES OR MEANS, e.g. BATTERIES, FOR THE DIRECT CONVERSION OF CHEMICAL ENERGY INTO ELECTRICAL ENERGY
- H01M10/00—Secondary cells; Manufacture thereof
- H01M10/42—Methods or arrangements for servicing or maintenance of secondary cells or secondary half-cells
- H01M10/44—Methods for charging or discharging
- H01M10/448—End of discharge regulating measures
-
- H—ELECTRICITY
- H01—ELECTRIC ELEMENTS
- H01M—PROCESSES OR MEANS, e.g. BATTERIES, FOR THE DIRECT CONVERSION OF CHEMICAL ENERGY INTO ELECTRICAL ENERGY
- H01M10/00—Secondary cells; Manufacture thereof
- H01M10/42—Methods or arrangements for servicing or maintenance of secondary cells or secondary half-cells
- H01M10/48—Accumulators combined with arrangements for measuring, testing or indicating the condition of cells, e.g. the level or density of the electrolyte
-
- H—ELECTRICITY
- H02—GENERATION; CONVERSION OR DISTRIBUTION OF ELECTRIC POWER
- H02J—ELECTRIC POWER NETWORKS; CIRCUIT ARRANGEMENTS OR SYSTEMS FOR SUPPLYING OR DISTRIBUTING ELECTRIC POWER; SYSTEMS FOR STORING ELECTRIC ENERGY
- H02J7/00—Circuit arrangements for charging or discharging batteries or for supplying loads from batteries
- H02J7/40—Circuit arrangements for charging or discharging batteries or for supplying loads from batteries characterised by the exchange of charge or discharge related data
- H02J7/443—Circuit arrangements for charging or discharging batteries or for supplying loads from batteries characterised by the exchange of charge or discharge related data using passive battery identification means, e.g. resistors or capacitors
-
- H—ELECTRICITY
- H02—GENERATION; CONVERSION OR DISTRIBUTION OF ELECTRIC POWER
- H02J—ELECTRIC POWER NETWORKS; CIRCUIT ARRANGEMENTS OR SYSTEMS FOR SUPPLYING OR DISTRIBUTING ELECTRIC POWER; SYSTEMS FOR STORING ELECTRIC ENERGY
- H02J7/00—Circuit arrangements for charging or discharging batteries or for supplying loads from batteries
- H02J7/50—Circuit arrangements for charging or discharging batteries or for supplying loads from batteries acting upon multiple batteries simultaneously or sequentially
- H02J7/52—Circuit arrangements for charging or discharging batteries or for supplying loads from batteries acting upon multiple batteries simultaneously or sequentially for charge balancing, e.g. equalisation of charge between batteries
-
- H—ELECTRICITY
- H01—ELECTRIC ELEMENTS
- H01M—PROCESSES OR MEANS, e.g. BATTERIES, FOR THE DIRECT CONVERSION OF CHEMICAL ENERGY INTO ELECTRICAL ENERGY
- H01M10/00—Secondary cells; Manufacture thereof
- H01M10/42—Methods or arrangements for servicing or maintenance of secondary cells or secondary half-cells
- H01M10/425—Structural combination with electronic components, e.g. electronic circuits integrated to the outside of the casing
- H01M2010/4271—Battery management systems including electronic circuits, e.g. control of current or voltage to keep battery in healthy state, cell balancing
-
- H—ELECTRICITY
- H01—ELECTRIC ELEMENTS
- H01M—PROCESSES OR MEANS, e.g. BATTERIES, FOR THE DIRECT CONVERSION OF CHEMICAL ENERGY INTO ELECTRICAL ENERGY
- H01M2220/00—Batteries for particular applications
- H01M2220/20—Batteries in motive systems, e.g. vehicle, ship, plane
-
- Y—GENERAL TAGGING OF NEW TECHNOLOGICAL DEVELOPMENTS; GENERAL TAGGING OF CROSS-SECTIONAL TECHNOLOGIES SPANNING OVER SEVERAL SECTIONS OF THE IPC; TECHNICAL SUBJECTS COVERED BY FORMER USPC CROSS-REFERENCE ART COLLECTIONS [XRACs] AND DIGESTS
- Y02—TECHNOLOGIES OR APPLICATIONS FOR MITIGATION OR ADAPTATION AGAINST CLIMATE CHANGE
- Y02E—REDUCTION OF GREENHOUSE GAS [GHG] EMISSIONS, RELATED TO ENERGY GENERATION, TRANSMISSION OR DISTRIBUTION
- Y02E60/00—Enabling technologies; Technologies with a potential or indirect contribution to GHG emissions mitigation
- Y02E60/10—Energy storage using batteries
-
- Y—GENERAL TAGGING OF NEW TECHNOLOGICAL DEVELOPMENTS; GENERAL TAGGING OF CROSS-SECTIONAL TECHNOLOGIES SPANNING OVER SEVERAL SECTIONS OF THE IPC; TECHNICAL SUBJECTS COVERED BY FORMER USPC CROSS-REFERENCE ART COLLECTIONS [XRACs] AND DIGESTS
- Y02—TECHNOLOGIES OR APPLICATIONS FOR MITIGATION OR ADAPTATION AGAINST CLIMATE CHANGE
- Y02T—CLIMATE CHANGE MITIGATION TECHNOLOGIES RELATED TO TRANSPORTATION
- Y02T10/00—Road transport of goods or passengers
- Y02T10/60—Other road transportation technologies with climate change mitigation effect
- Y02T10/70—Energy storage systems for electromobility, e.g. batteries
Definitions
- the present disclosure relates to a battery system including a secondary battery, a vehicle on which the battery system is mounted, and a method for controlling a battery system including a secondary battery.
- salt concentration unevenness uneven salt concentration distribution
- high rate deterioration or the like in distinction from deterioration over time
- Japanese Patent Laying-Open No. 2018-81807 discloses a battery system capable of suppressing the progress of high rate deterioration of a secondary battery.
- the high rate deterioration is mitigated by performing prescribed charging and discharging processes (first to third processes), and then, external charging is performed.
- the progress of the high rate deterioration caused by performing external charging can be suppressed.
- the present disclosure has been made to solve the above-described problem, and an object of the present disclosure is to provide a battery system capable of accurately calculating a current distribution in a secondary battery (cell), a vehicle on which the battery system is mounted, and a method for controlling the battery system.
- a battery system and a vehicle include: a secondary battery (cell); and a controller that calculates a current distribution in the cell using a circuit network model, the circuit network model being obtained by geometrically modeling an interior of the cell using a plurality of resistance elements and a plurality of power storage elements.
- the controller calculates the current distribution in the cell by applying, to the circuit network model, a resistance distribution in the cell calculated based on a salt concentration distribution in the cell.
- a method for controlling a battery system is a method for controlling a battery system including a secondary battery (cell), the method including: calculating a salt concentration distribution in the cell; calculating a resistance distribution in the cell based on the calculated salt concentration distribution; and calculating a current distribution in the cell using a circuit network model, the circuit network model being obtained by geometrically modeling an interior of the cell using a plurality of resistance elements and a plurality of power storage elements.
- the calculating the current distribution includes calculating the current distribution in the cell using the circuit network model to which the resistance distribution calculated in the calculating the resistance distribution is applied.
- the current distribution in the cell is calculated using the above-described circuit network model, and the current distribution caused by a geometric structure of the cell can thereby be calculated. Furthermore, the resistance distribution in the cell calculated based on the salt concentration distribution in the cell is applied to the above-described circuit network model. Therefore, according to the battery system, the vehicle and the control method, the current distribution in the cell can be accurately calculated, with consideration given to the geometric structure of the cell and the salt concentration distribution in the cell.
- the controller may execute control of suppressing charging and discharging of the cell, when a magnitude of a current in the cell based on the calculated current distribution exceeds a threshold value.
- the method for controlling a battery system may further include executing control of suppressing charging and discharging of the cell, when a magnitude of a current in the cell based on the calculated current distribution exceeds a threshold value.
- a maximum current value in the cell can be accurately estimated based on the calculated current distribution, and thus, charging and discharging can be suppressed without excess or deficiency.
- Fig. 1 is an overall configuration diagram of a vehicle on which a battery system according to the present embodiment is mounted.
- an electric vehicle including an MG 10 as a motive power source will be representatively described below, the vehicle according to the present disclosure is not necessarily limited to such an electric vehicle.
- the vehicle according to the present disclosure may be a hybrid vehicle on which an engine is further mounted as a motive power source, or may be a fuel cell vehicle on which a fuel cell is further mounted.
- a vehicle 1 includes a battery system 2, a motor generator (hereinafter, referred to as “MG”) 10, a motive power transmission gear 20, a driving wheel 30, a power control unit (hereinafter, referred to as “PCU”) 40, and a system main relay (hereinafter, referred to as "SMR”) 50.
- Battery system 2 includes a battery pack 100, a voltage sensor 210, a current sensor 220, a temperature sensor 230, and an electronic control unit (hereinafter, referred to as "ECU”) 300.
- MG 10 is a motor generator driven by PCU 40 and is, for example, a three-phase AC synchronous motor including a permanent magnet embedded in a rotor. MG 10 is supplied with electric power from battery pack 100 and rotates a drive shaft. MG 10 can also perform regenerative power generation during braking of vehicle 1. Electric power generated by MG 10 is rectified by PCU 40 and stored in battery pack 100.
- PCU 40 converts the electric power stored in battery pack 100 to AC power and supplies the AC power to MG 10 in accordance with a control signal from ECU 300. In addition, PCU 40 rectifies the AC power generated by MG 10 during braking of vehicle 1 and supplies the rectified power to battery pack 100.
- PCU 40 includes, for example, an inverter that drives MG 10, and a converter that performs voltage conversion between battery pack 100 and the inverter.
- Battery pack 100 is a rechargeable power storage element.
- Battery pack 100 is formed by connecting a plurality of (n) secondary batteries (cells) 110 in series, and each cell 110 is, for example, a lithium ion secondary battery, a nickel metal hydride secondary battery or the like.
- the lithium ion secondary battery is a secondary battery including lithium as an electric charge carrier, and may include a so-called all-solid-state battery including a solid electrolyte, in addition to a general lithium ion secondary battery including a liquid electrolyte.
- Battery pack 100 can supply the stored electric power to MG 10 through PCU 40.
- battery pack 100 can receive the electric power generated by MG 10 during deceleration of vehicle 1 through PCU 40 and store the electric power.
- battery pack 100 can be charged by a power supply external to the vehicle, using a charging device for charging battery pack 100 by the above-described power supply.
- SMR 50 is provided between PCU 40 and battery pack 100. SMR 50 performs switching between supply and cutoff of the electric power between PCU 40 and battery pack 100 in accordance with a control signal from ECU 300.
- Voltage sensor 210 is provided for each cell 110 and detects a voltage Vb across terminals of each cell 110.
- Current sensor 220 detects a current Ib input and output to and from battery pack 100.
- Temperature sensor 230 is provided for each cell 110 and detects a temperature Tb of each cell 110. A detection value of each sensor is output to ECU 300.
- ECU 300 includes a CPU (Central Processing Unit) 301, a memory (a ROM (Read Only Memory) and a RAM (Random Access Memory)) 302, and an input and output buffer (not shown).
- CPU 301 loads a program stored in the ROM into the RAM or the like and executes the program.
- a process performed by ECU 300 is written on the program stored in the ROM.
- the cell As a capacity of the cell becomes larger, a size of the cell becomes larger. Therefore, the cell has current unevenness caused by a geometric structure of the cell, and in the cell, there are a portion where a relatively large current flows and a portion where a small current flows. Thus, simply by checking an input and an output to and from cell 110 or battery pack 100, the cell cannot in some cases be protected from an overcurrent appropriately.
- a current distribution in cell 110 is calculated using a circuit network model obtained by modeling a circuit in cell 110 using a plurality of resistance elements and a plurality of power storage elements. As a result, the current distribution in cell 110 caused by the geometric structure of cell 110 can be calculated.
- the current distribution in cell 110 is affected not only by the geometric structure of cell 110 but also by a salt concentration distribution occurring in cell 110. Accordingly, in the battery system according to the present embodiment, the salt concentration distribution in cell 110 is calculated and a resistance distribution calculated based on the salt concentration distribution is applied to the above-described circuit network model. As a result, the current distribution in cell 110 can be accurately calculated, with consideration given to the geometric structure of cell 110 and the salt concentration distribution in cell 110.
- circuit network model of cell 110 will be first described, and then, the current distribution in cell 110 will be described.
- Fig. 2 is a side view showing a configuration example of an electrode assembly of cell 110.
- an electrode assembly 112 is partitioned into a plurality of portions 114 and a circuit network model (hereinafter, referred to as "ladder circuit network model") obtained by modeling each portion 114 using at least one of resistance elements and power storage elements is set.
- ladder circuit network model a circuit network model obtained by modeling each portion 114 using at least one of resistance elements and power storage elements.
- electrode assembly 112 is partitioned into 20 portions 114 of 4 ⁇ 5.
- Fig. 3 is a cross-sectional view taken along line III-III in Fig. 2 .
- electrode assembly 112 includes current collecting foils 122 and 126, a positive electrode active material layer 123, a negative electrode active material layer 125, and a separator 124.
- Positive electrode active material layer 123 is a layer including a positive electrode active material, a conductive material and a binder, and is formed on a surface of current collecting foil 122. A portion of current collecting foil 122 on which positive electrode active material layer 123 is not formed is provided with a positive electrode tab 120.
- negative electrode active material layer 125 is a layer including a negative electrode active material, a conductive material and a binder, and is formed on a surface of current collecting foil 126. A portion of current collecting foil 126 on which negative electrode active material layer 125 is not formed is provided with a negative electrode tab 121.
- Separator 124 is provided to be in contact with both positive electrode active material layer 123 and negative electrode active material layer 125.
- Positive electrode active material layer 123, negative electrode active material layer 125 and separator 124 are impregnated with an electrolyte.
- Fig. 4 is a diagram for illustrating an example of the ladder circuit network model.
- a lateral direction is defined as an x direction
- a vertical direction is defined as a z direction
- a depth direction is defined as a y direction.
- each portion 114 includes a partial structure 116.
- 20 partial structures 116 are arranged in a matrix form of 4 ⁇ 5 on an x-y plane.
- Partial structure 116 includes at least a resistance element Rz and a power storage element Vz. One end of resistance element Rz and one end of power storage element Vz are connected in series along the z direction.
- Partial structure 116 is obtained by modeling a portion of electrode assembly 112 formed of positive electrode active material layer 123 and separator 124.
- Partial structure 116 includes resistance elements Rx and Ry, depending on its position. At least one of one end of resistance element Rx and one end of resistance element Ry is connected to each of an upper contact point of the other end of resistance element Rz and a lower contact point of the other end of power storage element Vz. Adjacent partial structures 116 are connected by resistance elements Rx and Ry. These resistance elements Rx and Ry are obtained by modeling a portion of the current collecting foils of electrode assembly 112.
- Fig. 5 schematically shows an example of a flow of a current in cell 110.
- Fig. 5 shows an example of the flow of the current based on the geometric structure of cell 110, and it is assumed that there is no salt concentration unevenness (high rate deterioration) in cell 110.
- positive electrode tab 120 and negative electrode tab 121 are formed along the same side in the rectangular electrode assembly.
- the current flows efficiently along a current route having a short distance between the tabs, and thus, a relatively large current flows along the current route having the short distance between the tabs and a relatively small current flows along a current route having a long distance between the tabs (a thickness of a line indicates the magnitude of the current).
- Fig. 6 shows an example of the current distribution in cell 110.
- Fig. 6 shows the normalized magnitude (e.g., a ratio to an average value) of the current in each of 20 portions 114 of electrode assembly 112, and shows that a larger current flows as a numeric value is larger.
- Fig. 6 also shows an example of the current distribution based on the geometric structure of cell 110, and it is assumed that there is no salt concentration unevenness in cell 110.
- the current is maximized in a region 130 including a current route having a relatively short distance between the tabs, not in a central portion of cell 110.
- the current is relatively small in a portion including a current route having a relatively long distance between the tabs.
- the current unevenness in the cell there is current unevenness in the cell, and the current unevenness is greater particularly in a large-sized cell, and thus, it is necessary to control charging and discharging or the like with consideration given to the current distribution in the cell.
- the current distribution in the cell is affected not only by such a geometric structure of cell 110 but also by the salt concentration distribution in the cell.
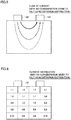
- Fig. 7 shows an example of the salt concentration distribution in cell 110.
- Fig. 7 shows, by way of example, the salt concentration distribution when there is salt concentration unevenness in an excessive discharging state (salt concentration unevenness caused by discharging at a high rate).
- a dotted line group indicates an iso-salt concentration line, and a salt concentration becomes higher with increasing distance from the center.
- the salt concentration increases from a center toward an end of cell 110.
- an internal resistance is relatively high and the current is relatively less likely to flow.
- an excessive charging state a state in which there is salt concentration unevenness caused by charging at a high rate
- the salt concentration increases with decreasing distance from the center of cell 110.
- Fig. 8 shows an example of a resistance distribution that occurs in cell 110 due to salt concentration unevenness.
- Fig. 8 shows a normalized increase or decrease (e.g., a ratio to an average value) in internal resistance in each of 20 portions 114 of electrode assembly 112 due to salt concentration unevenness, and shows that a resistance is higher as a numeric value is larger.
- Fig. 8 also shows, by way of example, the resistance distribution when there is salt concentration unevenness in the excessive discharging state.
- the internal resistance increases from the central portion toward the end of cell 110. That is, the internal resistance is the lowest in a region 132 near the center of cell 110. Therefore, when the salt concentration distribution shown in Fig. 7 occurs, the current becomes less likely to flow with decreasing distance from the end of cell 110, and the current is more likely to flow in the region near the center of cell 110 than in the end of cell 110.
- the salt concentration distribution in cell 110 is calculated and the resistance distribution in cell 110 (increase or decrease in internal resistance in each portion) is calculated based on the salt concentration distribution.
- the resistance distribution shown in Fig. 8 is calculated based on the calculated salt concentration distribution.
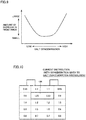
- Fig. 9 shows a relationship between the degree of the salt concentration and an amount of increase in internal resistance. Referring to Fig. 9 , the amount of increase in resistance becomes larger as the salt concentration becomes higher. When the salt concentration decreases, the amount of increase in resistance also becomes larger.
- the resistance distribution ( Fig. 8 ) in cell 110 can be calculated based on the salt concentration distribution.
- the resistance distribution calculated based on the salt concentration distribution is applied to the ladder circuit network model.
- the calculated resistance distribution (the normalized amount of increase or decrease in internal resistance) is multiplied by the resistance elements that form the ladder circuit network model, to thereby incorporate the resistance distribution calculated based on the salt concentration distribution into the ladder circuit network model.
- the current distribution in cell 110 can be accurately calculated, with consideration given to the geometric structure of cell 110 and the salt concentration distribution in cell 110.
- Fig. 10 shows an example of the current distribution with consideration given to the salt concentration distribution.
- Fig. 10 corresponds to Fig. 6 showing the current distribution with no consideration given to the salt concentration unevenness.
- the current is maximized in a region 134 shown in the figure, not in a region (region 130 in Fig. 6 ) including a current route having a relatively short distance between the tabs. Therefore, when the current flowing through region 134 exceeds a limiting value, an input and an output to and from battery pack 100 are suppressed to thereby suppress an input and an output to and from cell 110. Thus, cell 110 can be protected from an overcurrent.
- Fig. 11 is a flowchart showing an example of a procedure of a process performed by ECU 300. The process shown in this flowchart is performed for each cell 110 of battery pack 100, and is repeatedly performed every prescribed cycle while the system of vehicle 1 is active.
- ECU 300 performs a salt concentration distribution calculation process of calculating a salt concentration distribution in cell 110 to be computed (hereinafter, referred to as "target cell”) (step S10).
- target cell a salt concentration distribution calculation process of calculating a salt concentration distribution in cell 110 to be computed
- ECU 300 calculates a resistance distribution in the target cell based on the salt concentration distribution calculated in step S10 (step S20). Specifically, ECU 300 reads, from memory 302, the preliminarily prepared map or relational equation indicating the relationship between the salt concentration and the amount of increase in resistance shown in Fig. 9 , and calculates an amount of increase in resistance for each portion 114 of the target cell using the above-described map. The resistance distribution based on the salt concentration distribution thus calculated is reflected in the ladder circuit network model used in a current distribution calculation process described below.
- ECU 300 performs the current distribution calculation process of calculating a current distribution in the target cell (step S30). The details of the current distribution calculation process will be described below.
- ECU 300 determines whether or not a maximum current value obtained from the calculated current distribution exceeds a threshold value (step S40).
- the threshold value is appropriately determined based on the specifications, a preliminary evaluation test or the like of cell 110 so as to prevent an overcurrent from occurring in cell 110.
- ECU 300 executes charging and discharging suppression control of suppressing charging and discharging of battery pack 100 (step S50). For example, ECU 300 suppresses charging and discharging of battery pack 100 by reducing a discharging power upper limit value Wout that defines an upper limit of the discharging power of battery pack 100, and a charging power upper limit value Win that defines an upper limit of the charging power of battery pack 100.
- step S40 When it is determined in step S40 that the maximum current value is equal to or smaller than the threshold value (NO in step S40), ECU 300 moves the process to Return without performing step S50.
- Fig. 12 is a flowchart showing an example of a procedure of the salt concentration distribution calculation process performed in step S10 in Fig. 11 .
- ECU 300 obtains a detection value of temperature Tb of the target cell from temperature sensor 230 (step S110).
- ECU 300 calculates a flow rate of an electrolyte in the target cell using obtained temperature Tb (step S120).
- the flow rate of the electrolyte can be calculated using a known method.
- a subscript j is used to make a distinction among a negative electrode plate, a positive electrode plate and a separator, and subscript j includes "n”, “p” and “s”.
- subscript j indicates a value about the negative electrode (negative electrode active material layer 125).
- subscript j indicates a value about the positive electrode (positive electrode active material layer 123).
- subscript j indicates a value about the separator.
- a predetermined fixed value can be used as viscosity ⁇ , or viscosity ⁇ can be changed depending on a temperature of the electrolyte.
- Temperature Tb detected by temperature sensor 230 is used as the temperature of the electrolyte.
- Density p is a parameter that defines expansion and contraction of the electrolyte, and indicates a value corresponding to expansion and contraction of the electrolyte. Expansion and contraction of the electrolyte depends on the temperature (temperature Tb) of the electrolyte, and density ⁇ also depends on the temperature of the electrolyte. Therefore, by preliminarily preparing information (map or computational equation) indicating a correspondence relation between density ⁇ and temperature Tb by an experiment or the like, density ⁇ can be specified based on the detection value of temperature Tb. By specifying density p, expansion and contraction of the electrolyte can be grasped. Predetermined fixed values can be used as volume fraction ⁇ e,j and transmission coefficient K j .
- Equation (1) flow rate u j and pressure p are unknown. Therefore, by defining the continuous equation indicated by Equation (2) and solving a simultaneous equation of Equations (1) and (2), flow rate u j and pressure p can be calculated.
- Equations (1) and (2) include density ⁇ that defines expansion and contraction of the electrolyte, and thus, by solving the simultaneous equation of Equations (1) and (2), flow rate u j corresponding to expansion and contraction of the electrolyte can be calculated.
- convergence calculation can, for example, be performed using Equations (1) and (2).
- the computation using Equations (1) and (2) is performed every prescribed cycle, and flow rate u j can be calculated by using, in a current computation, a value calculated in a previous computation.
- flow rate u j (i.e., flow rate u n ) is calculated for each position in negative electrode active material layer 125.
- flow rate u j (i.e., flow rate u p ) is calculated for each position in positive electrode active material layer 123.
- separator 124 the electrolyte moves in separator 124. Therefore, flow rate u j (i.e., flow rate us) is calculated for each position in separator 124.
- ECU 300 calculates a salt concentration distribution in the target cell based on calculated flow rate u j of the electrolyte.
- the salt concentration distribution can also be calculated using a known method. Japanese Patent Laying-Open No.
- the first term of the left side of Equation (3) defines a change in salt concentration for a prescribed time period ⁇ t.
- the second term of the left side defines a change in salt concentration that depends on a flow (flow rate u j ) of the electrolyte.
- the first term of the right side defines a diffusion state of the salt in the electrolyte.
- the second term of the right side defines an amount of the generated salt.
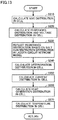
- Fig. 13 is a flowchart showing an example of a procedure of the current distribution calculation process performed in step S30 in Fig. 11 .
- ECU 300 first estimates an SOC (State Of Charge) distribution in the target cell (step S210). Specifically, ECU 300 calculates the SOC distribution in the target cell by calculating an SOC of power storage element Vz included in each portion (each partial structure 116) of the target cell.
- SOC State Of Charge
- ⁇ Cdeg n (t-1) represents a capacity deterioration rate (previous value) of power storage element Vz.
- the capacity deterioration rate indicates a rate of decrease in full charge capacity of power storage element Vz from an initial value. As the capacity deterioration rate becomes lower than 1, power storage element Vz becomes more deteriorated, and as the capacity deterioration rate becomes closer to 1, power storage element Vz becomes less deteriorated.
- ⁇ t represents a computation cycle.
- Various initial values may be set using a result of detection by each sensor.
- ECU 300 calculates the SOCs (e.g., SOC 1 to SOC 20 ) of power storage elements Vz of 20 partial structures 116, using Equation (4).
- ECU 300 calculates a resistance distribution and a voltage distribution in the target cell (step S220).
- ECU 300 calculates the resistance distribution in the target cell by, for example, calculating a resistance value of each of resistance elements Rx, Ry and Rz included in the ladder circuit network model ( Fig. 4 ).
- the resistance values of the plurality of resistance elements included in the ladder circuit network model are preset by, for example, adaptation of a reference value at a reference temperature and a reference SOC by an experiment or the like.
- the resistance values of the plurality of resistance elements Rx, Ry and Rz included in the ladder circuit network model change in accordance with an amount of deviation from the reference temperature and an amount of deviation from the reference SOC.
- ECU 300 calculates the resistance values of resistance elements Rx, Ry and Rz, using the SOC (current value) of each partial structure 116 and the temperature (previous value) of each partial structure 116. ECU 300 calculates the resistance values of resistance elements Rx, Ry and Rz, using a prescribed map, for example.
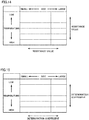
- Fig. 14 shows an example of a relationship among the temperature, the SOC, and the resistance value of each of resistance elements Rx, Ry and Rz in each partial structure 116 in cell 110.
- the temperature and the SOC are partitioned into a plurality of regions and the resistance value of each of resistance elements Rx, Ry and Rz corresponding to the temperature and the SOC is set for each partitioned region.
- ECU 300 calculates the resistance value of each of resistance elements Rx, Ry and Rz included in each partial structure 116, using an SOC (current value) of each partial structure 116, a temperature (previous value) of each partial structure 116, and the map shown in Fig. 14 .
- ECU 300 multiplies the calculated resistance value of each of resistance elements Rx, Ry and Rz by a resistance deterioration rate (previous value) corresponding to each partial structure 116, to thereby calculate a resistance value (current value) of each of resistance elements Rx, Ry and Rz.
- the resistance deterioration rate indicates a rate of increase in resistance value of each resistance element from an initial value. As the resistance deterioration rate becomes higher than 1, the resistance element becomes more deteriorated, and as the resistance deterioration rate becomes closer to 1, the resistance element becomes less deteriorated.
- ECU 300 calculates the voltage distribution by calculating a voltage of power storage element Vz in each partial structure 116 in the target cell.
- the voltages of the plurality of power storage elements Vz included in the ladder circuit network model are preset by, for example, adaptation of a reference value at a reference temperature and a reference SOC by an experiment or the like.
- the voltages of the plurality of power storage elements Vz included in the ladder circuit network model change in accordance with an amount of deviation from the reference temperature and an amount of deviation from the reference SOC. Therefore, ECU 300 calculates the voltage of each power storage element Vz, using the SOC (current value) of each partial structure 116 and the temperature (previous value) of each partial structure 116.
- ECU 300 calculates the voltage of each power storage element Vz, using a prescribed map, for example.
- the prescribed map indicates the relationship among the temperature, the SOC and the voltage, similarly to the map indicating the relationship among the temperature, the SOC and the resistance value as shown in Fig. 14 , and thus, detailed description thereof will not be repeated.
- ECU 300 reflects the resistance distribution in the target cell calculated based on the salt concentration distribution in step S20 in Fig. 11 in the resistance distribution calculated in step S220 (step S230). Specifically, ECU 300 multiplies each resistance element in each partial structure 116 in the ladder circuit network model by the corresponding amount of increase in resistance calculated based on the salt concentration distribution, to thereby correct the value of each resistance element in the ladder circuit network model.
- ECU 300 calculates a deterioration distribution in the target cell (step S240). Specifically, ECU 300 estimates a deterioration coefficient distribution, and estimates a deterioration amount distribution using the estimated deterioration coefficient distribution.
- a deterioration coefficient includes a capacity deterioration coefficient for calculating an amount of deterioration in capacity, and a resistance deterioration coefficient for calculating an amount of deterioration in resistance. ECU 300 calculates the deterioration coefficient distribution by calculating the capacity deterioration coefficient and the resistance deterioration coefficient corresponding to each partial structure 116.
- Both the capacity deterioration coefficient and the resistance deterioration coefficient are values that depend on the SOC and the temperature in each partial structure 116 in cell 110. Therefore, ECU 300 calculates the capacity deterioration coefficient and the resistance deterioration coefficient corresponding to each partial structure 116, using the SOC (current value) of each partial structure 116 and the temperature (previous value) of each partial structure 116. ECU 300 calculates the capacity deterioration coefficient and the resistance deterioration coefficient corresponding to each partial structure 116, using a prescribed map, for example.
- Fig. 15 shows an example of a relationship among the temperature, the SOC and the deterioration coefficient in each partial structure 116 in cell 110.
- the temperature and the SOC are partitioned into a plurality of regions, and the capacity deterioration coefficient and the resistance deterioration coefficient corresponding to the temperature and the SOC are set for each partitioned region.
- ECU 300 calculates the capacity deterioration coefficient and the resistance deterioration coefficient, using the SOC (current value) of each partial structure 116, the temperature (previous value) of each partial structure 116, and the map shown in Fig. 15 .
- ECU 300 estimates the deterioration amount distribution using the estimated deterioration coefficient distribution.
- An amount of deterioration includes an amount of deterioration in capacity indicating an amount of decrease in full charge capacity from an initial value, and an amount of deterioration in resistance indicating an amount of increase in resistance value from an initial value.
- ECU 300 calculates an amount of deterioration in capacity (current value) corresponding to each partial structure 116, using the calculated capacity deterioration coefficient (current value) corresponding to each partial structure 116 and the amount of deterioration in capacity (previous value).
- ECU 300 calculates an amount of deterioration in resistance (current value) corresponding to each partial structure 116, using the calculated resistance deterioration coefficient (current value) corresponding to each partial structure 116 and the amount of deterioration in resistance (previous value).
- Crd n (t) represents a resistance deterioration coefficient (current value).
- ECU 300 calculates a resistance deterioration rate by, for example, adding the amount of deterioration in resistance (current value) to a reference value of the resistance value of each resistance element to thereby obtain a value, and dividing the value by the reference value of the resistance value of each resistance element.
- ECU 300 calculates a current distribution in the target cell (step S250). ECU 300 calculates the current distribution in the target cell by calculating a current flowing through each of resistance elements Rx, Ry and Rz and each power storage element Vz, using the resistance distribution in which the salt concentration distribution is reflected in step S230 and the voltage distribution calculated in step S220.
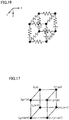
- Fig. 16 shows a cubic lattice formed by eight contact points in a part of the ladder circuit network model.
- Fig. 17 shows generalized coordinates of the eight contact points of the cubic lattice.
- Fig. 18 shows resistance elements Rx (i, j, k), Ry (i, j, k) and Rz (i, j, k) and a power storage element Vz (i, j, k) connected to a contact point (i, j, k).
- Fig. 19 is a diagram for illustrating loop currents.
- a resistance element arranged along a positive direction of an x axis with respect to the contact point (i, j, k) is defined as Rx (i, j, k)
- a resistance element arranged along a positive direction of a y axis with respect to the contact point (i, j, k) is defined as Ry (i, j, k)
- a resistance element arranged along a positive direction of a z axis with respect to the contact point (i, j, k) is defined as Rz (i, j, k)
- the power storage element is defined as Vz (i, j, k).
- a loop of a current is expressed by an orthogonal coordinate. That is, a current that loops on a y-z plane orthogonal to the x axis is defined as Ix, a current that loops on an x-z plane orthogonal to the y axis is defined as Iy, and a current that loops on an x-y plane orthogonal to the z axis is defined as Iz.
- resistance element Rx (i, j, k)
- a current that loops from the positive direction side of the z axis, a current that loops from the negative direction side of the z axis, a current that loops from the positive direction side of the y axis, and a current that loops from the negative direction side of the y axis overlap with one another.
- a current that loops from the positive direction side of the x axis, a current that loops from the negative direction side of the x axis, a current that loops from the positive direction side of the z axis, and a current that loops from the negative direction side of the z axis overlap with one another.
- a voltage RyI (i, j, k) of resistance element Ry (i, j, k) is expressed like the following equation:
- RyI i j k Ry i j k ⁇ Ix i j k ⁇ Iz i j k ⁇ Ix i , j , k ⁇ 1 + Iz i ⁇ 1 , j , k
- a current that loops from the positive direction side of the x axis, a current that loops from the negative direction side of the x axis, a current that loops from the positive direction side of the y axis, and a current that loops from the negative direction side of the y axis overlap with one another.
- equations whose solutions are the currents flowing through each of resistance elements Rx, Ry and Rz and each power storage element Vz can be set.
- Such equations are set for each contact point and computational equations that can be computed by ECU 300 to obtain the solutions of these equations are set using the above-described resistance distribution and voltage distribution.
- the currents flowing through each of resistance elements Rx, Ry and Rz and each power storage element Vz can be calculated and the current distribution in cell 110 can be calculated.
- a well-known method may be used as a specific method for obtaining the solutions of the equations, and a method for obtaining a solution using an inverse matrix may, for example, be used.
- ECU 300 calculates a heat generation amount distribution in the target cell, using the resistance distribution and the current distribution in the target cell (step S260). Specifically, ECU 300 calculates the heat generation amount distribution in the target cell by, for each partial structure 116, multiplying a square value of the current obtained from the current distribution by the resistance value obtained from the resistance distribution, and calculating an amount of heat generation in each partial structure 116.
- partial structure 116 includes a plurality of resistance elements
- a sum of amounts of heat generation in the resistance elements may be calculated as the amount of heat generation in partial structure 116.
- T represents a temperature (previous value) of each portion, and “T_0” represents a temperature of the air.
- S represents a cross-sectional area of each portion.
- Equation (13) "m ⁇ c ⁇ t” represents a heat generation term, and " ⁇ (T-T_0) ⁇ S" represents a heat release term.
- ECU 300 calculates the temperature distribution in the target cell by, for each partial structure 116, adding the amount of change in temperature ⁇ T of each partial structure 116 calculated using Equation (13) to a temperature distribution indicating a previous temperature of each partial structure 116, and calculating a current temperature.
- the temperature distribution calculated in step S270 is used as a temperature (previous value) in calculation of the resistance distribution and the voltage distribution in step S220.
- the current distribution in cell 110 by calculating the current distribution in cell 110 using the ladder circuit network model, the current distribution caused by the geometric structure of cell 110 can be calculated. Furthermore, the resistance distribution in cell 110 calculated based on the salt concentration distribution in cell 110 is applied to the ladder circuit network model. Therefore, according to the present embodiment, the current distribution in cell 110 can be accurately calculated, with consideration given to the geometric structure of cell 110 and the salt concentration distribution in cell 110.
- the maximum current value in cell 110 can be accurately estimated based on the calculated current distribution, and thus, charging and discharging can be suppressed without excess or deficiency.
- a battery system (2) includes a battery pack (100) including a plurality of cells (110), and an ECU (300).
- the ECU (300) calculates a current distribution in each cell (110) using a ladder circuit network model, the ladder circuit network model being obtained by geometrically modeling an interior of the cell (110) using a plurality of resistance elements and a plurality of power storage elements.
- the ECU (300) calculates the current distribution in the cell (110) by applying, to the ladder circuit network model, a resistance distribution in the cell (110) calculated based on a salt concentration distribution in the cell (110).
Landscapes
- Engineering & Computer Science (AREA)
- General Chemical & Material Sciences (AREA)
- Manufacturing & Machinery (AREA)
- Chemical & Material Sciences (AREA)
- Chemical Kinetics & Catalysis (AREA)
- Electrochemistry (AREA)
- Power Engineering (AREA)
- Life Sciences & Earth Sciences (AREA)
- Sustainable Development (AREA)
- Sustainable Energy (AREA)
- Transportation (AREA)
- Mechanical Engineering (AREA)
- Microelectronics & Electronic Packaging (AREA)
- Secondary Cells (AREA)
- Charge And Discharge Circuits For Batteries Or The Like (AREA)
- Tests Of Electric Status Of Batteries (AREA)
Abstract
A battery system (2) includes a battery pack (100) including a plurality of cells (110), and an ECU (300). The ECU (300) calculates a current distribution in each cell (110) using a ladder circuit network model, the ladder circuit network model being obtained by geometrically modeling an interior of the cell (110) using a plurality of resistance elements and a plurality of power storage elements. The ECU (300) calculates the current distribution in the cell (110) by applying, to the ladder circuit network model, a resistance distribution in the cell (110) calculated based on a salt concentration distribution in the cell (110).
Description
- This nonprovisional application is based on Japanese Patent Application No.
2019-092832 filed on May 16, 2019 - The present disclosure relates to a battery system including a secondary battery, a vehicle on which the battery system is mounted, and a method for controlling a battery system including a secondary battery.
- It is known that charging and discharging of a secondary battery causes an uneven salt concentration distribution (hereinafter, may be referred to as "salt concentration unevenness") in a secondary battery, which leads to a reduction in input and output performance of the secondary battery. The reduction in input and output performance of the secondary battery caused by the salt concentration unevenness will be referred to as "high rate deterioration" or the like in distinction from deterioration over time.
- Japanese Patent Laying-Open No.
2018-81807 - In recent years, as a capacity of a secondary battery (hereinafter, may be simply referred to as "cell") becomes larger, a size of the cell becomes larger. Therefore, even when there is no salt concentration unevenness (high rate deterioration), the cell has an uneven current distribution (hereinafter, may be referred to as "current unevenness") caused by a geometric structure of the cell. Such current unevenness is not particularly taken into consideration in Japanese Patent Laying-Open No.
2018-81807 - The present disclosure has been made to solve the above-described problem, and an object of the present disclosure is to provide a battery system capable of accurately calculating a current distribution in a secondary battery (cell), a vehicle on which the battery system is mounted, and a method for controlling the battery system.
- A battery system and a vehicle according to the present disclosure include: a secondary battery (cell); and a controller that calculates a current distribution in the cell using a circuit network model, the circuit network model being obtained by geometrically modeling an interior of the cell using a plurality of resistance elements and a plurality of power storage elements. The controller calculates the current distribution in the cell by applying, to the circuit network model, a resistance distribution in the cell calculated based on a salt concentration distribution in the cell.
- A method for controlling a battery system according to the present disclosure is a method for controlling a battery system including a secondary battery (cell), the method including: calculating a salt concentration distribution in the cell; calculating a resistance distribution in the cell based on the calculated salt concentration distribution; and calculating a current distribution in the cell using a circuit network model, the circuit network model being obtained by geometrically modeling an interior of the cell using a plurality of resistance elements and a plurality of power storage elements. The calculating the current distribution includes calculating the current distribution in the cell using the circuit network model to which the resistance distribution calculated in the calculating the resistance distribution is applied.
- In the battery system, the vehicle and the control method described above, the current distribution in the cell is calculated using the above-described circuit network model, and the current distribution caused by a geometric structure of the cell can thereby be calculated. Furthermore, the resistance distribution in the cell calculated based on the salt concentration distribution in the cell is applied to the above-described circuit network model. Therefore, according to the battery system, the vehicle and the control method, the current distribution in the cell can be accurately calculated, with consideration given to the geometric structure of the cell and the salt concentration distribution in the cell.
- The controller may execute control of suppressing charging and discharging of the cell, when a magnitude of a current in the cell based on the calculated current distribution exceeds a threshold value.
- The method for controlling a battery system may further include executing control of suppressing charging and discharging of the cell, when a magnitude of a current in the cell based on the calculated current distribution exceeds a threshold value.
- According to the above-described configuration, a maximum current value in the cell can be accurately estimated based on the calculated current distribution, and thus, charging and discharging can be suppressed without excess or deficiency.
- The foregoing and other objects, features, aspects and advantages of the present disclosure will become more apparent from the following detailed description of the present disclosure when taken in conjunction with the accompanying drawings.
-
-
Fig. 1 is an overall configuration diagram of a vehicle on which a battery system according to the present embodiment is mounted. -
Fig. 2 is a side view showing a configuration example of an electrode assembly of a cell. -
Fig. 3 is a cross-sectional view taken along line III-III inFig. 2 . -
Fig. 4 is a diagram for illustrating an example of a ladder circuit network model. -
Fig. 5 schematically shows an example of a flow of a current in the cell. -
Fig. 6 shows an example of a current distribution in the cell. -
Fig. 7 shows an example of a salt concentration distribution in the cell. -
Fig. 8 shows an example of a resistance distribution that occurs in the cell due to salt concentration unevenness. -
Fig. 9 shows a relationship between the degree of salt concentration and an amount of increase in internal resistance. -
Fig. 10 shows an example of a current distribution with consideration given to the salt concentration distribution. -
Fig. 11 is a flowchart showing an example of a procedure of a process performed by an ECU. -
Fig. 12 is a flowchart showing an example of a procedure of a salt concentration distribution calculation process performed in step S10 inFig. 11 . -
Fig. 13 is a flowchart showing an example of a procedure of a current distribution calculation process performed in step S30 inFig. 11 . -
Fig. 14 shows an example of a relationship among a temperature, an SOC, and a resistance value of each resistance element in each partial structure in the cell. -
Fig. 15 shows an example of a relationship among a temperature, an SOC and a deterioration coefficient in each partial structure in the cell. -
Fig. 16 shows a cubic lattice formed by eight contact points in a part of the ladder circuit network model. -
Fig. 17 shows generalized coordinates of the eight contact points of the cubic lattice. -
Fig. 18 shows each resistance element and a power storage element connected to a contact point. -
Fig. 19 is a diagram for illustrating loop currents. - An embodiment of the present disclosure will be described in detail hereinafter with reference to the drawings, in which the same or corresponding portions are denoted by the same reference characters and description thereof will not be repeated.
-
Fig. 1 is an overall configuration diagram of a vehicle on which a battery system according to the present embodiment is mounted. Although an electric vehicle including an MG 10 as a motive power source will be representatively described below, the vehicle according to the present disclosure is not necessarily limited to such an electric vehicle. The vehicle according to the present disclosure may be a hybrid vehicle on which an engine is further mounted as a motive power source, or may be a fuel cell vehicle on which a fuel cell is further mounted. - Referring to
Fig. 1 , avehicle 1 includes abattery system 2, a motor generator (hereinafter, referred to as "MG") 10, a motivepower transmission gear 20, adriving wheel 30, a power control unit (hereinafter, referred to as "PCU") 40, and a system main relay (hereinafter, referred to as "SMR") 50.Battery system 2 includes abattery pack 100, avoltage sensor 210, acurrent sensor 220, atemperature sensor 230, and an electronic control unit (hereinafter, referred to as "ECU") 300. - MG 10 is a motor generator driven by PCU 40 and is, for example, a three-phase AC synchronous motor including a permanent magnet embedded in a rotor. MG 10 is supplied with electric power from
battery pack 100 and rotates a drive shaft. MG 10 can also perform regenerative power generation during braking ofvehicle 1. Electric power generated by MG 10 is rectified by PCU 40 and stored inbattery pack 100. - PCU 40 converts the electric power stored in
battery pack 100 to AC power and supplies the AC power to MG 10 in accordance with a control signal from ECU 300. In addition, PCU 40 rectifies the AC power generated by MG 10 during braking ofvehicle 1 and supplies the rectified power tobattery pack 100. PCU 40 includes, for example, an inverter that drives MG 10, and a converter that performs voltage conversion betweenbattery pack 100 and the inverter. -
Battery pack 100 is a rechargeable power storage element.Battery pack 100 is formed by connecting a plurality of (n) secondary batteries (cells) 110 in series, and eachcell 110 is, for example, a lithium ion secondary battery, a nickel metal hydride secondary battery or the like. The lithium ion secondary battery is a secondary battery including lithium as an electric charge carrier, and may include a so-called all-solid-state battery including a solid electrolyte, in addition to a general lithium ion secondary battery including a liquid electrolyte. -
Battery pack 100 can supply the stored electric power to MG 10 through PCU 40. In addition,battery pack 100 can receive the electric power generated by MG 10 during deceleration ofvehicle 1 through PCU 40 and store the electric power. Although not particularly shown,battery pack 100 can be charged by a power supply external to the vehicle, using a charging device for chargingbattery pack 100 by the above-described power supply. -
SMR 50 is provided betweenPCU 40 andbattery pack 100.SMR 50 performs switching between supply and cutoff of the electric power betweenPCU 40 andbattery pack 100 in accordance with a control signal fromECU 300. -
Voltage sensor 210 is provided for eachcell 110 and detects a voltage Vb across terminals of eachcell 110.Current sensor 220 detects a current Ib input and output to and frombattery pack 100.Temperature sensor 230 is provided for eachcell 110 and detects a temperature Tb of eachcell 110. A detection value of each sensor is output toECU 300. -
ECU 300 includes a CPU (Central Processing Unit) 301, a memory (a ROM (Read Only Memory) and a RAM (Random Access Memory)) 302, and an input and output buffer (not shown).CPU 301 loads a program stored in the ROM into the RAM or the like and executes the program. A process performed byECU 300 is written on the program stored in the ROM. - As a capacity of the cell becomes larger, a size of the cell becomes larger. Therefore, the cell has current unevenness caused by a geometric structure of the cell, and in the cell, there are a portion where a relatively large current flows and a portion where a small current flows. Thus, simply by checking an input and an output to and from
cell 110 orbattery pack 100, the cell cannot in some cases be protected from an overcurrent appropriately. - Accordingly, in the battery system according to the present embodiment, a current distribution in
cell 110 is calculated using a circuit network model obtained by modeling a circuit incell 110 using a plurality of resistance elements and a plurality of power storage elements. As a result, the current distribution incell 110 caused by the geometric structure ofcell 110 can be calculated. - In
cell 110, there is salt concentration unevenness (high rate deterioration) due to charging and discharging. Since a larger amount of current flows in a portion having a low salt concentration than in a portion having a high salt concentration, the current distribution incell 110 is affected not only by the geometric structure ofcell 110 but also by a salt concentration distribution occurring incell 110. Accordingly, in the battery system according to the present embodiment, the salt concentration distribution incell 110 is calculated and a resistance distribution calculated based on the salt concentration distribution is applied to the above-described circuit network model. As a result, the current distribution incell 110 can be accurately calculated, with consideration given to the geometric structure ofcell 110 and the salt concentration distribution incell 110. - Hereinafter, the circuit network model of
cell 110 will be first described, and then, the current distribution incell 110 will be described. -
Fig. 2 is a side view showing a configuration example of an electrode assembly ofcell 110. Referring toFig. 2 , in the present embodiment, anelectrode assembly 112 is partitioned into a plurality ofportions 114 and a circuit network model (hereinafter, referred to as "ladder circuit network model") obtained by modeling eachportion 114 using at least one of resistance elements and power storage elements is set. In this example,electrode assembly 112 is partitioned into 20portions 114 of 4×5. -
Fig. 3 is a cross-sectional view taken along line III-III inFig. 2 . Referring toFig. 3 ,electrode assembly 112 includes current collecting foils 122 and 126, a positive electrodeactive material layer 123, a negative electrodeactive material layer 125, and aseparator 124. - Positive electrode
active material layer 123 is a layer including a positive electrode active material, a conductive material and a binder, and is formed on a surface of current collectingfoil 122. A portion of current collectingfoil 122 on which positive electrodeactive material layer 123 is not formed is provided with apositive electrode tab 120. Similarly, negative electrodeactive material layer 125 is a layer including a negative electrode active material, a conductive material and a binder, and is formed on a surface of current collectingfoil 126. A portion of current collectingfoil 126 on which negative electrodeactive material layer 125 is not formed is provided with anegative electrode tab 121. -
Separator 124 is provided to be in contact with both positive electrodeactive material layer 123 and negative electrodeactive material layer 125. Positive electrodeactive material layer 123, negative electrodeactive material layer 125 andseparator 124 are impregnated with an electrolyte. -
Fig. 4 is a diagram for illustrating an example of the ladder circuit network model. InFig. 4 , a lateral direction is defined as an x direction, a vertical direction is defined as a z direction, and a depth direction is defined as a y direction. - Referring to
Fig. 4 , eachportion 114 includes apartial structure 116. 20partial structures 116 are arranged in a matrix form of 4×5 on an x-y plane.Partial structure 116 includes at least a resistance element Rz and a power storage element Vz. One end of resistance element Rz and one end of power storage element Vz are connected in series along the z direction.Partial structure 116 is obtained by modeling a portion ofelectrode assembly 112 formed of positive electrodeactive material layer 123 andseparator 124. -
Partial structure 116 includes resistance elements Rx and Ry, depending on its position. At least one of one end of resistance element Rx and one end of resistance element Ry is connected to each of an upper contact point of the other end of resistance element Rz and a lower contact point of the other end of power storage element Vz. Adjacentpartial structures 116 are connected by resistance elements Rx and Ry. These resistance elements Rx and Ry are obtained by modeling a portion of the current collecting foils ofelectrode assembly 112. -
Fig. 5 schematically shows an example of a flow of a current incell 110.Fig. 5 shows an example of the flow of the current based on the geometric structure ofcell 110, and it is assumed that there is no salt concentration unevenness (high rate deterioration) incell 110. - Referring to
Fig. 5 , in this example,positive electrode tab 120 andnegative electrode tab 121 are formed along the same side in the rectangular electrode assembly. When the current flows frompositive electrode tab 120 through the electrode assembly in the cell tonegative electrode tab 121, the current flows efficiently along a current route having a short distance between the tabs, and thus, a relatively large current flows along the current route having the short distance between the tabs and a relatively small current flows along a current route having a long distance between the tabs (a thickness of a line indicates the magnitude of the current). -
Fig. 6 shows an example of the current distribution incell 110.Fig. 6 shows the normalized magnitude (e.g., a ratio to an average value) of the current in each of 20portions 114 ofelectrode assembly 112, and shows that a larger current flows as a numeric value is larger.Fig. 6 also shows an example of the current distribution based on the geometric structure ofcell 110, and it is assumed that there is no salt concentration unevenness incell 110. - Referring to
Fig. 6 , in this example, the current is maximized in aregion 130 including a current route having a relatively short distance between the tabs, not in a central portion ofcell 110. The current is relatively small in a portion including a current route having a relatively long distance between the tabs. - As described above, there is current unevenness in the cell, and the current unevenness is greater particularly in a large-sized cell, and thus, it is necessary to control charging and discharging or the like with consideration given to the current distribution in the cell. However, the current distribution in the cell is affected not only by such a geometric structure of
cell 110 but also by the salt concentration distribution in the cell. -
Fig. 7 shows an example of the salt concentration distribution incell 110.Fig. 7 shows, by way of example, the salt concentration distribution when there is salt concentration unevenness in an excessive discharging state (salt concentration unevenness caused by discharging at a high rate). A dotted line group indicates an iso-salt concentration line, and a salt concentration becomes higher with increasing distance from the center. - Referring to
Fig. 7 , in the excessive discharging state, the salt concentration increases from a center toward an end ofcell 110. In a portion having the increased salt concentration, an internal resistance is relatively high and the current is relatively less likely to flow. - Although not particularly shown, in an excessive charging state (a state in which there is salt concentration unevenness caused by charging at a high rate), the salt concentration increases with decreasing distance from the center of
cell 110. -
Fig. 8 shows an example of a resistance distribution that occurs incell 110 due to salt concentration unevenness.Fig. 8 shows a normalized increase or decrease (e.g., a ratio to an average value) in internal resistance in each of 20portions 114 ofelectrode assembly 112 due to salt concentration unevenness, and shows that a resistance is higher as a numeric value is larger.Fig. 8 also shows, by way of example, the resistance distribution when there is salt concentration unevenness in the excessive discharging state. - Referring to
Fig. 8 , when the salt concentration distribution shown inFig. 7 occurs, the internal resistance increases from the central portion toward the end ofcell 110. That is, the internal resistance is the lowest in aregion 132 near the center ofcell 110. Therefore, when the salt concentration distribution shown inFig. 7 occurs, the current becomes less likely to flow with decreasing distance from the end ofcell 110, and the current is more likely to flow in the region near the center ofcell 110 than in the end ofcell 110. - Accordingly, in the present embodiment, in order to take the current unevenness caused by the salt concentration unevenness in
cell 110 into consideration, the salt concentration distribution incell 110 is calculated and the resistance distribution in cell 110 (increase or decrease in internal resistance in each portion) is calculated based on the salt concentration distribution. Specifically, the resistance distribution shown inFig. 8 is calculated based on the calculated salt concentration distribution. -
Fig. 9 shows a relationship between the degree of the salt concentration and an amount of increase in internal resistance. Referring toFig. 9 , the amount of increase in resistance becomes larger as the salt concentration becomes higher. When the salt concentration decreases, the amount of increase in resistance also becomes larger. - By standardizing (e.g., a ratio of the salt concentration in each
portion 114 to an average value of the salt concentration) the calculated salt concentration distribution, and preliminarily evaluating a relationship between the amount of increase or decrease in salt concentration and the amount of increase in internal resistance by an experiment, simulation or the like to generate a map or a relational equation, the resistance distribution (Fig. 8 ) incell 110 can be calculated based on the salt concentration distribution. - Then, in the present embodiment, the resistance distribution calculated based on the salt concentration distribution is applied to the ladder circuit network model. Specifically, the calculated resistance distribution (the normalized amount of increase or decrease in internal resistance) is multiplied by the resistance elements that form the ladder circuit network model, to thereby incorporate the resistance distribution calculated based on the salt concentration distribution into the ladder circuit network model. As a result, the current distribution in
cell 110 can be accurately calculated, with consideration given to the geometric structure ofcell 110 and the salt concentration distribution incell 110. -
Fig. 10 shows an example of the current distribution with consideration given to the salt concentration distribution.Fig. 10 corresponds toFig. 6 showing the current distribution with no consideration given to the salt concentration unevenness. - Referring to
Fig. 10 , in this example, due to an influence of the salt concentration distribution, the current is maximized in aregion 134 shown in the figure, not in a region (region 130 inFig. 6 ) including a current route having a relatively short distance between the tabs. Therefore, when the current flowing throughregion 134 exceeds a limiting value, an input and an output to and frombattery pack 100 are suppressed to thereby suppress an input and an output to and fromcell 110. Thus,cell 110 can be protected from an overcurrent. -
Fig. 11 is a flowchart showing an example of a procedure of a process performed byECU 300. The process shown in this flowchart is performed for eachcell 110 ofbattery pack 100, and is repeatedly performed every prescribed cycle while the system ofvehicle 1 is active. - Referring to
Fig. 11 ,ECU 300 performs a salt concentration distribution calculation process of calculating a salt concentration distribution incell 110 to be computed (hereinafter, referred to as "target cell") (step S10). The details of the salt concentration distribution calculation process will be described below. - Next,
ECU 300 calculates a resistance distribution in the target cell based on the salt concentration distribution calculated in step S10 (step S20). Specifically,ECU 300 reads, frommemory 302, the preliminarily prepared map or relational equation indicating the relationship between the salt concentration and the amount of increase in resistance shown inFig. 9 , and calculates an amount of increase in resistance for eachportion 114 of the target cell using the above-described map. The resistance distribution based on the salt concentration distribution thus calculated is reflected in the ladder circuit network model used in a current distribution calculation process described below. - Then, using the ladder circuit network model in which the resistance distribution based on the salt concentration distribution is reflected,
ECU 300 performs the current distribution calculation process of calculating a current distribution in the target cell (step S30). The details of the current distribution calculation process will be described below. - When the current distribution in the target cell is calculated in step S30,
ECU 300 determines whether or not a maximum current value obtained from the calculated current distribution exceeds a threshold value (step S40). The threshold value is appropriately determined based on the specifications, a preliminary evaluation test or the like ofcell 110 so as to prevent an overcurrent from occurring incell 110. - When it is determined in step S40 that the maximum current value in the target cell exceeds the threshold value (YES in step S40),
ECU 300 executes charging and discharging suppression control of suppressing charging and discharging of battery pack 100 (step S50). For example,ECU 300 suppresses charging and discharging ofbattery pack 100 by reducing a discharging power upper limit value Wout that defines an upper limit of the discharging power ofbattery pack 100, and a charging power upper limit value Win that defines an upper limit of the charging power ofbattery pack 100. - When it is determined in step S40 that the maximum current value is equal to or smaller than the threshold value (NO in step S40),
ECU 300 moves the process to Return without performing step S50. -
Fig. 12 is a flowchart showing an example of a procedure of the salt concentration distribution calculation process performed in step S10 inFig. 11 . Referring toFig. 12 ,ECU 300 obtains a detection value of temperature Tb of the target cell from temperature sensor 230 (step S110). - Next,
ECU 300 calculates a flow rate of an electrolyte in the target cell using obtained temperature Tb (step S120). The flow rate of the electrolyte can be calculated using a known method. For example, Japanese Patent Laying-Open No.2015-207473 

- A predetermined fixed value can be used as viscosity µ, or viscosity µ can be changed depending on a temperature of the electrolyte. Temperature Tb detected by
temperature sensor 230 is used as the temperature of the electrolyte. By preliminarily preparing information (map or computational equation) indicating a correspondence relation between viscosity µ and temperature Tb by an experiment or the like, viscosity µ can be specified based on the detection value of temperature Tb. - Density p is a parameter that defines expansion and contraction of the electrolyte, and indicates a value corresponding to expansion and contraction of the electrolyte. Expansion and contraction of the electrolyte depends on the temperature (temperature Tb) of the electrolyte, and density ρ also depends on the temperature of the electrolyte. Therefore, by preliminarily preparing information (map or computational equation) indicating a correspondence relation between density ρ and temperature Tb by an experiment or the like, density ρ can be specified based on the detection value of temperature Tb. By specifying density p, expansion and contraction of the electrolyte can be grasped. Predetermined fixed values can be used as volume fraction εe,j and transmission coefficient Kj.
- In Equation (1) above, flow rate uj and pressure p are unknown. Therefore, by defining the continuous equation indicated by Equation (2) and solving a simultaneous equation of Equations (1) and (2), flow rate uj and pressure p can be calculated. Equations (1) and (2) include density ρ that defines expansion and contraction of the electrolyte, and thus, by solving the simultaneous equation of Equations (1) and (2), flow rate uj corresponding to expansion and contraction of the electrolyte can be calculated. When flow rate uj is calculated, convergence calculation can, for example, be performed using Equations (1) and (2). The computation using Equations (1) and (2) is performed every prescribed cycle, and flow rate uj can be calculated by using, in a current computation, a value calculated in a previous computation.
- In the negative electrode, the electrolyte moves in negative electrode
active material layer 125. Therefore, flow rate uj (i.e., flow rate un) is calculated for each position in negative electrodeactive material layer 125. Similarly, in the positive electrode, the electrolyte moves in positive electrodeactive material layer 123. Therefore, flow rate uj (i.e., flow rate up) is calculated for each position in positive electrodeactive material layer 123. Inseparator 124, the electrolyte moves inseparator 124. Therefore, flow rate uj (i.e., flow rate us) is calculated for each position inseparator 124. - When the flow rate of the electrolyte is calculated in step S120,
ECU 300 calculates a salt concentration distribution in the target cell based on calculated flow rate uj of the electrolyte. The salt concentration distribution can also be calculated using a known method. Japanese Patent Laying-Open No.2015-207473 
- The first term of the left side of Equation (3) defines a change in salt concentration for a prescribed time period Δt. The second term of the left side defines a change in salt concentration that depends on a flow (flow rate uj) of the electrolyte. In addition, the first term of the right side defines a diffusion state of the salt in the electrolyte. The second term of the right side defines an amount of the generated salt. During discharging of
cell 110, the salt is generated in negative electrodeactive material layer 125, and during charging ofcell 110, the salt is generated in positive electrodeactive material layer 123. By solving Equation (3) above, the salt concentration distribution incell 110 can be calculated. -
Fig. 13 is a flowchart showing an example of a procedure of the current distribution calculation process performed in step S30 inFig. 11 . Referring toFig. 13 ,ECU 300 first estimates an SOC (State Of Charge) distribution in the target cell (step S210). Specifically,ECU 300 calculates the SOC distribution in the target cell by calculating an SOC of power storage element Vz included in each portion (each partial structure 116) of the target cell.ECU 300 calculates the SOC of power storage element Vz included inpartial structure 116, using the following equation, for example:
partial structure 116, and SOCn(t-1) represents an SOC (previous value) of power storage element Vz. In(t-1) represents a current (previous value) flowing through power storage element Vz, and capn represents a full charge capacity (initial value) of power storage element Vz. ΔCdegn(t-1) represents a capacity deterioration rate (previous value) of power storage element Vz. The capacity deterioration rate indicates a rate of decrease in full charge capacity of power storage element Vz from an initial value. As the capacity deterioration rate becomes lower than 1, power storage element Vz becomes more deteriorated, and as the capacity deterioration rate becomes closer to 1, power storage element Vz becomes less deteriorated. Δt represents a computation cycle. Various initial values may be set using a result of detection by each sensor. - For example, in the ladder circuit network model shown in
Fig. 4 ,ECU 300 calculates the SOCs (e.g., SOC1 to SOC20) of power storage elements Vz of 20partial structures 116, using Equation (4). - Next,
ECU 300 calculates a resistance distribution and a voltage distribution in the target cell (step S220).ECU 300 calculates the resistance distribution in the target cell by, for example, calculating a resistance value of each of resistance elements Rx, Ry and Rz included in the ladder circuit network model (Fig. 4 ). The resistance values of the plurality of resistance elements included in the ladder circuit network model are preset by, for example, adaptation of a reference value at a reference temperature and a reference SOC by an experiment or the like. The resistance values of the plurality of resistance elements Rx, Ry and Rz included in the ladder circuit network model change in accordance with an amount of deviation from the reference temperature and an amount of deviation from the reference SOC. Therefore,ECU 300 calculates the resistance values of resistance elements Rx, Ry and Rz, using the SOC (current value) of eachpartial structure 116 and the temperature (previous value) of eachpartial structure 116.ECU 300 calculates the resistance values of resistance elements Rx, Ry and Rz, using a prescribed map, for example. -
Fig. 14 shows an example of a relationship among the temperature, the SOC, and the resistance value of each of resistance elements Rx, Ry and Rz in eachpartial structure 116 incell 110. Referring toFig. 14 , the temperature and the SOC are partitioned into a plurality of regions and the resistance value of each of resistance elements Rx, Ry and Rz corresponding to the temperature and the SOC is set for each partitioned region.ECU 300 calculates the resistance value of each of resistance elements Rx, Ry and Rz included in eachpartial structure 116, using an SOC (current value) of eachpartial structure 116, a temperature (previous value) of eachpartial structure 116, and the map shown inFig. 14 . -
ECU 300 multiplies the calculated resistance value of each of resistance elements Rx, Ry and Rz by a resistance deterioration rate (previous value) corresponding to eachpartial structure 116, to thereby calculate a resistance value (current value) of each of resistance elements Rx, Ry and Rz. The resistance deterioration rate indicates a rate of increase in resistance value of each resistance element from an initial value. As the resistance deterioration rate becomes higher than 1, the resistance element becomes more deteriorated, and as the resistance deterioration rate becomes closer to 1, the resistance element becomes less deteriorated. - Furthermore,
ECU 300 calculates the voltage distribution by calculating a voltage of power storage element Vz in eachpartial structure 116 in the target cell. The voltages of the plurality of power storage elements Vz included in the ladder circuit network model are preset by, for example, adaptation of a reference value at a reference temperature and a reference SOC by an experiment or the like. The voltages of the plurality of power storage elements Vz included in the ladder circuit network model change in accordance with an amount of deviation from the reference temperature and an amount of deviation from the reference SOC. Therefore,ECU 300 calculates the voltage of each power storage element Vz, using the SOC (current value) of eachpartial structure 116 and the temperature (previous value) of eachpartial structure 116.ECU 300 calculates the voltage of each power storage element Vz, using a prescribed map, for example. The prescribed map indicates the relationship among the temperature, the SOC and the voltage, similarly to the map indicating the relationship among the temperature, the SOC and the resistance value as shown inFig. 14 , and thus, detailed description thereof will not be repeated. - Next,
ECU 300 reflects the resistance distribution in the target cell calculated based on the salt concentration distribution in step S20 inFig. 11 in the resistance distribution calculated in step S220 (step S230). Specifically,ECU 300 multiplies each resistance element in eachpartial structure 116 in the ladder circuit network model by the corresponding amount of increase in resistance calculated based on the salt concentration distribution, to thereby correct the value of each resistance element in the ladder circuit network model. - Then,
ECU 300 calculates a deterioration distribution in the target cell (step S240). Specifically,ECU 300 estimates a deterioration coefficient distribution, and estimates a deterioration amount distribution using the estimated deterioration coefficient distribution. A deterioration coefficient includes a capacity deterioration coefficient for calculating an amount of deterioration in capacity, and a resistance deterioration coefficient for calculating an amount of deterioration in resistance.ECU 300 calculates the deterioration coefficient distribution by calculating the capacity deterioration coefficient and the resistance deterioration coefficient corresponding to eachpartial structure 116. - Both the capacity deterioration coefficient and the resistance deterioration coefficient are values that depend on the SOC and the temperature in each
partial structure 116 incell 110. Therefore,ECU 300 calculates the capacity deterioration coefficient and the resistance deterioration coefficient corresponding to eachpartial structure 116, using the SOC (current value) of eachpartial structure 116 and the temperature (previous value) of eachpartial structure 116.ECU 300 calculates the capacity deterioration coefficient and the resistance deterioration coefficient corresponding to eachpartial structure 116, using a prescribed map, for example. -
Fig. 15 shows an example of a relationship among the temperature, the SOC and the deterioration coefficient in eachpartial structure 116 incell 110. Referring toFig. 15 , the temperature and the SOC are partitioned into a plurality of regions, and the capacity deterioration coefficient and the resistance deterioration coefficient corresponding to the temperature and the SOC are set for each partitioned region.ECU 300 calculates the capacity deterioration coefficient and the resistance deterioration coefficient, using the SOC (current value) of eachpartial structure 116, the temperature (previous value) of eachpartial structure 116, and the map shown inFig. 15 . - Then,
ECU 300 estimates the deterioration amount distribution using the estimated deterioration coefficient distribution. An amount of deterioration includes an amount of deterioration in capacity indicating an amount of decrease in full charge capacity from an initial value, and an amount of deterioration in resistance indicating an amount of increase in resistance value from an initial value.ECU 300 calculates an amount of deterioration in capacity (current value) corresponding to eachpartial structure 116, using the calculated capacity deterioration coefficient (current value) corresponding to eachpartial structure 116 and the amount of deterioration in capacity (previous value).ECU 300 calculates the amount of deterioration in capacity (current value) corresponding to eachpartial structure 116, using the following equation, for example:
ECU 300 calculates a capacity deterioration rate by, for example, subtracting the calculated amount of deterioration in capacity (current value) from the full charge capacity to thereby obtain a value, and dividing the value by an initial value of the full charge capacity. - Similarly,
ECU 300 calculates an amount of deterioration in resistance (current value) corresponding to eachpartial structure 116, using the calculated resistance deterioration coefficient (current value) corresponding to eachpartial structure 116 and the amount of deterioration in resistance (previous value).ECU 300 calculates the amount of deterioration in resistance (current value) corresponding to eachpartial structure 116, using the following equation, for example:
ECU 300 calculates a resistance deterioration rate by, for example, adding the amount of deterioration in resistance (current value) to a reference value of the resistance value of each resistance element to thereby obtain a value, and dividing the value by the reference value of the resistance value of each resistance element. - Referring again to
Fig. 13 ,ECU 300 calculates a current distribution in the target cell (step S250).ECU 300 calculates the current distribution in the target cell by calculating a current flowing through each of resistance elements Rx, Ry and Rz and each power storage element Vz, using the resistance distribution in which the salt concentration distribution is reflected in step S230 and the voltage distribution calculated in step S220. - An example of a method for calculating the current distribution will be described below with reference to
Figs. 16 to 19 , using an extracted part of the ladder circuit network model.Fig. 16 shows a cubic lattice formed by eight contact points in a part of the ladder circuit network model.Fig. 17 shows generalized coordinates of the eight contact points of the cubic lattice.Fig. 18 shows resistance elements Rx (i, j, k), Ry (i, j, k) and Rz (i, j, k) and a power storage element Vz (i, j, k) connected to a contact point (i, j, k).Fig. 19 is a diagram for illustrating loop currents. - The case in which the respective contact points in the cubic lattice shown in
Fig. 16 have the coordinates as shown inFig. 17 is assumed. In this case, as shown inFig. 18 , a resistance element arranged along a positive direction of an x axis with respect to the contact point (i, j, k) is defined as Rx (i, j, k), a resistance element arranged along a positive direction of a y axis with respect to the contact point (i, j, k) is defined as Ry (i, j, k), a resistance element arranged along a positive direction of a z axis with respect to the contact point (i, j, k) is defined as Rz (i, j, k), and the power storage element is defined as Vz (i, j, k). - As shown in
Fig. 19 , a loop of a current is expressed by an orthogonal coordinate. That is, a current that loops on a y-z plane orthogonal to the x axis is defined as Ix, a current that loops on an x-z plane orthogonal to the y axis is defined as Iy, and a current that loops on an x-y plane orthogonal to the z axis is defined as Iz. - In resistance element Rx (i, j, k), a current that loops from the positive direction side of the z axis, a current that loops from the negative direction side of the z axis, a current that loops from the positive direction side of the y axis, and a current that loops from the negative direction side of the y axis overlap with one another. Therefore, a voltage RxI (i, j, k) of resistance element Rx (i, j, k) is expressed like the following equation:

- Similarly, in resistance element Ry (i, j, k), a current that loops from the positive direction side of the x axis, a current that loops from the negative direction side of the x axis, a current that loops from the positive direction side of the z axis, and a current that loops from the negative direction side of the z axis overlap with one another. Therefore, a voltage RyI (i, j, k) of resistance element Ry (i, j, k) is expressed like the following equation:

- Similarly, in resistance element Rz (i, j, k), a current that loops from the positive direction side of the x axis, a current that loops from the negative direction side of the x axis, a current that loops from the positive direction side of the y axis, and a current that loops from the negative direction side of the y axis overlap with one another. Therefore, a voltage RzI (i, j, k) of resistance element Rz (i, j, k) is expressed like the following equation:

- Next, considering, as to loop current Iz, the case in which the orientation of the current loop matches the positive direction of the current and the case in which the orientation of the current loop is opposite to the positive direction of the current, the following equation is derived from the Kirchhoff s second law:

- Furthermore, considering, as to loop current Ix, the case in which the orientation of the current loop matches the positive direction of the current and the case in which the orientation of the current loop is opposite to the positive direction of the current, the following equation is derived from the Kirchhoff s second law:

- Furthermore, considering, as to loop current Iy, the case in which the orientation of the current loop matches the positive direction of the current and the case in which the orientation of the current loop is opposite to the positive direction of the current, the following equation is derived from the Kirchhoff s second law:

- Based on derived Equations (10) to (12) above, and a relational equation about the current derived using the Kirchhoff s first law that a total sum of currents flowing into a contact point is equal to a total sum of currents flowing out of the contact point, equations whose solutions are the currents flowing through each of resistance elements Rx, Ry and Rz and each power storage element Vz can be set. Such equations are set for each contact point and computational equations that can be computed by
ECU 300 to obtain the solutions of these equations are set using the above-described resistance distribution and voltage distribution. Thus, the currents flowing through each of resistance elements Rx, Ry and Rz and each power storage element Vz can be calculated and the current distribution incell 110 can be calculated. A well-known method may be used as a specific method for obtaining the solutions of the equations, and a method for obtaining a solution using an inverse matrix may, for example, be used. - Referring again to
Fig. 13 ,ECU 300 calculates a heat generation amount distribution in the target cell, using the resistance distribution and the current distribution in the target cell (step S260). Specifically,ECU 300 calculates the heat generation amount distribution in the target cell by, for eachpartial structure 116, multiplying a square value of the current obtained from the current distribution by the resistance value obtained from the resistance distribution, and calculating an amount of heat generation in eachpartial structure 116. Whenpartial structure 116 includes a plurality of resistance elements, a sum of amounts of heat generation in the resistance elements may be calculated as the amount of heat generation inpartial structure 116. - Next,
ECU 300 calculates a temperature distribution in the target cell (step S270). Specifically,ECU 300 calculates an amount of change in temperature ΔT of eachpartial structure 116 using the following equation:
- Then,
ECU 300 calculates the temperature distribution in the target cell by, for eachpartial structure 116, adding the amount of change in temperature ΔT of eachpartial structure 116 calculated using Equation (13) to a temperature distribution indicating a previous temperature of eachpartial structure 116, and calculating a current temperature. - The temperature distribution calculated in step S270 is used as a temperature (previous value) in calculation of the resistance distribution and the voltage distribution in step S220.
- As described above, in the present embodiment, by calculating the current distribution in
cell 110 using the ladder circuit network model, the current distribution caused by the geometric structure ofcell 110 can be calculated. Furthermore, the resistance distribution incell 110 calculated based on the salt concentration distribution incell 110 is applied to the ladder circuit network model. Therefore, according to the present embodiment, the current distribution incell 110 can be accurately calculated, with consideration given to the geometric structure ofcell 110 and the salt concentration distribution incell 110. - In addition, according to the present embodiment, the maximum current value in
cell 110 can be accurately estimated based on the calculated current distribution, and thus, charging and discharging can be suppressed without excess or deficiency. - It should be understood that the embodiment disclosed herein is illustrative and non-restrictive in every respect. The scope of the present disclosure is defined by the terms of the claims and is intended to include any modifications within the scope and meaning equivalent to the terms of the claims.
- A battery system (2) includes a battery pack (100) including a plurality of cells (110), and an ECU (300). The ECU (300) calculates a current distribution in each cell (110) using a ladder circuit network model, the ladder circuit network model being obtained by geometrically modeling an interior of the cell (110) using a plurality of resistance elements and a plurality of power storage elements. The ECU (300) calculates the current distribution in the cell (110) by applying, to the ladder circuit network model, a resistance distribution in the cell (110) calculated based on a salt concentration distribution in the cell (110).
Claims (5)
- A battery system (2) comprising:a secondary battery (110); anda controller (300) that calculates a current distribution in the secondary battery using a circuit network model, the circuit network model being obtained by geometrically modeling an interior of the secondary battery using a plurality of resistance elements (Rx, Ry, Rz) and a plurality of power storage elements (Vz), whereinthe controller calculates the current distribution by applying, to the circuit network model, a resistance distribution in the secondary battery calculated based on a salt concentration distribution in the secondary battery.
- The battery system according to claim 1, wherein
the controller executes control of suppressing charging and discharging of the secondary battery, when a magnitude of a current in the secondary battery based on the current distribution exceeds a threshold value. - A vehicle (1) comprising the battery system (2) according to claim 1 or 2.
- A method for controlling a battery system (2) including a secondary battery (110), the method comprising:calculating a salt concentration distribution in the secondary battery;calculating a resistance distribution in the secondary battery based on the calculated salt concentration distribution; andcalculating a current distribution in the secondary battery using a circuit network model, the circuit network model being obtained by geometrically modeling an interior of the secondary battery using a plurality of resistance elements (Rx, Ry, Rz) and a plurality of power storage elements (Vz), whereinthe calculating the current distribution includes calculating the current distribution in the secondary battery using the circuit network model to which the resistance distribution calculated in the calculating the resistance distribution is applied.
- The method for controlling a battery system according to claim 4, further comprising
executing control of suppressing charging and discharging of the secondary battery, when a magnitude of a current in the secondary battery based on the current distribution exceeds a threshold value.
Applications Claiming Priority (1)
| Application Number | Priority Date | Filing Date | Title |
|---|---|---|---|
| JP2019092832A JP7275842B2 (en) | 2019-05-16 | 2019-05-16 | BATTERY SYSTEM AND VEHICLE, AND BATTERY SYSTEM CONTROL METHOD |
Publications (1)
| Publication Number | Publication Date |
|---|---|
| EP3739682A1 true EP3739682A1 (en) | 2020-11-18 |
Family
ID=70417424
Family Applications (1)
| Application Number | Title | Priority Date | Filing Date |
|---|---|---|---|
| EP20171038.1A Pending EP3739682A1 (en) | 2019-05-16 | 2020-04-23 | Battery system, vehicle, and method for controlling battery system |
Country Status (4)
| Country | Link |
|---|---|
| US (1) | US11322960B2 (en) |
| EP (1) | EP3739682A1 (en) |
| JP (1) | JP7275842B2 (en) |
| CN (1) | CN111952681B (en) |
Families Citing this family (4)
| Publication number | Priority date | Publication date | Assignee | Title |
|---|---|---|---|---|
| JP7208272B2 (en) * | 2021-01-08 | 2023-01-18 | プライムプラネットエナジー&ソリューションズ株式会社 | Controller and its use |
| JP2022139508A (en) * | 2021-03-12 | 2022-09-26 | プライムアースEvエナジー株式会社 | Estimation device, estimation method and estimation program |
| JP7636310B2 (en) * | 2021-09-24 | 2025-02-26 | トヨタ自動車株式会社 | How to charge the battery |
| US20260056260A1 (en) | 2022-08-29 | 2026-02-26 | Hitachi High-Tech Corporation | Capacity deterioration estimation device |
Citations (6)
| Publication number | Priority date | Publication date | Assignee | Title |
|---|---|---|---|---|
| JP2013046446A (en) * | 2011-08-23 | 2013-03-04 | Toyota Motor Corp | Power supply system for vehicle |
| JP2015207473A (en) | 2014-04-21 | 2015-11-19 | トヨタ自動車株式会社 | Battery system |
| JP2015228324A (en) * | 2014-05-31 | 2015-12-17 | トヨタ自動車株式会社 | Battery system |
| JP2016058255A (en) * | 2014-09-10 | 2016-04-21 | トヨタ自動車株式会社 | Battery system |
| JP2018081807A (en) | 2016-11-16 | 2018-05-24 | トヨタ自動車株式会社 | Vehicular battery system and control method thereof |
| JP2019092832A (en) | 2017-11-22 | 2019-06-20 | トヨタ紡織株式会社 | Vehicular seat cushion |
Family Cites Families (8)
| Publication number | Priority date | Publication date | Assignee | Title |
|---|---|---|---|---|
| JP5036662B2 (en) | 2008-09-03 | 2012-09-26 | トヨタ自動車株式会社 | Secondary battery monitoring device and secondary battery system |
| KR101685461B1 (en) | 2011-09-05 | 2016-12-20 | 가부시키가이샤 니혼 마이크로닉스 | Apparatus and Method for Evaluating Sheet-like Battery |
| US9529056B2 (en) | 2012-02-17 | 2016-12-27 | Toyota Jidosha Kabushiki Kaisha | Battery system and deterioration determining method |
| JP2013182788A (en) | 2012-03-01 | 2013-09-12 | Nippon Soken Inc | Lithium ion secondary battery and charge control method therefor |
| JP2015210208A (en) | 2014-04-28 | 2015-11-24 | 株式会社日本自動車部品総合研究所 | Resistance measurement method and resistance measurement apparatus |
| JP2015225846A (en) | 2014-05-30 | 2015-12-14 | トヨタ自動車株式会社 | Power storage system |
| JP6504093B2 (en) | 2016-03-24 | 2019-04-24 | トヨタ自動車株式会社 | Control device for secondary battery |
| JP6658689B2 (en) * | 2017-07-18 | 2020-03-04 | トヨタ自動車株式会社 | Battery system and vehicle equipped with battery system |
-
2019
- 2019-05-16 JP JP2019092832A patent/JP7275842B2/en active Active
-
2020
- 2020-04-23 EP EP20171038.1A patent/EP3739682A1/en active Pending
- 2020-05-05 US US16/867,028 patent/US11322960B2/en active Active
- 2020-05-12 CN CN202010396526.1A patent/CN111952681B/en active Active
Patent Citations (6)
| Publication number | Priority date | Publication date | Assignee | Title |
|---|---|---|---|---|
| JP2013046446A (en) * | 2011-08-23 | 2013-03-04 | Toyota Motor Corp | Power supply system for vehicle |
| JP2015207473A (en) | 2014-04-21 | 2015-11-19 | トヨタ自動車株式会社 | Battery system |
| JP2015228324A (en) * | 2014-05-31 | 2015-12-17 | トヨタ自動車株式会社 | Battery system |
| JP2016058255A (en) * | 2014-09-10 | 2016-04-21 | トヨタ自動車株式会社 | Battery system |
| JP2018081807A (en) | 2016-11-16 | 2018-05-24 | トヨタ自動車株式会社 | Vehicular battery system and control method thereof |
| JP2019092832A (en) | 2017-11-22 | 2019-06-20 | トヨタ紡織株式会社 | Vehicular seat cushion |
Also Published As
| Publication number | Publication date |
|---|---|
| JP2020187050A (en) | 2020-11-19 |
| JP7275842B2 (en) | 2023-05-18 |
| CN111952681A (en) | 2020-11-17 |
| US11322960B2 (en) | 2022-05-03 |
| US20200366111A1 (en) | 2020-11-19 |
| CN111952681B (en) | 2024-05-28 |
Similar Documents
| Publication | Publication Date | Title |
|---|---|---|
| US11322960B2 (en) | Battery system, vehicle, and method for controlling charge and discharge of a secondary battery | |
| JP6947014B2 (en) | Rechargeable battery system and rechargeable battery control method | |
| EP2804249B1 (en) | Method for controlling and device for controlling secondary battery | |
| JP7274368B2 (en) | battery control system | |
| JP5862836B2 (en) | Battery system | |
| US8054046B2 (en) | Fast search algorithm for finding initial diffusion voltage in electro-chemical systems | |
| US10557891B2 (en) | Battery system and control method thereof | |
| US7646166B2 (en) | Method and apparatus for modeling diffusion in an electrochemical system | |
| CN104956538A (en) | Battery system | |
| US10381855B2 (en) | Secondary battery system using temperature threshold in response to lithium ion concentrations | |
| JP7100151B2 (en) | Battery control device | |
| JP2016207287A (en) | Deterioration estimation method for secondary battery | |
| JP6356633B2 (en) | Secondary battery system | |
| JP2020119820A (en) | Battery system | |
| JP7040408B2 (en) | Rechargeable battery system | |
| US12123917B2 (en) | Method and system for determining remaining charging time of battery | |
| JP2025116506A (en) | Charging system | |
| JP2017163687A (en) | Power system | |
| JP7006540B2 (en) | Battery temperature estimator | |
| US20260034900A1 (en) | Controlling current for direct current fast charge with heat generation and temperature control | |
| JP2017010882A (en) | Secondary battery system | |
| JP2025018110A (en) | Battery Management System | |
| JP6627669B2 (en) | Battery system | |
| JP2025037313A (en) | Battery System | |
| JP2016207327A (en) | Secondary battery system, vehicle including the same, and secondary battery control method |
Legal Events
| Date | Code | Title | Description |
|---|---|---|---|
| PUAI | Public reference made under article 153(3) epc to a published international application that has entered the european phase |
Free format text: ORIGINAL CODE: 0009012 |
|
| STAA | Information on the status of an ep patent application or granted ep patent |
Free format text: STATUS: REQUEST FOR EXAMINATION WAS MADE |
|
| 17P | Request for examination filed |
Effective date: 20200423 |
|
| AK | Designated contracting states |
Kind code of ref document: A1 Designated state(s): AL AT BE BG CH CY CZ DE DK EE ES FI FR GB GR HR HU IE IS IT LI LT LU LV MC MK MT NL NO PL PT RO RS SE SI SK SM TR |
|
| AX | Request for extension of the european patent |
Extension state: BA ME |
|
| STAA | Information on the status of an ep patent application or granted ep patent |
Free format text: STATUS: EXAMINATION IS IN PROGRESS |
|
| 17Q | First examination report despatched |
Effective date: 20230131 |