EP3739328A1 - Method for identifying proteins - Google Patents
Method for identifying proteins Download PDFInfo
- Publication number
- EP3739328A1 EP3739328A1 EP18899287.9A EP18899287A EP3739328A1 EP 3739328 A1 EP3739328 A1 EP 3739328A1 EP 18899287 A EP18899287 A EP 18899287A EP 3739328 A1 EP3739328 A1 EP 3739328A1
- Authority
- EP
- European Patent Office
- Prior art keywords
- sample
- proteins
- target sample
- protein
- derived
- Prior art date
- Legal status (The legal status is an assumption and is not a legal conclusion. Google has not performed a legal analysis and makes no representation as to the accuracy of the status listed.)
- Withdrawn
Links
- 102000004169 proteins and genes Human genes 0.000 title claims abstract description 137
- 108090000623 proteins and genes Proteins 0.000 title claims abstract description 137
- 238000000034 method Methods 0.000 title claims abstract description 28
- 238000004885 tandem mass spectrometry Methods 0.000 claims abstract description 37
- 210000004369 blood Anatomy 0.000 claims abstract description 30
- 239000008280 blood Substances 0.000 claims abstract description 30
- 238000001228 spectrum Methods 0.000 claims abstract description 28
- 238000005259 measurement Methods 0.000 claims abstract description 27
- 238000002372 labelling Methods 0.000 claims description 18
- 238000004949 mass spectrometry Methods 0.000 claims description 12
- 239000002243 precursor Substances 0.000 claims description 12
- 239000007788 liquid Substances 0.000 claims description 11
- 238000002156 mixing Methods 0.000 claims description 11
- 238000013467 fragmentation Methods 0.000 claims description 10
- 238000006062 fragmentation reaction Methods 0.000 claims description 10
- 150000002500 ions Chemical class 0.000 description 29
- 238000000926 separation method Methods 0.000 description 15
- 210000004027 cell Anatomy 0.000 description 14
- 238000010586 diagram Methods 0.000 description 12
- 238000004458 analytical method Methods 0.000 description 10
- 239000003153 chemical reaction reagent Substances 0.000 description 4
- 238000001294 liquid chromatography-tandem mass spectrometry Methods 0.000 description 4
- 108010088751 Albumins Proteins 0.000 description 2
- 102000009027 Albumins Human genes 0.000 description 2
- XKRFYHLGVUSROY-UHFFFAOYSA-N Argon Chemical compound [Ar] XKRFYHLGVUSROY-UHFFFAOYSA-N 0.000 description 2
- IJGRMHOSHXDMSA-UHFFFAOYSA-N Atomic nitrogen Chemical compound N#N IJGRMHOSHXDMSA-UHFFFAOYSA-N 0.000 description 2
- 108010033276 Peptide Fragments Proteins 0.000 description 2
- 102000007079 Peptide Fragments Human genes 0.000 description 2
- 102000004142 Trypsin Human genes 0.000 description 2
- 108090000631 Trypsin Proteins 0.000 description 2
- 238000000065 atmospheric pressure chemical ionisation Methods 0.000 description 2
- 238000001514 detection method Methods 0.000 description 2
- 102000038379 digestive enzymes Human genes 0.000 description 2
- 108091007734 digestive enzymes Proteins 0.000 description 2
- 230000000694 effects Effects 0.000 description 2
- 238000000132 electrospray ionisation Methods 0.000 description 2
- 238000004811 liquid chromatography Methods 0.000 description 2
- 239000000203 mixture Substances 0.000 description 2
- 108090000765 processed proteins & peptides Proteins 0.000 description 2
- 239000012588 trypsin Substances 0.000 description 2
- 206010028980 Neoplasm Diseases 0.000 description 1
- 108010026552 Proteome Proteins 0.000 description 1
- 229910052786 argon Inorganic materials 0.000 description 1
- 210000000601 blood cell Anatomy 0.000 description 1
- 201000011510 cancer Diseases 0.000 description 1
- 239000003795 chemical substances by application Substances 0.000 description 1
- 238000001816 cooling Methods 0.000 description 1
- 238000005516 engineering process Methods 0.000 description 1
- 239000007789 gas Substances 0.000 description 1
- 238000010438 heat treatment Methods 0.000 description 1
- 238000005040 ion trap Methods 0.000 description 1
- 238000000752 ionisation method Methods 0.000 description 1
- 230000014759 maintenance of location Effects 0.000 description 1
- 229910052757 nitrogen Inorganic materials 0.000 description 1
- 210000002966 serum Anatomy 0.000 description 1
- 238000003756 stirring Methods 0.000 description 1
Images




Classifications
-
- G—PHYSICS
- G01—MEASURING; TESTING
- G01N—INVESTIGATING OR ANALYSING MATERIALS BY DETERMINING THEIR CHEMICAL OR PHYSICAL PROPERTIES
- G01N33/00—Investigating or analysing materials by specific methods not covered by groups G01N1/00 - G01N31/00
- G01N33/48—Biological material, e.g. blood, urine; Haemocytometers
- G01N33/50—Chemical analysis of biological material, e.g. blood, urine; Testing involving biospecific ligand binding methods; Immunological testing
- G01N33/68—Chemical analysis of biological material, e.g. blood, urine; Testing involving biospecific ligand binding methods; Immunological testing involving proteins, peptides or amino acids
- G01N33/6803—General methods of protein analysis not limited to specific proteins or families of proteins
- G01N33/6848—Methods of protein analysis involving mass spectrometry
-
- G—PHYSICS
- G01—MEASURING; TESTING
- G01N—INVESTIGATING OR ANALYSING MATERIALS BY DETERMINING THEIR CHEMICAL OR PHYSICAL PROPERTIES
- G01N2458/00—Labels used in chemical analysis of biological material
- G01N2458/15—Non-radioactive isotope labels, e.g. for detection by mass spectrometry
-
- G—PHYSICS
- G01—MEASURING; TESTING
- G01N—INVESTIGATING OR ANALYSING MATERIALS BY DETERMINING THEIR CHEMICAL OR PHYSICAL PROPERTIES
- G01N2560/00—Chemical aspects of mass spectrometric analysis of biological material
Definitions
- the present invention relates to a method for identifying proteins for identifying a protein contained in a target sample derived from blood.
- each component in a sample is separated by liquid chromatography, and MS/MS measurement is sequentially performed on each of the separated components, so that each of the components is identified based on an obtained MS/MS spectrum (for example, see Patent Document 1 below).
- the protein sample is digested with a digestive enzyme such as trypsin, and a mixture of resulting peptide fragments (peptide mixture) is measured.
- the above-described analysis method is known as a method called shotgun analysis using mass spectrometry. Specifically, each component separated by a liquid chromatograph is ionized, and mass spectrometry is performed on each of the ionized components, so that an MS spectrum is measured (MS measurement). Then, a peak with a high intensity is selected from data of the obtained MS spectrum, and an ion (precursor ion) corresponding to the peak is cleaved to perform mass spectrometry, so that an MS/MS spectrum is measured (MS/MS measurement).
- MS/MS measurement mass spectrometry
- Patent Document 1 Japanese Patent Laid-Open No. 2015-148461
- mass spectrometry is sequentially performed on each component separated and sent by liquid chromatography, and MS/MS measurement needs to be performed at relatively short time intervals (for example, about several seconds). For this reason, the number of ions that can be selected as precursor ions is limited, and it is difficult to perform MS/MS measurement by selecting peaks derived from all proteins contained in a sample.
- peaks derived from abundantly contained proteins are preferentially selected, and MS/MS measurement is performed using ions corresponding to those peaks as precursor ions.
- peaks derived from proteins contained in a small amount are less likely to be selected, and an MS/MS spectrum for ions corresponding to those peaks is not obtained in some cases.
- a sample derived from blood has a characteristic of being rich in some types of proteins (for example, albumin).
- proteins for example, albumin.
- shotgun analysis is performed on such a sample derived from blood, a peak derived from a protein contained in a large amount in the sample is preferentially selected and the MS/MS measurement is performed. Accordingly, there is a problem that an MS/MS spectrum for a peak derived from other proteins contained in a small amount is missed.
- kit column for example, "Multiple Affinity Removal Column Human 14" by Agilent Technologies
- the efficiency of protein removal is poor, or the concentration of proteins remaining after removal of a main protein is biased. Accordingly, the problem has not been completely solved in the present circumstances.
- the present invention has been made in view of the above circumstances, and an object of the present invention is to provide a method for identifying proteins capable of increasing the number of identified proteins contained in a target sample derived from blood.
- the method for identifying proteins includes a first pretreatment step, a second pretreatment step, a mixing step, a separating step, an MS measurement step, an MS/MS measurement step, and an identifying step.
- first pretreatment step fragmentation and labeling of a protein are performed on a target sample derived from blood, the target sample containing a plurality of types of proteins.
- second pretreatment step fragmentation and labeling of a protein are performed on an additional sample containing a plurality of types of proteins with less bias in a quantity ratio of proteins than the target sample.
- a mixed sample is generated by mixing the target sample after the first pretreatment step is performed with the additional sample that has undergone the second pretreatment.
- separating step a component contained in the mixed sample is separated with a liquid chromatograph.
- MS measurement step each of separated components from the mixed sample is ionized, and mass spectrometry is performed on each of the ionized components to measure an MS spectrum.
- MS/MS measurement step an MS/MS spectrum is measured by cleaving a precursor ion selected based on the MS spectrum and performing mass spectrometry.
- identifying step a protein contained in the target sample is identified based on the MS/MS spectrum.
- a protein contained in the target sample derived from blood is fragmented, and a protein contained in the additional sample having less bias in a quantity ratio of proteins than the target sample is fragmented, and the fragmented proteins are mixed.
- the mixed sample in which the bias in a quantity ratio of proteins is less than that of the target sample can be generated. Therefore, by performing MS/MS measurement using the generated mixed sample, an MS/MS spectrum of a peak derived from a protein contained in a small amount in the target sample can be prevented from being missed. Accordingly, the number of identified proteins in the target sample derived from blood can be increased.
- both the target sample derived from blood and the additional sample mixed with the target sample are mixed after labeling. Since a protein derived from the target sample and a protein derived from the additional sample can be clearly distinguished from each other in the above manner, only the protein contained in the target sample derived from blood can be reliably identified.
- the additional sample may be a sample in which a quantity ratio of proteins is changed by applying a stimulus.
- the additional sample in which a quantity ratio of proteins is changed by applying a stimulus is mixed with the target sample derived from blood, and MS/MS measurement is performed using the generated mixed sample, so that a protein increased in quantity by the stimulus can be identified.
- the additional sample may be a sample derived from a cell or a tissue.
- the additional sample by using, as the additional sample, a sample derived from a cell or a tissue with less bias in a quantity ratio of proteins as compared with the target sample derived from blood, the number of identified proteins contained in the target sample derived from blood can be successfully increased.
- a mixed sample in which a bias in a quantity ratio of proteins is reduced as compared with that of a target sample can be generated. Accordingly, by performing MS/MS measurement using the generated mixed sample, the number of identified proteins contained in the target sample derived from blood can be increased.
- FIG. 1 is a block diagram showing a configuration example of an analyzer used when a method for identifying proteins according to one embodiment of the present invention is performed.
- This analyzer includes a liquid chromatograph 1 and a mass spectrometer 2.
- the liquid chromatograph 1 includes a column (not shown), and components contained in a sample are temporally separated by the column. The components in the sample temporally separated in the liquid chromatograph 1 are sequentially sent to the mass spectrometer 2 with different holding times (retention times).
- the mass spectrometer 2 includes an ionization chamber 21, a first mass separation unit 22, a collision chamber 23, a second mass separation unit 24, a detector 25, and the like.
- the components in the sample separated in the liquid chromatograph 1 are sequentially sent to the ionization chamber 21, where the components are ionized.
- the components in the sample can be ionized using a publicly-known ionization method such as, for example, electrospray ionization (ESI) or atmospheric pressure chemical ionization (APCI).
- ESI electrospray ionization
- APCI atmospheric pressure chemical ionization
- the first mass separation unit 22 includes, for example, a quadrupole mass filter, and selects and allows only ions having a predetermined mass-to-charge ratio to pass through.
- the ions that have passed through the first mass separation unit 22 are sent to the second mass separation unit 24 via the collision chamber 23.
- the ions from the first mass separation unit 22 are caused to collide with gas (argon, nitrogen, and the like) and cleaved, so that fragmented product ions can be generated.
- the second mass separation unit 24 includes, for example, a quadrupole mass filter, like the first mass separation unit 22, and can allow only ions having a predetermined mass-to-charge ratio to pass through.
- the ions that have passed through the second mass separation unit 22 are detected by the detector 25, and the detector 25 outputs a detection signal according to an amount of the detected ions. Based on the detection signal from the detector 25, spectrum data can be obtained.
- first mass separation unit 22 and the second mass separation unit 24 are not limited to the configuration including the quadrupole mass filter.
- a configuration using an ion trap as the first mass separation unit 22 or a configuration using a time-of-flight mass spectrometer (TOF-MS) as the second mass separation unit 24 can also be employed.
- TOF-MS time-of-flight mass spectrometer
- components in a sample ionized in the ionization chamber 21 are detected by the detector 25 without being cleaved in the collision chamber 23 and mass spectrometry is performed, so that an MS spectrum can be measured (MS measurement). Further, a peak with a high intensity is selected from data of an MS spectrum, and an ion (precursor ion) corresponding to the peak is cleaved in the collision chamber 23 to generate a product ion. The product ion is detected by the detector 25 and mass spectrometry is performed, so that an MS/MS spectrum can be measured (MS/MS measurement).
- a sample derived from blood the target sample containing a plurality of types of proteins is set as a target to be measured (target sample), and a mixed sample obtained by mixing an additional sample with the target sample is prepared.
- the mixed sample is measured by the above-described analyzer, so that the proteins contained in the target sample are identified.
- the additional sample is not particularly limited as long as the additional sample is a sample containing a plurality of types of proteins in which a quantity ratio of the proteins is less biased than the target sample.
- a sample derived from a cell or a tissue is preferably used. Note that, as the sample derived from blood, for example, plasma, serum, whole blood or blood cells can be exemplified. Further, the sample derived from a cell is a sample derived from various cells such as a cancer cell, and the sample derived from a tissue is a sample derived from a tissue made of various cells.
- FIG. 2A is a diagram conceptually showing a relationship between a plurality of types of proteins contained in the target sample and an abundance.
- FIG. 2B is a diagram conceptually showing a relationship between a plurality of types of proteins contained in the additional sample and an abundance.
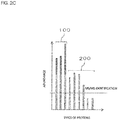
- FIG. 2C is a diagram conceptually showing a relationship between a plurality of types of proteins contained in the mixed sample and an abundance.
- the bias in a quantity ratio of a plurality of types of proteins contained in the additional sample is smaller than that of the target sample shown in FIG. 2A . That is, a difference in abundance between the protein types having a large abundance and the protein types having a small abundance is not as large as that of the target sample.
- the protein types contained in the additional sample and the protein types contained in the target sample overlap at least partially.
- the bias in the quantity ratio of these is smaller than that of the target sample.
- the bias in the quantity ratio of a plurality of types of proteins contained in the obtained mixed sample is smaller than that in the case of the target sample alone shown in FIG.2A . That is, not only the protein types 100 that has a large abundance in the case of the target sample alone, but also the abundance of at least part of the other protein types 200 is large. As a result, the bias in the quantity ratio of proteins is smaller than that in the case of the target sample alone.
- FIG. 3 is a flowchart showing an example of a method for identifying proteins according to one embodiment of the present invention.
- Step S101 protein fragmentation and labeling are performed on the target sample. Specifically, a protein contained in the target sample is digested by a digestive enzyme such as trypsin, and fragmented into peptide fragments. Further, labeling is performed by label-modifying a protein contained in the target sample using a stable isotope reagent such as a TMT reagent manufactured by Thermo Fisher Scientific Inc. Since a method of fragmentation and labeling is well known, detailed description of the method will be omitted. Note that either one of fragmentation and labeling of a protein on the target sample may be performed first.
- a stable isotope reagent such as a TMT reagent manufactured by Thermo Fisher Scientific Inc. Since a method of fragmentation and labeling is well known, detailed description of the method will be omitted. Note that either one of fragmentation and labeling of a protein on the target sample may be performed first.
- Step S102 fragmentation and labeling of a protein are performed on the additional sample.
- the method of fragmentation and labeling of a protein on the additional sample is similar to that of the first pretreatment step on the target sample, and either one of fragmentation and labeling may be performed first. Further, either one of the first pretreatment step and the second pretreatment step may be performed first, or the steps may be performed in parallel.
- the labeling of a protein is preferably performed using different reagents that cause a mass difference between the target sample and the additional sample when a precursor ion is cleaved during MS/MS measurement.
- the target sample after the first pretreatment step is performed is mixed with the additional sample after the second pretreatment step to form a mixed sample (Step S103), and the mixed sample is introduced into the liquid chromatograph 1. In this manner, components contained in the mixed sample are separated by the liquid chromatograph 1 (Step S104: separating step).
- each of the components from the mixed sample separated by the liquid chromatograph 1 is introduced into the mass spectrometer 2.
- the mass spectrometer 2 first, each of the separated components from the mixed sample is ionized in the ionization chamber 21, and mass spectrometry for each of the ionized components is performed, so that an MS spectrum is measured (Step S105: MS measurement step).
- a peak whose intensity is equal to or larger than a threshold is selected from data of the MS spectrum, so that an ion corresponding to the peak is selected as a precursor ion. Then, the selected precursor ion is cleaved in the collision chamber 23, so that a product ion is generated. Mass spectrometry is performed on the product ion, so that an MS/MS spectrum is measured (Steps S106 and S107: MS/MS measurement step).
- Step S106 and S107 The MS/MS measurement steps (Steps S106 and S107) as described above are performed for all the selected precursor ions. Then, after the MS/MS measurement step is performed on all the precursor ions (Yes in Step S108), a protein contained in the target sample is identified based on the obtained MS/MS spectrum (Step S109: identifying step). This identifying step can be performed using a publicly-known method such as a database search.
- the LC-MS/MS analysis (Steps S104 to S109) on the mixed sample is performed. That is, a protein contained in the target sample derived from blood is fragmented, and a protein contained in the additional sample having less bias in a quantity ratio of proteins than the target sample is fragmented, and the fragmented proteins are mixed. In this manner, as shown in FIG. 2C , the mixed sample in which the bias in a quantity ratio of proteins is less than that of the target sample can be generated.
- an MS/MS spectrum of a peak derived from a protein contained in a small amount in the target sample can be prevented from being missed. Accordingly, the number of identified proteins in the target sample derived from blood can be increased.
- both the target sample derived from blood and the additional sample mixed with the target sample are mixed after the labeling is performed in the first pretreatment step (Step S101) or the second pretreatment step (Step S102) (Step S103). Since a protein derived from the target sample and a protein derived from the additional sample can be clearly distinguished from each other in the above manner, only the protein contained in the target sample derived from blood can be reliably identified.
- the bias in a quantity ratio of proteins can be successfully reduced as shown in FIG. 2C . Therefore, the number of identified proteins contained in the target sample derived from blood can be successfully increased.
- the target sample can be mixed after a stimulus is applied to the additional sample.
- a method of applying a stimulus to the additional sample include various methods such as heating or cooling or stirring the additional sample, in addition to a method of adding an agent to the additional sample.
- Plasma was used as the target sample derived from blood, and a HeLa cell, which was a sample derived from a cell, was used as the additional sample. Further, TMT reagents (TMT126 and TMT131) manufactured by Thermo Fisher Scientific Inc. were used for labeling proteins, and Orbitrap-Fusion manufactured by the same company was used for measurement. Note that, plasma is a typical sample containing a large amount of some proteins such as albumin and having a bias in a quantity ratio of the proteins.
- FIG. 4A is a diagram showing a process of a procedure when a protein was identified using only plasma as the target sample.
- the target sample obtained by fragmenting a protein derived from plasma and labeling the protein with TMT126 was mixed with the target sample obtained by fragmenting a protein derived from plasma and labeling the protein with TMT131, and LC-MS/MS analysis was performed on the mixed sample.
- the number of identified proteins in the target sample was "284".
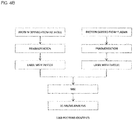
- FIG. 4B is a diagram showing a process of a procedure when a protein was identified by mixing a HeLa cell as the additional sample with plasma as the target sample.
- the additional sample obtained by fragmenting a protein derived from a HeLa cell and fragmenting the protein with TMT126 was mixed with the target sample obtained by fragmenting a protein derived from plasma and labeling the protein with TMT131, and LC-MS/MS analysis was performed on the mixed sample.
- the number of identified proteins contained in the target sample was "1283", and the number of identified proteins was dramatically increased.
Landscapes
- Life Sciences & Earth Sciences (AREA)
- Health & Medical Sciences (AREA)
- Engineering & Computer Science (AREA)
- Molecular Biology (AREA)
- Physics & Mathematics (AREA)
- Bioinformatics & Cheminformatics (AREA)
- Bioinformatics & Computational Biology (AREA)
- Chemical & Material Sciences (AREA)
- Urology & Nephrology (AREA)
- Immunology (AREA)
- Biomedical Technology (AREA)
- Hematology (AREA)
- Cell Biology (AREA)
- Medicinal Chemistry (AREA)
- Proteomics, Peptides & Aminoacids (AREA)
- Microbiology (AREA)
- Biophysics (AREA)
- Spectroscopy & Molecular Physics (AREA)
- Food Science & Technology (AREA)
- Biotechnology (AREA)
- Analytical Chemistry (AREA)
- Biochemistry (AREA)
- General Health & Medical Sciences (AREA)
- General Physics & Mathematics (AREA)
- Pathology (AREA)
- Other Investigation Or Analysis Of Materials By Electrical Means (AREA)
Abstract
Description
- The present invention relates to a method for identifying proteins for identifying a protein contained in a target sample derived from blood.
- In the field of proteome analysis, which performs comprehensive analysis of proteins, there is a case where each component in a sample is separated by liquid chromatography, and MS/MS measurement is sequentially performed on each of the separated components, so that each of the components is identified based on an obtained MS/MS spectrum (for example, see Patent Document 1 below). In this case, the protein sample is digested with a digestive enzyme such as trypsin, and a mixture of resulting peptide fragments (peptide mixture) is measured.
- The above-described analysis method is known as a method called shotgun analysis using mass spectrometry. Specifically, each component separated by a liquid chromatograph is ionized, and mass spectrometry is performed on each of the ionized components, so that an MS spectrum is measured (MS measurement). Then, a peak with a high intensity is selected from data of the obtained MS spectrum, and an ion (precursor ion) corresponding to the peak is cleaved to perform mass spectrometry, so that an MS/MS spectrum is measured (MS/MS measurement). By performing a database search using the MS/MS spectrum obtained in this manner, identification of a peptide sequence and identification of a protein can be performed.
- Patent Document 1: Japanese Patent Laid-Open No.
2015-148461 - In the above shotgun analysis, mass spectrometry is sequentially performed on each component separated and sent by liquid chromatography, and MS/MS measurement needs to be performed at relatively short time intervals (for example, about several seconds). For this reason, the number of ions that can be selected as precursor ions is limited, and it is difficult to perform MS/MS measurement by selecting peaks derived from all proteins contained in a sample.
- In particular, in a case where there is a bias in a quantity ratio of a plurality of types of proteins contained in a sample, peaks derived from abundantly contained proteins are preferentially selected, and MS/MS measurement is performed using ions corresponding to those peaks as precursor ions. In this case, peaks derived from proteins contained in a small amount are less likely to be selected, and an MS/MS spectrum for ions corresponding to those peaks is not obtained in some cases.
- For example, a sample derived from blood has a characteristic of being rich in some types of proteins (for example, albumin). In a case where shotgun analysis is performed on such a sample derived from blood, a peak derived from a protein contained in a large amount in the sample is preferentially selected and the MS/MS measurement is performed. Accordingly, there is a problem that an MS/MS spectrum for a peak derived from other proteins contained in a small amount is missed.
- Therefore, a kit column (for example, "Multiple Affinity Removal Column Human 14" by Agilent Technologies) and the like for removing proteins contained in a large amount in a blood sample are also commercially available. However, even with such a kit column, the efficiency of protein removal is poor, or the concentration of proteins remaining after removal of a main protein is biased. Accordingly, the problem has not been completely solved in the present circumstances.
- The present invention has been made in view of the above circumstances, and an object of the present invention is to provide a method for identifying proteins capable of increasing the number of identified proteins contained in a target sample derived from blood.
- The method for identifying proteins according to the present invention includes a first pretreatment step, a second pretreatment step, a mixing step, a separating step, an MS measurement step, an MS/MS measurement step, and an identifying step. In the first pretreatment step, fragmentation and labeling of a protein are performed on a target sample derived from blood, the target sample containing a plurality of types of proteins. In the second pretreatment step, fragmentation and labeling of a protein are performed on an additional sample containing a plurality of types of proteins with less bias in a quantity ratio of proteins than the target sample. In the mixing step, a mixed sample is generated by mixing the target sample after the first pretreatment step is performed with the additional sample that has undergone the second pretreatment. In the separating step, a component contained in the mixed sample is separated with a liquid chromatograph. In the MS measurement step, each of separated components from the mixed sample is ionized, and mass spectrometry is performed on each of the ionized components to measure an MS spectrum. In the MS/MS measurement step, an MS/MS spectrum is measured by cleaving a precursor ion selected based on the MS spectrum and performing mass spectrometry. In the identifying step, a protein contained in the target sample is identified based on the MS/MS spectrum.
- According to such a configuration, a protein contained in the target sample derived from blood is fragmented, and a protein contained in the additional sample having less bias in a quantity ratio of proteins than the target sample is fragmented, and the fragmented proteins are mixed. In this manner, the mixed sample in which the bias in a quantity ratio of proteins is less than that of the target sample can be generated. Therefore, by performing MS/MS measurement using the generated mixed sample, an MS/MS spectrum of a peak derived from a protein contained in a small amount in the target sample can be prevented from being missed. Accordingly, the number of identified proteins in the target sample derived from blood can be increased.
- Further, both the target sample derived from blood and the additional sample mixed with the target sample are mixed after labeling. Since a protein derived from the target sample and a protein derived from the additional sample can be clearly distinguished from each other in the above manner, only the protein contained in the target sample derived from blood can be reliably identified.
- The additional sample may be a sample in which a quantity ratio of proteins is changed by applying a stimulus.
- According to such a configuration, the additional sample in which a quantity ratio of proteins is changed by applying a stimulus is mixed with the target sample derived from blood, and MS/MS measurement is performed using the generated mixed sample, so that a protein increased in quantity by the stimulus can be identified.
- The additional sample may be a sample derived from a cell or a tissue.
- According to such a configuration, by using, as the additional sample, a sample derived from a cell or a tissue with less bias in a quantity ratio of proteins as compared with the target sample derived from blood, the number of identified proteins contained in the target sample derived from blood can be successfully increased.
- According to the present invention, a mixed sample in which a bias in a quantity ratio of proteins is reduced as compared with that of a target sample can be generated. Accordingly, by performing MS/MS measurement using the generated mixed sample, the number of identified proteins contained in the target sample derived from blood can be increased.
-
-
FIG. 1 is a block diagram showing a configuration example of an analyzer used when a method for identifying proteins according to one embodiment of the present invention is performed. -
FIG. 2A is a diagram conceptually showing a relationship between a plurality of types of proteins contained in a target sample and an abundance. -
FIG. 2B is a diagram conceptually showing a relationship between a plurality of types of proteins contained in an additional sample and an abundance. -
FIG. 2C is a diagram conceptually showing a relationship between a plurality of types of proteins contained in a mixed sample and an abundance. -
FIG. 3 is a flowchart showing an example of a method for identifying proteins according to one embodiment of the present invention. -
FIG. 4A is a diagram showing a process of a procedure when a protein was identified using only plasma as a target sample. -
FIG. 4B is a diagram showing a process of a procedure when a protein was identified by mixing a HeLa cell as an additional sample with plasma as a target sample. -
FIG. 1 is a block diagram showing a configuration example of an analyzer used when a method for identifying proteins according to one embodiment of the present invention is performed. This analyzer includes a liquid chromatograph 1 and amass spectrometer 2. - The liquid chromatograph 1 includes a column (not shown), and components contained in a sample are temporally separated by the column. The components in the sample temporally separated in the liquid chromatograph 1 are sequentially sent to the
mass spectrometer 2 with different holding times (retention times). - The
mass spectrometer 2 includes anionization chamber 21, a firstmass separation unit 22, acollision chamber 23, a secondmass separation unit 24, adetector 25, and the like. The components in the sample separated in the liquid chromatograph 1 are sequentially sent to theionization chamber 21, where the components are ionized. The components in the sample can be ionized using a publicly-known ionization method such as, for example, electrospray ionization (ESI) or atmospheric pressure chemical ionization (APCI). - The first
mass separation unit 22 includes, for example, a quadrupole mass filter, and selects and allows only ions having a predetermined mass-to-charge ratio to pass through. The ions that have passed through the firstmass separation unit 22 are sent to the secondmass separation unit 24 via thecollision chamber 23. In thecollision chamber 23, the ions from the firstmass separation unit 22 are caused to collide with gas (argon, nitrogen, and the like) and cleaved, so that fragmented product ions can be generated. - The second
mass separation unit 24 includes, for example, a quadrupole mass filter, like the firstmass separation unit 22, and can allow only ions having a predetermined mass-to-charge ratio to pass through. The ions that have passed through the secondmass separation unit 22 are detected by thedetector 25, and thedetector 25 outputs a detection signal according to an amount of the detected ions. Based on the detection signal from thedetector 25, spectrum data can be obtained. - However, the first
mass separation unit 22 and the secondmass separation unit 24 are not limited to the configuration including the quadrupole mass filter. For example, a configuration using an ion trap as the firstmass separation unit 22 or a configuration using a time-of-flight mass spectrometer (TOF-MS) as the secondmass separation unit 24 can also be employed. - In this analyzer, components in a sample ionized in the
ionization chamber 21 are detected by thedetector 25 without being cleaved in thecollision chamber 23 and mass spectrometry is performed, so that an MS spectrum can be measured (MS measurement). Further, a peak with a high intensity is selected from data of an MS spectrum, and an ion (precursor ion) corresponding to the peak is cleaved in thecollision chamber 23 to generate a product ion. The product ion is detected by thedetector 25 and mass spectrometry is performed, so that an MS/MS spectrum can be measured (MS/MS measurement). - In the present embodiment, a sample derived from blood, the target sample containing a plurality of types of proteins is set as a target to be measured (target sample), and a mixed sample obtained by mixing an additional sample with the target sample is prepared. The mixed sample is measured by the above-described analyzer, so that the proteins contained in the target sample are identified. The additional sample is not particularly limited as long as the additional sample is a sample containing a plurality of types of proteins in which a quantity ratio of the proteins is less biased than the target sample. For example, a sample derived from a cell or a tissue is preferably used. Note that, as the sample derived from blood, for example, plasma, serum, whole blood or blood cells can be exemplified. Further, the sample derived from a cell is a sample derived from various cells such as a cancer cell, and the sample derived from a tissue is a sample derived from a tissue made of various cells.
-
FIG. 2A is a diagram conceptually showing a relationship between a plurality of types of proteins contained in the target sample and an abundance.FIG. 2B is a diagram conceptually showing a relationship between a plurality of types of proteins contained in the additional sample and an abundance.FIG. 2C is a diagram conceptually showing a relationship between a plurality of types of proteins contained in the mixed sample and an abundance. - As shown in
FIG. 2A , in the target sample derived from blood, there is a large bias in a quantity ratio of a plurality of types of proteins contained in the target sample. That is, there is a relatively large difference in abundance betweenprotein types 100 having a large abundance and other protein types 200. Therefore, a peak corresponding to theprotein types 100 having a large abundance is easily detected with high intensity. As a result, peaks corresponding to theother protein types 200 are less likely to be selected as a precursor ion, and an MS/MS spectrum of ions corresponding to the peaks cannot be obtained in some cases. In this case, theprotein types 200 having a small abundance cannot be identified based on an MS/MS spectrum in some cases even though the protein types are included in the target sample. - On the other hand, as shown in
FIG. 2B , in the additional sample derived from a cell or a tissue, the bias in a quantity ratio of a plurality of types of proteins contained in the additional sample is smaller than that of the target sample shown inFIG. 2A . That is, a difference in abundance between the protein types having a large abundance and the protein types having a small abundance is not as large as that of the target sample. The protein types contained in the additional sample and the protein types contained in the target sample overlap at least partially. In the examples ofFIGS. 2A and 2B , while both theprotein types 100 having a large abundance in the target sample and theother protein types 200 are contained in the additional sample, the bias in the quantity ratio of these is smaller than that of the target sample. - In a case where the target sample and the additional sample as described above are mixed, as shown in
FIG.2C , the bias in the quantity ratio of a plurality of types of proteins contained in the obtained mixed sample is smaller than that in the case of the target sample alone shown inFIG.2A . That is, not only theprotein types 100 that has a large abundance in the case of the target sample alone, but also the abundance of at least part of theother protein types 200 is large. As a result, the bias in the quantity ratio of proteins is smaller than that in the case of the target sample alone. -
FIG. 3 is a flowchart showing an example of a method for identifying proteins according to one embodiment of the present invention. When a protein contained in the target sample is identified, first, a first pretreatment is performed on the target sample (Step S101: first pretreatment step), and a second pretreatment is performed on the additional sample (Step S102: second pretreatment step). Then, the target sample and the additional sample are mixed to generate a mixed sample (Step S103: mixing step). - In the first pretreatment step (Step S101), protein fragmentation and labeling are performed on the target sample. Specifically, a protein contained in the target sample is digested by a digestive enzyme such as trypsin, and fragmented into peptide fragments. Further, labeling is performed by label-modifying a protein contained in the target sample using a stable isotope reagent such as a TMT reagent manufactured by Thermo Fisher Scientific Inc. Since a method of fragmentation and labeling is well known, detailed description of the method will be omitted. Note that either one of fragmentation and labeling of a protein on the target sample may be performed first.
- In the second pretreatment step (Step S102), fragmentation and labeling of a protein are performed on the additional sample. The method of fragmentation and labeling of a protein on the additional sample is similar to that of the first pretreatment step on the target sample, and either one of fragmentation and labeling may be performed first. Further, either one of the first pretreatment step and the second pretreatment step may be performed first, or the steps may be performed in parallel. The labeling of a protein is preferably performed using different reagents that cause a mass difference between the target sample and the additional sample when a precursor ion is cleaved during MS/MS measurement.
- The target sample after the first pretreatment step is performed is mixed with the additional sample after the second pretreatment step to form a mixed sample (Step S103), and the mixed sample is introduced into the liquid chromatograph 1. In this manner, components contained in the mixed sample are separated by the liquid chromatograph 1 (Step S104: separating step).
- Each of the components from the mixed sample separated by the liquid chromatograph 1 is introduced into the
mass spectrometer 2. In themass spectrometer 2, first, each of the separated components from the mixed sample is ionized in theionization chamber 21, and mass spectrometry for each of the ionized components is performed, so that an MS spectrum is measured (Step S105: MS measurement step). - After the above, a peak whose intensity is equal to or larger than a threshold is selected from data of the MS spectrum, so that an ion corresponding to the peak is selected as a precursor ion. Then, the selected precursor ion is cleaved in the
collision chamber 23, so that a product ion is generated. Mass spectrometry is performed on the product ion, so that an MS/MS spectrum is measured (Steps S106 and S107: MS/MS measurement step). - The MS/MS measurement steps (Steps S106 and S107) as described above are performed for all the selected precursor ions. Then, after the MS/MS measurement step is performed on all the precursor ions (Yes in Step S108), a protein contained in the target sample is identified based on the obtained MS/MS spectrum (Step S109: identifying step). This identifying step can be performed using a publicly-known method such as a database search.
- As described above, in the present embodiment, after the target sample and the additional sample are mixed to generate the mixed sample (Steps S101 to S103), the LC-MS/MS analysis (Steps S104 to S109) on the mixed sample is performed. That is, a protein contained in the target sample derived from blood is fragmented, and a protein contained in the additional sample having less bias in a quantity ratio of proteins than the target sample is fragmented, and the fragmented proteins are mixed. In this manner, as shown in
FIG. 2C , the mixed sample in which the bias in a quantity ratio of proteins is less than that of the target sample can be generated. Therefore, by performing MS/MS measurement using the generated mixed sample, an MS/MS spectrum of a peak derived from a protein contained in a small amount in the target sample can be prevented from being missed. Accordingly, the number of identified proteins in the target sample derived from blood can be increased. - Further, both the target sample derived from blood and the additional sample mixed with the target sample are mixed after the labeling is performed in the first pretreatment step (Step S101) or the second pretreatment step (Step S102) (Step S103). Since a protein derived from the target sample and a protein derived from the additional sample can be clearly distinguished from each other in the above manner, only the protein contained in the target sample derived from blood can be reliably identified.
- In particular, when a sample derived from a cell or a tissue with less bias in a quantity ratio of proteins as compared with the target sample derived from blood is used as the additional sample, the bias in a quantity ratio of proteins can be successfully reduced as shown in
FIG. 2C . Therefore, the number of identified proteins contained in the target sample derived from blood can be successfully increased. - Instead of simply mixing the target sample and the additional sample as described above, the target sample can be mixed after a stimulus is applied to the additional sample. Examples of a method of applying a stimulus to the additional sample include various methods such as heating or cooling or stirring the additional sample, in addition to a method of adding an agent to the additional sample. By applying a stimulus to the additional sample as described above, the additional sample is converted into a sample in which a quantity ratio of proteins is changed, and then mixed with the target sample. By performing the MS/MS measurement using the mixed sample thus generated, a protein increased in quantity by the stimulus can be identified.
- Hereinafter, a result of an effect test in which the number of identified proteins contained in the target sample can be increased by mixing the additional sample with the target sample derived from blood and performing LC-MS/MS analysis will be described. Plasma was used as the target sample derived from blood, and a HeLa cell, which was a sample derived from a cell, was used as the additional sample. Further, TMT reagents (TMT126 and TMT131) manufactured by Thermo Fisher Scientific Inc. were used for labeling proteins, and Orbitrap-Fusion manufactured by the same company was used for measurement. Note that, plasma is a typical sample containing a large amount of some proteins such as albumin and having a bias in a quantity ratio of the proteins.
-
FIG. 4A is a diagram showing a process of a procedure when a protein was identified using only plasma as the target sample. In this case, the target sample obtained by fragmenting a protein derived from plasma and labeling the protein with TMT126 was mixed with the target sample obtained by fragmenting a protein derived from plasma and labeling the protein with TMT131, and LC-MS/MS analysis was performed on the mixed sample. As a result, the number of identified proteins in the target sample was "284". -
FIG. 4B is a diagram showing a process of a procedure when a protein was identified by mixing a HeLa cell as the additional sample with plasma as the target sample. In this case, the additional sample obtained by fragmenting a protein derived from a HeLa cell and fragmenting the protein with TMT126 was mixed with the target sample obtained by fragmenting a protein derived from plasma and labeling the protein with TMT131, and LC-MS/MS analysis was performed on the mixed sample. As a result, the number of identified proteins contained in the target sample was "1283", and the number of identified proteins was dramatically increased. -
- 1
- liquid chromatograph
- 2
- mass spectrometer
- 21
- ionization chamber
- 22
- mass separation unit
- 23
- collision chamber
- 24
- mass separation unit
- 25
- detector
Claims (3)
- A method for identifying proteins, comprising:a first pretreatment step of performing fragmentation and labeling on a protein for a target sample derived from blood, the target sample containing a plurality of types of proteins;a second pretreatment step of performing fragmentation and labeling on a protein for an additional sample containing a plurality of types of proteins with less bias in a quantity ratio of proteins than the target sample;a mixing step of generating a mixed sample by mixing the additional sample that has undergone the second pretreatment with the target sample after the first pretreatment step is performed;a separating step of separating the mixed sample into components with a liquid chromatograph;an MS measurement step of measuring an MS spectrum by ionizing each of separated components from the mixed sample and performing mass spectrometry for each of the ionized components;an MS/MS measurement step of measuring an MS/MS spectrum by performing mass spectrometry by cleaving a precursor ion selected based on the MS spectrum; andan identifying step of identifying a protein contained in the target sample based on the MS/MS spectrum.
- The method for identifying proteins according to claim 1, wherein the additional sample is a sample in which a quantity ratio of proteins is changed by applying a stimulus.
- The method for identifying proteins according to claim 1 or 2, wherein the additional sample is a sample derived from a cell or a tissue.
Applications Claiming Priority (1)
| Application Number | Priority Date | Filing Date | Title |
|---|---|---|---|
| PCT/JP2018/000180 WO2019138441A1 (en) | 2018-01-09 | 2018-01-09 | Method for identifying proteins |
Publications (2)
| Publication Number | Publication Date |
|---|---|
| EP3739328A1 true EP3739328A1 (en) | 2020-11-18 |
| EP3739328A4 EP3739328A4 (en) | 2021-10-20 |
Family
ID=67218230
Family Applications (1)
| Application Number | Title | Priority Date | Filing Date |
|---|---|---|---|
| EP18899287.9A Withdrawn EP3739328A4 (en) | 2018-01-09 | 2018-01-09 | Method for identifying proteins |
Country Status (6)
| Country | Link |
|---|---|
| US (1) | US20200355697A1 (en) |
| EP (1) | EP3739328A4 (en) |
| JP (1) | JP7028258B2 (en) |
| CN (1) | CN111587373A (en) |
| SG (1) | SG11202006629TA (en) |
| WO (1) | WO2019138441A1 (en) |
Family Cites Families (11)
| Publication number | Priority date | Publication date | Assignee | Title |
|---|---|---|---|---|
| US6670194B1 (en) * | 1998-08-25 | 2003-12-30 | University Of Washington | Rapid quantitative analysis of proteins or protein function in complex mixtures |
| JP4758529B2 (en) * | 1999-12-01 | 2011-08-31 | 積水化学工業株式会社 | Packing agent for liquid chromatography and measuring method using the same |
| DE10158860B4 (en) * | 2001-11-30 | 2007-04-05 | Bruker Daltonik Gmbh | Mass spectrometric protein mixture analysis |
| EP1495332A2 (en) * | 2002-04-15 | 2005-01-12 | Thermo Finnigan LLC | Quantitation of biological molecules |
| JP2005121380A (en) * | 2003-10-14 | 2005-05-12 | Sumitomo Pharmaceut Co Ltd | Protein analysis method |
| JP2006300758A (en) * | 2005-04-21 | 2006-11-02 | Apro Life Science Institute Inc | Method for quantifying target protein contained in biological sample using internal standard peptide |
| US20060287834A1 (en) * | 2005-06-16 | 2006-12-21 | Kearney Paul E | Virtual mass spectrometry |
| WO2007108140A1 (en) * | 2006-03-22 | 2007-09-27 | Shimadzu Corporation | Identification method and quantification method for protein sample using electrophoresis and mass spectrometry |
| GB0809488D0 (en) * | 2008-05-23 | 2008-07-02 | Electrophoretics Ltd | Mass spectrometric analysis |
| JP2010044064A (en) * | 2008-07-18 | 2010-02-25 | Shizuoka Prefecture | Protein profiling method by 2d-lcms/ms total spectra |
| JP6191486B2 (en) | 2014-02-05 | 2017-09-06 | 株式会社島津製作所 | Mass spectrometer and mass spectrometry method |
-
2018
- 2018-01-09 JP JP2019565090A patent/JP7028258B2/en active Active
- 2018-01-09 CN CN201880085568.4A patent/CN111587373A/en not_active Withdrawn
- 2018-01-09 US US16/960,765 patent/US20200355697A1/en not_active Abandoned
- 2018-01-09 WO PCT/JP2018/000180 patent/WO2019138441A1/en not_active Ceased
- 2018-01-09 EP EP18899287.9A patent/EP3739328A4/en not_active Withdrawn
- 2018-01-09 SG SG11202006629TA patent/SG11202006629TA/en unknown
Also Published As
| Publication number | Publication date |
|---|---|
| EP3739328A4 (en) | 2021-10-20 |
| CN111587373A (en) | 2020-08-25 |
| JPWO2019138441A1 (en) | 2020-11-19 |
| JP7028258B2 (en) | 2022-03-02 |
| SG11202006629TA (en) | 2020-08-28 |
| US20200355697A1 (en) | 2020-11-12 |
| WO2019138441A1 (en) | 2019-07-18 |
Similar Documents
| Publication | Publication Date | Title |
|---|---|---|
| US10083825B2 (en) | Mass spectrometer with bypass of a fragmentation device | |
| US11378560B2 (en) | Mass spectrum data acquisition and analysis method | |
| US8278115B2 (en) | Methods for processing tandem mass spectral data for protein sequence analysis | |
| US20050063864A1 (en) | Mass spectrometer system | |
| JP5003274B2 (en) | Mass spectrometry system and mass spectrometry method | |
| US12228577B2 (en) | Operating a mass spectrometer utilizing mass spectral database search | |
| EP3971943B1 (en) | Using real time search results to dynamically exclude product ions that may be present in the master scan | |
| JP5472068B2 (en) | Mass spectrometry method and apparatus | |
| JP2004279424A (en) | Method for identifying biopolymer using mass spectrometry and program product used therefor | |
| US20120109533A1 (en) | Method of analyzing protein using data-independent analysis combined with data-dependent analysis | |
| US20210287892A1 (en) | Dynamic ion filtering for reducing highly abundant ions | |
| US9697997B2 (en) | Ion fragmentation | |
| US10317412B1 (en) | Method and device for analyzing protein or peptide | |
| WO2003046577A1 (en) | A system and method for automatic protein sequencing by mass spectrometry | |
| US20240369516A1 (en) | Method of bioanalytical analysis utilizing ion spectrometry, including mass analysis | |
| US11211236B2 (en) | Operating a mass spectrometer utilizing a promotion list | |
| EP1696230A1 (en) | Protein analysis method | |
| Owens et al. | Aspects of oligonucleotide and peptide sequencing with MALDI and electrospray mass spectrometry | |
| JP2015152582A (en) | ion trap mass spectrometer and ion trap mass spectrometry method | |
| Patel et al. | Mass spectrometry-A review | |
| EP3739328A1 (en) | Method for identifying proteins | |
| US11600359B2 (en) | Methods and systems for analysis of mass spectrometry data | |
| JP2015102475A (en) | Sugar peptide analyzer | |
| JP2008039608A (en) | Mass spectrometry system | |
| Ratcliffe | Proteomic Strategies for Protein and Biomarker Identification by Matrix-Assisted Laser Desorption/Ionization Mass Spectrometry |
Legal Events
| Date | Code | Title | Description |
|---|---|---|---|
| STAA | Information on the status of an ep patent application or granted ep patent |
Free format text: STATUS: THE INTERNATIONAL PUBLICATION HAS BEEN MADE |
|
| PUAI | Public reference made under article 153(3) epc to a published international application that has entered the european phase |
Free format text: ORIGINAL CODE: 0009012 |
|
| STAA | Information on the status of an ep patent application or granted ep patent |
Free format text: STATUS: REQUEST FOR EXAMINATION WAS MADE |
|
| 17P | Request for examination filed |
Effective date: 20200730 |
|
| AK | Designated contracting states |
Kind code of ref document: A1 Designated state(s): AL AT BE BG CH CY CZ DE DK EE ES FI FR GB GR HR HU IE IS IT LI LT LU LV MC MK MT NL NO PL PT RO RS SE SI SK SM TR |
|
| AX | Request for extension of the european patent |
Extension state: BA ME |
|
| DAV | Request for validation of the european patent (deleted) | ||
| DAX | Request for extension of the european patent (deleted) | ||
| A4 | Supplementary search report drawn up and despatched |
Effective date: 20210917 |
|
| RIC1 | Information provided on ipc code assigned before grant |
Ipc: G01N 27/62 20210101ALI20210914BHEP Ipc: G01N 33/68 20060101AFI20210914BHEP |
|
| STAA | Information on the status of an ep patent application or granted ep patent |
Free format text: STATUS: THE APPLICATION HAS BEEN WITHDRAWN |
|
| 18W | Application withdrawn |
Effective date: 20221124 |