-
This invention relates to methods for assessing the risk that a subject is affected by prostate cancer and to methods for assessing the risk that such cancer is aggressive, by analysing the gaseous headspace of urine samples with at least three metal oxide semiconductor -based gas sensors, wherein the metal oxide of the first gas sensor is pure or doped SnO2, the metal oxide of the second sensor is pure or doped ZnO and the metal oxides of the third sensor are pure or doped SnO2, pure or doped TiO2 and pure or doped Nb2O5.
BACKGROUND OF THE INVENTION
-
Prostate cancer represents the second most common cancer in men globally (Siegel et al., 2017), and the fifth most frequent cancer in the world. Serum Prostate-Specific Antigen (PSA) is, currently, the most important biomarker for the detection, follow-up, and therapeutic monitoring of prostate cancer. PSA based screening for prostate cancer has had an important impact on the epidemiology of the disease. Its use has been associated with a significant reduction in prostate cancer mortality, but has also resulted in the over-diagnosis and overtreatment of indolent prostate cancer, exposing many men to treatments without benefits (Lee at al., 2017). Its low specificity and sensitivity are mainly attributable to the fact that serum PSA may also be increased in benign conditions, such as benign prostatic hyperplasia and chronic prostatitis. Additionally, serum PSA levels are affected by biologic variability that may be related to differences in androgen levels or prostate manipulation and may have distinct racial variation (Kryvenko et al., 2016). Therefore, the currently most widely practiced method for diagnosis is to subject men with increased PSA values to biopsy sampling. Not only is this procedure invasive, but it also entails a low level of accuracy (i.e. only 30% detection rate at the first biopsy) and is prone to various complications, including sepsis and death (Anastasiadis et al., 2013; Presti et al., 2008).
-
There is thus a need for more reliable, non-invasive, method to assess the risk that a patient is affected by prostate cancer.
-
When it comes to assessing the risk that a prostate cancer is aggressive, the are many available methods. One very reliable method consists in the histologic classification of the tumour stage according to the TNM classification in combination with the tumour grade according to the Gleason Score (GS), but such method entails prostatectomy.
-
Recently, it has been demonstrated that a trained canine olfactory system can detect prostate cancer specific volatile organic compounds (VOCs) in urine samples with high estimated sensitivity and specificity (97%). This approach might have the potential to offer a noninvasive alternative to PSA sampling and prostate biopsy for detecting prostate cancer, but requires the training and housing of dogs. In addition, the results suggest that prostate cancer specific VOCs might depend on a metabolic process of the tumor. In general, odor analysis is not simple, as it entails the objectification of a sensation; however, in the last decades, specific techniques for odor characterization and measurement have been implemented and developed (Capelli et al., 2016). Sensorial techniques are based on the principle of characterizing odors referring to the sensation caused by an odorous sample directly on a panel of human assessors. Even though chemical analysis is a more consolidated method, it can turn out to be highly complex and not always effective for odor analysis. This is particularly true in the characterization of complex odors, for which it is difficult to relate the sensation provoked by an odorous mixture in humans to its chemical composition, mostly due to the highly complicated effects of odorant mixing. For these reasons, the possibility of using an electronic nose capable of reproducing the activity of the mammalian sense of smell appears as a very interesting challenge for the definition of a modern strategy for early and non-invasive diagnosis, and possibly the prognosis of a prostate cancer
-
Metal oxide semi conductor (MOS)- based gas sensors are currently widely used in the field of odour analysis with electronic noses (James et al., 2005; Wilson and Baietto, 2009, 2011; Loutfi et al., 2015).
PRIOR ART
-
Recently, it has been demonstrated that a trained canine olfactory system can detect prostate cancer specific volatile organic compounds (VOCs) in urine samples with high estimated sensitivity and specificity (97%) (Taverna et al., 2015), and that the same dogs are also able to detect Biochemically Recurrent Prostate Cancer (BCR) following radical prostatectomy (Taverna et al., 2016)
-
Roine et al. (2012) describe how an electronic nose equipped with a WO3-based sensor is able to discriminate between healthy and cancerous prostate cells.
-
Asimakopoulos et al. (2014), Santonico et al. (2014), Bernabei et al. (2008) and D'Amico et al. (2012a and b), describe how an electronic nose equipped with various metallo-porphyrins-based sensors can be used on urine samples to diagnose prostate cancer.
BRIEF DESCRIPTION OF THE DRAWINGS
-
- Fig. 1 Depicts a typical response curve of an MOS-based gas sensor during and after analysis of a urine headspace.
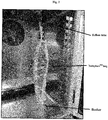
- Fig. 2 Depicts a typical apparatus for the creation of the urine headspace to be analysed.
- Fig. 3 Depicts two Principal Component Analysis score plots used to cluster Healthy (H) vs Prostate Cancer (PC) subjects
- Fig. 4 Depicts a Principal Component Analysis score plot used to cluster high tumour aggressiveness (GS 4) vs intermediate tumour aggressiveness (GS 3+4) prostate cancer patients
DETAILED DESCRIPTION OF THE INVENTION
-
We have surprisingly found that the combined use of three types of MOS-based gas sensors allows to assess, from a urine sample of a subject, the risk that this subject is affected by a prostate cancer, so long as:
- The urine sample is either collected via a catheter, or equivalent means allowing to take the sample directly from that subject's bladder, or if collected as naturally voided urine, does not comprise the last jet of that naturally voided urine, in accordance with the known literature (Smith et al., 2008)
- The urine sample is heated to above 50°C before being subjected to analysis
- The analysis is performed in a humidity-controlled environment
-
Accordingly, in a first aspect of this invention, there is provided an in vitro method to assess risk that a subject is affected by prostate cancer, such method comprising:
- a) obtaining a urine sample from said subject which does not comprise the last jet of a naturally voided urine sample;
- b) heating the sample to above 50°C in a closed, humidity-controlled environment.
- c) analysing the headspace of the sample heated in step b), under humidity control, with at least 3 MOS-based gas sensors, wherein the metal oxide of the first gas sensor is pure or doped SnO2, the metal oxide of the second sensor is pure or doped ZnO and the metal oxides of the third sensor are pure or doped SnO2, pure or doped TiO2 and pure or doped Nb2O5;
- d) comparing the values obtained in step c) to reference values for each sensor, thereby assessing the risk that the subject is affected by prostate cancer.
-
In one embodiment under this first aspect of the invention, the reference values are those obtained on urine samples of subjects that have been classified as prostate cancer free or affected by prostate cancer by other means.
-
We have also surprisingly found that the combined use of the three types of gas sensors described above, allow to assess the risk that a prostate cancer is aggressive.
-
Accordingly, in a second aspect of this invention, there is provided an in vitro method to assess the risk that a subject is affected by an aggressive form of prostate cancer, such method comprising
- a) obtaining a urine sample from said subject which does not comprise the last jet of a naturally voided urine sample;
- b) heating the sample to above 50°C in a closed, humidity-controlled environment;
- c) analysing the headspace of the sample heated in step b), under humidity control, with at least 3 MOS-based gas sensors, wherein the metal oxide of the first gas sensor is pure or doped SnO2, the metal oxide of the second sensor is pure or doped ZnO and the metal oxides of the third sensor are pure or doped SnO2, pure or doped TiO2 and pure or doped Nb2O5.
- d) comparing the values obtained in step c) to reference values for each sensor, thereby assessing the risk that a subject is affected by an aggressive form of prostate cancer.
-
In one embodiment under this second aspect of the invention, the reference values include those obtained on urine samples of subjects that have been classified affected by prostate cancer with a certain risk of being aggressive by other means.
-
In another one embodiment under this second aspect of the invention, the reference values are those obtained on urine samples of subjects that have been classified as prostate cancer free and affected by prostate cancer with a certain risk of being aggressive by other means.
-
As used herein, the terms "first gas sensor", "second gas sensor" and "third gas sensor" are not to be construed as the order in which the sensors are to be used in the methods of the invention, but only as a way to clearly distinguish the sensors from each other.
-
An electronic nose is an instrument which comprises an array of electronic chemical sensors with partial specificity and an appropriate pattern recognition (PR) system, capable of recognizing simple or complex odours.
-
The architecture of the electronic nose emulates the structure of the mammalian olfactory system, and thus, it is divided into the following three components:
- Gas detection system: The actions of olfactory receptors are simulated by an array of sensors responding to a wide range of different odorants. When the sensors contact the odorous air to be analysed, they produce response signals.
- Sensor-signal-processing system: The information from the sensors is compressed, simulating the action of the human olfactory bulb.
- Odour recognition system: A sophisticated PR system identifies odours based on a previously stored dataset, simulating the processes that take place in the human brain.
-
Since the sensors are not specific, the electronic nose does not recognize the individual odour-generating compounds, but rather provides an olfactory signature (fingerprint) of the analysed air. To do this, the instrument must be trained.
-
E-nose training consists in the analysis of samples belonging to known odour classes: the sensor responses to these training samples constitute the "clusters" of the different odour classes that shall be discriminated.
-
The e-nose functioning relies on the principle of similarity: similar odours will produce similar sensor responses. Based on this principle, classification of an unknown sample is made by the instrument by comparing the sensor response produced by the unknown sample to the responses of the training sample. The unknown sample is then attributed to the training class to which it is most similar.
-
There are different mathematical methods that can be used for this purpose, belonging to the so called "multivariate statistical analysis".
-
The training phase is fundamental for the e-nose classification capability. If the different odour classes that constitute the training data set are well clustered, i.e. well separated from each other, this indicates a good capability of the instrument of discriminating the different odours, thus resulting in high classification accuracy.
-
Each e-nose sensor typically responds to volatile organic compounds with a variation in its resistance that produces a curve like the one shown in Fig. 1.
-
The set of curves produced by the sensors for all the analysed samples constitute the huge "raw" data from the electronic nose that need to be processed.
-
E-nose data processing consists of 2 fundamental steps:
- 1. Feature extraction and selection
- 2. Classification
-
Feature extraction and selection represents the set of operations that shall be carried out in order to extract from the sensor response curves the numerical data that can be further processed for classification.
-
The most typical feature that can be extracted from a curve like the one depicted in Fig. 1 is the resistance ratio between the resistance before flowing of the sample under analysis R0, and the plateau value of the resistance measured during the measurement R.
-
Other examples of features that can be extracted are (not exhaustive) (Blatt et al., 2007):
- The resistance change of sensor during measurement where R0 is the resistance value in reference conditions, while R is the resistance value over time.
- The ratio between the reference line and the minimum value of resistance reached during the measurement where R0 is the resistance value in reference conditions, while R(t) is the resistance value over time.
- The integral defined as where R0 is the resistance value in reference conditions, while R(t) is the resistance value over time.
- The closed area determined by the plot of the state graph of the measurement defined as where R(t) is the resistance value over time.
- The minimum value of resistance reached during the measurement where R(t) is the resistance value over time.
-
Since the number and type of features that can be extracted from the sensor response curves is almost unlimited, feature selection is required in order to consider those features that are effectively relevant for odour discrimination and classification. Different methods can be applied to carry out feature selection by optimization of the classification performances, such as filter and wrapper methods (Pardo et al., 2006, Nowotny et al., 2013, Fang et al., 2015).
-
After feature extraction and selection, the e-nose data (sensor response curves) are converted into numerical data that can be processed by suitable algorithms for classification purposes. As previously mentioned, classification of an unknown sample is carried out by evaluating its similarity with the data relevant to the odour classes defined during the instrument training. The unknown sample will be attributed to the class to which it is evaluated as "most similar".
-
The easiest type of classification algorithm is the "cut-off" method, which uses a "yes/no" logic to distinguish between 2 classes: if the features relevant to the unknown sample exceed a given reference value, then the sample is attributed to one class, otherwise to the other one. In another very common algorithm (k-Nearest Neighbour (k-NN)), which can be applied for classification between more odour classes, the similarity is evaluated as Euclidean distance between the vector consisting of the selected features relevant to the unknown sample and the same vectors relevant to the training data. The sample is attributed to the class to which the smallest distance is calculated.
-
Other common pattern recognition algorithms are, not limitedly (Gutierrez-Osuna, 2002, Aggio et al., 2016, Qui et al., 2015):
- Support Vector Machine (SVM)
- Discriminant Function Analysis (DFA)
- Partial Least Squares Interpretation (PLS)
- Artificial Neural Networks (ANN)
-
In one embodiment under any aspect of this invention, the comparison of step d) comprises the scoring of the data acquired in step c) against a cut-off value for each sensor.
-
In one embodiment under any aspect of this invention, the comparison of step d) consists in the scoring of the data acquired in step c) against a cut-off value for each sensor.
-
In one embodiment under the first aspect of this invention, the comparison of step d) comprises the scoring, obtained through multivariate statistical analysis, of the data acquired in step c) against data acquired from the analysis of urine samples of subjects that have been classified as prostate cancer free or affected by prostate cancer by other means.
-
In one embodiment under the first aspect of this invention, the comparison of step d) consists in the scoring, obtained through multivariate statistical analysis, of the data acquired in step c) against data acquired from the analysis of urine samples of subjects that have been classified as prostate cancer free or affected by prostate cancer by other means.
-
In one embodiment under the first aspect of this invention, the comparison of step d) comprises the scoring, obtained through application of a pattern recognition algorithm, of the data acquired in step c) against data acquired from the analysis of urine samples of subjects that have been classified as prostate cancer free or affected by prostate cancer by other means.
-
In one embodiment under the first aspect of this invention, the comparison of step d) consists in the scoring, obtained through application of a pattern recognition algorithm, of the data acquired in step c) against data acquired from the analysis of urine samples of subjects that have been classified as prostate cancer free or affected by prostate cancer by other means.
-
In one embodiment under the second aspect of this invention, the comparison of step d) comprises the scoring, obtained through multivariate statistical analysis, of the data acquired in step c) against data acquired from the analysis of urine samples of subjects that have been classified as prostate cancer free and/or affected by prostate cancer with a certain risk of being aggressive by other means.
-
In one embodiment under the second aspect of this invention, the comparison of step d) consists in the scoring, obtained through multivariate statistical analysis, of the data acquired in step c) against data acquired from the analysis of urine samples of subjects that have been classified as prostate cancer free and/or affected by prostate cancer with a certain risk of being aggressive by other means.
-
In one embodiment under the second aspect of this invention, the comparison of step d) comprises the scoring, obtained through application of a pattern recognition algorithm, of the data acquired in step c) against data acquired from the analysis of urine samples of subjects that have been classified as prostate cancer free and/or affected by prostate cancer with a certain risk of being aggressive by other means.
-
In one embodiment under the second aspect of this invention, the comparison of step d) consists in the scoring, obtained through application of a pattern recognition algorithm, of the data acquired in step c) against data acquired from the analysis of urine samples of subjects that have been classified as prostate cancer free and/or affected by prostate cancer with a certain risk of being aggressive by other means.
-
In a particular embodiment under any aspect of this invention, the pattern recognition algorithm is selected from the list of k-Nearest Neighbour, Support Vector Machine, Discriminant Function Analysis, Partial Least Squares Interpretation and Artificial Neural Networks.
-
The skilled man will know that sensors are subject to wear and tear, so that the reference values for each given sensor used may fluctuate with use, and may need be redetermined from time to time.
-
The doping a metal-oxide based sensor is a common practice in the field to achieve modulation of the sensitivity of that particular sensor towards a particular volatile compound/set of volatile compounds (Godavarti et al. (2019); Matsushima et al. (1988); Ruiz et al. (2003); Senguttuvan et al. (2007); Yamazoe, (1991); Zhang et al. (2019)).
-
In one embodiment under any aspect of this invention, the dopant of the first sensor is selected from the list consisting of no dopant, Mo, "MoO3, Pd, Ag, Cu, Al, Pb, Cr, and Pt.
-
In one embodiment under any aspect of this invention, the dopant of the second sensor is selected from the list consisting of no dopant Mo, "MoO3, Pd, Ag, Cu, Al, Pb, Cr, and Pt.
-
In one embodiment under any aspect of this invention, the dopant of the third sensor is selected from the list consisting of no dopant, Mo, "MoO3, Pd, Ag, Cu, Al, Pb, Cr, and Pt.
-
In one embodiment under any aspect of this invention, the metal oxide of the first gas sensor is pure SnO2.
-
In another embodiment under any aspect of this invention, the metal oxide of the first gas sensor is SnO2 doped with MoO3.
-
In another embodiment under any aspect of this invention, the metal oxide of the first gas sensor is SnO2 doped with Mo.
-
In another embodiment under any aspect of this invention, the metal oxide of the second gas sensor is pure ZnO.
-
In another embodiment under any aspect of this invention, step c) is performed limitedly with the three gas sensors.
-
In another embodiment under any aspect of this invention, the urine sample is collected with a catheter.
-
In another embodiment under any aspect of this invention, the urine sample is the first jet of a naturally voided urine sample.
-
In another embodiment under any aspect of this invention, the urine sample is the intermediate jet of a naturally voided urine sample.
-
In one embodiment under any aspect of this invention, the temperature of step b) is selected the list of above 50°C, above 51°C, above 52°C, above 53°C, above 54°C, above 55°C, above 56°C, above 57°C, above 58°C and above 59°C.
-
In another embodiment under any aspect of this invention, the temperature of step b) is selected from the list of about 51°C, about 52°C, about 53°C, about 54°C, about 55°C, about 56°C, about 57°C, about 58°C, about 59°C, about 60°C, about 61°C, about 62°C, about 63°C, about 64°C, about 65°C, about 66°C, about 67°C, about 68°C, about 69°C, about 70°C, about 71°C, about 72°C, about 73°C, about 74°C, about 75°C, about 76°C, about 77°C, about 78°C, about 79°C, about 80°C, about 81°C, about 82°C, about 83°C, about 84°C, about 85°C, about 86°C, about 87°C, about 88°C, about 89°C, about 90°C, about 91°C, about 92°C, about 93°C, about 94°C, about 95°C, about 96°C, about 97°C, about 98°C, about 99°C, about 100°C, about 101°C, about 102°C, about 103°C, about 104°C, about 105°C, about 106°C, about 107°C, about 108°C, about 109°C about 110°C, and ranges comprising any such values.
-
In another embodiment under any aspect of this invention, the temperature of step b) is selected from the list of 51°C, 52°C, 53°C, 54°C, 55°C, 56°C, 57°C, 58°C, 59°C, 60°C, 61°C, 62°C, 63°C, 64°C, 65°C, 66°C, 67°C, 68°C, 69°C, 70°C, 71°C, 72°C, 73°C, 74°C, 75°C, 76°C, 77°C, 78°C, 79°C, 80°C, 81°C, 82°C, 83°C, 84°C, 85°C, 86°C, 87°C, 88°C, 89°C, 90°C, 91°C, 92°C, 93°C, 94°C, 95°C, 96°C, 97°C, 98°C, 99°C, 100°C, 101°C, 102°C, 103°C, 104°C, 105°C, 106°C, 107°C, 108°C, 109°C, 110°C, and ranges comprising any such values.
-
In another embodiment under any aspect of this invention, the temperature of step b) is selected from the list of below 61°C, below 62°C, below 63°C, below 64°C, below 65°C, below 66°C, below 67°C, below 68°C, below 69°C, below 70°C, below 71°C, below 72°C, below 73°C, below 74°C, below 75°C, below 76°C, below 77°C, below 78°C, below 79°C, below 80°C, below 81°C, below 82°C, below 83°C, below 84°C, below 85°C, below 86°C, below 87°C, below 88°C, below 89°C, below 90°C, below 91°C, below 92°C, below 93°C, below 94°C, below 95°C, below 96°C, below 97°C, below 98°C, below 99°C and below 100°C.
-
The skilled man in the art will able to determine by trial and error method and without any undue burden the length of time needed to create the optimal headspace at any given temperature and humidity. In one embodiment under any aspect of this invention, the humidity-controlled environment is set at a value selected from the list of 10% RH- 90% RH, any integer value falling within this range, and ranges comprising any of these integer values.
-
The skilled man will also, based on his own or other's experience and know-how, select the recipient in which to create the headspace.
-
All embodiments may be combined.
EXAMPLES
-
The invention is now described by means of non-limiting examples.
Materials & Methods
SAMPLES COLLECTION
-
Urine samples of 246 subjects (69 healthy (H) and 177 affected by prostate cancer (PC)) were collected with informed consent at the Humanitas Hospital of Castellanza (Varese) or at the Humanitas Hospital of Rozzano (Milano). Prostate cancer patient's samples were collected before biopsy, radical prostatectomy or transurethral resection of the prostate. Healthy subjects consisted of a mixture of pre-menstrual young women, young women (20-35 years of age), young (<28 years old) and middle aged (up to 50 years old) men without familial history of prostate cancer and with PSA < 1 ng/ml and negative Digital Rectal Examination, as well as patients affected with ureteropelvic junction syndrome or benign prostatic hyperplasia.
-
The risk of aggressiveness of the 177 prostate cancer patients was set out against the criteria of Table 1 below
Table 1 | Risk of aggressiveness |
| Low | Intermediate | High |
| GS=3+3 and TNM pT1-2 | GS=3+4 and TNM pT2 | GS>3+4 or TNM pT3-4 |
-
These patients can also be seen to form two groups:
- Group A: intermediate or high risk (159 patients)
- Group B: low risk (18 patients)
-
Each PC subject furnished 4 samples: one taken via catheter, and three samples from a naturally voided urine (first jet, intermediate jet and last jet respectively), whereas Healthy (H) subjects only furnished the naturally voided urine samples.
-
Samples were collected in sterile containers commonly used for urine analysis and frozen immediately after collection at -20°C until analysis.
SAMPLE PREPRATION
-
In a typical procedure, prior to being analysed, each urine sample was thawed in a water bath at 37-40°C until completely liquid, transferred to a beaker sealed to a Nalophan™ bag equipped with a Teflon tube (Fig. 2) and kept in a climatic chamber at 60°C/60% RH for 1.5 hours, so as to create the headspace in the Nalophan™ bag for analysis with the electronic nose. The Nalophan™ bag was then separated from the beaker, sealed and the headspace so created kept at 60°C / 20% RH for 2.5h, before being flown into the electronic nose via the Teflon tube.
HEADSPACE ANALYSIS
-
The headspaces were subjected to analysis with a SACMI EOS507c electronic nose, equipped with 5 MOS-based sensors, which metal oxides are the following:
- SnO2 doped with cat Mo
- SnO2 doped with MoO3
- Pure SnO2
- Pure ZnO
- SnO2+ TiO2+ Nb2O5.
STATISTICAL ANALYSIS
-
With regard to the diagnostic test in the examples below, the number of true positives (TP), true negatives (TN), false positives (FP) and false negatives (FN) affect the specificity, sensitivity and accuracy of the test as per the equations below, where CI 95% represents the relative confidence interval:
-
With regard to assessing whether a prostate cancer patient belongs to Group A or Group B as defined above, and in example 2 below the fitness of the method is determined by how the number of
- True Positives belonging to group A (TpA),
- True Positives belonging to group B (TpB)
- True positives belonging to the Healthy group (TpH)
- Group A patients that are classified as Healthy (eAH)
- Group B patients that are classified as Healthy (eBH)
- Group A patients that are classified as Group B patients (eAB)
- Group B patients that are classified as Group A patients (eBA)
- Healthy subjects that are classified as Group A patients (eHA)
- Healthy subjects that are classified as Group B patients (eHB)
affect the recall values and the accuracy as set out in the equations below
-
With regard to assessing whether a prostate cancer patient is at high risk or intermediate risk of being affected by an aggressive form of prostate cancer in example 4 below, the fitness of the method is determined by how the number of
- True Positives belonging to group GS 3+4 (TpMedium)
- True positives belonging to group GS 4 (TpHigh)
- Group GS 3+4 patients that are classified as group GS 4 (eMedium;High)
- Group GS 4 subjects that are classified as group GS 3+4 (eHigh;Medium)
affect the recall values and the accuracy as set out in the equations below
Example 1: Assessing risk of being affected by prostate cancer with cut-off value.
-
The first jet samples of the 246 subjects described above were subjected to the analysis as described in the material and methods section above.
-
Table 2 reports the accuracy, sensitivity and specificity of the test, depending on the number of sensors used and the method used to assign a subject as healthy (H) or affected by prostate cancer (PC). Entries 12 and 13 represent the values obtained by using the method of the invention.
-
Similar results are obtained by analysing either the intermediate jet of a naturally voided urine sample or samples taken with a catheter.
Table 2 | Entry | N. of sensors | Sensors used | Method | H vs PC |
| Accuracy | Sensitivity | Specificity |
| 1 | 1 | SnO2 doped with Mo | If R0/R ≤2.5: H; if R0/R >2.5 :PC | 38% | 15% | 97% |
| 2 | 1 | SnO2 doped with MoO3 | If R0/R ≤2.5: H; if R0/R >2.5 :PC | 33% | 7% | 99% |
| 3 | 1 | Pure SnO2 | If R0/R ≤2.5: H; if R0/R >2.5 :PC | 36% | 13% | 97% |
| 4 | 1 | Pure ZnO | If R0/R ≤2.5: H; if R0/R >2.5 PC | 58% | 39% | 97% |
| 5 | 1 | SnO2+ TiO2+ Nb2O5 | If R0/R ≤2.5: H; if R0/R >2.5 :PC | 59% | 50% | 84% |
| 6 | 3 | SnO2 doped with Mo | If all R0/R ≤2.5: H; if at least one R0/R >2.5: PC | 41% | 21% | 94% |
| SnO2 doped with MoO3 |
| Pure SnO2 |
| 7 | 2 | SnO2 doped with Mo | If all R0/R ≤2.5: H; if at least one R0/R >2.5: PC | 63% | 51% | 93% |
| Pure ZnO |
| 8 | 4 | SnO2 doped with Mo | If all R0/R ≤2.5: H; if at least one R0/R >2.5: PC | 63% | 53% | 91% |
| SnO2 doped with MoO3 |
| Pure SnO2 |
| Pure ZnO |
| 9 | 2 | SnO2 doped with Mo | If all R0/R ≤2.5: H; if at least one R0/R >2.5: PC | 66% | 59% | 83% |
| SnO2+ TiO2+ Nb2O5 |
| 10 | 4 | SnO2 doped with Mo | If all R0/R ≤2.5: H; if at least one R0/R >2.5: PC | 67% | 62% | 83% |
| SnO2 doped with MoO3 |
| Pure SnO2 |
| SnO2+ TiO2+ Nb2O5 |
| 11 | 2 | Pure ZnO | If all R0/R ≤2.5: H; if at least one R0/R >2.5: PC | 71% | 66% | 84% |
| SnO2+ TiO2+ Nb2O5 |
| 12 | 3 | Pure ZnO | If all R0/R ≤2.5: H; if at least one R0/R >2.5: PC | 76% | 73% | 84% |
| SnO2 doped with Mo SnO2+ TiO2+ Nb2O5 |
| 13 | 5 | Pure ZnO | If all R0/R ≤2.5: H; if at least one R0/R >2.5: PC | 79% | 78% | 83% |
| SnO2 doped with Mo |
| SnO2 doped with MoO3 |
| Pure SnO2 |
| SnO2+ TiO2+Nb2O5 |
Example 2: Assessing risk of aggressiveness with a cut-off value
-
The first jet samples of the 246 subjects described above were subjected to the risk of aggressiveness analysis as described in the materials and methods above. Table 3 reports the recall values and accuracy of various methods which differ by the number and types of sensor used in the analysis, and where subjects were classified as healthy or affected by prostate cancer using the corresponding method of example 1. Entries 12 and 13 represent the values obtained with the method of the invention.
-
Similar results are obtained by analysing either the intermediate jet of a naturally voided urine sample or samples taken with a catheter.
Example 3: Assessing risk of being affected by prostate cancer using various pattern recognition algorithms
-
Data relevant to a subset of the 246 patients (11 Healthy, 17 affected by prostate cancer) were processed by extracting the following features (F), with reference to Fig. 1 for the R0, R and RA values:
- Resistance Ratio R0/R
- Delta After δ= RA-R (where RA is the resistance value recorded at the end of the measurement, see Fig. 1)
- Single point is the minimum value of resistance reached during the measurement S = min(R(t)) where R(t) is the resistance value over time.
-
These data were acquired using the following set of sensors:
- Pure ZnO
- SnO2 doped with Mo
- SnO2 doped with MoO3
- Pure SnO2
- SnO2+ TiO2+ Nb2O5
-
The datasets obtained from sample analysis after feature extraction were processed by Principal Component Analysis (PCA, Borgognone et al., 2001) to visualize discrimination between healthy subjects and patients affected by prostate cancer.
-
As an example, Fig. 3 reports the PCA score plot obtained considering different features extracted from the sensors response curve. Different odour classes, i.e. healthy subjects and patients affected by prostate cancers clearly form clusters in different areas of the plot.
-
As a second step, different classification algorithms (A) were applied in order to perform classification on the training datasets. As an example, the different training sets were processed by Support Vector Machine (SVM) and Linear Discriminant Analysis (LDA) to evaluate test performances. Results obtained for accuracy, sensitivity and specificity as defined in the materials and methods above are reported in Table 4.
Table 4 | | Diagnosis performance |
| Feature and classification algorithm considered | Accuracy | Specificity | Sensitivity |
| Resistance ratio (F) + Cut-off method (A) | 96.4% | 90.9% | 100.0% |
| Resistance ratio (F) + SVM (A) | 89.3% | 90.9% | 88.2% |
| Resistance ratio (F) + LDA (A) | 82.1% | 100.0% | 70.6% |
| DeltaAfter (F) + SVM (A) | 82.1% | 72.7% | 88.2% |
| DeltaAfter (F) + LDA (A) | 85.7% | 90.9% | 82.4% |
| Single point (F) + SVM (A) | 75.0% | 72.7% | 76.5% |
| Single point (F) + LDA (A) | 78.6% | 72.7% | 82.4% |
-
Although the cut-off method provides the best results in terms of accuracy and sensitivity, also other classification techniques proved to be capable of providing acceptable results for prostate cancer diagnosis.
Example 4: Discrimination between high and medium risk of aggressiveness
-
Data relevant to a subset of the 246 patients, including only patients affected by prostate cancer (20 patients), classified according to table 1 as being at high or intermediate risk, were processed considering the following feature:
- Resistance Ratio R0/R where R0 is the resistance value at the beginning of the e-nose analysis and R is the minimum resistance value recorded during the analysis of the urine headspace.
-
These data were acquired using the following set of sensors:
- Pure ZnO
- SnO2 doped with Mo
- SnO2 doped with MoO3
- Pure SnO2
- SnO2+ TiO2+ Nb2O5
-
Fig. 4 reports the PCA score plot obtained considering the resistance ratios of the sensors as feature. The analysed samples cluster in different regions of the graph according to the Gleason Score values: Samples with a GS 3+4 cluster in the left part of the graph, whereas those with higher GS are prevailingly in the right part of it.
-
For the second step (classification), an SVM algorithm was applied. Thus, the data processing combination applied in this case is: resistance ratio (F) + SVM (A).
-
The confusion matrix relevant to the classification operated by the e-nose with this combination of feature and classification algorithm and the corresponding values of accuracy and recall are reported in Tables 5 and 6, respectively.
Table 5 | | GS real |
| 3+4 | 4 |
| E-nose Output | 3+4 | 6 | 1 |
| 4 | 2 | 11 |
Table 6 | | Risk assessment |
| Feature and classification algorithm considered | Accuracy | Recall GS | 3+4 | Recall GS 4 |
| Resistance ratio (F) + SVM (A) | 85 | 75 | 91.7 |
Example 5: Effect of temperature
-
Tables 7 and 8 below, report the statistical values obtained when the methods of diagnosis (table 7) or prognosis (table 8) of the invention (entries 13 of examples 1 and 2) compared to those obtained when the sample is kept at 50°C rather than 60°C.
-
The data at 50°C was acquired on a subset of the 246 patients (19 Healthy, 29 group A patients, 6 group B patients)
Table 7 | Healthy H vs PC | 50°C | 60°C |
| Accuracy | 74% | 79% |
| Sensitivity | 69% | 78% |
| Specificity | 84% | 83% |
Table 8 | Staging PCa | 50°C | 60°C |
| Accuracy | 56% | 73% |
| Recall PC Group A | 28% | 69% |
| Recall PC Group B | 100% | 73% |
| Recall Healthy | 84% | 83% |
Example 6: Effect of humidity control
-
Table 9 below reports the statistical values obtained when using the sensors of entry 13 of example 1, where the urine headspace enrichment and the analysis with the electronic nose is carried out under humidity control as per method of the invention, compared to those obtained when the urine headspace after the enrichment is analysed in the same conditions but without any humidity control.
-
Samples considered for this evaluation constitute a subset of the 246 patients (5 healthy, 5 group A patients). Using this subset, with the sensors of entry 13 of example 1, the cut off values are as follows:
- Pure ZnO: 2.5
- SnO2 doped with Mo: 2.5
- SnO2 doped with MoO3: 2.5
- Pure SnO2: 2.5
- SnO2+ TiO2+ Nb2O5:4.1
Table 9 | Healthy H vs PC | Without humidity control | With humidity control |
| Accuracy | 30% | 100% |
| Sensitivity | 60% | 100% |
| Specificity |
| | 0% | 100% |
REFERENCES
-
-
Aggio et al., (2016), J Breath Res.;10(1):017106. doi: 10.1088/1752-7155/10/1/017106
- Anastasiadis et al. Expert Rev Anticancer Ther 2013; 13: 829.
-
Asimakopoulos et al. (2014), Prostate Cancer Prostatic Dis. 2014 Jun;17(2):206-11. doi: 10.1038/pcan.2014.11
-
Bernabei et al. (2008), Sensors and Actuators B: Chemical Volume 131,
-
Blatt et al. (2007), Lung cancer identification by an electronic nose based on an array of MOS sensors. 2007 International Joint Conference on Neural Networks, Orlando, FL, pp.1423-1428
- Borgognone et al. (2001), Food Quality and Preference, 2, 323-326.
-
Capelli et al. (2016), Sensors (Basel). 2016; 16(10): 1708
-
D'Amico et al. (2012a), Expert Opin Med Diagn. 2012 May;6(3):175-85. doi: 10.1517/17530059.2012.665870
-
D'Amico et al. (2012b),Procedia Engineering , Volume 47, 2012, Pages 1113-1116
- Fang et al. (2015), Biomedical Signal Processing and Control, Volume 21, 2015, Pages 82-89.
- Godavarti et al. (2019). Physica B: Condensed Matter 553: 151-160.
- Gutierrez-Osuna (2002), Pattern analysis for machine olfaction: a review. IEEE Sensors Journal, 2,189-202.
-
James et al., 2005, Microchimica Acta, vol 149, pages 1-17
- Kryvenko et al. (2016), The Journal of Urology. 2016; 196(6):1659-1663.
-
Lee at al. (2017), The Journal of Urology. 2017; 198(6):1230-1240
-
Loutfi et al., 2015, Journal of Food Engineering, vol 144, pages 103-111
- Matsushima et al. (1988) Japanese Journal of Applied Physics 27(.
- Nowotny et al.(2013), Sensors and Actuators B: Chemical, 187, 471-480.
-
Pardo et al. (2006), Sensors and Actuators B, 123, 437-443
- Presti et al.(2008), Nat Clin Pract Urol 5: 246.
- Qui et al.(2015), Journal of food engineering, 144, 77-85.
-
Roine at al. (2012), Future Oncol. 2012 Sep;8(9):1157-65. doi: 10.2217/fon.12.93
-
Ruiz, A. M., et al. (2003). Sensors and Actuators B:Chemical 93(1): 509-518
-
Santonico et al. (2014), Procedia Engineering , Volume 87, 2014, Pages 320-323
-
Senguttuvan, T. D., et al. (2007), Materials Letters 61(2): 582-584
- Siegel et al. (2017), CA: A Cancer Journal for Clinicians. 2017; 67(1): 7-30.
-
Smith et al. (2008), J Breath Res. 2008 Sep;2(3):037022. doi: 10.1088/1752-7155/2/3/03702
-
Taverna et al. (2015) The Journal of Urology. 2015; 193(4): 1382-1387
- Taverna et al. (2016), Clin Chem Lab Med. 2016; 54(3):e67-70.
- Wilson and Baietto, 2009, Sensors, 9(7), pp.5099-5148.
-
Wilson and Baietto, 2011,Sensors, 11(1), pp.1105-1176
-
Yamazoe, N. (1991) Sensors and Actuators B:Chemical 5(1): 7-19
-
Zhang, Y., et al. (2019) Journal of Colloid and Interface Science 536: 215-223