EP3704274B1 - Genetische regulierung der immunreaktion durch chromosomen-wechselwirkungen - Google Patents
Genetische regulierung der immunreaktion durch chromosomen-wechselwirkungen Download PDFInfo
- Publication number
- EP3704274B1 EP3704274B1 EP18815789.5A EP18815789A EP3704274B1 EP 3704274 B1 EP3704274 B1 EP 3704274B1 EP 18815789 A EP18815789 A EP 18815789A EP 3704274 B1 EP3704274 B1 EP 3704274B1
- Authority
- EP
- European Patent Office
- Prior art keywords
- responder
- chromosome
- probe
- sequence
- interactions
- Prior art date
- Legal status (The legal status is an assumption and is not a legal conclusion. Google has not performed a legal analysis and makes no representation as to the accuracy of the status listed.)
- Active
Links
- 230000003993 interaction Effects 0.000 title claims description 141
- 210000000349 chromosome Anatomy 0.000 title claims description 137
- 230000004034 genetic regulation Effects 0.000 title 1
- 239000000523 sample Substances 0.000 claims description 118
- 150000007523 nucleic acids Chemical class 0.000 claims description 117
- 102000039446 nucleic acids Human genes 0.000 claims description 102
- 108020004707 nucleic acids Proteins 0.000 claims description 102
- 238000000034 method Methods 0.000 claims description 58
- 230000008569 process Effects 0.000 claims description 34
- 108020004414 DNA Proteins 0.000 claims description 32
- 238000002560 therapeutic procedure Methods 0.000 claims description 32
- 238000011282 treatment Methods 0.000 claims description 24
- 238000001514 detection method Methods 0.000 claims description 13
- 239000002773 nucleotide Substances 0.000 claims description 13
- 125000003729 nucleotide group Chemical group 0.000 claims description 13
- 230000000295 complement effect Effects 0.000 claims description 9
- 238000006243 chemical reaction Methods 0.000 claims description 8
- 108091034117 Oligonucleotide Proteins 0.000 claims description 7
- 108091028043 Nucleic acid sequence Proteins 0.000 claims description 5
- MPLHNVLQVRSVEE-UHFFFAOYSA-N texas red Chemical compound [O-]S(=O)(=O)C1=CC(S(Cl)(=O)=O)=CC=C1C(C1=CC=2CCCN3CCCC(C=23)=C1O1)=C2C1=C(CCC1)C3=[N+]1CCCC3=C2 MPLHNVLQVRSVEE-UHFFFAOYSA-N 0.000 claims description 4
- 238000003753 real-time PCR Methods 0.000 claims 2
- 238000011895 specific detection Methods 0.000 claims 1
- 102100024216 Programmed cell death 1 ligand 1 Human genes 0.000 description 384
- 108010074708 B7-H1 Antigen Proteins 0.000 description 380
- 108090000623 proteins and genes Proteins 0.000 description 79
- 238000003752 polymerase chain reaction Methods 0.000 description 37
- 101000679903 Homo sapiens Tumor necrosis factor receptor superfamily member 25 Proteins 0.000 description 36
- 102100022203 Tumor necrosis factor receptor superfamily member 25 Human genes 0.000 description 36
- 230000001973 epigenetic effect Effects 0.000 description 33
- 230000004044 response Effects 0.000 description 31
- 108060006678 I-kappa-B kinase Proteins 0.000 description 28
- 102000001284 I-kappa-B kinase Human genes 0.000 description 28
- 239000003550 marker Substances 0.000 description 28
- 102100040678 Programmed cell death protein 1 Human genes 0.000 description 23
- 101100478715 Drosophila melanogaster Start1 gene Proteins 0.000 description 22
- 101001050320 Homo sapiens Junctional adhesion molecule B Proteins 0.000 description 22
- 102100023430 Junctional adhesion molecule B Human genes 0.000 description 22
- 230000002759 chromosomal effect Effects 0.000 description 21
- 239000012634 fragment Substances 0.000 description 21
- 239000000090 biomarker Substances 0.000 description 20
- 229940121358 tyrosine kinase inhibitor Drugs 0.000 description 19
- 101001120056 Homo sapiens Phosphatidylinositol 3-kinase regulatory subunit alpha Proteins 0.000 description 17
- 206010028980 Neoplasm Diseases 0.000 description 17
- 102100026169 Phosphatidylinositol 3-kinase regulatory subunit alpha Human genes 0.000 description 17
- 208000002154 non-small cell lung carcinoma Diseases 0.000 description 16
- 102100036952 Cytoplasmic protein NCK2 Human genes 0.000 description 14
- 101001024712 Homo sapiens Cytoplasmic protein NCK2 Proteins 0.000 description 14
- 101001034652 Homo sapiens Insulin-like growth factor 1 receptor Proteins 0.000 description 14
- 101000738769 Homo sapiens Receptor-type tyrosine-protein phosphatase alpha Proteins 0.000 description 14
- 102100039688 Insulin-like growth factor 1 receptor Human genes 0.000 description 14
- 108060005251 Nectin Proteins 0.000 description 14
- 102000002356 Nectin Human genes 0.000 description 14
- 102100037405 Receptor-type tyrosine-protein phosphatase alpha Human genes 0.000 description 14
- 230000002068 genetic effect Effects 0.000 description 14
- 101000598002 Homo sapiens Interferon regulatory factor 1 Proteins 0.000 description 13
- 102100036981 Interferon regulatory factor 1 Human genes 0.000 description 13
- 101710089372 Programmed cell death protein 1 Proteins 0.000 description 13
- 102000004398 TNF receptor-associated factor 1 Human genes 0.000 description 13
- 108090000920 TNF receptor-associated factor 1 Proteins 0.000 description 13
- 201000001441 melanoma Diseases 0.000 description 13
- 102100035273 E3 ubiquitin-protein ligase CBL-B Human genes 0.000 description 12
- 102100036242 HLA class II histocompatibility antigen, DQ alpha 2 chain Human genes 0.000 description 12
- 102100036241 HLA class II histocompatibility antigen, DQ beta 1 chain Human genes 0.000 description 12
- 108010086786 HLA-DQA1 antigen Proteins 0.000 description 12
- 108010065026 HLA-DQB1 antigen Proteins 0.000 description 12
- 101000737265 Homo sapiens E3 ubiquitin-protein ligase CBL-B Proteins 0.000 description 12
- 101000692259 Homo sapiens Phosphoprotein associated with glycosphingolipid-enriched microdomains 1 Proteins 0.000 description 12
- 101000863873 Homo sapiens Tyrosine-protein phosphatase non-receptor type substrate 1 Proteins 0.000 description 12
- 102100026066 Phosphoprotein associated with glycosphingolipid-enriched microdomains 1 Human genes 0.000 description 12
- 101000987219 Sus scrofa Pregnancy-associated glycoprotein 1 Proteins 0.000 description 12
- 102100029948 Tyrosine-protein phosphatase non-receptor type substrate 1 Human genes 0.000 description 12
- 101000979042 Arabidopsis thaliana Uncharacterized mitochondrial protein AtMg00660 Proteins 0.000 description 11
- 101000896919 Porphyra purpurea Chromophore lyase CpcS/CpeS homolog Proteins 0.000 description 11
- 238000004458 analytical method Methods 0.000 description 11
- 101000611936 Homo sapiens Programmed cell death protein 1 Proteins 0.000 description 10
- 101000738771 Homo sapiens Receptor-type tyrosine-protein phosphatase C Proteins 0.000 description 10
- 102100037422 Receptor-type tyrosine-protein phosphatase C Human genes 0.000 description 10
- 102100021573 Bcl-2-binding component 3, isoforms 3/4 Human genes 0.000 description 9
- 102100023701 C-C motif chemokine 18 Human genes 0.000 description 9
- 102100025277 C-X-C motif chemokine 13 Human genes 0.000 description 9
- 108010017009 CD11b Antigen Proteins 0.000 description 9
- 101000971203 Homo sapiens Bcl-2-binding component 3, isoforms 1/2 Proteins 0.000 description 9
- 101000971209 Homo sapiens Bcl-2-binding component 3, isoforms 3/4 Proteins 0.000 description 9
- 101000978371 Homo sapiens C-C motif chemokine 18 Proteins 0.000 description 9
- 101000858064 Homo sapiens C-X-C motif chemokine 13 Proteins 0.000 description 9
- 101000628949 Homo sapiens Mitogen-activated protein kinase 10 Proteins 0.000 description 9
- 101000946889 Homo sapiens Monocyte differentiation antigen CD14 Proteins 0.000 description 9
- 101000998194 Homo sapiens NF-kappa-B inhibitor epsilon Proteins 0.000 description 9
- 101000779418 Homo sapiens RAC-alpha serine/threonine-protein kinase Proteins 0.000 description 9
- 102100022338 Integrin alpha-M Human genes 0.000 description 9
- 102100026931 Mitogen-activated protein kinase 10 Human genes 0.000 description 9
- 102100035877 Monocyte differentiation antigen CD14 Human genes 0.000 description 9
- 102100033104 NF-kappa-B inhibitor epsilon Human genes 0.000 description 9
- 108010015499 Protein Kinase C-theta Proteins 0.000 description 9
- 102100021566 Protein kinase C theta type Human genes 0.000 description 9
- 101000808077 Pseudomonas phage Pf1 Uncharacterized protein ORF430 Proteins 0.000 description 9
- 101000808078 Pseudomonas phage Pf3 Putative assembly protein ORF430 Proteins 0.000 description 9
- 102100033810 RAC-alpha serine/threonine-protein kinase Human genes 0.000 description 9
- 238000003491 array Methods 0.000 description 9
- 230000037361 pathway Effects 0.000 description 9
- 101001046668 Homo sapiens Integrin alpha-X Proteins 0.000 description 8
- 101000917824 Homo sapiens Low affinity immunoglobulin gamma Fc region receptor II-b Proteins 0.000 description 8
- 101001087416 Homo sapiens Tyrosine-protein phosphatase non-receptor type 11 Proteins 0.000 description 8
- 102100022297 Integrin alpha-X Human genes 0.000 description 8
- 102100029205 Low affinity immunoglobulin gamma Fc region receptor II-b Human genes 0.000 description 8
- 101000788538 Marchantia polymorpha Uncharacterized mitochondrial protein ymf23 Proteins 0.000 description 8
- 108010029031 Regulatory-Associated Protein of mTOR Proteins 0.000 description 8
- 102100040969 Regulatory-associated protein of mTOR Human genes 0.000 description 8
- 101000792566 Saccharum officinarum Putative uncharacterized protein ycf15 Proteins 0.000 description 8
- 101000736243 Trieres chinensis Uncharacterized protein ycf66 Proteins 0.000 description 8
- 102100033019 Tyrosine-protein phosphatase non-receptor type 11 Human genes 0.000 description 8
- 210000004369 blood Anatomy 0.000 description 8
- 239000008280 blood Substances 0.000 description 8
- 210000004027 cell Anatomy 0.000 description 8
- 201000010099 disease Diseases 0.000 description 8
- 208000037265 diseases, disorders, signs and symptoms Diseases 0.000 description 8
- 238000009396 hybridization Methods 0.000 description 8
- 229960002621 pembrolizumab Drugs 0.000 description 8
- 238000012545 processing Methods 0.000 description 8
- 238000012216 screening Methods 0.000 description 8
- 101100214875 Autographa californica nuclear polyhedrosis virus p95 gene Proteins 0.000 description 7
- 102100027217 CD82 antigen Human genes 0.000 description 7
- 101000914469 Homo sapiens CD82 antigen Proteins 0.000 description 7
- 101000927796 Homo sapiens Rho guanine nucleotide exchange factor 7 Proteins 0.000 description 7
- 101150004576 ORF83 gene Proteins 0.000 description 7
- 101100317123 Orgyia pseudotsugata multicapsid polyhedrosis virus GP41 gene Proteins 0.000 description 7
- 102100033200 Rho guanine nucleotide exchange factor 7 Human genes 0.000 description 7
- 201000011510 cancer Diseases 0.000 description 7
- 238000005516 engineering process Methods 0.000 description 7
- 230000019491 signal transduction Effects 0.000 description 7
- 238000012360 testing method Methods 0.000 description 7
- 102100037263 3-phosphoinositide-dependent protein kinase 1 Human genes 0.000 description 6
- 101100486454 Acidianus bottle-shaped virus (isolate Italy/Pozzuoli) ORF243 gene Proteins 0.000 description 6
- 102100035634 B-cell linker protein Human genes 0.000 description 6
- 102100039498 Cytotoxic T-lymphocyte protein 4 Human genes 0.000 description 6
- 101000600756 Homo sapiens 3-phosphoinositide-dependent protein kinase 1 Proteins 0.000 description 6
- 101000803266 Homo sapiens B-cell linker protein Proteins 0.000 description 6
- 101001076292 Homo sapiens Insulin-like growth factor II Proteins 0.000 description 6
- 101001011382 Homo sapiens Interferon regulatory factor 3 Proteins 0.000 description 6
- 101001005550 Homo sapiens Mitogen-activated protein kinase kinase kinase 14 Proteins 0.000 description 6
- 101001090546 Homo sapiens Proline-rich protein 5 Proteins 0.000 description 6
- 101000652747 Homo sapiens Target of rapamycin complex 2 subunit MAPKAP1 Proteins 0.000 description 6
- 101000638255 Homo sapiens Tumor necrosis factor ligand superfamily member 8 Proteins 0.000 description 6
- 101000801227 Homo sapiens Tumor necrosis factor receptor superfamily member 19 Proteins 0.000 description 6
- 102100025947 Insulin-like growth factor II Human genes 0.000 description 6
- 102100029843 Interferon regulatory factor 3 Human genes 0.000 description 6
- 108010074328 Interferon-gamma Proteins 0.000 description 6
- 102000008070 Interferon-gamma Human genes 0.000 description 6
- 206010058467 Lung neoplasm malignant Diseases 0.000 description 6
- 102100025211 Mitogen-activated protein kinase kinase kinase 14 Human genes 0.000 description 6
- 102100034733 Proline-rich protein 5 Human genes 0.000 description 6
- 108010038036 Receptor Activator of Nuclear Factor-kappa B Proteins 0.000 description 6
- 101150063267 STAT5B gene Proteins 0.000 description 6
- 102100024474 Signal transducer and activator of transcription 5B Human genes 0.000 description 6
- 102100030904 Target of rapamycin complex 2 subunit MAPKAP1 Human genes 0.000 description 6
- 102100032100 Tumor necrosis factor ligand superfamily member 8 Human genes 0.000 description 6
- 102100028787 Tumor necrosis factor receptor superfamily member 11A Human genes 0.000 description 6
- 102100033760 Tumor necrosis factor receptor superfamily member 19 Human genes 0.000 description 6
- 238000004422 calculation algorithm Methods 0.000 description 6
- 238000013461 design Methods 0.000 description 6
- 229950009791 durvalumab Drugs 0.000 description 6
- 229960003130 interferon gamma Drugs 0.000 description 6
- 229960005386 ipilimumab Drugs 0.000 description 6
- 201000005202 lung cancer Diseases 0.000 description 6
- 208000020816 lung neoplasm Diseases 0.000 description 6
- 102000004169 proteins and genes Human genes 0.000 description 6
- 108091008146 restriction endonucleases Proteins 0.000 description 6
- 150000003384 small molecules Chemical class 0.000 description 6
- 238000011144 upstream manufacturing Methods 0.000 description 6
- CDKIEBFIMCSCBB-UHFFFAOYSA-N 1-(6,7-dimethoxy-3,4-dihydro-1h-isoquinolin-2-yl)-3-(1-methyl-2-phenylpyrrolo[2,3-b]pyridin-3-yl)prop-2-en-1-one;hydrochloride Chemical compound Cl.C1C=2C=C(OC)C(OC)=CC=2CCN1C(=O)C=CC(C1=CC=CN=C1N1C)=C1C1=CC=CC=C1 CDKIEBFIMCSCBB-UHFFFAOYSA-N 0.000 description 5
- 102100025074 C-C chemokine receptor-like 2 Human genes 0.000 description 5
- 108010009392 Cyclin-Dependent Kinase Inhibitor p16 Proteins 0.000 description 5
- 102100024458 Cyclin-dependent kinase inhibitor 2A Human genes 0.000 description 5
- 102100038713 Death domain-containing protein CRADD Human genes 0.000 description 5
- 108010050568 HLA-DM antigens Proteins 0.000 description 5
- 101000716068 Homo sapiens C-C chemokine receptor type 6 Proteins 0.000 description 5
- 101000957914 Homo sapiens Death domain-containing protein CRADD Proteins 0.000 description 5
- 101001019455 Homo sapiens ICOS ligand Proteins 0.000 description 5
- 101000979342 Homo sapiens Nuclear factor NF-kappa-B p105 subunit Proteins 0.000 description 5
- 101000934346 Homo sapiens T-cell surface antigen CD2 Proteins 0.000 description 5
- 101000617285 Homo sapiens Tyrosine-protein phosphatase non-receptor type 6 Proteins 0.000 description 5
- 102100034980 ICOS ligand Human genes 0.000 description 5
- 102100025748 Mothers against decapentaplegic homolog 3 Human genes 0.000 description 5
- 101710143111 Mothers against decapentaplegic homolog 3 Proteins 0.000 description 5
- 101150097381 Mtor gene Proteins 0.000 description 5
- 102100023050 Nuclear factor NF-kappa-B p105 subunit Human genes 0.000 description 5
- 101700056750 PAK1 Proteins 0.000 description 5
- 102100031206 Serine/threonine-protein kinase N1 Human genes 0.000 description 5
- 102100023085 Serine/threonine-protein kinase mTOR Human genes 0.000 description 5
- 101000768322 Synechococcus sp. (strain WH8020) Uncharacterized 16.1 kDa protein in cpeY 3'region Proteins 0.000 description 5
- 102100025237 T-cell surface antigen CD2 Human genes 0.000 description 5
- 108010091356 Tumor Protein p73 Proteins 0.000 description 5
- 102100030018 Tumor protein p73 Human genes 0.000 description 5
- 102100021657 Tyrosine-protein phosphatase non-receptor type 6 Human genes 0.000 description 5
- 238000003556 assay Methods 0.000 description 5
- 230000008901 benefit Effects 0.000 description 5
- 230000008859 change Effects 0.000 description 5
- 238000002648 combination therapy Methods 0.000 description 5
- 239000003814 drug Substances 0.000 description 5
- 230000014509 gene expression Effects 0.000 description 5
- 230000036210 malignancy Effects 0.000 description 5
- 238000002493 microarray Methods 0.000 description 5
- 229960003301 nivolumab Drugs 0.000 description 5
- 230000001105 regulatory effect Effects 0.000 description 5
- 210000001519 tissue Anatomy 0.000 description 5
- 238000013519 translation Methods 0.000 description 5
- 208000029729 tumor suppressor gene on chromosome 11 Diseases 0.000 description 5
- 238000010200 validation analysis Methods 0.000 description 5
- 101000979022 Arabidopsis thaliana Uncharacterized mitochondrial cytochrome b-like protein AtMg00590 Proteins 0.000 description 4
- 101000956733 Arabidopsis thaliana Uncharacterized mitochondrial protein AtMg01050 Proteins 0.000 description 4
- 102100024222 B-lymphocyte antigen CD19 Human genes 0.000 description 4
- 206010005003 Bladder cancer Diseases 0.000 description 4
- 102100039398 C-X-C motif chemokine 2 Human genes 0.000 description 4
- 108010014064 CCCTC-Binding Factor Proteins 0.000 description 4
- 102100026548 Caspase-8 Human genes 0.000 description 4
- 102100037759 GRB2-associated-binding protein 2 Human genes 0.000 description 4
- 102100039620 Granulocyte-macrophage colony-stimulating factor Human genes 0.000 description 4
- 101000980825 Homo sapiens B-lymphocyte antigen CD19 Proteins 0.000 description 4
- 101000889128 Homo sapiens C-X-C motif chemokine 2 Proteins 0.000 description 4
- 101000983528 Homo sapiens Caspase-8 Proteins 0.000 description 4
- 101000889276 Homo sapiens Cytotoxic T-lymphocyte protein 4 Proteins 0.000 description 4
- 101001024902 Homo sapiens GRB2-associated-binding protein 2 Proteins 0.000 description 4
- 101000746373 Homo sapiens Granulocyte-macrophage colony-stimulating factor Proteins 0.000 description 4
- 101001011393 Homo sapiens Interferon regulatory factor 2 Proteins 0.000 description 4
- 101000998181 Homo sapiens Interleukin-17B Proteins 0.000 description 4
- 101000853002 Homo sapiens Interleukin-25 Proteins 0.000 description 4
- 101000868279 Homo sapiens Leukocyte surface antigen CD47 Proteins 0.000 description 4
- 101001052490 Homo sapiens Mitogen-activated protein kinase 3 Proteins 0.000 description 4
- 101000934338 Homo sapiens Myeloid cell surface antigen CD33 Proteins 0.000 description 4
- 101001128431 Homo sapiens Myeloid-derived growth factor Proteins 0.000 description 4
- 101000844245 Homo sapiens Non-receptor tyrosine-protein kinase TYK2 Proteins 0.000 description 4
- 101000987581 Homo sapiens Perforin-1 Proteins 0.000 description 4
- 101001117317 Homo sapiens Programmed cell death 1 ligand 1 Proteins 0.000 description 4
- 101000801228 Homo sapiens Tumor necrosis factor receptor superfamily member 1A Proteins 0.000 description 4
- 102100029838 Interferon regulatory factor 2 Human genes 0.000 description 4
- 102100033101 Interleukin-17B Human genes 0.000 description 4
- 102100036680 Interleukin-25 Human genes 0.000 description 4
- 208000031671 Large B-Cell Diffuse Lymphoma Diseases 0.000 description 4
- 102100032913 Leukocyte surface antigen CD47 Human genes 0.000 description 4
- 102100024192 Mitogen-activated protein kinase 3 Human genes 0.000 description 4
- 102100025243 Myeloid cell surface antigen CD33 Human genes 0.000 description 4
- 102100032028 Non-receptor tyrosine-protein kinase TYK2 Human genes 0.000 description 4
- 108700026244 Open Reading Frames Proteins 0.000 description 4
- 102100028467 Perforin-1 Human genes 0.000 description 4
- 206010060862 Prostate cancer Diseases 0.000 description 4
- 208000000236 Prostatic Neoplasms Diseases 0.000 description 4
- 102100022122 Ras-related C3 botulinum toxin substrate 1 Human genes 0.000 description 4
- 108010017324 STAT3 Transcription Factor Proteins 0.000 description 4
- 102100024040 Signal transducer and activator of transcription 3 Human genes 0.000 description 4
- 108090000925 TNF receptor-associated factor 2 Proteins 0.000 description 4
- 102100034779 TRAF family member-associated NF-kappa-B activator Human genes 0.000 description 4
- 102100027671 Transcriptional repressor CTCF Human genes 0.000 description 4
- 102100033732 Tumor necrosis factor receptor superfamily member 1A Human genes 0.000 description 4
- 208000007097 Urinary Bladder Neoplasms Diseases 0.000 description 4
- 230000033228 biological regulation Effects 0.000 description 4
- 238000004132 cross linking Methods 0.000 description 4
- 206010012818 diffuse large B-cell lymphoma Diseases 0.000 description 4
- FOCAHLGSDWHSAH-UHFFFAOYSA-N difluoromethanethione Chemical compound FC(F)=S FOCAHLGSDWHSAH-UHFFFAOYSA-N 0.000 description 4
- 230000009977 dual effect Effects 0.000 description 4
- 229940127130 immunocytokine Drugs 0.000 description 4
- 238000009169 immunotherapy Methods 0.000 description 4
- 108010062302 rac1 GTP Binding Protein Proteins 0.000 description 4
- 230000035945 sensitivity Effects 0.000 description 4
- 201000005112 urinary bladder cancer Diseases 0.000 description 4
- 101100541956 Acidianus filamentous virus 1 (isolate United States/Yellowstone) ORF190 gene Proteins 0.000 description 3
- 101100247448 Allochromatium vinosum (strain ATCC 17899 / DSM 180 / NBRC 103801 / NCIMB 10441 / D) Alvin_2545 gene Proteins 0.000 description 3
- 101000979020 Arabidopsis thaliana Uncharacterized mitochondrial protein AtMg00550 Proteins 0.000 description 3
- 102100027205 B-cell antigen receptor complex-associated protein alpha chain Human genes 0.000 description 3
- 102100027203 B-cell antigen receptor complex-associated protein beta chain Human genes 0.000 description 3
- 206010006187 Breast cancer Diseases 0.000 description 3
- 208000026310 Breast neoplasm Diseases 0.000 description 3
- 102100038918 Caspase-6 Human genes 0.000 description 3
- 102100026550 Caspase-9 Human genes 0.000 description 3
- 230000007067 DNA methylation Effects 0.000 description 3
- 102000004190 Enzymes Human genes 0.000 description 3
- 108090000790 Enzymes Proteins 0.000 description 3
- 102100038595 Estrogen receptor Human genes 0.000 description 3
- 101000626901 Euglena longa Uncharacterized 20.0 kDa protein in rps12-trnP intergenic region Proteins 0.000 description 3
- 102100031258 HLA class II histocompatibility antigen, DM beta chain Human genes 0.000 description 3
- 102100034458 Hepatitis A virus cellular receptor 2 Human genes 0.000 description 3
- 101000914489 Homo sapiens B-cell antigen receptor complex-associated protein alpha chain Proteins 0.000 description 3
- 101000914491 Homo sapiens B-cell antigen receptor complex-associated protein beta chain Proteins 0.000 description 3
- 101000741087 Homo sapiens Caspase-6 Proteins 0.000 description 3
- 101000983523 Homo sapiens Caspase-9 Proteins 0.000 description 3
- 101000882584 Homo sapiens Estrogen receptor Proteins 0.000 description 3
- 101001056180 Homo sapiens Induced myeloid leukemia cell differentiation protein Mcl-1 Proteins 0.000 description 3
- 101000599852 Homo sapiens Intercellular adhesion molecule 1 Proteins 0.000 description 3
- 101001011441 Homo sapiens Interferon regulatory factor 4 Proteins 0.000 description 3
- 101000852992 Homo sapiens Interleukin-12 subunit beta Proteins 0.000 description 3
- 101001019598 Homo sapiens Interleukin-17 receptor A Proteins 0.000 description 3
- 101000853000 Homo sapiens Interleukin-26 Proteins 0.000 description 3
- 101001137987 Homo sapiens Lymphocyte activation gene 3 protein Proteins 0.000 description 3
- 101001120097 Homo sapiens Phosphatidylinositol 3-kinase regulatory subunit beta Proteins 0.000 description 3
- 101001098116 Homo sapiens Phosphatidylinositol 3-kinase regulatory subunit gamma Proteins 0.000 description 3
- 101000702132 Homo sapiens Protein spinster homolog 1 Proteins 0.000 description 3
- 101000674728 Homo sapiens TGF-beta-activated kinase 1 and MAP3K7-binding protein 2 Proteins 0.000 description 3
- 101000880854 Homo sapiens Uridylate-specific endoribonuclease Proteins 0.000 description 3
- 102100026539 Induced myeloid leukemia cell differentiation protein Mcl-1 Human genes 0.000 description 3
- 102100037877 Intercellular adhesion molecule 1 Human genes 0.000 description 3
- 102100030126 Interferon regulatory factor 4 Human genes 0.000 description 3
- 102100036701 Interleukin-12 subunit beta Human genes 0.000 description 3
- 102000003812 Interleukin-15 Human genes 0.000 description 3
- 108090000172 Interleukin-15 Proteins 0.000 description 3
- 102100035018 Interleukin-17 receptor A Human genes 0.000 description 3
- 102100036679 Interleukin-26 Human genes 0.000 description 3
- 229940127145 L19-IL2 immunocytokine Drugs 0.000 description 3
- 229940127147 L19-TNF immunocytokine Drugs 0.000 description 3
- 102000017578 LAG3 Human genes 0.000 description 3
- 101150053046 MYD88 gene Proteins 0.000 description 3
- 206010027480 Metastatic malignant melanoma Diseases 0.000 description 3
- 102100024193 Mitogen-activated protein kinase 1 Human genes 0.000 description 3
- 102100024134 Myeloid differentiation primary response protein MyD88 Human genes 0.000 description 3
- 101150102849 ORF142 gene Proteins 0.000 description 3
- 239000012270 PD-1 inhibitor Substances 0.000 description 3
- 239000012668 PD-1-inhibitor Substances 0.000 description 3
- 206010061902 Pancreatic neoplasm Diseases 0.000 description 3
- 102100026177 Phosphatidylinositol 3-kinase regulatory subunit beta Human genes 0.000 description 3
- 102100037553 Phosphatidylinositol 3-kinase regulatory subunit gamma Human genes 0.000 description 3
- 102100024213 Programmed cell death 1 ligand 2 Human genes 0.000 description 3
- 102100030293 Protein spinster homolog 1 Human genes 0.000 description 3
- 208000006265 Renal cell carcinoma Diseases 0.000 description 3
- 102000005886 STAT4 Transcription Factor Human genes 0.000 description 3
- 108010019992 STAT4 Transcription Factor Proteins 0.000 description 3
- 101150058731 STAT5A gene Proteins 0.000 description 3
- 102100024481 Signal transducer and activator of transcription 5A Human genes 0.000 description 3
- 102100021227 TGF-beta-activated kinase 1 and MAP3K7-binding protein 2 Human genes 0.000 description 3
- 102000003714 TNF receptor-associated factor 6 Human genes 0.000 description 3
- 108090000009 TNF receptor-associated factor 6 Proteins 0.000 description 3
- 102100037697 Uridylate-specific endoribonuclease Human genes 0.000 description 3
- 230000004913 activation Effects 0.000 description 3
- 229950002916 avelumab Drugs 0.000 description 3
- 230000006037 cell lysis Effects 0.000 description 3
- 208000032852 chronic lymphocytic leukemia Diseases 0.000 description 3
- 230000001186 cumulative effect Effects 0.000 description 3
- 238000012217 deletion Methods 0.000 description 3
- 230000037430 deletion Effects 0.000 description 3
- 238000010586 diagram Methods 0.000 description 3
- 230000029087 digestion Effects 0.000 description 3
- 239000003596 drug target Substances 0.000 description 3
- 238000011156 evaluation Methods 0.000 description 3
- 230000006870 function Effects 0.000 description 3
- 201000010536 head and neck cancer Diseases 0.000 description 3
- 208000014829 head and neck neoplasm Diseases 0.000 description 3
- 230000028993 immune response Effects 0.000 description 3
- 210000000987 immune system Anatomy 0.000 description 3
- 208000032839 leukemia Diseases 0.000 description 3
- 208000015486 malignant pancreatic neoplasm Diseases 0.000 description 3
- 208000021039 metastatic melanoma Diseases 0.000 description 3
- 230000035772 mutation Effects 0.000 description 3
- 238000011275 oncology therapy Methods 0.000 description 3
- 201000002528 pancreatic cancer Diseases 0.000 description 3
- 208000008443 pancreatic carcinoma Diseases 0.000 description 3
- 229940121655 pd-1 inhibitor Drugs 0.000 description 3
- 210000003819 peripheral blood mononuclear cell Anatomy 0.000 description 3
- 229950010773 pidilizumab Drugs 0.000 description 3
- 102000040430 polynucleotide Human genes 0.000 description 3
- 108091033319 polynucleotide Proteins 0.000 description 3
- 239000002157 polynucleotide Substances 0.000 description 3
- 239000000092 prognostic biomarker Substances 0.000 description 3
- 230000009467 reduction Effects 0.000 description 3
- 241000894007 species Species 0.000 description 3
- 238000013517 stratification Methods 0.000 description 3
- 239000000126 substance Substances 0.000 description 3
- 229940124597 therapeutic agent Drugs 0.000 description 3
- ANRHNWWPFJCPAZ-UHFFFAOYSA-M thionine Chemical compound [Cl-].C1=CC(N)=CC2=[S+]C3=CC(N)=CC=C3N=C21 ANRHNWWPFJCPAZ-UHFFFAOYSA-M 0.000 description 3
- PJOHVEQSYPOERL-SHEAVXILSA-N (e)-n-[(4r,4as,7ar,12br)-3-(cyclopropylmethyl)-9-hydroxy-7-oxo-2,4,5,6,7a,13-hexahydro-1h-4,12-methanobenzofuro[3,2-e]isoquinoline-4a-yl]-3-(4-methylphenyl)prop-2-enamide Chemical compound C1=CC(C)=CC=C1\C=C\C(=O)N[C@]1(CCC(=O)[C@@H]2O3)[C@H]4CC5=CC=C(O)C3=C5[C@]12CCN4CC1CC1 PJOHVEQSYPOERL-SHEAVXILSA-N 0.000 description 2
- UDGUGZTYGWUUSG-UHFFFAOYSA-N 4-[4-[[2,5-dimethoxy-4-[(4-nitrophenyl)diazenyl]phenyl]diazenyl]-n-methylanilino]butanoic acid Chemical compound COC=1C=C(N=NC=2C=CC(=CC=2)N(C)CCCC(O)=O)C(OC)=CC=1N=NC1=CC=C([N+]([O-])=O)C=C1 UDGUGZTYGWUUSG-UHFFFAOYSA-N 0.000 description 2
- 101710115267 ATP synthase protein MI25 Proteins 0.000 description 2
- 101100265639 Acidianus bottle-shaped virus (isolate Italy/Pozzuoli) ORF346 gene Proteins 0.000 description 2
- 101100157851 Acidianus filamentous virus 1 (isolate United States/Yellowstone) ORF195 gene Proteins 0.000 description 2
- 230000007730 Akt signaling Effects 0.000 description 2
- 102100029647 Apoptosis-associated speck-like protein containing a CARD Human genes 0.000 description 2
- 101001036647 Arabidopsis thaliana Uncharacterized mitochondrial protein AtMg00710 Proteins 0.000 description 2
- 101000756436 Autographa californica nuclear polyhedrosis virus Uncharacterized 23.6 kDa protein in LEF2-PH intergenic region Proteins 0.000 description 2
- 208000010839 B-cell chronic lymphocytic leukemia Diseases 0.000 description 2
- 102100022005 B-lymphocyte antigen CD20 Human genes 0.000 description 2
- 102100023932 Bcl-2-like protein 2 Human genes 0.000 description 2
- 101000774107 Borrelia burgdorferi (strain ATCC 35210 / B31 / CIP 102532 / DSM 4680) Uncharacterized protein BB_0266 Proteins 0.000 description 2
- 102100023705 C-C motif chemokine 14 Human genes 0.000 description 2
- 102100023703 C-C motif chemokine 15 Human genes 0.000 description 2
- 102100023700 C-C motif chemokine 16 Human genes 0.000 description 2
- 102100036850 C-C motif chemokine 23 Human genes 0.000 description 2
- 108010021064 CTLA-4 Antigen Proteins 0.000 description 2
- 229940045513 CTLA4 antagonist Drugs 0.000 description 2
- 102100035904 Caspase-1 Human genes 0.000 description 2
- 102100023126 Cell surface glycoprotein MUC18 Human genes 0.000 description 2
- 101000748754 Chlorella vulgaris Uncharacterized 27.9 kDa protein in trnR-minE intergenic region Proteins 0.000 description 2
- 108091026890 Coding region Proteins 0.000 description 2
- 206010009944 Colon cancer Diseases 0.000 description 2
- 208000001333 Colorectal Neoplasms Diseases 0.000 description 2
- 102100038418 Cytoplasmic FMR1-interacting protein 2 Human genes 0.000 description 2
- 230000007023 DNA restriction-modification system Effects 0.000 description 2
- 101000963886 Dictyostelium discoideum Uncharacterized mitochondrial protein Mp05 Proteins 0.000 description 2
- 108010067770 Endopeptidase K Proteins 0.000 description 2
- 102100038591 Endothelial cell-selective adhesion molecule Human genes 0.000 description 2
- 101000626919 Euglena longa Uncharacterized 25.9 kDa protein in rpl12-rps7 intergenic region Proteins 0.000 description 2
- 101000748786 Euglena longa Uncharacterized 7.2 kDa protein in rps2-rps9 intergenic region Proteins 0.000 description 2
- 102100033079 HLA class II histocompatibility antigen, DM alpha chain Human genes 0.000 description 2
- 101000743338 Haemophilus phage HP1 (strain HP1c1) Probable head completion/stabilization protein Proteins 0.000 description 2
- 208000002250 Hematologic Neoplasms Diseases 0.000 description 2
- 108010007707 Hepatitis A Virus Cellular Receptor 2 Proteins 0.000 description 2
- 108010033040 Histones Proteins 0.000 description 2
- 101000728679 Homo sapiens Apoptosis-associated speck-like protein containing a CARD Proteins 0.000 description 2
- 101000897405 Homo sapiens B-lymphocyte antigen CD20 Proteins 0.000 description 2
- 101000904691 Homo sapiens Bcl-2-like protein 2 Proteins 0.000 description 2
- 101000978381 Homo sapiens C-C motif chemokine 14 Proteins 0.000 description 2
- 101000978376 Homo sapiens C-C motif chemokine 15 Proteins 0.000 description 2
- 101000978375 Homo sapiens C-C motif chemokine 16 Proteins 0.000 description 2
- 101000713081 Homo sapiens C-C motif chemokine 23 Proteins 0.000 description 2
- 101000715398 Homo sapiens Caspase-1 Proteins 0.000 description 2
- 101000983518 Homo sapiens Caspase-10 Proteins 0.000 description 2
- 101000623903 Homo sapiens Cell surface glycoprotein MUC18 Proteins 0.000 description 2
- 101000956870 Homo sapiens Cytoplasmic FMR1-interacting protein 2 Proteins 0.000 description 2
- 101000882622 Homo sapiens Endothelial cell-selective adhesion molecule Proteins 0.000 description 2
- 101000599858 Homo sapiens Intercellular adhesion molecule 2 Proteins 0.000 description 2
- 101000599868 Homo sapiens Intercellular adhesion molecule 4 Proteins 0.000 description 2
- 101000599940 Homo sapiens Interferon gamma Proteins 0.000 description 2
- 101001003142 Homo sapiens Interleukin-12 receptor subunit beta-1 Proteins 0.000 description 2
- 101000998178 Homo sapiens Interleukin-17C Proteins 0.000 description 2
- 101000998176 Homo sapiens Interleukin-17D Proteins 0.000 description 2
- 101001028836 Homo sapiens M-phase-specific PLK1-interacting protein Proteins 0.000 description 2
- 101000989653 Homo sapiens Membrane frizzled-related protein Proteins 0.000 description 2
- 101001052493 Homo sapiens Mitogen-activated protein kinase 1 Proteins 0.000 description 2
- 101001091194 Homo sapiens Peptidyl-prolyl cis-trans isomerase G Proteins 0.000 description 2
- 101000605639 Homo sapiens Phosphatidylinositol 4,5-bisphosphate 3-kinase catalytic subunit alpha isoform Proteins 0.000 description 2
- 101001117312 Homo sapiens Programmed cell death 1 ligand 2 Proteins 0.000 description 2
- 101000741544 Homo sapiens Properdin Proteins 0.000 description 2
- 101100087590 Homo sapiens RICTOR gene Proteins 0.000 description 2
- 101000824971 Homo sapiens Sperm surface protein Sp17 Proteins 0.000 description 2
- 101000809875 Homo sapiens TYRO protein tyrosine kinase-binding protein Proteins 0.000 description 2
- 101000795169 Homo sapiens Tumor necrosis factor receptor superfamily member 13C Proteins 0.000 description 2
- 101000679857 Homo sapiens Tumor necrosis factor receptor superfamily member 3 Proteins 0.000 description 2
- 101000666896 Homo sapiens V-type immunoglobulin domain-containing suppressor of T-cell activation Proteins 0.000 description 2
- 101100283436 Human herpesvirus 8 type P (isolate GK18) gM gene Proteins 0.000 description 2
- 108010064600 Intercellular Adhesion Molecule-3 Proteins 0.000 description 2
- 102100037872 Intercellular adhesion molecule 2 Human genes 0.000 description 2
- 102100037871 Intercellular adhesion molecule 3 Human genes 0.000 description 2
- 102100037874 Intercellular adhesion molecule 4 Human genes 0.000 description 2
- 102100037850 Interferon gamma Human genes 0.000 description 2
- 102100020790 Interleukin-12 receptor subunit beta-1 Human genes 0.000 description 2
- 102100033105 Interleukin-17C Human genes 0.000 description 2
- 102100033096 Interleukin-17D Human genes 0.000 description 2
- 102000042838 JAK family Human genes 0.000 description 2
- 108091082332 JAK family Proteins 0.000 description 2
- 101000904276 Lactococcus phage P008 Gene product 38 Proteins 0.000 description 2
- 208000031422 Lymphocytic Chronic B-Cell Leukemia Diseases 0.000 description 2
- 206010025323 Lymphomas Diseases 0.000 description 2
- 102100037185 M-phase-specific PLK1-interacting protein Human genes 0.000 description 2
- 101000747947 Marchantia polymorpha Uncharacterized mitochondrial protein ymf33 Proteins 0.000 description 2
- 101150016564 ORF39 gene Proteins 0.000 description 2
- 101150092861 ORF71 gene Proteins 0.000 description 2
- 101000768129 Oryza sativa subsp. japonica Uncharacterized protein ycf73 Proteins 0.000 description 2
- 239000012271 PD-L1 inhibitor Substances 0.000 description 2
- 101100378791 Paenarthrobacter nicotinovorans aldh gene Proteins 0.000 description 2
- 102100034850 Peptidyl-prolyl cis-trans isomerase G Human genes 0.000 description 2
- 102100038332 Phosphatidylinositol 4,5-bisphosphate 3-kinase catalytic subunit alpha isoform Human genes 0.000 description 2
- 102100025067 Potassium voltage-gated channel subfamily H member 4 Human genes 0.000 description 2
- 101710163352 Potassium voltage-gated channel subfamily H member 4 Proteins 0.000 description 2
- 102100038567 Properdin Human genes 0.000 description 2
- 102000001183 RAG-1 Human genes 0.000 description 2
- 108060006897 RAG1 Proteins 0.000 description 2
- 238000011529 RT qPCR Methods 0.000 description 2
- 108700019586 Rapamycin-Insensitive Companion of mTOR Proteins 0.000 description 2
- 102000046941 Rapamycin-Insensitive Companion of mTOR Human genes 0.000 description 2
- 101000748505 Rhodobacter capsulatus Uncharacterized 16.1 kDa protein in hypE 3'region Proteins 0.000 description 2
- 101000827797 Rhodobacter capsulatus Uncharacterized 23.7 kDa protein in puhA 5'region Proteins 0.000 description 2
- 101000814063 Salmonella phage P22 Uncharacterized 6.6 kDa protein in eae-abc2 intergenic region Proteins 0.000 description 2
- 102100022441 Sperm surface protein Sp17 Human genes 0.000 description 2
- 101000637187 Streptomyces actuosus Putative nosiheptide resistance regulatory protein Proteins 0.000 description 2
- 102100038717 TYRO protein tyrosine kinase-binding protein Human genes 0.000 description 2
- 101000792450 Trieres chinensis Uncharacterized 4.7 kDa protein in ycf33-trnY intergenic region Proteins 0.000 description 2
- 101000792502 Trieres chinensis Uncharacterized protein ycf90 Proteins 0.000 description 2
- 102100029690 Tumor necrosis factor receptor superfamily member 13C Human genes 0.000 description 2
- 102100022156 Tumor necrosis factor receptor superfamily member 3 Human genes 0.000 description 2
- 101710173665 Uncharacterized 5.8 kDa protein Proteins 0.000 description 2
- 101710134973 Uncharacterized 9.7 kDa protein in cox-rep intergenic region Proteins 0.000 description 2
- 101710172361 Uncharacterized protein ycf17 Proteins 0.000 description 2
- 102100038282 V-type immunoglobulin domain-containing suppressor of T-cell activation Human genes 0.000 description 2
- 208000037844 advanced solid tumor Diseases 0.000 description 2
- 238000013459 approach Methods 0.000 description 2
- 229960003852 atezolizumab Drugs 0.000 description 2
- 230000031018 biological processes and functions Effects 0.000 description 2
- 229960000074 biopharmaceutical Drugs 0.000 description 2
- 230000001413 cellular effect Effects 0.000 description 2
- 230000003831 deregulation Effects 0.000 description 2
- 230000000694 effects Effects 0.000 description 2
- IJJVMEJXYNJXOJ-UHFFFAOYSA-N fluquinconazole Chemical compound C=1C=C(Cl)C=C(Cl)C=1N1C(=O)C2=CC(F)=CC=C2N=C1N1C=NC=N1 IJJVMEJXYNJXOJ-UHFFFAOYSA-N 0.000 description 2
- 201000003444 follicular lymphoma Diseases 0.000 description 2
- 230000007062 hydrolysis Effects 0.000 description 2
- 238000006460 hydrolysis reaction Methods 0.000 description 2
- 238000000126 in silico method Methods 0.000 description 2
- 238000002372 labelling Methods 0.000 description 2
- 239000003446 ligand Substances 0.000 description 2
- 238000004519 manufacturing process Methods 0.000 description 2
- 230000001394 metastastic effect Effects 0.000 description 2
- 206010061289 metastatic neoplasm Diseases 0.000 description 2
- 230000004048 modification Effects 0.000 description 2
- 238000012986 modification Methods 0.000 description 2
- 238000012544 monitoring process Methods 0.000 description 2
- 108091027963 non-coding RNA Proteins 0.000 description 2
- 102000042567 non-coding RNA Human genes 0.000 description 2
- 230000007170 pathology Effects 0.000 description 2
- 229940121656 pd-l1 inhibitor Drugs 0.000 description 2
- 229940046159 pegylated liposomal doxorubicin Drugs 0.000 description 2
- 239000013641 positive control Substances 0.000 description 2
- 230000002829 reductive effect Effects 0.000 description 2
- 230000019908 regulation of T cell activation Effects 0.000 description 2
- 238000011160 research Methods 0.000 description 2
- 230000002441 reversible effect Effects 0.000 description 2
- 229960004641 rituximab Drugs 0.000 description 2
- 238000000926 separation method Methods 0.000 description 2
- 238000009097 single-agent therapy Methods 0.000 description 2
- 238000010561 standard procedure Methods 0.000 description 2
- 238000007619 statistical method Methods 0.000 description 2
- 238000006467 substitution reaction Methods 0.000 description 2
- 230000008685 targeting Effects 0.000 description 2
- 238000012546 transfer Methods 0.000 description 2
- 229950007217 tremelimumab Drugs 0.000 description 2
- 108091032973 (ribonucleotides)n+m Proteins 0.000 description 1
- 102100030388 1-phosphatidylinositol 4,5-bisphosphate phosphodiesterase beta-3 Human genes 0.000 description 1
- 102100036933 12-(S)-hydroxy-5,8,10,14-eicosatetraenoic acid receptor Human genes 0.000 description 1
- 101150029062 15 gene Proteins 0.000 description 1
- LTPSRQRIPCVMKQ-UHFFFAOYSA-N 2-amino-5-methylbenzenesulfonic acid Chemical compound CC1=CC=C(N)C(S(O)(=O)=O)=C1 LTPSRQRIPCVMKQ-UHFFFAOYSA-N 0.000 description 1
- QSPOQCXMGPDIHI-UHFFFAOYSA-N 2-amino-n,n-dipropyl-8-[4-(pyrrolidine-1-carbonyl)phenyl]-3h-1-benzazepine-4-carboxamide Chemical compound C1=C2N=C(N)CC(C(=O)N(CCC)CCC)=CC2=CC=C1C(C=C1)=CC=C1C(=O)N1CCCC1 QSPOQCXMGPDIHI-UHFFFAOYSA-N 0.000 description 1
- 102100033453 26S proteasome non-ATPase regulatory subunit 5 Human genes 0.000 description 1
- 102100039776 39S ribosomal protein L4, mitochondrial Human genes 0.000 description 1
- 102100033051 40S ribosomal protein S19 Human genes 0.000 description 1
- 101150095992 5a gene Proteins 0.000 description 1
- 101150026181 5b gene Proteins 0.000 description 1
- 102100040924 60S ribosomal protein L6 Human genes 0.000 description 1
- 101150071460 6b gene Proteins 0.000 description 1
- 101150003582 7a gene Proteins 0.000 description 1
- 101150028631 7b gene Proteins 0.000 description 1
- 102100032310 A disintegrin and metalloproteinase with thrombospondin motifs 14 Human genes 0.000 description 1
- 102100022980 ADAMTS-like protein 4 Human genes 0.000 description 1
- 108091005673 ADAMTS14 Proteins 0.000 description 1
- 101700073590 ADM5 Proteins 0.000 description 1
- 102100025261 AMSH-like protease Human genes 0.000 description 1
- 102100020973 ATP-binding cassette sub-family D member 3 Human genes 0.000 description 1
- 102100032921 ATP-dependent 6-phosphofructokinase, liver type Human genes 0.000 description 1
- 101100318730 Acidianus bottle-shaped virus (isolate Italy/Pozzuoli) ORF257 gene Proteins 0.000 description 1
- 101100374343 Acidianus filamentous virus 1 (isolate United States/Yellowstone) ORF224 gene Proteins 0.000 description 1
- 101100374232 Acidianus filamentous virus 2 (isolate Italy/Pozzuoli) ORF202 gene Proteins 0.000 description 1
- 101100431002 Acidianus filamentous virus 2 (isolate Italy/Pozzuoli) ORF554 gene Proteins 0.000 description 1
- 102100040635 Actin filament-associated protein 1-like 1 Human genes 0.000 description 1
- 102100036732 Actin, aortic smooth muscle Human genes 0.000 description 1
- 208000031261 Acute myeloid leukaemia Diseases 0.000 description 1
- 102100032872 Adenosine 3'-phospho 5'-phosphosulfate transporter 1 Human genes 0.000 description 1
- 102100034029 Adenylosuccinate synthetase isozyme 1 Human genes 0.000 description 1
- 102100030233 Agmatinase, mitochondrial Human genes 0.000 description 1
- 102100037411 Alanine-tRNA ligase, mitochondrial Human genes 0.000 description 1
- 102100034181 Alpha- and gamma-adaptin-binding protein p34 Human genes 0.000 description 1
- 102100036092 Alpha-endosulfine Human genes 0.000 description 1
- 102100037242 Amiloride-sensitive sodium channel subunit alpha Human genes 0.000 description 1
- 102100040055 Amyloid beta precursor like protein 1 Human genes 0.000 description 1
- 102100034598 Angiopoietin-related protein 7 Human genes 0.000 description 1
- 108020005544 Antisense RNA Proteins 0.000 description 1
- 102100034156 Apical endosomal glycoprotein Human genes 0.000 description 1
- 102000010565 Apoptosis Regulatory Proteins Human genes 0.000 description 1
- 108010063104 Apoptosis Regulatory Proteins Proteins 0.000 description 1
- 102100021569 Apoptosis regulator Bcl-2 Human genes 0.000 description 1
- 102100024454 Apoptosis regulatory protein Siva Human genes 0.000 description 1
- 101001054928 Arabidopsis thaliana Uncharacterized mitochondrial protein AtMg00150 Proteins 0.000 description 1
- 101000578843 Arabidopsis thaliana Uncharacterized mitochondrial protein AtMg00400 Proteins 0.000 description 1
- 101000958403 Arabidopsis thaliana Uncharacterized mitochondrial protein AtMg00970 Proteins 0.000 description 1
- 101000956763 Arabidopsis thaliana Uncharacterized mitochondrial protein AtMg01010 Proteins 0.000 description 1
- 101000615717 Arabidopsis thaliana Uncharacterized mitochondrial protein AtMg01250 Proteins 0.000 description 1
- 101000615718 Arabidopsis thaliana Uncharacterized mitochondrial protein AtMg01260 Proteins 0.000 description 1
- 102100020741 Atrophin-1 Human genes 0.000 description 1
- 101100335652 Autographa californica nuclear polyhedrosis virus GP64 gene Proteins 0.000 description 1
- 101100144928 Autographa californica nuclear polyhedrosis virus PNK/PNL gene Proteins 0.000 description 1
- 208000023275 Autoimmune disease Diseases 0.000 description 1
- 108091012583 BCL2 Proteins 0.000 description 1
- 108091007065 BIRCs Proteins 0.000 description 1
- 102100026032 BRI3-binding protein Human genes 0.000 description 1
- 102100033151 BTB/POZ domain-containing protein KCTD21 Human genes 0.000 description 1
- 102100021677 Baculoviral IAP repeat-containing protein 2 Human genes 0.000 description 1
- 102100021894 Bcl-2-like protein 12 Human genes 0.000 description 1
- 102100021895 Bcl-2-like protein 13 Human genes 0.000 description 1
- 102100028723 BolA-like protein 2 Human genes 0.000 description 1
- 208000003174 Brain Neoplasms Diseases 0.000 description 1
- 102100033641 Bromodomain-containing protein 2 Human genes 0.000 description 1
- 108090000342 C-Type Lectins Proteins 0.000 description 1
- 102000003930 C-Type Lectins Human genes 0.000 description 1
- 102100032957 C5a anaphylatoxin chemotactic receptor 1 Human genes 0.000 description 1
- 102100024217 CAMPATH-1 antigen Human genes 0.000 description 1
- 102100025752 CASP8 and FADD-like apoptosis regulator Human genes 0.000 description 1
- 108010065524 CD52 Antigen Proteins 0.000 description 1
- 102100040525 CKLF-like MARVEL transmembrane domain-containing protein 5 Human genes 0.000 description 1
- 102100028245 COP9 signalosome complex subunit 7a Human genes 0.000 description 1
- 102100039372 Calcium uniporter regulatory subunit MCUb, mitochondrial Human genes 0.000 description 1
- 102100025466 Carcinoembryonic antigen-related cell adhesion molecule 3 Human genes 0.000 description 1
- 102100027946 Carnitine O-palmitoyltransferase 1, brain isoform Human genes 0.000 description 1
- 102100038902 Caspase-7 Human genes 0.000 description 1
- 102100030245 Cation channel sperm-associated auxiliary subunit zeta Human genes 0.000 description 1
- 102100032230 Caveolae-associated protein 1 Human genes 0.000 description 1
- 102000000844 Cell Surface Receptors Human genes 0.000 description 1
- 108010001857 Cell Surface Receptors Proteins 0.000 description 1
- 102100024479 Cell division cycle-associated protein 3 Human genes 0.000 description 1
- 102100025064 Cellular tumor antigen p53 Human genes 0.000 description 1
- 102100034788 Cementoblastoma-derived protein 1 Human genes 0.000 description 1
- 102100031203 Centrosomal protein 43 Human genes 0.000 description 1
- 102100025705 Centrosomal protein of 170 kDa protein B Human genes 0.000 description 1
- 102100024308 Ceramide synthase Human genes 0.000 description 1
- 206010008342 Cervix carcinoma Diseases 0.000 description 1
- 108091006146 Channels Proteins 0.000 description 1
- 102100026314 Charged multivesicular body protein 6 Human genes 0.000 description 1
- 101000792452 Chlamydomonas reinhardtii Uncharacterized 12.3 kDa protein in petA-petD intergenic region Proteins 0.000 description 1
- 101000792453 Chlorella vulgaris Uncharacterized 43.6 kDa protein in ycf4-trnK intergenic region Proteins 0.000 description 1
- 101000792448 Chlorella vulgaris Uncharacterized 79.7 kDa protein in psaB-ycf62 intergenic region Proteins 0.000 description 1
- 102100021809 Chorionic somatomammotropin hormone 1 Human genes 0.000 description 1
- 102100031633 Chorionic somatomammotropin hormone-like 1 Human genes 0.000 description 1
- 108010077544 Chromatin Proteins 0.000 description 1
- 208000008818 Chronic Mucocutaneous Candidiasis Diseases 0.000 description 1
- 102100023335 Chymotrypsin-like elastase family member 2A Human genes 0.000 description 1
- 102100023338 Chymotrypsin-like elastase family member 2B Human genes 0.000 description 1
- 102100025817 Coiled-coil domain-containing protein 153 Human genes 0.000 description 1
- 102100032408 Coiled-coil domain-containing protein 27 Human genes 0.000 description 1
- 102100021982 Coiled-coil domain-containing protein 28B Human genes 0.000 description 1
- 102100032372 Coiled-coil domain-containing protein 88B Human genes 0.000 description 1
- 102100031088 Coiled-coil domain-containing protein 9 Human genes 0.000 description 1
- 201000003874 Common Variable Immunodeficiency Diseases 0.000 description 1
- 102100030135 Complement C1q tumor necrosis factor-related protein 5 Human genes 0.000 description 1
- 102100027827 Complexin-3 Human genes 0.000 description 1
- 102100028233 Coronin-1A Human genes 0.000 description 1
- OHOQEZWSNFNUSY-UHFFFAOYSA-N Cy3-bifunctional dye zwitterion Chemical compound O=C1CCC(=O)N1OC(=O)CCCCCN1C2=CC=C(S(O)(=O)=O)C=C2C(C)(C)C1=CC=CC(C(C1=CC(=CC=C11)S([O-])(=O)=O)(C)C)=[N+]1CCCCCC(=O)ON1C(=O)CCC1=O OHOQEZWSNFNUSY-UHFFFAOYSA-N 0.000 description 1
- 101000748760 Cyanophora paradoxa Uncharacterized 21.2 kDa protein in psbX-ycf33 intergenic region Proteins 0.000 description 1
- 101000764210 Cyanophora paradoxa Uncharacterized 21.2 kDa protein in ycf23-apcF intergenic region Proteins 0.000 description 1
- 101000748770 Cyanophora paradoxa Uncharacterized 24.3 kDa protein in hemA-psbN intergenic region Proteins 0.000 description 1
- 101000768085 Cyanophora paradoxa Uncharacterized protein ycf49 Proteins 0.000 description 1
- 102000009512 Cyclin-Dependent Kinase Inhibitor p15 Human genes 0.000 description 1
- 108010009356 Cyclin-Dependent Kinase Inhibitor p15 Proteins 0.000 description 1
- 102100038254 Cyclin-F Human genes 0.000 description 1
- 102100021903 Cysteine protease ATG4B Human genes 0.000 description 1
- 108010074918 Cytochrome P-450 CYP1A1 Proteins 0.000 description 1
- 108010074922 Cytochrome P-450 CYP1A2 Proteins 0.000 description 1
- 102100031476 Cytochrome P450 1A1 Human genes 0.000 description 1
- 102100026533 Cytochrome P450 1A2 Human genes 0.000 description 1
- 102100025620 Cytochrome b-245 light chain Human genes 0.000 description 1
- 102100028997 Cytochrome c oxidase subunit 6A2, mitochondrial Human genes 0.000 description 1
- 102100029010 D-aminoacyl-tRNA deacylase 1 Human genes 0.000 description 1
- OQEBIHBLFRADNM-UHFFFAOYSA-N D-iminoxylitol Natural products OCC1NCC(O)C1O OQEBIHBLFRADNM-UHFFFAOYSA-N 0.000 description 1
- 108010009540 DNA (Cytosine-5-)-Methyltransferase 1 Proteins 0.000 description 1
- 102100036279 DNA (cytosine-5)-methyltransferase 1 Human genes 0.000 description 1
- 102100024811 DNA (cytosine-5)-methyltransferase 3-like Human genes 0.000 description 1
- 238000007400 DNA extraction Methods 0.000 description 1
- 102100033215 DNA nucleotidylexotransferase Human genes 0.000 description 1
- 102100022302 DNA polymerase beta Human genes 0.000 description 1
- 102100039116 DNA repair protein RAD50 Human genes 0.000 description 1
- 102100036945 Dead end protein homolog 1 Human genes 0.000 description 1
- 102100037794 Diacylglycerol lipase-beta Human genes 0.000 description 1
- 102100037986 Dickkopf-related protein 4 Human genes 0.000 description 1
- 101001014190 Dictyostelium discoideum Uncharacterized mitochondrial protein 21 Proteins 0.000 description 1
- 101000624596 Dictyostelium discoideum Uncharacterized mitochondrial protein 30 Proteins 0.000 description 1
- 102100028561 Disabled homolog 1 Human genes 0.000 description 1
- 102100034110 DnaJ homolog subfamily C member 16 Human genes 0.000 description 1
- 102100031682 DnaJ homolog subfamily C member 4 Human genes 0.000 description 1
- 102100021151 Doublecortin domain-containing protein 2B Human genes 0.000 description 1
- 102100033570 Doublesex- and mab-3-related transcription factor C2 Human genes 0.000 description 1
- 102100033992 Dual specificity protein phosphatase 22 Human genes 0.000 description 1
- 102100040614 Dynein regulatory complex subunit 5 Human genes 0.000 description 1
- 102100039499 E3 ubiquitin-protein ligase RNF26 Human genes 0.000 description 1
- 102100037024 E3 ubiquitin-protein ligase XIAP Human genes 0.000 description 1
- 102100029650 EH domain-binding protein 1-like protein 1 Human genes 0.000 description 1
- 102100039368 ER lumen protein-retaining receptor 2 Human genes 0.000 description 1
- 102100039249 Elongation of very long chain fatty acids protein 6 Human genes 0.000 description 1
- 108050007786 Elongation of very long chain fatty acids protein 6 Proteins 0.000 description 1
- 102100032450 Endothelial differentiation-related factor 1 Human genes 0.000 description 1
- 102000006397 Ephrin-B1 Human genes 0.000 description 1
- 108010044099 Ephrin-B1 Proteins 0.000 description 1
- 102100034720 Epididymal-specific lipocalin-12 Human genes 0.000 description 1
- 102100021469 Equilibrative nucleoside transporter 1 Human genes 0.000 description 1
- 101100173936 Escherichia coli (strain K12) flmA gene Proteins 0.000 description 1
- 101000626924 Euglena longa Uncharacterized 32.5 kDa protein in rpl14-rpl12 intergenic region Proteins 0.000 description 1
- 101000764374 Euglena longa Uncharacterized 66.5 kDa protein in trnI-trnV intergenic region Proteins 0.000 description 1
- 101000792446 Euglena longa Uncharacterized 8.7 kDa protein in rpl22-rpl23 intergenic region Proteins 0.000 description 1
- 102100029782 Eukaryotic translation initiation factor 3 subunit I Human genes 0.000 description 1
- 108010007457 Extracellular Signal-Regulated MAP Kinases Proteins 0.000 description 1
- 102000013345 FBXW5 Human genes 0.000 description 1
- 101150101596 FBXW5 gene Proteins 0.000 description 1
- 102100037577 FERM, ARHGEF and pleckstrin domain-containing protein 2 Human genes 0.000 description 1
- 102100035279 FYN-binding protein 2 Human genes 0.000 description 1
- 102100040612 Fermitin family homolog 3 Human genes 0.000 description 1
- 102100026117 Ferredoxin-2, mitochondrial Human genes 0.000 description 1
- 102100040305 Flagellum-associated coiled-coil domain-containing protein 1 Human genes 0.000 description 1
- WSFSSNUMVMOOMR-UHFFFAOYSA-N Formaldehyde Chemical compound O=C WSFSSNUMVMOOMR-UHFFFAOYSA-N 0.000 description 1
- 102100028930 Formin-like protein 1 Human genes 0.000 description 1
- 102100022277 Fructose-bisphosphate aldolase A Human genes 0.000 description 1
- 108010038179 G-protein beta3 subunit Proteins 0.000 description 1
- 102100025101 GATA-type zinc finger protein 1 Human genes 0.000 description 1
- 229940032072 GVAX vaccine Drugs 0.000 description 1
- 102100028652 Gamma-enolase Human genes 0.000 description 1
- 102100040225 Gamma-interferon-inducible lysosomal thiol reductase Human genes 0.000 description 1
- 102100039262 Glycogen [starch] synthase, muscle Human genes 0.000 description 1
- 102100035710 Golgi phosphoprotein 3-like Human genes 0.000 description 1
- 102100030430 Group XIIA secretory phospholipase A2 Human genes 0.000 description 1
- 102100023683 GrpE protein homolog 2, mitochondrial Human genes 0.000 description 1
- 102100035346 Guanine nucleotide-binding protein G(I)/G(S)/G(T) subunit beta-3 Human genes 0.000 description 1
- 101000626906 Guillardia theta Uncharacterized 30.1 kDa protein Proteins 0.000 description 1
- 102100031547 HLA class II histocompatibility antigen, DO alpha chain Human genes 0.000 description 1
- 102100040485 HLA class II histocompatibility antigen, DRB1 beta chain Human genes 0.000 description 1
- 108010039343 HLA-DRB1 Chains Proteins 0.000 description 1
- 101000854890 Haemophilus phage HP1 (strain HP1c1) Probable terminase, ATPase subunit Proteins 0.000 description 1
- 101000768945 Haemophilus phage HP1 (strain HP1c1) Uncharacterized 7.9 kDa protein in int-C1 intergenic region Proteins 0.000 description 1
- 102100032510 Heat shock protein HSP 90-beta Human genes 0.000 description 1
- 102100029360 Hematopoietic cell signal transducer Human genes 0.000 description 1
- 102100027618 Heme transporter HRG1 Human genes 0.000 description 1
- 101710083479 Hepatitis A virus cellular receptor 2 homolog Proteins 0.000 description 1
- 102100031004 Histidine-tRNA ligase, cytoplasmic Human genes 0.000 description 1
- 102100039869 Histone H2B type F-S Human genes 0.000 description 1
- 102100039996 Histone deacetylase 1 Human genes 0.000 description 1
- 102100038719 Histone deacetylase 7 Human genes 0.000 description 1
- 102100023604 Homeobox and leucine zipper protein Homez Human genes 0.000 description 1
- 101000583069 Homo sapiens 1-phosphatidylinositol 4,5-bisphosphate phosphodiesterase beta-3 Proteins 0.000 description 1
- 101001071349 Homo sapiens 12-(S)-hydroxy-5,8,10,14-eicosatetraenoic acid receptor Proteins 0.000 description 1
- 101001135226 Homo sapiens 26S proteasome non-ATPase regulatory subunit 5 Proteins 0.000 description 1
- 101000667416 Homo sapiens 39S ribosomal protein L4, mitochondrial Proteins 0.000 description 1
- 101000733040 Homo sapiens 40S ribosomal protein S19 Proteins 0.000 description 1
- 101000673524 Homo sapiens 60S ribosomal protein L6 Proteins 0.000 description 1
- 101000975058 Homo sapiens ADAMTS-like protein 4 Proteins 0.000 description 1
- 101000648020 Homo sapiens AMSH-like protease Proteins 0.000 description 1
- 101000783770 Homo sapiens ATP-binding cassette sub-family D member 3 Proteins 0.000 description 1
- 101000730830 Homo sapiens ATP-dependent 6-phosphofructokinase, liver type Proteins 0.000 description 1
- 101000892363 Homo sapiens Actin filament-associated protein 1-like 1 Proteins 0.000 description 1
- 101000929319 Homo sapiens Actin, aortic smooth muscle Proteins 0.000 description 1
- 101000591086 Homo sapiens Adenylosuccinate synthetase isozyme 1 Proteins 0.000 description 1
- 101000652415 Homo sapiens Agmatinase, mitochondrial Proteins 0.000 description 1
- 101000662481 Homo sapiens Alanine-tRNA ligase, mitochondrial Proteins 0.000 description 1
- 101000799569 Homo sapiens Alpha- and gamma-adaptin-binding protein p34 Proteins 0.000 description 1
- 101000876352 Homo sapiens Alpha-endosulfine Proteins 0.000 description 1
- 101000740448 Homo sapiens Amiloride-sensitive sodium channel subunit alpha Proteins 0.000 description 1
- 101000890407 Homo sapiens Amyloid beta precursor like protein 1 Proteins 0.000 description 1
- 101000924546 Homo sapiens Angiopoietin-related protein 7 Proteins 0.000 description 1
- 101000780564 Homo sapiens Apical endosomal glycoprotein Proteins 0.000 description 1
- 101000688963 Homo sapiens Apoptosis regulatory protein Siva Proteins 0.000 description 1
- 101000785083 Homo sapiens Atrophin-1 Proteins 0.000 description 1
- 101000933488 Homo sapiens BRI3-binding protein Proteins 0.000 description 1
- 101001135507 Homo sapiens BTB/POZ domain-containing protein KCTD21 Proteins 0.000 description 1
- 101000971073 Homo sapiens Bcl-2-like protein 12 Proteins 0.000 description 1
- 101000971074 Homo sapiens Bcl-2-like protein 13 Proteins 0.000 description 1
- 101000695323 Homo sapiens BolA-like protein 2 Proteins 0.000 description 1
- 101000871850 Homo sapiens Bromodomain-containing protein 2 Proteins 0.000 description 1
- 101000867983 Homo sapiens C5a anaphylatoxin chemotactic receptor 1 Proteins 0.000 description 1
- 101000914211 Homo sapiens CASP8 and FADD-like apoptosis regulator Proteins 0.000 description 1
- 101000749437 Homo sapiens CKLF-like MARVEL transmembrane domain-containing protein 5 Proteins 0.000 description 1
- 101000860484 Homo sapiens COP9 signalosome complex subunit 7a Proteins 0.000 description 1
- 101000961406 Homo sapiens Calcium uniporter regulatory subunit MCUb, mitochondrial Proteins 0.000 description 1
- 101000914337 Homo sapiens Carcinoembryonic antigen-related cell adhesion molecule 3 Proteins 0.000 description 1
- 101000859578 Homo sapiens Carnitine O-palmitoyltransferase 1, brain isoform Proteins 0.000 description 1
- 101000741014 Homo sapiens Caspase-7 Proteins 0.000 description 1
- 101000726696 Homo sapiens Cation channel sperm-associated auxiliary subunit zeta Proteins 0.000 description 1
- 101000869049 Homo sapiens Caveolae-associated protein 1 Proteins 0.000 description 1
- 101000980907 Homo sapiens Cell division cycle-associated protein 3 Proteins 0.000 description 1
- 101000945883 Homo sapiens Cementoblastoma-derived protein 1 Proteins 0.000 description 1
- 101000776477 Homo sapiens Centrosomal protein 43 Proteins 0.000 description 1
- 101000831645 Homo sapiens Ceramide synthase Proteins 0.000 description 1
- 101000914024 Homo sapiens Charged multivesicular body protein 6 Proteins 0.000 description 1
- 101000895818 Homo sapiens Chorionic somatomammotropin hormone 1 Proteins 0.000 description 1
- 101000940558 Homo sapiens Chorionic somatomammotropin hormone-like 1 Proteins 0.000 description 1
- 101000907955 Homo sapiens Chymotrypsin-like elastase family member 2A Proteins 0.000 description 1
- 101000907961 Homo sapiens Chymotrypsin-like elastase family member 2B Proteins 0.000 description 1
- 101000932661 Homo sapiens Coiled-coil domain-containing protein 153 Proteins 0.000 description 1
- 101000868775 Homo sapiens Coiled-coil domain-containing protein 27 Proteins 0.000 description 1
- 101000896972 Homo sapiens Coiled-coil domain-containing protein 28B Proteins 0.000 description 1
- 101000868820 Homo sapiens Coiled-coil domain-containing protein 88B Proteins 0.000 description 1
- 101000777407 Homo sapiens Coiled-coil domain-containing protein 9 Proteins 0.000 description 1
- 101000794265 Homo sapiens Complement C1q tumor necrosis factor-related protein 5 Proteins 0.000 description 1
- 101000859633 Homo sapiens Complexin-3 Proteins 0.000 description 1
- 101000860852 Homo sapiens Coronin-1A Proteins 0.000 description 1
- 101000884183 Homo sapiens Cyclin-F Proteins 0.000 description 1
- 101000753468 Homo sapiens Cysteine protease ATG4B Proteins 0.000 description 1
- 101000856723 Homo sapiens Cytochrome b-245 light chain Proteins 0.000 description 1
- 101000915972 Homo sapiens Cytochrome c oxidase subunit 6A2, mitochondrial Proteins 0.000 description 1
- 101000919466 Homo sapiens Cytochrome c oxidase subunit 7A-related protein, mitochondrial Proteins 0.000 description 1
- 101000838688 Homo sapiens D-aminoacyl-tRNA deacylase 1 Proteins 0.000 description 1
- 101000909250 Homo sapiens DNA (cytosine-5)-methyltransferase 3-like Proteins 0.000 description 1
- 101000800646 Homo sapiens DNA nucleotidylexotransferase Proteins 0.000 description 1
- 101000902539 Homo sapiens DNA polymerase beta Proteins 0.000 description 1
- 101000743929 Homo sapiens DNA repair protein RAD50 Proteins 0.000 description 1
- 101000950194 Homo sapiens Dead end protein homolog 1 Proteins 0.000 description 1
- 101000950829 Homo sapiens Diacylglycerol lipase-beta Proteins 0.000 description 1
- 101000951340 Homo sapiens Dickkopf-related protein 4 Proteins 0.000 description 1
- 101000915416 Homo sapiens Disabled homolog 1 Proteins 0.000 description 1
- 101000870184 Homo sapiens DnaJ homolog subfamily C member 16 Proteins 0.000 description 1
- 101000845897 Homo sapiens DnaJ homolog subfamily C member 4 Proteins 0.000 description 1
- 101001041013 Homo sapiens Doublecortin domain-containing protein 2B Proteins 0.000 description 1
- 101000871985 Homo sapiens Doublesex- and mab-3-related transcription factor C2 Proteins 0.000 description 1
- 101001017467 Homo sapiens Dual specificity protein phosphatase 22 Proteins 0.000 description 1
- 101000816952 Homo sapiens Dynein regulatory complex subunit 5 Proteins 0.000 description 1
- 101001103590 Homo sapiens E3 ubiquitin-protein ligase RNF26 Proteins 0.000 description 1
- 101001012961 Homo sapiens EH domain-binding protein 1-like protein 1 Proteins 0.000 description 1
- 101000812465 Homo sapiens ER lumen protein-retaining receptor 2 Proteins 0.000 description 1
- 101001016384 Homo sapiens Endothelial differentiation-related factor 1 Proteins 0.000 description 1
- 101000946137 Homo sapiens Epididymal-specific lipocalin-12 Proteins 0.000 description 1
- 101001028283 Homo sapiens FERM, ARHGEF and pleckstrin domain-containing protein 2 Proteins 0.000 description 1
- 101001022170 Homo sapiens FYN-binding protein 2 Proteins 0.000 description 1
- 101000749644 Homo sapiens Fermitin family homolog 3 Proteins 0.000 description 1
- 101000912981 Homo sapiens Ferredoxin-2, mitochondrial Proteins 0.000 description 1
- 101000891676 Homo sapiens Flagellum-associated coiled-coil domain-containing protein 1 Proteins 0.000 description 1
- 101001059386 Homo sapiens Formin-like protein 1 Proteins 0.000 description 1
- 101000755879 Homo sapiens Fructose-bisphosphate aldolase A Proteins 0.000 description 1
- 101000788682 Homo sapiens GATA-type zinc finger protein 1 Proteins 0.000 description 1
- 101001058231 Homo sapiens Gamma-enolase Proteins 0.000 description 1
- 101001037132 Homo sapiens Gamma-interferon-inducible lysosomal thiol reductase Proteins 0.000 description 1
- 101001036130 Homo sapiens Glycogen [starch] synthase, muscle Proteins 0.000 description 1
- 101001074265 Homo sapiens Golgi phosphoprotein 3-like Proteins 0.000 description 1
- 101001126622 Homo sapiens Group XIIA secretory phospholipase A2 Proteins 0.000 description 1
- 101000829465 Homo sapiens GrpE protein homolog 2, mitochondrial Proteins 0.000 description 1
- 101000866278 Homo sapiens HLA class II histocompatibility antigen, DO alpha chain Proteins 0.000 description 1
- 101001016856 Homo sapiens Heat shock protein HSP 90-beta Proteins 0.000 description 1
- 101000990188 Homo sapiens Hematopoietic cell signal transducer Proteins 0.000 description 1
- 101000843187 Homo sapiens Histidine-tRNA ligase, cytoplasmic Proteins 0.000 description 1
- 101000696493 Homo sapiens Histidine-tRNA ligase, mitochondrial Proteins 0.000 description 1
- 101001035372 Homo sapiens Histone H2B type F-S Proteins 0.000 description 1
- 101001035024 Homo sapiens Histone deacetylase 1 Proteins 0.000 description 1
- 101001032113 Homo sapiens Histone deacetylase 7 Proteins 0.000 description 1
- 101001048457 Homo sapiens Homeobox and leucine zipper protein Homez Proteins 0.000 description 1
- 101000777670 Homo sapiens Hsp90 co-chaperone Cdc37 Proteins 0.000 description 1
- 101001011420 Homo sapiens IQ domain-containing protein C Proteins 0.000 description 1
- 101000840263 Homo sapiens IgLON family member 5 Proteins 0.000 description 1
- 101000840257 Homo sapiens Immunoglobulin kappa constant Proteins 0.000 description 1
- 101001044370 Homo sapiens Immunoglobulin superfamily member 23 Proteins 0.000 description 1
- 101001010610 Homo sapiens Immunoglobulin-like domain-containing receptor 1 Proteins 0.000 description 1
- 101001033704 Homo sapiens Insulin, isoform 2 Proteins 0.000 description 1
- 101001000784 Homo sapiens Integral membrane protein GPR137 Proteins 0.000 description 1
- 101001035237 Homo sapiens Integrin alpha-D Proteins 0.000 description 1
- 101000960337 Homo sapiens Intercellular adhesion molecule 5 Proteins 0.000 description 1
- 101000959820 Homo sapiens Interferon alpha-1/13 Proteins 0.000 description 1
- 101000959794 Homo sapiens Interferon alpha-2 Proteins 0.000 description 1
- 101001010600 Homo sapiens Interleukin-12 subunit alpha Proteins 0.000 description 1
- 101001010842 Homo sapiens Intraflagellar transport protein 57 homolog Proteins 0.000 description 1
- 101001012154 Homo sapiens Inverted formin-2 Proteins 0.000 description 1
- 101001139016 Homo sapiens Kin of IRRE-like protein 2 Proteins 0.000 description 1
- 101001039223 Homo sapiens Leucine-rich repeat and fibronectin type-III domain-containing protein 3 Proteins 0.000 description 1
- 101001017847 Homo sapiens Leucine-rich repeat, immunoglobulin-like domain and transmembrane domain-containing protein 3 Proteins 0.000 description 1
- 101001039170 Homo sapiens Leucine-rich repeat-containing protein 23 Proteins 0.000 description 1
- 101000605074 Homo sapiens Lipocalin-like 1 protein Proteins 0.000 description 1
- 101000780202 Homo sapiens Long-chain-fatty-acid-CoA ligase 6 Proteins 0.000 description 1
- 101001038510 Homo sapiens Ly6/PLAUR domain-containing protein 4 Proteins 0.000 description 1
- 101000997845 Homo sapiens Lysophospholipase D GDPD3 Proteins 0.000 description 1
- 101001039669 Homo sapiens Lysophospholipid acyltransferase 5 Proteins 0.000 description 1
- 101001014572 Homo sapiens MARCKS-related protein Proteins 0.000 description 1
- 101000582864 Homo sapiens Mediator of RNA polymerase II transcription subunit 7 Proteins 0.000 description 1
- 101001003205 Homo sapiens Methylosome subunit pICln Proteins 0.000 description 1
- 101001018294 Homo sapiens Microtubule-associated serine/threonine-protein kinase 3 Proteins 0.000 description 1
- 101001018298 Homo sapiens Microtubule-associated serine/threonine-protein kinase 4 Proteins 0.000 description 1
- 101000628925 Homo sapiens Mitochondrial intermediate peptidase Proteins 0.000 description 1
- 101001005602 Homo sapiens Mitogen-activated protein kinase kinase kinase 11 Proteins 0.000 description 1
- 101001055051 Homo sapiens Mpv17-like protein 2 Proteins 0.000 description 1
- 101000798124 Homo sapiens Multifunctional methyltransferase subunit TRM112-like protein Proteins 0.000 description 1
- 101000955263 Homo sapiens Multiple epidermal growth factor-like domains protein 6 Proteins 0.000 description 1
- 101000624869 Homo sapiens Myb/SANT-like DNA-binding domain-containing protein 2 Proteins 0.000 description 1
- 101001013159 Homo sapiens Myeloid leukemia factor 2 Proteins 0.000 description 1
- 101000958741 Homo sapiens Myosin-6 Proteins 0.000 description 1
- 101000588448 Homo sapiens N-acetylglucosamine-6-phosphate deacetylase Proteins 0.000 description 1
- 101001111244 Homo sapiens NADH dehydrogenase [ubiquinone] 1 alpha subcomplex subunit 2 Proteins 0.000 description 1
- 101000998185 Homo sapiens NF-kappa-B inhibitor delta Proteins 0.000 description 1
- 101000573401 Homo sapiens NFATC2-interacting protein Proteins 0.000 description 1
- 101001109501 Homo sapiens NKG2-D type II integral membrane protein Proteins 0.000 description 1
- 101000978730 Homo sapiens Nephrin Proteins 0.000 description 1
- 101000995157 Homo sapiens Netrin-3 Proteins 0.000 description 1
- 101000973259 Homo sapiens Neurogranin Proteins 0.000 description 1
- 101000583239 Homo sapiens Nicotinate-nucleotide pyrophosphorylase [carboxylating] Proteins 0.000 description 1
- 101001008394 Homo sapiens Nucleobindin-1 Proteins 0.000 description 1
- 101000586302 Homo sapiens Oncostatin-M-specific receptor subunit beta Proteins 0.000 description 1
- 101000579851 Homo sapiens PC-esterase domain-containing protein 1A Proteins 0.000 description 1
- 101001071236 Homo sapiens PHD finger protein 19 Proteins 0.000 description 1
- 101001114076 Homo sapiens Paladin Proteins 0.000 description 1
- 101001134728 Homo sapiens Pecanex-like protein 3 Proteins 0.000 description 1
- 101000914053 Homo sapiens Peptidyl-prolyl cis-trans isomerase FKBP2 Proteins 0.000 description 1
- 101000619805 Homo sapiens Peroxiredoxin-5, mitochondrial Proteins 0.000 description 1
- 101000890327 Homo sapiens Peroxynitrite isomerase THAP4 Proteins 0.000 description 1
- 101000730611 Homo sapiens Pleckstrin homology domain-containing family G member 5 Proteins 0.000 description 1
- 101000730616 Homo sapiens Pleckstrin homology domain-containing family G member 6 Proteins 0.000 description 1
- 101000609211 Homo sapiens Polyadenylate-binding protein 2 Proteins 0.000 description 1
- 101001109588 Homo sapiens Polynucleotide 5'-hydroxyl-kinase NOL9 Proteins 0.000 description 1
- 101001049831 Homo sapiens Potassium channel subfamily K member 4 Proteins 0.000 description 1
- 101001049824 Homo sapiens Potassium channel subfamily K member 7 Proteins 0.000 description 1
- 101001125496 Homo sapiens Pre-mRNA-processing factor 19 Proteins 0.000 description 1
- 101000612282 Homo sapiens Prenylcysteine oxidase-like Proteins 0.000 description 1
- 101000864678 Homo sapiens Probable ATP-dependent RNA helicase DHX37 Proteins 0.000 description 1
- 101000872867 Homo sapiens Probable E3 ubiquitin-protein ligase HECTD4 Proteins 0.000 description 1
- 101000857759 Homo sapiens Probable G-protein coupled receptor 162 Proteins 0.000 description 1
- 101000919183 Homo sapiens Probable carboxypeptidase X1 Proteins 0.000 description 1
- 101001129654 Homo sapiens Prohibitin-2 Proteins 0.000 description 1
- 101000619116 Homo sapiens Proline-rich protein 12 Proteins 0.000 description 1
- 101000741721 Homo sapiens Proline-rich protein 29 Proteins 0.000 description 1
- 101001090551 Homo sapiens Proline-rich protein 5-like Proteins 0.000 description 1
- 101001135402 Homo sapiens Prostaglandin-H2 D-isomerase Proteins 0.000 description 1
- 101000740825 Homo sapiens Protein C10 Proteins 0.000 description 1
- 101001038314 Homo sapiens Protein ERGIC-53-like Proteins 0.000 description 1
- 101000854605 Homo sapiens Protein FAM167B Proteins 0.000 description 1
- 101000918449 Homo sapiens Protein FAM220A Proteins 0.000 description 1
- 101000848912 Homo sapiens Protein FAM71B Proteins 0.000 description 1
- 101000757216 Homo sapiens Protein arginine N-methyltransferase 1 Proteins 0.000 description 1
- 101000688343 Homo sapiens Protein phosphatase 1 regulatory subunit 14B Proteins 0.000 description 1
- 101001123077 Homo sapiens Protein phosphatase 1 regulatory subunit 3E Proteins 0.000 description 1
- 101000769159 Homo sapiens Protein yippee-like 3 Proteins 0.000 description 1
- 101000599577 Homo sapiens Putative transmembrane protein INAFM1 Proteins 0.000 description 1
- 101000608194 Homo sapiens Pyrin domain-containing protein 1 Proteins 0.000 description 1
- 101001129467 Homo sapiens Pyroglutamyl-peptidase 1-like protein Proteins 0.000 description 1
- 101000708591 Homo sapiens RAB11-binding protein RELCH Proteins 0.000 description 1
- 101000848502 Homo sapiens RNA polymerase II-associated protein 3 Proteins 0.000 description 1
- 101001076726 Homo sapiens RNA-binding protein 33 Proteins 0.000 description 1
- 101001130286 Homo sapiens Rab GTPase-binding effector protein 2 Proteins 0.000 description 1
- 101001061807 Homo sapiens Rab-like protein 6 Proteins 0.000 description 1
- 101000848724 Homo sapiens Rap guanine nucleotide exchange factor 3 Proteins 0.000 description 1
- 101000686246 Homo sapiens Ras-related protein R-Ras Proteins 0.000 description 1
- 101000635773 Homo sapiens Receptor-transporting protein 5 Proteins 0.000 description 1
- 101001091990 Homo sapiens Rho GTPase-activating protein 24 Proteins 0.000 description 1
- 101001132646 Homo sapiens Ribonucleoprotein PTB-binding 1 Proteins 0.000 description 1
- 101001023680 Homo sapiens Ribosomal RNA small subunit methyltransferase NEP1 Proteins 0.000 description 1
- 101000945093 Homo sapiens Ribosomal protein S6 kinase alpha-4 Proteins 0.000 description 1
- 101000694338 Homo sapiens RuvB-like 2 Proteins 0.000 description 1
- 101000616753 Homo sapiens SIGLEC family-like protein 1 Proteins 0.000 description 1
- 101000825291 Homo sapiens SPRY domain-containing SOCS box protein 2 Proteins 0.000 description 1
- 101000693367 Homo sapiens SUMO-activating enzyme subunit 1 Proteins 0.000 description 1
- 101000740417 Homo sapiens Secretory carrier-associated membrane protein 2 Proteins 0.000 description 1
- 101000628693 Homo sapiens Serine/threonine-protein kinase 25 Proteins 0.000 description 1
- 101000607339 Homo sapiens Serine/threonine-protein kinase ULK3 Proteins 0.000 description 1
- 101001068219 Homo sapiens Serine/threonine-protein phosphatase 4 catalytic subunit Proteins 0.000 description 1
- 101000836875 Homo sapiens Sialic acid-binding Ig-like lectin 12 Proteins 0.000 description 1
- 101000863882 Homo sapiens Sialic acid-binding Ig-like lectin 7 Proteins 0.000 description 1
- 101000836906 Homo sapiens Signal-induced proliferation-associated protein 1 Proteins 0.000 description 1
- 101000832643 Homo sapiens Small ubiquitin-related modifier 4 Proteins 0.000 description 1
- 101000693993 Homo sapiens Sodium channel protein type 4 subunit alpha Proteins 0.000 description 1
- 101000629575 Homo sapiens Spermatogenesis-associated protein 32 Proteins 0.000 description 1
- 101000824996 Homo sapiens Spermatogenesis-associated serine-rich protein 1 Proteins 0.000 description 1
- 101000693262 Homo sapiens Sphingosine 1-phosphate receptor 2 Proteins 0.000 description 1
- 101000651021 Homo sapiens Splicing factor, arginine/serine-rich 19 Proteins 0.000 description 1
- 101000851700 Homo sapiens Steroid hormone receptor ERR1 Proteins 0.000 description 1
- 101000825820 Homo sapiens Structure-specific endonuclease subunit SLX1 Proteins 0.000 description 1
- 101000625859 Homo sapiens T-box transcription factor TBX6 Proteins 0.000 description 1
- 101000788505 Homo sapiens TBC1 domain family member 24 Proteins 0.000 description 1
- 101000596739 Homo sapiens Testis-expressed protein 29 Proteins 0.000 description 1
- 101000794197 Homo sapiens Testis-specific serine/threonine-protein kinase 3 Proteins 0.000 description 1
- 101000928780 Homo sapiens Trans-1,2-dihydrobenzene-1,2-diol dehydrogenase Proteins 0.000 description 1
- 101000843572 Homo sapiens Transcription factor HES-2 Proteins 0.000 description 1
- 101000680088 Homo sapiens Transmembrane and coiled-coil domain-containing protein 6 Proteins 0.000 description 1
- 101000852857 Homo sapiens Transmembrane protein 109 Proteins 0.000 description 1
- 101000640721 Homo sapiens Transmembrane protein 132A Proteins 0.000 description 1
- 101000596309 Homo sapiens Transmembrane protein 151B Proteins 0.000 description 1
- 101000831807 Homo sapiens Transmembrane protein 234 Proteins 0.000 description 1
- 101000798550 Homo sapiens Transmembrane protein 239 Proteins 0.000 description 1
- 101000795107 Homo sapiens Triggering receptor expressed on myeloid cells 1 Proteins 0.000 description 1
- 101000801742 Homo sapiens Triosephosphate isomerase Proteins 0.000 description 1
- 101000795210 Homo sapiens Tripartite motif-containing protein 72 Proteins 0.000 description 1
- 101000834944 Homo sapiens Tubulin epsilon and delta complex protein 2 Proteins 0.000 description 1
- 101000801234 Homo sapiens Tumor necrosis factor receptor superfamily member 18 Proteins 0.000 description 1
- 101000830816 Homo sapiens Tumor protein p63-regulated gene 1-like protein Proteins 0.000 description 1
- 101000608653 Homo sapiens UbiA prenyltransferase domain-containing protein 1 Proteins 0.000 description 1
- 101000748159 Homo sapiens Ubiquitin carboxyl-terminal hydrolase 35 Proteins 0.000 description 1
- 101000643890 Homo sapiens Ubiquitin carboxyl-terminal hydrolase 5 Proteins 0.000 description 1
- 101000858880 Homo sapiens Uncharacterized protein C20orf141 Proteins 0.000 description 1
- 101001032312 Homo sapiens Uncharacterized protein IRF1-AS1 Proteins 0.000 description 1
- 101000590277 Homo sapiens Uridine diphosphate glucose pyrophosphatase NUDT22 Proteins 0.000 description 1
- 101000743490 Homo sapiens V-set and immunoglobulin domain-containing protein 2 Proteins 0.000 description 1
- 101000805729 Homo sapiens V-type proton ATPase 116 kDa subunit a 1 Proteins 0.000 description 1
- 101000641419 Homo sapiens V-type proton ATPase 16 kDa proteolipid subunit c Proteins 0.000 description 1
- 101000782382 Homo sapiens Vacuolar protein sorting-associated protein 16 homolog Proteins 0.000 description 1
- 101000742579 Homo sapiens Vascular endothelial growth factor B Proteins 0.000 description 1
- 101000803751 Homo sapiens WD repeat-containing protein 55 Proteins 0.000 description 1
- 101000804817 Homo sapiens WD repeat-containing protein WRAP73 Proteins 0.000 description 1
- 101000723821 Homo sapiens Zinc finger CCCH domain-containing protein 18 Proteins 0.000 description 1
- 101000916529 Homo sapiens Zinc finger and BTB domain-containing protein 42 Proteins 0.000 description 1
- 101000723890 Homo sapiens Zinc finger matrin-type protein 2 Proteins 0.000 description 1
- 101000781876 Homo sapiens Zinc finger protein 518A Proteins 0.000 description 1
- 101000785585 Homo sapiens Zinc finger protein 843 Proteins 0.000 description 1
- 101000633045 Homo sapiens Zinc finger protein SNAI3 Proteins 0.000 description 1
- 101000991054 Homo sapiens [F-actin]-monooxygenase MICAL3 Proteins 0.000 description 1
- 101001098805 Homo sapiens cAMP-specific 3',5'-cyclic phosphodiesterase 4A Proteins 0.000 description 1
- 101000988423 Homo sapiens cAMP-specific 3',5'-cyclic phosphodiesterase 4C Proteins 0.000 description 1
- 101000772567 Homo sapiens tRNA 2'-phosphotransferase 1 Proteins 0.000 description 1
- 102100031568 Hsp90 co-chaperone Cdc37 Human genes 0.000 description 1
- 102000039989 IL-17 family Human genes 0.000 description 1
- 108091069193 IL-17 family Proteins 0.000 description 1
- 108010007666 IMP cyclohydrolase Proteins 0.000 description 1
- 102100029841 IQ domain-containing protein C Human genes 0.000 description 1
- 102000009438 IgE Receptors Human genes 0.000 description 1
- 108010073816 IgE Receptors Proteins 0.000 description 1
- 102100029612 IgLON family member 5 Human genes 0.000 description 1
- 101150018316 Igsf3 gene Proteins 0.000 description 1
- 102000037982 Immune checkpoint proteins Human genes 0.000 description 1
- 108091008036 Immune checkpoint proteins Proteins 0.000 description 1
- 206010061598 Immunodeficiency Diseases 0.000 description 1
- 208000029462 Immunodeficiency disease Diseases 0.000 description 1
- 102100029572 Immunoglobulin kappa constant Human genes 0.000 description 1
- 102100022515 Immunoglobulin superfamily member 23 Human genes 0.000 description 1
- 102100022519 Immunoglobulin superfamily member 3 Human genes 0.000 description 1
- 102100030713 Immunoglobulin-like domain-containing receptor 1 Human genes 0.000 description 1
- 102100020796 Inosine 5'-monophosphate cyclohydrolase Human genes 0.000 description 1
- 102100039090 Insulin, isoform 2 Human genes 0.000 description 1
- 102100035568 Integral membrane protein GPR137 Human genes 0.000 description 1
- 102100039904 Integrin alpha-D Human genes 0.000 description 1
- 102100039919 Intercellular adhesion molecule 5 Human genes 0.000 description 1
- 102100040019 Interferon alpha-1/13 Human genes 0.000 description 1
- 102100040018 Interferon alpha-2 Human genes 0.000 description 1
- 108010050904 Interferons Proteins 0.000 description 1
- 102000014150 Interferons Human genes 0.000 description 1
- 108091029795 Intergenic region Proteins 0.000 description 1
- 102100030698 Interleukin-12 subunit alpha Human genes 0.000 description 1
- 102100029996 Intraflagellar transport protein 57 homolog Human genes 0.000 description 1
- 102100030075 Inverted formin-2 Human genes 0.000 description 1
- 208000008839 Kidney Neoplasms Diseases 0.000 description 1
- 102100020690 Kin of IRRE-like protein 2 Human genes 0.000 description 1
- 101000578717 Klebsiella pneumoniae Mannose-1-phosphate guanylyltransferase Proteins 0.000 description 1
- 239000002144 L01XE18 - Ruxolitinib Substances 0.000 description 1
- 101000820218 Lactococcus phage LL-H Uncharacterized protein ORF5 Proteins 0.000 description 1
- 108090001090 Lectins Proteins 0.000 description 1
- 102000004856 Lectins Human genes 0.000 description 1
- 102100040703 Leucine-rich repeat and fibronectin type-III domain-containing protein 3 Human genes 0.000 description 1
- 102100033290 Leucine-rich repeat, immunoglobulin-like domain and transmembrane domain-containing protein 3 Human genes 0.000 description 1
- 102100040691 Leucine-rich repeat-containing protein 23 Human genes 0.000 description 1
- 102100038264 Lipocalin-like 1 protein Human genes 0.000 description 1
- 102100034337 Long-chain-fatty-acid-CoA ligase 6 Human genes 0.000 description 1
- 102100040279 Ly6/PLAUR domain-containing protein 4 Human genes 0.000 description 1
- 101000759330 Lymantria dispar multicapsid nuclear polyhedrosis virus Uncharacterized protein in LEF8-FP intergenic region Proteins 0.000 description 1
- 102100033440 Lysophospholipase D GDPD3 Human genes 0.000 description 1
- 102100040944 Lysophospholipid acyltransferase 5 Human genes 0.000 description 1
- 102100032514 MARCKS-related protein Human genes 0.000 description 1
- 102000044235 MICAL3 Human genes 0.000 description 1
- 101000626905 Marchantia polymorpha Uncharacterized 3.8 kDa protein in ycf12-psaM intergenic region Proteins 0.000 description 1
- 101000788492 Marchantia polymorpha Uncharacterized mitochondrial protein ymf28 Proteins 0.000 description 1
- 102100030235 Mediator of RNA polymerase II transcription subunit 7 Human genes 0.000 description 1
- 102100029357 Membrane frizzled-related protein Human genes 0.000 description 1
- 208000002030 Merkel cell carcinoma Diseases 0.000 description 1
- 206010027406 Mesothelioma Diseases 0.000 description 1
- 102100020846 Methylosome subunit pICln Human genes 0.000 description 1
- 108700011259 MicroRNAs Proteins 0.000 description 1
- 102100033251 Microtubule-associated serine/threonine-protein kinase 3 Human genes 0.000 description 1
- 102100033252 Microtubule-associated serine/threonine-protein kinase 4 Human genes 0.000 description 1
- 102100026934 Mitochondrial intermediate peptidase Human genes 0.000 description 1
- 102100025207 Mitogen-activated protein kinase kinase kinase 11 Human genes 0.000 description 1
- 102100026903 Mpv17-like protein 2 Human genes 0.000 description 1
- 206010028080 Mucocutaneous candidiasis Diseases 0.000 description 1
- 102100032242 Multifunctional methyltransferase subunit TRM112-like protein Human genes 0.000 description 1
- 102100039005 Multiple epidermal growth factor-like domains protein 6 Human genes 0.000 description 1
- 208000034578 Multiple myelomas Diseases 0.000 description 1
- 101100407308 Mus musculus Pdcd1lg2 gene Proteins 0.000 description 1
- 102100023248 Myb/SANT-like DNA-binding domain-containing protein 2 Human genes 0.000 description 1
- 102100029687 Myeloid leukemia factor 2 Human genes 0.000 description 1
- 102100038319 Myosin-6 Human genes 0.000 description 1
- 102100031324 N-acetylglucosamine-6-phosphate deacetylase Human genes 0.000 description 1
- 102100023950 NADH dehydrogenase [ubiquinone] 1 alpha subcomplex subunit 2 Human genes 0.000 description 1
- 108010057466 NF-kappa B Proteins 0.000 description 1
- 102000003945 NF-kappa B Human genes 0.000 description 1
- 102100033103 NF-kappa-B inhibitor delta Human genes 0.000 description 1
- 102100026380 NFATC2-interacting protein Human genes 0.000 description 1
- 102100022680 NKG2-D type II integral membrane protein Human genes 0.000 description 1
- 102100023195 Nephrin Human genes 0.000 description 1
- 102100034393 Netrin-3 Human genes 0.000 description 1
- 206010029266 Neuroendocrine carcinoma of the skin Diseases 0.000 description 1
- 102100022159 Neurogranin Human genes 0.000 description 1
- 101000914065 Neurospora crassa (strain ATCC 24698 / 74-OR23-1A / CBS 708.71 / DSM 1257 / FGSC 987) FK506-binding protein 2 Proteins 0.000 description 1
- 102100030830 Nicotinate-nucleotide pyrophosphorylase [carboxylating] Human genes 0.000 description 1
- 208000015914 Non-Hodgkin lymphomas Diseases 0.000 description 1
- 208000010505 Nose Neoplasms Diseases 0.000 description 1
- 102100027439 Nucleobindin-1 Human genes 0.000 description 1
- 230000004989 O-glycosylation Effects 0.000 description 1
- 101150084972 OPALIN gene Proteins 0.000 description 1
- 101150003799 ORF110 gene Proteins 0.000 description 1
- 101150024472 ORF146 gene Proteins 0.000 description 1
- 101150083029 ORF147 gene Proteins 0.000 description 1
- 101150104094 ORF52 gene Proteins 0.000 description 1
- 101150071814 ORF86 gene Proteins 0.000 description 1
- 102100030098 Oncostatin-M-specific receptor subunit beta Human genes 0.000 description 1
- 102100030153 Opalin Human genes 0.000 description 1
- 101100389785 Orgyia pseudotsugata multicapsid polyhedrosis virus ETM gene Proteins 0.000 description 1
- 101100263767 Orgyia pseudotsugata multicapsid polyhedrosis virus GP16 gene Proteins 0.000 description 1
- 101100259906 Orgyia pseudotsugata multicapsid polyhedrosis virus IE1 gene Proteins 0.000 description 1
- 101100295700 Orgyia pseudotsugata multicapsid polyhedrosis virus ODVP6E gene Proteins 0.000 description 1
- 101100028042 Orgyia pseudotsugata multicapsid polyhedrosis virus OPEP-3 gene Proteins 0.000 description 1
- 101100317133 Orgyia pseudotsugata multicapsid polyhedrosis virus p91 gene Proteins 0.000 description 1
- 206010033128 Ovarian cancer Diseases 0.000 description 1
- 206010061535 Ovarian neoplasm Diseases 0.000 description 1
- 102100027496 PC-esterase domain-containing protein 1A Human genes 0.000 description 1
- 102100036870 PHD finger protein 19 Human genes 0.000 description 1
- 229930012538 Paclitaxel Natural products 0.000 description 1
- 102100023224 Paladin Human genes 0.000 description 1
- 229930040373 Paraformaldehyde Natural products 0.000 description 1
- 102100027370 Parathymosin Human genes 0.000 description 1
- 102100033317 Pecanex-like protein 3 Human genes 0.000 description 1
- 102000035195 Peptidases Human genes 0.000 description 1
- 108091005804 Peptidases Proteins 0.000 description 1
- 102100026408 Peptidyl-prolyl cis-trans isomerase FKBP2 Human genes 0.000 description 1
- 208000027190 Peripheral T-cell lymphomas Diseases 0.000 description 1
- 102100022078 Peroxiredoxin-5, mitochondrial Human genes 0.000 description 1
- 102100040041 Peroxynitrite isomerase THAP4 Human genes 0.000 description 1
- ISWSIDIOOBJBQZ-UHFFFAOYSA-N Phenol Chemical compound OC1=CC=CC=C1 ISWSIDIOOBJBQZ-UHFFFAOYSA-N 0.000 description 1
- 206010035226 Plasma cell myeloma Diseases 0.000 description 1
- 102100032589 Pleckstrin homology domain-containing family G member 5 Human genes 0.000 description 1
- 102100032591 Pleckstrin homology domain-containing family G member 6 Human genes 0.000 description 1
- 101100481711 Pneumococcus phage Dp-1 TMP gene Proteins 0.000 description 1
- 102100039427 Polyadenylate-binding protein 2 Human genes 0.000 description 1
- 102100022739 Polynucleotide 5'-hydroxyl-kinase NOL9 Human genes 0.000 description 1
- 101000626911 Porphyra purpurea Putative cytochrome c-type biogenesis protein DbsD-like Proteins 0.000 description 1
- 101000736241 Porphyra purpurea Uncharacterized monothiol glutaredoxin ycf64 Proteins 0.000 description 1
- 101000828198 Porphyra purpurea Uncharacterized protein ycf56 Proteins 0.000 description 1
- 102100023205 Potassium channel subfamily K member 4 Human genes 0.000 description 1
- 102100023201 Potassium channel subfamily K member 7 Human genes 0.000 description 1
- 102100029522 Pre-mRNA-processing factor 19 Human genes 0.000 description 1
- 102100041014 Prenylcysteine oxidase-like Human genes 0.000 description 1
- 102100030093 Probable ATP-dependent RNA helicase DHX37 Human genes 0.000 description 1
- 102100034679 Probable E3 ubiquitin-protein ligase HECTD4 Human genes 0.000 description 1
- 102100025358 Probable G-protein coupled receptor 162 Human genes 0.000 description 1
- 102100029401 Probable carboxypeptidase X1 Human genes 0.000 description 1
- 102100024622 Proenkephalin-B Human genes 0.000 description 1
- 108700030875 Programmed Cell Death 1 Ligand 2 Proteins 0.000 description 1
- 102100031156 Prohibitin-2 Human genes 0.000 description 1
- 102100022637 Proline-rich protein 12 Human genes 0.000 description 1
- 102100038775 Proline-rich protein 29 Human genes 0.000 description 1
- 102100034734 Proline-rich protein 5-like Human genes 0.000 description 1
- 208000033759 Prolymphocytic T-Cell Leukemia Diseases 0.000 description 1
- 208000031486 Properdin deficiency Diseases 0.000 description 1
- 102100033279 Prostaglandin-H2 D-isomerase Human genes 0.000 description 1
- 102100038957 Protein C10 Human genes 0.000 description 1
- 102100040251 Protein ERGIC-53-like Human genes 0.000 description 1
- 102100020936 Protein FAM167B Human genes 0.000 description 1
- 102100029123 Protein FAM220A Human genes 0.000 description 1
- 102100034513 Protein FAM71B Human genes 0.000 description 1
- 108091008611 Protein Kinase B Proteins 0.000 description 1
- 102100022985 Protein arginine N-methyltransferase 1 Human genes 0.000 description 1
- 102100024146 Protein phosphatase 1 regulatory subunit 14B Human genes 0.000 description 1
- 102100028562 Protein phosphatase 1 regulatory subunit 3E Human genes 0.000 description 1
- 102100028368 Protein yippee-like 3 Human genes 0.000 description 1
- 101000764086 Pseudomonas stutzeri UPF0339 protein in ptx operon 5'region Proteins 0.000 description 1
- 201000004681 Psoriasis Diseases 0.000 description 1
- 102100026654 Putative adrenomedullin-5-like protein Human genes 0.000 description 1
- 102100037973 Putative transmembrane protein INAFM1 Human genes 0.000 description 1
- 102100039892 Pyrin domain-containing protein 1 Human genes 0.000 description 1
- 102100031114 Pyroglutamyl-peptidase 1-like protein Human genes 0.000 description 1
- 102100032798 RAB11-binding protein RELCH Human genes 0.000 description 1
- 102100034617 RNA polymerase II-associated protein 3 Human genes 0.000 description 1
- 102100025869 RNA-binding protein 33 Human genes 0.000 description 1
- 238000003559 RNA-seq method Methods 0.000 description 1
- 102100031524 Rab GTPase-binding effector protein 2 Human genes 0.000 description 1
- 102100029618 Rab-like protein 6 Human genes 0.000 description 1
- 102100034584 Rap guanine nucleotide exchange factor 3 Human genes 0.000 description 1
- 102100024683 Ras-related protein R-Ras Human genes 0.000 description 1
- 102100022308 Ras-related protein Rab-3A Human genes 0.000 description 1
- 102100030855 Receptor-transporting protein 5 Human genes 0.000 description 1
- 206010038389 Renal cancer Diseases 0.000 description 1
- 102100035741 Rho GTPase-activating protein 24 Human genes 0.000 description 1
- 108010053823 Rho Guanine Nucleotide Exchange Factors Proteins 0.000 description 1
- 102100021708 Rho guanine nucleotide exchange factor 1 Human genes 0.000 description 1
- 102100033913 Ribonucleoprotein PTB-binding 1 Human genes 0.000 description 1
- 102100035491 Ribosomal RNA small subunit methyltransferase NEP1 Human genes 0.000 description 1
- 102100033644 Ribosomal protein S6 kinase alpha-4 Human genes 0.000 description 1
- 102100027092 RuvB-like 2 Human genes 0.000 description 1
- 102100034187 S-methyl-5'-thioadenosine phosphorylase Human genes 0.000 description 1
- 101710136206 S-methyl-5'-thioadenosine phosphorylase Proteins 0.000 description 1
- 108091005487 SCARB1 Proteins 0.000 description 1
- 102100021843 SIGLEC family-like protein 1 Human genes 0.000 description 1
- 108091006595 SLC15A3 Proteins 0.000 description 1
- 108091006751 SLC22A17 Proteins 0.000 description 1
- 108091006551 SLC29A1 Proteins 0.000 description 1
- 108091006950 SLC35B2 Proteins 0.000 description 1
- 108091007579 SLC48A1 Proteins 0.000 description 1
- 102100022330 SPRY domain-containing SOCS box protein 2 Human genes 0.000 description 1
- 102100025809 SUMO-activating enzyme subunit 1 Human genes 0.000 description 1
- 101000857460 Saccharomyces cerevisiae (strain ATCC 204508 / S288c) RuvB-like protein 2 Proteins 0.000 description 1
- 102100037118 Scavenger receptor class B member 1 Human genes 0.000 description 1
- 101100279513 Schizosaccharomyces pombe (strain 972 / ATCC 24843) sum1 gene Proteins 0.000 description 1
- 102100037233 Secretory carrier-associated membrane protein 2 Human genes 0.000 description 1
- 102100026737 Serine/threonine-protein kinase 25 Human genes 0.000 description 1
- 102100039985 Serine/threonine-protein kinase ULK3 Human genes 0.000 description 1
- 102100034492 Serine/threonine-protein phosphatase 4 catalytic subunit Human genes 0.000 description 1
- 102100029946 Sialic acid-binding Ig-like lectin 7 Human genes 0.000 description 1
- 102100027163 Signal-induced proliferation-associated protein 1 Human genes 0.000 description 1
- 102100024535 Small ubiquitin-related modifier 4 Human genes 0.000 description 1
- 102100027195 Sodium channel protein type 4 subunit alpha Human genes 0.000 description 1
- 102100021485 Solute carrier family 15 member 3 Human genes 0.000 description 1
- 102100021542 Solute carrier family 22 member 17 Human genes 0.000 description 1
- 102100026838 Spermatogenesis-associated protein 32 Human genes 0.000 description 1
- 102100022426 Spermatogenesis-associated serine-rich protein 1 Human genes 0.000 description 1
- 102100025749 Sphingosine 1-phosphate receptor 2 Human genes 0.000 description 1
- 102100027779 Splicing factor, arginine/serine-rich 19 Human genes 0.000 description 1
- 102100036832 Steroid hormone receptor ERR1 Human genes 0.000 description 1
- 102100022826 Structure-specific endonuclease subunit SLX1 Human genes 0.000 description 1
- 102100026088 Succinate dehydrogenase assembly factor 1, mitochondrial Human genes 0.000 description 1
- 101710125889 Succinate dehydrogenase assembly factor 1, mitochondrial Proteins 0.000 description 1
- 102100023983 Sulfotransferase 1A3 Human genes 0.000 description 1
- 230000006044 T cell activation Effects 0.000 description 1
- 208000031673 T-Cell Cutaneous Lymphoma Diseases 0.000 description 1
- 208000031672 T-Cell Peripheral Lymphoma Diseases 0.000 description 1
- 102100024751 T-box transcription factor TBX6 Human genes 0.000 description 1
- 229940126547 T-cell immunoglobulin mucin-3 Drugs 0.000 description 1
- 208000026651 T-cell prolymphocytic leukemia Diseases 0.000 description 1
- 108091005700 TAS1R1 Proteins 0.000 description 1
- 102100025233 TBC1 domain family member 24 Human genes 0.000 description 1
- 102100035941 Taste receptor type 1 member 1 Human genes 0.000 description 1
- 102100035103 Testis-expressed protein 29 Human genes 0.000 description 1
- 102100030168 Testis-specific serine/threonine-protein kinase 3 Human genes 0.000 description 1
- 208000024770 Thyroid neoplasm Diseases 0.000 description 1
- 239000004012 Tofacitinib Substances 0.000 description 1
- 102100036502 Trans-1,2-dihydrobenzene-1,2-diol dehydrogenase Human genes 0.000 description 1
- 102100030772 Transcription factor HES-2 Human genes 0.000 description 1
- 102100022242 Transmembrane and coiled-coil domain-containing protein 6 Human genes 0.000 description 1
- 102100036708 Transmembrane protein 109 Human genes 0.000 description 1
- 102100033852 Transmembrane protein 132A Human genes 0.000 description 1
- 102100035061 Transmembrane protein 151B Human genes 0.000 description 1
- 102100024194 Transmembrane protein 234 Human genes 0.000 description 1
- 102100032474 Transmembrane protein 239 Human genes 0.000 description 1
- 101000980798 Trieres chinensis Cytochrome c biogenesis protein Ccs1 Proteins 0.000 description 1
- 102100029681 Triggering receptor expressed on myeloid cells 1 Human genes 0.000 description 1
- 102100033598 Triosephosphate isomerase Human genes 0.000 description 1
- 102100029655 Tripartite motif-containing protein 72 Human genes 0.000 description 1
- 102100026157 Tubulin epsilon and delta complex protein 2 Human genes 0.000 description 1
- 108010078814 Tumor Suppressor Protein p53 Proteins 0.000 description 1
- 102100033728 Tumor necrosis factor receptor superfamily member 18 Human genes 0.000 description 1
- 102100024947 Tumor protein p63-regulated gene 1-like protein Human genes 0.000 description 1
- 102100039547 UbiA prenyltransferase domain-containing protein 1 Human genes 0.000 description 1
- 102100040048 Ubiquitin carboxyl-terminal hydrolase 35 Human genes 0.000 description 1
- 102100021017 Ubiquitin carboxyl-terminal hydrolase 5 Human genes 0.000 description 1
- 102100028038 Uncharacterized protein C20orf141 Human genes 0.000 description 1
- 102100038253 Uncharacterized protein IRF1-AS1 Human genes 0.000 description 1
- 101710173506 Uncharacterized protein ycf39 Proteins 0.000 description 1
- 102100032304 Uridine diphosphate glucose pyrophosphatase NUDT22 Human genes 0.000 description 1
- 208000006105 Uterine Cervical Neoplasms Diseases 0.000 description 1
- 102100038295 V-set and immunoglobulin domain-containing protein 2 Human genes 0.000 description 1
- 102100037979 V-type proton ATPase 116 kDa subunit a 1 Human genes 0.000 description 1
- 102100034171 V-type proton ATPase 16 kDa proteolipid subunit c Human genes 0.000 description 1
- 102100035889 Vacuolar protein sorting-associated protein 16 homolog Human genes 0.000 description 1
- 102100038217 Vascular endothelial growth factor B Human genes 0.000 description 1
- 102100035132 WD repeat-containing protein 55 Human genes 0.000 description 1
- 102100035327 WD repeat-containing protein WRAP73 Human genes 0.000 description 1
- 108700031544 X-Linked Inhibitor of Apoptosis Proteins 0.000 description 1
- 108700018540 X-linked Properdin deficiency Proteins 0.000 description 1
- 102100028476 Zinc finger CCCH domain-containing protein 18 Human genes 0.000 description 1
- 102100028129 Zinc finger and BTB domain-containing protein 42 Human genes 0.000 description 1
- 102100028483 Zinc finger matrin-type protein 2 Human genes 0.000 description 1
- 102100036690 Zinc finger protein 518A Human genes 0.000 description 1
- 102100026470 Zinc finger protein 843 Human genes 0.000 description 1
- 102100029573 Zinc finger protein SNAI3 Human genes 0.000 description 1
- JLCPHMBAVCMARE-UHFFFAOYSA-N [3-[[3-[[3-[[3-[[3-[[3-[[3-[[3-[[3-[[3-[[3-[[5-(2-amino-6-oxo-1H-purin-9-yl)-3-[[3-[[3-[[3-[[3-[[3-[[5-(2-amino-6-oxo-1H-purin-9-yl)-3-[[5-(2-amino-6-oxo-1H-purin-9-yl)-3-hydroxyoxolan-2-yl]methoxy-hydroxyphosphoryl]oxyoxolan-2-yl]methoxy-hydroxyphosphoryl]oxy-5-(5-methyl-2,4-dioxopyrimidin-1-yl)oxolan-2-yl]methoxy-hydroxyphosphoryl]oxy-5-(6-aminopurin-9-yl)oxolan-2-yl]methoxy-hydroxyphosphoryl]oxy-5-(6-aminopurin-9-yl)oxolan-2-yl]methoxy-hydroxyphosphoryl]oxy-5-(6-aminopurin-9-yl)oxolan-2-yl]methoxy-hydroxyphosphoryl]oxy-5-(6-aminopurin-9-yl)oxolan-2-yl]methoxy-hydroxyphosphoryl]oxyoxolan-2-yl]methoxy-hydroxyphosphoryl]oxy-5-(5-methyl-2,4-dioxopyrimidin-1-yl)oxolan-2-yl]methoxy-hydroxyphosphoryl]oxy-5-(4-amino-2-oxopyrimidin-1-yl)oxolan-2-yl]methoxy-hydroxyphosphoryl]oxy-5-(5-methyl-2,4-dioxopyrimidin-1-yl)oxolan-2-yl]methoxy-hydroxyphosphoryl]oxy-5-(5-methyl-2,4-dioxopyrimidin-1-yl)oxolan-2-yl]methoxy-hydroxyphosphoryl]oxy-5-(6-aminopurin-9-yl)oxolan-2-yl]methoxy-hydroxyphosphoryl]oxy-5-(6-aminopurin-9-yl)oxolan-2-yl]methoxy-hydroxyphosphoryl]oxy-5-(4-amino-2-oxopyrimidin-1-yl)oxolan-2-yl]methoxy-hydroxyphosphoryl]oxy-5-(4-amino-2-oxopyrimidin-1-yl)oxolan-2-yl]methoxy-hydroxyphosphoryl]oxy-5-(4-amino-2-oxopyrimidin-1-yl)oxolan-2-yl]methoxy-hydroxyphosphoryl]oxy-5-(6-aminopurin-9-yl)oxolan-2-yl]methoxy-hydroxyphosphoryl]oxy-5-(4-amino-2-oxopyrimidin-1-yl)oxolan-2-yl]methyl [5-(6-aminopurin-9-yl)-2-(hydroxymethyl)oxolan-3-yl] hydrogen phosphate Polymers Cc1cn(C2CC(OP(O)(=O)OCC3OC(CC3OP(O)(=O)OCC3OC(CC3O)n3cnc4c3nc(N)[nH]c4=O)n3cnc4c3nc(N)[nH]c4=O)C(COP(O)(=O)OC3CC(OC3COP(O)(=O)OC3CC(OC3COP(O)(=O)OC3CC(OC3COP(O)(=O)OC3CC(OC3COP(O)(=O)OC3CC(OC3COP(O)(=O)OC3CC(OC3COP(O)(=O)OC3CC(OC3COP(O)(=O)OC3CC(OC3COP(O)(=O)OC3CC(OC3COP(O)(=O)OC3CC(OC3COP(O)(=O)OC3CC(OC3COP(O)(=O)OC3CC(OC3COP(O)(=O)OC3CC(OC3COP(O)(=O)OC3CC(OC3COP(O)(=O)OC3CC(OC3COP(O)(=O)OC3CC(OC3COP(O)(=O)OC3CC(OC3CO)n3cnc4c(N)ncnc34)n3ccc(N)nc3=O)n3cnc4c(N)ncnc34)n3ccc(N)nc3=O)n3ccc(N)nc3=O)n3ccc(N)nc3=O)n3cnc4c(N)ncnc34)n3cnc4c(N)ncnc34)n3cc(C)c(=O)[nH]c3=O)n3cc(C)c(=O)[nH]c3=O)n3ccc(N)nc3=O)n3cc(C)c(=O)[nH]c3=O)n3cnc4c3nc(N)[nH]c4=O)n3cnc4c(N)ncnc34)n3cnc4c(N)ncnc34)n3cnc4c(N)ncnc34)n3cnc4c(N)ncnc34)O2)c(=O)[nH]c1=O JLCPHMBAVCMARE-UHFFFAOYSA-N 0.000 description 1
- 238000010317 ablation therapy Methods 0.000 description 1
- 230000002159 abnormal effect Effects 0.000 description 1
- 230000005856 abnormality Effects 0.000 description 1
- 238000009825 accumulation Methods 0.000 description 1
- 238000007792 addition Methods 0.000 description 1
- 238000011467 adoptive cell therapy Methods 0.000 description 1
- 108091008108 affimer Proteins 0.000 description 1
- 229960000548 alemtuzumab Drugs 0.000 description 1
- 238000009175 antibody therapy Methods 0.000 description 1
- 239000000427 antigen Substances 0.000 description 1
- 108091007433 antigens Proteins 0.000 description 1
- 102000036639 antigens Human genes 0.000 description 1
- MHHMNDJIDRZZNT-UHFFFAOYSA-N atto 680 Chemical compound OC(=O)CCCN1C(C)(C)C=C(CS([O-])(=O)=O)C2=C1C=C1OC3=CC4=[N+](CC)CCCC4=CC3=NC1=C2 MHHMNDJIDRZZNT-UHFFFAOYSA-N 0.000 description 1
- 210000003719 b-lymphocyte Anatomy 0.000 description 1
- 102100037092 cAMP-specific 3',5'-cyclic phosphodiesterase 4A Human genes 0.000 description 1
- 102100029169 cAMP-specific 3',5'-cyclic phosphodiesterase 4C Human genes 0.000 description 1
- 238000002619 cancer immunotherapy Methods 0.000 description 1
- 229940022399 cancer vaccine Drugs 0.000 description 1
- 238000009566 cancer vaccine Methods 0.000 description 1
- 190000008236 carboplatin Chemical compound 0.000 description 1
- 229960004562 carboplatin Drugs 0.000 description 1
- 231100000357 carcinogen Toxicity 0.000 description 1
- 239000003183 carcinogenic agent Substances 0.000 description 1
- 230000024245 cell differentiation Effects 0.000 description 1
- 201000010881 cervical cancer Diseases 0.000 description 1
- 239000003153 chemical reaction reagent Substances 0.000 description 1
- 239000003795 chemical substances by application Substances 0.000 description 1
- 238000002512 chemotherapy Methods 0.000 description 1
- 210000003483 chromatin Anatomy 0.000 description 1
- 239000013611 chromosomal DNA Substances 0.000 description 1
- 238000003776 cleavage reaction Methods 0.000 description 1
- 230000024203 complement activation Effects 0.000 description 1
- 239000003184 complementary RNA Substances 0.000 description 1
- 230000001276 controlling effect Effects 0.000 description 1
- 201000007241 cutaneous T cell lymphoma Diseases 0.000 description 1
- 208000017763 cutaneous neuroendocrine carcinoma Diseases 0.000 description 1
- 238000005520 cutting process Methods 0.000 description 1
- 231100000433 cytotoxic Toxicity 0.000 description 1
- 230000001472 cytotoxic effect Effects 0.000 description 1
- 238000007405 data analysis Methods 0.000 description 1
- 230000007547 defect Effects 0.000 description 1
- 238000011161 development Methods 0.000 description 1
- 230000018109 developmental process Effects 0.000 description 1
- 238000003745 diagnosis Methods 0.000 description 1
- 239000000104 diagnostic biomarker Substances 0.000 description 1
- CZWHMRTTWFJMBC-UHFFFAOYSA-N dinaphtho[2,3-b:2',3'-f]thieno[3,2-b]thiophene Chemical compound C1=CC=C2C=C(SC=3C4=CC5=CC=CC=C5C=C4SC=33)C3=CC2=C1 CZWHMRTTWFJMBC-UHFFFAOYSA-N 0.000 description 1
- 229940079593 drug Drugs 0.000 description 1
- 101150004703 eIF3i gene Proteins 0.000 description 1
- 238000010201 enrichment analysis Methods 0.000 description 1
- 230000007613 environmental effect Effects 0.000 description 1
- 230000002255 enzymatic effect Effects 0.000 description 1
- 230000008995 epigenetic change Effects 0.000 description 1
- 230000035612 epigenetic expression Effects 0.000 description 1
- 238000012869 ethanol precipitation Methods 0.000 description 1
- 238000002474 experimental method Methods 0.000 description 1
- 238000000556 factor analysis Methods 0.000 description 1
- 125000002485 formyl group Chemical class [H]C(*)=O 0.000 description 1
- 230000004927 fusion Effects 0.000 description 1
- 229940084388 gammar Drugs 0.000 description 1
- 150000004676 glycans Chemical class 0.000 description 1
- 101150118163 h gene Proteins 0.000 description 1
- 201000005787 hematologic cancer Diseases 0.000 description 1
- 208000024200 hematopoietic and lymphoid system neoplasm Diseases 0.000 description 1
- 210000003958 hematopoietic stem cell Anatomy 0.000 description 1
- 206010073071 hepatocellular carcinoma Diseases 0.000 description 1
- 231100000844 hepatocellular carcinoma Toxicity 0.000 description 1
- 210000003917 human chromosome Anatomy 0.000 description 1
- 201000006122 hypervitaminosis A Diseases 0.000 description 1
- 229940126546 immune checkpoint molecule Drugs 0.000 description 1
- 230000001900 immune effect Effects 0.000 description 1
- 230000007813 immunodeficiency Effects 0.000 description 1
- 208000013224 immunodeficiency 51 Diseases 0.000 description 1
- 238000000338 in vitro Methods 0.000 description 1
- 239000003112 inhibitor Substances 0.000 description 1
- 230000000977 initiatory effect Effects 0.000 description 1
- 238000003780 insertion Methods 0.000 description 1
- 230000037431 insertion Effects 0.000 description 1
- 229940079322 interferon Drugs 0.000 description 1
- 201000010982 kidney cancer Diseases 0.000 description 1
- 239000002523 lectin Substances 0.000 description 1
- 230000000670 limiting effect Effects 0.000 description 1
- 238000012417 linear regression Methods 0.000 description 1
- 201000007270 liver cancer Diseases 0.000 description 1
- 208000014018 liver neoplasm Diseases 0.000 description 1
- 201000004792 malaria Diseases 0.000 description 1
- 238000013507 mapping Methods 0.000 description 1
- 239000000463 material Substances 0.000 description 1
- 239000011159 matrix material Substances 0.000 description 1
- 208000020968 mature T-cell and NK-cell non-Hodgkin lymphoma Diseases 0.000 description 1
- 238000005259 measurement Methods 0.000 description 1
- 230000007246 mechanism Effects 0.000 description 1
- 208000037819 metastatic cancer Diseases 0.000 description 1
- 208000011575 metastatic malignant neoplasm Diseases 0.000 description 1
- WSFSSNUMVMOOMR-NJFSPNSNSA-N methanone Chemical compound O=[14CH2] WSFSSNUMVMOOMR-NJFSPNSNSA-N 0.000 description 1
- 230000011987 methylation Effects 0.000 description 1
- 238000007069 methylation reaction Methods 0.000 description 1
- 239000002679 microRNA Substances 0.000 description 1
- 108010083982 monoamine-sulfating phenol sulfotransferase Proteins 0.000 description 1
- 201000005962 mycosis fungoides Diseases 0.000 description 1
- 206010028537 myelofibrosis Diseases 0.000 description 1
- 208000037830 nasal cancer Diseases 0.000 description 1
- 239000013642 negative control Substances 0.000 description 1
- 238000007857 nested PCR Methods 0.000 description 1
- 230000002352 nonmutagenic effect Effects 0.000 description 1
- 238000010606 normalization Methods 0.000 description 1
- 229960002450 ofatumumab Drugs 0.000 description 1
- 238000002966 oligonucleotide array Methods 0.000 description 1
- 238000011017 operating method Methods 0.000 description 1
- 238000005457 optimization Methods 0.000 description 1
- 108010068338 p38 Mitogen-Activated Protein Kinases Proteins 0.000 description 1
- 102000002574 p38 Mitogen-Activated Protein Kinases Human genes 0.000 description 1
- 229960001592 paclitaxel Drugs 0.000 description 1
- 238000003909 pattern recognition Methods 0.000 description 1
- 201000000500 penis squamous cell carcinoma Diseases 0.000 description 1
- 230000003285 pharmacodynamic effect Effects 0.000 description 1
- 230000004962 physiological condition Effects 0.000 description 1
- 229920001282 polysaccharide Polymers 0.000 description 1
- 239000005017 polysaccharide Substances 0.000 description 1
- 108010001062 polysaccharide-K Proteins 0.000 description 1
- 229940034049 polysaccharide-k Drugs 0.000 description 1
- 238000001556 precipitation Methods 0.000 description 1
- 238000002360 preparation method Methods 0.000 description 1
- 108010074732 preproenkephalin Proteins 0.000 description 1
- 208000025638 primary cutaneous T-cell non-Hodgkin lymphoma Diseases 0.000 description 1
- 238000004393 prognosis Methods 0.000 description 1
- 210000002307 prostate Anatomy 0.000 description 1
- 235000019833 protease Nutrition 0.000 description 1
- 238000011002 quantification Methods 0.000 description 1
- 108010046566 rab3A GTP Binding Protein Proteins 0.000 description 1
- 230000002285 radioactive effect Effects 0.000 description 1
- 238000007637 random forest analysis Methods 0.000 description 1
- 208000019465 refractory cytopenia of childhood Diseases 0.000 description 1
- 238000000611 regression analysis Methods 0.000 description 1
- 230000004043 responsiveness Effects 0.000 description 1
- 230000000717 retained effect Effects 0.000 description 1
- HFNKQEVNSGCOJV-OAHLLOKOSA-N ruxolitinib Chemical compound C1([C@@H](CC#N)N2N=CC(=C2)C=2C=3C=CNC=3N=CN=2)CCCC1 HFNKQEVNSGCOJV-OAHLLOKOSA-N 0.000 description 1
- 229960000215 ruxolitinib Drugs 0.000 description 1
- 230000007017 scission Effects 0.000 description 1
- 238000013515 script Methods 0.000 description 1
- 230000011664 signaling Effects 0.000 description 1
- 229960000714 sipuleucel-t Drugs 0.000 description 1
- 239000007787 solid Substances 0.000 description 1
- 208000021333 squamous cell carcinoma of penis Diseases 0.000 description 1
- 238000010972 statistical evaluation Methods 0.000 description 1
- 201000000596 systemic lupus erythematosus Diseases 0.000 description 1
- 102100030611 tRNA 2'-phosphotransferase 1 Human genes 0.000 description 1
- RCINICONZNJXQF-MZXODVADSA-N taxol Chemical compound O([C@@H]1[C@@]2(C[C@@H](C(C)=C(C2(C)C)[C@H](C([C@]2(C)[C@@H](O)C[C@H]3OC[C@]3([C@H]21)OC(C)=O)=O)OC(=O)C)OC(=O)[C@H](O)[C@@H](NC(=O)C=1C=CC=CC=1)C=1C=CC=CC=1)O)C(=O)C1=CC=CC=C1 RCINICONZNJXQF-MZXODVADSA-N 0.000 description 1
- 229940066453 tecentriq Drugs 0.000 description 1
- ABZLKHKQJHEPAX-UHFFFAOYSA-N tetramethylrhodamine Chemical compound C=12C=CC(N(C)C)=CC2=[O+]C2=CC(N(C)C)=CC=C2C=1C1=CC=CC=C1C([O-])=O ABZLKHKQJHEPAX-UHFFFAOYSA-N 0.000 description 1
- 210000001541 thymus gland Anatomy 0.000 description 1
- 201000002510 thyroid cancer Diseases 0.000 description 1
- 229960001350 tofacitinib Drugs 0.000 description 1
- UJLAWZDWDVHWOW-YPMHNXCESA-N tofacitinib Chemical compound C[C@@H]1CCN(C(=O)CC#N)C[C@@H]1N(C)C1=NC=NC2=C1C=CN2 UJLAWZDWDVHWOW-YPMHNXCESA-N 0.000 description 1
- 238000013518 transcription Methods 0.000 description 1
- 230000035897 transcription Effects 0.000 description 1
- 230000007704 transition Effects 0.000 description 1
- 206010044412 transitional cell carcinoma Diseases 0.000 description 1
- 230000001960 triggered effect Effects 0.000 description 1
- 208000023747 urothelial carcinoma Diseases 0.000 description 1
- 229940055760 yervoy Drugs 0.000 description 1
Images
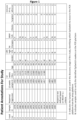

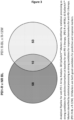
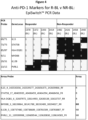
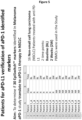

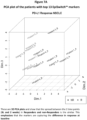
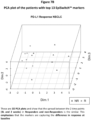
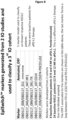
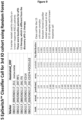
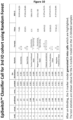
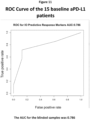

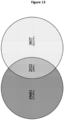
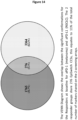

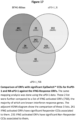
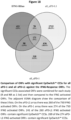

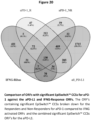

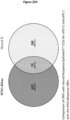
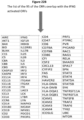
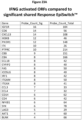
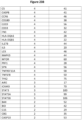

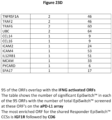

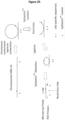
Classifications
-
- C—CHEMISTRY; METALLURGY
- C12—BIOCHEMISTRY; BEER; SPIRITS; WINE; VINEGAR; MICROBIOLOGY; ENZYMOLOGY; MUTATION OR GENETIC ENGINEERING
- C12Q—MEASURING OR TESTING PROCESSES INVOLVING ENZYMES, NUCLEIC ACIDS OR MICROORGANISMS; COMPOSITIONS OR TEST PAPERS THEREFOR; PROCESSES OF PREPARING SUCH COMPOSITIONS; CONDITION-RESPONSIVE CONTROL IN MICROBIOLOGICAL OR ENZYMOLOGICAL PROCESSES
- C12Q1/00—Measuring or testing processes involving enzymes, nucleic acids or microorganisms; Compositions therefor; Processes of preparing such compositions
- C12Q1/68—Measuring or testing processes involving enzymes, nucleic acids or microorganisms; Compositions therefor; Processes of preparing such compositions involving nucleic acids
- C12Q1/6876—Nucleic acid products used in the analysis of nucleic acids, e.g. primers or probes
- C12Q1/6883—Nucleic acid products used in the analysis of nucleic acids, e.g. primers or probes for diseases caused by alterations of genetic material
- C12Q1/6886—Nucleic acid products used in the analysis of nucleic acids, e.g. primers or probes for diseases caused by alterations of genetic material for cancer
-
- C—CHEMISTRY; METALLURGY
- C12—BIOCHEMISTRY; BEER; SPIRITS; WINE; VINEGAR; MICROBIOLOGY; ENZYMOLOGY; MUTATION OR GENETIC ENGINEERING
- C12Q—MEASURING OR TESTING PROCESSES INVOLVING ENZYMES, NUCLEIC ACIDS OR MICROORGANISMS; COMPOSITIONS OR TEST PAPERS THEREFOR; PROCESSES OF PREPARING SUCH COMPOSITIONS; CONDITION-RESPONSIVE CONTROL IN MICROBIOLOGICAL OR ENZYMOLOGICAL PROCESSES
- C12Q1/00—Measuring or testing processes involving enzymes, nucleic acids or microorganisms; Compositions therefor; Processes of preparing such compositions
- C12Q1/68—Measuring or testing processes involving enzymes, nucleic acids or microorganisms; Compositions therefor; Processes of preparing such compositions involving nucleic acids
- C12Q1/6844—Nucleic acid amplification reactions
- C12Q1/686—Polymerase chain reaction [PCR]
-
- C—CHEMISTRY; METALLURGY
- C12—BIOCHEMISTRY; BEER; SPIRITS; WINE; VINEGAR; MICROBIOLOGY; ENZYMOLOGY; MUTATION OR GENETIC ENGINEERING
- C12Q—MEASURING OR TESTING PROCESSES INVOLVING ENZYMES, NUCLEIC ACIDS OR MICROORGANISMS; COMPOSITIONS OR TEST PAPERS THEREFOR; PROCESSES OF PREPARING SUCH COMPOSITIONS; CONDITION-RESPONSIVE CONTROL IN MICROBIOLOGICAL OR ENZYMOLOGICAL PROCESSES
- C12Q2600/00—Oligonucleotides characterized by their use
- C12Q2600/106—Pharmacogenomics, i.e. genetic variability in individual responses to drugs and drug metabolism
Definitions
- the invention relates to detecting chromosome interactions.
- WO 2016/207661 discloses a process of analysing epigenetically active regions of the genome.
- WO 2016/207653 discloses a method of determining the epigenetic chromosome interactions which are relevant to a companion diagnostic.
- CCSs Specific Chromosome Conformation Signatures at loci either exist or are absent due to the regulatory epigenetic control settings associated with pathology or treatment.
- CCSs have mild off-rates and when representing a particular phenotype or pathology, they will only change with a physiologically signalled transition to a new phenotype, or as a result of external intervention.
- the measurement of these events is binary, and so this read-out is in stark contrast to the continuum readout of varying levels of DNA methylation, histone modifications and most of the non-coding RNAs.
- the continuum read-out used for most molecular biomarkers to date offers a challenge to data analysis, in that the magnitude of change for particular biomarkers varies greatly from patient to patient, which causes problems for classification statistics when they are used to stratify cohorts of patients. These classification statistics are better-suited to using biomarkers that are absent of magnitude and offer just a "yes or no" binary score of phenotypic differences - signifying that chromosome conformation ( EpiSwitch TM ) biomarkers are an excellent resource for potential diagnostic, prognostic and predictive biomarkers.
- the inventors have identified regions of the genome with chromosomal interactions relevant to immunoresponsiveness using an approach which allows identification of subgroups in a population.
- the identified regions, genes and specific chromosome interactions from two separate studies using different therapies to treat two different conditions have been found to determine general immunoresponsiveness in a patient, including through the immune response regulating cell surface signalling pathway and regulation of T cell activation.
- the inventors' work allows changes in immunoresponsiveness to be followed, for example during the course of disease or therapy.
- the invention provides a process for determining how responsive an individual is to anti-PD-1 or anti-PD-L1 therapy comprising determining whether at least 10 chromosome interactions are present or absent in the individual,
- the inventions concerns a panel of epigenetic markers which relate to the regulation of the immune system, in particular via cell surface signalling pathways and T cell activation.
- the invention also includes monitoring the state of the immune system to determine its responsiveness to particular therapies. That means appropriate therapies can be given to a patient, and whether or not the patient is retaining or losing 'responder' status can be determined.
- the invention therefore provides in one embodiment a 'live' ongoing readout of 'responder' status allowing a personalised therapy to be given to the patient which accurately reflects the patient's needs.
- the invention relates to determining immunoresponsiveness.
- immunoresponsiveness to a PD-1 inhibitor or PD-L1 inhibitor, including an antibody specific for PD-1 or PD-L1.
- PD-1 is 'programmed cell death protein'
- PD-L1 is 'programmed death-ligand 1'.
- the immunoresponsiveness is preferably to a cancer therapy, and so typically is relevant to whether a specific individual is responsive to the therapy, where the individual may or may not have cancer, or may be at risk of cancer.
- the cancer is typically any cancer mentioned herein, and for example is melanoma, lung cancer, non-small cell lung carcinoma (NSCLC), diffuse large B-cell lymphoma, liver cancer, hepatocellular carcinoma, prostate cancer, breast cancer, leukaemia, acute myeloid leukaemia, pancreatic cancer, thyroid cancer, nasal cancer, brain cancer, bladder cancer, cervical cancer, non-Hodgkin lymphoma, ovarian cancer, colorectal cancer or kidney cancer.
- NSCLC non-small cell lung carcinoma
- 'antibody' includes all fragments and derivatives of an antibody that retain the ability to bind the antigen target, for example single chain scFV's or Fab's.
- the process of the invention comprises a typing system for detecting chromosome interactions relevant to immunoresponsiveness.
- This typing may be performed using the EpiSwitch TM system mentioned herein which is based on cross-linking regions of chromosome which have come together in the chromosome interaction, subjecting the chromosomal DNA to cleavage and then ligating the nucleic acids present in the cross-linked entity to derive a ligated nucleic acid with sequence from both the regions which formed the chromosomal interaction. Detection of this ligated nucleic acid allows determination of the presence or absence of a particular chromosome interaction.
- 'epigenetic' and 'chromosome' interactions typically refers to interactions between distal regions of a chromosome, said interactions being dynamic and altering, forming or breaking depending upon the status of the region of the chromosome.
- chromosome interactions are typically detected by first generating a ligated nucleic acid that comprises sequence from both regions of the chromosomes that are part of the interactions.
- the regions can be cross-linked by any suitable means.
- the interactions are cross-linked using formaldehyde, but may also be cross-linked by any aldehyde, or D-Biotinoyl-e- aminocaproic acid-N-hydroxysuccinimide ester or Digoxigenin-3-O-methylcarbonyl-e-aminocaproic acid-N-hydroxysuccinimide ester.
- Para-formaldehyde can cross link DNA chains which are 4 Angstroms apart.
- the chromosome interactions are on the same chromosome and optionally 2 to 10 Angstroms apart.
- the chromosome interaction may reflect the status of the region of the chromosome, for example, if it is being transcribed or repressed in response to change of the physiological conditions. Chromosome interactions which are specific to subgroups as defined herein have been found to be stable, thus providing a reliable means of measuring the differences between the two subgroups.
- chromosome interactions specific to a characteristic will normally occur early in a biological process, for example compared to other epigenetic markers such as methylation or changes to binding of histone proteins.
- the process of the invention is able to detect early stages of a biological process. This allows early intervention (for example treatment) which may as a consequence be more effective.
- Chromosome interactions also reflect the current state of the individual and therefore can be used to assess changes to immunoresponsiveness.
- Detecting chromosome interactions is highly informative with up to 50 different possible interactions per gene, and so processes of the invention can interrogate 500,000 different interactions.
- the term 'marker' or 'biomarker' refers to a specific chromosome interaction which can be detected (typed) in the invention.
- Specific markers are disclosed herein, any of which may be used in the invention. Further sets of markers may be used, for example in the combinations or numbers disclosed herein.
- the specific markers disclosed in the tables herein are preferred as well as markers presents in genes and regions mentioned in the tables herein are preferred. These may be typed by any suitable method, for example the PCR or probe based methods disclosed herein, including a qPCR method.
- the markers are defined herein by location or by probe and/or primer sequences.
- Epigenetic chromosomal interactions may overlap and include the regions of chromosomes shown to encode relevant or undescribed genes, but equally may be in intergenic regions. It should further be noted that the inventors have discovered that epigenetic interactions in all regions are equally important in determining the status of the chromosomal locus. These interactions are not necessarily in the coding region of a particular gene located at the locus and may be in intergenic regions.
- the chromosome interactions which are detected in the invention could be caused by changes to the underlying DNA sequence, by environmental factors, DNA methylation, non-coding antisense RNA transcripts, non-mutagenic carcinogens, histone modifications, chromatin remodelling and specific local DNA interactions.
- the changes which lead to the chromosome interactions may be caused by changes to the underlying nucleic acid sequence, which themselves do not directly affect a gene product or the mode of gene expression.
- Such changes may be for example, SNPs within and/or outside of the genes, gene fusions and/or deletions of intergenic DNA, microRNA, and non-coding RNA.
- SNPs within and/or outside of the genes, gene fusions and/or deletions of intergenic DNA, microRNA, and non-coding RNA.
- the regions of the chromosome which come together to form the interaction are less than 5 kb
- the chromosome interaction which is detected is preferably within any of the genes mentioned in Table 1.
- the aim of the present invention is to determine the level of immunoresponsiveness. This may be at one or more defined time points, for example at at least 1, 2, 5, 8 or 10 different time points.
- the durations between at least 1, 2, 5 or 8 of the time points may be at least 5, 10, 20, 50, 80 or 100 days.
- at least 1, 2 or 5 time points are before therapy begins and/or at least 1, 2 or 5 time points are after the beginning of therapy.
- a “subgroup” preferably refers to a population subgroup (a subgroup in a population)
- a “subgroup” refers to a subgroup in the human population.
- chromosome interactions differ between subsets (for example at least two subsets) in a given population. Identifying these differences will allow physicians to categorize their patients as a part of one subset of the population as described in the process.
- the invention therefore provides physicians with a process of personalizing medicine for the patient based on their epigenetic chromosome interactions.
- the invention relates to testing whether an individual is a 'responder'. Once a person is found to be a 'responder' they can be given the relevant therapy If an individual is found to be a non-responder then they can be given a combination therapy, such as any combination therapy listed herein.
- a combination therapy comprises an antibody and a small molecule.
- Certain embodiments of the invention utilise ligated nucleic acids, in particular ligated DNA. These comprise sequences from both of the regions that come together in a chromosome interaction and therefore provide information about the interaction.
- the EpiSwitch TM method described herein uses generation of such ligated nucleic acids to detect chromosome interactions.
- a process of the invention may comprise a step of generating ligated nucleic acids (e.g. DNA) by the following steps (including a method comprising these steps):
- steps may be carried out to detect the chromosome interactions for any embodiment mentioned herein.
- the steps may also be carried out to generate the first and/or second set of nucleic acids mentioned herein.
- PCR polymerase chain reaction
- the size of the PCR product produced may be indicative of the specific chromosome interaction which is present, and may therefore be used to identify the status of the locus.
- at least 1, 2 or 3 primers or primer pairs as shown in Table 4 are used in the PCR reaction.
- at least 1, 2 or 3 primers or primer pairs as shown in Table 14 are used in the PCR reaction.
- the skilled person will be aware of numerous restriction enzymes which can be used to cut the DNA within the chromosomal locus of interest. It will be apparent that the particular enzyme used will depend upon the locus studied and the sequence of the DNA located therein.
- a non-limiting example of a restriction enzyme which can be used to cut the DNA as described in the present invention is Taql.
- the EpiSwitch TM Technology also relates to the use of microarray EpiSwitch TM marker data in the detection of epigenetic chromosome conformation signatures specific for phenotypes.
- Embodiments such as EpiSwitch TM which utilise ligated nucleic acids in the manner described herein have several advantages. They have a low level of stochastic noise, for example because the nucleic acid sequences from the first set of nucleic acids of the present invention either hybridise or fail to hybridise with the second set of nucleic acids. This provides a binary result permitting a relatively simple way to measure a complex mechanism at the epigenetic level.
- EpiSwitch TM technology also has fast processing time and low cost. In one embodiment the processing time is 3 hours to 6 hours.
- the process of the invention will normally be carried out on a sample.
- the sample may be obtained at a defined time point, for example at any time point defined herein.
- the sample will normally contain DNA from the individual. It will normally contain cells.
- a sample is obtained by minimally invasive means, and may for example be a blood sample. DNA may be extracted and cut up with a standard restriction enzyme. This can pre-determine which chromosome conformations are retained and will be detected with the EpiSwitch TM platforms. Due to the synchronisation of chromosome interactions between tissues and blood, including horizontal transfer, a blood sample can be used to detect the chromosome interactions in tissues, such as tissues relevant to disease. For certain conditions, such as cancer, genetic noise due to mutations can affect the chromosome interaction 'signal' in the relevant tissues and therefore using blood is advantageous.
- the invention relates to certain nucleic acids, such as the ligated nucleic acids which are described herein as being used or generated in the process of the invention. These may be the same as, or have any of the properties of, the first and second nucleic acids mentioned herein.
- the nucleic acids of the invention typically comprise two portions each comprising sequence from one of the two regions of the chromosome which come together in the chromosome interaction. Typically each portion is at least 8, 10, 15, 20, 30 or 40 nucleotides in length, for example 10 to 40 nucleotides in length.
- Preferred nucleic acids comprise sequence from any of the genes mentioned in any of the tables. Typically preferred nucleic acids comprise the specific probe sequences mentioned in Table 1; or fragments and/or homologues of such sequences.
- the nucleic acids are DNA. It is understood that where a specific sequence is provided the invention may use the complementary sequence as required in the particular embodiment.
- the nucleic acids are DNA. It is understood that where a specific sequence is provided the invention may use the complementary sequence as required in the particular embodiment.
- primers shown in Table 4 may also be used in the invention as mentioned herein. In one embodiment primers are used which comprise any of: the sequences shown in Table 4; or fragments and/or homologues of any sequence shown in Table 4.
- the primers shown in Table 14 may also be used in the invention as mentioned herein. In one embodiment primers are used which comprise any of: the sequences shown in Table 14; or fragments and/or homologues of any sequence shown in Table 14.
- the second set of nucleic acid sequences has the function of being a set of index sequences, and is essentially a set of nucleic acid sequences which are suitable for identifying subgroup specific sequence. They can represents the 'background' chromosomal interactions and might be selected in some way or be unselected. They are in general a subset of all possible chromosomal interactions.
- the second set of nucleic acids may be derived by any suitable process. They can be derived computationally or they may be based on chromosome interaction in individuals. They typically represent a larger population group than the first set of nucleic acids. In one particular embodiment, the second set of nucleic acids represents all possible epigenetic chromosomal interactions in a specific set of genes. In another particular embodiment, the second set of nucleic acids represents a large proportion of all possible epigenetic chromosomal interactions present in a population described herein. In one particular embodiment, the second set of nucleic acids represents at least 50% or at least 80% of epigenetic chromosomal interactions in at least 20, 50, 100 or 500 genes, for example in 20 to 100 or 50 to 500 genes.
- the second set of nucleic acids typically represents at least 100 possible epigenetic chromosome interactions which modify, regulate or in any way mediate a phenotype in population.
- the second set of nucleic acids may represent chromosome interactions that affect a disease state (typically relevant to diagnosis or prognosis) in a species.
- the second set of nucleic acids typically comprises sequences representing epigenetic interactions both relevant and not relevant to an immunoresponsiveness subgroup.
- the second set of nucleic acids derive at least partially from naturally occurring sequences in a population, and are typically obtained by in silico processes. Said nucleic acids may further comprise single or multiple mutations in comparison to a corresponding portion of nucleic acids present in the naturally occurring nucleic acids. Mutations include deletions, substitutions and/or additions of one or more nucleotide base pairs.
- the second set of nucleic acids may comprise sequence representing a homologue and/or orthologue with at least 70% sequence identity to the corresponding portion of nucleic acids present in the naturally occurring species. In another particular embodiment, at least 80% sequence identity or at least 90% sequence identity to the corresponding portion of nucleic acids present in the naturally occurring species is provided.
- there are at least 100 different nucleic acid sequences in the second set of nucleic acids preferably at least 1000, 2000 or 5000 different nucleic acids sequences, with up to 100,000, 1,000,000 or 10,000,000 different nucleic acid sequences.
- a typical number would be 100 to 1,000,000, such as 1,000 to 100,000 different nucleic acids sequences. All or at least 90% or at least 50% or these would correspond to different chromosomal interactions.
- the second set of nucleic acids represent chromosome interactions in at least 20 different loci or genes, preferably at least 40 different loci or genes, and more preferably at least 100, at least 500, at least 1000 or at least 5000 different loci or genes, such as 100 to 10,000 different loci or genes.
- the lengths of the second set of nucleic acids are suitable for them to specifically hybridise according to Watson Crick base pairing to the first set of nucleic acids to allow identification of chromosome interactions specific to subgroups.
- the second set of nucleic acids will comprise two portions corresponding in sequence to the two chromosome regions which come together in the chromosome interaction.
- the second set of nucleic acids typically comprise nucleic acid sequences which are at least 10, preferably 20, and preferably still 30 bases (nucleotides) in length.
- the nucleic acid sequences may be at the most 500, preferably at most 100, and preferably still at most 50 base pairs in length.
- the second set of nucleic acids comprises nucleic acid sequences of between 17 and 25 base pairs.
- at least 100, 80% or 50% of the second set of nucleic acid sequences have lengths as described above.
- the different nucleic acids do not have any overlapping sequences, for example at least 100%, 90%, 80% or 50% of the nucleic acids do not have the same sequence over at least 5 contiguous nucleotides.
- the same set of second nucleic acids may be used with different sets of first nucleic acids which represent subgroups for different characteristics, i.e. the second set of nucleic acids may represent a 'universal' collection of nucleic acids which can be used to identify chromosome interactions relevant to different characteristics.
- the first set of nucleic acids are typically from subgroups relevant to immunoresponsiveness.
- the first nucleic acids may have any of the characteristics and properties of the second set of nucleic acids mentioned herein.
- the first set of nucleic acids is normally derived from samples from the individuals which have undergone treatment and processing as described herein, particularly the EpiSwitch TM cross-linking and cleaving steps.
- the first set of nucleic acids represents all or at least 80% or 50% of the chromosome interactions present in the samples taken from the individuals.
- the first set of nucleic acids represents a smaller population of chromosome interactions across the loci or genes represented by the second set of nucleic acids in comparison to the chromosome interactions represented by second set of nucleic acids, i.e. the second set of nucleic acids is representing a background or index set of interactions in a defined set of loci or genes.
- nucleic acid populations mentioned herein may be present in the form of a library comprising at least 200, at least 500, at least 1000, at least 5000 or at least 10000 different nucleic acids of that type, such as 'first' or 'second' nucleic acids.
- a library may be in the form of being bound to an array.
- the invention requires a means for allowing wholly or partially complementary nucleic acid sequences from the first set of nucleic acids and the second set of nucleic acids to hybridise.
- all of the first set of nucleic acids is contacted with all of the second set of nucleic acids in a single assay, i.e. in a single hybridisation step.
- any suitable assay can be used.
- the nucleic acids mentioned herein may be labelled, preferably using an independent label such as a fluorophore (fluorescent molecule) or radioactive label which assists detection of successful hybridisation. Certain labels can be detected under UV light.
- the pattern of hybridisation for example on an array described herein, represents differences in epigenetic chromosome interactions between the two subgroups, and thus provides a process of comparing epigenetic chromosome interactions and determination of which epigenetic chromosome interactions are specific to a subgroup in the population of the present invention.
- 'pattern of hybridisation broadly covers the presence and absence of hybridisation between the first and second set of nucleic acids, i.e. which specific nucleic acids from the first set hybridise to which specific nucleic acids from the second set, and so it not limited to any particular assay or technique, or the need to have a surface or array on which a 'pattern' can be detected.
- the invention provides a process which comprises detecting the presence or absence of chromosome interactions, typically 10 to 20 or 5 to 500 such interactions, preferably 20 to 300 or 50 to 100 interactions, in order to determine the presence or absence of a characteristic relating to immunoresponsiveness in an individual.
- chromosome interactions are those in any of the genes mentioned herein.
- the chromosome interactions which are typed are those represented by the nucleic acids in Table 1. The column titled 'Loop Detected' in the tables shows which subgroup is detected (i.e. responder or non-responder) by each probe.
- the individual that is tested in the process of the invention may have been selected in some way.
- the individual may be susceptible to any condition mentioned herein and/or may be in need of any therapy mentioned in.
- the individual may be receiving any therapy mentioned herein.
- the individual that is tested has shown a lack of response to therapy, and the purpose of testing them is to discover whether they are a 'pseudo-progressor' that will respond to therapy in the second stage of disease, though they have not responded at an earlier stage.
- loci, genes and chromosome interactions are mentioned in the tables, for example in Table 1.
- chromosome interactions are detected from at least 1, 2, 10, 50, 100, 150, 200 or 300 of the relevant genes listed in Table 1.
- the presence or absence of at least 10, 50, 100, 150, 200 or 300 of the relevant specific chromosome interactions represented by the probe sequences in Table 1 are detected.
- the chromosome interaction may be upstream or downstream of any of the genes mentioned herein, for example 50 kb upstream or 20 kb downstream, for example from the coding sequence.
- At least 5, 10, 15, 20 or all of the chromosome interactions in Table 1.a are typed. In one embodiment at least 5, 10, 15, 20 or all of the chromosome interactions in Table 1.b are typed. In one embodiment at least 5, 10, 15, 20 or all of the chromosome interactions in Table 1.c are typed. In one embodiment at least 5, 10, 15, 20 or all of the chromosome interactions in Table 1.d are typed. In one embodiment at least 5, 10, 15, 20 or all of the chromosome interactions in Table 1.e are typed. In one embodiment at least 5, 10, 15, 20 or all of the chromosome interactions in Table 1.f are typed. In one embodiment at least 5, 10, 15, 20 or all of the chromosome interactions in Table 1.g are typed.
- chromosome interactions are typed from any of genes or regions disclosed the tables herein, or parts of tables disclosed herein.
- the chromosome interactions which are typed are present in at least 20, 50, 100, 200, 300 or all of the genes mentioned in Table 2.
- the chromosome interactions which are typed are present in at least 10, 20, 50, 70 or all of the genes mentioned in Table 3.
- At least 5, 10 or 15 or all of the chromosome interactions in Table 15 are typed.
- the locus may comprise a CTCF binding site.
- This is any sequence capable of binding transcription repressor CTCF. That sequence may consist of or comprise the sequence CCCTC which may be present in 1, 2 or 3 copies at the locus.
- the CTCF binding site sequence may comprise the sequence CCGCGNGGNGGCAG (SEQ ID NO: 1) (in IUPAC notation).
- the CTCF binding site may be within at least 100, 500, 1000 or 4000 bases of the chromosome interaction or within any of the chromosome regions shown Table 1.
- probes are used in the process which comprise or consist of the same or complementary sequence to a probe shown in any table. In some embodiments probes are used which comprise sequence which is homologous to any of the probe sequences shown in the tables.
- Table 1 shows probe (Episwitch TM marker) data and gene data representing chromosome interactions relevant to immunoresponsiveness.
- the probe sequences show sequence which can be used to detect a ligated product generated from both sites of gene regions that have come together in chromosome interactions, i.e. the probe will comprise sequence which is complementary to sequence in the ligated product.
- the first two sets of Start-End positions show probe positions, and the second two sets of Start-End positions show the relevant 4kb region. The following information is provided in the probe data table:
- Table 1 shows genes where a relevant chromosome interaction has been found to occur. Other tables show similar data.
- the p-value in the loci table is the same as the HyperG_Stats (p-value for the probability of finding that number of significant EpiSwitch TM markers in the locus based on the parameters of hypergeometric enrichment).
- the LS column shows presence or absence of the relevant interaction with that particular responder status.
- the probes are designed to be 30bp away from the Taq1 site.
- PCR primers are typically designed to detect ligated product but their locations from the Taq1 site vary.
- GLMNET values related to procedures for fitting the entire lasso or elastic-net regularization (Lambda set to 0.5 (elastic-net)).
- Tables 1 and 4 relates to detection of immunoresponsiveness.
- Table 2 shows the overlap between the two studies that were done, and Table 3 shows the overlap with markers relating to interferon gamma.
- the invention can be carried out using markers as disclosed/represented in any of the tables. Other tables can be interpreted in a similar manner as set out for Table 1 above.
- the sample will contain at least 2 ⁇ 10 5 cells.
- the sample may contain up to 5 ⁇ 10 5 cells. In one embodiment, the sample will contain 2 ⁇ 10 5 to 5.5 ⁇ 10 5 cells.
- Crosslinking of epigenetic chromosomal interactions present at the chromosomal locus is described herein. This may be performed before cell lysis takes place. Cell lysis may be performed for 3 to 7 minutes, such as 4 to 6 or about 5 minutes. In some embodiments, cell lysis is performed for at least 5 minutes and for less than 10 minutes.
- DNA restriction is performed at about 55°C to about 70°C, such as for about 65°C, for a period of about 10 to 30 minutes, such as about 20 minutes.
- a frequent cutter restriction enzyme is used which results in fragments of ligated DNA with an average fragment size up to 4000 base pair.
- the restriction enzyme results in fragments of ligated DNA have an average fragment size of about 200 to 300 base pairs, such as about 256 base pairs.
- the typical fragment size is from 200 base pairs to 4,000 base pairs, such as 400 to 2,000 or 500 to 1,000 base pairs.
- a DNA precipitation step is not performed between the DNA restriction digest step and the DNA ligation step.
- DNA ligation is described herein. Typically the DNA ligation is performed for 5 to 30 minutes, such as about 10 minutes.
- the protein in the sample may be digested enzymatically, for example using a proteinase, optionally Proteinase K.
- the protein may be enzymatically digested for a period of about 30 minutes to 1 hour, for example for about 45 minutes.
- PCR detection is capable of detecting a single copy of the ligated nucleic acid, preferably with a binary read-out for presence/absence of the ligated nucleic acid.
- Figure 25 shows a preferred method of detecting chromosome interactions.
- the invention includes detecting chromosome interactions at any locus, gene or regions mentioned Table 1.
- the invention includes use of the nucleic acids and probes mentioned herein to detect chromosome interactions, for example use of at least 1, 5, 10, 50, 100, 200, 250, 300 such nucleic acids or probes to detect chromosome interactions, preferably in at least 1, 5, 10, 50, 100, 200, 250, 300 different loci or genes.
- the invention includes detection of chromosome interactions using any of the primers or primer pairs listed in Table 4 or using variants of these primers as described herein (sequences comprising the primer sequences or comprising fragments and/or homologues of the primer sequences).
- both the parts of the chromosome which have together in the interaction are within the defined gene, region or location or in some embodiments only one part of the chromosome is within the defined, gene, region or location.
- homologues of polynucleotide / nucleic acid (e.g. DNA) sequences are referred to herein.
- Such homologues typically have at least 70% homology, preferably at least 80%, at least 85%, at least 90%, at least 95%, at least 97%, at least 98% or at least 99% homology, for example over a region of at least 10, 15, 20, 30, 100 or more contiguous nucleotides, or across the portion of the nucleic acid which is from the region of the chromosome involved in the chromosome interaction.
- the homology may be calculated on the basis of nucleotide identity (sometimes referred to as "hard homology").
- homologues of polynucleotide / nucleic acid (e.g. DNA) sequences are referred to herein by reference to percentage sequence identity.
- such homologues have at least 70% sequence identity, preferably at least 80%, at least 85%, at least 90%, at least 95%, at least 97%, at least 98% or at least 99% sequence identity, for example over a region of at least 10, 15, 20, 30, 100 or more contiguous nucleotides, or across the portion of the nucleic acid which is from the region of the chromosome involved in the chromosome interaction.
- the UWGCG Package provides the BESTFIT program which can be used to calculate homology and/or % sequence identity (for example used on its default settings) ( Devereux et al (1984) Nucleic Acids Research 12, p387-395 ).
- the PILEUP and BLAST algorithms can be used to calculate homology and/or % sequence identity and/or line up sequences (such as identifying equivalent or corresponding sequences (typically on their default settings)), for example as described in Altschul S. F. (1993) J Mol Evol 36:290-300 ; Altschul, S, F et al (1990) J Mol Biol 215:403-10 .
- HSPs high scoring sequence pair
- Extensions for the word hits in each direction are halted when: the cumulative alignment score falls off by the quantity X from its maximum achieved value; the cumulative score goes to zero or below, due to the accumulation of one or more negative-scoring residue alignments; or the end of either sequence is reached.
- the BLAST algorithm parameters W5 T and X determine the sensitivity and speed of the alignment.
- the BLAST algorithm performs a statistical analysis of the similarity between two sequences; see e.g., Karlin and Altschul (1993) Proc. Natl. Acad. Sci. USA 90: 5873-5787 .
- One measure of similarity provided by the BLAST algorithm is the smallest sum probability (P(N)), which provides an indication of the probability by which a match between two polynucleotide sequences would occur by chance.
- P(N) the smallest sum probability
- a sequence is considered similar to another sequence if the smallest sum probability in comparison of the first sequence to the second sequence is less than about 1, preferably less than about 0.1, more preferably less than about 0.01, and most preferably less than about 0.001.
- the homologous sequence typically differs by 1, 2, 3, 4 or more bases, such as less than 10, 15 or 20 bases (which may be substitutions, deletions or insertions of nucleotides). These changes may be measured across any of the regions mentioned above in relation to calculating homology and/or % sequence identity.
- Homology of a 'pair of primers' can be calculated, for example, by considering the two sequences as a single sequence (as if the two sequences are joined together) for the purpose of then comparing against the another primer pair which again is considered as a single sequence.
- the second set of nucleic acids may be bound to an array, and in one embodiment there are at least 15,000, 45,000, 100,000 or 250,000 different second nucleic acids bound to the array, which preferably represent at least 300, 900, 2000 or 5000 loci. In one embodiment one, or more, or all of the different populations of second nucleic acids are bound to more than one distinct region of the array, in effect repeated on the array allowing for error detection.
- the array may be based on an Agilent SurePrint G3 Custom CGH microarray platform. Detection of binding of first nucleic acids to the array may be performed by a dual colour system.
- the therapy may be mono or combination therapy, for example with immunocheckpoint modulators (inhibitors) for PD-1 and or its ligand, PD-L1.
- the therapy could be a combination of an anti-PD-1 or anti-PD-L1 combined with another drug that targets a checkpoint like CTLA4 (Ipilimumab/Yervoy) or small molecules.
- CTLA4 Ipilimumab/Yervoy
- the PD-1 inhibitors could be pembrolizumab (Keytruda) or nivolumab (Opdivo).
- the modulator of PD-L1 or therapeutic agent could be Atezolizumab (Tecentriq), Avelumab (Bavencio), Durvalumab (Imfinzi), CA-170, Ipilimumab, Tremelimumab, Nivolumab, Pembrolizumab, Pidilizumab, BMS935559, GVAXMPDL3280A, MEDI4736, MSB0010718C, MDX-1105/BMS-936559, AMP-224, MEDI0680.
- the therapy may comprise administering agents that target and/or modulate interferon gamma or the JAK-START pathway.
- nucleic acids or therapeutic agents may be in purified or isolated form. They may be in a form which is different from that found in nature, for example they may be present in combination with other substance with which they do not occur in nature.
- the nucleic acids (including portions of sequences defined herein) may have sequences which are different to those found in nature, for example having at least 1, 2, 3, 4 or more nucleotide changes in the sequence as described in the section on homology.
- the nucleic acids may have heterologous sequence at the 5' or 3' end.
- the nucleic acids may be chemically different from those found in nature, for example they may be modified in some way, but preferably are still capable of Watson-Crick base pairing.
- nucleic acids will be provided in double stranded or single stranded form.
- the invention provides all of the specific nucleic acid sequences mentioned herein in single or double stranded form, and thus includes the complementary strand to any sequence which is disclosed.
- quantitative detection of the ligated sequence which is relevant to a chromosome interaction is carried out using a probe which is detectable upon activation during a PCR reaction, wherein said ligated sequence comprises sequences from two chromosome regions that come together in an epigenetic chromosome interaction, wherein said method comprises contacting the ligated sequence with the probe during a PCR reaction, and detecting the extent of activation of the probe, and wherein said probe binds the ligation site.
- the method typically allows particular interactions to be detected in a MIQE compliant manner using a dual labelled fluorescent hydrolysis probe.
- the probe is generally labelled with a detectable label which has an inactive and active state, so that it is only detected when activated.
- the extent of activation will be related to the extent of template (ligation product) present in the PCR reaction. Detection may be carried out during all or some of the PCR, for example for at least 50% or 80% of the cycles of the PCR.
- the probe can comprise a fluorophore covalently attached to one end of the oligonucleotide, and a quencher attached to the other end of the nucleotide, so that the fluorescence of the fluorophore is quenched by the quencher.
- the fluorophore is attached to the 5'end of the oligonucleotide, and the quencher is covalently attached to the 3' end of the oligonucleotide.
- Fluorophores that can be used in the methods of the invention include FAM, TET, JOE, Yakima Yellow, HEX, Cyanine3, ATTO 550, TAMRA, ROX, Texas Red, Cyanine 3.5, LC610, LC 640, ATTO 647N, Cyanine 5, Cyanine 5.5 and ATTO 680.
- Quenchers that can be used with the appropriate fluorophore include TAM, BHQ1, DAB, Eclip, BHQ2 and BBQ650, optionally wherein said fluorophore is selected from HEX, Texas Red and FAM.
- Preferred combinations of fluorophore and quencher include FAM with BHQ1 and Texas Red with BHQ2.
- Hydrolysis probes of the invention are typically temperature gradient optimised with concentration matched negative controls. Preferably single-step PCR reactions are optimized. More preferably a standard curve is calculated.
- An advantage of using a specific probe that binds across the junction of the ligated sequence is that specificity for the ligated sequence can be achieved without using a nested PCR approach.
- the methods described herein allow accurate and precise quantification of low copy number targets.
- the target ligated sequence can be purified, for example gel-purified, prior to temperature gradient optimization.
- the target ligated sequence can be sequenced.
- PCR reactions are performed using about 10ng, or 5 to 15 ng, or 10 to 20ng, or 10 to 50ng, or 10 to 200ng template DNA.
- Forward and reverse primers are designed such that one primer binds to the sequence of one of the chromosome regions represented in the ligated DNA sequence, and the other primer binds to other chromosome region represented in the ligated DNA sequence, for example, by being complementary to the sequence.
- selecting primers and a probe for use in a PCR method as defined herein comprising selecting primers based on their ability to bind and amplify the ligated sequence and selecting the probe sequence based properties of the target sequence to which it will bind, in particular the curvature of the target sequence.
- Probes are typically designed/chosen to bind to ligated sequences which are juxtaposed restriction fragments spanning the restriction site.
- the predicted curvature of possible ligated sequences relevant to a particular chromosome interaction is calculated, for example using a specific algorithm referenced herein.
- the curvature can be expressed as degrees per helical turn, e.g. 10.5° per helical turn.
- Ligated sequences are selected for targeting where the ligated sequence has a curvature propensity peak score of at least 5° per helical turn, typically at least 10°, 15° or 20° per helical turn, for example 5° to 20° per helical turn.
- the curvature propensity score per helical turn is calculated for at least 20, 50, 100, 200 or 400 bases, such as for 20 to 400 bases upstream and/or downstream of the ligation site.
- the target sequence in the ligated product has any of these levels of curvature.
- Target sequences can also be chosen based on lowest thermodynamic structure free energy.
- intrachromosomal interactions are typed/detected, and no extrachromosomal interactions (between different chromosomes) are typed/detected.
- chromosome interactions are not typed, for example any specific interaction mentioned herein (for example as defined by any probe or primer pair mentioned herein). In some embodiments chromosome interactions are not typed in any of the genes mentioned here, for example in any gene mentioned in the Figures, including any or all genes mentioned in Figures 2 and 4 .
- none of the chromosome interactions represented by the probes or primers of any or all of Tables 5 to 7 are typed.
- no chromosome interactions present in any of the genes listed in any or all of Tables 5 to 7 are typed.
- no chromosome interactions present in any of the regions listed in any or all of Tables 5 to 7 are typed.
- the immunoresponsiveness does not relate to antibody therapy. In another embodiment the immunoresponsiveness does not relate to anti-PD-1 therapy, for example anti-PD-1 therapy of melanoma. In another embodiment the immunoresponsiveness does not relate to therapy one or more of the following: a blood cancer, leukaemia, prostate cancer, breast cancer, diffuse large B cell lymphoma.
- a method of determining which chromosomal interactions are relevant to a chromosome state corresponding to an immunoresponsive subgroup of the population comprising contacting a first set of nucleic acids from subgroups with different states of the chromosome with a second set of index nucleic acids, and allowing complementary sequences to hybridise, wherein the nucleic acids in the first and second sets of nucleic acids represent a ligated product comprising sequences from both the chromosome regions that have come together in chromosomal interactions, and wherein the pattern of hybridisation between the first and second set of nucleic acids allows a determination of which chromosomal interactions are specific to an immunoresponsive subgroup.
- the subgroup may be any of the specific subgroups defined herein, for example with reference to particular conditions or therapies.
- the EpiSwitch TM platform technology detects epigenetic regulatory signatures of regulatory changes between normal and abnormal conditions at loci.
- the EpiSwitch TM platform identifies and monitors the fundamental epigenetic level of gene regulation associated with regulatory high order structures of human chromosomes also known as chromosome conformation signatures.
- Chromosome signatures are a distinct primary step in a cascade of gene deregulation. They are high order biomarkers with a unique set of advantages against biomarker platforms that utilize late epigenetic and gene expression biomarkers, such as DNA methylation and RNA profiling.
- the custom EpiSwitch TM array-screening platforms come in 4 densities of, 15K, 45K, 100K, and 250K unique chromosome conformations, each chimeric fragment is repeated on the arrays 4 times, making the effective densities 60K, 180K, 400K and 1 Million respectively.
- the 15K EpiSwitch TM array can screen the whole genome including around 300 loci interrogated with the EpiSwitch TM Biomarker discovery technology.
- the EpiSwitch TM array is built on the Agilent SurePrint G3 Custom CGH microarray platform; this technology offers 4 densities, 60K, 180K, 400K and 1 Million probes.
- the density per array is reduced to 15K, 45K, 100K and 250K as each EpiSwitch TM probe is presented as a quadruplicate, thus allowing for statistical evaluation of the reproducibility.
- the average number of potential EpiSwitch TM markers interrogated per genetic loci is 50; as such the numbers of loci that can be investigated are 300, 900, 2000, and 5000.
- the EpiSwitch TM array is a dual colour system with one set of samples, after EpiSwitch TM library generation, labelled in Cy5 and the other of sample (controls) to be compared/ analyzed labelled in Cy3.
- the arrays are scanned using the Agilent SureScan Scanner and the resultant features extracted using the Agilent Feature Extraction software.
- the data is then processed using the EpiSwitch TM array processing scripts in R.
- the arrays are processed using standard dual colour packages in Bioconductor in R: Limma *.
- the normalisation of the arrays is done using the normalisedWithinArrays function in Limma * and this is done to the on chip Agilent positive controls and EpiSwitch TM positive controls.
- the data is filtered based on the Agilent Flag calls, the Agilent control probes are removed and the technical replicate probes are averaged, in order for them to be analysed using Limma *.
- the pool of probes is initially selected based on adjusted p-value, FC and CV ⁇ 30% (arbitrary cut off point) parameters for final picking. Further analyses and the final list are drawn based only on the first two parameters (adj. p-value; FC).
- EpiSwitch TM screening arrays are processed using the EpiSwitch TM Analytical Package in R in order to select high value EpiSwitch TM markers for translation on to the EpiSwitch TM PCR platform.
- FDR Fealse Discovery Rate
- the top 40 markers from the statistical lists are selected based on their ER for selection as markers for PCR translation.
- the top 20 markers with the highest negative ER load and the top 20 markers with the highest positive ER load form the list.
- the resultant markers from step 1 the statistically significant probes form the bases of enrichment analysis using hypergeometric enrichment (HE).
- HE hypergeometric enrichment
- the statistical probes are processed by HE to determine which genetic locations have an enrichment of statistically significant probes, indicating which genetic locations are hubs of epigenetic difference.
- the most significant enriched loci based on a corrected p-value are selected for probe list generation. Genetic locations below p-value of 0.3 or 0.2 are selected. The statistical probes mapping to these genetic locations, with the markers from step 2, form the high value markers for EpiSwitch TM PCR translation.
- EpiSwitch TM biomarker signatures demonstrate high robustness, sensitivity and specificity in the stratification of complex disease phenotypes. This technology takes advantage of the latest breakthroughs in the science of epigenetics, monitoring and evaluation of chromosome conformation signatures as a highly informative class of epigenetic biomarkers.
- Current research methodologies deployed in academic environment require from 3 to 7 days for biochemical processing of cellular material in order to detect CCSs. Those procedures have limited sensitivity, and reproducibility; and furthermore, do not have the benefit of the targeted insight provided by the EpiSwitch TM Analytical Package at the design stage.
- EpiSwitch TM Array CCS sites across the genome are directly evaluated by the EpiSwitch TM Array on clinical samples from testing cohorts for identification of all relevant stratifying lead biomarkers.
- the EpiSwitch TM Array platform is used for marker identification due to its high-throughput capacity, and its ability to screen large numbers of loci rapidly.
- the array used was the Agilent custom-CGH array, which allows markers identified through the in silico software to be interrogated.
- EpiSwitch TM Array Potential markers identified by EpiSwitch TM Array are then validated either by EpiSwitch TM PCR or DNA sequencers (i.e. Roche 454, Nanopore MinION, etc.). The top PCR markers which are statistically significant and display the best reproducibility are selected for further reduction into the final EpiSwitch TM Signature Set, and validated on an independent cohort of samples.
- EpiSwitch TM PCR can be performed by a trained technician following a standardised operating procedure protocol established. All protocols and manufacture of reagents are performed under ISO 13485 and 9001 accreditation to ensure the quality of the work and the ability to transfer the protocols.
- EpiSwitch TM PCR and EpiSwitch TM Array biomarker platforms are compatible with analysis of both whole blood and cell lines. The tests are sensitive enough to detect abnormalities in very low copy numbers using small volumes of blood.
- Figure 1 shows an example of clinical annotations of patients used in the study.
- Colour coded markings patients listed in red were used in array screening. Patients in blue were used as part of independent cohort for validation - those patient were not used for marker selection, which is important in development of robust biomarkers.
- Clinical assessment of response or no-response was defined by the standard RESIST 1.1 criteria.
- Stage 1 consist of the initial array screening and evaluation for the 14,000 marker leads (all predicted by pattern recognition).
- Stage 2 is the translation of statistically significant marker leads from array into PCR. Further evaluation by PCR of the markers by regression analysis for reduction of the final marker number in the final signature.
- Stage 3 is validation of the final signature of 6 best biomarkers (shown in Figure 2 ). The table in Figure 2 shows the names for the best biomarkers and the genetic loci in which they are positioned, i.e. in this loci they contribute in a particular way to the overall regulation.
- Figure 3 shows the Venn diagram for the best predictive biomarkers from array analysis (comparing baseline for responders and non-responders) and best response biomarkers (comparing responders at baseline and at 12 weeks). The overlap gives not only good response biomarkers that are present at the start for response, but also could be monitored over 12 weeks.
- Figure 4 is an example of a binary PCR readout on individual patients for some of the final signature biomarkers: 1 CCs is present, 0 CCS is absent. One can see visually the difference in profiles for responders and non-responders. R is a responder. NR is a non-responder.
- Figure 5 shows two groups of patients with lung cancer who were treated with anti-PD-L1 monoclonal antibody. Blood was collected at baseline prior to treatment (BL) and at two weeks after the start of treatment (2W). The identity of the two groups for response was established but in the original study had been blinded into group I and group II. The top best 30 PCR-based marker leads predictive for response from anti-PD-1 from the first study (see above) were evaluated on all the patients listed.
- Figure 6 show statistical analysis of the best top 13 statistically significant markers discriminating between groups I and II.
- PDCD1LG2 and STATS are also the top discriminating markers in the original anti-PD-1 study: PDCD1LG2 for non-responders, STAT5B for responders. This helps to identify the groups I and II as responder and non-responder groups correctly.
- the biomarkers monitor deregulation in the same immunotherapies checkpoint cellular network, triggered either by PD-1 in the first study or by its ligand PD-L1 in the second study, and thus have shared features with overlap on the same markers - 6 non-response markers, 7 response markers from the first study on PD-1 still being valid in the second study with PD-L1.
- Figure 7 shows a principle component analysis (PCA) of the top 13 markers selected from the PD-L1 cohort.
- PCA principle component analysis
- Figure 8 show how in a separate, third study, conducted on lung cancer patients with a different anti-PD-L1 monoclonal, 15 patient baseline samples were provided as blinded on annotation for response/no-response to treatment.
- a pool of markers was evaluated and the top 5 markers on statistical significance (listed in the table) were then used for classification of 15 blinded samples.
- Figure 9 shows how a Random Forest Classifier built on the listed 5 markers produces predicted calls for each of the 15 samples (column predicted).
- Figure 10 shows predicted calls for each sample compared against unblinded validations (column actual). The stratification efficiency is listed in the table. Sensitivity 71%, Specificity 87.5%, Positive predictive value 83% (important in this context of patient selection), negative predictive value 77%.
- Figure 11 shows the standard rOC curve for the classifier.
- AUC 0.786
- Figure 12 shows a principle component analysis for all the samples used in this analysis: 8 from the first study, 24 from the second, 15 from the validation. On the first principle components the separation for responders and non-responders is already obvious. There are only two miscalled samples in the open classifier for all 47 samples.
- the third study relates to anti-PD-L1 treatment in lung cancer.
- 12 responders and 12 non-responders were compared at base line on the array for a total of 180,000 readouts (in technical and biological repeats). There was then PCR translation for the top 100 marker leads from the array followed by validation.
- Figure 16 shows how the genetic loci for array reads for response and non-response markers (Studies I and III) overlap with genes involved in interferon gamma pathway.
- Interferon gamma treatment can increase PD-L1 expression, which is a clinical observation for predisposition for response to treatment.
- Figure 17 shows the same, but for statistical significant data only.
- Figure 18 shows the same, but for all studies I-III.
- Figure 19 shows Venn diagrams across four cohorts: gene loci (ORFs) for INFG pathway, anti-PD-L1 responders and non-responders, all anti-PD-1.
- ORFs gene loci for INFG pathway
- anti-PD-L1 responders and non-responders, all anti-PD-1.
- Figure 20 shows Venn diagrams across four cohorts: gene loci (ORFs) for INFG pathway, anti-PD-1 responders and non-responders, all anti-PD-L1
- Figure 21 shows all gene loci for responders markers shared between studies I-III and INFG genes.
- Figure 22 shows the same, but with the list of 95 loci that contain some of the significant response EpiSwitch markers shared between all three studies I-III.
- Figure 23 shows the loci list from Figure 22 showing the number of significant marker leads and total number of marker leads when these loci were evaluated on array.
- Figure 24 shows Interferon Signaling Pathway Matched to aPD-L1 significant EpiSwitch TM CCSs associated ORFs.
- markers have been identified that have statistically significant disseminating powers to identify in baseline patients those who are set up for good response to immunotherapies (including immunocheckpoint therapies), i.e. responders, and those who are not, i.e. non-responders, or progressors.
- the markers of Table 1 represent a common universal profile of responders across three independent cohorts with either melanoma or lung cancer (NSCLC).
- NSCLC lung cancer
- the list of markers in Table 1 reflects a common network regulation in responders. These can be used as agnostic markers to monitor response/non-response across various treatments and conditions, including in response to treatments targeting standard immunocheckpoint molecules controlling the immunological network response.
- CCSs chromosome conformation signatures
- NSCLC non-small cell lung cancer
- the discovered EpiSwitch TM markers from this array screen were then screened and validated using the EpiSwitch TM PCR platform using three immunotherapies cohorts, two anti-PD-L1 therapies and one anti-PD-1 therapy (Pembrolizumab) in baseline patients' samples.
- the two anti-PD-L1 response CCSs were developed on NSCLC patients and the Pembrolizumab response CCSs on melanoma patients and further validated on NSCLC patients.
- Table 15 provides the results of further work, and shows a further set of markers that can be used to determine immunoresponsiveness.
- PBMC peripheral blood mononuclear cells
- NSCLC non-small-cell lung carcinoma
- CD52 Fludarabine-refractory Chronic lymphocytic leukemia Cutaneous T-cell lymphoma Peripheral T-cell lymphoma T-cell prolymphocytic leukemia Ofatumumab (Second generation human IgG1 antibody).
- CD20 Chronic lymphocytic leukemia Follicular lymphoma Diffuse large B cell lymphoma Pegylated liposomal doxorubicin (PLD) plus motolimod (VTX2337).
- PLD Pegylated liposomal doxorubicin
- VTX2337 motolimod
- Sipuleucel-T Approved Cancer Vaccine
- Prostate cancer Rituximab monoclonal antibody.
- CD20 B-cell malignancies Aggressive and indolent lymphomas such as diffuse large B-cell lymphoma and follicular lymphoma and leukaemias such as B-cell chronic lymphocytic leukaemia Interferon gamma Combinatorial ablation and immunotherapy.
- Curative metastatic cancer treatment Polysaccharide-K Stimulate the immune systems of patients undergoing chemotherapy.
- Adoptive cell therapy Anti-CD47 antibodies.
- CD47 Polypurine reverse Hoogsteen oligonucleotides (PPRHs).
- GD2 BGB-A317 monooclonal antibody).
- PD-1 inhibitor Affimer biotherapeutic.
- PD-L1 inhibitor Polysaccharides Neoantigens Table 10.
- Combinations in cancer immunotherapy biologicals, immunocytokines (L19-IL2 and L19-TNF), cytotoxics (Paxlitaxel) Drug targets Preferred Disease Ipilimumab &Nivolumab PD-1 and CTLA-4 metastatic melanoma Paclitaxel, ipilimumab & carboplatin CTLA4 non-small-cell lung cancer Ipilimumab & GVAX CTLA-4 pancreatic cancer Pidilizumab & rituximab PD-1 hematologic malignancies L19-IL2 & L19-TNF STAT Melanoma MEDI0680 & Durvalumab PD1/PDL1 Advanced solid malignancies Table 11.
Landscapes
- Chemical & Material Sciences (AREA)
- Life Sciences & Earth Sciences (AREA)
- Health & Medical Sciences (AREA)
- Organic Chemistry (AREA)
- Proteomics, Peptides & Aminoacids (AREA)
- Engineering & Computer Science (AREA)
- Zoology (AREA)
- Wood Science & Technology (AREA)
- Immunology (AREA)
- Genetics & Genomics (AREA)
- Analytical Chemistry (AREA)
- Pathology (AREA)
- Microbiology (AREA)
- Biochemistry (AREA)
- Biophysics (AREA)
- Molecular Biology (AREA)
- Physics & Mathematics (AREA)
- General Health & Medical Sciences (AREA)
- General Engineering & Computer Science (AREA)
- Biotechnology (AREA)
- Bioinformatics & Cheminformatics (AREA)
- Hospice & Palliative Care (AREA)
- Oncology (AREA)
- Chemical Kinetics & Catalysis (AREA)
- Measuring Or Testing Involving Enzymes Or Micro-Organisms (AREA)
- Medicines Containing Antibodies Or Antigens For Use As Internal Diagnostic Agents (AREA)
- Medicines That Contain Protein Lipid Enzymes And Other Medicines (AREA)
- Saccharide Compounds (AREA)
Claims (7)
- Verfahren für das Bestimmen wie empfänglich ein Individuum für eine Anti-PD-1- oder Anti-PD-L1-Therapie ist, umfassend das Bestimmen, ob mindestens 10 Chromosomen-interaktionen in dem Individuum vorhanden sind oder fehlen,wobei die mindestens 10 Chromosomen-Interaktionen jeder beliebigen der 10 Chromosomen-Interaktionen entsprechen, die von einer der in Tabelle 1 gezeigten Sonden repräsentiert wird,und wobei das Vorhandensein oder Fehlen von mindestens der Chromosomen-Interaktion ORF712 9_120888366_120893320_120913546_120919710_RR, die der Sondensequenz AGTGCTGGGTTCCACACCTCTCAGCTCTTCGACCTCCAGGTCCCCCGCCACTTCCACG GC entspricht, bestimmt wird.
- Verfahren nach Anspruch 1, bei dem das Vorhandensein oder Fehlen der Chromosomen-Interaktionen bestimmt wird:- In einer Probe von einem Individuum und/oder- durch Erfassen des Vorhandenseins oder Fehlens einer DNA-Schleife an der Stelle der Chromosomen-Interaktionen und/oder- Erfassen des Vorhandenseins oder Fehlens von distalen Regionen eines Chromosoms, die in einer Chromosome Conformation zusammengebracht werden und/oder- durch Erfassen des Vorhandenseins einer ligierten Nukleinsäure, die während dieser Typisierung generiert wird und deren Sequenz zwei Regionen umfasst, die jeweils den Regionen des Chromosoms entsprechen, die in der Chromosomen-Interaktion zusammenkommen, wobei das Erfassen der ligierten Nukleinsäure vorzugsweise durch Nutzung einer Sonde erfolgt, die mindestens 70 % Identität mit jeder der in Tabelle 1 genannten spezifischen Sondensequenzen hat.
- Verfahren nach Anspruch 1 oder 2, wobei das Verfahren ausgeführt wird, um ein Individuum für eine medizinische Behandlung auszuwählen.
- Verfahren nach einem der vorhergehenden Ansprüche, wobei das Bestimmen des Vorhandenseins oder Fehlens der Chromosomen-Interaktionen eine spezifische Erfassung des ligierten Produkts durch quantitative PCR (qPCR) umfasst, die Primer verwendet, die in der Lage sind, das ligierte Produkt zu verstärken, und eine Sonde, die die Ligationsstelle während der PCR-Reaktion bindet, wobei die Sonde eine Sequenz umfasst, die komplementär zu einer Sequenz von jeder der Chromosomen-Regionen ist, die in der Chromosomen-Interaktion zusammengekommen sind.
- Verfahren nach Anspruch 4, wobei die Sonde Folgendes umfasst:Ein Oligonukleotid, das sich spezifisch an das ligierte Produkt bindet, und/oderein Fluorophor, das kovalent mit dem 5'-Ende des Oligonukleotids verbunden ist, und/oder ein Quencher, der kovalent mit dem 3'-Ende des Oligonukleotids verbunden ist.
- Verfahren nach Anspruch 4 oder 5, wobei:Das Fluorophor ausgewählt ist aus HEX, Texas Red und FAM; und/oderdie Sonde eine Nukleinsäuresequenz mit einer Länge von 10 bis 40 Nukleotidbasen umfasst.
- Verfahren nach Anspruch 6, wobei die Sonde eine Länge von 20 bis 30 Nukleotidbasen hat.
Applications Claiming Priority (3)
| Application Number | Priority Date | Filing Date | Title |
|---|---|---|---|
| US201762581287P | 2017-11-03 | 2017-11-03 | |
| GB2018052818 | 2018-10-03 | ||
| PCT/GB2018/053196 WO2019086898A2 (en) | 2017-11-03 | 2018-11-02 | Genetic regulation |
Publications (3)
| Publication Number | Publication Date |
|---|---|
| EP3704274A2 EP3704274A2 (de) | 2020-09-09 |
| EP3704274C0 EP3704274C0 (de) | 2024-04-17 |
| EP3704274B1 true EP3704274B1 (de) | 2024-04-17 |
Family
ID=64661410
Family Applications (1)
| Application Number | Title | Priority Date | Filing Date |
|---|---|---|---|
| EP18815789.5A Active EP3704274B1 (de) | 2017-11-03 | 2018-11-02 | Genetische regulierung der immunreaktion durch chromosomen-wechselwirkungen |
Country Status (11)
| Country | Link |
|---|---|
| US (1) | US11840737B2 (de) |
| EP (1) | EP3704274B1 (de) |
| JP (2) | JP2021501592A (de) |
| KR (1) | KR20200081380A (de) |
| CN (1) | CN111511930A (de) |
| AU (1) | AU2018361833B2 (de) |
| CA (1) | CA3078675A1 (de) |
| HU (1) | HUE066292T2 (de) |
| PL (1) | PL3704274T3 (de) |
| SG (1) | SG11202003233YA (de) |
| WO (1) | WO2019086898A2 (de) |
Families Citing this family (4)
| Publication number | Priority date | Publication date | Assignee | Title |
|---|---|---|---|---|
| AU2020344206B2 (en) * | 2019-09-11 | 2022-08-25 | Oxford BioDynamics PLC | Diagnostic chromosome marker |
| GB202008269D0 (en) * | 2020-06-02 | 2020-07-15 | Oxford Biodynamics Ltd | Detecting a chromosome marker |
| GB202016176D0 (en) * | 2020-10-12 | 2020-11-25 | Oxford BioDynamics PLC | Disease marker |
| TW202302862A (zh) * | 2021-03-04 | 2023-01-16 | 英商牛津生物力學公眾有限公司 | 染色體交互作用標記物 |
Citations (1)
| Publication number | Priority date | Publication date | Assignee | Title |
|---|---|---|---|---|
| WO2016207661A1 (en) * | 2015-06-24 | 2016-12-29 | Oxford Biodynamics Limited | Detection processes using sites of chromosome interaction |
Family Cites Families (8)
| Publication number | Priority date | Publication date | Assignee | Title |
|---|---|---|---|---|
| AR036993A1 (es) * | 2001-04-02 | 2004-10-20 | Wyeth Corp | Uso de agentes que modulan la interaccion entre pd-1 y sus ligandos en la submodulacion de respuestas inmunologicas |
| GB0603251D0 (en) | 2006-02-17 | 2006-03-29 | Isis Innovation | DNA conformation |
| US8642295B2 (en) * | 2007-01-11 | 2014-02-04 | Erasmus University Medical Center | Circular chromosome conformation capture (4C) |
| US20100210545A1 (en) * | 2007-10-15 | 2010-08-19 | Shinsuke Araki | Preventive/remedy for cancer |
| GB0810051D0 (en) | 2008-06-02 | 2008-07-09 | Oxford Biodynamics Ltd | Method of diagnosis |
| JP6148007B2 (ja) | 2009-05-12 | 2017-06-14 | コーニンクレッカ フィリップス エヌ ヴェKoninklijke Philips N.V. | 前立腺癌マーカーとしてのホスホジエステラーゼ4d7 |
| WO2014197369A1 (en) * | 2013-06-06 | 2014-12-11 | Dana-Farber Cancer Institute, Inc. | Compositions and methods for identification, assessment prevention, and treatment of cancer using pd-l1 isoforms |
| US20160299146A1 (en) | 2013-11-20 | 2016-10-13 | Dana-Farber Cancer Institute, Inc. | Kynurenine Pathway Biomarkers Predictive of Anti-Immune Checkpoint Inhibitor Response |
-
2018
- 2018-11-02 CN CN201880083380.6A patent/CN111511930A/zh active Pending
- 2018-11-02 KR KR1020207012736A patent/KR20200081380A/ko not_active Application Discontinuation
- 2018-11-02 JP JP2020524490A patent/JP2021501592A/ja active Pending
- 2018-11-02 CA CA3078675A patent/CA3078675A1/en active Pending
- 2018-11-02 HU HUE18815789A patent/HUE066292T2/hu unknown
- 2018-11-02 SG SG11202003233YA patent/SG11202003233YA/en unknown
- 2018-11-02 EP EP18815789.5A patent/EP3704274B1/de active Active
- 2018-11-02 WO PCT/GB2018/053196 patent/WO2019086898A2/en unknown
- 2018-11-02 AU AU2018361833A patent/AU2018361833B2/en active Active
- 2018-11-02 US US16/760,541 patent/US11840737B2/en active Active
- 2018-11-02 PL PL18815789.5T patent/PL3704274T3/pl unknown
-
2023
- 2023-04-03 JP JP2023060384A patent/JP2023082157A/ja active Pending
Patent Citations (3)
| Publication number | Priority date | Publication date | Assignee | Title |
|---|---|---|---|---|
| WO2016207661A1 (en) * | 2015-06-24 | 2016-12-29 | Oxford Biodynamics Limited | Detection processes using sites of chromosome interaction |
| WO2016207647A1 (en) * | 2015-06-24 | 2016-12-29 | Oxford Biodynamics Limited | Epigenetic chromosome interactions |
| WO2016207653A1 (en) * | 2015-06-24 | 2016-12-29 | Oxford Biodynamics Limited | Detection of chromosome interactions |
Also Published As
| Publication number | Publication date |
|---|---|
| SG11202003233YA (en) | 2020-05-28 |
| HUE066292T2 (hu) | 2024-07-28 |
| KR20200081380A (ko) | 2020-07-07 |
| WO2019086898A3 (en) | 2019-06-13 |
| US11840737B2 (en) | 2023-12-12 |
| WO2019086898A2 (en) | 2019-05-09 |
| EP3704274A2 (de) | 2020-09-09 |
| EP3704274C0 (de) | 2024-04-17 |
| JP2021501592A (ja) | 2021-01-21 |
| CN111511930A (zh) | 2020-08-07 |
| AU2018361833B2 (en) | 2021-04-22 |
| PL3704274T3 (pl) | 2024-07-08 |
| US20210230702A1 (en) | 2021-07-29 |
| CA3078675A1 (en) | 2019-05-09 |
| AU2018361833A1 (en) | 2020-04-30 |
| JP2023082157A (ja) | 2023-06-13 |
Similar Documents
| Publication | Publication Date | Title |
|---|---|---|
| JP7297015B2 (ja) | エピジェネティックな染色体相互作用 | |
| EP3704274B1 (de) | Genetische regulierung der immunreaktion durch chromosomen-wechselwirkungen | |
| US10570457B2 (en) | Methods for predicting drug responsiveness | |
| EP2982985A1 (de) | System zur vorhersage einer prognose von lokal fortgeschrittenem magenkrebs | |
| CN111187840B (zh) | 一种用于早期乳腺癌诊断的生物标志物 | |
| EP2527459A1 (de) | Blutbasierte Gendetektion von nichtkleinzelligem Lungenkrebs | |
| US20150099643A1 (en) | Blood-based gene expression signatures in lung cancer | |
| EP2520661A1 (de) | Blutbasierte Genexpressionssignaturen bei Lungenkrebs | |
| EP3548633B1 (de) | Anwendung von epigenetisch veränderten chromosomalen interaktionen in der krebsdiagnostik | |
| CN111269979A (zh) | Arid1b基因变异在预测肺腺癌患者对免疫检查点抑制剂疗法敏感性中的应用 | |
| AU2020344206B2 (en) | Diagnostic chromosome marker | |
| TW202242135A (zh) | 分析方法 | |
| CN109609649B (zh) | 一种用于直肠腺癌诊疗的lncRNA | |
| TW202302862A (zh) | 染色體交互作用標記物 | |
| CN117795098A (zh) | 染色体相互作用标志物 | |
| Engel et al. | Quantifying immune cell telomere content at single-cell resolution in context of PD-1 checkpoint immunotherapy | |
| WO2024038396A1 (en) | Method of detecting cancer dna in a sample | |
| CA3138719A1 (en) | Chromosome conformation markers of prostate cancer and lymphoma |
Legal Events
| Date | Code | Title | Description |
|---|---|---|---|
| STAA | Information on the status of an ep patent application or granted ep patent |
Free format text: STATUS: UNKNOWN |
|
| STAA | Information on the status of an ep patent application or granted ep patent |
Free format text: STATUS: THE INTERNATIONAL PUBLICATION HAS BEEN MADE |
|
| PUAI | Public reference made under article 153(3) epc to a published international application that has entered the european phase |
Free format text: ORIGINAL CODE: 0009012 |
|
| STAA | Information on the status of an ep patent application or granted ep patent |
Free format text: STATUS: REQUEST FOR EXAMINATION WAS MADE |
|
| 17P | Request for examination filed |
Effective date: 20200520 |
|
| AK | Designated contracting states |
Kind code of ref document: A2 Designated state(s): AL AT BE BG CH CY CZ DE DK EE ES FI FR GB GR HR HU IE IS IT LI LT LU LV MC MK MT NL NO PL PT RO RS SE SI SK SM TR |
|
| AX | Request for extension of the european patent |
Extension state: BA ME |
|
| DAV | Request for validation of the european patent (deleted) | ||
| DAX | Request for extension of the european patent (deleted) | ||
| REG | Reference to a national code |
Ref country code: HK Ref legal event code: DE Ref document number: 40033107 Country of ref document: HK |
|
| PUAG | Search results despatched under rule 164(2) epc together with communication from examining division |
Free format text: ORIGINAL CODE: 0009017 |
|
| STAA | Information on the status of an ep patent application or granted ep patent |
Free format text: STATUS: EXAMINATION IS IN PROGRESS |
|
| 17Q | First examination report despatched |
Effective date: 20211130 |
|
| B565 | Issuance of search results under rule 164(2) epc |
Effective date: 20211130 |
|
| RIC1 | Information provided on ipc code assigned before grant |
Ipc: C12Q 1/6886 20180101AFI20211125BHEP |
|
| GRAP | Despatch of communication of intention to grant a patent |
Free format text: ORIGINAL CODE: EPIDOSNIGR1 |
|
| STAA | Information on the status of an ep patent application or granted ep patent |
Free format text: STATUS: GRANT OF PATENT IS INTENDED |
|
| INTG | Intention to grant announced |
Effective date: 20231109 |
|
| RAP3 | Party data changed (applicant data changed or rights of an application transferred) |
Owner name: OXFORD BIODYNAMICS PLC |
|
| RIN1 | Information on inventor provided before grant (corrected) |
Inventor name: HUNTER, EWAN Inventor name: RAMADASS, AROUL SELVAM Inventor name: AKOULITCHEV, ALEXANDRE |
|
| GRAS | Grant fee paid |
Free format text: ORIGINAL CODE: EPIDOSNIGR3 |
|
| GRAA | (expected) grant |
Free format text: ORIGINAL CODE: 0009210 |
|
| STAA | Information on the status of an ep patent application or granted ep patent |
Free format text: STATUS: THE PATENT HAS BEEN GRANTED |
|
| AK | Designated contracting states |
Kind code of ref document: B1 Designated state(s): AL AT BE BG CH CY CZ DE DK EE ES FI FR GB GR HR HU IE IS IT LI LT LU LV MC MK MT NL NO PL PT RO RS SE SI SK SM TR |
|
| REG | Reference to a national code |
Ref country code: GB Ref legal event code: FG4D |
|
| REG | Reference to a national code |
Ref country code: CH Ref legal event code: EP |
|
| REG | Reference to a national code |
Ref country code: IE Ref legal event code: FG4D Ref country code: DE Ref legal event code: R096 Ref document number: 602018068267 Country of ref document: DE |
|
| U01 | Request for unitary effect filed |
Effective date: 20240508 |
|
| U07 | Unitary effect registered |
Designated state(s): AT BE BG DE DK EE FI FR IT LT LU LV MT NL PT SE SI Effective date: 20240522 |
|
| REG | Reference to a national code |
Ref country code: HU Ref legal event code: AG4A Ref document number: E066292 Country of ref document: HU |