EP3690410A2 - Inspection device and inspection learning model generation device - Google Patents
Inspection device and inspection learning model generation device Download PDFInfo
- Publication number
- EP3690410A2 EP3690410A2 EP20154611.6A EP20154611A EP3690410A2 EP 3690410 A2 EP3690410 A2 EP 3690410A2 EP 20154611 A EP20154611 A EP 20154611A EP 3690410 A2 EP3690410 A2 EP 3690410A2
- Authority
- EP
- European Patent Office
- Prior art keywords
- data
- inspection
- inspection object
- component
- learning model
- Prior art date
- Legal status (The legal status is an assumption and is not a legal conclusion. Google has not performed a legal analysis and makes no representation as to the accuracy of the status listed.)
- Ceased
Links
Images






Classifications
-
- G—PHYSICS
- G01—MEASURING; TESTING
- G01N—INVESTIGATING OR ANALYSING MATERIALS BY DETERMINING THEIR CHEMICAL OR PHYSICAL PROPERTIES
- G01N29/00—Investigating or analysing materials by the use of ultrasonic, sonic or infrasonic waves; Visualisation of the interior of objects by transmitting ultrasonic or sonic waves through the object
- G01N29/04—Analysing solids
- G01N29/12—Analysing solids by measuring frequency or resonance of acoustic waves
-
- G—PHYSICS
- G01—MEASURING; TESTING
- G01H—MEASUREMENT OF MECHANICAL VIBRATIONS OR ULTRASONIC, SONIC OR INFRASONIC WAVES
- G01H1/00—Measuring characteristics of vibrations in solids by using direct conduction to the detector
- G01H1/12—Measuring characteristics of vibrations in solids by using direct conduction to the detector of longitudinal or not specified vibrations
- G01H1/16—Amplitude
-
- G—PHYSICS
- G01—MEASURING; TESTING
- G01H—MEASUREMENT OF MECHANICAL VIBRATIONS OR ULTRASONIC, SONIC OR INFRASONIC WAVES
- G01H17/00—Measuring mechanical vibrations or ultrasonic, sonic or infrasonic waves, not provided for in the other groups of this subclass
-
- B—PERFORMING OPERATIONS; TRANSPORTING
- B62—LAND VEHICLES FOR TRAVELLING OTHERWISE THAN ON RAILS
- B62D—MOTOR VEHICLES; TRAILERS
- B62D5/00—Power-assisted or power-driven steering
- B62D5/04—Power-assisted or power-driven steering electrical, e.g. using an electric servo-motor connected to, or forming part of, the steering gear
- B62D5/0457—Power-assisted or power-driven steering electrical, e.g. using an electric servo-motor connected to, or forming part of, the steering gear characterised by control features of the drive means as such
- B62D5/0481—Power-assisted or power-driven steering electrical, e.g. using an electric servo-motor connected to, or forming part of, the steering gear characterised by control features of the drive means as such monitoring the steering system, e.g. failures
-
- G—PHYSICS
- G01—MEASURING; TESTING
- G01H—MEASUREMENT OF MECHANICAL VIBRATIONS OR ULTRASONIC, SONIC OR INFRASONIC WAVES
- G01H3/00—Measuring characteristics of vibrations by using a detector in a fluid
- G01H3/10—Amplitude; Power
-
- G—PHYSICS
- G01—MEASURING; TESTING
- G01M—TESTING STATIC OR DYNAMIC BALANCE OF MACHINES OR STRUCTURES; TESTING OF STRUCTURES OR APPARATUS, NOT OTHERWISE PROVIDED FOR
- G01M17/00—Testing of vehicles
- G01M17/007—Wheeled or endless-tracked vehicles
- G01M17/06—Steering behaviour; Rolling behaviour
-
- G—PHYSICS
- G01—MEASURING; TESTING
- G01N—INVESTIGATING OR ANALYSING MATERIALS BY DETERMINING THEIR CHEMICAL OR PHYSICAL PROPERTIES
- G01N29/00—Investigating or analysing materials by the use of ultrasonic, sonic or infrasonic waves; Visualisation of the interior of objects by transmitting ultrasonic or sonic waves through the object
- G01N29/14—Investigating or analysing materials by the use of ultrasonic, sonic or infrasonic waves; Visualisation of the interior of objects by transmitting ultrasonic or sonic waves through the object using acoustic emission techniques
-
- G—PHYSICS
- G01—MEASURING; TESTING
- G01N—INVESTIGATING OR ANALYSING MATERIALS BY DETERMINING THEIR CHEMICAL OR PHYSICAL PROPERTIES
- G01N29/00—Investigating or analysing materials by the use of ultrasonic, sonic or infrasonic waves; Visualisation of the interior of objects by transmitting ultrasonic or sonic waves through the object
- G01N29/44—Processing the detected response signal, e.g. electronic circuits specially adapted therefor
- G01N29/4472—Mathematical theories or simulation
-
- G—PHYSICS
- G01—MEASURING; TESTING
- G01N—INVESTIGATING OR ANALYSING MATERIALS BY DETERMINING THEIR CHEMICAL OR PHYSICAL PROPERTIES
- G01N29/00—Investigating or analysing materials by the use of ultrasonic, sonic or infrasonic waves; Visualisation of the interior of objects by transmitting ultrasonic or sonic waves through the object
- G01N29/44—Processing the detected response signal, e.g. electronic circuits specially adapted therefor
- G01N29/46—Processing the detected response signal, e.g. electronic circuits specially adapted therefor by spectral analysis, e.g. Fourier analysis or wavelet analysis
-
- G—PHYSICS
- G01—MEASURING; TESTING
- G01N—INVESTIGATING OR ANALYSING MATERIALS BY DETERMINING THEIR CHEMICAL OR PHYSICAL PROPERTIES
- G01N29/00—Investigating or analysing materials by the use of ultrasonic, sonic or infrasonic waves; Visualisation of the interior of objects by transmitting ultrasonic or sonic waves through the object
- G01N29/44—Processing the detected response signal, e.g. electronic circuits specially adapted therefor
- G01N29/48—Processing the detected response signal, e.g. electronic circuits specially adapted therefor by amplitude comparison
-
- G—PHYSICS
- G06—COMPUTING OR CALCULATING; COUNTING
- G06N—COMPUTING ARRANGEMENTS BASED ON SPECIFIC COMPUTATIONAL MODELS
- G06N20/00—Machine learning
-
- G—PHYSICS
- G01—MEASURING; TESTING
- G01H—MEASUREMENT OF MECHANICAL VIBRATIONS OR ULTRASONIC, SONIC OR INFRASONIC WAVES
- G01H1/00—Measuring characteristics of vibrations in solids by using direct conduction to the detector
- G01H1/10—Measuring characteristics of vibrations in solids by using direct conduction to the detector of torsional vibrations
-
- G—PHYSICS
- G01—MEASURING; TESTING
- G01N—INVESTIGATING OR ANALYSING MATERIALS BY DETERMINING THEIR CHEMICAL OR PHYSICAL PROPERTIES
- G01N2291/00—Indexing codes associated with group G01N29/00
- G01N2291/02—Indexing codes associated with the analysed material
- G01N2291/025—Change of phase or condition
- G01N2291/0258—Structural degradation, e.g. fatigue of composites, ageing of oils
-
- G—PHYSICS
- G06—COMPUTING OR CALCULATING; COUNTING
- G06F—ELECTRIC DIGITAL DATA PROCESSING
- G06F2218/00—Aspects of pattern recognition specially adapted for signal processing
- G06F2218/08—Feature extraction
Definitions
- the present invention relates to an inspection device and an inspection learning model generation device.
- Patent Literature 1 discloses a technique in which a microphone (a sound sensor) or an acceleration sensor is attached to an electric power steering device (an electric steering device) such that an abnormal sound generated from a component of the electric power steering device is detected by the microphone or the acceleration sensor in inspection of the electric power steering device.
- Patent Literature 2 discloses a technique of detecting an abnormal noise (a rattling sound) generated from a steering system (an electric steering device), when a vehicle is driven, by a microphone in an evaluation device (an inspection device) of the steering system.
- Patent Literature 2 discloses spectrogram data of an audio signal detected by the microphone.
- a detection signal obtained from the acceleration sensor or the sound sensor is time series data.
- a timing at which the abnormal sound is generated is not uniform in the time series data, so that a timing at which a feature amount necessary for the inspection using the obtained detection signal appears is also random.
- a difference in the timing at which the abnormal sound is generated does not affect presence or absence of an abnormality hidden in an inspection target.
- the randomness of the timing at which the abnormal sound is generated may adversely affect an inspection result.
- the generated inspection learning model is affected by the randomness of a time component at which the feature amount appears, so that good learning cannot be performed. As a result, even if the inspection is performed using the inspection learning model, sufficient inspection accuracy cannot be obtained.
- One or more embodiments provides an inspection device and an inspection learning model generation device that can obtain an inspection result in which an influence of a difference in time components is eliminated when performing an inspection using time series data.
- one or more embodiments provide an inspection device including a first data storage unit configured to store a first data which is time series according to a state of an inspection object, a second data generation unit configured to generate second data, which is a spectrogram including a first frequency component, a time component, and an amplitude component by performing short-time Fourier transform on the first data, a third data generation unit configured to generate third data including the first frequency component, a second frequency component, and the amplitude component by performing Fourier transform on time-amplitude data for each first frequency component in the second data, respectively, and a determination unit configured to determine the state of the inspection object based on the third data.
- the second data generation unit converts the first data of time series into the second data which is spectrogram including the first frequency component, the time component, and the amplitude component.
- the third data generation unit converts the second data into the third data including the first frequency component, the second frequency component, and the amplitude component. Then, the determination unit determines the state of the inspection object based on the third data.
- the third data is obtained by excluding the time component from the first data, and the determination unit determines the state of the inspection object using the data that does not include the time component. Accordingly, the inspection device can obtain the inspection result in which the influence due to the difference in the time component is eliminated when performing the inspection using the time series data.
- the inspection learning model generation device includes: a first data storage unit configured to store time series first data according to a state of an inspection object; a second data generation unit configured to generate second data, which is spectrogram including a first frequency component, a time component, and an amplitude component by performing short-time Fourier transform on the first data; a third data generation unit configured to generate third data including the first frequency component, a second frequency component, and the amplitude component by performing Fourier transform on time-amplitude data for each first frequency component in the second data, respectively; and a learning model generation unit configured to generate a learning model which is used to determine the state of the inspection object and in which fourth data is used as output data when the third data is used as input data. According to the inspection learning model generation device, the same effect as that of the inspection device can be obtained.
- the inspection device 100 targets an inspection object that operates when predetermined operation is performed, and is configured to determine a state of the inspection object based on time series data obtained when the inspection object is operating.
- the inspection object is, for example, a component of an electric steering device, and the inspection device 100 can be used for an inspection of the component of the electric steering device.
- the state of the inspection object is, for example, a degree of vibration of the inspection object, and the inspection device 100 can inspect the inspection object by determining a degree of vibration.
- the time series data is, for example, waveform data indicating operation of an output signal from a sensor capable of detecting the state of the inspection object.
- the inspection device 100 can determine the state of the inspection object by analyzing the time series data.
- the inspection object is a component of a column type electric steering device.
- the inspection device 100 determines whether the electric steering device is a non-defective product based on the degree of vibration generated from the component of the electric steering device that operates when predetermined operation is performed on the electric steering device. Specifically, the inspection device 100 sets the non-defective electric power steering device as a reference state electric steering device, and sets the time series data obtained from the non-defective electric steering device as reference time series data. Then, the inspection device 100 determines whether the electric steering device is a non-defective product based on a difference amount when the time series data obtained from the electric steering device is compared with the reference time series data.
- the inspection device 100 is used to inspect whether the inspection object is a non-defective product is described as an example, but the present invention is not limited thereto.
- the inspection device 100 may be used to inspect whether there is a specific defective factor.
- the inspection device 100 can identify a defective factor for the inspection object determined to be defective.
- the inspection object is not limited to a fixed component or a member, and a movable unit, a component to be deformed (for example, a motor or a speed reducer), or the like can be used as the inspection object.
- the inspection object is a component of column type electric steering device 50.
- the electric steering device 50 which is the inspection object mainly includes a steering mechanism 10, an intermediate shaft 20, and a turning mechanism 30.
- the steering mechanism 10 mainly includes a steering member 11, an input shaft 12, a torsion bar 13, an output shaft 14, and a steering assist mechanism 40.
- the steering member 11 is a handle operated by a driver.
- the input shaft 12 is a shaft member which connects the steering member 11 and the torsion bar 13.
- the input shaft 12 is configured to transmit rotation (steering) of the steering member 11 to the torsion bar 13.
- the torsion bar 13 connects the input shaft 12 and the output shaft 14 in a relatively rotatable manner. When relative rotation of the input shaft 12 and the output shaft 14 occurs, the torsion bar 13 is elastically deformed in a torsional direction.
- the output shaft 14 is a shaft member configured to output the rotation input from the steering member 11 via the input shaft 12 and the torsion bar 13 to the turning mechanism 30.
- the steering assist mechanism 40 is configured to assist the rotation of the output shaft 14 (assist the steering of the steering member 11). Details of the steering assist mechanism 40 will be described below.
- the intermediate shaft 20 is configured to transmit the rotation between the steering mechanism 10 and the turning mechanism 30.
- One axial end side of the intermediate shaft 20 is connected to the output shaft 14 of the steering mechanism 10 via a universal joint 21, and the other axial end side of the intermediate shaft 20 is connected to a pinion shaft 31 of the turning mechanism 30 via a universal joint 22.
- the turning mechanism 30 includes the pinion shaft 31, a turning shaft 32, and turned wheels 33.
- One axial end side of the pinion shaft 31 is connected to the output shaft 14 via the universal joint 22, and the other axial end side of the pinion shaft 31 is formed with a pinion 31a.
- the turning shaft 32 is formed with a rack 32a which meshes with the pinion 31a, and the turned wheels 33 are connected to both axial ends of the turning shaft 32 via a pair of tie rods 34 and a pair of knuckle arms 35.
- the turning mechanism 30 changes a turned angle of the turned wheels 33 by moving the turning shaft 32 in an axial direction (a vehicle width direction).
- the steering assist mechanism 40 includes a speed reducer 41, an electric motor 42, a torque sensor 43, a vehicle speed sensor 44, a rotation angle sensor 45, and a control unit 46.
- the speed reducer 41 is a worm speed reducer including a worm gear (not illustrated) and a worm wheel (not illustrated) which meshes with the worm gear.
- the worm gear is integrally and rotatably connected to a motor shaft of the electric motor 42, and the worm wheel is integrally and rotatably connected to the output shaft 14.
- the electric motor 42 is configured to rotationally drive the worm gear of the speed reducer 41. Rotation of the motor shaft of the electric motor 42 is transmitted to the turning mechanism 30 via the speed reducer 41, the output shaft 14, and the intermediate shaft 20, and is converted into a force for moving the turning shaft 32 in the axial direction in the turning mechanism 30.
- the torque sensor 43 is configured to detect steering torque applied to the steering member 11 based on a torsion amount of the torsion bar 13.
- the vehicle speed sensor 44 is configured to detect a vehicle speed of a vehicle (not illustrated) on which the electric steering device 50 is mounted.
- the rotation angle sensor 45 is configured to detect a rotation angle of the motor shaft of the electric motor 42.
- the control unit 46 is configured to set a target value of steering assist torque applied to the speed reducer 41 by the electric motor 42, and to control a current supplied to the electric motor 42 such that actual steering assist torque becomes the target value based on output signals from the torque sensor 43, the vehicle speed sensor 44, and the rotation angle sensor 45.
- the inspection system 1 uses the electric motor 42 and the speed reducer 41, which are components of the electric steering device 50, as inspection objects.
- the inspection system 1 includes an inspection device 100 and a sensor.
- the inspection system 1 includes, as sensors, two vibration sensors 151, 152, and one sound sensor 153. Types and quantities of the sensors provided in the inspection system 1 in the present embodiment are examples, and can be changed as appropriate. That is, the inspection system 1 may include a sensor other than the vibration sensors and the sound sensor.
- the number of the vibration sensors may be one or three or more, and the number of the sound sensors may be two or more.
- the vibration sensors 151, 152 are three-axis acceleration sensors capable of detecting vibration of the electric motor 42, and the two vibration sensors 151, 152 are attached to the electric motor 42 at positions separated from each other.
- the vibration sensor 151 is configured to detect acceleration (vibration) in three directions of the electric motor 42 that operates when the steering member 11 is rotated at a constant rotational speed, and to output an output signal corresponding to a degree of the acceleration to the inspection device 100.
- the sound sensor 153 is a microphone capable of detecting a sound generated from the speed reducer 41.
- the sound sensor 153 is provided in a vicinity of the speed reducer 41 and at a position where the sound generated from the speed reducer 41 can be detected.
- the sound sensor 153 is configured to detect a sound caused by vibration of the speed reducer 41 that operates when the steering member 11 is rotated at the constant rotation speed, and to output an output signal corresponding to a degree of the sound to the inspection device 100.
- the inspection device 100 is configured to analyze waveform data of seven patterns of the output signals obtained from the three sensors 151, 152, and 153, and to determine a state (a degree of vibration) of each of the electric motor 42 and the speed reducer 41 which are the inspection objects.
- the configuration of the inspection device 100 will be specifically described below.
- the inspection device 100 mainly includes a data conversion unit 110, a learning model generation unit 120, a learning model storage unit 130, and a determination unit 140.
- the data conversion unit 110, the learning model generation unit 120, and the learning model storage unit 130 function as a learning phase 101 of machine learning
- the data conversion unit 110, the learning model storage unit 130, and the determination unit 140 function as an inference phase 102 of the machine learning.
- the learning phase 101 is configured to generate a learning model M used to determine the state of the inspection object in the inference phase 102.
- the learning phase 101 corresponds to an inspection learning model generation device.
- the data conversion unit 110 includes a first data storage unit 111, a second data generation unit 112, and a third data generation unit 113.
- the first data storage unit 111 is configured to acquire the output signals from the vibration sensors 151, 152 and the sound sensor 153, and to store the waveform data of each output signal as time series first data D1.
- the second data generation unit 112 is configured to generate second data D2, which is spectrogram data including a first frequency component, a time component, and an amplitude component by performing short-time Fourier transform on the first data D1.
- the third data generation unit 113 is configured to generate third data D3 including the first frequency component, a second frequency component, and the amplitude component by performing Fourier transform on time-amplitude data for each first frequency component in the second data D2, respectively.
- the learning model generation unit 120 is configured to generate a learning model M to be used in determining the state of the inspection object in the inference phase 102.
- the learning model storage unit 130 is configured to store the learning model M generated by the learning model generation unit 120.
- the determination unit 140 is configured to determine the state of the inspection object using the learning model M in the inference phase 102.
- the first data D1 is output signals of the vibration sensors 151, 152 and the sound sensor 153.
- Fig. 4 shows waveform data of one detection signal from the vibration sensor 151 as an example of the first data D1.
- a horizontal axis indicates time t1
- a vertical axis indicates acceleration G which is an amplitude component.
- the vibration sensor 151 is capable of detecting vibration in each of three axes
- the first data storage unit 111 is configured to acquire and store three patterns of the first data D1 indicating the degree of vibration in each direction from the vibration sensor 151.
- the second data D2 is obtained by converting the first data D1 into data including a first frequency component, a time component, and an amplitude component.
- the second data generation unit 112 generates the second data D2 by performing the short-time Fourier transform on the first data D1.
- the second data generation unit 112 extracts short-time waveform data (first waveform data) of a minute time (for example, 0.1 seconds) from the waveform data of the first data D1, and performs Fourier transform on the extracted first waveform data.
- the short-time waveform data is time series data including a time component and the amplitude component (the acceleration G), and becomes waveform data including a first frequency component and an amplitude component by being subjected to Fourier transform.
- the second data generation unit 112 extracts short-time waveform data (second waveform data) of a minute time from the waveform data of the first data D1, and performs Fourier transform on the extracted second waveform data.
- the second waveform data is short-time waveform data obtained by shifting the time component by a predetermined time (for example, 0.05 seconds) with respect to the first waveform data.
- the second data generation unit 112 performs Fourier transform on each of pieces of all the waveform data extracted every minute time while shifting the time by the predetermined time from the waveform data of the first data D1.
- the second data generation unit 112 generates spectrogram data including the first frequency component, the time component, and the amplitude component (the acceleration G) based on a result of performing the Fourier transform on a plurality of pieces of the short-time waveform data.
- a horizontal axis indicates time t2
- a vertical axis indicates the first frequency f1
- a color indicates the acceleration G which is the amplitude component.
- the third data D3 is obtained by converting the second data D2 into data including the first frequency component, the second frequency component, and the amplitude component.
- the third data generation unit 113 is configured to generate the third data D3 by performing Fourier transform on time t2-amplitude data for each first frequency component in the second data D2, respectively.
- Fig. 7 shows an example of the time t2-amplitude data. Specifically, as shown in Fig. 7 , operation of the amplitude component (the acceleration G) at which the first frequency f1 is 4 kHz is represented by the time series data. As described above, the second data D2 is data generated by superimposing the time t2-amplitude data for each first frequency component.
- the third data generation unit 113 performs Fourier transform on the time t2-amplitude data for each first frequency component, and generates second frequency f2-amplitude data for each first frequency component.
- the amplitude component (the acceleration G) at which the first frequency f1 is 4 kHz is represented for each second frequency component.
- the third data generation unit 113 performs Fourier transform on the time t2-amplitude data included in the second data D2 for each first frequency component, and converts the time t2-amplitude data into data not including a time component.
- the third data generation unit 113 generates image data including the first frequency component, the second frequency component, and the amplitude component based on a plurality of pieces of the second frequency f2-amplitude data.
- Fig. 9 shows the image data with a specification approximate to the spectrogram data.
- a horizontal axis indicates the second frequency f2
- a vertical axis indicates the first frequency f1
- a color indicates the acceleration G which is the amplitude component.
- the third data generation unit 113 can convert the second data D2 which is the image data including the time component into the third data D3 which is image data not including the time component.
- the data conversion unit 110 converts the first data D1 which is the time series data into the third data D3 not including the time component.
- the learning model M is an automatic encoder including an input layer M1, an intermediate layer M2, and an output layer M3.
- the third data D3 is input to the input layer M1 as input data.
- the third data D3 is the image data.
- One piece of the third data D3 includes the same number of pieces of pixel data as the number of pixels, and each piece of pixel data is used as input data.
- the intermediate layer M2 includes a first intermediate layer M21 configured to compress a dimension of the input data and to extract a feature amount included in the input data, and a second intermediate layer M22 configured to expand the dimension of the compressed data and to set the dimension of the data to the same number as the dimension of the input data.
- the output layer M3 is configured to output fourth data D4 obtained by extracting a feature amount from the third data D3.
- the determination unit 140 determines the state of the inspection object using the third data D3 input to the learning model M as input data and the fourth data D4 output from the learning model M. Then, the inspection device 100 can obtain a highly accurate inspection result in the inference phase 102 by generating the learning model M that extracts an appropriate feature amount in the learning phase 101.
- the state of the inspection object to be inspected by the inspection device 100 is the degree of vibration of the electric motor 42 and the speed reducer 41 which are the components of the electric steering device 50.
- the inspection device 100 analyzes the vibration generated during operation of the electric motor 42 and the speed reducer 41, and determines whether the electric steering device 50 is a non-defective product.
- the inspection device 100 determines whether the inspection object is a non-defective product using the amplitude component and the frequency component included in the first data D1 and the second data D2.
- the time component included in the first data D1 and the second data D2 is not required for determining whether the inspection object is a non-defective product by the inspection device 100. That is, during the operation of the electric motor 42 and the speed reducer 41, a timing at which the vibration occurs does not affect a result of determining whether the electric steering device 50 is a non-defective product by the inspection device 100.
- the first data D1 and the second data D2 include the time component. Accordingly, when the learning model generation unit 120 generates the learning model M using the first data D1 and the second data D2 as the input data, there is a high possibility that the time component is included in the feature amount extracted in the intermediate layer M2. However, as described above, the time component included in the first data D1 and the second data D2 does not affect a result of determining whether the inspection object is a non-defective product. Accordingly, even if whether the inspection object is a non-defective product is determined using the learning model M that extracts the feature amount including the time component, the inspection device 100 cannot obtain the highly accurate result of determining whether the inspection object is a non-defective product.
- the inspection device 100 converts the first data including the time component and generates the third data D3 not including the time component. Then, the learning model generation unit 120 uses the generated third data D3 as the input data. Therefore, the learning model generation unit 120 can generate the learning model M that extracts the feature amount not including the time component in the intermediate layer M2.
- the fourth data D4 output from the learning model M is the image data obtained by extracting the feature amount included in the amplitude component and the frequency component (the first frequency component and the second frequency component) from the waveform data of the output signals of the vibration sensors 151, 152 and the sound sensor 153.
- the inference phase 102 determines whether the inspection object is a non-defective product, whereas the learning phase 101 uses the third data D3 of the inspection object which is a non-defective product as the input data when the learning model M is generated. That is, in the learning phase 101, the data conversion unit 110 generates the non-defective third data D3 based on the first data D1 obtained from the inspection object which is a non-defective product, and the learning model generation unit 120 uses the non-defective third data D3 as the input data and learns a large amount of pieces of the third data D3. Accordingly, the learning model M can extract an appropriate feature amount from the third data D3 in the intermediate layer M2.
- the learning model M outputs the fourth data D 4, which is not different from the third data D3, as the output data when the third data D3 of the inspection object which is a non-defective product is input in the inference phase 102.
- the learning model M outputs fourth data D4, which is different from the third data D3, as output data when the third data D3 of the inspection object which is a defective product is input in the inference phase 102.
- the determination unit 140 determines the state of the inspection object using the learning model M generated in the learning phase 101.
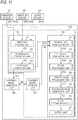
- the determination unit 140 includes a fourth data generation unit 141, a fifth data generation unit 142, a filter processing unit 143, a positive value processing unit 144, an evaluation value generation unit 145, a state determination unit 146, and an output unit 147.
- the fourth data generation unit 141 generates the fourth data D4. Specifically, when there are output signals from the vibration sensors 151, 152 and the sound sensor 153 in the inference phase 102, the data conversion unit 110 generates the third data D3 based on the first data D1. Thereafter, the determination unit 140 acquires the third data D3 generated by the third data generation unit 113 and the learning model M stored in the learning model storage unit 130. Then, the fourth data generation unit 141 inputs the third data D3 generated by the data conversion unit 110 to the learning model M, and generates the fourth data D4.
- the fifth data generation unit 142 is configured to generate fifth data D5 indicating a difference value obtained by calculating a difference between the third data D3 input to the learning model M and the fourth data D4 output from the learning model M by each coordinate of a two-dimensional coordinate system. Details of the fifth data D5 will be described below with reference to Figs. 12 to 14 .
- the filter processing unit 143 is configured to generate sixth data D6 by performing processing using a low-pass filter on the fifth data D5. That is, the filter processing unit 143 performs processing using the low-pass filter for each of the first frequency f1 and the second frequency f2. A reason why the fifth data D5 is processed using the low-pass filter will be described below with reference to Figs. 15A and 15B .
- the positive value processing unit 144 is configured to generate seventh data D7 by performing positive value processing on the sixth data D6.
- all coordinate values included in the sixth data D6 are set to 0 or positive values.
- the positive value processing unit 144 set all the coordinate values included in the sixth data D6 to 0 or positive values by squaring all the coordinate values.
- the present invention is not limited thereto, and the positive value processing unit 144 may set all the coordinate values to 0 or positive values by, for example, converting all the coordinate values included in the sixth data D6 into absolute values.
- the evaluation value generation unit 145 is configured to generate an evaluation value indicating a comparison result between the third data D3 and the fourth data D4 based on each coordinate value of the seventh data D7.
- the evaluation value generation unit 145 sets the seventh data D7 as target data to be used for comparison between the third data D3 and the fourth data D4, and obtains a sum of all the coordinate values of the seventh data D7.
- the evaluation value represents a difference amount between the third data D3 and the fourth data D4. The smaller the evaluation value is, the smaller the difference between the third data D3 and the fourth data D4 is, which indicates that the inspection object is a non-defective product.
- the state determination unit 146 is configured to determine a difference between a state of the inspection object and a reference state based on the comparison result between the third data D3 and the fourth data D4. That is, the state determination unit 146 sets the third data D3 generated based on the new first data D1 as the reference state to determine the difference between the state of the fourth data D4 and the state of the third data D3 which is the reference state. As a result, the state determination unit 146 determines that the electric steering device 50 is a non-defective product when a difference amount between the degree of vibration that can be grasped from the third data D3 and the degree of vibration that can be grasped from the fourth data D4 is small.
- the fourth data generation unit 141 determines that the inspection object is a non-defective product.
- the fourth data generation unit 141 generates the fourth data D4 that is different from the third data D3.
- the determination unit 140 can easily determine the inspection result for the inspection object.
- the state determination unit 146 determines that the state of the inspection object is included within a predetermined range from the reference state.
- the evaluation value generated by the evaluation value generation unit 145 is the preset threshold value or less
- the state determination unit 146 determines that the electric steering device 50 which is the inspection object is a non-defective product. Accordingly, the determination unit 140 can easily determine the inspection result for the inspection object.
- the output unit 147 is configured to output the determination result by the state determination unit 146 as the inspection result of the inspection device 100.
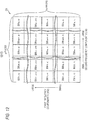
- image data of the third data D3 includes (a ⁇ b) pieces of pixel data having a pieces of pixel data in a horizontal axis direction indicating magnitude of the second frequency f2 and b pieces of pixel data in a vertical axis direction indicating magnitude of the first frequency f1.
- a value of the amplitude component of each piece of pixel data is represented by a color of a pixel
- the value of the amplitude component in the third data D3 is represented by a coordinate value in the two-dimensional coordinate system of the first frequency f1 and the second frequency f2.
- the value of the amplitude component indicated by a coordinate located at an m-th counted from a left and an n-th counted from a bottom is denoted as D3 (m, n).
- image data of the fourth data D4 includes the same number of pieces of pixel data as the third data D3.
- the value of the amplitude component in the fourth data D4 is represented by a coordinate value in the two-dimensional coordinate system of the first frequency component and the second frequency component.
- the value of the amplitude component indicated by a coordinate located at an m-th counted from a left and an n-th counted from a bottom is denoted as D4 (m, n).
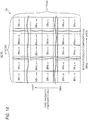
- the fifth data D5 is two-dimensional coordinate system data similar to the third data D3 and the fourth data D4 represented in the two-dimensional coordinate system.
- the coordinate value of the fifth data D5 is a difference value of the corresponding coordinate values of the third data D3 and the fourth data D4 represented in the two-dimensional coordinate system.
- the difference value of the amplitude component indicated by a coordinate located at an m-th counted from a left and an n-th counted from a bottom is denoted as D5 (m, n).
- D5 (m, n) is a value obtained by subtracting D4 (m, n) from D3 (m, n), so that if there is no difference in amplitude component between D3 (m, n) and D4 (m, n), D5 (m, n) is zero. On the other hand, if there is a difference in amplitude component between D3 (m, n) and D4 (m, n), D5 (m, n) is a positive value or a negative value.
- the fifth data D5 is processed using the low-pass filter
- a case is taken as an example where, in the third data D3, the second frequency f2 at which the value of the amplitude component increases is x1, and in the fourth data D4, the second frequency f2 at which the value of the amplitude component increases is x2, which is slightly larger than x1.
- the difference value of the amplitude component indicated by a coordinate located at an m-th counted from a left and an n-th counted from a bottom is denoted as D6 (m, n).
- Fig. 15A shows an example of the fifth data D5, and shows, for each second frequency component, a difference in the difference value in which the first frequency f1 is a specific value y.
- the difference in the second frequency f2 is within an error range, the difference does not affect the state determination (the determination whether the inspection object is a non-defective product) of the inspection object.
- D5 (x1, y) and D5 (x2, y) can be extreme values. Accordingly, an evaluation value generated by squaring each value of D5 (x1, y) and D5 (x2, y) directly in the positive value processing unit 144 and calculating a sum of the coordinate values after the positive value processing in the evaluation value generation unit 145 may be extremely large. That is, the state determination unit 146 is more likely to determine that the evaluation value is larger than a threshold value.
- the difference in the second frequency f2 does not actually affect the determination whether the inspection object is a non-defective product.
- the inspection device 100 is more likely to determine that the inspection object is a defective product even if the inspection object should be determined to be a non-defective product.
- the filter processing unit 143 performs processing using a low-pass filter on the fifth data D5.
- the determination unit 140 can reduce an influence of the coordinate value on the determination result by the state determination unit 146.
- the inspection device 100 can avoid determining that the inspection object is a defective product based on the error.
- the second data generation unit 112 converts the first data D1 of time series into the second data D2 which is spectrogram data including the first frequency component, the time component, and the amplitude component.
- the third data generation unit 113 converts the second data D2 into the third data D3 including the first frequency component, the second frequency component, and the amplitude component.
- the determination unit 140 determines the state of the inspection object based on the third data D3. That is, the third data D3 is obtained by excluding the time component from the first data D1, and the determination unit 140 determines the state of the inspection object using the data that does not include the time component.
- the inspection device 100 can obtain the inspection result in which the influence due to the difference in the time component is eliminated when performing the inspection using the time series data, and as a result, the inspection result with high accuracy can be obtained.
- the inspection device 100 can obtain a highly accurate inspection result by using the automatic encoder as the learning model M.
- the inspection device 100 uses the output signals of the vibration sensors 151, 152 and the sound sensor 153 as the first data D1. Therefore, the inspection system 1 can obtain a highly accurate inspection result by performing the inspection by the inspection device 100 while using a sensor used in a related art.
- the state determination unit 146 determines that the inspection object is a non-defective product. That is, even if the inspection object includes defective elements, the state determination unit 146 determines that the inspection object is a non-defective product if the number of the included defective elements is small.
- the third data D3 to be input by the learning model generation unit 120 is preferably generated based on the first data D1 obtained from the inspection object not including the defective elements. In this case, the inspection device 100 can prevent the state determination unit 146 from erroneously determining that the inspection object that is actually a defective product is a non-defective product.
- An inspection device includes a first data storage unit configured to store a first data which is time series according to a state of an inspection object, a second data generation unit configured to generate second data, which is a spectrogram including a first frequency component, a time component, and an amplitude component by performing short-time Fourier transform on the first data, a third data generation unit configured to generate third data including the first frequency component, a second frequency component, and the amplitude component by performing Fourier transform on time-amplitude data for each first frequency component in the second data, respectively, and a determination unit configured to determine the state of the inspection object based on the third data.
Landscapes
- Physics & Mathematics (AREA)
- Engineering & Computer Science (AREA)
- General Physics & Mathematics (AREA)
- Chemical & Material Sciences (AREA)
- Pathology (AREA)
- General Health & Medical Sciences (AREA)
- Biochemistry (AREA)
- Analytical Chemistry (AREA)
- Immunology (AREA)
- Signal Processing (AREA)
- Life Sciences & Earth Sciences (AREA)
- Health & Medical Sciences (AREA)
- Mathematical Physics (AREA)
- Software Systems (AREA)
- Theoretical Computer Science (AREA)
- Computer Vision & Pattern Recognition (AREA)
- Artificial Intelligence (AREA)
- Spectroscopy & Molecular Physics (AREA)
- Acoustics & Sound (AREA)
- General Engineering & Computer Science (AREA)
- Computing Systems (AREA)
- Medical Informatics (AREA)
- Evolutionary Computation (AREA)
- Data Mining & Analysis (AREA)
- Combustion & Propulsion (AREA)
- Transportation (AREA)
- Mechanical Engineering (AREA)
- Pure & Applied Mathematics (AREA)
- Mathematical Optimization (AREA)
- Mathematical Analysis (AREA)
- Algebra (AREA)
- Testing Of Devices, Machine Parts, Or Other Structures Thereof (AREA)
- Measurement Of Mechanical Vibrations Or Ultrasonic Waves (AREA)
- Power Steering Mechanism (AREA)
Abstract
Description
- The present invention relates to an inspection device and an inspection learning model generation device.
-
Patent Literature 1 discloses a technique in which a microphone (a sound sensor) or an acceleration sensor is attached to an electric power steering device (an electric steering device) such that an abnormal sound generated from a component of the electric power steering device is detected by the microphone or the acceleration sensor in inspection of the electric power steering device.Patent Literature 2 discloses a technique of detecting an abnormal noise (a rattling sound) generated from a steering system (an electric steering device), when a vehicle is driven, by a microphone in an evaluation device (an inspection device) of the steering system.Patent Literature 2 discloses spectrogram data of an audio signal detected by the microphone. - [Patent Literature 1]
JP-A-2006-153729 - [Patent Literature 2]
JP-A-2018-36269 - A detection signal obtained from the acceleration sensor or the sound sensor is time series data. A timing at which the abnormal sound is generated is not uniform in the time series data, so that a timing at which a feature amount necessary for the inspection using the obtained detection signal appears is also random. On the other hand, in the inspection of the electric steering device, a difference in the timing at which the abnormal sound is generated does not affect presence or absence of an abnormality hidden in an inspection target. However, when the inspection is performed by the inspection device using the time series data, the randomness of the timing at which the abnormal sound is generated may adversely affect an inspection result.
- For example, when an inspection learning model is generated by a machine learning algorithm with learning data using the obtained detection signal as it is, the generated inspection learning model is affected by the randomness of a time component at which the feature amount appears, so that good learning cannot be performed. As a result, even if the inspection is performed using the inspection learning model, sufficient inspection accuracy cannot be obtained.
- One or more embodiments provides an inspection device and an inspection learning model generation device that can obtain an inspection result in which an influence of a difference in time components is eliminated when performing an inspection using time series data.
- In an aspect (1), one or more embodiments provide an inspection device including a first data storage unit configured to store a first data which is time series according to a state of an inspection object, a second data generation unit configured to generate second data, which is a spectrogram including a first frequency component, a time component, and an amplitude component by performing short-time Fourier transform on the first data, a third data generation unit configured to generate third data including the first frequency component, a second frequency component, and the amplitude component by performing Fourier transform on time-amplitude data for each first frequency component in the second data, respectively, and a determination unit configured to determine the state of the inspection object based on the third data.
- According to the aspect (1), the second data generation unit converts the first data of time series into the second data which is spectrogram including the first frequency component, the time component, and the amplitude component. The third data generation unit converts the second data into the third data including the first frequency component, the second frequency component, and the amplitude component. Then, the determination unit determines the state of the inspection object based on the third data.
- That is, the third data is obtained by excluding the time component from the first data, and the determination unit determines the state of the inspection object using the data that does not include the time component. Accordingly, the inspection device can obtain the inspection result in which the influence due to the difference in the time component is eliminated when performing the inspection using the time series data.
- The inspection learning model generation device according to the present invention includes: a first data storage unit configured to store time series first data according to a state of an inspection object; a second data generation unit configured to generate second data, which is spectrogram including a first frequency component, a time component, and an amplitude component by performing short-time Fourier transform on the first data; a third data generation unit configured to generate third data including the first frequency component, a second frequency component, and the amplitude component by performing Fourier transform on time-amplitude data for each first frequency component in the second data, respectively; and a learning model generation unit configured to generate a learning model which is used to determine the state of the inspection object and in which fourth data is used as output data when the third data is used as input data. According to the inspection learning model generation device, the same effect as that of the inspection device can be obtained.
-
-
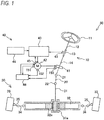
Fig. 1 illustrates a configuration of an inspection system. -
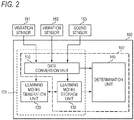
Fig. 2 is a schematic block diagram of an inspection device. -
Fig. 3 is a block diagram showing a configuration which functions as a learning phase in the inspection device. -
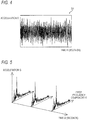
Fig. 4 is a diagram showing an example of waveform data which is first data of time series. -
Fig. 5 is a diagram showing a process of generating second data by a second data generation unit. -
Fig. 6 is a diagram showing an example of spectrogram data which is the second data. -
Fig. 7 is a diagram showing an example of time-amplitude data. -
Fig. 8 is a diagram showing an example of second frequency component-amplitude data. -
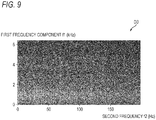
Fig. 9 is a diagram showing an example of image data which is third data. -
Fig. 10 is a diagram schematically showing a learning model. -
Fig. 11 is a block diagram showing a configuration which functions as an inference phase in the inspection device. -
Fig. 12 is a diagram showing the third data in a two-dimensional coordinate system. -
Fig. 13 is a diagram showing fourth data in the two-dimensional coordinate system. -
Fig. 14 is a diagram showing fifth data in the two-dimensional coordinate system. -
Fig. 15A shows, for each second frequency, an amplitude component whose first frequency component is a specific value in the fifth data. -
Fig. 15B shows, for each second frequency, an amplitude component whose first frequency component is a specific value in sixth data. - The
inspection device 100 targets an inspection object that operates when predetermined operation is performed, and is configured to determine a state of the inspection object based on time series data obtained when the inspection object is operating. The inspection object is, for example, a component of an electric steering device, and theinspection device 100 can be used for an inspection of the component of the electric steering device. The state of the inspection object is, for example, a degree of vibration of the inspection object, and theinspection device 100 can inspect the inspection object by determining a degree of vibration. The time series data is, for example, waveform data indicating operation of an output signal from a sensor capable of detecting the state of the inspection object. Theinspection device 100 can determine the state of the inspection object by analyzing the time series data. - In the present embodiment, the inspection object is a component of a column type electric steering device. The
inspection device 100 determines whether the electric steering device is a non-defective product based on the degree of vibration generated from the component of the electric steering device that operates when predetermined operation is performed on the electric steering device. Specifically, theinspection device 100 sets the non-defective electric power steering device as a reference state electric steering device, and sets the time series data obtained from the non-defective electric steering device as reference time series data. Then, theinspection device 100 determines whether the electric steering device is a non-defective product based on a difference amount when the time series data obtained from the electric steering device is compared with the reference time series data. - In the present embodiment, an example in which the
inspection device 100 is used to inspect whether the inspection object is a non-defective product is described as an example, but the present invention is not limited thereto. For example, theinspection device 100 may be used to inspect whether there is a specific defective factor. In this case, theinspection device 100 can identify a defective factor for the inspection object determined to be defective. The inspection object is not limited to a fixed component or a member, and a movable unit, a component to be deformed (for example, a motor or a speed reducer), or the like can be used as the inspection object. - First, the configuration of the inspection object and the configuration of the
inspection system 1 including theinspection device 100 will be described with reference toFig. 1 . As described above, the inspection object is a component of column typeelectric steering device 50. - As illustrated in
Fig. 1 , theelectric steering device 50 which is the inspection object mainly includes asteering mechanism 10, anintermediate shaft 20, and aturning mechanism 30. - The
steering mechanism 10 mainly includes asteering member 11, aninput shaft 12, atorsion bar 13, anoutput shaft 14, and asteering assist mechanism 40. The steeringmember 11 is a handle operated by a driver. Theinput shaft 12 is a shaft member which connects the steeringmember 11 and thetorsion bar 13. Theinput shaft 12 is configured to transmit rotation (steering) of the steeringmember 11 to thetorsion bar 13. Thetorsion bar 13 connects theinput shaft 12 and theoutput shaft 14 in a relatively rotatable manner. When relative rotation of theinput shaft 12 and theoutput shaft 14 occurs, thetorsion bar 13 is elastically deformed in a torsional direction. Theoutput shaft 14 is a shaft member configured to output the rotation input from the steeringmember 11 via theinput shaft 12 and thetorsion bar 13 to theturning mechanism 30. Thesteering assist mechanism 40 is configured to assist the rotation of the output shaft 14 (assist the steering of the steering member 11). Details of the steering assistmechanism 40 will be described below. - The
intermediate shaft 20 is configured to transmit the rotation between thesteering mechanism 10 and theturning mechanism 30. One axial end side of theintermediate shaft 20 is connected to theoutput shaft 14 of thesteering mechanism 10 via auniversal joint 21, and the other axial end side of theintermediate shaft 20 is connected to apinion shaft 31 of theturning mechanism 30 via auniversal joint 22. - The
turning mechanism 30 includes thepinion shaft 31, a turningshaft 32, and turnedwheels 33. One axial end side of thepinion shaft 31 is connected to theoutput shaft 14 via theuniversal joint 22, and the other axial end side of thepinion shaft 31 is formed with apinion 31a. The turningshaft 32 is formed with arack 32a which meshes with thepinion 31a, and the turnedwheels 33 are connected to both axial ends of the turningshaft 32 via a pair oftie rods 34 and a pair ofknuckle arms 35. Theturning mechanism 30 changes a turned angle of the turnedwheels 33 by moving the turningshaft 32 in an axial direction (a vehicle width direction). - Here, a configuration of the steering assist
mechanism 40 will be described. Thesteering assist mechanism 40 includes aspeed reducer 41, anelectric motor 42, atorque sensor 43, avehicle speed sensor 44, arotation angle sensor 45, and acontrol unit 46. - The
speed reducer 41 is a worm speed reducer including a worm gear (not illustrated) and a worm wheel (not illustrated) which meshes with the worm gear. The worm gear is integrally and rotatably connected to a motor shaft of theelectric motor 42, and the worm wheel is integrally and rotatably connected to theoutput shaft 14. Theelectric motor 42 is configured to rotationally drive the worm gear of thespeed reducer 41. Rotation of the motor shaft of theelectric motor 42 is transmitted to theturning mechanism 30 via thespeed reducer 41, theoutput shaft 14, and theintermediate shaft 20, and is converted into a force for moving the turningshaft 32 in the axial direction in theturning mechanism 30. - The
torque sensor 43 is configured to detect steering torque applied to the steeringmember 11 based on a torsion amount of thetorsion bar 13. Thevehicle speed sensor 44 is configured to detect a vehicle speed of a vehicle (not illustrated) on which theelectric steering device 50 is mounted. Therotation angle sensor 45 is configured to detect a rotation angle of the motor shaft of theelectric motor 42. Thecontrol unit 46 is configured to set a target value of steering assist torque applied to thespeed reducer 41 by theelectric motor 42, and to control a current supplied to theelectric motor 42 such that actual steering assist torque becomes the target value based on output signals from thetorque sensor 43, thevehicle speed sensor 44, and therotation angle sensor 45. - Next, the configuration of the
inspection system 1 will be described. Theinspection system 1 uses theelectric motor 42 and thespeed reducer 41, which are components of theelectric steering device 50, as inspection objects. Theinspection system 1 includes aninspection device 100 and a sensor. In the present embodiment, theinspection system 1 includes, as sensors, twovibration sensors sound sensor 153. Types and quantities of the sensors provided in theinspection system 1 in the present embodiment are examples, and can be changed as appropriate. That is, theinspection system 1 may include a sensor other than the vibration sensors and the sound sensor. In theinspection system 1, the number of the vibration sensors may be one or three or more, and the number of the sound sensors may be two or more. - The
vibration sensors electric motor 42, and the twovibration sensors electric motor 42 at positions separated from each other. In theinspection system 1, thevibration sensor 151 is configured to detect acceleration (vibration) in three directions of theelectric motor 42 that operates when the steeringmember 11 is rotated at a constant rotational speed, and to output an output signal corresponding to a degree of the acceleration to theinspection device 100. Thesound sensor 153 is a microphone capable of detecting a sound generated from thespeed reducer 41. Thesound sensor 153 is provided in a vicinity of thespeed reducer 41 and at a position where the sound generated from thespeed reducer 41 can be detected. In theinspection system 1, thesound sensor 153 is configured to detect a sound caused by vibration of thespeed reducer 41 that operates when the steeringmember 11 is rotated at the constant rotation speed, and to output an output signal corresponding to a degree of the sound to theinspection device 100. - The
inspection device 100 is configured to analyze waveform data of seven patterns of the output signals obtained from the threesensors electric motor 42 and thespeed reducer 41 which are the inspection objects. The configuration of theinspection device 100 will be specifically described below. - Next, the schematic configuration of the
inspection device 100 will be described with reference toFig. 2 . As shown inFig. 2 , theinspection device 100 mainly includes adata conversion unit 110, a learningmodel generation unit 120, a learningmodel storage unit 130, and adetermination unit 140. Among these, thedata conversion unit 110, the learningmodel generation unit 120, and the learningmodel storage unit 130 function as alearning phase 101 of machine learning, and thedata conversion unit 110, the learningmodel storage unit 130, and thedetermination unit 140 function as aninference phase 102 of the machine learning. - The
learning phase 101 is configured to generate a learning model M used to determine the state of the inspection object in theinference phase 102. Thelearning phase 101 corresponds to an inspection learning model generation device. - As shown in
Fig. 3 , thedata conversion unit 110 includes a firstdata storage unit 111, a seconddata generation unit 112, and a thirddata generation unit 113. The firstdata storage unit 111 is configured to acquire the output signals from thevibration sensors sound sensor 153, and to store the waveform data of each output signal as time series first data D1. The seconddata generation unit 112 is configured to generate second data D2, which is spectrogram data including a first frequency component, a time component, and an amplitude component by performing short-time Fourier transform on the first data D1. The thirddata generation unit 113 is configured to generate third data D3 including the first frequency component, a second frequency component, and the amplitude component by performing Fourier transform on time-amplitude data for each first frequency component in the second data D2, respectively. - The learning
model generation unit 120 is configured to generate a learning model M to be used in determining the state of the inspection object in theinference phase 102. The learningmodel storage unit 130 is configured to store the learning model M generated by the learningmodel generation unit 120. Thedetermination unit 140 is configured to determine the state of the inspection object using the learning model M in theinference phase 102. - Next, the first data D1 will be described with reference to
Fig. 4 . In the present embodiment, the first data D1 is output signals of thevibration sensors sound sensor 153.Fig. 4 shows waveform data of one detection signal from thevibration sensor 151 as an example of the first data D1. In the first data D1 shown inFig. 4 , a horizontal axis indicates time t1, and a vertical axis indicates acceleration G which is an amplitude component. Thevibration sensor 151 is capable of detecting vibration in each of three axes, and the firstdata storage unit 111 is configured to acquire and store three patterns of the first data D1 indicating the degree of vibration in each direction from thevibration sensor 151. - Next, the second data D2 will be described with reference to
Figs. 5 and6 . The second data D2 is obtained by converting the first data D1 into data including a first frequency component, a time component, and an amplitude component. As described above, the seconddata generation unit 112 generates the second data D2 by performing the short-time Fourier transform on the first data D1. - Specifically, as shown in
Fig. 5 , the seconddata generation unit 112 extracts short-time waveform data (first waveform data) of a minute time (for example, 0.1 seconds) from the waveform data of the first data D1, and performs Fourier transform on the extracted first waveform data. The short-time waveform data is time series data including a time component and the amplitude component (the acceleration G), and becomes waveform data including a first frequency component and an amplitude component by being subjected to Fourier transform. - Subsequently, the second
data generation unit 112 extracts short-time waveform data (second waveform data) of a minute time from the waveform data of the first data D1, and performs Fourier transform on the extracted second waveform data. The second waveform data is short-time waveform data obtained by shifting the time component by a predetermined time (for example, 0.05 seconds) with respect to the first waveform data. As described above, the seconddata generation unit 112 performs Fourier transform on each of pieces of all the waveform data extracted every minute time while shifting the time by the predetermined time from the waveform data of the first data D1. - Then, as shown in
Fig. 6 , the seconddata generation unit 112 generates spectrogram data including the first frequency component, the time component, and the amplitude component (the acceleration G) based on a result of performing the Fourier transform on a plurality of pieces of the short-time waveform data. In the spectrogram data shown inFig. 6 , a horizontal axis indicates time t2, a vertical axis indicates the first frequency f1, and a color indicates the acceleration G which is the amplitude component. - Next, the third data D3 will be described with reference to
Figs. 7 to 9 . The third data D3 is obtained by converting the second data D2 into data including the first frequency component, the second frequency component, and the amplitude component. The thirddata generation unit 113 is configured to generate the third data D3 by performing Fourier transform on time t2-amplitude data for each first frequency component in the second data D2, respectively. -
Fig. 7 shows an example of the time t2-amplitude data. Specifically, as shown inFig. 7 , operation of the amplitude component (the acceleration G) at which the first frequency f1 is 4 kHz is represented by the time series data. As described above, the second data D2 is data generated by superimposing the time t2-amplitude data for each first frequency component. - Then, as shown in
Fig. 8 , the thirddata generation unit 113 performs Fourier transform on the time t2-amplitude data for each first frequency component, and generates second frequency f2-amplitude data for each first frequency component. As shown inFig. 8 , the amplitude component (the acceleration G) at which the first frequency f1 is 4 kHz is represented for each second frequency component. As described above, the thirddata generation unit 113 performs Fourier transform on the time t2-amplitude data included in the second data D2 for each first frequency component, and converts the time t2-amplitude data into data not including a time component. - Then, as shown in
Fig. 9 , the thirddata generation unit 113 generates image data including the first frequency component, the second frequency component, and the amplitude component based on a plurality of pieces of the second frequency f2-amplitude data.Fig. 9 shows the image data with a specification approximate to the spectrogram data. A horizontal axis indicates the second frequency f2, a vertical axis indicates the first frequency f1, and a color indicates the acceleration G which is the amplitude component. Accordingly, the thirddata generation unit 113 can convert the second data D2 which is the image data including the time component into the third data D3 which is image data not including the time component. Accordingly, thedata conversion unit 110 converts the first data D1 which is the time series data into the third data D3 not including the time component. - Next, the learning model M will be described with reference to
Fig. 10 . As shown inFig. 10 , the learning model M is an automatic encoder including an input layer M1, an intermediate layer M2, and an output layer M3. The third data D3 is input to the input layer M1 as input data. The third data D3 is the image data. One piece of the third data D3 includes the same number of pieces of pixel data as the number of pixels, and each piece of pixel data is used as input data. The intermediate layer M2 includes a first intermediate layer M21 configured to compress a dimension of the input data and to extract a feature amount included in the input data, and a second intermediate layer M22 configured to expand the dimension of the compressed data and to set the dimension of the data to the same number as the dimension of the input data. The output layer M3 is configured to output fourth data D4 obtained by extracting a feature amount from the third data D3. - As described below, the
determination unit 140 determines the state of the inspection object using the third data D3 input to the learning model M as input data and the fourth data D4 output from the learning model M. Then, theinspection device 100 can obtain a highly accurate inspection result in theinference phase 102 by generating the learning model M that extracts an appropriate feature amount in thelearning phase 101. - In the present embodiment, the state of the inspection object to be inspected by the
inspection device 100 is the degree of vibration of theelectric motor 42 and thespeed reducer 41 which are the components of theelectric steering device 50. Theinspection device 100 analyzes the vibration generated during operation of theelectric motor 42 and thespeed reducer 41, and determines whether theelectric steering device 50 is a non-defective product. - In this regard, the
inspection device 100 determines whether the inspection object is a non-defective product using the amplitude component and the frequency component included in the first data D1 and the second data D2. On the other hand, the time component included in the first data D1 and the second data D2 is not required for determining whether the inspection object is a non-defective product by theinspection device 100. That is, during the operation of theelectric motor 42 and thespeed reducer 41, a timing at which the vibration occurs does not affect a result of determining whether theelectric steering device 50 is a non-defective product by theinspection device 100. - On the other hand, the first data D1 and the second data D2 include the time component. Accordingly, when the learning
model generation unit 120 generates the learning model M using the first data D1 and the second data D2 as the input data, there is a high possibility that the time component is included in the feature amount extracted in the intermediate layer M2. However, as described above, the time component included in the first data D1 and the second data D2 does not affect a result of determining whether the inspection object is a non-defective product. Accordingly, even if whether the inspection object is a non-defective product is determined using the learning model M that extracts the feature amount including the time component, theinspection device 100 cannot obtain the highly accurate result of determining whether the inspection object is a non-defective product. - Therefore, in the
data conversion unit 110, theinspection device 100 converts the first data including the time component and generates the third data D3 not including the time component. Then, the learningmodel generation unit 120 uses the generated third data D3 as the input data. Therefore, the learningmodel generation unit 120 can generate the learning model M that extracts the feature amount not including the time component in the intermediate layer M2. The fourth data D4 output from the learning model M is the image data obtained by extracting the feature amount included in the amplitude component and the frequency component (the first frequency component and the second frequency component) from the waveform data of the output signals of thevibration sensors sound sensor 153. - In the present embodiment, the
inference phase 102 determines whether the inspection object is a non-defective product, whereas thelearning phase 101 uses the third data D3 of the inspection object which is a non-defective product as the input data when the learning model M is generated. That is, in thelearning phase 101, thedata conversion unit 110 generates the non-defective third data D3 based on the first data D1 obtained from the inspection object which is a non-defective product, and the learningmodel generation unit 120 uses the non-defective third data D3 as the input data and learns a large amount of pieces of the third data D3. Accordingly, the learning model M can extract an appropriate feature amount from the third data D3 in the intermediate layer M2. - As a result, the learning model M outputs the
fourth data D 4, which is not different from the third data D3, as the output data when the third data D3 of the inspection object which is a non-defective product is input in theinference phase 102. On the other hand, the learning model M outputs fourth data D4, which is different from the third data D3, as output data when the third data D3 of the inspection object which is a defective product is input in theinference phase 102. - Next, the configuration of the
determination unit 140 that functions only in theinference phase 102 will be described. In theinference phase 102, thedetermination unit 140 determines the state of the inspection object using the learning model M generated in thelearning phase 101. - As shown in
Fig. 11 , thedetermination unit 140 includes a fourthdata generation unit 141, a fifthdata generation unit 142, a filter processing unit 143, a positivevalue processing unit 144, an evaluationvalue generation unit 145, a state determination unit 146, and anoutput unit 147. - The fourth
data generation unit 141 generates the fourth data D4. Specifically, when there are output signals from thevibration sensors sound sensor 153 in theinference phase 102, thedata conversion unit 110 generates the third data D3 based on the first data D1. Thereafter, thedetermination unit 140 acquires the third data D3 generated by the thirddata generation unit 113 and the learning model M stored in the learningmodel storage unit 130. Then, the fourthdata generation unit 141 inputs the third data D3 generated by thedata conversion unit 110 to the learning model M, and generates the fourth data D4. - The fifth
data generation unit 142 is configured to generate fifth data D5 indicating a difference value obtained by calculating a difference between the third data D3 input to the learning model M and the fourth data D4 output from the learning model M by each coordinate of a two-dimensional coordinate system. Details of the fifth data D5 will be described below with reference toFigs. 12 to 14 . - The filter processing unit 143 is configured to generate sixth data D6 by performing processing using a low-pass filter on the fifth data D5. That is, the filter processing unit 143 performs processing using the low-pass filter for each of the first frequency f1 and the second frequency f2. A reason why the fifth data D5 is processed using the low-pass filter will be described below with reference to
Figs. 15A and 15B . - The positive
value processing unit 144 is configured to generate seventh data D7 by performing positive value processing on the sixth data D6. In the positive value processing, all coordinate values included in the sixth data D6 are set to 0 or positive values. In the present embodiment, the positivevalue processing unit 144 set all the coordinate values included in the sixth data D6 to 0 or positive values by squaring all the coordinate values. However, the present invention is not limited thereto, and the positivevalue processing unit 144 may set all the coordinate values to 0 or positive values by, for example, converting all the coordinate values included in the sixth data D6 into absolute values. - The evaluation
value generation unit 145 is configured to generate an evaluation value indicating a comparison result between the third data D3 and the fourth data D4 based on each coordinate value of the seventh data D7. In the present embodiment, the evaluationvalue generation unit 145 sets the seventh data D7 as target data to be used for comparison between the third data D3 and the fourth data D4, and obtains a sum of all the coordinate values of the seventh data D7. The evaluation value represents a difference amount between the third data D3 and the fourth data D4. The smaller the evaluation value is, the smaller the difference between the third data D3 and the fourth data D4 is, which indicates that the inspection object is a non-defective product. - The state determination unit 146 is configured to determine a difference between a state of the inspection object and a reference state based on the comparison result between the third data D3 and the fourth data D4. That is, the state determination unit 146 sets the third data D3 generated based on the new first data D1 as the reference state to determine the difference between the state of the fourth data D4 and the state of the third data D3 which is the reference state. As a result, the state determination unit 146 determines that the
electric steering device 50 is a non-defective product when a difference amount between the degree of vibration that can be grasped from the third data D3 and the degree of vibration that can be grasped from the fourth data D4 is small. - Specifically, if the inspection object is a non-defective product, the fourth
data generation unit 141 generates the fourth data D4 that is not different from the third data D3. Therefore, in this case, the state determination unit 146 determines that the inspection object is a non-defective product. On the other hand, if the inspection object is a defective product, the fourthdata generation unit 141 generates the fourth data D4 that is different from the third data D3. As a result, if the difference between the third data D3 and the fourth data D4 is large, the state determination unit 146 determines that the inspection object is a defective product. Thus, thedetermination unit 140 can easily determine the inspection result for the inspection object. - When the evaluation value is a preset threshold value or less, the state determination unit 146 determines that the state of the inspection object is included within a predetermined range from the reference state. In the present embodiment, when the evaluation value generated by the evaluation
value generation unit 145 is the preset threshold value or less, the state determination unit 146 determines that theelectric steering device 50 which is the inspection object is a non-defective product. Accordingly, thedetermination unit 140 can easily determine the inspection result for the inspection object. Then, theoutput unit 147 is configured to output the determination result by the state determination unit 146 as the inspection result of theinspection device 100. - Here, as shown in
Fig. 12 , image data of the third data D3 includes (a×b) pieces of pixel data having a pieces of pixel data in a horizontal axis direction indicating magnitude of the second frequency f2 and b pieces of pixel data in a vertical axis direction indicating magnitude of the first frequency f1. In the third data D3, a value of the amplitude component of each piece of pixel data is represented by a color of a pixel, whereas inFig. 12 , the value of the amplitude component in the third data D3 is represented by a coordinate value in the two-dimensional coordinate system of the first frequency f1 and the second frequency f2. Among coordinates of the third data D3 represented in the two-dimensional coordinate system, the value of the amplitude component indicated by a coordinate located at an m-th counted from a left and an n-th counted from a bottom is denoted as D3 (m, n). - As shown in
Fig. 13 , image data of the fourth data D4 includes the same number of pieces of pixel data as the third data D3. InFig. 13 , similarly toFig. 12 , the value of the amplitude component in the fourth data D4 is represented by a coordinate value in the two-dimensional coordinate system of the first frequency component and the second frequency component. Among coordinates of the fourth data D4 represented in the two-dimensional coordinate system, the value of the amplitude component indicated by a coordinate located at an m-th counted from a left and an n-th counted from a bottom is denoted as D4 (m, n). - As shown in
Fig. 14 , the fifth data D5 is two-dimensional coordinate system data similar to the third data D3 and the fourth data D4 represented in the two-dimensional coordinate system. The coordinate value of the fifth data D5 is a difference value of the corresponding coordinate values of the third data D3 and the fourth data D4 represented in the two-dimensional coordinate system. Among coordinates of the fifth data D5 represented in the two-dimensional coordinate system, the difference value of the amplitude component indicated by a coordinate located at an m-th counted from a left and an n-th counted from a bottom is denoted as D5 (m, n). - D5 (m, n) is a value obtained by subtracting D4 (m, n) from D3 (m, n), so that if there is no difference in amplitude component between D3 (m, n) and D4 (m, n), D5 (m, n) is zero. On the other hand, if there is a difference in amplitude component between D3 (m, n) and D4 (m, n), D5 (m, n) is a positive value or a negative value.
- Next, a reason why the fifth data D5 is processed using the low-pass filter will be described with reference to
Figs. 15A and 15B . Here, a case is taken as an example where, in the third data D3, the second frequency f2 at which the value of the amplitude component increases is x1, and in the fourth data D4, the second frequency f2 at which the value of the amplitude component increases is x2, which is slightly larger than x1. Among coordinates of the sixth data D6 represented in the two-dimensional coordinate system, the difference value of the amplitude component indicated by a coordinate located at an m-th counted from a left and an n-th counted from a bottom is denoted as D6 (m, n). -
Fig. 15A shows an example of the fifth data D5, and shows, for each second frequency component, a difference in the difference value in which the first frequency f1 is a specific value y. In the example shown inFig. 15A , when the second frequency f2 is x1, the difference value (D5 (x1, y) = D3 (x1, y) - D4 (x1, y)) of the amplitude component is extremely large. On the other hand, when the second frequency f2 is x2, the difference value (D5 (x2, y) = D3 (x2, y) - D4 (x2, y)) of the amplitude component is extremely small. - In fact, if the difference in the second frequency f2 is within an error range, the difference does not affect the state determination (the determination whether the inspection object is a non-defective product) of the inspection object. However, in the fifth data D5, when the difference in the second frequency f2 is within the error range, D5 (x1, y) and D5 (x2, y) can be extreme values. Accordingly, an evaluation value generated by squaring each value of D5 (x1, y) and D5 (x2, y) directly in the positive
value processing unit 144 and calculating a sum of the coordinate values after the positive value processing in the evaluationvalue generation unit 145 may be extremely large. That is, the state determination unit 146 is more likely to determine that the evaluation value is larger than a threshold value. As a result, the difference in the second frequency f2 does not actually affect the determination whether the inspection object is a non-defective product. Theinspection device 100 is more likely to determine that the inspection object is a defective product even if the inspection object should be determined to be a non-defective product. - On the other hand, in the
determination unit 140, the filter processing unit 143 performs processing using a low-pass filter on the fifth data D5. In this case, when the coordinate value is an extreme value in the fifth data D5, thedetermination unit 140 can reduce an influence of the coordinate value on the determination result by the state determination unit 146. As a result, when the difference between the first frequency f1 and the second frequency f2 is an error that does not affect the state determination (the determination whether the inspection object is a non-defective product) of the inspection object, theinspection device 100 can avoid determining that the inspection object is a defective product based on the error. - As described above, in the
inspection device 100, the seconddata generation unit 112 converts the first data D1 of time series into the second data D2 which is spectrogram data including the first frequency component, the time component, and the amplitude component. The thirddata generation unit 113 converts the second data D2 into the third data D3 including the first frequency component, the second frequency component, and the amplitude component. Then, thedetermination unit 140 determines the state of the inspection object based on the third data D3. That is, the third data D3 is obtained by excluding the time component from the first data D1, and thedetermination unit 140 determines the state of the inspection object using the data that does not include the time component. Accordingly, theinspection device 100 can obtain the inspection result in which the influence due to the difference in the time component is eliminated when performing the inspection using the time series data, and as a result, the inspection result with high accuracy can be obtained. Theinspection device 100 can obtain a highly accurate inspection result by using the automatic encoder as the learning model M. - The
inspection device 100 uses the output signals of thevibration sensors sound sensor 153 as the first data D1. Therefore, theinspection system 1 can obtain a highly accurate inspection result by performing the inspection by theinspection device 100 while using a sensor used in a related art. - In the
inference phase 102, when the evaluation value is the threshold value or less, the state determination unit 146 determines that the inspection object is a non-defective product. That is, even if the inspection object includes defective elements, the state determination unit 146 determines that the inspection object is a non-defective product if the number of the included defective elements is small. On the other hand, in thelearning phase 101, the third data D3 to be input by the learningmodel generation unit 120 is preferably generated based on the first data D1 obtained from the inspection object not including the defective elements. In this case, theinspection device 100 can prevent the state determination unit 146 from erroneously determining that the inspection object that is actually a defective product is a non-defective product. - An inspection device includes a first data storage unit configured to store a first data which is time series according to a state of an inspection object, a second data generation unit configured to generate second data, which is a spectrogram including a first frequency component, a time component, and an amplitude component by performing short-time Fourier transform on the first data, a third data generation unit configured to generate third data including the first frequency component, a second frequency component, and the amplitude component by performing Fourier transform on time-amplitude data for each first frequency component in the second data, respectively, and a determination unit configured to determine the state of the inspection object based on the third data.
-
- 1
- inspection system
- 41
- speed reducer (example of inspection object)
- 42
- electric motor (example of inspection object)
- 50
- electric steering device (example of inspection object)
- 100
- inspection device
- 101
- learning phase
- 102
- inference phase
- 110
- data conversion unit
- 111
- first data storage unit
- 112
- second data generation unit
- 113
- third data generation unit
- 120
- learning model generation unit
- 130
- learning model storage unit
- 140
- determination unit
- 141
- fourth data generation unit
- 142
- fifth data generation unit
- 143
- filter processing unit
- 144
- positive value processing unit
- 145
- evaluation value generation unit
- 146
- state determination unit
- 151, 152
- vibration sensor
- 153
- sound sensor
- D1
- first data
- D2
- second data
- D3
- third data
- D4
- fourth data
- D5
- fifth data
- D6
- sixth data
- D7
- seventh data
- f1
- first frequency component
- f2
- second frequency component
- M
- learning model
- M1
- input layer
- M3
- output layer
Claims (11)
- An inspection device comprising:a first data storage unit configured to store a first data which is time series according to a state of an inspection object;a second data generation unit configured to generate second data, which is a spectrogram including a first frequency component, a time component, and an amplitude component by performing short-time Fourier transform on the first data;a third data generation unit configured to generate third data including the first frequency component, a second frequency component, and the amplitude component by performing Fourier transform on time-amplitude data for each first frequency component in the second data, respectively; anda determination unit configured to determine the state of the inspection object based on the third data.
- The inspection device according to claim 1, further comprising:a learning model storage unit configured to store a learning model when the third data of a reference generated based on the first data of a reference according to a reference state of the inspection object is used as an input layer and an output layer, the learning model being an automatic encoder in which fourth data is used as output data when the third data is used as input data,wherein the determination unit includes:a fourth data generation unit configured to generate the fourth data by the learning model by inputting the third data generated based on new first data according to the state of the inspection object to the learning model; anda state determination unit configured to determine a difference between the state of the inspection object and the reference state based on a comparison result between the third data and the fourth data.
- The inspection device according to claim 2,
wherein the determination unit further includes:a fifth data generation unit configured to generate fifth data indicating, in each coordinate of a two-dimensional coordinate system of the first frequency component and the second frequency component, a difference value obtained by calculating a difference between a value of the amplitude component of each coordinate of the third data and a value of the amplitude component of each coordinate of the fourth data in the two-dimensional coordinate system; andan evaluation value generation unit configured to generate an evaluation value based on a value of each coordinate of the fifth data, andwherein when the evaluation value is a preset threshold value or less, the state determination unit determines that the state of the inspection object is included within a predetermined range from the reference state. - The inspection device according to claim 3,
wherein the determination unit further includes a filter processing unit configured to generate sixth data by performing processing using a low-pass filter on the fifth data, and
wherein the evaluation value generation unit generates the evaluation value based on a value of each coordinate of the sixth data. - The inspection device according to claim 4,
wherein the determination unit further includes a positive value processing unit configured to generate seventh data by performing positive value processing on the sixth data, and
wherein the evaluation value generation unit generates the evaluation value based on a value of each coordinate of the seventh data. - The inspection device according to any one of claims 3 to 5,
wherein the evaluation value generation unit is a sum of coordinate values of target data. - The inspection device according to any one of claims 1 to 6,
wherein the inspection object is a component of an electric steering device. - The inspection device according to any one of claims 1 to 7,
wherein the state of the inspection object is a degree of vibration of the inspection object when the inspection object is operating. - The inspection device according to any one of claims 1 to 8,
wherein the first data is an output signal of a vibration sensor capable of detecting vibration of the inspection object or an output signal of a sound sensor capable of detecting a sound generated due to vibration of the inspection object. - An inspection learning model generation device comprising:a first data storage unit configured to store a first data which is time series according to a state of an inspection object;a second data generation unit configured to generate second data, which is spectrogram including a first frequency component, a time component, and an amplitude component by performing short-time Fourier transform on the first data;a third data generation unit configured to generate third data including the first frequency component, a second frequency component, and the amplitude component by performing Fourier transform on time-amplitude data for each first frequency component in the second data, respectively; anda learning model generation unit configured to generate a learning model which is used to determine the state of the inspection object and in which fourth data is used as output data when the third data is used as input data.
- The inspection learning model generation device according to claim 10,
wherein the learning model is an automatic encoder in which the third data of a reference generated based on the first data of a reference according to a reference state of the inspection object is used as an input layer and an output layer.
Applications Claiming Priority (1)
| Application Number | Priority Date | Filing Date | Title |
|---|---|---|---|
| JP2019018311A JP7283096B2 (en) | 2019-02-04 | 2019-02-04 | Inspection device and learning model generation device for inspection |
Publications (2)
| Publication Number | Publication Date |
|---|---|
| EP3690410A2 true EP3690410A2 (en) | 2020-08-05 |
| EP3690410A3 EP3690410A3 (en) | 2020-11-25 |
Family
ID=69630631
Family Applications (1)
| Application Number | Title | Priority Date | Filing Date |
|---|---|---|---|
| EP20154611.6A Ceased EP3690410A3 (en) | 2019-02-04 | 2020-01-30 | Inspection device and inspection learning model generation device |
Country Status (4)
| Country | Link |
|---|---|
| US (1) | US11604170B2 (en) |
| EP (1) | EP3690410A3 (en) |
| JP (1) | JP7283096B2 (en) |
| CN (1) | CN111523370A (en) |
Cited By (1)
| Publication number | Priority date | Publication date | Assignee | Title |
|---|---|---|---|---|
| US20230012974A1 (en) * | 2021-07-07 | 2023-01-19 | Mando Corporation | Apparatus and method for controlling motor |
Families Citing this family (3)
| Publication number | Priority date | Publication date | Assignee | Title |
|---|---|---|---|---|
| DE102019201971A1 (en) * | 2019-02-14 | 2020-08-20 | Robert Bosch Gmbh | Drive unit for an electric vehicle and method for detecting errors in a drive unit |
| JP7834571B2 (en) * | 2022-05-02 | 2026-03-24 | 株式会社ミツバ | Motor device inspection apparatus and motor device inspection method |
| CN116188846A (en) * | 2022-12-30 | 2023-05-30 | 北京捷通华声科技股份有限公司 | A device fault detection method and device based on vibration images |
Citations (4)
| Publication number | Priority date | Publication date | Assignee | Title |
|---|---|---|---|---|
| JP2006153729A (en) | 2004-11-30 | 2006-06-15 | Showa Corp | Method and apparatus for detecting abnormal noise in electric power steering apparatus |
| US20180011065A1 (en) * | 2013-07-02 | 2018-01-11 | Computational Systems, Inc. | Machine Fault Prediction Based on Analysis of Periodic Information in a Signal |
| JP2018036269A (en) | 2016-04-21 | 2018-03-08 | 日本精工株式会社 | Steering system noise detection method and steering system evaluation apparatus |
| US20180249018A1 (en) * | 2015-12-24 | 2018-08-30 | Fuji Xerox Co., Ltd. | Diagnostic device and diagnostic method |
Family Cites Families (16)
| Publication number | Priority date | Publication date | Assignee | Title |
|---|---|---|---|---|
| JPS59109831A (en) * | 1982-12-15 | 1984-06-25 | Mitsubishi Electric Corp | Vibration and noise examining device |
| JPH11108806A (en) * | 1997-10-06 | 1999-04-23 | Oki Electric Ind Co Ltd | Device for extracting characteristic of mechanical motion |
| JPH11212637A (en) * | 1998-01-22 | 1999-08-06 | Hitachi Ltd | Preventive maintenance method and device |
| JP5063005B2 (en) | 2006-02-01 | 2012-10-31 | 株式会社ジェイテクト | Sound or vibration abnormality diagnosis method and sound or vibration abnormality diagnosis device |
| US10316849B2 (en) | 2014-10-15 | 2019-06-11 | Grundfos Holding A/S | Method and system for detection of faults in pump assembly via handheld communication device |
| KR20170069797A (en) * | 2015-12-11 | 2017-06-21 | 현대자동차주식회사 | Apparatus and method for active vibration control of hybrid vehicle |
| JP6016149B1 (en) | 2016-01-08 | 2016-10-26 | 富士ゼロックス株式会社 | Terminal device, diagnostic system, and program |
| US20180284758A1 (en) | 2016-05-09 | 2018-10-04 | StrongForce IoT Portfolio 2016, LLC | Methods and systems for industrial internet of things data collection for equipment analysis in an upstream oil and gas environment |
| JP6599294B2 (en) | 2016-09-20 | 2019-10-30 | 株式会社東芝 | Abnormality detection device, learning device, abnormality detection method, learning method, abnormality detection program, and learning program |
| WO2018150616A1 (en) | 2017-02-15 | 2018-08-23 | 日本電信電話株式会社 | Abnormal sound detection device, abnormality degree calculation device, abnormal sound generation device, abnormal sound detection learning device, abnormal signal detection device, abnormal signal detection learning device, and methods and programs therefor |
| JP6823501B2 (en) | 2017-03-03 | 2021-02-03 | 日本電信電話株式会社 | Anomaly detection device, anomaly detection method and program |
| CN110352340B (en) | 2017-03-17 | 2021-10-01 | 株式会社富士金 | Motion analysis system, method and computer program for fluid control equipment |
| CN108205016A (en) | 2017-12-29 | 2018-06-26 | 北京城建北方建设有限责任公司 | The industrial computer system of sound emission safety of tower crane detection |
| CN108830127B (en) | 2018-03-22 | 2021-08-10 | 南京航空航天大学 | Rotary machine fault feature intelligent diagnosis method based on deep convolutional neural network structure |
| CN109063290A (en) * | 2018-07-20 | 2018-12-21 | 中国航空工业集团公司沈阳飞机设计研究所 | A kind of flutter prediction technique based on nerual network technique |
| CN109241937B (en) * | 2018-09-26 | 2020-01-07 | 武汉夏宇信息技术有限公司 | Terahertz wave-based identification method and device and storage medium |
-
2019
- 2019-02-04 JP JP2019018311A patent/JP7283096B2/en active Active
-
2020
- 2020-01-27 US US16/752,738 patent/US11604170B2/en active Active
- 2020-01-30 EP EP20154611.6A patent/EP3690410A3/en not_active Ceased
- 2020-02-04 CN CN202010079788.5A patent/CN111523370A/en active Pending
Patent Citations (4)
| Publication number | Priority date | Publication date | Assignee | Title |
|---|---|---|---|---|
| JP2006153729A (en) | 2004-11-30 | 2006-06-15 | Showa Corp | Method and apparatus for detecting abnormal noise in electric power steering apparatus |
| US20180011065A1 (en) * | 2013-07-02 | 2018-01-11 | Computational Systems, Inc. | Machine Fault Prediction Based on Analysis of Periodic Information in a Signal |
| US20180249018A1 (en) * | 2015-12-24 | 2018-08-30 | Fuji Xerox Co., Ltd. | Diagnostic device and diagnostic method |
| JP2018036269A (en) | 2016-04-21 | 2018-03-08 | 日本精工株式会社 | Steering system noise detection method and steering system evaluation apparatus |
Non-Patent Citations (1)
| Title |
|---|
| ZHENG YANG ET AL: "Lane-Change Detection From Steering Signal Using Spectral Segmentation and Learning-Based Classification", IEEE TRANSACTIONS ON INTELLIGENT VEHICLES, IEEE, vol. 2, no. 1, 1 March 2017 (2017-03-01), pages 14 - 24, XP011654945, ISSN: 2379-8858, [retrieved on 20170628], DOI: 10.1109/TIV.2017.2708600 * |
Cited By (2)
| Publication number | Priority date | Publication date | Assignee | Title |
|---|---|---|---|---|
| US20230012974A1 (en) * | 2021-07-07 | 2023-01-19 | Mando Corporation | Apparatus and method for controlling motor |
| US12539913B2 (en) * | 2021-07-07 | 2026-02-03 | Hl Mando Corporation | Apparatus and method for controlling motor |
Also Published As
| Publication number | Publication date |
|---|---|
| JP7283096B2 (en) | 2023-05-30 |
| CN111523370A (en) | 2020-08-11 |
| US11604170B2 (en) | 2023-03-14 |
| EP3690410A3 (en) | 2020-11-25 |
| US20200249206A1 (en) | 2020-08-06 |
| JP2020125971A (en) | 2020-08-20 |
Similar Documents
| Publication | Publication Date | Title |
|---|---|---|
| US11604170B2 (en) | Inspection device and inspection learning model generation device | |
| JP4584186B2 (en) | Failure diagnosis method and failure diagnosis apparatus | |
| Kurka et al. | Applications of image processing in robotics and instrumentation | |
| CN101353051B (en) | Power steering apparatus having failure detection device for rotation angle sensors | |
| CN107246972B (en) | Method and system for testing steering parameters of whole vehicle | |
| JP5063005B2 (en) | Sound or vibration abnormality diagnosis method and sound or vibration abnormality diagnosis device | |
| CN110907864B (en) | Fault detection method, device and equipment for motor stator winding and storage medium | |
| US20170261529A1 (en) | Method for identifying friction parameter for linear module | |
| CA2961534A1 (en) | Inspection device for displacement sensor and inspection method of the same | |
| CN113562066A (en) | Steering-by-wire system and fault diagnosis method | |
| US11472479B2 (en) | Hands-off detection device and steering device | |
| WO2021166648A1 (en) | Electronic control device, electric power steering device, and control device for electric power steering device | |
| US20200148253A1 (en) | Frequency Tracking Based Friction Detection Using Accelerometer | |
| JP2009069106A (en) | Torque detection device and electric power steering device | |
| US7543679B2 (en) | Compensation of periodic sensor errors in electric power steering systems | |
| CN109204321A (en) | Signal processing method, sliding detection method, the control method of vehicle and device | |
| CN114943250B (en) | Transmission fault diagnosis method of electronic control brake system based on multi-domain feature fusion of vibration signals | |
| JP3925422B2 (en) | Steering device abnormality detection device and steering device abnormality detection method | |
| JP2011526560A (en) | Method and apparatus for detecting tire pressure drop | |
| JP5387140B2 (en) | Angular position / speed detection device and power test system of rotating body | |
| JP6475954B2 (en) | Tire pressure drop detection device, method and program | |
| JPH10333743A (en) | Simple abnormality diagnosis method for equipment with load fluctuation and simple abnormality diagnosis apparatus | |
| JP7245994B2 (en) | Abnormal diagnosis device and robot control device equipped with the same | |
| JP2021189039A (en) | Industrial inspection system | |
| JP2008215998A (en) | Device for detecting absolute rotation angle of rotating shaft |
Legal Events
| Date | Code | Title | Description |
|---|---|---|---|
| PUAI | Public reference made under article 153(3) epc to a published international application that has entered the european phase |
Free format text: ORIGINAL CODE: 0009012 |
|
| STAA | Information on the status of an ep patent application or granted ep patent |
Free format text: STATUS: THE APPLICATION HAS BEEN PUBLISHED |
|
| AK | Designated contracting states |
Kind code of ref document: A2 Designated state(s): AL AT BE BG CH CY CZ DE DK EE ES FI FR GB GR HR HU IE IS IT LI LT LU LV MC MK MT NL NO PL PT RO RS SE SI SK SM TR |
|
| AX | Request for extension of the european patent |
Extension state: BA ME |
|
| PUAL | Search report despatched |
Free format text: ORIGINAL CODE: 0009013 |
|
| AK | Designated contracting states |
Kind code of ref document: A3 Designated state(s): AL AT BE BG CH CY CZ DE DK EE ES FI FR GB GR HR HU IE IS IT LI LT LU LV MC MK MT NL NO PL PT RO RS SE SI SK SM TR |
|
| AX | Request for extension of the european patent |
Extension state: BA ME |
|
| RIC1 | Information provided on ipc code assigned before grant |
Ipc: H01H 1/10 20060101ALN20201016BHEP Ipc: G01M 17/06 20060101ALI20201016BHEP Ipc: G01H 1/10 20060101ALI20201016BHEP Ipc: G01H 1/16 20060101AFI20201016BHEP Ipc: G01N 29/46 20060101ALI20201016BHEP Ipc: G01H 3/10 20060101ALI20201016BHEP Ipc: G01N 29/44 20060101ALI20201016BHEP Ipc: G01N 29/14 20060101ALI20201016BHEP |
|
| STAA | Information on the status of an ep patent application or granted ep patent |
Free format text: STATUS: REQUEST FOR EXAMINATION WAS MADE |
|
| 17P | Request for examination filed |
Effective date: 20210422 |
|
| RBV | Designated contracting states (corrected) |
Designated state(s): AL AT BE BG CH CY CZ DE DK EE ES FI FR GB GR HR HU IE IS IT LI LT LU LV MC MK MT NL NO PL PT RO RS SE SI SK SM TR |
|
| RAP3 | Party data changed (applicant data changed or rights of an application transferred) |
Owner name: JTEKT CORPORATION |
|
| STAA | Information on the status of an ep patent application or granted ep patent |
Free format text: STATUS: EXAMINATION IS IN PROGRESS |
|
| 17Q | First examination report despatched |
Effective date: 20220727 |
|
| STAA | Information on the status of an ep patent application or granted ep patent |
Free format text: STATUS: THE APPLICATION HAS BEEN REFUSED |
|
| 18R | Application refused |
Effective date: 20240327 |