EP3689235A1 - Methods for analyte monitoring management and analyte measurement data management, and articles of manufacture related thereto - Google Patents
Methods for analyte monitoring management and analyte measurement data management, and articles of manufacture related thereto Download PDFInfo
- Publication number
- EP3689235A1 EP3689235A1 EP20163263.5A EP20163263A EP3689235A1 EP 3689235 A1 EP3689235 A1 EP 3689235A1 EP 20163263 A EP20163263 A EP 20163263A EP 3689235 A1 EP3689235 A1 EP 3689235A1
- Authority
- EP
- European Patent Office
- Prior art keywords
- analyte
- threshold
- episode
- measurement data
- episodes
- Prior art date
- Legal status (The legal status is an assumption and is not a legal conclusion. Google has not performed a legal analysis and makes no representation as to the accuracy of the status listed.)
- Granted
Links
- 238000005259 measurement Methods 0.000 title claims abstract description 304
- 239000012491 analyte Substances 0.000 title claims abstract description 196
- 238000000034 method Methods 0.000 title claims abstract description 99
- 238000004519 manufacturing process Methods 0.000 title claims abstract description 43
- 238000012544 monitoring process Methods 0.000 title claims abstract description 18
- 238000007726 management method Methods 0.000 title abstract description 18
- 238000013523 data management Methods 0.000 title description 3
- WQZGKKKJIJFFOK-GASJEMHNSA-N Glucose Natural products OC[C@H]1OC(O)[C@H](O)[C@@H](O)[C@@H]1O WQZGKKKJIJFFOK-GASJEMHNSA-N 0.000 claims description 145
- 239000008103 glucose Substances 0.000 claims description 145
- 238000012806 monitoring device Methods 0.000 claims description 45
- 230000008859 change Effects 0.000 claims description 15
- 238000004891 communication Methods 0.000 claims description 15
- 125000002791 glucosyl group Chemical group C1([C@H](O)[C@@H](O)[C@H](O)[C@H](O1)CO)* 0.000 claims description 7
- 150000002576 ketones Chemical class 0.000 claims description 7
- 230000036541 health Effects 0.000 abstract description 52
- 238000004458 analytical method Methods 0.000 abstract description 18
- 229940079593 drug Drugs 0.000 description 22
- 239000003814 drug Substances 0.000 description 22
- 208000013016 Hypoglycemia Diseases 0.000 description 19
- 230000002218 hypoglycaemic effect Effects 0.000 description 18
- 238000012545 processing Methods 0.000 description 14
- 239000000463 material Substances 0.000 description 13
- 238000001514 detection method Methods 0.000 description 10
- 201000001421 hyperglycemia Diseases 0.000 description 10
- 230000003345 hyperglycaemic effect Effects 0.000 description 8
- NOESYZHRGYRDHS-UHFFFAOYSA-N insulin Chemical compound N1C(=O)C(NC(=O)C(CCC(N)=O)NC(=O)C(CCC(O)=O)NC(=O)C(C(C)C)NC(=O)C(NC(=O)CN)C(C)CC)CSSCC(C(NC(CO)C(=O)NC(CC(C)C)C(=O)NC(CC=2C=CC(O)=CC=2)C(=O)NC(CCC(N)=O)C(=O)NC(CC(C)C)C(=O)NC(CCC(O)=O)C(=O)NC(CC(N)=O)C(=O)NC(CC=2C=CC(O)=CC=2)C(=O)NC(CSSCC(NC(=O)C(C(C)C)NC(=O)C(CC(C)C)NC(=O)C(CC=2C=CC(O)=CC=2)NC(=O)C(CC(C)C)NC(=O)C(C)NC(=O)C(CCC(O)=O)NC(=O)C(C(C)C)NC(=O)C(CC(C)C)NC(=O)C(CC=2NC=NC=2)NC(=O)C(CO)NC(=O)CNC2=O)C(=O)NCC(=O)NC(CCC(O)=O)C(=O)NC(CCCNC(N)=N)C(=O)NCC(=O)NC(CC=3C=CC=CC=3)C(=O)NC(CC=3C=CC=CC=3)C(=O)NC(CC=3C=CC(O)=CC=3)C(=O)NC(C(C)O)C(=O)N3C(CCC3)C(=O)NC(CCCCN)C(=O)NC(C)C(O)=O)C(=O)NC(CC(N)=O)C(O)=O)=O)NC(=O)C(C(C)CC)NC(=O)C(CO)NC(=O)C(C(C)O)NC(=O)C1CSSCC2NC(=O)C(CC(C)C)NC(=O)C(NC(=O)C(CCC(N)=O)NC(=O)C(CC(N)=O)NC(=O)C(NC(=O)C(N)CC=1C=CC=CC=1)C(C)C)CC1=CN=CN1 NOESYZHRGYRDHS-UHFFFAOYSA-N 0.000 description 8
- 235000012054 meals Nutrition 0.000 description 7
- 239000008280 blood Substances 0.000 description 6
- 210000004369 blood Anatomy 0.000 description 6
- 230000001413 cellular effect Effects 0.000 description 5
- 230000001960 triggered effect Effects 0.000 description 5
- 102000004877 Insulin Human genes 0.000 description 4
- 108090001061 Insulin Proteins 0.000 description 4
- 230000009471 action Effects 0.000 description 4
- 206010012601 diabetes mellitus Diseases 0.000 description 4
- 230000000694 effects Effects 0.000 description 4
- 230000006872 improvement Effects 0.000 description 4
- 229940125396 insulin Drugs 0.000 description 4
- 238000012986 modification Methods 0.000 description 4
- 230000004048 modification Effects 0.000 description 4
- 230000008569 process Effects 0.000 description 4
- 241001465754 Metazoa Species 0.000 description 3
- 239000012925 reference material Substances 0.000 description 3
- 241000282412 Homo Species 0.000 description 2
- WQZGKKKJIJFFOK-VFUOTHLCSA-N beta-D-glucose Chemical compound OC[C@H]1O[C@@H](O)[C@H](O)[C@@H](O)[C@@H]1O WQZGKKKJIJFFOK-VFUOTHLCSA-N 0.000 description 2
- 230000003247 decreasing effect Effects 0.000 description 2
- 238000002474 experimental method Methods 0.000 description 2
- 230000005055 memory storage Effects 0.000 description 2
- 238000003491 array Methods 0.000 description 1
- 230000006399 behavior Effects 0.000 description 1
- 238000004364 calculation method Methods 0.000 description 1
- 239000012530 fluid Substances 0.000 description 1
- 238000000338 in vitro Methods 0.000 description 1
- 238000001727 in vivo Methods 0.000 description 1
- 238000010348 incorporation Methods 0.000 description 1
- 239000004615 ingredient Substances 0.000 description 1
- 230000007246 mechanism Effects 0.000 description 1
- 239000000203 mixture Substances 0.000 description 1
- 230000003287 optical effect Effects 0.000 description 1
- 230000000737 periodic effect Effects 0.000 description 1
- 238000012552 review Methods 0.000 description 1
- 238000007920 subcutaneous administration Methods 0.000 description 1
- 238000012360 testing method Methods 0.000 description 1
- 238000012384 transportation and delivery Methods 0.000 description 1
- 230000000007 visual effect Effects 0.000 description 1
Images


Classifications
-
- A—HUMAN NECESSITIES
- A61—MEDICAL OR VETERINARY SCIENCE; HYGIENE
- A61B—DIAGNOSIS; SURGERY; IDENTIFICATION
- A61B5/00—Measuring for diagnostic purposes; Identification of persons
- A61B5/145—Measuring characteristics of blood in vivo, e.g. gas concentration, pH value; Measuring characteristics of body fluids or tissues, e.g. interstitial fluid, cerebral tissue
- A61B5/14532—Measuring characteristics of blood in vivo, e.g. gas concentration, pH value; Measuring characteristics of body fluids or tissues, e.g. interstitial fluid, cerebral tissue for measuring glucose, e.g. by tissue impedance measurement
-
- A—HUMAN NECESSITIES
- A61—MEDICAL OR VETERINARY SCIENCE; HYGIENE
- A61B—DIAGNOSIS; SURGERY; IDENTIFICATION
- A61B5/00—Measuring for diagnostic purposes; Identification of persons
- A61B5/145—Measuring characteristics of blood in vivo, e.g. gas concentration, pH value; Measuring characteristics of body fluids or tissues, e.g. interstitial fluid, cerebral tissue
- A61B5/14546—Measuring characteristics of blood in vivo, e.g. gas concentration, pH value; Measuring characteristics of body fluids or tissues, e.g. interstitial fluid, cerebral tissue for measuring analytes not otherwise provided for, e.g. ions, cytochromes
-
- A—HUMAN NECESSITIES
- A61—MEDICAL OR VETERINARY SCIENCE; HYGIENE
- A61B—DIAGNOSIS; SURGERY; IDENTIFICATION
- A61B5/00—Measuring for diagnostic purposes; Identification of persons
- A61B5/72—Signal processing specially adapted for physiological signals or for diagnostic purposes
- A61B5/7271—Specific aspects of physiological measurement analysis
- A61B5/7282—Event detection, e.g. detecting unique waveforms indicative of a medical condition
-
- A—HUMAN NECESSITIES
- A61—MEDICAL OR VETERINARY SCIENCE; HYGIENE
- A61B—DIAGNOSIS; SURGERY; IDENTIFICATION
- A61B5/00—Measuring for diagnostic purposes; Identification of persons
- A61B5/74—Details of notification to user or communication with user or patient ; user input means
- A61B5/742—Details of notification to user or communication with user or patient ; user input means using visual displays
-
- G—PHYSICS
- G16—INFORMATION AND COMMUNICATION TECHNOLOGY [ICT] SPECIALLY ADAPTED FOR SPECIFIC APPLICATION FIELDS
- G16H—HEALTHCARE INFORMATICS, i.e. INFORMATION AND COMMUNICATION TECHNOLOGY [ICT] SPECIALLY ADAPTED FOR THE HANDLING OR PROCESSING OF MEDICAL OR HEALTHCARE DATA
- G16H40/00—ICT specially adapted for the management or administration of healthcare resources or facilities; ICT specially adapted for the management or operation of medical equipment or devices
- G16H40/60—ICT specially adapted for the management or administration of healthcare resources or facilities; ICT specially adapted for the management or operation of medical equipment or devices for the operation of medical equipment or devices
- G16H40/63—ICT specially adapted for the management or administration of healthcare resources or facilities; ICT specially adapted for the management or operation of medical equipment or devices for the operation of medical equipment or devices for local operation
Definitions
- HCP health care practitioner
- the HCP may collect the glucose measurements and acquire information from the collection of measurements.
- Information acquired from the measurements by existing software typically focus on overall summary statistics, such as median and percent or measurements in a target range.
- the software provides a general picture of the glucose measurements as a whole and does not focus in on more specific episodes within the measurements that may be useful in treatment determination or modification. Such general summary information is limited and more clinically meaningful health related information is lacking.
- methods for analyte monitoring management include receiving analyte measurement data and analyzing the analyte measurement data for health related parameters.
- the analyte measurement data represents analyte measurement data collected over a time period.
- the methods also include determining recommendations for creating or modifying a treatment program based on the analysis.
- the recommendations modulate the health related parameters to improve one or more of the health related parameters.
- the methods include generating a user-interface to enable a user to create or modify the treatment program.
- the user interface provides the recommendations to guide the user in creating or modifying the treatment program.
- the recommendations are optional and not required to be implemented by the user.
- the methods also include configuring an analyte monitoring device according to the created or modified treatment program.
- articles of manufacture are provided that include a machine-readable medium having machine-executable instructions stored thereon for analyte monitoring management according to the methods described above.
- methods for managing analyte measurement data include receiving analyte measurement data that represent data collected over a time period, and analyzing the analyte measurement data for analyte episodes within that time period.
- the analyte episodes include at least one threshold based episode.
- the threshold based episode is based on measurements meeting an entrance threshold for entering the threshold based episode. Further, the threshold based episode requires at least one of: a minimum number of measurements meeting the entrance threshold; a minimum duration of time meeting the entrance threshold; and a minimum area for measurements meeting the entrance threshold.
- the methods also include storing the analyte episodes in memory.
- articles of manufacture are provided that include a machine-readable medium having machine-executable instructions stored thereon for managing analyte measurement data according to the methods described above.
- methods for managing analyte measurement data include receiving analyte measurement data that represent data collected over a time period, and analyzing the analyte measurement data for analyte episodes within that time period.
- the analyte episodes include at least one rate-of-change based episode.
- the rate ol-change based episode requires a core of the episode to meet a threshold rate for a duration threshold.
- the methods also include storing the analyte episodes in memory.
- articles of manufacture are provided that include a machine-readable medium having machine-executable instructions stored thereon for managing analyte measurement data according to the methods described above.
- Patent Application Publication No. 2007/0095661 U.S. Patent Application Publication No. 2006/0091006 ; U.S. Patent Application Publication No. 2006/0025662 ; U.S. Patent Application Publication No. 2008/0267823 ; U.S. Patent Application Publication No. 2007/0108048 ; U.S. Patent Application Publication No. 2008/0102441 ; U.S. Patent Application Publication No. 2008/0066305 ; U.S. Patent Application Publication No. 2007/0199818 ; U.S. Patent Application Publication No. 2008/0148873 ; U.S. Patent Application Publication No. 2007/0068807 ; US patent Application Publication No. 2010/0198034 ; and US provisional application no. 61/149,639 titled "Compact On-Body Physiological Monitoring Device and Methods Thereof", the disclosures of each of which are incorporated herein by reference in their entirety.
- any of the possible candidates or alternatives listed for that component may generally be used individually or in combination with one another, unless implicitly or explicitly understood or stated otherwise. Additionally, it will be understood that any list of such candidates or alternatives, is merely illustrative, not limiting, unless implicitly or explicitly understood or stated otherwise.
- the methods include receiving analyte measurement data and analyzing the analyte measurement data for health related parameters.
- the analyte measurement data represents analyte measurement data collected over a time period.
- the methods also include determining recommendations for creating or modifying a treatment program based on the analysis.
- the recommendations modulate the health related parameters to improve one or more of the health related parameters.
- the methods include generating a user-interface to enable a user to create or modify the treatment program.
- the user interface provides the recommendations to guide the user in creating or modifying the treatment program.
- the recommendations are optional and not required to be implemented by the user.
- the methods also include configuring an analyte monitoring device according to the created or modified treatment program.
- articles of manufacture include a machine-readable medium having machine-executable instructions stored thereon for analyte monitoring management according to the methods described above.
- FIGs. 10-30 illustrate and describe example methods for analyte monitoring management. Moreover, FIGs. 10-30 illustrate the user interface that is generated to enable a user to create or modify the treatment program, and further provides the recommendations to guide the user in creating or modifying the treatment program. The user interface also enables the configuring of an analyte monitoring device according to the created or modified treatment program, the importing of glucose measurement data, and the printing of orders including materials such as reports, summaries, educational material, instructional material, etc.
- the user may be, for example, a physician or other health care practitioner, and the user-interface provided via a data processing device, such as a personal computer, a portable computer including a laptop or a handheld device (e.g., a personal digital assistant (PDA), a telephone including a cellular phone (e.g., a multimedia and Internet-enabled mobile phone including an iPhoneTM, a Blackberry®, or similar phone), etc.
- a data processing device such as a personal computer, a portable computer including a laptop or a handheld device (e.g., a personal digital assistant (PDA), a telephone including a cellular phone (e.g., a multimedia and Internet-enabled mobile phone including an iPhoneTM, a Blackberry®, or similar phone), etc.
- PDA personal digital assistant
- a telephone including a cellular phone e.g., a multimedia and Internet-enabled mobile phone including an iPhoneTM, a Blackberry®, or similar phone
- a communication link is established with an analyte (e.g., glucose) monitoring device.
- the glucose monitoring device may be connected (wired or wirelessly), for example, to the data processing device.
- a patient may use the glucose monitoring device between visits to a physician, or other health care practitioner, to collect glucose measurement data, and then have the glucose monitoring device connect either wired or wireless with the data processing device (e.g., computer, laptop, cellular phone, etc.) of the physician during the next visit.
- the data processing device e.g., computer, laptop, cellular phone, etc.
- the glucose measurements that are received represent data that has been collected over a time period.
- time periods may be used, such as two weeks, one month, two months, or any other time period.
- the time period may reflect the time between visits.
- the glucose monitoring device is connected to the physician's computer and glucose measurement data and the glucose measurement data is received by the physician's computer from the glucose monitoring device.
- the glucose measurement data may be received from other devices than the glucose monitoring device-e.g., another personal computer, portable computer, handheld device, or memory storage device, such as Flash memory stick, CD-ROM, etc.
- the health related parameter may be, for example, a risk of hypoglycemia or hyperglycemia, deviation of median glucose with respect to a target range, a degree of glucose variability, or any other parameter or indicator of health or area of concern thereof.
- the risk level identifies a level of risk of hypoglycemia based on the collected measurement data.
- the level of risk of hypoglycemia or hyperglycemia may be established in various manners-e.g., by looking to hypoglycemic or hyperglycemic episodes, such as the number, duration, timing, or other characteristics thereof.
- Deviations of median glucose may be categorized, for example, as above, below, or within a target range.
- the degree of glucose variability indicates how variable the glucose measurements are. Widely varying glucose measurements may present difficulties in controlling treatment or parameters. For example, small variations in glucose measurements may facilitate more accurately estimating the proper dosage, or change in dosage, to improve or control blood glucose levels.
- the analyzing of the analyte measurement data for health related parameters includes analyzing the measurement data for analyte episodes within the collection time period.
- the episodes are derived according to the methods described herein relating to threshold based episodes.
- the episodes are derived according to the methods described herein relating to rate-of-change based episodes.
- the episodes are derived according to methods described herein relating to both the threshold based episodes and the rate-of-change based episodes.
- the recommendations are provided to modulate the health related parameters to improve one or more of the health related parameters.
- the recommendations may relate to lowering glucose variability, adjusting median glucose to be close to the target range, reducing a risk of hypoglycemia or hyperglycemia, etc.
- the recommendations are optional and are not required to be implemented by the user.
- a database stores recommendations and corresponding conditions that are associated with or required by the recommendations.
- a table may include predetermined conditions that are associated with one or more recommendations. Based on the conditions that exist, the appropriate recommendation may be determined. In some instances, the conditions and requirements may take into account attributes of the episodes themselves--e.g., type of episode, specific combinations of episodes present, number of episodes, relation to event or activities (e.g., meals, fasting periods, exercise, medication administration, times of day (e.g., morning, afternoon, night, sleeping periods, etc.), etc. Based on the resulting attributes of episodes found for the measurement data, the associated recommendations in the database will be selected.
- the user-interface is generated to enable the user (e.g., physician or other health care practitioner) to create or modify treatment.
- user-interface is used broadly herein.
- the user interface may be visual and/or audio based.
- the user interface may include a graphical user interface (GUI) generated for display on a display device.
- GUI graphical user interface
- the user interface may be implemented as a program containing one or more GUIs and may include one or more application "screens" or “windows”.
- the generated user-interface provides the user with the necessary tool to modify or create a treatment program for the patient.
- the recommendations go further and guide the user in creating or modifying the treatment program such that the health related parameters may be modulated to improve the health related parameter.
- the recommendations may for instance, recommend or suggest that one or more health related parameters be targeted for improvement.
- the recommendations may recommend steps necessary to achieve such improvement.
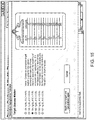
- FIG. 13 illustrates an example GUI that includes recommendations resulting from analyzing glucose measurement data that was collected over a time period.
- the recommendations A1 are provided in summary format along with a summary of the health related parameters A2 for specific time periods in the day (e.g., during fasting periods, post-breakfast periods, post-lunch periods, and post-dinner periods).
- a summary A3 of the glucose measurement data over a 24-hour plot is also shown in the GUI.
- the recommendations include a recommendation for creating or modifying medication parameters of the treatment program.
- the medication parameters may include, for instance, the medication selected, the amount of dosage, the frequency or timing of administration, etc. For example, it may be determined that a risk of hypoglycemia is present (e.g., high risk) and recommended that medication (e.g., insulin) be increased.
- the recommendation may also note that glucose variability is high and that reducing this variability will allow for greater increases in the medication dose.
- the recommendation may further include recommended steps that can be taken to assist with the improvement, such as using a greater number of measurements to be scheduled for higher sample count, as shown.
- the recommendation for creating or modifying medication parameters are provided for different time periods, including time periods centered around events such as fasting periods, meal times (e.g., during post-breakfast periods, post-lunch periods, post-dinner periods), exercise or other activities, etc.
- FIG. 17 illustrates recommendations provided along with the option for the user to select the corresponding course of action.
- the recommendations are provided for medication adjustment purposes.
- a summary A10 of the health related parameters are listed for different event periods-e.g., median glucose and glucose variability are provided fasting periods to indicate that these are the areas of concern determined for this period.
- the user interface provides the user with suggested or recommended courses of action A11. For example, as shown for fasting, the user is presented with the option of reducing variability with no medication dose adjustment; or the option of decreasing the medication adjustment if variability cannot be reduced.
- the user interface also provides the user with a trigger element A12 to get more information or further recommendation related thereto, as shown by pop up windows A13 on FIG. 18 .
- insufficient measurement data is also accounted for and conveyed on the user interface.
- page 33 illustrates an example user-interface when insufficient data is encountered.
- the recommendation may state that that there is insufficient data to perform an analysis, and may present a warning or suggest a course of action to be taken with caution.
- glucose variability is a health related parameter in the analysis.
- the user interface may provide recommendations, for example, in the form of specific questions to ask the patient or to determine about the patient. For example, FIGs. 23-24 illustrate example questions to be answered by the user to assist with treatment creation or modification.
- educational material or other reference material may be provided to assist or remind the user of the subject matter related to the recommendation.
- guidelines or flowcharts e.g., medication administration guidelines
- other pertinent information e.g., information regarding the medication, such as ingredients, side effects, recommended dosages, etc.
- example educational information is shown on FIGs. 17 , 18 , and 20 .
- the user interface enables the user to generate a structured schedule, including setting reminders related to the modified or created treatment program. For example, reminders to take measurement readings may be set and ultimately implemented in the glucose monitoring device to remind the patient (or user of the glucose monitoring device) to take a measurement at the appropriate time, to avoid missing measurements or taking them too infrequently. Thus, if the treatment program is modified to include a higher number of measurements to be taken, then the reminders may be set accordingly-e.g., to provide a reminder for every measurement reading. Other schedules and reminders may set, such as meal times, applicable start and end dates, etc.
- the glucose monitoring device is configured according to the created or modified treatment program.
- the glucose monitoring device may be configured by programming the device with the created or modified reminder schedule.
- the reminder schedule may be transmitted to the to the glucose monitoring device from the physician's computer via the wired or wireless communication link.
- the configuration data may be stored in the glucose monitoring device and thereafter be implemented when the patient begins using the device again. It should be appreciated that many other configuration data may be included that relate to alerts, medication calculations, meter settings, event reminders, etc.
- a report is generated.
- Various reports may be generated to provide the physician and/or patient with related information.
- reports may be generated and then printed.
- Example information that may be included in a report may include a summary of the glucose measurement data, health related parameters, recommendations, configuration settings, instructions, etc.
- educational material may be generated and printed for the patient and/or physician.
- the educational material may include information on medication, instructions for treatment, self-care instructions, or educational material geared toward educating the patient.
- FIG. 28 illustrates some example material (e.g., summary materials and educational materials) that may be generated and provided to the patient.
- FIG. 1 illustrates a flowchart of a method for analyte (e.g., glucose) monitoring management, according to one embodiment.
- analyte e.g., glucose
- a communication link is established with an analyte (e.g., glucose) monitoring device.
- an analyte e.g., glucose
- a patient may use the glucose monitoring device between visits to a physician, or other health care practitioner, to collect glucose measurement data, and then have the glucose monitoring device connect either wired or wireless with the computer of the physician during the next visit.
- glucose measurement data is received.
- the glucose measurement data includes data that has been collected over a time period.
- time periods may be used, such as two weeks, one month, two months, or any other time period.
- the time period may reflect the time between visits.
- the glucose monitoring device is connected to the physician's computer and glucose measurement data and the glucose measurement data is received by the physician's computer from the glucose monitoring device.
- the glucose measurement data is analyzed for health related parameters.
- the health related parameter may be, for example, a risk of hypoglycemia or hyperglycemia, deviation of median glucose with respect to a target range, a degree of glucose variability, or any other parameter or indicator of health or area of concern thereof.
- the risk level identifies a level of risk of hypoglycemia based on the collected measurement data.
- the level of risk of hypoglycemia or hyperglycemia may be established in various manners-e.g., by looking to hypoglycemic or hyperglycemic episodes, such as the number, duration, timing, or other characteristics thereof.
- Deviations of median glucose may be categorized, for example, as above, below, or within a target range.
- the degree of glucose variability indicates how variable the glucose measurements are.
- the analyzing of the analyte measurement data for health related parameters includes analyzing the measurement data for analyte episodes within the collection time period. For instance, the episodes are derived according to the methods described later with respect to threshold-based episodes and rate-of-change based episodes.
- recommendations for creating modifying a treatment program are determined, as represented at block 120.
- the recommendations modulate the health related parameters to improve one or more of the health related parameters.
- the recommendations may relate to lowering glucose variability, adjusting median glucose to be close to the target range, reducing a risk of hypoglycemia, etc.
- the recommendations are optional and are not required to be implemented by the user.
- a database stores recommendations and corresponding conditions that are associated with or required by the recommendations.
- a table may include predetermined conditions that are associated with one or more recommendations. Based on the conditions that exist, the appropriate recommendation may be determined. In some instances, the conditions and requirements may take into account attributes of the episodes themselves--e.g., type of episode, specific combinations of episodes present, number of episodes, relation to event or activities (e.g., meals, fasting periods, exercise, medication administration, times of day (e.g., morning, afternoon, night, sleeping periods, etc.), etc. Based on the resulting attributes of episodes found for the measurement data, the associated recommendations in the database will be selected.
- a user-interface is generated to enable the user (e.g., physician or other health care practitioner) to create or modify treatment.
- the user interface may include a graphical user interface (GUI) generated for display on a display device and includes one or more application "screens" or “windows”.
- GUI graphical user interface
- the generated user-interface provides the user with the necessary tool to modify or create a treatment program for the patient.
- the recommendations go further and guide the user in creating or modifying the treatment program such that the health related parameters may be modulated to improve the health related parameter.
- the previous discussion and examples for recommendations apply here as well.
- the glucose monitoring device is configured according to the created or modified treatment program.
- the glucose monitoring device may be configured by programming the device with the created or modified reminder schedule.
- the reminder schedule may be transmitted to the to the glucose monitoring device from the physician's computer via the wired or wireless communication link.
- the configuration data may be stored in the glucose monitoring device and thereafter be implemented when the patient begins using the device again.
- a report is generated.
- Various reports may be generated to provide the physician and/or patient with related information. For example, reports may be generated and then printed.
- any patient education material is generated to be provided (e.g., printed or transferred to the glucose monitoring device) for viewing at a later time.
- methods for managing analyte measurement data include receiving analyte measurement data that represent data collected over a time period, and analyzing the analyte measurement data for analyte episodes within that time period.
- the analyte episodes include at least one threshold based episode.
- the threshold based episode is based on measurements meeting an entrance threshold for entering the threshold based episode. Further, the threshold based episode requires at least one of: a minimum number of measurements meeting the entrance threshold; a minimum duration of time meeting the entrance threshold; and a minimum area for measurements meeting the entrance threshold.
- the methods also include storing the analyte episodes in memory.
- articles of manufacture are provided that include a machine-readable medium having machine-executable instructions stored thereon for managing analyte measurement data according to the methods described above.
- analyte measurement data may provide problems for episode detection due to various factors. For example, gaps in measurement data (e.g., missing measurements) may present problems in determining if the gap exists in one episode or exists between two episodes. Furthermore, outliers or other brief measurement data points may provide problems by improperly crossing value thresholds (e.g., entrance thresholds or exit thresholds) and rate of change based thresholds. Noise may present similar issues.
- gaps in measurement data e.g., missing measurements
- outliers or other brief measurement data points may provide problems by improperly crossing value thresholds (e.g., entrance thresholds or exit thresholds) and rate of change based thresholds. Noise may present similar issues.
- rate-of-change based thresholds refer to thresholds of rate-of-change (also referred to herein “rate thresholds” or “threshold rate”).
- rate thresholds also referred to herein “rate thresholds” or “threshold rate”
- value thresholds' is used herein generally to distinguish the thresholds from thresholds for rate-of-changes.
- Such value thresholds may include, for example, entrance thresholds, exit thresholds, thresholds of duration (also referred to herein as “duration thresholds”), thresholds for minimum number of measurements, thresholds for minimum area, etc.
- Value thresholds may also be referred to herein simply as thresholds in some instances.
- methods are provided that resolve the above-mentioned issues and problems in episode detection. For example, these methods may be used to search glucose measurement values to detect extreme episodes of clinical interest. Therefore, the episode may be more clinically meaningful.
- the present disclosure specifies the properties of episodes that can be clinically meaningful. These properties can also be used to construct sequences or "chains" of episodes that have specific clinical meaning related to self-care behaviors.
- episode analysis falls into two families: threshold based, and rate-of-change based thresholds. Looking for episodes in both directions, for example, suggests four basic episode types: low glucose / hypoglycemia (measurements below a threshold); high glucose / hyperglycemia (measurements above a threshold); glucose fall (rate-of-change more negative than a negative threshold rate); and glucose rise (rate-of-change more positive than a positive threshold rate).
- a "within target" episode is defined to identify an episode where the measurements are maintained between an upper and lower bound for a period of time. Detection of these episodes can be done by extension of the threshold-based episode detection algorithms.
- the methods for managing analyte measurement data described herein requires threshold based episodes to be based on measurements meeting an entrance threshold.
- the threshold based episode requires one or more of the following: a minimum number of measurements meeting the entrance threshold; a minimum duration of time meeting the entrance threshold; and a minimum area for measurements meeting the entrance threshold.
- all three criteria may be required. In one embodiment, all three are required to have an episode.
- a threshold is used herein to mean that the threshold is triggered. It should be appreciated that “meeting a threshold” is used generally herein to refer to instances where a threshold is triggered by values “equal to” or “exceeding” the threshold; as well as to other instances where a threshold is triggered by values only “exceeding” the threshold. Furthermore, it should be appreciated that the phrase “exceeding a threshold” is used herein generally to refer to values that are beyond the threshold such that the threshold is triggered, whether the threshold is triggered by measurements above the threshold (e.g., hyperglycemic episodes) or below the threshold value (hypoglycemic episodes).
- Gaps in measurement data may also provide problems by significantly altering an episode duration.
- a threshold based episode is defined based on a gap threshold such that a single episode is maintained at any gaps shorter than the gap threshold, and split into two separate potential episodes at any gaps meeting the gap threshold. The potential episodes are determined to be episodes if all other criteria are met.
- Noise may also present problems in defining episodes, especially when the true value is near a threshold. For example, noise may cause many episodes to be recorded when the true value is close to the threshold.
- a threshold based episode is defined based on an exit threshold for exiting the episode, such that the at least one threshold based episode ends when measurements meet the exit threshold.
- the exit threshold is a value "outside" the entrance threshold. The term “outside” is used here to mean that the exit threshold does not "equal" the entrance threshold or “exceed” the entrance threshold such that it would trigger the entrance threshold. Therefore, to exit an episode, measurements within the episode must first reach and pass the entrance threshold before eventually reaching the exit threshold. In this way, measurement will be "debounced” such that the episode is only terminated following a threshold crossing if the signal also crosses the exit threshold.
- threshold based episodes may be defined for clinical utility, including but not limited to: threshold value, most extreme value (magnitude of excursion past threshold), episode duration, or episode area. It should be appreciated that many other episode types may be provided, each of which, if independently clinically relevant, could form the basis for reports and analysis.
- FIG. 2A illustrates a flowchart for a method of managing analyte measurement data, according to one embodiment.
- analyte e.g., glucose
- a data processing device such as a glucose monitoring device, personal computer, a portable computer including a laptop or a handheld device (e.g., a personal digital assistant (PDA), a telephone including a cellular phone (e.g., a multimedia and Internet-enabled mobile phone including an iPhoneTM, a Blackberry®, or similar phone), etc.
- PDA personal digital assistant
- the analyte measurement data represents analyte measurements collected over a period of time. Various time periods may be used, such as two weeks, one month, two months, or any other time period.
- the time period may reflect the time between visits.
- the data processing device may receive the analyte measurement data from a glucose monitoring device or other device-e.g., another personal computer, portable computer, handheld device, or memory storage device, such as Flash memory stick, CD-ROM, etc.
- the analyte measurement data is analyzed for analyte episodes that are threshold based episodes.
- the threshold based episode is based on measurements meeting an entrance threshold for entering the episode.
- the threshold based episode requires at least one of: a minimum number of measurements meeting the entrance threshold; a minimum duration of time meeting the entrance threshold; and a minimum area for measurements meeting the entrance threshold.
- the area associated with the measurements meeting the entrance threshold is defined as the area on a glucose versus time plot of measurement that is between the measurements meeting the entrance threshold and the entrance threshold itself.
- any threshold based episodes are stored in memory for further data management.
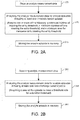
- FIG. 2B illustrates a flowchart for a method of managing analyte measurement data wherein the analyte measurement data is analyzed for analyte episodes that are rate of change based episodes. This is discussed in further detail later in the section for rate-of-change based episodes.
- methods of managing analyte measurement data may include analyzing the measurement data for both threshold based episodes and rate-of-change based episodes.
- FIG. 3 illustrates a flowchart of a method for managing analyte (e.g., glucose) measurements that includes analyzing for threshold based episodes, according to one embodiment.
- the glucose measurement data is received and analyzed for threshold based episodes.
- the analysis may begin, for example, at the earliest measurement and continued through till the latest measurement.
- the previous glucose measurement value is set to "not in an episode" at the start of the analysis.
- the "newest" or next glucose value (measurement) in time-ordered series is selected for analysis. If the next glucose value is the last value of the glucose measurement data, then the process is ended, as shown by block 315. If the next glucose value is not the last measurement, then the state of that glucose measurement is checked, as shown in block 320. If it is determined that the next glucose value is between thresholds, then the next glucose value in time-ordered series is selected at block 310. "Between episodes" refers to the being between the entrance threshold and exit threshold.
- the state of the previous glucose value is checked, as shown in block 325. Then it is determined if the previous measurements is in episode or between thresholds. For example, in the embodiment shown, at block 330, the episode requires: 1) minimum number of measurements meeting the entrance threshold; 2) a minimum duration of time meeting the entrance threshold; and 3) a minimum area for measurements meeting the entrance threshold (e.g., the area under or above the glucose v. time curve relative to entrance threshold for a hypoglycemic or hyperglycemic episode, respectively).
- an episode does not exist and is not added to the search results (e.g., not stored in memory and used for further glucose measurement management). If all three criteria are met, as shown in block 340, then the episode exists and is added to the list of episodes (e.g., stored in memory and used for further glucose measurement management). The state of the previous glucose value is then set to "not in episode" so that episodes found in the subsequent data are analyzed independently of the previously identified episode.
- next glucose value is determine to be in an episode
- the gap to the previous point is checked against a predetermined gap threshold, as shown in block 345. If the gap to the previous point is smaller than the gap threshold, then the state of the previous glucose value is checked, as shown in block 350. If it determined that the previous glucose value is in episode or between thresholds, then the state of the previous glucose value is continued in episode, as shown at block 355. Further at block 355, various properties, such as end time, point count and "exposure" or area are stored. Then a next glucose value in time-ordered series is selected, as shown at block 310.
- the previous glucose value is set to in episode, and properties such as start time, point count and exposure (area) are stored, as shown in block 360. Then the next glucose value in time-ordered series is selected, as shown in block 310.
- the gap to the previous point meets the gap threshold (e.g., is larger than the gap threshold, or in other embodiments is equal to or larger)
- the episode does not exist and is not added to the search results (e.g., stored in memory and used for further glucose measurement management).
- the episode exists and is added to the list of episodes (e.g., stored in memory and used for further glucose measurement management). The state of the previous glucose value is then set to "not in episode".
- the previous glucose value is set to in episode and the properties, such as start time, point count and exposure (area) are stored, as shown in block 360. Then the next glucose value in time-ordered series is selected, as shown in block 310.
- FIG. 4 illustrates a hypoglycemic episode for a set of glucose measurement data, according to one embodiment.
- glucose measurements 405 are plotted on a chart of glucose versus time.
- the entrance threshold 410 is shown for a hypoglycemia event.
- the measurements that meet the entrance threshold are measurements that reach or exceed the entrance threshold by going below the entrance threshold (e.g., are smaller in value).
- measurement 405A is above the entrance threshold and thus not meeting the initial threshold for entering a hypoglycemic episode.
- Measurement 405B is the next measurement and "exceeds" the entrance threshold 410 for entering the hypoglycemic episode, and thus meets the entrance threshold.
- the next four measurements 405E are below the exit threshold 415.
- Measurement 405C is above the exit threshold 415 and thus "'exceeds" and meets the exit threshold 415.
- the three criteria are met for an episode: 1) minimum number of measurements outside the entrance threshold (e.g., the minimum number of measurements may be three measurements); 2) a minimum duration of time outside the entrance threshold (e.g., the minimum duration of time may be 20 minutes); and 3) a minimum area outside the entrance threshold (e.g., the area between the entrance threshold and the measurements that meet the entrance threshold).
- measurement 405A and 405C are the start and end of the episode, respectively, and the duration 420 of the episode spanning the time between the two. Therefore, the episode duration 420 is shown with the pre-event window 425 prior and post-event window 430 thereafter.
- Measurement 405D represents the lowest measurement in the episode.
- FIG. 5 illustrates a hyperglycemic episode for a set of glucose measurement data, according to one embodiment.
- glucose measurements 505 are plotted on a chart of glucose versus time.
- the entrance threshold 510 is shown for a hyperglycemia event.
- measurement 505A has not reached or exceeded (e.g., is below) the entrance threshold and thus not meeting the initial threshold requirement of entering a hyperglycemic episode.
- Measurement 405B is the next measurement and the entrance threshold 510 is met (e.g., reached or exceeded), and thus the first requirement of entering a hyperglycemic episode is met.
- Each consecutive measurement thereafter does not cross the exit threshold 515 until measurement 505E.
- the next measurement 505F returns back above the exit threshold and due to the duration threshold requirement, the measurements did not stay past the exit threshold for a required duration threshold (e.g., assuming an example duration threshold of 20 minutes). Thus the episode continues and does not end.
- Measurement 505C crosses the exit threshold and the next 3 measurements stay past the exit threshold (e.g., stay past the exit threshold for 30 minutes, which is longer than the example duration threshold of 20 minutes), thus meeting the duration threshold requirement. Therefore, the episode begins at measurement 505B and ends at measurement 505C.
- the episode duration 520 is shown with the pre-event window 525 prior and post-event window 530 thereafter.
- the episode includes a maximum measurement 505D in the episode.
- methods for managing analyte measurement data include receiving analyte measurement data that represent data collected over a time period, and analyzing the analyte measurement data for analyte episodes within that time period.
- the analyte episodes include at least one rate-of-change based episode.
- the rate-of-change based episode requires a core of the episode to meet a threshold rate for a duration threshold.
- the methods also include storing the analyte episodes in memory.
- articles of manufacture are provided that include a machine-readable medium having machine-executable instructions stored thereon for managing analyte measurement data according to the methods described above.
- the rate-of-change based episode requires a core of the episode to meet a threshold rate.
- the core is formed by two points having a threshold core rate-of-change for a duration threshold. Local extrema may then be scanned outward from the core to potentially define the episode.
- Gaps in the measurement data can also significantly alter the episode durations.
- a rate-of-change based episode is defined based on a gap threshold such that a single episode at any gaps shorter than the gap threshold, and split into two separate potential episodes at any gaps meeting the gap threshold. All of the points before the gap are considered a potentially complete episode with the last point being the point preceding the gap. All the points after the gap form the start of a potentially new episode. Again, the potential episodes are determined to be episodes if all other episode criteria are met.
- the rate-of-change based episode is defined based on a distance threshold between episodes such that two episodes within the distance threshold of each other are merged into a single episode. thus, episodes that are close together are merged into a single episode, resulting in a newly defined episode containing all of the points between the first point of the first episode and the last point of the second episode.
- episodes merged in this way could have intermediate extreme points outside of the end values.
- the single episode of the merger has intermediate extreme points outside of end values of the single episode, and wherein the single episode is then redefined beginning and ending at the intermediate extreme points.
- Episodes redefined in this way could include spikes caused by two closely spaced points where one of which is an outlier.
- the criteria requiring a duration threshold may be implemented in other embodiments to alleviate such issue.
- Properties of change episodes can be defined, including but not limited to: maximum rate, delta (highest-lowest values), lowest value, and highest value. This provides a virtually limitless catalog of episode types, each of which, if independently clinically relevant, could form the basis for reports and analysis.
- FIG. 2B illustrates a flowchart of a method for managing analyte (e.g., glucose) measurements that includes analyzing for rate-of-change based episodes.
- analyte e.g., glucose
- analyte measurement data is received.
- the analyte measurement data is analyzed for analyte episodes that are rate of change based episodes.
- the rate of change based episode requires a core of the episode to meet a threshold rate.
- the core is formed by two points having a threshold rate-of-change for a threshold duration of time (duration threshold).
- any threshold based episodes are stored in memory for further data management.
- FIG. 6 illustrates a flowchart of a method for managing analyte (e.g., glucose) measurements, according to one embodiment.
- the glucose measurement data is received and analyzed for rate-of-change based episodes. The analysis may begin, for example, at the earliest measurement and continued through till the latest measurement.
- analyte e.g., glucose
- a first value is identified.
- each point after the first value referred to here as the next value, is identified and the distance between the next value and the first point is determined and compared to a gap threshold (e.g., a maximum gap), as shown in block 615. If the distance is not greater than the gap threshold, then it is determined if the rate of change between the first value and the next exceeds the minimum threshold rate, as represented at block 620. If it does not meet the threshold rate (e.g., does not exceed the threshold rate), then another 'next value' is selected (e.g., the next measurement in time-ordered series) for analysis, as shown by block 610.
- a gap threshold e.g., a maximum gap
- the distance is greater than the gap threshold, then it is determined if the last episode is longer than a duration threshold, as shown by block 625. If it is not longer than the duration threshold, then the first value is set to the next value, to prevent reanalyzing the same points on the next pass, as represented by block 630 and arrow returning to block 605. If the last episode is longer than the duration threshold, then an episode is identified and stored in the episode list (e.g., in memory), as shown in block 635. Then the first value is set to the next value, to prevent reanalyzing the same points on the next pass, as represented by block 630 and arrow returning to block 605.
- the rate of change between the first value and the next value exceeds the minimum, then local extrema (e.g., first point and last point) are determined by scanning back form the first value and forward from the next value, as shown at block 640. Then the minimum and maximum (e.g., highest value and lowest value) are determined by scanning from the first point to the last point, as shown by block 645. The starting value and ending value are set to the highest value and the lowest value (or vice versa).
- local extrema e.g., first point and last point
- minimum and maximum e.g., highest value and lowest value
- a predetermined acceptable minimum e.g., a distance threshold between the two episodes. If so, then the two episodes are combined, as shown by block 655. The first point is equal to the starting value of the last episode, and the last point is the ending value of this episode. The previous episode is eliminated. Then to block 645, where the minimum and maximum (e.g., highest value and lowest value) are determined by scanning from the first point to the last point. The starting value and ending value are set to the highest value and the lowest value (or vice versa).
- a predetermined acceptable minimum e.g., a distance threshold between the two episodes.
- this episode is stored as the last episode for the next pass, as shown by block 660. Then again back to block 625 where it is determined if the last episode is longer than a duration threshold.
- FIG. 7 illustrates an example of a detection of a glucose rise episode in a set of glucose measurement data, according to one embodiment.
- glucose measurement data 705 is plotted on a chart of glucose versus time. Starting with the earliest measurements on the left, each measurement is compared with future measurements to determine if a predetermined rate threshold is met (e.g., reached or exceeded). For example, in the example shown, measurement 705A and prior measurements to the left, do not have any future measurements that create a rate-of-change above a predetermined threshold rate. However, measurement 705B and future measurement 705F embody a rate-of-change above the predetermined threshold rate. For example, the top of trigger window 710 represents the predetermined threshold rate and is shown for measurement 705B.
- measurement 705F is above the top of trigger window 710, and thus possesses a rate-of-change greater than the predetermined rate threshold of the trigger window 710.
- a core is thus defined from measurement 705B as the trigger start point to measurement 705F as the trigger end point. Note that for all the measurements prior to measurement 705B, no future measurements exist that would fall above the top of similarly drawn trigger windows (not shown) which align with the corresponding measurement being analyzed.
- Local extrema are then scanned for outside the core. For example, scanning from measurement 705B to the left, a minimum point is scanned for. Measurement 705C is determined to be the minimum and thus the episode start point. Similarly, scanning from measurement 705F to the right, a maximum point is scanned for. Measurement 705G is determined to be the maximum and thus the episode end point. Note that the episode includes a minimum and maximum point for the episode itself, which may or may not be the same as the local extrema searched for. In this case, the minimum measurement 705H is the episode's minimum while measurement 705G is the episode's maximum.
- the episode duration 720 is shown with the pre-event window 725 prior and post-event window 730 thereafter. The process may then be repeated for later measurements past the episode to find additional rate-of-change based episodes within the measurement data.
- FIG. 8 illustrates an example of a detection of a glucose fall episode in a set of glucose measurement data, according to one embodiment.
- glucose measurement data 805 is plotted on a chart of glucose versus time. Starting with the earliest measurements on the left, each measurement is compared with future measurements to determine if a predetermined rate threshold is met (e.g., reached or exceeded). For example, in the example shown, measurement 805A and prior measurements to the left, do not have any future measurements that create a rate-of-change above a predetermined threshold rate. However, measurement 805B and future measurement 805F possess a rate-of-change exceeding the predetermined threshold rate. For example, the bottom of trigger window 810 represents the predetermined threshold rate and is shown for measurement 805B.
- measurement 805F is below the bottom of trigger window 810, and thus possesses a rate-of-change exceeding than the predetermined rate threshold of the trigger window 810.
- a core is thus defined from measurement 805B as the trigger start point to measurement 805F as the trigger end point. Note that for all the measurements prior to measurement 805B, no future measurements exist that would fall below the bottom of similarly drawn trigger windows (not shown) which align with the corresponding measurement being analyzed.
- Local extrema are then scanned for outside the core. For example, scanning from measurement 805B to the left, a maximum point is scanned for. Measurement 805B is determined to be the minimum and thus the episode start point. Similarly, scanning from measurement 805F to the right, a minimum point is scanned for. Measurement 805G is determined to be the minimum and thus the episode end point. Note that the episode includes a minimum and maximum point for the episode itself, which may or may not be the same as the local extrema searched for. In this case, the minimum measurement 805G is the episode's minimum while measurement 805H is the episode's maximum.
- the episode duration 820 is shown with the pre-event window 825 prior and post-event window 830 thereafter. The process may then be repeated for later measurements past the episode to find additional rate-of-change based episodes within the measurement data.
- FIG. 9 illustrates a data processing device that may perform the methods described herein, according to one embodiment.
- the data processing device 900 is shown including processor 910, communication unit 923, memory 915, display unit 921 and input/output 920.
- the data processing device may communicate, either wired or wireless, with other devices, such as a medication delivery device 905, portable processing device 906, computer 907, or an analyte monitoring device 910.
- the data processing device may also be coupled to networks 908 and/or the internet 909.
- the analyte monitoring device and/or system 910 may, for example, provide for discrete monitoring of one or more analytes using an in vitro blood glucose (“BG") meter and an analyte test strip.
- BG in vitro blood glucose
- the glucose monitoring device may provide for continuous, periodic, and/or intermittent in vivo monitoring of the level of one or more analytes.
- a system may include, for example, an analyte sensor at least a portion of which is to be positioned beneath a skin surface of a user for a period of time.
- data processing device 900 may be a computer of a physician or HCP that connects to glucose monitoring device 910 of a patient.
- the computer 900 may then communicate data to and from other computers 907 and the internet 909.
- the data processing device 900 may be a handheld device, such as a cellular phone or hand-held computer, that connects with the glucose monitoring device 910 of a patient.
- the device 900 may then communicate data to and from a personal computers 907, for example, via a direct wired or wireless connection, or via the internet 909.
- instructions for performing the methods described herein may be stored in memory unit 915 and executed by processor 910.
- the communication unit 923 may be used to establish a communication link between the analyte monitoring device 910 and the data processing device 900.
- Display unit 921 and input/output 920 may be used to provide the user interface and receive user input. Input/output 920 may also be used to connect to a printer to print reports.
- Such special-purpose circuitry can be in the form of, for example, one or more application-specific integrated circuits (ASICS), programmable logic devices (PLDs), field programmable gate arrays (FPGAs), etc.
- ASICS application-specific integrated circuits
- PLDs programmable logic devices
- FPGAs field programmable gate arrays
- Machine-readable medium includes any mechanism that can store information in a form accessible by a machine (a machine may be, for example, a computer, network device, cellular phone, personal digital assistant (PDA), manufacturing took, any device with one or more processors, etc.).
- a machine-accessible medium includes recordable/non-recordable media (e.g., read only memory (ROM); random access memory (RAM); magnetic disk storage media; optical storage media; flash memory devices; etc.), etc.
Abstract
Description
- This application claims priority based to
U.S. Provisional Application No. 61/540,332, filed September 28, 2011 - Diabetes patients regularly consult with their health care practitioner (HCP) in order to assess the progress of their diabetes management, and to evaluate areas in need for improvement. The patient's responsibilities may include keeping diligent record of relevant information such as meal times and amount, fasting periods, insulin intake, exercise, and glucose measurements.
- When patients return for a visit to the HCP, the HCP may collect the glucose measurements and acquire information from the collection of measurements. Information acquired from the measurements by existing software typically focus on overall summary statistics, such as median and percent or measurements in a target range. The software provides a general picture of the glucose measurements as a whole and does not focus in on more specific episodes within the measurements that may be useful in treatment determination or modification. Such general summary information is limited and more clinically meaningful health related information is lacking.
- In some aspects of the present disclosure, methods for analyte monitoring management are provided. The methods include receiving analyte measurement data and analyzing the analyte measurement data for health related parameters. The analyte measurement data represents analyte measurement data collected over a time period. The methods also include determining recommendations for creating or modifying a treatment program based on the analysis. The recommendations modulate the health related parameters to improve one or more of the health related parameters. The methods include generating a user-interface to enable a user to create or modify the treatment program. The user interface provides the recommendations to guide the user in creating or modifying the treatment program. The recommendations are optional and not required to be implemented by the user. The methods also include configuring an analyte monitoring device according to the created or modified treatment program. In some aspects of the present disclosure, articles of manufacture are provided that include a machine-readable medium having machine-executable instructions stored thereon for analyte monitoring management according to the methods described above.
- In some aspects of the present disclosure, methods for managing analyte measurement data are provided. The methods include receiving analyte measurement data that represent data collected over a time period, and analyzing the analyte measurement data for analyte episodes within that time period. The analyte episodes include at least one threshold based episode. The threshold based episode is based on measurements meeting an entrance threshold for entering the threshold based episode. Further, the threshold based episode requires at least one of: a minimum number of measurements meeting the entrance threshold; a minimum duration of time meeting the entrance threshold; and a minimum area for measurements meeting the entrance threshold. The methods also include storing the analyte episodes in memory. In some aspects of the present disclosure, articles of manufacture are provided that include a machine-readable medium having machine-executable instructions stored thereon for managing analyte measurement data according to the methods described above.
- In some aspects of the present disclosure, methods for managing analyte measurement data are provided. The methods include receiving analyte measurement data that represent data collected over a time period, and analyzing the analyte measurement data for analyte episodes within that time period. The analyte episodes include at least one rate-of-change based episode. The rate ol-change based episode requires a core of the episode to meet a threshold rate for a duration threshold. The methods also include storing the analyte episodes in memory. In some aspects of the present disclosure, articles of manufacture are provided that include a machine-readable medium having machine-executable instructions stored thereon for managing analyte measurement data according to the methods described above.
- The following patents, applications and/or publications are incorporated herein by reference for all purposes:
U.S. Patent No. 7,041,468 ;U.S. Pat. No. 5,356,786 ;U.S. Pat. No. 6,175,752 ;U.S. Pat. No. 6,560,471 ;U.S. Pat. No. 5,262,035 ;U.S. Pat. No. 6,881,551 ;U.S. Pat. No. 6,121,009 ;U.S. Pat. No. 7,167,818 ;U.S. Pat. No. 6,270,455 ;U.S. Pat. No. 6,161,095 ;U.S. Pat. No. 5,918,603 ;U.S. Pat. No. 6,144,837 ;U.S. Pat, No. 5,601,435 ;U.S. Pat. No. 5,822,715 ;U.S. Pat. No. 5,899,855 ;U.S. Pat. No. 6,071,391 ;U.S. Pat. No. 6,120,676 ;U.S. Pat. No. 6,143,164 ;U.S. Pat. No. 6,299,757 ;U.S. Pat. No. 6,338,790 ;U.S. Pat. No. 6,377,894 ;U.S. Pat. No. 6,600,997 ;U.S. Pat. No. 6,773,671 ;U.S. Pat. No. 6,514,460 ;U.S. Pat. No. 6,592,745 ;U.S. Pat. No. 5,628,890 ;U.S. Pat. No. 5,820,551 ;U.S. Pat. No. 6,736,957 ;U.S. Pat. No. 4,545,382 ;U.S. Pat. No. 4,711,245 ;U.S. Pat. No. 5,509,410 ;U.S. Pat. No. 6,540,891 ;U.S. Pat. No. 6,730,200 ;U.S. Pat. No. 6,764,581 ;U.S. Pat. No. 6,299,757 ;U.S. Pat. No. 6,461,496 ;U.S. Pat. No. 6,503,381 ;U.S. Pat. No. 6,591,125 ;U.S. Pat. No. 6,616,819 ;U.S. Pat. No. 6,618,934 ;U.S. Pat. No. 6,676,816 ;U.S. Pat. No. 6,749,740 ;U.S. Pat, No. 6,893,545 ;U.S. Pat. No. 6,942,518 ;U.S. Pat. No. 6,514,718 ;U.S. Pat. No. 5,264,014 ;U.S. Pat. No. 5,262,305 ;U.S. Pat. No. 5,320,715 ;U.S. Pat. No. 5,593,852 ;U.S. Pat. No. 6,746,582 ;U.S. Pat. No. 6,284,478 ;U.S. Pat. No. 7,299,082 ;U.S. Patent Application No. 61/149,639 U.S. Patent Application No. 11/461,725, filed August 1, 2006 U.S. Patent Application No. 12/495,709, filed June 30, 2009 US2004/0186365 ;U.S. Patent Application Publication No. 2007/0095661 ;U.S. Patent Application Publication No. 2006/0091006 ;U.S. Patent Application Publication No. 2006/0025662 ;U.S. Patent Application Publication No. 2008/0267823 ;U.S. Patent Application Publication No. 2007/0108048 ;U.S. Patent Application Publication No. 2008/0102441 ;U.S. Patent Application Publication No. 2008/0066305 ;U.S. Patent Application Publication No. 2007/0199818 ;U.S. Patent Application Publication No. 2008/0148873 ;U.S. Patent Application Publication No. 2007/0068807 ;US patent Application Publication No. 2010/0198034 ; andUS provisional application no. 61/149,639 - A detailed description of various embodiments of the present disclosure is provided herein with reference to the accompanying drawings, which are briefly described below. The drawings are illustrative and are not necessarily drawn to scale. The drawings illustrate various embodiments of the present disclosure and may illustrate one or more embodiments) or example(s) of the present disclosure in whole or in part. A reference numeral, letter, and/or symbol that is used in one drawing to refer to a particular element may be used in another drawing to refer to a like element.
-
FIG. 1 illustrates a flowchart of a method for analyte (e.g., glucose) monitoring management, according to one embodiment. -
FIG. 2A illustrates a flowchart for a method of managing analyte measurement data, according to one embodiment. -
FIG. 2B illustrates a flowchart for a method of managing analyte measurement data, according to one embodiment. -
FIG. 3 illustrates a flowchart of a method for managing analyte (e.g., glucose) measurements that includes analyzing measurement data for threshold based episodes, according to one embodiment. -
FIG. 4 illustrates a hypoglycemic episode for a set of glucose measurement data, according to one embodiment. -
FIG. 5 illustrates a hyperglycemic episode for a set of glucose measurement data, according to one embodiment. -
FIG. 6 illustrates a flowchart of a method for managing analyte (e.g., glucose) measurements that includes analyzing measurement data for rate-of-change based episodes, according to one embodiment. -
FIG. 7 illustrates an example of a detection of a glucose rise episode in a set of glucose measurement data, according to one embodiment. -
FIG. 8 illustrates an example of a detection of a glucose fall episode in a set of glucose measurement data, according to one embodiment. -
FIG. 9 illustrates a data processing device that may perform the methods described herein, according to one embodiment. -
FIGs. 10-30 illustrate the user interface that is generated to enable a user to create or modify a treatment program, and further provides the recommendations to guide the user in creating or modifying the treatment program - Before the embodiments of the present disclosure are described, it is to be understood that the present disclosure is not limited to particular embodiments described, as such may, of course, vary. It is also to be understood that the terminology used herein is for the purpose of describing particular embodiments only, and is not intended to be limiting, since the scope of the embodiments of the present disclosure will be limited only by the appended claims.
- Where a range of values is provided, it is understood that each intervening value, to the tenth of the unit of the lower limit unless the context clearly dictates otherwise, between the upper and lower limits of that range is also specifically disclosed. Each smaller range between any stated value or intervening value in a stated range and any other stated or intervening value in that stated range is encompassed within the present disclosure. The upper and lower limits of these smaller ranges may independently be included or excluded in the range, and each range where either, neither or both limits are included in the smaller ranges is also encompassed within the present disclosure, subject to any specifically excluded limit in the stated range. Where the stated range includes one or both of the limits, ranges excluding either or both of those included limits are also included in the present disclosure.
- In the description of the present disclosure herein, it will be understood that a word appearing in the singular encompasses its plural counterpart, and a word appearing in the plural encompasses its singular counterpart, unless implicitly or explicitly understood or stated otherwise. Merely by way of example, reference to "an" or "the" "analyte" encompasses a single analyte, as well as a combination and/or mixture of two or more different analytes, reference to "a" or "the" "concentration value" encompasses a single concentration value, as well as two or more concentration values, and the like, unless implicitly or explicitly understood or stated otherwise. Further, it will be understood that for any given component described herein, any of the possible candidates or alternatives listed for that component, may generally be used individually or in combination with one another, unless implicitly or explicitly understood or stated otherwise. Additionally, it will be understood that any list of such candidates or alternatives, is merely illustrative, not limiting, unless implicitly or explicitly understood or stated otherwise.
- Various terms are described below to facilitate an understanding of the present disclosure. It will be understood that a corresponding description of these various terms applies to corresponding linguistic or grammatical variations or forms of these various terms. It will also be understood that the present disclosure is not limited to the terminology used herein, or the descriptions thereof, for the description of particular embodiments. Merely by way of example, the present disclosure is not limited to particular analytes, bodily or tissue fluids, blood or capillary blood, or sensor constructs or usages, unless implicitly or explicitly understood or stated otherwise, as such may vary. The publications discussed herein are provided solely for their disclosure prior to the filing date of the application. Nothing herein is to be construed as an admission that the embodiments of the present disclosure are not entitled to antedate such publication by virtue of prior invention. Further, the dates of publication provided may be different from the actual publication dates which may need to be independently confirmed.
- As summarized above, in some aspects of the present disclosure, methods for analyte monitoring management are provided. The methods include receiving analyte measurement data and analyzing the analyte measurement data for health related parameters. The analyte measurement data represents analyte measurement data collected over a time period. The methods also include determining recommendations for creating or modifying a treatment program based on the analysis. The recommendations modulate the health related parameters to improve one or more of the health related parameters. The methods include generating a user-interface to enable a user to create or modify the treatment program. The user interface provides the recommendations to guide the user in creating or modifying the treatment program. The recommendations are optional and not required to be implemented by the user. The methods also include configuring an analyte monitoring device according to the created or modified treatment program. In some aspects of the present disclosure, articles of manufacture are provided that include a machine-readable medium having machine-executable instructions stored thereon for analyte monitoring management according to the methods described above.
-
FIGs. 10-30 illustrate and describe example methods for analyte monitoring management. Moreover,FIGs. 10-30 illustrate the user interface that is generated to enable a user to create or modify the treatment program, and further provides the recommendations to guide the user in creating or modifying the treatment program. The user interface also enables the configuring of an analyte monitoring device according to the created or modified treatment program, the importing of glucose measurement data, and the printing of orders including materials such as reports, summaries, educational material, instructional material, etc. - The user may be, for example, a physician or other health care practitioner, and the user-interface provided via a data processing device, such as a personal computer, a portable computer including a laptop or a handheld device (e.g., a personal digital assistant (PDA), a telephone including a cellular phone (e.g., a multimedia and Internet-enabled mobile phone including an iPhone™, a Blackberry®, or similar phone), etc.
- In one embodiment, a communication link is established with an analyte (e.g., glucose) monitoring device. The glucose monitoring device may be connected (wired or wirelessly), for example, to the data processing device. For instance, a patient may use the glucose monitoring device between visits to a physician, or other health care practitioner, to collect glucose measurement data, and then have the glucose monitoring device connect either wired or wireless with the data processing device (e.g., computer, laptop, cellular phone, etc.) of the physician during the next visit.
- The glucose measurements that are received represent data that has been collected over a time period. Various time periods may be used, such as two weeks, one month, two months, or any other time period. For example, the time period may reflect the time between visits. In the example provided, the glucose monitoring device is connected to the physician's computer and glucose measurement data and the glucose measurement data is received by the physician's computer from the glucose monitoring device. In one embodiment, the glucose measurement data may be received from other devices than the glucose monitoring device-e.g., another personal computer, portable computer, handheld device, or memory storage device, such as Flash memory stick, CD-ROM, etc.
- The health related parameter may be, for example, a risk of hypoglycemia or hyperglycemia, deviation of median glucose with respect to a target range, a degree of glucose variability, or any other parameter or indicator of health or area of concern thereof. The risk level identifies a level of risk of hypoglycemia based on the collected measurement data. The level of risk of hypoglycemia or hyperglycemia may be established in various manners-e.g., by looking to hypoglycemic or hyperglycemic episodes, such as the number, duration, timing, or other characteristics thereof. Deviations of median glucose may be categorized, for example, as above, below, or within a target range. The degree of glucose variability indicates how variable the glucose measurements are. Widely varying glucose measurements may present difficulties in controlling treatment or parameters. For example, small variations in glucose measurements may facilitate more accurately estimating the proper dosage, or change in dosage, to improve or control blood glucose levels.
- In some aspects, the analyzing of the analyte measurement data for health related parameters includes analyzing the measurement data for analyte episodes within the collection time period. In one embodiment, the episodes are derived according to the methods described herein relating to threshold based episodes. In one embodiment, the episodes are derived according to the methods described herein relating to rate-of-change based episodes. In one embodiment, the episodes are derived according to methods described herein relating to both the threshold based episodes and the rate-of-change based episodes.
- The recommendations are provided to modulate the health related parameters to improve one or more of the health related parameters. For example, the recommendations may relate to lowering glucose variability, adjusting median glucose to be close to the target range, reducing a risk of hypoglycemia or hyperglycemia, etc. The recommendations are optional and are not required to be implemented by the user.
- In one embodiment, a database stores recommendations and corresponding conditions that are associated with or required by the recommendations. For example, a table may include predetermined conditions that are associated with one or more recommendations. Based on the conditions that exist, the appropriate recommendation may be determined. In some instances, the conditions and requirements may take into account attributes of the episodes themselves--e.g., type of episode, specific combinations of episodes present, number of episodes, relation to event or activities (e.g., meals, fasting periods, exercise, medication administration, times of day (e.g., morning, afternoon, night, sleeping periods, etc.), etc. Based on the resulting attributes of episodes found for the measurement data, the associated recommendations in the database will be selected.
- As stated above, the user-interface is generated to enable the user (e.g., physician or other health care practitioner) to create or modify treatment. It should be appreciated that the term "user-interface" is used broadly herein. The user interface may be visual and/or audio based. For example, the user interface may include a graphical user interface (GUI) generated for display on a display device. It should be appreciated that the user interface may be implemented as a program containing one or more GUIs and may include one or more application "screens" or "windows".
- The generated user-interface provides the user with the necessary tool to modify or create a treatment program for the patient. However, the recommendations go further and guide the user in creating or modifying the treatment program such that the health related parameters may be modulated to improve the health related parameter. The recommendations may for instance, recommend or suggest that one or more health related parameters be targeted for improvement. Furthermore, the recommendations may recommend steps necessary to achieve such improvement.
- The recommendations may be implemented in a variety of manners within the user interface. For example,
FIG. 13 illustrates an example GUI that includes recommendations resulting from analyzing glucose measurement data that was collected over a time period. The recommendations A1 are provided in summary format along with a summary of the health related parameters A2 for specific time periods in the day (e.g., during fasting periods, post-breakfast periods, post-lunch periods, and post-dinner periods). A summary A3 of the glucose measurement data over a 24-hour plot is also shown in the GUI. - In one embodiment, the recommendations include a recommendation for creating or modifying medication parameters of the treatment program. The medication parameters may include, for instance, the medication selected, the amount of dosage, the frequency or timing of administration, etc. For example, it may be determined that a risk of hypoglycemia is present (e.g., high risk) and recommended that medication (e.g., insulin) be increased. The recommendation may also note that glucose variability is high and that reducing this variability will allow for greater increases in the medication dose. The recommendation may further include recommended steps that can be taken to assist with the improvement, such as using a greater number of measurements to be scheduled for higher sample count, as shown. In one embodiment, the recommendation for creating or modifying medication parameters are provided for different time periods, including time periods centered around events such as fasting periods, meal times (e.g., during post-breakfast periods, post-lunch periods, post-dinner periods), exercise or other activities, etc.
-
FIG. 17 illustrates recommendations provided along with the option for the user to select the corresponding course of action. In the example shown, the recommendations are provided for medication adjustment purposes. For instance, a summary A10 of the health related parameters are listed for different event periods-e.g., median glucose and glucose variability are provided fasting periods to indicate that these are the areas of concern determined for this period. The user interface provides the user with suggested or recommended courses of action A11. For example, as shown for fasting, the user is presented with the option of reducing variability with no medication dose adjustment; or the option of decreasing the medication adjustment if variability cannot be reduced. The user interface also provides the user with a trigger element A12 to get more information or further recommendation related thereto, as shown by pop up windows A13 onFIG. 18 . - In one embodiment, insufficient measurement data is also accounted for and conveyed on the user interface. For example, page 33 illustrates an example user-interface when insufficient data is encountered. As shown, the recommendation may state that that there is insufficient data to perform an analysis, and may present a warning or suggest a course of action to be taken with caution.
- In one embodiment, glucose variability is a health related parameter in the analysis. The user interface may provide recommendations, for example, in the form of specific questions to ask the patient or to determine about the patient. For example,
FIGs. 23-24 illustrate example questions to be answered by the user to assist with treatment creation or modification. - In one embodiment, educational material or other reference material may be provided to assist or remind the user of the subject matter related to the recommendation. For example, guidelines or flowcharts (e.g., medication administration guidelines) or other pertinent information (e.g., information regarding the medication, such as ingredients, side effects, recommended dosages, etc.) may be provided to assist the user with actions related to the recommendation. For instance, example educational information is shown on
FIGs. 17 ,18 , and20 . - In one embodiment, the user interface enables the user to generate a structured schedule, including setting reminders related to the modified or created treatment program. For example, reminders to take measurement readings may be set and ultimately implemented in the glucose monitoring device to remind the patient (or user of the glucose monitoring device) to take a measurement at the appropriate time, to avoid missing measurements or taking them too infrequently. Thus, if the treatment program is modified to include a higher number of measurements to be taken, then the reminders may be set accordingly-e.g., to provide a reminder for every measurement reading. Other schedules and reminders may set, such as meal times, applicable start and end dates, etc.
- As stated above, the glucose monitoring device is configured according to the created or modified treatment program. For example, the glucose monitoring device may be configured by programming the device with the created or modified reminder schedule. For instance, the reminder schedule may be transmitted to the to the glucose monitoring device from the physician's computer via the wired or wireless communication link. The configuration data may be stored in the glucose monitoring device and thereafter be implemented when the patient begins using the device again. It should be appreciated that many other configuration data may be included that relate to alerts, medication calculations, meter settings, event reminders, etc.
- Furthermore, in one embodiment, a report is generated. Various reports may be generated to provide the physician and/or patient with related information. For example, reports may be generated and then printed. Example information that may be included in a report may include a summary of the glucose measurement data, health related parameters, recommendations, configuration settings, instructions, etc. In one embodiment, educational material may be generated and printed for the patient and/or physician. For instance, the educational material may include information on medication, instructions for treatment, self-care instructions, or educational material geared toward educating the patient.
FIG. 28 illustrates some example material (e.g., summary materials and educational materials) that may be generated and provided to the patient. - It should be appreciated that the following embodiments described are exemplary and that other variations may be provided in other embodiments, It should be appreciated that one or more of the features described may be deleted, combined, etc., in other embodiments. Furthermore, while the following embodiments are described with respect to glucose, it should be appreciated that the concepts and principles apply to analytes in general, and that other analytes (e.g., ketone bodies) may apply in other embodiments.
-
FIG. 1 illustrates a flowchart of a method for analyte (e.g., glucose) monitoring management, according to one embodiment. Atblock 105, a communication link is established with an analyte (e.g., glucose) monitoring device. For instance, a patient may use the glucose monitoring device between visits to a physician, or other health care practitioner, to collect glucose measurement data, and then have the glucose monitoring device connect either wired or wireless with the computer of the physician during the next visit. - At
block 110, glucose measurement data is received. The glucose measurement data includes data that has been collected over a time period. Various time periods may be used, such as two weeks, one month, two months, or any other time period. For example, the time period may reflect the time between visits. In the example provided, the glucose monitoring device is connected to the physician's computer and glucose measurement data and the glucose measurement data is received by the physician's computer from the glucose monitoring device. - At
block 115, the glucose measurement data is analyzed for health related parameters. The health related parameter may be, for example, a risk of hypoglycemia or hyperglycemia, deviation of median glucose with respect to a target range, a degree of glucose variability, or any other parameter or indicator of health or area of concern thereof. The risk level identifies a level of risk of hypoglycemia based on the collected measurement data. The level of risk of hypoglycemia or hyperglycemia may be established in various manners-e.g., by looking to hypoglycemic or hyperglycemic episodes, such as the number, duration, timing, or other characteristics thereof. Deviations of median glucose may be categorized, for example, as above, below, or within a target range. The degree of glucose variability indicates how variable the glucose measurements are. - In one embodiment, the analyzing of the analyte measurement data for health related parameters includes analyzing the measurement data for analyte episodes within the collection time period. For instance, the episodes are derived according to the methods described later with respect to threshold-based episodes and rate-of-change based episodes.
- Based on the analysis of the glucose measurement data in
block 115, recommendations for creating modifying a treatment program are determined, as represented atblock 120. The recommendations modulate the health related parameters to improve one or more of the health related parameters. For example, the recommendations may relate to lowering glucose variability, adjusting median glucose to be close to the target range, reducing a risk of hypoglycemia, etc. The recommendations are optional and are not required to be implemented by the user. - In one embodiment, a database stores recommendations and corresponding conditions that are associated with or required by the recommendations. For example, a table may include predetermined conditions that are associated with one or more recommendations. Based on the conditions that exist, the appropriate recommendation may be determined. In some instances, the conditions and requirements may take into account attributes of the episodes themselves--e.g., type of episode, specific combinations of episodes present, number of episodes, relation to event or activities (e.g., meals, fasting periods, exercise, medication administration, times of day (e.g., morning, afternoon, night, sleeping periods, etc.), etc. Based on the resulting attributes of episodes found for the measurement data, the associated recommendations in the database will be selected.
- At
block 125, a user-interface is generated to enable the user (e.g., physician or other health care practitioner) to create or modify treatment. For example, the user interface may include a graphical user interface (GUI) generated for display on a display device and includes one or more application "screens" or "windows". - The generated user-interface provides the user with the necessary tool to modify or create a treatment program for the patient. However, the recommendations go further and guide the user in creating or modifying the treatment program such that the health related parameters may be modulated to improve the health related parameter. The previous discussion and examples for recommendations apply here as well.
- At
block 130, the glucose monitoring device is configured according to the created or modified treatment program. For example, the glucose monitoring device may be configured by programming the device with the created or modified reminder schedule. For instance, the reminder schedule may be transmitted to the to the glucose monitoring device from the physician's computer via the wired or wireless communication link. The configuration data may be stored in the glucose monitoring device and thereafter be implemented when the patient begins using the device again. - At
block 135, a report is generated. Various reports may be generated to provide the physician and/or patient with related information. For example, reports may be generated and then printed. Atblock 140, any patient education material is generated to be provided (e.g., printed or transferred to the glucose monitoring device) for viewing at a later time. - As summarized above, in some aspects of the present disclosure, methods for managing analyte measurement data are provided. The methods include receiving analyte measurement data that represent data collected over a time period, and analyzing the analyte measurement data for analyte episodes within that time period. The analyte episodes include at least one threshold based episode. The threshold based episode is based on measurements meeting an entrance threshold for entering the threshold based episode. Further, the threshold based episode requires at least one of: a minimum number of measurements meeting the entrance threshold; a minimum duration of time meeting the entrance threshold; and a minimum area for measurements meeting the entrance threshold. The methods also include storing the analyte episodes in memory. In some aspects of the present disclosure, articles of manufacture are provided that include a machine-readable medium having machine-executable instructions stored thereon for managing analyte measurement data according to the methods described above.
- In practical applications, analyte measurement data may provide problems for episode detection due to various factors. For example, gaps in measurement data (e.g., missing measurements) may present problems in determining if the gap exists in one episode or exists between two episodes. Furthermore, outliers or other brief measurement data points may provide problems by improperly crossing value thresholds (e.g., entrance thresholds or exit thresholds) and rate of change based thresholds. Noise may present similar issues.
- It should be appreciated that rate-of-change based thresholds refer to thresholds of rate-of-change (also referred to herein "rate thresholds" or "threshold rate"). The term "value thresholds' is used herein generally to distinguish the thresholds from thresholds for rate-of-changes. Such value thresholds may include, for example, entrance thresholds, exit thresholds, thresholds of duration (also referred to herein as "duration thresholds"), thresholds for minimum number of measurements, thresholds for minimum area, etc. Value thresholds may also be referred to herein simply as thresholds in some instances.
- In some aspects, methods are provided that resolve the above-mentioned issues and problems in episode detection. For example, these methods may be used to search glucose measurement values to detect extreme episodes of clinical interest. Therefore, the episode may be more clinically meaningful. In addition, the present disclosure specifies the properties of episodes that can be clinically meaningful. These properties can also be used to construct sequences or "chains" of episodes that have specific clinical meaning related to self-care behaviors.
- The core logic of episode analysis falls into two families: threshold based, and rate-of-change based thresholds. Looking for episodes in both directions, for example, suggests four basic episode types: low glucose / hypoglycemia (measurements below a threshold); high glucose / hyperglycemia (measurements above a threshold); glucose fall (rate-of-change more negative than a negative threshold rate); and glucose rise (rate-of-change more positive than a positive threshold rate). In one embodiment, a "within target" episode is defined to identify an episode where the measurements are maintained between an upper and lower bound for a period of time. Detection of these episodes can be done by extension of the threshold-based episode detection algorithms.
- Grouping all consecutive measurements (e.g., above or below) a threshold to form an episode creates issues and challenges in practical applications. For example, very brief episodes or outlier values may skew the identification of episodes by being improperly identified as an episode.
- In one embodiment, the methods for managing analyte measurement data described herein requires threshold based episodes to be based on measurements meeting an entrance threshold. Further, the threshold based episode requires one or more of the following: a minimum number of measurements meeting the entrance threshold; a minimum duration of time meeting the entrance threshold; and a minimum area for measurements meeting the entrance threshold. In one embodiment, all three criteria may be required. In one embodiment, all three are required to have an episode.
- It should be appreciated that "meeting" a threshold is used herein to mean that the threshold is triggered. It should be appreciated that "meeting a threshold" is used generally herein to refer to instances where a threshold is triggered by values "equal to" or "exceeding" the threshold; as well as to other instances where a threshold is triggered by values only "exceeding" the threshold. Furthermore, it should be appreciated that the phrase "exceeding a threshold" is used herein generally to refer to values that are beyond the threshold such that the threshold is triggered, whether the threshold is triggered by measurements above the threshold (e.g., hyperglycemic episodes) or below the threshold value (hypoglycemic episodes). This applies to both value based thresholds and rate-of-change thresholds. For example, if a measurement is greater than a threshold for hyperglycemia, then the threshold is exceeded and the threshold is met. Similarly, if a measurement is less than a threshold for hypoglycemia, then the threshold is exceeded and the threshold is met.
- Gaps in measurement data may also provide problems by significantly altering an episode duration. In one embodiment, a threshold based episode is defined based on a gap threshold such that a single episode is maintained at any gaps shorter than the gap threshold, and split into two separate potential episodes at any gaps meeting the gap threshold. The potential episodes are determined to be episodes if all other criteria are met.
- Noise may also present problems in defining episodes, especially when the true value is near a threshold. For example, noise may cause many episodes to be recorded when the true value is close to the threshold. In one embodiment, a threshold based episode is defined based on an exit threshold for exiting the episode, such that the at least one threshold based episode ends when measurements meet the exit threshold. In one embodiment, the exit threshold is a value "outside" the entrance threshold. The term "outside" is used here to mean that the exit threshold does not "equal" the entrance threshold or "exceed" the entrance threshold such that it would trigger the entrance threshold. Therefore, to exit an episode, measurements within the episode must first reach and pass the entrance threshold before eventually reaching the exit threshold. In this way, measurement will be "debounced" such that the episode is only terminated following a threshold crossing if the signal also crosses the exit threshold.
- Properties of threshold based episodes may be defined for clinical utility, including but not limited to: threshold value, most extreme value (magnitude of excursion past threshold), episode duration, or episode area. It should be appreciated that many other episode types may be provided, each of which, if independently clinically relevant, could form the basis for reports and analysis.
- The following is an example pseudocode implementation of a threshold-based episode detection algorithm, according to one embodiment:

-
FIG. 2A illustrates a flowchart for a method of managing analyte measurement data, according to one embodiment. As shown atblock 205, analyte (e.g., glucose) measurement data is received by a data processing device, such as a glucose monitoring device, personal computer, a portable computer including a laptop or a handheld device (e.g., a personal digital assistant (PDA), a telephone including a cellular phone (e.g., a multimedia and Internet-enabled mobile phone including an iPhone™, a Blackberry®, or similar phone), etc. The analyte measurement data represents analyte measurements collected over a period of time. Various time periods may be used, such as two weeks, one month, two months, or any other time period. For example, the time period may reflect the time between visits. The data processing device may receive the analyte measurement data from a glucose monitoring device or other device-e.g., another personal computer, portable computer, handheld device, or memory storage device, such as Flash memory stick, CD-ROM, etc. - At
block 210, the analyte measurement data is analyzed for analyte episodes that are threshold based episodes. The threshold based episode is based on measurements meeting an entrance threshold for entering the episode. Furthermore, the threshold based episode requires at least one of: a minimum number of measurements meeting the entrance threshold; a minimum duration of time meeting the entrance threshold; and a minimum area for measurements meeting the entrance threshold. As later discussed and illustrated inFIG. 4 , the area associated with the measurements meeting the entrance threshold is defined as the area on a glucose versus time plot of measurement that is between the measurements meeting the entrance threshold and the entrance threshold itself. Atblock 215, any threshold based episodes are stored in memory for further data management. -
FIG. 2B illustrates a flowchart for a method of managing analyte measurement data wherein the analyte measurement data is analyzed for analyte episodes that are rate of change based episodes. This is discussed in further detail later in the section for rate-of-change based episodes. In other embodiments, methods of managing analyte measurement data may include analyzing the measurement data for both threshold based episodes and rate-of-change based episodes. -
FIG. 3 illustrates a flowchart of a method for managing analyte (e.g., glucose) measurements that includes analyzing for threshold based episodes, according to one embodiment. The glucose measurement data is received and analyzed for threshold based episodes. The analysis may begin, for example, at the earliest measurement and continued through till the latest measurement. - Beginning at
block 305, the previous glucose measurement value is set to "not in an episode" at the start of the analysis. At block 310, the "newest" or next glucose value (measurement) in time-ordered series is selected for analysis. If the next glucose value is the last value of the glucose measurement data, then the process is ended, as shown byblock 315. If the next glucose value is not the last measurement, then the state of that glucose measurement is checked, as shown inblock 320. If it is determined that the next glucose value is between thresholds, then the next glucose value in time-ordered series is selected at block 310. "Between episodes" refers to the being between the entrance threshold and exit threshold. - If it is determined that the measurement is not in episode, then the state of the previous glucose value is checked, as shown in
block 325. Then it is determined if the previous measurements is in episode or between thresholds. For example, in the embodiment shown, atblock 330, the episode requires: 1) minimum number of measurements meeting the entrance threshold; 2) a minimum duration of time meeting the entrance threshold; and 3) a minimum area for measurements meeting the entrance threshold (e.g., the area under or above the glucose v. time curve relative to entrance threshold for a hypoglycemic or hyperglycemic episode, respectively). Since all three criteria are required in this embodiment, if any one of the criteria is not met, then as shown atblock 335, an episode does not exist and is not added to the search results (e.g., not stored in memory and used for further glucose measurement management). If all three criteria are met, as shown in block 340, then the episode exists and is added to the list of episodes (e.g., stored in memory and used for further glucose measurement management). The state of the previous glucose value is then set to "not in episode" so that episodes found in the subsequent data are analyzed independently of the previously identified episode. - Returning to block 320, if the next glucose value is determine to be in an episode, then the gap to the previous point is checked against a predetermined gap threshold, as shown in
block 345. If the gap to the previous point is smaller than the gap threshold, then the state of the previous glucose value is checked, as shown inblock 350. If it determined that the previous glucose value is in episode or between thresholds, then the state of the previous glucose value is continued in episode, as shown atblock 355. Further atblock 355, various properties, such as end time, point count and "exposure" or area are stored. Then a next glucose value in time-ordered series is selected, as shown at block 310. If it is determined atblock 350 that the previous glucose value is not in episode, then the previous glucose value is set to in episode, and properties such as start time, point count and exposure (area) are stored, as shown inblock 360. Then the next glucose value in time-ordered series is selected, as shown in block 310. - Returning to block 345, if the gap to the previous point meets the gap threshold (e.g., is larger than the gap threshold, or in other embodiments is equal to or larger), then it is determined at
block 365 if the three criteria are met for the episode: 1) minimum number of measurements meeting the entrance threshold (e.g., minimum number of measurement readings after the entrance threshold was crossed); 2) a minimum duration of time meeting the entrance threshold; and 3) a minimum area for measurements meeting the entrance threshold (e.g., the area under or above the glucose v. time curve relative to entrance threshold). If any one of the criteria is not met, then as shown atblock 370, the episode does not exist and is not added to the search results (e.g., stored in memory and used for further glucose measurement management). If all three criteria are met, as shown inblock 375, then the episode exists and is added to the list of episodes (e.g., stored in memory and used for further glucose measurement management). The state of the previous glucose value is then set to "not in episode". - After
blocks block 360. Then the next glucose value in time-ordered series is selected, as shown in block 310. -
FIG. 4 illustrates a hypoglycemic episode for a set of glucose measurement data, according to one embodiment. As shown,glucose measurements 405 are plotted on a chart of glucose versus time. Theentrance threshold 410 is shown for a hypoglycemia event. In this hypoglycemic example, the measurements that meet the entrance threshold are measurements that reach or exceed the entrance threshold by going below the entrance threshold (e.g., are smaller in value). As shown,measurement 405A is above the entrance threshold and thus not meeting the initial threshold for entering a hypoglycemic episode.Measurement 405B is the next measurement and "exceeds" theentrance threshold 410 for entering the hypoglycemic episode, and thus meets the entrance threshold. The next fourmeasurements 405E are below theexit threshold 415. Measurement 405C is above theexit threshold 415 and thus "'exceeds" and meets theexit threshold 415. In the embodiment shown, the three criteria are met for an episode: 1) minimum number of measurements outside the entrance threshold (e.g., the minimum number of measurements may be three measurements); 2) a minimum duration of time outside the entrance threshold (e.g., the minimum duration of time may be 20 minutes); and 3) a minimum area outside the entrance threshold (e.g., the area between the entrance threshold and the measurements that meet the entrance threshold). - Therefore,
measurement 405A and 405C are the start and end of the episode, respectively, and theduration 420 of the episode spanning the time between the two. Therefore, theepisode duration 420 is shown with thepre-event window 425 prior andpost-event window 430 thereafter.Measurement 405D represents the lowest measurement in the episode. -
FIG. 5 illustrates a hyperglycemic episode for a set of glucose measurement data, according to one embodiment. As shown,glucose measurements 505 are plotted on a chart of glucose versus time. Theentrance threshold 510 is shown for a hyperglycemia event. As shown,measurement 505A has not reached or exceeded (e.g., is below) the entrance threshold and thus not meeting the initial threshold requirement of entering a hyperglycemic episode.Measurement 405B is the next measurement and theentrance threshold 510 is met (e.g., reached or exceeded), and thus the first requirement of entering a hyperglycemic episode is met. Each consecutive measurement thereafter does not cross theexit threshold 515 untilmeasurement 505E. However, thenext measurement 505F returns back above the exit threshold and due to the duration threshold requirement, the measurements did not stay past the exit threshold for a required duration threshold (e.g., assuming an example duration threshold of 20 minutes). Thus the episode continues and does not end.Measurement 505C crosses the exit threshold and the next 3 measurements stay past the exit threshold (e.g., stay past the exit threshold for 30 minutes, which is longer than the example duration threshold of 20 minutes), thus meeting the duration threshold requirement. Therefore, the episode begins atmeasurement 505B and ends atmeasurement 505C. - The
episode duration 520 is shown with thepre-event window 525 prior andpost-event window 530 thereafter. The episode includes amaximum measurement 505D in the episode. - As summarized above, in some aspects of the present disclosure, methods for managing analyte measurement data are provided. The methods include receiving analyte measurement data that represent data collected over a time period, and analyzing the analyte measurement data for analyte episodes within that time period. The analyte episodes include at least one rate-of-change based episode. The rate-of-change based episode requires a core of the episode to meet a threshold rate for a duration threshold. The methods also include storing the analyte episodes in memory. In some aspects of the present disclosure, articles of manufacture are provided that include a machine-readable medium having machine-executable instructions stored thereon for managing analyte measurement data according to the methods described above.
- Grouping all consecutive monotonically increasing/decreasing points to form an episode creates issues and challenges in practical applications. For instance, small changes in magnitude may not be meaningful. Furthermore, signal variation may also present issues and problems by exaggerating the rate of change of very brief episodes. In one embodiment, the rate-of-change based episode requires a core of the episode to meet a threshold rate. The core is formed by two points having a threshold core rate-of-change for a duration threshold. Local extrema may then be scanned outward from the core to potentially define the episode.
- Gaps in the measurement data can also significantly alter the episode durations. In one embodiment, a rate-of-change based episode is defined based on a gap threshold such that a single episode at any gaps shorter than the gap threshold, and split into two separate potential episodes at any gaps meeting the gap threshold. All of the points before the gap are considered a potentially complete episode with the last point being the point preceding the gap. All the points after the gap form the start of a potentially new episode. Again, the potential episodes are determined to be episodes if all other episode criteria are met.
- Noise presents issues and problems by breaking the monotonicity of the change during periods of relatively slow change. In one embodiment, the rate-of-change based episode is defined based on a distance threshold between episodes such that two episodes within the distance threshold of each other are merged into a single episode. thus, episodes that are close together are merged into a single episode, resulting in a newly defined episode containing all of the points between the first point of the first episode and the last point of the second episode.
- In some instances, episodes merged in this way could have intermediate extreme points outside of the end values. In one embodiment, the single episode of the merger has intermediate extreme points outside of end values of the single episode, and wherein the single episode is then redefined beginning and ending at the intermediate extreme points. Episodes redefined in this way could include spikes caused by two closely spaced points where one of which is an outlier. The criteria requiring a duration threshold may be implemented in other embodiments to alleviate such issue.
- Properties of change episodes, as so defined, can be defined, including but not limited to: maximum rate, delta (highest-lowest values), lowest value, and highest value. This provides a virtually limitless catalog of episode types, each of which, if independently clinically relevant, could form the basis for reports and analysis.
- The following is an example pseudocode implementation of a rate-of-change based episode detection algorithm, according to one embodiment:

- As stated above,
FIG. 2B illustrates a flowchart of a method for managing analyte (e.g., glucose) measurements that includes analyzing for rate-of-change based episodes. As shown atblock 250, similar to block 205 inFIG. 2A , analyte (e.g., glucose) measurement data is received. Atblock 255, however, the analyte measurement data is analyzed for analyte episodes that are rate of change based episodes. The rate of change based episode requires a core of the episode to meet a threshold rate. The core is formed by two points having a threshold rate-of-change for a threshold duration of time (duration threshold). Atblock 260, any threshold based episodes are stored in memory for further data management. -
FIG. 6 illustrates a flowchart of a method for managing analyte (e.g., glucose) measurements, according to one embodiment. The glucose measurement data is received and analyzed for rate-of-change based episodes. The analysis may begin, for example, at the earliest measurement and continued through till the latest measurement. - At
block 605, for each point in the data set, a first value (measurement) is identified. Atblock 610, each point after the first value, referred to here as the next value, is identified and the distance between the next value and the first point is determined and compared to a gap threshold (e.g., a maximum gap), as shown inblock 615. If the distance is not greater than the gap threshold, then it is determined if the rate of change between the first value and the next exceeds the minimum threshold rate, as represented atblock 620. If it does not meet the threshold rate (e.g., does not exceed the threshold rate), then another 'next value' is selected (e.g., the next measurement in time-ordered series) for analysis, as shown byblock 610. - If at
block 615, the distance is greater than the gap threshold, then it is determined if the last episode is longer than a duration threshold, as shown byblock 625. If it is not longer than the duration threshold, then the first value is set to the next value, to prevent reanalyzing the same points on the next pass, as represented byblock 630 and arrow returning to block 605. If the last episode is longer than the duration threshold, then an episode is identified and stored in the episode list (e.g., in memory), as shown inblock 635. Then the first value is set to the next value, to prevent reanalyzing the same points on the next pass, as represented byblock 630 and arrow returning to block 605. - Returning to block 620, if the rate of change between the first value and the next value exceeds the minimum, then local extrema (e.g., first point and last point) are determined by scanning back form the first value and forward from the next value, as shown at
block 640. Then the minimum and maximum (e.g., highest value and lowest value) are determined by scanning from the first point to the last point, as shown byblock 645. The starting value and ending value are set to the highest value and the lowest value (or vice versa). - Then it is determined if the difference between the ending value of the previous episode and the starting value is less than a predetermined acceptable minimum (e.g., a distance threshold between the two episodes). If so, then the two episodes are combined, as shown by
block 655. The first point is equal to the starting value of the last episode, and the last point is the ending value of this episode. The previous episode is eliminated. Then to block 645, where the minimum and maximum (e.g., highest value and lowest value) are determined by scanning from the first point to the last point. The starting value and ending value are set to the highest value and the lowest value (or vice versa). - If at
block 650, the difference between the ending value of the previous episode and the starting value is not less than a predetermined acceptable minimum, then this episode is stored as the last episode for the next pass, as shown byblock 660. Then again back to block 625 where it is determined if the last episode is longer than a duration threshold. -
FIG. 7 illustrates an example of a detection of a glucose rise episode in a set of glucose measurement data, according to one embodiment. As shownglucose measurement data 705 is plotted on a chart of glucose versus time. Starting with the earliest measurements on the left, each measurement is compared with future measurements to determine if a predetermined rate threshold is met (e.g., reached or exceeded). For example, in the example shown,measurement 705A and prior measurements to the left, do not have any future measurements that create a rate-of-change above a predetermined threshold rate. However, measurement 705B andfuture measurement 705F embody a rate-of-change above the predetermined threshold rate. For example, the top oftrigger window 710 represents the predetermined threshold rate and is shown for measurement 705B. As shown,measurement 705F is above the top oftrigger window 710, and thus possesses a rate-of-change greater than the predetermined rate threshold of thetrigger window 710. A core is thus defined from measurement 705B as the trigger start point tomeasurement 705F as the trigger end point. Note that for all the measurements prior to measurement 705B, no future measurements exist that would fall above the top of similarly drawn trigger windows (not shown) which align with the corresponding measurement being analyzed. - Local extrema are then scanned for outside the core. For example, scanning from measurement 705B to the left, a minimum point is scanned for. Measurement 705C is determined to be the minimum and thus the episode start point. Similarly, scanning from
measurement 705F to the right, a maximum point is scanned for.Measurement 705G is determined to be the maximum and thus the episode end point. Note that the episode includes a minimum and maximum point for the episode itself, which may or may not be the same as the local extrema searched for. In this case, theminimum measurement 705H is the episode's minimum whilemeasurement 705G is the episode's maximum. Theepisode duration 720 is shown with thepre-event window 725 prior andpost-event window 730 thereafter. The process may then be repeated for later measurements past the episode to find additional rate-of-change based episodes within the measurement data. -
FIG. 8 illustrates an example of a detection of a glucose fall episode in a set of glucose measurement data, according to one embodiment. As shownglucose measurement data 805 is plotted on a chart of glucose versus time. Starting with the earliest measurements on the left, each measurement is compared with future measurements to determine if a predetermined rate threshold is met (e.g., reached or exceeded). For example, in the example shown, measurement 805A and prior measurements to the left, do not have any future measurements that create a rate-of-change above a predetermined threshold rate. However, measurement 805B andfuture measurement 805F possess a rate-of-change exceeding the predetermined threshold rate. For example, the bottom oftrigger window 810 represents the predetermined threshold rate and is shown for measurement 805B. As shown,measurement 805F is below the bottom oftrigger window 810, and thus possesses a rate-of-change exceeding than the predetermined rate threshold of thetrigger window 810. A core is thus defined from measurement 805B as the trigger start point tomeasurement 805F as the trigger end point. Note that for all the measurements prior to measurement 805B, no future measurements exist that would fall below the bottom of similarly drawn trigger windows (not shown) which align with the corresponding measurement being analyzed. - Local extrema are then scanned for outside the core. For example, scanning from measurement 805B to the left, a maximum point is scanned for. Measurement 805B is determined to be the minimum and thus the episode start point. Similarly, scanning from
measurement 805F to the right, a minimum point is scanned for.Measurement 805G is determined to be the minimum and thus the episode end point. Note that the episode includes a minimum and maximum point for the episode itself, which may or may not be the same as the local extrema searched for. In this case, theminimum measurement 805G is the episode's minimum whilemeasurement 805H is the episode's maximum. Theepisode duration 820 is shown with thepre-event window 825 prior andpost-event window 830 thereafter. The process may then be repeated for later measurements past the episode to find additional rate-of-change based episodes within the measurement data. -
FIG. 9 illustrates a data processing device that may perform the methods described herein, according to one embodiment. Thedata processing device 900 is shown includingprocessor 910,communication unit 923,memory 915,display unit 921 and input/output 920. The data processing device may communicate, either wired or wireless, with other devices, such as amedication delivery device 905,portable processing device 906,computer 907, or ananalyte monitoring device 910. The data processing device may also be coupled tonetworks 908 and/or theinternet 909. The analyte monitoring device and/orsystem 910 may, for example, provide for discrete monitoring of one or more analytes using an in vitro blood glucose ("BG") meter and an analyte test strip. In other embodiments, the glucose monitoring device may provide for continuous, periodic, and/or intermittent in vivo monitoring of the level of one or more analytes. For instance, such a system may include, for example, an analyte sensor at least a portion of which is to be positioned beneath a skin surface of a user for a period of time. - In one embodiment,
data processing device 900 may be a computer of a physician or HCP that connects toglucose monitoring device 910 of a patient. Thecomputer 900 may then communicate data to and fromother computers 907 and theinternet 909. In another embodiment, thedata processing device 900 may be a handheld device, such as a cellular phone or hand-held computer, that connects with theglucose monitoring device 910 of a patient. Thedevice 900 may then communicate data to and from apersonal computers 907, for example, via a direct wired or wireless connection, or via theinternet 909. - In one embodiment, instructions for performing the methods described herein may be stored in
memory unit 915 and executed byprocessor 910. Thecommunication unit 923 may be used to establish a communication link between theanalyte monitoring device 910 and thedata processing device 900.Display unit 921 and input/output 920 may be used to provide the user interface and receive user input. Input/output 920 may also be used to connect to a printer to print reports. - Each of the various references, presentations, publications, provisional and/or non-provisional U.S. Patent Applications, U.S. Patents, non-U.S. Patent Applications, and/or non-U.S. Patents that have been identified herein, is incorporated herein by reference in its entirety.
- Other embodiments and modifications within the scope of the present disclosure will be apparent to those skilled in the relevant art. Various modifications, processes, as well as numerous structures to which the embodiments of the present disclosure may be applicable will be readily apparent to those of skill in the art to which the present disclosure is directed upon review of the specification. Various aspects and features of the present disclosure may have been explained or described in relation to understandings, beliefs, theories, underlying assumptions, and/or working or prophetic examples, although it will be understood that the present disclosure is not bound to any particular understanding, belief, theory, underlying assumption, and/or working or prophetic example. Although various aspects and features of the present disclosure may have been described largely with respect to applications, or more specifically, medical applications, involving diabetic humans, it will be understood that such aspects and features also relate to any of a variety of applications involving non-diabetic humans and any and all other animals. Further, although various aspects and features of the present disclosure may have been described largely with respect to applications involving partially implanted sensors, such as transcutaneous or subcutaneous sensors, it will be understood that such aspects and features also relate to any of a variety of sensors that are suitable for use in connection with the body of an animal or a human, such as those suitable for use as fully implanted in the body of an animal or a human. Finally, although the various aspects and features of the present disclosure have been described with respect to various embodiments and specific examples herein, all of which may be made or carried out conventionally, it will be understood that the invention is entitled to protection within the full scope of the appended claims.
- It should be understood that techniques introduced above can be implemented by programmable circuitry programmed or configured by software and/or firmware, or they can be implemented entirely by special-purpose "hardwired" circuitry, or in a combination of such forms. Such special-purpose circuitry (if any) can be in the form of, for example, one or more application-specific integrated circuits (ASICS), programmable logic devices (PLDs), field programmable gate arrays (FPGAs), etc.
- Software or firmware implementing the techniques introduced herein may be stored on a machine-readable storage medium and may be executed by one or more general-purpose or special-purpose programmable microprocessors. A "machine-readable medium", as the term is used herein, includes any mechanism that can store information in a form accessible by a machine (a machine may be, for example, a computer, network device, cellular phone, personal digital assistant (PDA), manufacturing took, any device with one or more processors, etc.). For example, a machine-accessible medium includes recordable/non-recordable media (e.g., read only memory (ROM); random access memory (RAM); magnetic disk storage media; optical storage media; flash memory devices; etc.), etc.
- The following examples are put forth so as to provide those of ordinary skill in the art with a complete disclosure and description of how to make and use the embodiments of the invention, and are not intended to limit the scope of what the inventors regard as their invention nor are they intended to represent that the experiments below are all or the only experiments performed. Efforts have been made to ensure accuracy with respect to numbers used (e.g., amounts, temperature, etc.) but some experimental errors and deviations should be accounted for. Unless indicated otherwise, parts are parts by weight, molecular weight is weight average molecular weight, temperature is in degrees Centigrade, and pressure is at or near atmospheric.
-
-
Clause 1. A method for analyte monitoring management, comprising: receiving analyte measurement data, the analyte measurement data representing analyte measurement data collected over a time period; analyzing the analyte measurement data for health related parameters; determining recommendations for creating or modifying a treatment program based on the analysis, wherein the recommendations modulate the health related parameters to improve one or more of the health related parameters; generating a user-interface to enable a user to create or modify the treatment program; wherein the user-interface provides the recommendations to guide the user in creating or modifying the treatment program, wherein the recommendations are optional and not required to be implemented; and configuring an analyte monitoring device according to the created or modified treatment program. -
Clause 2. The method ofclause 1, wherein the user-interface enables the user to set reminder schedules for performing a blood analyte measurement, and wherein the configuring of the analyte monitoring device comprises programming the analyte monitoring device with the reminder schedule. -
Clause 3. The method of any of the preceding clauses, comprising generating a report summarizing data related to the created or modified treatment program. -
Clause 4. The method of any of the preceding clauses, comprising generating patient education material. -
Clause 5. The method of any of the preceding clauses, comprising establishing a communication link with the analyte monitoring device, wherein the analyte measurement data is received via the communication link. -
Clause 6. The method of any of the preceding clauses, wherein the recommendations comprise a recommendation for creating or modifying medication parameters of the treatment program. -
Clause 7. The method ofclause 6, wherein the recommendation for creating or modifying the medication parameters are provided for different time periods including meal periods or fasting periods. -
Clause 8. The method ofclause -
Clause 9. The method of any of the preceding clauses, wherein the user interface comprises a screen including a summary of the health related parameter from the analysis. -
Clause 10. The method of any of the preceding clauses, wherein the health related parameters comprise a risk of hypoglycemia or hyperglycemia. -
Clause 11. The method of any of the preceding clauses, wherein the health related parameters comprise a deviation of median glucose with respect to a target range. -
Clause 12. The method of any of the preceding clauses, wherein the health related parameters comprise a degree of glucose variability. - Clause 13. The method of any of the preceding clauses, wherein the user-interface provides education or reference material.
-
Clause 14. The method of any of the preceding clauses, wherein the analyte is glucose or a ketone body. - Clause 15. The method of any of the preceding clauses, wherein the analyzing the analyte measurement data for health related parameters comprises analyzing the analyte measurement data for analyte episodes within the time period; wherein the analyte episodes comprise at least one threshold based episode; wherein the at least one threshold based episode is based on measurements meeting a threshold value for entering the at least one threshold based episode, and wherein the at least one threshold based episode requires at least one of: a minimum number of measurements meeting the entrance threshold; a minimum duration of time meeting the entrance threshold; and a minimum area for measurements meeting the entrance threshold.
- Clause 16. The method of any of the preceding clauses, wherein the analyzing the analyte measurement data for health related parameters comprises analyzing the analyte measurement data for analyte episodes within the time period; wherein the analyte episodes comprise at least one rate-of-change based episode; wherein the at least one rate-of-change based episode requires a core of the episode to meet a threshold rate for a duration threshold.
- Clause 17. An article of manufacture comprising: a machine-readable medium having machine-executable instructions stored thereon for analyte monitoring management, the instructions comprising: instructions for receiving analyte measurement data, the analyte measurement data representing analyte measurement data collected over a time period; instructions for analyzing the analyte measurement data for health related parameters; instructions for determining recommendations for creating or modifying a treatment program based on the analysis, wherein the recommendations modulate the health related parameters to improve one or more of the health related parameters; instructions for generating a user-interface to enable a user to create or modify the treatment program; wherein the user-interface provides the recommendations to guide the user in creating or modifying the treatment program, wherein the recommendations are optional and not required to be implemented; and instructions for configuring an analyte monitoring device according to the created or modified treatment program. Clause 18. The article of manufacture of clause 17, wherein the user-interface enables the user to set reminder schedules for performing a blood analyte measurement, and wherein the configuring of the analyte monitoring device comprises programming the analyte monitoring device with the reminder schedule.
- Clause 19. The article of manufacture of any of clauses 17-18, wherein the instructions comprise generating a report summarizing data related to the created or modified treatment program.
-
Clause 20. The article of manufacture of any of clauses 17-19, wherein the instructions comprise generating patient education material. - Clause 21. The article of manufacture of any of clauses 17-20, wherein the instructions comprise establishing a communication link with the analyte monitoring device, wherein the analyte measurement data is received via the communication link.
Clause 22. The article of manufacture of any of clauses 17-21 wherein the recommendations comprise a recommendation for creating or modifying medication parameters of the treatment program. - Clause 23. The article of manufacture of
clause 22, wherein the recommendation for creating or modifying the medication parameters are provided for different time periods including meal periods or fasting periods. - Clause 24. The article of manufacture of
clauses 22 or 23, wherein the medication is insulin. -
Clause 25. The article of manufacture of any of clauses 17-24, wherein the user interface comprises a screen including a summary of the health related parameter from the analysis. - Clause 26. The article of manufacture of any of clauses 17-25, wherein the health related parameters comprise a risk of hypoglycemia or hyperglycemia.
- Clause 27. The article of manufacture of any of clauses 17-26, wherein the health related parameters comprise a deviation of median glucose with respect to a target range.
-
Clause 28. The article of manufacture of any of clauses 17-27 wherein the health related parameters comprise a degree of glucose variability. - Clause 29. The article of manufacture of any of clauses 17-28, wherein the user-interface provides education or reference material.
-
Clause 30. The article of manufacture of any of clauses 17-29, wherein the analyte is glucose or a ketone body. - Clause 31. The article of manufacture of any of clauses 17-30, wherein the analyzing the analyte measurement data for health related parameters comprises analyzing the analyte measurement data for analyte episodes within the time period; wherein the analyte episodes comprise at least one threshold based episode; wherein the at least one threshold based episode is based on measurements meeting a threshold value for entering the at least one threshold based episode, and wherein the at least one threshold based episode requires at least one of: a minimum number of measurements meeting the entrance threshold; a minimum duration of time meeting the entrance threshold; and a minimum area for measurements meeting the entrance threshold.
- Clause 32. The article of manufacture of any of clauses 17-31, wherein the analyzing the analyte measurement data for health related parameters comprises analyzing the analyte measurement data for analyte episodes within the time period; wherein the analyte episodes comprise at least one rate-of-change based episode; wherein the at least one rate-of-change based episode requires a core of the episode to meet a threshold rate for a duration threshold.
- Clause 33. A method of managing analyte measurement data, comprising: receiving analyte measurement data, the analyte measurement data representing analyte measurement data collected over a time period; analyzing the analyte measurement data for analyte episodes within the time period; wherein the analyte episodes comprise at least one threshold based episode; wherein the at least one threshold based episode is based on measurements meeting an entrance threshold for entering the at least one threshold based episode, and wherein the at least one threshold based episode requires at least one of: a minimum number of measurements meeting the entrance threshold; a minimum duration of time meeting the entrance threshold; and a minimum area for measurements meeting the entrance threshold; and storing the analyte episodes in memory.
- Clause 34. The method of clause 33, wherein the at least one threshold based episode requires each of: a minimum number of measurements outside the entrance threshold, a minimum duration of time outside the entrance threshold, and a minimum area outside the entrance threshold.
-
Clause 35. The method of any of clauses any of 33-34, wherein the at least one threshold based episode is defined based on a gap threshold such that a single episode is maintained at any gaps shorter than the gap threshold, and split into two separate potential episodes at any gaps meeting the gap threshold. - Clause 36. The method of any of clauses any of 33-35, wherein at least one threshold based episode is defined based on an exit threshold such that the at least one threshold based episode ends when measurements meet the exit threshold, and wherein the exit threshold is a value outside of the entrance threshold.
- Clause 37. The method of any of clauses any of 33-36, wherein the analyte episodes comprise at least one rate-of-change based episode; wherein the at least one rate-of-change based episode requires a core of the episode to meet a threshold rate for a duration threshold.
- Clause 38. The method of clause 37, wherein the at least one rate-of-change based episode is defined based on a gap threshold such that a single episode at any gaps shorter than the gap threshold, and split into two separate potential episodes at any gaps meeting the gap threshold.
- Clause 39. The method of clause 37, wherein at least one rate-of-change based episode is defined based on a distance threshold between episodes such that two episodes within the distance threshold of each other are merged into a single episode.
- Clause 40. The method of clause 38 or 39, wherein the single episode of the merger has intermediate extreme points outside of end values of the single episode, and wherein the single episode is then redefined beginning and ending at the intermediate extreme points.
- Clause 41. The method of any of clauses 33-40, wherein the analyte is glucose or a ketone body.
- Clause 42. An article of manufacture comprising: a machine-readable medium having machine-executable instructions stored thereon for analyte monitoring management, the instructions comprising: instructions for receiving analyte measurement data, the analyte measurement data representing analyte measurement data collected over a time period; instructions for analyzing the analyte measurement data for analyte episodes within the time period; wherein the analyte episodes comprise at least one threshold based episode; wherein the at least one threshold based episode is based on measurements meeting an entrance threshold for entering the at least one threshold based episode, and wherein the at least one threshold based episode requires at least one of: a minimum number of measurements meeting the entrance threshold; a minimum duration of time meeting the entrance threshold; and a minimum area for measurements meeting the entrance threshold; and instructions for storing the analyte episodes in memory.
- Clause 43. The article of manufacture of clause 42, wherein the at least one threshold based episode requires each of: a minimum number of measurements outside the entrance threshold, a minimum duration of time outside the entrance threshold, and a minimum area outside the entrance threshold.
- Clause 44. The article of manufacture of any of clauses 42-43, wherein the at least one threshold based episode is defined based on a gap threshold such that a single episode is maintained at any gaps shorter than the gap threshold, and split into two separate potential episodes at any gaps meeting the gap threshold.
- Clause 45. The article of manufacture of any of clauses 42-44, wherein at least one threshold based episode is defined based on an exit threshold such that the at least one threshold based episode ends when measurements meet the exit threshold, and wherein the exit threshold is a value outside of the entrance threshold.
- Clause 46. The article of manufacture of any of clauses 42-45, wherein the analyte episodes comprise at least one rate-of-change based episode; wherein the at least one rate-of-change based episode requires a core of the episode to meet a threshold rate for a duration threshold.
- Clause 47. The article of manufacture of clause 46, wherein the at least one rate-of-change based episode is defined based on a gap threshold such that a single episode is maintained at any gaps shorter than the gap threshold, and split into two separate potential episodes at any gaps meeting the gap threshold.
- Clause 48. The article of manufacture of clause 46, wherein at least one rate-of-change based episode is defined based on a distance threshold between episodes such that two episodes within the distance threshold of each other are merged into a single episode.
- Clause 49. The article of manufacture of clause 47 or 48, wherein the single episode of the merger has intermediate extreme points outside of end values of the single episode, and wherein the single episode is then redefined beginning and ending at the intermediate extreme points.
-
Clause 50. The article of manufacture of any clauses 42-49, wherein the analyte is glucose or a ketone body. - Clause 51. A method of managing analyte measurement data, comprising: receiving analyte measurement data, the analyte measurement data representing analyte measurement data collected over a time period; analyzing the analyte measurement data for analyte episodes within the time period; wherein the analyte episodes comprise at least one rate-of-change based episode; wherein the at least one rate-of-change based episode requires a core of the episode to meet a threshold rate for a duration threshold; and storing the analyte episodes in memory.
- Clause 52. The method of clause 51, wherein the at least one rate-of-change based episode is defined based on a gap threshold such that a single episode at any gaps shorter than the gap threshold, and split into two separate potential episodes at any gaps meeting the gap threshold.
- Clause 53. The method of 51, wherein at least one rate-of-change based episode is defined based on a distance threshold between episodes such that two episodes within the distance threshold of each other are merged into a single episode.
- Clause 54. The method of clause 52 or 53, wherein the single episode of the merger has intermediate extreme points outside of end values of the single episode, and wherein the single episode is then redefined beginning and ending at the intermediate extreme points.
- Clause 55. The method of any of clauses 51-54, wherein the analyte is glucose or a ketone body.
- Clause 56. An article of manufacture comprising: a machine-readable medium having machine-executable instructions stored thereon for analyte monitoring management, the instructions comprising: instructions for receiving analyte measurement data, the analyte measurement data representing analyte measurement data collected over a time period; instructions for analyzing the analyte measurement data for analyte episodes within the time period; wherein the analyte episodes comprise at least one rate-of-change based episode; wherein the at least one rate-of-change based episode requires a core of the episode to meet a threshold rate for a duration threshold; and instructions for storing the analyte episodes in memory.
- Clause 57. The article of manufacture of clause 56, wherein the at least one rate-of-change based episode is defined based on a gap threshold such that a single episode at any gaps shorter than the gap threshold, and split into two separate potential episodes at any gaps meeting the gap threshold.
- Clause 58. The article of manufacture of clause 56, wherein at least one rate-of-change based episode is defined based on a distance threshold between episodes such that two episodes within the distance threshold of each other are merged into a single episode.
- Clause 59. The article of manufacture of clause 57 or 58, wherein the single episode of the merger has intermediate extreme points outside of end values of the single episode, and wherein the single episode is then redefined beginning and ending at the intermediate extreme points.
-
Clause 60. The article of manufacture of any of clauses 56-59, wherein the analyte is glucose.
Claims (5)
- An article of manufacture comprising:a machine-readable medium having machine-executable instructions stored thereon for analyte monitoring management, the instructions comprising:instructions for receiving analyte measurement data (110, 205, 250), the analyte measurement data representing analyte measurement data (705, 805) collected over a time period;instructions for analyzing the analyte measurement data (115, 210, 255) for analyte episodes (705C-705G, 805B-805G) within the time period;wherein the analyte episodes comprise at least one rate-of-change based episode; the rate of change being the rate of change of the analyte value over time;wherein the at least one rate-of-change based episode includes two points having a threshold rate-of-change for a duration threshold, andinstructions for splitting a rate-of-change based episode into two episodes when the rate-of-change based episode includes a gap in the analyte measurement data that is shorter than a gap threshold; andinstructions for storing the analyte episodes in a memory (215, 260).
- A computer-implemented method for analyte monitoring management, comprising:receiving analyte measurement data (110, 205, 250), the analyte measurement data representing analyte measurement data collected over a time period;analyzing the analyte measurement data (115,210, 255) for analyte episodes within the time period;wherein the analyte episodes comprise at least one rate-of-change based episode; the rate of change being the rate of change of the analyte value over time;wherein the at least one rate-of-change based episode extends between two points having a threshold rate-of-change for a duration threshold, and wherein the at least one rate-of-change based episode is defined based on a gap threshold between episodes such that a single episode that includes a gap in the analyte measurement data that is shorter than the gap threshold is split into two episodes;splitting the at least one rate-of-change based episode into two episodes when the at least one rate-of-change based episode includes a gap in the analyte measurement data that is shorter than a gap threshold; andstoring the analyte episodes in a memory (215, 260).
- The article of manufacture of claim 1, wherein the instructions further comprise instructions for establishing a communication link with an analyte monitoring device (105), wherein the analyte measurement data is received via the communication link (110, 205, 250).
- The computer-implemented method of claim 2, comprising establishing a communication link with an analyte monitoring device (105), wherein the analyte measurement data is received via the communication link (110, 205, 250).
- The article of manufacture of any of claims 1 or 3, or the computer-implemented method of any of claims 2 or 4, wherein the analyte is glucose or a ketone body.
Applications Claiming Priority (3)
| Application Number | Priority Date | Filing Date | Title |
|---|---|---|---|
| US201161540332P | 2011-09-28 | 2011-09-28 | |
| PCT/US2012/057608 WO2013049381A1 (en) | 2011-09-28 | 2012-09-27 | Methods for analyte monitoring management and analyte measurement data management, and articles of manufacture related thereto |
| EP12836194.6A EP2760335B1 (en) | 2011-09-28 | 2012-09-27 | Methods for analyte monitoring management and analyte measurement data management, and articles of manufacture related thereto |
Related Parent Applications (1)
| Application Number | Title | Priority Date | Filing Date |
|---|---|---|---|
| EP12836194.6A Division EP2760335B1 (en) | 2011-09-28 | 2012-09-27 | Methods for analyte monitoring management and analyte measurement data management, and articles of manufacture related thereto |
Publications (2)
| Publication Number | Publication Date |
|---|---|
| EP3689235A1 true EP3689235A1 (en) | 2020-08-05 |
| EP3689235B1 EP3689235B1 (en) | 2024-04-17 |
Family
ID=47993236
Family Applications (2)
| Application Number | Title | Priority Date | Filing Date |
|---|---|---|---|
| EP12836194.6A Active EP2760335B1 (en) | 2011-09-28 | 2012-09-27 | Methods for analyte monitoring management and analyte measurement data management, and articles of manufacture related thereto |
| EP20163263.5A Active EP3689235B1 (en) | 2011-09-28 | 2012-09-27 | Methods for analyte monitoring management and analyte measurement data management, and articles of manufacture related thereto |
Family Applications Before (1)
| Application Number | Title | Priority Date | Filing Date |
|---|---|---|---|
| EP12836194.6A Active EP2760335B1 (en) | 2011-09-28 | 2012-09-27 | Methods for analyte monitoring management and analyte measurement data management, and articles of manufacture related thereto |
Country Status (3)
| Country | Link |
|---|---|
| US (4) | US9622689B2 (en) |
| EP (2) | EP2760335B1 (en) |
| WO (1) | WO2013049381A1 (en) |
Families Citing this family (25)
| Publication number | Priority date | Publication date | Assignee | Title |
|---|---|---|---|---|
| ES2950160T3 (en) | 2009-08-31 | 2023-10-05 | Abbott Diabetes Care Inc | Displays for a medical device |
| US10136845B2 (en) | 2011-02-28 | 2018-11-27 | Abbott Diabetes Care Inc. | Devices, systems, and methods associated with analyte monitoring devices and devices incorporating the same |
| EP2760335B1 (en) * | 2011-09-28 | 2020-03-18 | Abbott Diabetes Care, Inc. | Methods for analyte monitoring management and analyte measurement data management, and articles of manufacture related thereto |
| US9465910B2 (en) | 2012-05-15 | 2016-10-11 | James Minor | Diagnostic methods and devices for monitoring chronic glycemia |
| US11798685B2 (en) | 2012-05-15 | 2023-10-24 | James M. Minor | Diagnostic methods and devices for controlling acute glycemia |
| US9171343B1 (en) | 2012-09-11 | 2015-10-27 | Aseko, Inc. | Means and method for improved glycemic control for diabetic patients |
| US9897565B1 (en) | 2012-09-11 | 2018-02-20 | Aseko, Inc. | System and method for optimizing insulin dosages for diabetic subjects |
| WO2014085602A1 (en) | 2012-11-29 | 2014-06-05 | Abbott Diabetes Care Inc. | Methods, devices, and systems related to analyte monitoring |
| US9486580B2 (en) | 2014-01-31 | 2016-11-08 | Aseko, Inc. | Insulin management |
| US9898585B2 (en) | 2014-01-31 | 2018-02-20 | Aseko, Inc. | Method and system for insulin management |
| US11081226B2 (en) | 2014-10-27 | 2021-08-03 | Aseko, Inc. | Method and controller for administering recommended insulin dosages to a patient |
| AU2015339576B2 (en) | 2014-10-27 | 2020-02-06 | Aseko, Inc. | Subcutaneous outpatient management |
| WO2017007775A2 (en) | 2015-07-06 | 2017-01-12 | Abbott Diabetes Care Inc. | Systems, devices, and methods for episode detection and evaluation |
| US10888272B2 (en) | 2015-07-10 | 2021-01-12 | Abbott Diabetes Care Inc. | Systems, devices, and methods for meal information collection, meal assessment, and analyte data correlation |
| CA2993275C (en) | 2015-08-20 | 2022-06-21 | Aseko, Inc. | Diabetes management therapy advisor |
| US10092207B1 (en) | 2016-05-15 | 2018-10-09 | Biolinq, Inc. | Tissue-penetrating electrochemical sensor featuring a co-electrodeposited thin film comprised of polymer and bio-recognition element |
| US11200973B2 (en) * | 2017-01-09 | 2021-12-14 | International Business Machines Corporation | System, for food intake control |
| EP3568863A4 (en) * | 2017-01-11 | 2020-10-28 | Abbott Diabetes Care Inc. | Systems, devices, and methods for episode detection and evaluation with visit guides and action plans |
| FI3592213T3 (en) | 2017-03-08 | 2023-05-22 | Abbott Diabetes Care Inc | System for wellness and nutrition monitoring and management using analyte data |
| CN115769303A (en) | 2020-07-01 | 2023-03-07 | 雅培糖尿病护理公司 | Systems, devices, and methods for meal information collection, meal assessment, and analyte data correlation |
| US11478194B2 (en) | 2020-07-29 | 2022-10-25 | Biolinq Incorporated | Continuous analyte monitoring system with microneedle array |
| USD957438S1 (en) | 2020-07-29 | 2022-07-12 | Abbott Diabetes Care Inc. | Display screen or portion thereof with graphical user interface |
| AU2021342491A1 (en) | 2020-09-17 | 2023-03-30 | Abbott Diabetes Care Inc. | Digital and user interfaces for analyte monitoring systems |
| CN116113454A (en) | 2021-05-08 | 2023-05-12 | 比奥林股份有限公司 | Continuous analyte monitoring device fault detection based on microneedle arrays |
| US20230404441A1 (en) | 2022-04-26 | 2023-12-21 | Abbott Diabetes Care Inc. | Systems, devices, and methods for meal-related analyte response monitoring |
Citations (55)
| Publication number | Priority date | Publication date | Assignee | Title |
|---|---|---|---|---|
| US4545382A (en) | 1981-10-23 | 1985-10-08 | Genetics International, Inc. | Sensor for components of a liquid mixture |
| US4711245A (en) | 1983-05-05 | 1987-12-08 | Genetics International, Inc. | Sensor for components of a liquid mixture |
| US5262305A (en) | 1991-03-04 | 1993-11-16 | E. Heller & Company | Interferant eliminating biosensors |
| US5262035A (en) | 1989-08-02 | 1993-11-16 | E. Heller And Company | Enzyme electrodes |
| US5264014A (en) | 1989-04-25 | 1993-11-23 | Abb Flakt Aktiebolag | Arrangement for cleaning ventilation air polluted with paint particles |
| US5320715A (en) | 1994-01-14 | 1994-06-14 | Lloyd Berg | Separation of 1-pentanol from cyclopentanol by extractive distillation |
| US5356786A (en) | 1991-03-04 | 1994-10-18 | E. Heller & Company | Interferant eliminating biosensor |
| US5509410A (en) | 1983-06-06 | 1996-04-23 | Medisense, Inc. | Strip electrode including screen printing of a single layer |
| US5593852A (en) | 1993-12-02 | 1997-01-14 | Heller; Adam | Subcutaneous glucose electrode |
| US5601435A (en) | 1994-11-04 | 1997-02-11 | Intercare | Method and apparatus for interactively monitoring a physiological condition and for interactively providing health related information |
| US5628890A (en) | 1995-09-27 | 1997-05-13 | Medisense, Inc. | Electrochemical sensor |
| US5820551A (en) | 1983-05-05 | 1998-10-13 | Hill; Hugh Allen Oliver | Strip electrode with screen printing |
| US5822715A (en) | 1997-01-10 | 1998-10-13 | Health Hero Network | Diabetes management system and method for controlling blood glucose |
| US5899855A (en) | 1992-11-17 | 1999-05-04 | Health Hero Network, Inc. | Modular microprocessor-based health monitoring system |
| US5918603A (en) | 1994-05-23 | 1999-07-06 | Health Hero Network, Inc. | Method for treating medical conditions using a microprocessor-based video game |
| US6071391A (en) | 1997-09-12 | 2000-06-06 | Nok Corporation | Enzyme electrode structure |
| US6120676A (en) | 1997-02-06 | 2000-09-19 | Therasense, Inc. | Method of using a small volume in vitro analyte sensor |
| US6161095A (en) | 1998-12-16 | 2000-12-12 | Health Hero Network, Inc. | Treatment regimen compliance and efficacy with feedback |
| US6175752B1 (en) | 1998-04-30 | 2001-01-16 | Therasense, Inc. | Analyte monitoring device and methods of use |
| US6270455B1 (en) | 1997-03-28 | 2001-08-07 | Health Hero Network, Inc. | Networked system for interactive communications and remote monitoring of drug delivery |
| US6299757B1 (en) | 1998-10-08 | 2001-10-09 | Therasense, Inc. | Small volume in vitro analyte sensor with diffusible or non-leachable redox mediator |
| US6377894B1 (en) | 1998-11-30 | 2002-04-23 | Abbott Laboratories | Analyte test instrument having improved calibration and communication processes |
| US20020177764A1 (en) * | 2001-05-25 | 2002-11-28 | Borzu Sohrab | Monitoring analyte concentration using minimally invasive devices |
| US6514460B1 (en) | 1999-07-28 | 2003-02-04 | Abbott Laboratories | Luminous glucose monitoring device |
| US6540891B1 (en) | 1998-05-08 | 2003-04-01 | Abbott Laboratories | Test strip |
| US6560471B1 (en) | 2001-01-02 | 2003-05-06 | Therasense, Inc. | Analyte monitoring device and methods of use |
| US6591125B1 (en) | 2000-06-27 | 2003-07-08 | Therasense, Inc. | Small volume in vitro analyte sensor with diffusible or non-leachable redox mediator |
| US6616819B1 (en) | 1999-11-04 | 2003-09-09 | Therasense, Inc. | Small volume in vitro analyte sensor and methods |
| US6676816B2 (en) | 2001-05-11 | 2004-01-13 | Therasense, Inc. | Transition metal complexes with (pyridyl)imidazole ligands and sensors using said complexes |
| US6730200B1 (en) | 1999-06-18 | 2004-05-04 | Abbott Laboratories | Electrochemical sensor for analysis of liquid samples |
| US6736957B1 (en) | 1997-10-16 | 2004-05-18 | Abbott Laboratories | Biosensor electrode mediators for regeneration of cofactors and process for using |
| US6746582B2 (en) | 2000-05-12 | 2004-06-08 | Therasense, Inc. | Electrodes with multilayer membranes and methods of making the electrodes |
| US6764581B1 (en) | 1997-09-05 | 2004-07-20 | Abbott Laboratories | Electrode with thin working layer |
| US6773671B1 (en) | 1998-11-30 | 2004-08-10 | Abbott Laboratories | Multichemistry measuring device and test strips |
| US20040186365A1 (en) | 2002-12-31 | 2004-09-23 | Therasense, Inc. | Continuous glucose monitoring system and methods of use |
| US20060091006A1 (en) | 1999-11-04 | 2006-05-04 | Yi Wang | Analyte sensor with insertion monitor, and methods |
| US7041468B2 (en) | 2001-04-02 | 2006-05-09 | Therasense, Inc. | Blood glucose tracking apparatus and methods |
| US20070068807A1 (en) | 2005-09-27 | 2007-03-29 | Abbott Diabetes Care, Inc. | In vitro analyte sensor and methods of use |
| US20070095661A1 (en) | 2005-10-31 | 2007-05-03 | Yi Wang | Method of making, and, analyte sensor |
| US20070108048A1 (en) | 2005-11-17 | 2007-05-17 | Abbott Diabetes Care, Inc. | Sensors |
| US20070179434A1 (en) * | 2005-12-08 | 2007-08-02 | Stefan Weinert | System and method for determining drug administration information |
| US20070199818A1 (en) | 2006-02-28 | 2007-08-30 | Adrian Petyt | Biosensors and Methods of Making |
| US7299082B2 (en) | 2003-10-31 | 2007-11-20 | Abbott Diabetes Care, Inc. | Method of calibrating an analyte-measurement device, and associated methods, devices and systems |
| US20080066305A1 (en) | 2006-08-01 | 2008-03-20 | Abbott Diabetes Care Inc. | Analyte sensors and methods |
| US20080102441A1 (en) | 2006-10-31 | 2008-05-01 | Ting Chen | Analyte Sensors and Methods |
| US20080148873A1 (en) | 2006-12-22 | 2008-06-26 | Yi Wang | Analyte Sensors and Methods of Use |
| US20080267823A1 (en) | 2007-04-27 | 2008-10-30 | Abbott Diabetes Care, Inc. | Identification Of A Strip Type By The Meter Using Conductive Patterns On The Strip |
| US20080300534A1 (en) * | 2007-05-30 | 2008-12-04 | Michael Blomquist | Insulin pump based expert system |
| US20100198034A1 (en) | 2009-02-03 | 2010-08-05 | Abbott Diabetes Care Inc. | Compact On-Body Physiological Monitoring Devices and Methods Thereof |
| US20100256047A1 (en) * | 2009-04-03 | 2010-10-07 | Lifescan, Inc. | Analyte Measurement and Management Device and Associated Methods |
| US20100299075A1 (en) * | 2009-05-19 | 2010-11-25 | Bayer Healthcare Llc | Systems and methods for calculating an average analyte concentration value |
| US20100332142A1 (en) * | 2009-06-30 | 2010-12-30 | Lifescan,Inc. | Analyte testing method and device for calculating basal insulin therapy |
| US20110004085A1 (en) * | 2009-04-30 | 2011-01-06 | Dexcom, Inc. | Performance reports associated with continuous sensor data from multiple analysis time periods |
| US20110130666A1 (en) * | 2009-11-30 | 2011-06-02 | Yanting Dong | Enhanced reporting of pathological episodes |
| US20110193704A1 (en) * | 2009-08-31 | 2011-08-11 | Abbott Diabetes Care Inc. | Displays for a medical device |
Family Cites Families (19)
| Publication number | Priority date | Publication date | Assignee | Title |
|---|---|---|---|---|
| FR2502449A1 (en) | 1981-03-23 | 1982-09-24 | Alsthom Cgee | DEVICE FOR FIXING AN APPARATUS TO SUPPORT PROFILES |
| US5320725A (en) | 1989-08-02 | 1994-06-14 | E. Heller & Company | Electrode and method for the detection of hydrogen peroxide |
| US5264104A (en) | 1989-08-02 | 1993-11-23 | Gregg Brian A | Enzyme electrodes |
| US5356249A (en) | 1993-03-30 | 1994-10-18 | Buffers Ab | Automatic securing system for locking and unlocking a freight container to a load carrier |
| US9135402B2 (en) * | 2007-12-17 | 2015-09-15 | Dexcom, Inc. | Systems and methods for processing sensor data |
| US8233959B2 (en) * | 2003-08-22 | 2012-07-31 | Dexcom, Inc. | Systems and methods for processing analyte sensor data |
| US20070128682A1 (en) * | 2004-06-28 | 2007-06-07 | Rosman Paul M | Predictive treatment of dysglycemic excursions associated with diabetes mellitus |
| US20060276771A1 (en) * | 2005-06-06 | 2006-12-07 | Galley Paul J | System and method providing for user intervention in a diabetes control arrangement |
| US8251904B2 (en) * | 2005-06-09 | 2012-08-28 | Roche Diagnostics Operations, Inc. | Device and method for insulin dosing |
| US7824333B2 (en) * | 2006-03-31 | 2010-11-02 | Lifescan, Inc. | Diabetes management methods and systems |
| US20080269714A1 (en) * | 2007-04-25 | 2008-10-30 | Medtronic Minimed, Inc. | Closed loop/semi-closed loop therapy modification system |
| US8103471B2 (en) * | 2007-05-14 | 2012-01-24 | Abbott Diabetes Care Inc. | Method and apparatus for providing data processing and control in a medical communication system |
| CN102265279B (en) * | 2008-12-23 | 2019-08-23 | 霍夫曼-拉罗奇有限公司 | The Structural Testing Method and its equipment that diagnosis or treatment for chronic are supported |
| EP4325520A2 (en) * | 2009-05-29 | 2024-02-21 | University Of Virginia Patent Foundation | System coordinator and modular architecture for open-loop and closed-loop control of diabetes |
| US8298158B2 (en) | 2009-06-30 | 2012-10-30 | Abbott Diabetes Care Inc. | Integrated devices having extruded electrode structures and methods of using same |
| EP2525710B1 (en) * | 2010-01-22 | 2014-08-06 | Lifescan, Inc. | Analyte testing method and system |
| US20110245634A1 (en) * | 2010-04-03 | 2011-10-06 | Lifescan, Inc. | Methods, Systems, and Devices for Analyzing Patient Data |
| US9913599B2 (en) * | 2011-02-11 | 2018-03-13 | Abbott Diabetes Care Inc. | Software applications residing on handheld analyte determining devices |
| EP2760335B1 (en) * | 2011-09-28 | 2020-03-18 | Abbott Diabetes Care, Inc. | Methods for analyte monitoring management and analyte measurement data management, and articles of manufacture related thereto |
-
2012
- 2012-09-27 EP EP12836194.6A patent/EP2760335B1/en active Active
- 2012-09-27 US US13/629,262 patent/US9622689B2/en active Active
- 2012-09-27 WO PCT/US2012/057608 patent/WO2013049381A1/en active Application Filing
- 2012-09-27 EP EP20163263.5A patent/EP3689235B1/en active Active
-
2017
- 2017-03-30 US US15/475,094 patent/US10945646B2/en active Active
-
2021
- 2021-02-09 US US17/170,991 patent/US11832973B2/en active Active
-
2023
- 2023-10-26 US US18/383,977 patent/US20240122552A1/en active Pending
Patent Citations (72)
| Publication number | Priority date | Publication date | Assignee | Title |
|---|---|---|---|---|
| US4545382A (en) | 1981-10-23 | 1985-10-08 | Genetics International, Inc. | Sensor for components of a liquid mixture |
| US4711245A (en) | 1983-05-05 | 1987-12-08 | Genetics International, Inc. | Sensor for components of a liquid mixture |
| US5820551A (en) | 1983-05-05 | 1998-10-13 | Hill; Hugh Allen Oliver | Strip electrode with screen printing |
| US5509410A (en) | 1983-06-06 | 1996-04-23 | Medisense, Inc. | Strip electrode including screen printing of a single layer |
| US5264014A (en) | 1989-04-25 | 1993-11-23 | Abb Flakt Aktiebolag | Arrangement for cleaning ventilation air polluted with paint particles |
| US5262035A (en) | 1989-08-02 | 1993-11-16 | E. Heller And Company | Enzyme electrodes |
| US5356786A (en) | 1991-03-04 | 1994-10-18 | E. Heller & Company | Interferant eliminating biosensor |
| US6514718B2 (en) | 1991-03-04 | 2003-02-04 | Therasense, Inc. | Subcutaneous glucose electrode |
| US5262305A (en) | 1991-03-04 | 1993-11-16 | E. Heller & Company | Interferant eliminating biosensors |
| US6881551B2 (en) | 1991-03-04 | 2005-04-19 | Therasense, Inc. | Subcutaneous glucose electrode |
| US5899855A (en) | 1992-11-17 | 1999-05-04 | Health Hero Network, Inc. | Modular microprocessor-based health monitoring system |
| US6284478B1 (en) | 1993-12-02 | 2001-09-04 | E. Heller & Company | Subcutaneous glucose electrode |
| US5593852A (en) | 1993-12-02 | 1997-01-14 | Heller; Adam | Subcutaneous glucose electrode |
| US6121009A (en) | 1993-12-02 | 2000-09-19 | E. Heller & Company | Electrochemical analyte measurement system |
| US5320715A (en) | 1994-01-14 | 1994-06-14 | Lloyd Berg | Separation of 1-pentanol from cyclopentanol by extractive distillation |
| US5918603A (en) | 1994-05-23 | 1999-07-06 | Health Hero Network, Inc. | Method for treating medical conditions using a microprocessor-based video game |
| US5601435A (en) | 1994-11-04 | 1997-02-11 | Intercare | Method and apparatus for interactively monitoring a physiological condition and for interactively providing health related information |
| US6144837A (en) | 1994-11-04 | 2000-11-07 | Health Hero Network, Inc. | Method and apparatus for interactively monitoring a physiological condition and for interactively providing health-related information |
| US5628890A (en) | 1995-09-27 | 1997-05-13 | Medisense, Inc. | Electrochemical sensor |
| US5822715A (en) | 1997-01-10 | 1998-10-13 | Health Hero Network | Diabetes management system and method for controlling blood glucose |
| US7167818B2 (en) | 1997-01-10 | 2007-01-23 | Health Hero Network, Inc. | Disease simulation system and method |
| US6143164A (en) | 1997-02-06 | 2000-11-07 | E. Heller & Company | Small volume in vitro analyte sensor |
| US6120676A (en) | 1997-02-06 | 2000-09-19 | Therasense, Inc. | Method of using a small volume in vitro analyte sensor |
| US6270455B1 (en) | 1997-03-28 | 2001-08-07 | Health Hero Network, Inc. | Networked system for interactive communications and remote monitoring of drug delivery |
| US6764581B1 (en) | 1997-09-05 | 2004-07-20 | Abbott Laboratories | Electrode with thin working layer |
| US6071391A (en) | 1997-09-12 | 2000-06-06 | Nok Corporation | Enzyme electrode structure |
| US6893545B2 (en) | 1997-09-12 | 2005-05-17 | Therasense, Inc. | Biosensor |
| US6503381B1 (en) | 1997-09-12 | 2003-01-07 | Therasense, Inc. | Biosensor |
| US6736957B1 (en) | 1997-10-16 | 2004-05-18 | Abbott Laboratories | Biosensor electrode mediators for regeneration of cofactors and process for using |
| US6175752B1 (en) | 1998-04-30 | 2001-01-16 | Therasense, Inc. | Analyte monitoring device and methods of use |
| US6540891B1 (en) | 1998-05-08 | 2003-04-01 | Abbott Laboratories | Test strip |
| US6461496B1 (en) | 1998-10-08 | 2002-10-08 | Therasense, Inc. | Small volume in vitro analyte sensor with diffusible or non-leachable redox mediator |
| US6338790B1 (en) | 1998-10-08 | 2002-01-15 | Therasense, Inc. | Small volume in vitro analyte sensor with diffusible or non-leachable redox mediator |
| US6299757B1 (en) | 1998-10-08 | 2001-10-09 | Therasense, Inc. | Small volume in vitro analyte sensor with diffusible or non-leachable redox mediator |
| US6618934B1 (en) | 1998-10-08 | 2003-09-16 | Therasense, Inc. | Method of manufacturing small volume in vitro analyte sensor |
| US6592745B1 (en) | 1998-10-08 | 2003-07-15 | Therasense, Inc. | Method of using a small volume in vitro analyte sensor with diffusible or non-leachable redox mediator |
| US6600997B2 (en) | 1998-11-30 | 2003-07-29 | Abbott Laboratories | Analyte test instrument having improved calibration and communication processes |
| US6773671B1 (en) | 1998-11-30 | 2004-08-10 | Abbott Laboratories | Multichemistry measuring device and test strips |
| US6377894B1 (en) | 1998-11-30 | 2002-04-23 | Abbott Laboratories | Analyte test instrument having improved calibration and communication processes |
| US6161095A (en) | 1998-12-16 | 2000-12-12 | Health Hero Network, Inc. | Treatment regimen compliance and efficacy with feedback |
| US6730200B1 (en) | 1999-06-18 | 2004-05-04 | Abbott Laboratories | Electrochemical sensor for analysis of liquid samples |
| US6514460B1 (en) | 1999-07-28 | 2003-02-04 | Abbott Laboratories | Luminous glucose monitoring device |
| US6749740B2 (en) | 1999-11-04 | 2004-06-15 | Therasense, Inc. | Small volume in vitro analyte sensor and methods |
| US6616819B1 (en) | 1999-11-04 | 2003-09-09 | Therasense, Inc. | Small volume in vitro analyte sensor and methods |
| US6942518B2 (en) | 1999-11-04 | 2005-09-13 | Therasense, Inc. | Small volume in vitro analyte sensor and methods |
| US20060091006A1 (en) | 1999-11-04 | 2006-05-04 | Yi Wang | Analyte sensor with insertion monitor, and methods |
| US6746582B2 (en) | 2000-05-12 | 2004-06-08 | Therasense, Inc. | Electrodes with multilayer membranes and methods of making the electrodes |
| US6591125B1 (en) | 2000-06-27 | 2003-07-08 | Therasense, Inc. | Small volume in vitro analyte sensor with diffusible or non-leachable redox mediator |
| US20060025662A1 (en) | 2000-06-27 | 2006-02-02 | Therasense, Inc. | Small volume in vitro analyte sensor with diffusible or non-leachable redox mediator |
| US6560471B1 (en) | 2001-01-02 | 2003-05-06 | Therasense, Inc. | Analyte monitoring device and methods of use |
| US7041468B2 (en) | 2001-04-02 | 2006-05-09 | Therasense, Inc. | Blood glucose tracking apparatus and methods |
| US6676816B2 (en) | 2001-05-11 | 2004-01-13 | Therasense, Inc. | Transition metal complexes with (pyridyl)imidazole ligands and sensors using said complexes |
| US20020177764A1 (en) * | 2001-05-25 | 2002-11-28 | Borzu Sohrab | Monitoring analyte concentration using minimally invasive devices |
| US20040186365A1 (en) | 2002-12-31 | 2004-09-23 | Therasense, Inc. | Continuous glucose monitoring system and methods of use |
| US7299082B2 (en) | 2003-10-31 | 2007-11-20 | Abbott Diabetes Care, Inc. | Method of calibrating an analyte-measurement device, and associated methods, devices and systems |
| US20070068807A1 (en) | 2005-09-27 | 2007-03-29 | Abbott Diabetes Care, Inc. | In vitro analyte sensor and methods of use |
| US20070095661A1 (en) | 2005-10-31 | 2007-05-03 | Yi Wang | Method of making, and, analyte sensor |
| US20070108048A1 (en) | 2005-11-17 | 2007-05-17 | Abbott Diabetes Care, Inc. | Sensors |
| US20070179434A1 (en) * | 2005-12-08 | 2007-08-02 | Stefan Weinert | System and method for determining drug administration information |
| US20070199818A1 (en) | 2006-02-28 | 2007-08-30 | Adrian Petyt | Biosensors and Methods of Making |
| US20080066305A1 (en) | 2006-08-01 | 2008-03-20 | Abbott Diabetes Care Inc. | Analyte sensors and methods |
| US20080102441A1 (en) | 2006-10-31 | 2008-05-01 | Ting Chen | Analyte Sensors and Methods |
| US20080148873A1 (en) | 2006-12-22 | 2008-06-26 | Yi Wang | Analyte Sensors and Methods of Use |
| US20080267823A1 (en) | 2007-04-27 | 2008-10-30 | Abbott Diabetes Care, Inc. | Identification Of A Strip Type By The Meter Using Conductive Patterns On The Strip |
| US20080300534A1 (en) * | 2007-05-30 | 2008-12-04 | Michael Blomquist | Insulin pump based expert system |
| US20100198034A1 (en) | 2009-02-03 | 2010-08-05 | Abbott Diabetes Care Inc. | Compact On-Body Physiological Monitoring Devices and Methods Thereof |
| US20100256047A1 (en) * | 2009-04-03 | 2010-10-07 | Lifescan, Inc. | Analyte Measurement and Management Device and Associated Methods |
| US20110004085A1 (en) * | 2009-04-30 | 2011-01-06 | Dexcom, Inc. | Performance reports associated with continuous sensor data from multiple analysis time periods |
| US20100299075A1 (en) * | 2009-05-19 | 2010-11-25 | Bayer Healthcare Llc | Systems and methods for calculating an average analyte concentration value |
| US20100332142A1 (en) * | 2009-06-30 | 2010-12-30 | Lifescan,Inc. | Analyte testing method and device for calculating basal insulin therapy |
| US20110193704A1 (en) * | 2009-08-31 | 2011-08-11 | Abbott Diabetes Care Inc. | Displays for a medical device |
| US20110130666A1 (en) * | 2009-11-30 | 2011-06-02 | Yanting Dong | Enhanced reporting of pathological episodes |
Non-Patent Citations (1)
| Title |
|---|
| YUVAL SHAHAR ET AL: "Knowledge-based temporal abstraction in clinical domains", ARTIFICIAL INTELLIGENCE IN MEDICINE, 1 January 1996 (1996-01-01), pages 267 - 298, XP055140343, Retrieved from the Internet <URL:http://ac.els-cdn.com/0933365795000364/1-s2.0-0933365795000364-main.pdf?_tid=03c34d40-3ced-11e4-909c-00000aab0f6c&acdnat=1410795119_c6442942cbf376afc41a4910309dc730> [retrieved on 20140915], DOI: 10.1016/0933-3657(95)00036-4 * |
Also Published As
| Publication number | Publication date |
|---|---|
| US20170251960A1 (en) | 2017-09-07 |
| WO2013049381A1 (en) | 2013-04-04 |
| US9622689B2 (en) | 2017-04-18 |
| US20240122552A1 (en) | 2024-04-18 |
| EP2760335A4 (en) | 2015-04-22 |
| EP2760335B1 (en) | 2020-03-18 |
| EP3689235B1 (en) | 2024-04-17 |
| EP2760335A1 (en) | 2014-08-06 |
| US20210161438A1 (en) | 2021-06-03 |
| US11832973B2 (en) | 2023-12-05 |
| US10945646B2 (en) | 2021-03-16 |
| US20130085358A1 (en) | 2013-04-04 |
Similar Documents
| Publication | Publication Date | Title |
|---|---|---|
| US11832973B2 (en) | Methods for analyte monitoring management and analyte measurement data management, and articles of manufacture related thereto | |
| US11389090B2 (en) | Intermittent monitoring | |
| US10667759B2 (en) | Automatic recognition of known patterns in physiological measurement data | |
| US20180242891A1 (en) | Software applications residing on handheld analyte determining devices | |
| EP3125761B1 (en) | Method and apparatus for determining meal start and peak events in analyte monitoring systems | |
| US8781752B2 (en) | Measuring control method and arrangement | |
| EP2654563B1 (en) | Automatic recognition of known patterns in physiological measurement data | |
| US20220273204A1 (en) | Intermittent Monitoring | |
| EP3019084B1 (en) | Reminder, classification, and pattern identification systems and methods for handheld diabetes management devices | |
| US10665332B2 (en) | Systems and methods for facilitating physiological data collection prior to appointment | |
| Fonda et al. | Minding the gaps in continuous glucose monitoring: a method to repair gaps to achieve more accurate glucometrics | |
| JP2016540229A (en) | Data management unit and operation method thereof | |
| US11864888B2 (en) | User-defined structured testing for use in diabetes care | |
| Irace et al. | Device profile of the eversense continuous glucose monitoring system for glycemic control in type-1 diabetes: overview of its safety and efficacy | |
| Kramer et al. | Practical improvements for medical device evaluation | |
| US20230404441A1 (en) | Systems, devices, and methods for meal-related analyte response monitoring | |
| HOLUBOVÁ | Automatic discovery of problematic situations in biosignals of patients with diabetes | |
| WO2023219847A1 (en) | Cost-effective therapy recommendations | |
| Holubová | Automatizované vyhledávání problematických situací v biologických signálech pacientů s diabetem |
Legal Events
| Date | Code | Title | Description |
|---|---|---|---|
| PUAI | Public reference made under article 153(3) epc to a published international application that has entered the european phase |
Free format text: ORIGINAL CODE: 0009012 |
|
| STAA | Information on the status of an ep patent application or granted ep patent |
Free format text: STATUS: THE APPLICATION HAS BEEN PUBLISHED |
|
| AC | Divisional application: reference to earlier application |
Ref document number: 2760335 Country of ref document: EP Kind code of ref document: P |
|
| AK | Designated contracting states |
Kind code of ref document: A1 Designated state(s): AL AT BE BG CH CY CZ DE DK EE ES FI FR GB GR HR HU IE IS IT LI LT LU LV MC MK MT NL NO PL PT RO RS SE SI SK SM TR |
|
| STAA | Information on the status of an ep patent application or granted ep patent |
Free format text: STATUS: REQUEST FOR EXAMINATION WAS MADE |
|
| 17P | Request for examination filed |
Effective date: 20210202 |
|
| RBV | Designated contracting states (corrected) |
Designated state(s): AL AT BE BG CH CY CZ DE DK EE ES FI FR GB GR HR HU IE IS IT LI LT LU LV MC MK MT NL NO PL PT RO RS SE SI SK SM TR |
|
| P01 | Opt-out of the competence of the unified patent court (upc) registered |
Effective date: 20230530 |
|
| GRAP | Despatch of communication of intention to grant a patent |
Free format text: ORIGINAL CODE: EPIDOSNIGR1 |
|
| STAA | Information on the status of an ep patent application or granted ep patent |
Free format text: STATUS: GRANT OF PATENT IS INTENDED |
|
| INTG | Intention to grant announced |
Effective date: 20231117 |
|
| GRAS | Grant fee paid |
Free format text: ORIGINAL CODE: EPIDOSNIGR3 |
|
| GRAA | (expected) grant |
Free format text: ORIGINAL CODE: 0009210 |
|
| STAA | Information on the status of an ep patent application or granted ep patent |
Free format text: STATUS: THE PATENT HAS BEEN GRANTED |
|
| AC | Divisional application: reference to earlier application |
Ref document number: 2760335 Country of ref document: EP Kind code of ref document: P |
|
| AK | Designated contracting states |
Kind code of ref document: B1 Designated state(s): AL AT BE BG CH CY CZ DE DK EE ES FI FR GB GR HR HU IE IS IT LI LT LU LV MC MK MT NL NO PL PT RO RS SE SI SK SM TR |
|
| REG | Reference to a national code |
Ref country code: GB Ref legal event code: FG4D |