EP3689002B1 - Howl detection in conference systems - Google Patents
Howl detection in conference systems Download PDFInfo
- Publication number
- EP3689002B1 EP3689002B1 EP18783352.0A EP18783352A EP3689002B1 EP 3689002 B1 EP3689002 B1 EP 3689002B1 EP 18783352 A EP18783352 A EP 18783352A EP 3689002 B1 EP3689002 B1 EP 3689002B1
- Authority
- EP
- European Patent Office
- Prior art keywords
- howl
- teleconference
- state
- teleconferencing
- block
- Prior art date
- Legal status (The legal status is an assumption and is not a legal conclusion. Google has not performed a legal analysis and makes no representation as to the accuracy of the status listed.)
- Active
Links
Images







Classifications
-
- G—PHYSICS
- G10—MUSICAL INSTRUMENTS; ACOUSTICS
- G10L—SPEECH ANALYSIS TECHNIQUES OR SPEECH SYNTHESIS; SPEECH RECOGNITION; SPEECH OR VOICE PROCESSING TECHNIQUES; SPEECH OR AUDIO CODING OR DECODING
- G10L25/00—Speech or voice analysis techniques not restricted to a single one of groups G10L15/00 - G10L21/00
- G10L25/48—Speech or voice analysis techniques not restricted to a single one of groups G10L15/00 - G10L21/00 specially adapted for particular use
-
- H—ELECTRICITY
- H04—ELECTRIC COMMUNICATION TECHNIQUE
- H04M—TELEPHONIC COMMUNICATION
- H04M3/00—Automatic or semi-automatic exchanges
- H04M3/42—Systems providing special services or facilities to subscribers
- H04M3/56—Arrangements for connecting several subscribers to a common circuit, i.e. affording conference facilities
- H04M3/568—Arrangements for connecting several subscribers to a common circuit, i.e. affording conference facilities audio processing specific to telephonic conferencing, e.g. spatial distribution, mixing of participants
-
- H—ELECTRICITY
- H04—ELECTRIC COMMUNICATION TECHNIQUE
- H04M—TELEPHONIC COMMUNICATION
- H04M9/00—Arrangements for interconnection not involving centralised switching
- H04M9/08—Two-way loud-speaking telephone systems with means for conditioning the signal, e.g. for suppressing echoes for one or both directions of traffic
-
- H—ELECTRICITY
- H04—ELECTRIC COMMUNICATION TECHNIQUE
- H04R—LOUDSPEAKERS, MICROPHONES, GRAMOPHONE PICK-UPS OR LIKE ACOUSTIC ELECTROMECHANICAL TRANSDUCERS; ELECTRIC HEARING AIDS; PUBLIC ADDRESS SYSTEMS
- H04R3/00—Circuits for transducers
- H04R3/02—Circuits for transducers for preventing acoustic reaction, i.e. acoustic oscillatory feedback
-
- H—ELECTRICITY
- H04—ELECTRIC COMMUNICATION TECHNIQUE
- H04M—TELEPHONIC COMMUNICATION
- H04M2203/00—Aspects of automatic or semi-automatic exchanges
- H04M2203/20—Aspects of automatic or semi-automatic exchanges related to features of supplementary services
- H04M2203/2094—Proximity
Definitions
- This disclosure relates to the processing of audio signals.
- this disclosure relates to processing audio signals related to teleconferencing or video conferencing.
- Acoustic feedback is a type of feedback that occurs when a sound loop exists between an audio input (e.g., a microphone) and an audio output (for example, a loudspeaker).
- a signal received by the microphone may be amplified and reproduced by the loudspeaker.
- the reproduced sound from the loudspeaker may then be received by the microphone again, amplified further, and then reproduced by the loudspeaker again at a higher amplitude or volume level.
- the sound of the acoustic feedback may be a loud screech or squeal, which may be referred to herein as a "howl.”
- guitarists and other performers may intentionally create howl (e.g., between a guitar pickup and a loudspeaker) in order to produce desired musical effects.
- howl e.g., between a guitar pickup and a loudspeaker
- some methods have proven to successfully detect and mitigate unintentionally-produced howl, this problem has proven to be more difficult to solve in the context of teleconferencing.
- aspects of the present application may be embodied, at least in part, in an apparatus, a system that includes more than one device, a method, a computer program product, etc. Accordingly, aspects of the present application may take the form of a hardware embodiment, a software embodiment (including firmware, resident software, microcodes, etc.) and/or an embodiment combining both software and hardware aspects.
- Such embodiments may be referred to herein as a "circuit,” a “module” or “engine.”
- Some aspects of the present application may take the form of a computer program product embodied in one or more non-transitory media having computer readable program code embodied thereon.
- Such non-transitory media may, for example, include a hard disk, a random access memory (RAM), a read-only memory (ROM), an erasable programmable read-only memory (EPROM or Flash memory), a portable compact disc read-only memory (CD-ROM), an optical storage device, a magnetic storage device, or any suitable combination of the foregoing. Accordingly, the teachings of this disclosure are not intended to be limited to the implementations shown in the figures and/or described herein, but instead have wide applicability.
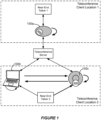
- Figure 1 shows examples of teleconference devices during a teleconference involving two teleconference client locations.
- a teleconference server is configured for providing audio connectivity (which may be full-duplex audio connectivity) between a teleconference client device 100a in teleconference client location 1 and teleconference client devices 100b and 100c in teleconference client location 2.
- the teleconference client devices 100a and 100c are conference phones, whereas teleconference client device 100b is a laptop.
- teleconference client devices 100b and 100c both have their microphones and speakers enabled. Therefore, the microphones of teleconference client devices 100b and 100c each provide teleconference audio data to the teleconference server corresponding to the speech of near-end talker 2. Accordingly, the teleconference server provides teleconference audio data to teleconference client device 100b corresponding to the speech of near-end talker 2 received by teleconference client device 100c, and also provides teleconference audio data to teleconference client device 100c corresponding to the speech of near-end talker 2 received by teleconference client device 100b.
- the speakers of teleconference client devices 100b and 100c each reproduce the speech of near-end talker 2 after a time delay corresponding with the round-trip time for the teleconference audio data to be transmitted from the teleconference client location 2 to the teleconference server and back.
- the speakers of teleconference client device 100b reproduce the speech of near-end talker 2
- the microphones of teleconference client device 100c detect the reproduced speech of near-end talker 2.
- the speakers of teleconference client device 100c reproduce the speech of near-end talker 2
- the microphone(s) of teleconference client device 100b detect the reproduced speech of near-end talker 2.
- a howl state can be triggered by the speech of near-end talker 2 in teleconference client location 2.
- the howl state has at least some characteristics that would not be present if the teleconference client devices 100b and 100c were not participating in a teleconference.
- Figure 2 shows graphs, in the time and frequency domains, of an example of a howl state that may involve two or more teleconference devices in a teleconference client location.
- Graph 205 is in the time domain, with time represented by the horizontal axis and level, in dB, represented by the vertical axis.
- Graph 205 shows howl events 210a-210f. The time during which the howl events 210a-210f are taking place may be referred to herein as a "howl state.”
- the howl events 210a-210f are periodic, or quasi-periodic, and that they increase in amplitude over time.
- the periodicity of the howl events 210a-210f corresponds with a time delay corresponding with the round-trip time for the teleconference audio data to be transmitted from a teleconference client location to a teleconference server and back.
- the level of speech events (to the left of the howl events 210a-210f) is lower than that of the howl events 210a-210f.
- Graph 215 represents the same audio data, including the howl events 210a-210f, in the frequency domain. It may be observed from graph 215 that most of the energy of the howl events 210a-210f is concentrated in relatively narrow frequency bands.
- the howl state has at least some characteristics that would not be present if the devices involved in producing the howl state were not participating in a teleconference. For example, acoustic feedback between a microphone and a speaker of a public address audio system may occur when the microphone is too close to the loudspeaker and/or when the amplification is too large. Such acoustic feedback would generally manifest as a single and continuous howl event, not as a plurality of discontinuous and periodically-occurring howl events. In contrast to acoustic feedback in a public address system context, acoustic feedback in a duplex communication use case may span different networks and different devices.
- the round-trip time is usually larger than 300ms, and may be in the range of 500 ms to a second or more. Accordingly, acoustic feedback detection and mitigation in a teleconferencing context may be very different from acoustic feedback detection and mitigation in a public address system context, where the feedback is caused in the same microphone-amplifier-loudspeaker system.
- FIG. 3 is a block diagram that shows examples of components of an apparatus that may be configured to perform at least some of the methods disclosed herein.
- the apparatus 305 may be a teleconferencing server.
- the apparatus 305 may be a teleconference client device.
- the components of the apparatus 305 may be implemented via hardware, via software stored on non-transitory media, via firmware and/or by combinations thereof.
- the types and numbers of components shown in Figure 3 , as well as other figures disclosed herein, are merely shown by way of example. Alternative implementations may include more, fewer and/or different components.
- the apparatus 305 may include one or more microphones, one or more speakers, etc.
- the apparatus 305 includes an interface system 310 and a control system 315.
- the interface system 310 may include one or more network interfaces, one or more interfaces between the control system 315 and a memory system and/or one or more external device interfaces (such as one or more universal serial bus (USB) interfaces).
- the interface system 310 may include a user interface system.
- the user interface system may be configured for receiving input from a user.
- the user interface system may be configured for providing feedback to a user.
- the user interface system may include one or more displays with corresponding touch and/or gesture detection systems.
- the user interface system may include one or more speakers.
- the user interface system may include apparatus for providing haptic feedback, such as a motor, a vibrator, etc.
- the control system 315 may, for example, include a general purpose single- or multi-chip processor, a digital signal processor (DSP), an application specific integrated circuit (ASIC), a field programmable gate array (FPGA) or other programmable logic device, discrete gate or transistor logic, and/or discrete hardware components.
- DSP digital signal processor
- ASIC application specific integrated circuit
- FPGA field programmable gate array
- the apparatus 305 may be implemented in a single device. However, in some implementations, the apparatus 305 may be implemented in more than one device. In some such implementations, functionality of the control system 315 may be included in more than one device. In some examples, the apparatus 305 may be a component of another device. For example, in some implementations the apparatus 305 may be a component of a server, e.g., a line card.
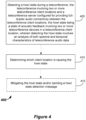
- Figure 4 is a flow diagram that outlines blocks of a method according to one example. The method may, in some instances, be performed by the apparatus of Figure 3 or by another type of apparatus disclosed herein. In some examples, the blocks of method 400 may be implemented via software stored on one or more non-transitory media.
- block 405 involves detecting a howl state during a teleconference.
- the teleconference involves two or more teleconference client locations and a teleconference server configured for providing full-duplex audio connectivity between the teleconference client locations.
- the howl state is a state of acoustic feedback involving two or more teleconference devices in a teleconference client location.
- detecting the howl state involves an analysis of both spectral and temporal characteristics of teleconference audio data.
- detecting the howl state may involve calculating a power-based metric according to order statistics of frequency bands, calculating a spectral resonance metric, calculating an inter-percentile range metric, event aggregation, calculating a periodicity metric, detecting envelope similarity, calculating a spectral peakiness metric, a machine-learning-based process and/or estimating a howl presence probability.
- metric and "measure” may be used synonymously herein.
- detecting the howl state may, for example, involve estimating a howl presence probability according to the teleconference audio data.
- the howl presence probability estimation may be based on a hierarchical rule set or a machine learning method. Detecting the howl state may be based, at least in part, on the howl presence probability.
- Various examples are described in detail below.
- the teleconference server may detect the howl state in block 405.
- a howl-detection-enabled teleconference device at a teleconference client location may detect the howl state in block 405.
- block 410 involves determining which client location is causing the howl state.
- the teleconference server may determine which client location is causing the howl state in block 410.
- a howl-detection-enabled teleconference device at a teleconference client location may determine which client location is causing the howl state in block 410.
- the howl-detection-enabled teleconference device may, in some instances, determine that the howl-detection-enabled teleconference device itself, or another teleconference device at the same teleconference client location, it causing the howl state.
- Optional block 415 involves mitigating the howl state or sending a howl state detection message.
- the teleconference server may send the howl state detection message to the client location that is causing the howl state in block 415.
- mitigating the howl state may involve detecting one or more peak frequency bands of the howl state and applying one or more notch filters corresponding to the one or more peak frequency bands.
- mitigating the howl state may involve muting one or more microphones at the client location that is causing the howl state and/or lowering a speaker volume at the client location that is causing the howl state.
- a howl-detection-enabled teleconference device at the client location that is causing the howl state may be configured to mitigate the howl state.
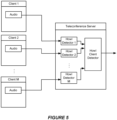
- Figure 5 shows teleconference client device and teleconference server configurations according to one implementation.
- the teleconference server is configured to detect the howl state based, at least in part, on teleconference audio data received from the teleconference client locations.
- teleconference client locations 1 through M are participating in a teleconference.
- the teleconference server includes howl detectors 1 through M, each howl detector corresponding with a teleconference client location or a teleconference client device at a client location.
- each of the howl detectors 1 through M is configured for detecting a howl state during a teleconference.
- the teleconference server also includes a howl client detector configured for determining which client location is causing the howl state.
- each of the howl detectors 1 through M is configured for sending a howl state signal to the howl client detector after detecting a howl state.
- the howl client detector may determine which client location is causing the howl state according to the howl detector from which the howl state signal is received.
- the teleconference server may be configured for mitigating the howl state and/or sending a howl state detection message to the teleconference client location causing the howl state.
- the howl detectors and the howl client detector shown and described herein, including but not limited to those shown in Figure 5 may be implemented in various ways according to the particular implementation.
- the howl detectors and the howl client detector may be implemented as part of a control system such as that shown in Figure 3 and described above.
- the howl detectors and the howl client detector may be implemented via hardware, via software (which may include firmware, resident software, microcodes, etc.) and/or in an embodiment combining both software and hardware aspects.
- Such embodiments may be referred to herein as a "circuit,” a “module” or “engine.”
- the howl detectors and the howl client detector may be implemented via a computer program product embodied in one or more non-transitory media having computer readable program code embodied thereon.
- Such non-transitory media may, for example, include a hard disk, a random access memory (RAM), a read-only memory (ROM), an erasable programmable read-only memory (EPROM or Flash memory), a portable compact disc read-only memory (CD-ROM), an optical storage device, a magnetic storage device, or any suitable combination of the foregoing.
- Figure 6 shows teleconference client device and teleconference server configurations according to another implementation.
- the teleconference server is configured to detect the howl state based, at least in part, on teleconference audio data received from the teleconference client locations 1 through M, which are participating in a teleconference.
- the teleconference server includes a mixer that is configured to mix the teleconference audio data received from the teleconference client locations 1 through M and to output a teleconference audio data mix to the howl detector.
- the howl detector is configured to detect a howl state based on the teleconference audio data mix.
- This type of implementation has potential advantages as compared to the type of implementation shown in Figure 5 , in that multiple howl detectors are not required. Accordingly, this type of implementation can provide relatively lower computational overhead, less power consumption, etc., as compared to the type of implementation shown in Figure 5 .
- the teleconference server shown in Figure 6 also includes a howl client detector that is configured for determining which client location is causing the howl state.
- the teleconference server may be configured for mitigating the howl state and/or sending a howl state detection message to the teleconference client location causing the howl state.
- the teleconference server may receive teleconference metadata from each of the teleconference client locations 1 through M participating in the teleconference.
- the teleconference metadata may include voice activity detection metadata, level metadata and/or energy metadata.
- the howl client detector may be configured to determine which client location is causing the howl state based, at least in part, on the teleconference metadata.
- the howl client detector may be configured to determine which client location is causing the howl state based, at least in part, on voice activity detection metadata indicating which teleconference client location has a teleconference participant who is currently speaking. This is a reasonable assumption because throughout most of a teleconference or other conversation, one person is talking at a time.
- Some implementations may provide a howl client detection algorithm, which also may be referred to as a "blame” algorithm, to correlate regions of howl to a particular teleconference client based on howl detection result in the server and each teleconference client's metadata information received by the teleconference server.
- the "blame" algorithm may be as follows:
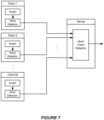
- FIG. 7 shows teleconference client device and teleconference server configurations according to still another implementation.
- each of the teleconference client locations includes a howl detector.
- a teleconference device that includes such a howl detector may be referred to herein as a howl-detection-enabled teleconference device at a teleconference client location.
- the howl-detection-enabled teleconference device may be configured to detect a howl state.
- the howl-detection-enabled teleconference device (or another device at the teleconference client location) may be configured to mitigate the howl state.
- no teleconference server involvement may be required for detecting and/or mitigating the howl state.
- a teleconference device at a teleconference client location may perform a howl feature extraction process on at least some of the teleconference audio data received by the teleconference device.
- the howl feature extraction process may yield howl feature data.
- the characteristics of the howl feature data may vary according to the details of the howl feature extraction process of a particular implementation.
- the howl feature data may include one or more features corresponding with a power-based metric, a spectral resonance metric, an inter-percentile range metric, an event aggregation, a periodicity metric, envelope similarity, a spectral peakiness metric, and/or a howl presence probability.
- the teleconference device may send at least some of the howl feature data to the teleconference server.
- the teleconference server may be configured to detect the howl state based, at least in part, on the howl feature data.
- the teleconference server may be configured to determine which client location is causing the howl state based, at least in part, on the client location from which the howl feature data are received.
- Some howl detection methods may involve detecting the short-term spectral structural features of howl, the medium-term spectral-temporal structure features of howl and/or the long-term temporal repeat patterns of howl.
- Such howl detection methods may involve a howl presence probability estimation or a "binary" howl/no howl determination. The detailed discussion below will describe aspects of the following howl detection methods, including:
- the audio signal may be transformed into the frequency domain and the features may be calculated based on frequency domain audio signals.
- some method operates, at least in part, in the time domain.
- Figure 8 is a flow diagram that outlines blocks of howl detection methods according to some implementations.
- the blocks of method 800 may, for example, be implemented by one or more of the devices shown in Figures 3 and 5-7 .
- the blocks of method 800 may be implemented via software stored on one or more non-transitory media.
- the blocks of method 800 like other methods described herein, are not necessarily performed in the order indicated. Moreover, such methods may include more or fewer blocks than shown and/or described.
- method 800 begins with audio data being transformed from the time domain to the frequency domain in block 805.
- the audio data may include teleconference audio data.
- the transformed audio data are divided into frequency bands in block 810.
- the number of frequency bands may vary according to the particular implementation. Some implementations (which may correspond to relatively narrow-band audio data) may involve dividing the transformed audio data into 40 audio bands, whereas other implementations may involve dividing the transformed audio data into 48 audio bands (which may correspond to wideband audio data), into 56 audio bands (which may correspond to super-wideband audio data), or into another number of audio bands.
- block 810 may involve dividing the transformed audio data into logarithmically-spaced bands, whereas other examples may involve dividing the transformed audio data into linearly-spaced bands.
- the transformed and banded audio data are provided to three different howl detection processes: block 815 involves detecting short-term features of spectral structures, block 820 involves detecting medium-term spectral and temporal features and block 825 involves detecting patterns that are repeated over a relatively long term. Examples of each of these howl detection processes are provided below.
- “medium-term” may be a time period of hundreds of milliseconds, e.g., 150 ms, 200 ms, 250 ms, 300 ms, 350 ms, 400 ms, etc.
- “Long-term” means longer than medium-term.
- long-term may be on the order of seconds, such as 1 second, 1.5 seconds, 2 seconds, 2.5 seconds, etc.
- Short-term means shorter than medium-term.
- short-term may correspond to tens of milliseconds, e.g., 10 ms, 20 ms, 30 ms, etc.
- Short-term events may, in some examples, be detectable in an individual frame of audio data.
- Some alternative methods may involve only two of the three types of howl detection processes shown in Figure 8 . Some methods may involve only one of the three types of howl detection processes, e.g., only block 815 or block 820.
- the results from blocks 815, 820 and 825 are all provided to a howl presence probability estimation process in block 830.
- block 830 outputs an indication of howl presence probability.
- Optional post-processing block 835 receives the indication of howl presence probability and outputs a howl binary indicator, which indicates either a howl state or a no-howl state.
- method 800 also may include actions responsive to a howl state, such as mitigating the howl state or sending a howl state detection message.
- a first such metric which is referred to herein as a spectral peakiness measure (SPM) is based on the observation that howl audio usually has very high spectral peaks, with energy concentrated in narrow frequency ranges.
- SPM spectral peakiness measure
- One of the embodiments of the spectral peakiness measure can be seen in Equation (1), below.
- Equation 1 X(k) represents the spectral amplitude of band index k, l represents the index of the frame and K represents the number of the frequency bands.
- SPM is calculated as one minus the ratio between geometric mean of the band power spectrum and the arithmetic mean of the band power spectrum.
- N the block size and T s represents a smoothing time constant.
- the values of N and T s may vary according to the particular implementation and may depend, for example, on the sampling rate and/or the frame length. In some examples wherein the frame length is 20ms, N may be 320 for a 16K sampling rate and 640 for a 32K sampling rate. In other examples, the frame length may be 10ms, 30ms, etc. According to some implementations, Ts may be 0.04s, 0.06s, 0.10s, 0.12s, etc.
- spectral-related measures may be used to characterize a peaky condition of a signal spectrum, such as:
- Another measure of peakiness that may be used for howl state detection may be referred to herein as a "consistent high-peakiness measure based on counter.” These implementations involve detecting, based on the counter, relatively long blocks having a high peakiness signal. In some such implementations, the counter may be released slowly if the signal is not becoming highly peaky.
- P Counter (1) represents the counted number of high-peakiness signals
- P MaxCounter represents the maximum counter value when long blocks with high peakiness signal are observed
- SP ⁇ M Th represents a threshold for determining a condition of high-peakiness
- SP ⁇ M DownTh represents a threshold of declining SPM (l)
- P CounterDown represents a step for decrementing the counter.
- SPM_Th may be 0.85, 0.88, 0.90, etc.
- SPM_DownTh may be 0.05, 0.08, 0.10, etc.
- P_CounterDown may be 0.2, 0.5, 1.0, etc.
- the value of P_CounterDown may depend, for example, on a desired release time.
- Inter-percentile range (IPR) metrics may be used to detect the contrast between band power in a current frame. Howl audio usually has very high IPR compared with speech and noise signals.
- k represents the index of the band
- l represents the index of the frame.
- the corresponding order statistics version of band power may be denoted as B(t, 1), B(2, 1), ... B(K,l), respectively, where: B 1 l ⁇ B 2 l ⁇ ... ⁇ B K l
- IPR l B r l ⁇ B ⁇ l
- Percentile Th 80.
- Percentile Th may be 82, 85, etc.
- N represents the block size
- T S represents a smoothing time constant.
- the values of N and T s may vary according to the particular implementation and may depend on the sampling rate and/or the frame length. In some examples wherein the frame length is 20ms, N may be 320 for a 16K sampling rate and 640 for a 32K sampling rate. In other examples, the frame length may be 10ms, 30ms, etc. According to some implementations, Ts may be 0.04s, 0.06s, 0.10s, 0.12s, etc. Weighting Functions for IPR
- some type of weighting function(s) may be used for IPR metrics. Using a well-chosen weighting function can increase the discriminative ability of the original IPR measure.
- the input level may be determined before automatic gain control (AGC) is applied.
- inLeveldB represents the input level of a signal.
- inLeveldB may represent the input level of a signal before AGC is applied.
- inLeveldB may represent the input level of a signal after AGC is applied.
- LowTh -60 dB
- HighTh -30dB. It will be appreciated that the values of LowTh and HighTh may vary according to the particular implementation.
- IPR Counter l ⁇ min IPR MaxCounter , IPR Counter l + IP R ⁇ Comb l > I P ⁇ R Th , max 0 , IPR Counter l ⁇ IPR CounterDown , if IP R ⁇ Comb l ⁇ I P ⁇ R Th ⁇ I P ⁇ R DownTh otherwise
- IPR Counter ( l ) represents the counter of the high-IPRComb signal
- IPR MaxCounter represents the maximum counter when long blocks with high IPRComb signals are observed
- IPR Th represents the threshold of the high-IPRComb metric
- IPR CounterDown represents the step of the declining counter.
- IPR_Th may be 12, 15, 18, 20, etc.
- An example of "long blocks" is a block on the order of 10 or 20 frames, the time duration of which will depend on the frame length. For example, if the frame length is 20ms, a block on the order of 10 or 20 frames would correspond to a time duration of 200 to 400 milliseconds. Accordingly, this metric provides an example of a process that may occur in block 820 of Figure 8 .
- the medium-term event-based counter may detect repeating patterns of the spectral structure of howl audio during the medium term.
- Event Counter (l) represents the counter of the medium-term howl event
- Event MaxCounter represents the maximum counter of medium-term howl events
- Event CounterDown represents the step of the declining event counter.
- the counter is used to detect repeating patterns of the spectral structure of howl in the medium term.
- the maximum counter represents the highest possible likelihood of howl presence, e.g., 1.
- CounterDown represents the step size for decreasing the counter. When the counter value decreases, this indicates that the likelihood of howl presence is declining.
- ⁇ ( k,l ) is essentially an entropy measure of a normalized short-term spectrum computed at band k over R consecutive frames, ending at the l th frame.
- the signal variability measure LTSV is the sample variance of entropies (computed according to Equation 14) for K bands.
- This metric is another example of a process that could correspond to block 825 of Figure 8 .
- the inventors have observed that howl in a teleconferencing context often shows long-term repeated patterns that may, for example, occur over a period of two or more seconds.
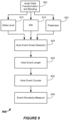
- Figure 9 is a flow diagram that shows example blocks of a howl event periodicity detection method.
- the blocks of method 900 may, for example, be implemented by one or more of the devices shown in Figures 3 and 5-7 .
- the blocks of method 900 may be implemented via software stored on one or more non-transitory media.
- the blocks of method 900 like other methods described herein, are not necessarily performed in the order indicated. Moreover, such methods may include more or fewer blocks than shown and/or described.
- method 900 begins with received audio data being transformed from the time domain to the frequency domain in block 905.
- the audio data may include teleconference audio data.
- the transformed audio data are also divided into frequency bands in block 905.
- block 910 involves a "delta level" process for determining whether there is a level increase that is characteristic of a howl event. In some examples, this level increase threshold may be 20dB, 25dB, 30dB, etc.
- block 915 involves evaluating IPR. Block 915 may, for example, involve one or more types of IPR calculation methods such as those described above.
- block 920 involves one or more types of peakiness detection, which can represent the spectral structure of the howl event onset. Block 920 may involve one or more of the peakiness detection methods described above.
- howl onset detection metrics output from the processes of blocks 910-920 are provided to a howl event onset detection process in block 925.
- the howl onset detection metrics output from the processes of blocks 910-920 are given equal weight during the howl event onset detection process, whereas in other examples one of the metrics may be given more weight than others.
- a howl event onset detection indication is input to the process of block 930, wherein the howl event length is determined.
- one or more howl event detection methods may be invoked, e.g., one or more of the short-term howl event detection methods that are disclosed herein.
- method 900 proceeds to a howl event counter process (block 935).
- a result of the howl event counter process (which may include a detected howl event number) is provided to the event periodicity measuring process(es) of block 940.
- EventCount represents a detected howl event number
- EventNumTh represents a threshold of the howl event presence number
- Periodicity Step represents an increased step of periodicity.
- EventNumTh is 2 and Periodicity Step is 0.5.
- EventNumTh may be 1.5, 1.8, etc.
- Periodicity Step may be 0.4, 0.6, etc.
- ⁇ smooth represents a smoothing coefficient.
- ⁇ smooth may be 0.85, 0.9, 0.95, etc.
- Some implementations involve determining a long-term periodicity metric that is based on audio signal levels.
- the inventors have observed that the amplitude modulation spectrum of howl events in a teleconferencing context often shows a long-term repeated pattern.
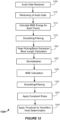
- Figure 10 is a flow diagram that shows example blocks of another method of measuring howl event periodicity.
- the blocks of method 1000 may, for example, be implemented by one or more of the devices shown in Figures 3 and 5-7 .
- the blocks of method 1000 may be implemented via software stored on one or more non-transitory media.
- the blocks of method 1000 like other methods described herein, are not necessarily performed in the order indicated. Moreover, such methods may include more or fewer blocks than shown and/or described.
- method 1000 begins with audio data being received in block 1005.
- the audio data may include teleconference audio data.
- the received audio data are provided to block 1010.
- block 1010 involves evaluating level information in audio data according to a sliding time window.
- the sliding time window may be 128 frames of audio data. In other examples, the sliding time window may be longer or shorter.
- the level information may be determined prior to an AGC process.
- the results of block 1010 are provided to block 1015, which involves a process of modulation spectrum analysis.
- block 1015 involves fast Fourier transform (FFT) calculations.
- FFT fast Fourier transform
- the modulation spectrum analysis of block 1015 may involve a Fourier transform of the long-term level information in the sliding time window.
- the results of block 1015 are provided to the peak picking process of block 1020.
- the peak value of the modulation spectrum is selected in block 1020 because the peak value represents periodicity information.
- a periodicity measure may then be determined in block 1025, based on the results of block 1020.
- a peak level selected in block 1020 may indicate the onset of a howl event.
- a corresponding peak level may be identified later in time and may be correlated with the earlier peak level.
- a global howl presence probability may be determined.
- Figure 11 is a flow diagram that shows blocks of a howl presence probability determination method according to one example.
- the blocks of method 1100 may, for example, be implemented by one or more of the devices shown in Figures 3 and 5-7 .
- the blocks of method 1100 may be implemented via software stored on one or more non-transitory media.
- the blocks of method 1100 like other methods described herein, are not necessarily performed in the order indicated. Moreover, such methods may include more or fewer blocks than shown and/or described.
- block 1105 may involve other processes according to the particular implementation, such as receiving audio data, transforming the audio data to the frequency domain, banding, etc.
- block 1110 involves determining whether a number of howl events has exceeded a first howl event counter threshold, which also may be referred to as a medium-term event counter high threshold.
- the medium-term event counter high threshold may be 10, 12, 13, etc. If it is determined in block 1110 that the number of howl events has exceeded the first howl event counter threshold, the process continues to block 1115.
- the process continues to block 1150, wherein it is determined whether a number of howl events is less than a second howl event counter threshold, which also may be referred to as a medium-term event counter low threshold.
- a second howl event counter threshold which also may be referred to as a medium-term event counter low threshold.
- the medium-term event counter low threshold may be 5, 6, 7, etc. If it is determined in block 1150 that the number of howl events is less than the second howl event counter threshold, the process continues to block 1155, which involves reducing the current howl presence probability (HPP).
- HPP current howl presence probability
- block 1155 involves multiplying the current HPP value by HPP_Clear, which is a constant for reducing the HPP value quickly if the probability of a false alarm is high.
- HPP_Clear may be 0.1, 0.2, 0.3, etc.
- block 1160 involves setting the current HPP value to the greater of zero or the value of (HPP(l) [the current HPP value] - HPP_Down).
- HPP_Down is a constant for reducing the value of HPP.
- the value of HPP_Down may be 0.02, 0.03, 0.04, etc.
- block 1115 involves evaluating signal variability.
- block 1115 involves determining whether the long-term signal variability (LTSV) is greater than an LTSV threshold value, denoted LTSV_Th1 in Figure 11 .
- LTSV_Th1 the long-term signal variability
- the value of LTSV_Th1 may be 0.15, 0.2, 0.25, etc. If it is determined in block 1115 that LTSV is not greater than LTSV_Th1, the process proceeds to block 1150. However, if it is determined in block 1115 that the LTSV is greater than LTSV_Th1, the process continues to block 1120.
- block 1120 involves determining whether one or more level values of the audio input data exceed a threshold.
- the level value(s) may be determined prior to an AGC process.
- block 1120 involves determining whether InLeveldB>Level_Th1.
- the value of LTSV_Th1 may be -60Db, -65Db, -70Db, etc. If it is determined in block 1120 that InLeveldB is not greater than LTSV_Th1, the process proceeds to block 1150. However, if it is determined in block 1120 that InLeveldB>Level_Th1, the process continues to block 1125 in this example.
- block 1125 involves setting the current HPP value to the lesser of 1 or the sum of the current HPP value and the "raw" howl probability, which may in some examples be determined according to Equation 21. The process then proceeds to block 1130.
- block 1130 involves determining whether a howl event periodicity metric is less than a first howl event periodicity threshold, which is denoted Periodicity_Thl in Figure 11 .
- the value of Periodicity_Th1 may be 0.2, 0.3, 0.4, 0.5, etc. If it is determined in block 1130 that the howl event periodicity metric is less than Periodicity_Th1, the process continues to block 1135.
- block 1135 involves reducing the current HPP. In this example, block 1135 involves multiplying the current HPP value by HPP_Clear.
- block 1140 involves determining whether the howl event periodicity metric is greater than a second howl event periodicity threshold, which is denoted Periodicity _Th2 in Figure 11 .
- the value of Periodicity_Th2 may be 0.80, 0.85, 0.90, etc.
- the process continues to block 1145.
- block 1145 involves setting the current HPP value to the lesser of 1 or the sum of the current HPP value and a constant that is denoted HPP_Up in Figure 11 .
- HPP_Up is a value used to incrementally increase the current value of HPP. In some examples, the value of HPP_Up may be 0.1, 0.15, 0.2, etc.
- An HPP value may be output after the foregoing processes have been completed. Although this is not shown in Figure 11 , the process may continue as additional howl events are detected.
- an HPP value may be determined according to one or more other methods.
- an HPP value may be determined according to a machine learning based method such as regression a decision tree method, an Adaptive Boosting algorithm, a Gaussian Mixture Model, a Hidden Markov Model or a deep neural network.
- Vth represents a voting ratio threshold, which may vary according to the particular implementation. In some examples, Vth may be 0.5, 0.6, 0.7, etc.
- a median filter method may be used for further binary decision smoothing.
- M represents a length of a median filter window. In some examples, M may be in the range of 3, 4, 5, etc.
- Figure 12 is a flow diagram that shows example blocks of a method of determining signal envelope similarity.
- the blocks of method 1200 may, for example, be implemented by one or more of the devices shown in Figures 3 and 5-7 .
- the blocks of method 1200 may be implemented via software stored on one or more non-transitory media.
- the blocks of method 1200 like other methods described herein, are not necessarily performed in the order indicated. Moreover, such methods may include more or fewer blocks than shown and/or described.
- method 1200 begins with audio data being received in block 1205.
- the audio data may include teleconference audio data.
- the received audio data are provided to block 1210 without a transformation to the frequency domain.
- block 1210 involves windowing of the time-domain audio signal.
- the frame length is 10ms and the time-domain audio signal is first windowed via a Hamming window having a window length of 20ms.
- the type of windowing process and the window length may vary according to the particular implementation.
- a Hanning window may be applied.
- the window size may be 25ms, 30ms, etc.
- the process then continues to block 1212, wherein the RMS energy for each frame is calculated.
- the median filtering operation may involve sorting the RMS energy and selecting values in the 50 th percentile.
- the results of block 1215 are provided to block 1220.
- block 1220 involves, for the smoothed RMS envelope, a peak-picking method that is used to find the RMS peaks.
- the peak-picking method may, in some examples, selecting local maximum RMS values.
- the blocks between two adjacent peaks are extracted and then the length of the remaining blocks is calculated. This length may be used as a constraint condition for envelope periodicity in some implementations.
- Equations 27 and 28 vrms1 and vrms2 represent two adjacent blocks among three peaks.
- the mean square error (MSE) of the smooth RMS of two blocks is then calculated in block 1230.
- block 1235 follows, in order to alleviate the fluctuation of MSE among peaks.
- block 1235 involves a median filtering process to obtain smoothed MSE values.
- the inventors have observed that the length of corresponding howl events in a teleconferencing context may be very similar. By using the lengths of blocks corresponding to howl events, one can construct a kind of constraint rule that may be applied to the smoothed MSE values. In this way, one can obtain final MSE values.
- constraint rules are then applied in block 1240.
- the constraint rules may be based, at least in part, on the maximum length and the ratio of len1 and len2, where len1 and len2 represent the lengths of the above-referenced vrms1 and vrms2, respectively. If the maximum length is too long or the ratio is too small or too big, this may indicate that the difference between len1 and len2 is too large. Therefore, according to some examples, the MSE values may be increased. If the ratio nearly equals to 1, and the ratios over several blocks (for example, over 4 or 5 blocks) are nearly equal to 1, this may indicate that the envelopes have strong similarity. Therefore, according to some such examples, the MSE values may be decreased.
- a binary indication of howl events may then be derived in block 1245.
- the threshold for MSE values may be small, e.g., 0.015, 0.02, 0.025, 0.03, etc.
- the output may be 1 for a howl event and 0 for a non-howl event.
- Equation 30 A represents energy.
- an audio signal may be windowed and then transformed to the frequency domain, e.g., by using an FFT or a modified discrete cosine transform.
- Equation 31 X [ k ] represents a coefficient in the frequency domain, k represents the frequency index and N represents the frame length.
- N represents the length of the moving average filter, the value of which may differ according to the implementation. In some examples, the value of N may be 3, 5, 7, etc. According to some implementations, the peaks of the envelope may then be picked and the MSE values may be calculated. In some examples, these processes may be performed as described above with reference to blocks 1220-1245 of Figure 12 .
- One implementation of determining sub-band domain envelope similarity may start by windowing a received audio signal and then transforming the audio signal to the frequency domain, e.g., by using an FFT or a modified discrete cosine transform.
- the resulting broad-band signal may be divided into sub-bands, e.g., according to psychoacoustic principles.
- the number of sub-bands may, for example, be based on the sampling rate of the broad-band signal. In one example involving a 16kHz sampling rate, the broad-band signal may be divided into 48 sub-bands. In other examples involving a 32kHz sampling rate, the broad-band signal may be divided into 56 or 64 sub-bands.
- the process may then proceed substantially as described in the preceding section.
- some examples of this method may involve outputting not only binary non-howl or howl event indications (e.g., 1 and 0), but also outputting an indication of uncertainty (e.g., 0.5) in the howl event determination.
- a howl event may be mixed with a speech signal and this may result in an ambiguous howl event determination result.
- Figure 13 is a flow diagram that outlines blocks of howl detection methods according to some implementations.
- the blocks of method 1300 may, for example, be implemented by one or more of the devices shown in Figures 3 and 5-7 .
- the processes that are referenced by the blocks of Figure 13 may be performed according to any of the corresponding above-described methods.
- the blocks of method 1300 may be implemented via software stored on one or more non-transitory media.
- the blocks of method 1300 like other methods described herein, are not necessarily performed in the order indicated. Moreover, such methods may include more or fewer blocks than shown and/or described.
- method 1300 begins with audio data being transformed from the time domain to the frequency domain in block 1305.
- the audio data may include teleconference audio data.
- the transformed audio data are divided into frequency bands in block 1310.
- the transformed and banded audio data are provided to four different howl detection processes: according to this implementation, block 1315 involves detecting spectral peakiness, block 1320 involves determining IPR, block 1325 involves determining signal level before AGC is applied to the audio data and block 1330 involves a spectral entropy determination process.
- the results of block 1315, 1320 and 1325 are provided to the IPRComb block, which in turn provides input to the High IPRComb Consistency Measure block 1345.
- the results of block 1315 are also provided to the High Peakiness Consistency Measure block 1340.
- the results of block 1330 are also provided to the Long-Term Signal Variability block 1350.
- the results of blocks 1325, 1340, 1345, 1350 and 1355 are provided to the Howl Presence Probability Determination block 1360.
- block 1360 outputs a measure of howl presence probability, which is also referred to herein as HPP.
- block 1360 also provides input to Post-Processing block 1365, which outputs a binary howl/no howl indication.
- method 1300 may involve mitigating a howl state or sending a howl state detection message.
Landscapes
- Engineering & Computer Science (AREA)
- Multimedia (AREA)
- Signal Processing (AREA)
- Physics & Mathematics (AREA)
- Health & Medical Sciences (AREA)
- Acoustics & Sound (AREA)
- Computational Linguistics (AREA)
- Audiology, Speech & Language Pathology (AREA)
- Human Computer Interaction (AREA)
- Otolaryngology (AREA)
- General Health & Medical Sciences (AREA)
- Telephonic Communication Services (AREA)
- Circuit For Audible Band Transducer (AREA)
- Telephone Function (AREA)
Description
- This application claims priority to International Patent Application No.
PCT/CN2017/104604, filed September 29, 2017 United States Provisional Application No. 62/575,701, filed October 23, 2017 European Patent Application No. 17201011.8, filed November 10, 2017 - This disclosure relates to the processing of audio signals. In particular, this disclosure relates to processing audio signals related to teleconferencing or video conferencing.
- Acoustic feedback is a type of feedback that occurs when a sound loop exists between an audio input (e.g., a microphone) and an audio output (for example, a loudspeaker). For example, a signal received by the microphone may be amplified and reproduced by the loudspeaker. The reproduced sound from the loudspeaker may then be received by the microphone again, amplified further, and then reproduced by the loudspeaker again at a higher amplitude or volume level. In this type of system, the sound of the acoustic feedback may be a loud screech or squeal, which may be referred to herein as a "howl." In some instances, guitarists and other performers may intentionally create howl (e.g., between a guitar pickup and a loudspeaker) in order to produce desired musical effects. Although some methods have proven to successfully detect and mitigate unintentionally-produced howl, this problem has proven to be more difficult to solve in the context of teleconferencing.
- The present invention, defined in the appended independent claims, brings a solution to the above-mentioned technical issues. Optional aspects of the invention are defined in the dependent claims.
- Details of one or more implementations of the subject matter described in this specification are set forth in the accompanying drawings and the description below. Other features, aspects, and advantages will become apparent from the description, the drawings, and the claims. Note that the relative dimensions of the following figures may not be drawn to scale.
-
-
Figure 1 shows examples of teleconference devices during a teleconference involving two teleconference client locations. -
Figure 2 shows graphs, in the time and frequency domains, of an example of a howl state that may involve two or more teleconference devices in a teleconference client location. -
Figure 3 is a block diagram that shows examples of components of an apparatus that may be configured to perform at least some of the methods disclosed herein. -
Figure 4 is a flow diagram that outlines blocks of a method according to one example. -
Figure 5 shows teleconference client device and teleconference server configurations according to one implementation. -
Figure 6 shows teleconference client device and teleconference server configurations according to another implementation. -
Figure 7 shows teleconference client device and teleconference server configurations according to still another implementation. -
Figure 8 is a flow diagram that outlines blocks of howl detection methods according to some implementations. -
Figure 9 is a flow diagram that shows example blocks of a howl event periodicity detection method. -
Figure 10 is a flow diagram that shows example blocks of another method of measuring howl event periodicity. -
Figure 11 is a flow diagram that shows blocks of a howl presence probability determination method according to one example. -
Figure 12 is a flow diagram that shows example blocks of a method of determining signal envelope similarity. -
Figure 13 is a flow diagram that outlines blocks of howl detection methods according to some implementations. - Like reference numbers and designations in the various drawings indicate like elements.
- The following description is directed to certain implementations for the purposes of describing some innovative aspects of this disclosure, as well as examples of contexts in which these innovative aspects may be implemented. However, the teachings herein can be applied in various different ways. Moreover, the described embodiments may be implemented in a variety of hardware, software, firmware, etc. For example, aspects of the present application may be embodied, at least in part, in an apparatus, a system that includes more than one device, a method, a computer program product, etc. Accordingly, aspects of the present application may take the form of a hardware embodiment, a software embodiment (including firmware, resident software, microcodes, etc.) and/or an embodiment combining both software and hardware aspects. Such embodiments may be referred to herein as a "circuit," a "module" or "engine." Some aspects of the present application may take the form of a computer program product embodied in one or more non-transitory media having computer readable program code embodied thereon. Such non-transitory media may, for example, include a hard disk, a random access memory (RAM), a read-only memory (ROM), an erasable programmable read-only memory (EPROM or Flash memory), a portable compact disc read-only memory (CD-ROM), an optical storage device, a magnetic storage device, or any suitable combination of the foregoing. Accordingly, the teachings of this disclosure are not intended to be limited to the implementations shown in the figures and/or described herein, but instead have wide applicability.
-
Figure 1 shows examples of teleconference devices during a teleconference involving two teleconference client locations. In this example, a teleconference server is configured for providing audio connectivity (which may be full-duplex audio connectivity) between ateleconference client device 100a inteleconference client location 1 andteleconference client devices teleconference client location 2. Here, theteleconference client devices teleconference client device 100b is a laptop. - According to this example,
teleconference client devices teleconference client devices end talker 2. Accordingly, the teleconference server provides teleconference audio data toteleconference client device 100b corresponding to the speech of near-end talker 2 received byteleconference client device 100c, and also provides teleconference audio data toteleconference client device 100c corresponding to the speech of near-end talker 2 received byteleconference client device 100b. - The speakers of
teleconference client devices end talker 2 after a time delay corresponding with the round-trip time for the teleconference audio data to be transmitted from theteleconference client location 2 to the teleconference server and back. When the speakers ofteleconference client device 100b reproduce the speech of near-end talker 2, the microphones ofteleconference client device 100c detect the reproduced speech of near-end talker 2. Likewise, when the speakers ofteleconference client device 100c reproduce the speech of near-end talker 2, the microphone(s) ofteleconference client device 100b detect the reproduced speech of near-end talker 2. - Therefore, a howl state can be triggered by the speech of near-
end talker 2 inteleconference client location 2. However, the howl state has at least some characteristics that would not be present if theteleconference client devices -
Figure 2 shows graphs, in the time and frequency domains, of an example of a howl state that may involve two or more teleconference devices in a teleconference client location.Graph 205 is in the time domain, with time represented by the horizontal axis and level, in dB, represented by the vertical axis. Graph 205 showshowl events 210a-210f. The time during which thehowl events 210a-210f are taking place may be referred to herein as a "howl state." - It may be observed that the
howl events 210a-210f are periodic, or quasi-periodic, and that they increase in amplitude over time. In this example, the periodicity of thehowl events 210a-210f corresponds with a time delay corresponding with the round-trip time for the teleconference audio data to be transmitted from a teleconference client location to a teleconference server and back. It also may be observed that the level of speech events (to the left of thehowl events 210a-210f) is lower than that of thehowl events 210a-210f. - Graph 215 represents the same audio data, including the
howl events 210a-210f, in the frequency domain. It may be observed fromgraph 215 that most of the energy of thehowl events 210a-210f is concentrated in relatively narrow frequency bands. - Based on many observations made by the inventors, including the data in
graphs - The resonance frequencies of the howl events include spectral peaks in single or multiple bands;
- Howl events generally have a higher amplitude than that of speech;
- Howl events are generally periodic or quasi-periodic in nature and are highly localized in frequency; and
- The characteristics of howl events have a consistency across time.
- Other characteristics of a howl state are described below. As noted above, the howl state has at least some characteristics that would not be present if the devices involved in producing the howl state were not participating in a teleconference. For example, acoustic feedback between a microphone and a speaker of a public address audio system may occur when the microphone is too close to the loudspeaker and/or when the amplification is too large. Such acoustic feedback would generally manifest as a single and continuous howl event, not as a plurality of discontinuous and periodically-occurring howl events. In contrast to acoustic feedback in a public address system context, acoustic feedback in a duplex communication use case may span different networks and different devices. The round-trip time is usually larger than 300ms, and may be in the range of 500 ms to a second or more. Accordingly, acoustic feedback detection and mitigation in a teleconferencing context may be very different from acoustic feedback detection and mitigation in a public address system context, where the feedback is caused in the same microphone-amplifier-loudspeaker system.
- In view of the above-described observations, some aspects of the present disclosure can provide improved methods for detecting a howl state during a teleconference.
Figure 3 is a block diagram that shows examples of components of an apparatus that may be configured to perform at least some of the methods disclosed herein. In some examples, theapparatus 305 may be a teleconferencing server. In other examples, theapparatus 305 may be a teleconference client device. The components of theapparatus 305 may be implemented via hardware, via software stored on non-transitory media, via firmware and/or by combinations thereof. The types and numbers of components shown inFigure 3 , as well as other figures disclosed herein, are merely shown by way of example. Alternative implementations may include more, fewer and/or different components. For example, if theapparatus 305 is a teleconferencing client device, theapparatus 305 may include one or more microphones, one or more speakers, etc. - In this example, the
apparatus 305 includes aninterface system 310 and acontrol system 315. Theinterface system 310 may include one or more network interfaces, one or more interfaces between thecontrol system 315 and a memory system and/or one or more external device interfaces (such as one or more universal serial bus (USB) interfaces). In some implementations, theinterface system 310 may include a user interface system. The user interface system may be configured for receiving input from a user. In some implementations, the user interface system may be configured for providing feedback to a user. For example, the user interface system may include one or more displays with corresponding touch and/or gesture detection systems. In some examples, the user interface system may include one or more speakers. According to some examples, the user interface system may include apparatus for providing haptic feedback, such as a motor, a vibrator, etc. Thecontrol system 315 may, for example, include a general purpose single- or multi-chip processor, a digital signal processor (DSP), an application specific integrated circuit (ASIC), a field programmable gate array (FPGA) or other programmable logic device, discrete gate or transistor logic, and/or discrete hardware components. - In some examples, the
apparatus 305 may be implemented in a single device. However, in some implementations, theapparatus 305 may be implemented in more than one device. In some such implementations, functionality of thecontrol system 315 may be included in more than one device. In some examples, theapparatus 305 may be a component of another device. For example, in some implementations theapparatus 305 may be a component of a server, e.g., a line card. -
Figure 4 is a flow diagram that outlines blocks of a method according to one example. The method may, in some instances, be performed by the apparatus ofFigure 3 or by another type of apparatus disclosed herein. In some examples, the blocks ofmethod 400 may be implemented via software stored on one or more non-transitory media. - In this implementation, block 405 involves detecting a howl state during a teleconference. According to this example, the teleconference involves two or more teleconference client locations and a teleconference server configured for providing full-duplex audio connectivity between the teleconference client locations. Here, the howl state is a state of acoustic feedback involving two or more teleconference devices in a teleconference client location.
- In this example, detecting the howl state involves an analysis of both spectral and temporal characteristics of teleconference audio data. Depending on the particular implementation, detecting the howl state may involve calculating a power-based metric according to order statistics of frequency bands, calculating a spectral resonance metric, calculating an inter-percentile range metric, event aggregation, calculating a periodicity metric, detecting envelope similarity, calculating a spectral peakiness metric, a machine-learning-based process and/or estimating a howl presence probability. The terms "metric" and "measure" may be used synonymously herein. In some examples, detecting the howl state may, for example, involve estimating a howl presence probability according to the teleconference audio data. The howl presence probability estimation may be based on a hierarchical rule set or a machine learning method. Detecting the howl state may be based, at least in part, on the howl presence probability. Various examples are described in detail below.
- In some instances, the teleconference server may detect the howl state in
block 405. However, in some implementations a howl-detection-enabled teleconference device at a teleconference client location may detect the howl state inblock 405. - In this example, block 410 involves determining which client location is causing the howl state. In some instances, the teleconference server may determine which client location is causing the howl state in
block 410. - However, in some implementations a howl-detection-enabled teleconference device at a teleconference client location may determine which client location is causing the howl state in
block 410. The howl-detection-enabled teleconference device may, in some instances, determine that the howl-detection-enabled teleconference device itself, or another teleconference device at the same teleconference client location, it causing the howl state. -
Optional block 415 involves mitigating the howl state or sending a howl state detection message. According to some examples, the teleconference server may send the howl state detection message to the client location that is causing the howl state inblock 415. In some implementations, mitigating the howl state may involve detecting one or more peak frequency bands of the howl state and applying one or more notch filters corresponding to the one or more peak frequency bands. In some examples, mitigating the howl state may involve muting one or more microphones at the client location that is causing the howl state and/or lowering a speaker volume at the client location that is causing the howl state. In some implementations, a howl-detection-enabled teleconference device at the client location that is causing the howl state may be configured to mitigate the howl state. -
Figure 5 shows teleconference client device and teleconference server configurations according to one implementation. In this example, the teleconference server is configured to detect the howl state based, at least in part, on teleconference audio data received from the teleconference client locations. Here,teleconference client locations 1 through M are participating in a teleconference. - In the example shown in
Figure 5 , the teleconference server includeshowl detectors 1 through M, each howl detector corresponding with a teleconference client location or a teleconference client device at a client location. According to this implementation, each of thehowl detectors 1 through M is configured for detecting a howl state during a teleconference. In this example, the teleconference server also includes a howl client detector configured for determining which client location is causing the howl state. - Here, each of the
howl detectors 1 through M is configured for sending a howl state signal to the howl client detector after detecting a howl state. In this implementation, the howl client detector may determine which client location is causing the howl state according to the howl detector from which the howl state signal is received. The teleconference server may be configured for mitigating the howl state and/or sending a howl state detection message to the teleconference client location causing the howl state. - The howl detectors and the howl client detector shown and described herein, including but not limited to those shown in
Figure 5 , may be implemented in various ways according to the particular implementation. For example, the howl detectors and the howl client detector may be implemented as part of a control system such as that shown inFigure 3 and described above. In some examples, the howl detectors and the howl client detector may be implemented via hardware, via software (which may include firmware, resident software, microcodes, etc.) and/or in an embodiment combining both software and hardware aspects. Such embodiments may be referred to herein as a "circuit," a "module" or "engine." In some implementations, the howl detectors and the howl client detector may be implemented via a computer program product embodied in one or more non-transitory media having computer readable program code embodied thereon. Such non-transitory media may, for example, include a hard disk, a random access memory (RAM), a read-only memory (ROM), an erasable programmable read-only memory (EPROM or Flash memory), a portable compact disc read-only memory (CD-ROM), an optical storage device, a magnetic storage device, or any suitable combination of the foregoing. -
Figure 6 shows teleconference client device and teleconference server configurations according to another implementation. In this example, the teleconference server is configured to detect the howl state based, at least in part, on teleconference audio data received from theteleconference client locations 1 through M, which are participating in a teleconference. In the example shown inFigure 6 , the teleconference server includes a mixer that is configured to mix the teleconference audio data received from theteleconference client locations 1 through M and to output a teleconference audio data mix to the howl detector. In this implementation, the howl detector is configured to detect a howl state based on the teleconference audio data mix. - This type of implementation has potential advantages as compared to the type of implementation shown in
Figure 5 , in that multiple howl detectors are not required. Accordingly, this type of implementation can provide relatively lower computational overhead, less power consumption, etc., as compared to the type of implementation shown inFigure 5 . - As in the previous example, the teleconference server shown in
Figure 6 also includes a howl client detector that is configured for determining which client location is causing the howl state. The teleconference server may be configured for mitigating the howl state and/or sending a howl state detection message to the teleconference client location causing the howl state. - Because there is only one howl detector in this example, the howl client detector cannot determine which client location is causing the howl state according to the howl detector from which the howl state signal is received. Therefore, according to some such implementations, the teleconference server may receive teleconference metadata from each of the
teleconference client locations 1 through M participating in the teleconference. In some examples, the teleconference metadata may include voice activity detection metadata, level metadata and/or energy metadata. The howl client detector may be configured to determine which client location is causing the howl state based, at least in part, on the teleconference metadata. For example, in some instances the howl client detector may be configured to determine which client location is causing the howl state based, at least in part, on voice activity detection metadata indicating which teleconference client location has a teleconference participant who is currently speaking. This is a reasonable assumption because throughout most of a teleconference or other conversation, one person is talking at a time. - Some implementations may provide a howl client detection algorithm, which also may be referred to as a "blame" algorithm, to correlate regions of howl to a particular teleconference client based on howl detection result in the server and each teleconference client's metadata information received by the teleconference server. In one example, the "blame" algorithm may be as follows:
- Run the howl detector on the teleconference audio data mix, which may be represented as xsum(n) = sum (xm(n)), wherein n represents the frame number and xm(n) represents a signal denoting the level of the mth teleconference client.
- When the howl detector observes a probability of a howl event that exceeds a threshold probability:
- ∘ Select the current teleconference client(s) whose VAD = True;
- ∘ Run a cross correlation Rm(n) between the mixed signal xsum(n) and the mth teleconference client xm(n), such as Rm(n) = alpha*Rm(n) + (1-alpha)*Rm(n-1). The value of alpha may vary according to the particular implementation. The value of alpha may, for example, depend on the frame rate and/or on a desired length of time for retaining past values of Rm. In some examples, alpha may be 0.95, 0.96, 0.97, 0.98, 0.99, etc. According to some implementations Rm(n) may be smoothed, e.g., with a 1-pole smoothing filter having a time constant in the order of one or more seconds. This smoothing process will retain correlation information for a relatively longer period of time.
- Choose the maximum of all Rm(n), which should correspond to the teleconference client m whose level signal is most correlated to the mixed signal. This mth client becomes the detected teleconference client (or client location) that is causing the howl state.
-
Figure 7 shows teleconference client device and teleconference server configurations according to still another implementation. In this example, each of the teleconference client locations includes a howl detector. A teleconference device that includes such a howl detector may be referred to herein as a howl-detection-enabled teleconference device at a teleconference client location. In some examples, the howl-detection-enabled teleconference device may be configured to detect a howl state. In some such examples, the howl-detection-enabled teleconference device (or another device at the teleconference client location) may be configured to mitigate the howl state. According to some such examples, no teleconference server involvement may be required for detecting and/or mitigating the howl state. - However, in some alternative implementations, there may nonetheless be some level of teleconference server involvement. According to some such implementations, a teleconference device at a teleconference client location (such as one of the client-side howl detectors shown in
Figure 7 ) may perform a howl feature extraction process on at least some of the teleconference audio data received by the teleconference device. - The howl feature extraction process may yield howl feature data. The characteristics of the howl feature data may vary according to the details of the howl feature extraction process of a particular implementation. For example, the howl feature data may include one or more features corresponding with a power-based metric, a spectral resonance metric, an inter-percentile range metric, an event aggregation, a periodicity metric, envelope similarity, a spectral peakiness metric, and/or a howl presence probability.
- The teleconference device may send at least some of the howl feature data to the teleconference server. According to some such examples, the teleconference server may be configured to detect the howl state based, at least in part, on the howl feature data. The teleconference server may be configured to determine which client location is causing the howl state based, at least in part, on the client location from which the howl feature data are received.
- Various howl detection methods are disclosed herein. Some howl detection methods may involve detecting the short-term spectral structural features of howl, the medium-term spectral-temporal structure features of howl and/or the long-term temporal repeat patterns of howl. Such howl detection methods may involve a howl presence probability estimation or a "binary" howl/no howl determination. The detailed discussion below will describe aspects of the following howl detection methods, including:
- ∘ Order-statistics of a log-domain bands power-based measure may be calculated in order to detect the short-term spectral structures of howl;
- ∘ A spectral resonance measure may be calculated in order to detect the short-term spectral structures of howl;
- ∘ A consistent high inter-percentile range measure may be calculated in order to detect the spectral-temporal structure features of howl;
- ∘ A consistent high resonance measure may be calculated in order to detect the spectral-temporal structure features of howl;
- ∘ Events (such as potential howl events) may be aggregated in order to detect the long-term temporal repeat patterns of howl;
- ∘ Periodicity measure based on modulation spectrum may be analyzed in order to detect the long-term temporal repeat patterns of howl;
- ∘ Envelope similarity may be analyzed in order to detect the long-term temporal repeat patterns of howl;
- ∘ A howl presence probability estimation may be based on a hierarchical rule set (which may be referred to herein as a hierarchical decision tree) including two or more of the above calculations.
- These methods will be described in the following subsections. In some methods, the audio signal may be transformed into the frequency domain and the features may be calculated based on frequency domain audio signals. However, some method operates, at least in part, in the time domain.
-
Figure 8 is a flow diagram that outlines blocks of howl detection methods according to some implementations. The blocks ofmethod 800 may, for example, be implemented by one or more of the devices shown inFigures 3 and5-7 . In some examples, the blocks ofmethod 800 may be implemented via software stored on one or more non-transitory media. The blocks ofmethod 800, like other methods described herein, are not necessarily performed in the order indicated. Moreover, such methods may include more or fewer blocks than shown and/or described. - In this example,
method 800 begins with audio data being transformed from the time domain to the frequency domain inblock 805. The audio data may include teleconference audio data. In this implementation, the transformed audio data are divided into frequency bands inblock 810. The number of frequency bands may vary according to the particular implementation. Some implementations (which may correspond to relatively narrow-band audio data) may involve dividing the transformed audio data into 40 audio bands, whereas other implementations may involve dividing the transformed audio data into 48 audio bands (which may correspond to wideband audio data), into 56 audio bands (which may correspond to super-wideband audio data), or into another number of audio bands. According to some examples, block 810 may involve dividing the transformed audio data into logarithmically-spaced bands, whereas other examples may involve dividing the transformed audio data into linearly-spaced bands. - In this example, the transformed and banded audio data are provided to three different howl detection processes: block 815 involves detecting short-term features of spectral structures, block 820 involves detecting medium-term spectral and temporal features and block 825 involves detecting patterns that are repeated over a relatively long term. Examples of each of these howl detection processes are provided below. In some implementations, "medium-term" may be a time period of hundreds of milliseconds, e.g., 150 ms, 200 ms, 250 ms, 300 ms, 350 ms, 400 ms, etc. "Long-term" means longer than medium-term. For example, "long-term" may be on the order of seconds, such as 1 second, 1.5 seconds, 2 seconds, 2.5 seconds, etc. "Short-term" means shorter than medium-term. For example, "short-term" may correspond to tens of milliseconds, e.g., 10 ms, 20 ms, 30 ms, etc. "Short-term" events may, in some examples, be detectable in an individual frame of audio data.
- Other examples may involve more or fewer howl detection processes. For example, some alternative methods may involve only two of the three types of howl detection processes shown in
Figure 8 . Some methods may involve only one of the three types of howl detection processes, e.g., only block 815 or block 820. - In this example, the results from
blocks block 830. In this example, block 830 outputs an indication of howl presence probability.Optional post-processing block 835 receives the indication of howl presence probability and outputs a howl binary indicator, which indicates either a howl state or a no-howl state. In some implementations,method 800 also may include actions responsive to a howl state, such as mitigating the howl state or sending a howl state detection message. - Examples of howl detection processes and metrics are provided in the following paragraphs.
- These metrics provide examples of the processes of
block 815. A first such metric, which is referred to herein as a spectral peakiness measure (SPM), is based on the observation that howl audio usually has very high spectral peaks, with energy concentrated in narrow frequency ranges. There are many potential spectral-related measures that can be used to characterize the "peaky" condition of signal spectrum. One of the embodiments of the spectral peakiness measure can be seen in Equation (1), below.
- In
Equation 1, X(k) represents the spectral amplitude of band index k, l represents the index of the frame and K represents the number of the frequency bands. In this example, SPM is calculated as one minus the ratio between geometric mean of the band power spectrum and the arithmetic mean of the band power spectrum. - In some examples, the SPM measure of
Equation 1 may be smoothed as follows:
- In
Equation 2,
- In some implementations, other spectral-related measures may be used to characterize a peaky condition of a signal spectrum, such as:
- A spectral crest measure based on a power ratio between the sum of the peak bands and other bands;
- A spectral crest measure based on a peak-to-average band power ratio (in some examples, the average power ratio may be calculated without the peak band(s));
- A variance or standard deviation of the power of adjacent spectral bands;
- A sum or maximum of spectral band power difference among adjacent frequency bands;
- A spectral spread or spectral variance around a spectral centroid; and/or
- A spectral entropy metric.
- Another measure of peakiness that may be used for howl state detection may be referred to herein as a "consistent high-peakiness measure based on counter." These implementations involve detecting, based on the counter, relatively long blocks having a high peakiness signal. In some such implementations, the counter may be released slowly if the signal is not becoming highly peaky. One example of a consistent high-peakiness measure based on a counter is shown in Equation 3:

Equation 3, PCounter (1) represents the counted number of high-peakiness signals, PMaxCounter represents the maximum counter value when long blocks with high peakiness signal are observed, SP̃M Th represents a threshold for determining a condition of high-peakiness, SP̃M DownTh represents a threshold of declining SPM (l) and PCounterDown represents a step for decrementing the counter. The values of SPM_Th, SPM_DownTh and P_CounterDown may vary according to the particular implementation. In some examples, SPM_Th may be 0.85, 0.88, 0.90, etc., SPM_DownTh may be 0.05, 0.08, 0.10, etc., and P_CounterDown may be 0.2, 0.5, 1.0, etc. The value of P_CounterDown may depend, for example, on a desired release time. - Inter-percentile range (IPR) metrics may be used to detect the contrast between band power in a current frame. Howl audio usually has very high IPR compared with speech and noise signals.
- The log domain band power may be expressed as follows: b(k,l) = 10log10(|X(k,l)|2), where k = 1, ...,K; I = 1, ...,N. In this expression, k represents the index of the band and l represents the index of the frame. The corresponding order statistics version of band power may be denoted as B(t, 1), B(2, 1), ... B(K,l), respectively, where:

- One way of expressing IPR is as follows:

- The values of r and κ have been determined by the inventors according to experiments under various howl conditions. In some examples, r = 1 and κ may be expressed as

- In some examples, the original IPR measure may be smoothed, e.g., as follows:

- In
Equation 6, αIPR may be expressed as

- In some implementations, some type of weighting function(s) may be used for IPR metrics. Using a well-chosen weighting function can increase the discriminative ability of the original IPR measure. In some examples, the input level may be determined before automatic gain control (AGC) is applied. In some implementations, the input level and a spectral peakiness metric may be used in a weighting function. Equation 7 provides one such example:

- In Equation 7, inLeveldB represents the input level of a signal. In some examples (which may be examples in which a howl detector is implemented in a teleconference client device), inLeveldB may represent the input level of a signal before AGC is applied. However, in other examples (which may be examples in which a howl detector is implemented in a teleconference server), inLeveldB may represent the input level of a signal after AGC is applied. In one example, LowTh = -60 dB and HighTh = -30dB. It will be appreciated that the values of LowTh and HighTh may vary according to the particular implementation. One corresponding weighting function for IPR can be expressed as follows:

- The IPRComb measure is a weighted version of the above-described IPR measure and may, in some examples, be expressed as follows:

- Another useful metric for howl detection may be referred to as the "Consistent High-IPRComb Measure Based on Counter." This metric can be expressed as follows:

- In Equation 10, IPRCounter (l) represents the counter of the high-IPRComb signal, IPRMaxCounter represents the maximum counter when long blocks with high IPRComb signals are observed, IPRTh represents the threshold of the high-IPRComb metric and IPRCounterDown represents the step of the declining counter. In some examples, IPR_Th may be 12, 15, 18, 20, etc. An example of "long blocks" is a block on the order of 10 or 20 frames, the time duration of which will depend on the frame length. For example, if the frame length is 20ms, a block on the order of 10 or 20 frames would correspond to a time duration of 200 to 400 milliseconds. Accordingly, this metric provides an example of a process that may occur in
block 820 ofFigure 8 . - This metric provides another example of a process that may occur in
block 820. The medium-term event-based counter may detect repeating patterns of the spectral structure of howl audio during the medium term. In one example, the onset of a howl event can be detected based on PCounter (l) and IPRCounter (l), as follows:
- The medium-term event counter may be expressed as follows:

- In
Equation 12, EventCounter (l) represents the counter of the medium-term howl event, EventMaxCounter represents the maximum counter of medium-term howl events and EventCounterDown represents the step of the declining event counter. In this example, the counter is used to detect repeating patterns of the spectral structure of howl in the medium term. Here, if the value of the counter increases, the likelihood of the howl presence also increases. In this example, the maximum counter represents the highest possible likelihood of howl presence, e.g., 1. In this implementation, CounterDown represents the step size for decreasing the counter. When the counter value decreases, this indicates that the likelihood of howl presence is declining. - This metric is an example of a process that could correspond to block 825 of
Figure 8 . In some examples, a smoothed bands power metric may be determined as follows:
- In some implementations, spectral entropy during a time domain analysis window may be expressed as follows:

- η(k,l) is essentially an entropy measure of a normalized short-term spectrum computed at band k over R consecutive frames, ending at the lth frame. According to some examples, a long-term signal variability measure LTSV may be computed as follows:

- In this example, the signal variability measure LTSV is the sample variance of entropies (computed according to Equation 14) for K bands. In Equation (15),

- This metric is another example of a process that could correspond to block 825 of
Figure 8 . The inventors have observed that howl in a teleconferencing context often shows long-term repeated patterns that may, for example, occur over a period of two or more seconds. -
Figure 9 is a flow diagram that shows example blocks of a howl event periodicity detection method. The blocks ofmethod 900 may, for example, be implemented by one or more of the devices shown inFigures 3 and5-7 . In some examples, the blocks ofmethod 900 may be implemented via software stored on one or more non-transitory media. The blocks ofmethod 900, like other methods described herein, are not necessarily performed in the order indicated. Moreover, such methods may include more or fewer blocks than shown and/or described. - In this example,
method 900 begins with received audio data being transformed from the time domain to the frequency domain inblock 905. The audio data may include teleconference audio data. In this implementation, the transformed audio data are also divided into frequency bands inblock 905. - In order to count howl events and determine howl event lengths, some type of howl event onset detection is needed. In this example, the transformed and banded audio data are provided to three different processes for determining howl onset detection metrics. Other implementations may involve determining more or fewer howl onset detection metrics. In this example, block 910 involves a "delta level" process for determining whether there is a level increase that is characteristic of a howl event. In some examples, this level increase threshold may be 20dB, 25dB, 30dB, etc. Here, block 915 involves evaluating IPR.
Block 915 may, for example, involve one or more types of IPR calculation methods such as those described above. According to this implementation, block 920 involves one or more types of peakiness detection, which can represent the spectral structure of the howl event onset.Block 920 may involve one or more of the peakiness detection methods described above. - In this example, howl onset detection metrics output from the processes of blocks 910-920 are provided to a howl event onset detection process in
block 925. In some examples, the howl onset detection metrics output from the processes of blocks 910-920 are given equal weight during the howl event onset detection process, whereas in other examples one of the metrics may be given more weight than others. When the onset of a howl event has been detected, a howl event onset detection indication is input to the process ofblock 930, wherein the howl event length is determined. For example, inblock 930 one or more howl event detection methods may be invoked, e.g., one or more of the short-term howl event detection methods that are disclosed herein. According to this example, after the howl event length has been determined inblock 935,method 900 proceeds to a howl event counter process (block 935). - In this implementation, a result of the howl event counter process (which may include a detected howl event number) is provided to the event periodicity measuring process(es) of
block 940. In some examples, block 940 may involve applying one or more heuristic rules to derive a periodicity measure, e.g., as follows:
- In Equation 17, EventCount represents a detected howl event number; EventNumTh represents a threshold of the howl event presence number and Periodicity Step represents an increased step of periodicity. According to one example, EventNumTh is 2 and Periodicity Step is 0.5. However in alternative examples, EventNumTh may be 1.5, 1.8, etc. In other examples, Periodicity Step may be 0.4, 0.6, etc.
- According to some examples, a recursive averaging method may be invoked in order to provide further smoothing of the event-based periodicity measure, e.g., as follows:

- Some implementations involve determining a long-term periodicity metric that is based on audio signal levels. The inventors have observed that the amplitude modulation spectrum of howl events in a teleconferencing context often shows a long-term repeated pattern.
-
Figure 10 is a flow diagram that shows example blocks of another method of measuring howl event periodicity. The blocks ofmethod 1000 may, for example, be implemented by one or more of the devices shown inFigures 3 and5-7 . In some examples, the blocks ofmethod 1000 may be implemented via software stored on one or more non-transitory media. The blocks ofmethod 1000, like other methods described herein, are not necessarily performed in the order indicated. Moreover, such methods may include more or fewer blocks than shown and/or described. - In this example,
method 1000 begins with audio data being received inblock 1005. The audio data may include teleconference audio data. In this implementation, the received audio data are provided to block 1010. Here,block 1010 involves evaluating level information in audio data according to a sliding time window. In one example, the sliding time window may be 128 frames of audio data. In other examples, the sliding time window may be longer or shorter. In some examples, the level information may be determined prior to an AGC process. - According to this example, the results of
block 1010 are provided to block 1015, which involves a process of modulation spectrum analysis. In some examples,block 1015 involves fast Fourier transform (FFT) calculations. For example, the modulation spectrum analysis ofblock 1015 may involve a Fourier transform of the long-term level information in the sliding time window. The results ofblock 1015 are provided to the peak picking process ofblock 1020. The peak value of the modulation spectrum is selected inblock 1020 because the peak value represents periodicity information. A periodicity measure may then be determined inblock 1025, based on the results ofblock 1020. For example, a peak level selected inblock 1020 may indicate the onset of a howl event. A corresponding peak level may be identified later in time and may be correlated with the earlier peak level. - In some implementations, a local howl presence probability may be based on a linear interpolation of IPR values, e.g., as follows:

- Alternatively, or additionally, a global howl presence probability may be determined. In some examples, a global howl presence probability may be based on a counter-based consistency measure, as follows:

- A raw howl probability may, in some examples, be defined as follows:

-
Figure 11 is a flow diagram that shows blocks of a howl presence probability determination method according to one example. The blocks ofmethod 1100 may, for example, be implemented by one or more of the devices shown inFigures 3 and5-7 . In some examples, the blocks ofmethod 1100 may be implemented via software stored on one or more non-transitory media. The blocks ofmethod 1100, like other methods described herein, are not necessarily performed in the order indicated. Moreover, such methods may include more or fewer blocks than shown and/or described. - In this example, the salient features of
method 1100 begin after the howl event detection process ofblock 1105, which may be performed according to any of the above-described howl event detection methods. Although not shown inFigure 11 ,block 1105 may involve other processes according to the particular implementation, such as receiving audio data, transforming the audio data to the frequency domain, banding, etc. Here,block 1110 involves determining whether a number of howl events has exceeded a first howl event counter threshold, which also may be referred to as a medium-term event counter high threshold. In some examples, the medium-term event counter high threshold may be 10, 12, 13, etc. If it is determined inblock 1110 that the number of howl events has exceeded the first howl event counter threshold, the process continues to block 1115. - However, if it is determined in
block 1110 that the number of howl events has not exceeded the first howl event counter threshold, the process continues to block 1150, wherein it is determined whether a number of howl events is less than a second howl event counter threshold, which also may be referred to as a medium-term event counter low threshold. In some examples, the medium-term event counter low threshold may be 5, 6, 7, etc. If it is determined inblock 1150 that the number of howl events is less than the second howl event counter threshold, the process continues to block 1155, which involves reducing the current howl presence probability (HPP). In this example,block 1155 involves multiplying the current HPP value by HPP_Clear, which is a constant for reducing the HPP value quickly if the probability of a false alarm is high. In some examples, the value of HPP_Clear may be 0.1, 0.2, 0.3, etc. - However, if it is determined in
block 1150 that the number of howl events is not less than the second howl event counter threshold, the process continues to block 1160. In this example,block 1160 involves setting the current HPP value to the greater of zero or the value of (HPP(l) [the current HPP value] - HPP_Down). According to this example, HPP_Down is a constant for reducing the value of HPP. In some examples, the value of HPP_Down may be 0.02, 0.03, 0.04, etc. - As noted above, if it is determined in
block 1110 that the number of howl events has exceeded the first howl event counter threshold, the process continues to block 1115. Here,block 1115 involves evaluating signal variability. In this example,block 1115 involves determining whether the long-term signal variability (LTSV) is greater than an LTSV threshold value, denoted LTSV_Th1 inFigure 11 . In some examples, the value of LTSV_Th1 may be 0.15, 0.2, 0.25, etc. If it is determined inblock 1115 that LTSV is not greater than LTSV_Th1, the process proceeds to block 1150. However, if it is determined inblock 1115 that the LTSV is greater than LTSV_Th1, the process continues to block 1120. - In this implementation,
block 1120 involves determining whether one or more level values of the audio input data exceed a threshold. In some examples, the level value(s) may be determined prior to an AGC process. According to this implementation,block 1120 involves determining whether InLeveldB>Level_Th1. In some examples, the value of LTSV_Th1 may be -60Db, -65Db, -70Db, etc. If it is determined inblock 1120 that InLeveldB is not greater than LTSV_Th1, the process proceeds to block 1150. However, if it is determined inblock 1120 that InLeveldB>Level_Th1, the process continues to block 1125 in this example. - In this implementation,
block 1125 involves setting the current HPP value to the lesser of 1 or the sum of the current HPP value and the "raw" howl probability, which may in some examples be determined according toEquation 21. The process then proceeds to block 1130. - In this implementation,
block 1130 involves determining whether a howl event periodicity metric is less than a first howl event periodicity threshold, which is denoted Periodicity_Thl inFigure 11 . In some examples, the value of Periodicity_Th1 may be 0.2, 0.3, 0.4, 0.5, etc. If it is determined inblock 1130 that the howl event periodicity metric is less than Periodicity_Th1, the process continues to block 1135. Here,block 1135 involves reducing the current HPP. In this example,block 1135 involves multiplying the current HPP value by HPP_Clear. - However, if it is determined in
block 1130 that the howl event periodicity metric is not less than the first howl event periodicity threshold, the process proceeds to block 1140 in this example. Here,block 1140 involves determining whether the howl event periodicity metric is greater than a second howl event periodicity threshold, which is denoted Periodicity _Th2 inFigure 11 . In some examples, the value of Periodicity_Th2 may be 0.80, 0.85, 0.90, etc. In this example, if it is determined inblock 1140 that the howl event periodicity metric is not greater than Periodicity _Th2, the current HPP value will not be changed. However, if it is determined inblock 1140 that the howl event periodicity metric is greater than Periodicity _Th2, the process continues to block 1145. - In this implementation,
block 1145 involves setting the current HPP value to the lesser of 1 or the sum of the current HPP value and a constant that is denoted HPP_Up inFigure 11 . HPP_Up is a value used to incrementally increase the current value of HPP. In some examples, the value of HPP_Up may be 0.1, 0.15, 0.2, etc. - An HPP value may be output after the foregoing processes have been completed. Although this is not shown in
Figure 11 , the process may continue as additional howl events are detected. - In alternative implementations, an HPP value may be determined according to one or more other methods. For example, an HPP value may be determined according to a machine learning based method such as regression a decision tree method, an Adaptive Boosting algorithm, a Gaussian Mixture Model, a Hidden Markov Model or a deep neural network.
- As described above with reference to block 835 of
Figure 8 , some implementations may involve a post-processing step after determining an HPP value or a similar howl probability value. Some such implementations may involve a voting-based decision smoothing process. If we define the binary indicator of a howl state in frame I as I (l) and the voting ratio in an observation window R as V (l), the voting ratio may be expressed as follows:
- The binary decision smoothing can be performed as follows:

- In Equation 23, Vth represents a voting ratio threshold, which may vary according to the particular implementation. In some examples, Vth may be 0.5, 0.6, 0.7, etc.
- According to some implementations, a median filter method may be used for further binary decision smoothing. In some such implementations, the binary indicator of a howl state in frame I may be expressed as follows:

- In Equation 24, M represents a length of a median filter window. In some examples, M may be in the range of 3, 4, 5, etc.
-
Figure 12 is a flow diagram that shows example blocks of a method of determining signal envelope similarity. The blocks ofmethod 1200 may, for example, be implemented by one or more of the devices shown inFigures 3 and5-7 . In some examples, the blocks ofmethod 1200 may be implemented via software stored on one or more non-transitory media. The blocks ofmethod 1200, like other methods described herein, are not necessarily performed in the order indicated. Moreover, such methods may include more or fewer blocks than shown and/or described. - In this example,
method 1200 begins with audio data being received inblock 1205. The audio data may include teleconference audio data. In this implementation, the received audio data are provided to block 1210 without a transformation to the frequency domain. In this example,block 1210 involves windowing of the time-domain audio signal. In one such example, the frame length is 10ms and the time-domain audio signal is first windowed via a Hamming window having a window length of 20ms. However, the type of windowing process and the window length may vary according to the particular implementation. In some alternative examples a Hanning window may be applied. In some examples, the window size may be 25ms, 30ms, etc. - The process then continues to block 1212, wherein the RMS energy for each frame is calculated. In one implementation, the RMS energy for each frame is calculated as follows:

- In Equation 25, xi (i=1,2,...,N) are the samples of the frame.
- The process then proceeds to the smoothing and filtering processes of
block 1215 in this example. In some implementations,block 1215 involves obtain a smoothed RMS envelope by applying median filtering to the RMS energy calculated inblock 1212, e.g., as follows:
- Accordingly, the median filtering operation may involve sorting the RMS energy and selecting values in the 50th percentile. The results of
block 1215 are provided to block 1220. According to this example,block 1220 involves, for the smoothed RMS envelope, a peak-picking method that is used to find the RMS peaks. The peak-picking method may, in some examples, selecting local maximum RMS values. In this example, the blocks between two adjacent peaks are extracted and then the length of the remaining blocks is calculated. This length may be used as a constraint condition for envelope periodicity in some implementations. - The RMS blocks are then normalized in
block 1225. In some examples,block 1225 involves using the maximal RMS values, e.g., as follows:

- In Equations 27 and 28, vrms1 and vrms2 represent two adjacent blocks among three peaks.
- In this implementation, the mean square error (MSE) of the smooth RMS of two blocks is then calculated in
block 1230. According to some examples,block 1230 may involve calculating the MSE as follows:
- In this example, the smoothing process of
block 1235 follows, in order to alleviate the fluctuation of MSE among peaks. According to some such examples,block 1235 involves a median filtering process to obtain smoothed MSE values. - The inventors have observed that the length of corresponding howl events in a teleconferencing context may be very similar. By using the lengths of blocks corresponding to howl events, one can construct a kind of constraint rule that may be applied to the smoothed MSE values. In this way, one can obtain final MSE values.
- Therefore, according to this example, constraint rules are then applied in
block 1240. In some examples, the constraint rules may be based, at least in part, on the maximum length and the ratio of len1 and len2, where len1 and len2 represent the lengths of the above-referenced vrms1 and vrms2, respectively. If the maximum length is too long or the ratio is too small or too big, this may indicate that the difference between len1 and len2 is too large. Therefore, according to some examples, the MSE values may be increased. If the ratio nearly equals to 1, and the ratios over several blocks (for example, over 4 or 5 blocks) are nearly equal to 1, this may indicate that the envelopes have strong similarity. Therefore, according to some such examples, the MSE values may be decreased. - By selecting and applying an appropriate threshold of MSE values, a binary indication of howl events may then be derived in
block 1245. According to some implementations, the threshold for MSE values may be small, e.g., 0.015, 0.02, 0.025, 0.03, etc. In some examples, the output may be 1 for a howl event and 0 for a non-howl event. - In some implementations, envelope similarity metrics can be calculated in the frequency domain based on energy. According to Parseval's Theorem,

- In Equation 30, A represents energy.
- In one example of determining energy-based envelope similarity, an audio signal may be windowed and then transformed to the frequency domain, e.g., by using an FFT or a modified discrete cosine transform. In some examples, the energy for each frame may be calculated as follows:

- In Equation 31, X[k] represents a coefficient in the frequency domain, k represents the frequency index and N represents the frame length. A filter may then be applied in order to obtain a smooth envelope. For example, a moving average filter may be applied:

- In Equation 32, N represents the length of the moving average filter, the value of which may differ according to the implementation. In some examples, the value of N may be 3, 5, 7, etc. According to some implementations, the peaks of the envelope may then be picked and the MSE values may be calculated. In some examples, these processes may be performed as described above with reference to blocks 1220-1245 of
Figure 12 . - Howl events may occur in several frequency bands. Therefore, collective decisions in the sub-band domain can help determine envelope similarity.
- One implementation of determining sub-band domain envelope similarity may start by windowing a received audio signal and then transforming the audio signal to the frequency domain, e.g., by using an FFT or a modified discrete cosine transform. The resulting broad-band signal may be divided into sub-bands, e.g., according to psychoacoustic principles. The number of sub-bands may, for example, be based on the sampling rate of the broad-band signal. In one example involving a 16kHz sampling rate, the broad-band signal may be divided into 48 sub-bands. In other examples involving a 32kHz sampling rate, the broad-band signal may be divided into 56 or 64 sub-bands.
- The process may then proceed substantially as described in the preceding section. However, some examples of this method may involve outputting not only binary non-howl or howl event indications (e.g., 1 and 0), but also outputting an indication of uncertainty (e.g., 0.5) in the howl event determination. For example, a howl event may be mixed with a speech signal and this may result in an ambiguous howl event determination result.
-
Figure 13 is a flow diagram that outlines blocks of howl detection methods according to some implementations. The blocks ofmethod 1300 may, for example, be implemented by one or more of the devices shown inFigures 3 and5-7 . The processes that are referenced by the blocks ofFigure 13 may be performed according to any of the corresponding above-described methods. In some examples, the blocks ofmethod 1300 may be implemented via software stored on one or more non-transitory media. The blocks ofmethod 1300, like other methods described herein, are not necessarily performed in the order indicated. Moreover, such methods may include more or fewer blocks than shown and/or described. - In this example,
method 1300 begins with audio data being transformed from the time domain to the frequency domain inblock 1305. The audio data may include teleconference audio data. In this implementation, the transformed audio data are divided into frequency bands inblock 1310. - In this example, the transformed and banded audio data are provided to four different howl detection processes: according to this implementation,
block 1315 involves detecting spectral peakiness,block 1320 involves determining IPR,block 1325 involves determining signal level before AGC is applied to the audio data andblock 1330 involves a spectral entropy determination process. In this implementation, the results ofblock Consistency Measure block 1345. In this example, the results ofblock 1315 are also provided to the High PeakinessConsistency Measure block 1340. Here, the results ofblock 1330 are also provided to the Long-TermSignal Variability block 1350. - According to this implementation, the results of
blocks Probability Determination block 1360. In this example, block 1360 outputs a measure of howl presence probability, which is also referred to herein as HPP. Here,block 1360 also provides input toPost-Processing block 1365, which outputs a binary howl/no howl indication. In some examples,method 1300 may involve mitigating a howl state or sending a howl state detection message.
Claims (15)
- A teleconferencing server, comprising:an interface system configured for communication between the teleconferencing server and teleconference client locations; anda control system configured for:providing full-duplex audio connectivity during a teleconference between two or more teleconference client locations;detecting, during the teleconference, a howl state, the howl state being a state of acoustic feedback involving two or more teleconference devices in a teleconference client location, wherein detecting the howl state involves:receiving teleconference audio data from one or more of the teleconference client locations,transforming teleconference audio data from time domain to frequency domain,dividing the transformed audio data in frequency bands, detecting, in said transformed and banded audio data, short-term spectral features and medium-term spectral and temporal features, wherein short-term is in the order of tens of milliseconds and medium-term is in the order of hundreds of milliseconds,estimating, based on the short-term spectral features and medium-term spectral and temporal features, a howl presence probability and outputting a howl binary indicator, indicative of a presence of the howl state; anddetermining which client location is causing the howl state.
- The teleconferencing server of claim 1, wherein short-term spectral features include a spectral peakiness measure, SPM, wherein the SPM of a frame is calculated as one minus a ratio between a geometric mean of the band power spectrum for the frame and the arithmetic mean of the band power spectrum for the frame.
- The teleconferencing server of claim 1, wherein short-term spectral features include an inter-percentile range, IPR, where the IPR of a frame I is defined as IPR(l) = B(1,l) - B(κ, l), where B(r,l) is the r:th order statistics version of bandpower for frame l, and κ is an index representing a predefined percentile of a total number, K, of frequency bands, according to:

- The teleconferencing server of claim 3, wherein said percentile is 80, 82 or 85.
- The teleconferencing server of claim 3 or 4, wherein IPR(l) is weighted in a weighting function, the weighting function using an input level and a spectral peakiness measure, SPM, according to claim 2.
- The teleconferencing server of Claim 1, wherein the control system is configured for at least one of mitigating the howl state or sending a howl state detection message.
- The teleconferencing server of Claim 1 or Claim 2, wherein the control system is configured for determining which client device is causing the howl state.
- The teleconferencing server of any one of Claims 1-7, wherein the control system is configured for:creating a teleconference audio data mix comprising said teleconference audio data received from the teleconference client locations; anddetecting the howl state based on the teleconference audio data mix.
- The teleconferencing server of any one of Claims 1 - 7, wherein the control system is configured for:receiving, via the interface system, teleconference metadata from the teleconference client locations; anddetermining which client location is causing the howl state based, at least in part, on the teleconference metadata.
- The teleconferencing server of Claim 1, wherein the howl presence probability estimation is based on a hierarchical rule set or a machine learning process.
- The teleconferencing server of Claim 1, wherein the short-term spectral features and medium-term spectral and temporal features are selected from a list consisting of: a power-based metric according to order statistics of frequency bands; a spectral resonance metric; an inter-percentile range metric; event aggregation; a periodicity metric; envelope similarity; and a spectral peakiness metric.
- A teleconferencing client device, comprising:an interface system configured for communication between the teleconference client device and a teleconferencing server configured for providing full-duplex audio connectivity during a teleconference between a plurality of teleconference client locations and to detect a howl state based, at least in part, on howl feature data; anda control system configured for:
performing a howl state feature extraction process during the teleconference, the howl state feature extraction process involving extracting howl feature data that is relevant to detecting a howl state, the howl state being a state of acoustic feedback involving the teleconferencing client device and at least one other device in a teleconference client location that includes the teleconferencing client device, wherein the howl state feature extraction process involves:transforming teleconference audio data gathered at the teleconference client location from time domain to frequency domain,dividing the transformed audio data in frequency bands, detecting, in said transformed and banded audio data, short-term spectral features, and medium-term spectral features and temporal features, wherein short-term is in the order of tens of milliseconds and medium-term is in the order of hundreds of milliseconds,
andsending the howl feature data to the teleconferencing server. - The teleconferencing client device of Claim 12, wherein the short-term spectral features and medium-term spectral and temporal features are selected from a list consisting of: a power-based metric according to order statistics of frequency bands; a spectral resonance metric; an inter-percentile range metric; event aggregation; a periodicity metric; envelope similarity; and a spectral peakiness metric.
- A computer program product comprising computer-readable program code to be executed by one or more processors of a teleconferencing server when retrieved from a non-transitory computer-readable medium, the program code including instructions which configure the teleconferencing server as defined in the teleconferencing server of any one of Claims 1 to 11.
- A computer program product comprising computer-readable program code to be executed by one or more processors of a teleconferencing client device when retrieved from a non-transitory computer-readable medium, the program code including instructions which configure the teleconferencing client device as defined in the teleconferencing client device of Claim 12 or Claim 13.
Applications Claiming Priority (4)
| Application Number | Priority Date | Filing Date | Title |
|---|---|---|---|
| CN2017104604 | 2017-09-29 | ||
| US201762575701P | 2017-10-23 | 2017-10-23 | |
| EP17201011 | 2017-11-10 | ||
| PCT/US2018/053119 WO2019067718A2 (en) | 2017-09-29 | 2018-09-27 | Howl detection in conference systems |
Publications (2)
| Publication Number | Publication Date |
|---|---|
| EP3689002A2 EP3689002A2 (en) | 2020-08-05 |
| EP3689002B1 true EP3689002B1 (en) | 2024-10-30 |
Family
ID=63794778
Family Applications (1)
| Application Number | Title | Priority Date | Filing Date |
|---|---|---|---|
| EP18783352.0A Active EP3689002B1 (en) | 2017-09-29 | 2018-09-27 | Howl detection in conference systems |
Country Status (4)
| Country | Link |
|---|---|
| US (2) | US11277518B2 (en) |
| EP (1) | EP3689002B1 (en) |
| CN (2) | CN113766073B (en) |
| WO (1) | WO2019067718A2 (en) |
Families Citing this family (16)
| Publication number | Priority date | Publication date | Assignee | Title |
|---|---|---|---|---|
| CN113766073B (en) * | 2017-09-29 | 2024-04-16 | 杜比实验室特许公司 | Howling Detection in Conference Systems |
| WO2021013363A1 (en) * | 2019-07-25 | 2021-01-28 | Unify Patente Gmbh & Co. Kg | Method and system for avoiding howling disturbance on conferences |
| US11057702B1 (en) | 2019-12-20 | 2021-07-06 | Microsoft Technology Licensing, Llc | Method and system for reducing audio feedback |
| GB2596169B (en) * | 2020-02-11 | 2022-04-27 | Tymphany Acoustic Tech Ltd | A method and an audio processing unit for detecting a tone |
| CN111883163B (en) * | 2020-04-02 | 2023-11-28 | 珠海市杰理科技股份有限公司 | Audio howling suppression method, device and system and neural network training method |
| CN112992190B (en) * | 2021-02-02 | 2021-12-10 | 北京字跳网络技术有限公司 | Audio signal processing method, device, electronic device and storage medium |
| US20220415336A1 (en) * | 2021-06-28 | 2022-12-29 | Panasonic Intellectual Property Management Co., Ltd. | Voice communication apparatus and howling detection method |
| JP7767808B2 (en) * | 2021-09-27 | 2025-11-12 | 富士フイルムビジネスイノベーション株式会社 | Information processing device and program |
| CN113724725B (en) * | 2021-11-04 | 2022-01-18 | 北京百瑞互联技术有限公司 | Bluetooth audio squeal detection suppression method, device, medium and Bluetooth device |
| CN113905310B (en) * | 2021-12-09 | 2022-03-01 | 北京百瑞互联技术有限公司 | A method, device and medium for howling detection and suppression of Bluetooth audio |
| CN114863941B (en) * | 2022-03-25 | 2026-02-03 | 杭州网易智企科技有限公司 | Howling suppression method and device, storage medium and electronic equipment |
| CN114420148B (en) * | 2022-03-30 | 2022-06-14 | 北京百瑞互联技术有限公司 | Howling detection and suppression method, device, medium and equipment |
| US12154537B2 (en) | 2022-11-23 | 2024-11-26 | Synaptics Incorporated | Howling suppression for active noise cancellation (ANC) systems and methods |
| US12034784B1 (en) * | 2023-02-21 | 2024-07-09 | Zoom Video Communications, Inc. | Automatic detection of companion mode for hybrid events |
| CN116124285A (en) * | 2023-02-28 | 2023-05-16 | 重庆长安汽车股份有限公司 | A Noise Evaluation Method for Vehicle Drive System |
| CN118748003B (en) * | 2024-08-08 | 2025-12-02 | 宁波方太厨具有限公司 | Active noise cancellation system and its control method, abnormal noise detection method and device |
Citations (1)
| Publication number | Priority date | Publication date | Assignee | Title |
|---|---|---|---|---|
| WO2007013981A2 (en) * | 2005-07-22 | 2007-02-01 | Gables Engineering, Inc. | Acoustic feedback cancellation system |
Family Cites Families (34)
| Publication number | Priority date | Publication date | Assignee | Title |
|---|---|---|---|---|
| JP3654470B2 (en) * | 1996-09-13 | 2005-06-02 | 日本電信電話株式会社 | Echo canceling method for subband multi-channel audio communication conference |
| DE60029147T2 (en) * | 2000-12-29 | 2007-05-31 | Nokia Corp. | QUALITY IMPROVEMENT OF AUDIO SIGNAL IN A DIGITAL NETWORK |
| JP2004165888A (en) * | 2002-11-12 | 2004-06-10 | Oki Electric Ind Co Ltd | Howling processor |
| GB0317158D0 (en) * | 2003-07-23 | 2003-08-27 | Mitel Networks Corp | A method to reduce acoustic coupling in audio conferencing systems |
| TWI289020B (en) * | 2004-02-06 | 2007-10-21 | Fortemedia Inc | Apparatus and method of a dual microphone communication device applied for teleconference system |
| JP4287762B2 (en) * | 2004-02-20 | 2009-07-01 | パナソニック株式会社 | Howling detection method and apparatus, and acoustic apparatus including the same |
| US20050286443A1 (en) * | 2004-06-29 | 2005-12-29 | Octiv, Inc. | Conferencing system |
| US20050285935A1 (en) * | 2004-06-29 | 2005-12-29 | Octiv, Inc. | Personal conferencing node |
| US7742608B2 (en) * | 2005-03-31 | 2010-06-22 | Polycom, Inc. | Feedback elimination method and apparatus |
| US7991146B2 (en) * | 2005-11-15 | 2011-08-02 | Mitel Networks Corporation | Anti-howling structure |
| US7873175B2 (en) * | 2005-12-27 | 2011-01-18 | Polycom, Inc. | Multiplexed microphone signals with multiple signal processing paths |
| JP2007300295A (en) * | 2006-04-28 | 2007-11-15 | Matsushita Electric Ind Co Ltd | CONFERENCE MICROPHONE DEVICE AND CONFERENCE MICROPHONE CONTROL METHOD |
| US20080091415A1 (en) * | 2006-10-12 | 2008-04-17 | Schafer Ronald W | System and method for canceling acoustic echoes in audio-conference communication systems |
| JP4569618B2 (en) * | 2006-11-10 | 2010-10-27 | ソニー株式会社 | Echo canceller and speech processing apparatus |
| US8160239B2 (en) * | 2006-11-10 | 2012-04-17 | Sony Corporation | Echo canceller and speech processing apparatus |
| JP2008263280A (en) * | 2007-04-10 | 2008-10-30 | Iwatsu Electric Co Ltd | Howling prevention device |
| CN101511050A (en) * | 2009-03-24 | 2009-08-19 | 北京中星微电子有限公司 | Hearing-aid device and method for eliminating acoustic feedback |
| US8488745B2 (en) * | 2009-06-17 | 2013-07-16 | Microsoft Corporation | Endpoint echo detection |
| US8462193B1 (en) | 2010-01-08 | 2013-06-11 | Polycom, Inc. | Method and system for processing audio signals |
| CN102740214B (en) * | 2011-04-01 | 2014-09-10 | 中国科学院声学研究所 | Howling suppression method based on feedback signal spectrum estimation |
| KR20170017000A (en) * | 2012-11-12 | 2017-02-14 | 야마하 가부시키가이샤 | Signal processing system and signal processing method |
| US9521258B2 (en) * | 2012-11-21 | 2016-12-13 | Castel Communications, LLC | Real-time call center call monitoring and analysis |
| EP2736271B1 (en) * | 2012-11-27 | 2019-06-19 | Oticon A/s | A method of controlling an update algorithm of an adaptive feedback estimation system and a de-correlation unit |
| CN105099949A (en) * | 2014-04-16 | 2015-11-25 | 杜比实验室特许公司 | Jitter buffer control based on monitoring for dynamic states of delay jitter and conversation |
| EP2975831A1 (en) | 2014-07-16 | 2016-01-20 | Dolby Laboratories Licensing Corporation | In-service monitoring of voice quality in teleconferencing |
| CN105812993B (en) * | 2014-12-29 | 2019-02-15 | 联芯科技有限公司 | It utters long and high-pitched sounds detection and suppressing method and its device |
| US10142484B2 (en) * | 2015-02-09 | 2018-11-27 | Dolby Laboratories Licensing Corporation | Nearby talker obscuring, duplicate dialogue amelioration and automatic muting of acoustically proximate participants |
| EP3139636B1 (en) * | 2015-09-07 | 2019-10-16 | Oticon A/s | A hearing device comprising a feedback cancellation system based on signal energy relocation |
| CN105516876A (en) * | 2015-12-09 | 2016-04-20 | 天津大学 | Spectrum entropy based howling detection method |
| KR20170072783A (en) * | 2015-12-16 | 2017-06-27 | 한국전자통신연구원 | Channel adaptive audio mixing method for multi-point conference service |
| CN105788611A (en) * | 2016-02-25 | 2016-07-20 | 成都普创通信技术股份有限公司 | Audio quality online monitoring system |
| CN105979197B (en) * | 2016-07-19 | 2019-04-05 | 一块互动(北京)科技有限公司 | Teleconference control method and device based on sound automatic identification of uttering long and high-pitched sounds |
| CN113766073B (en) * | 2017-09-29 | 2024-04-16 | 杜比实验室特许公司 | Howling Detection in Conference Systems |
| EP3481085B1 (en) * | 2017-11-01 | 2020-09-09 | Oticon A/s | A feedback detector and a hearing device comprising a feedback detector |
-
2018
- 2018-09-27 CN CN202111051519.9A patent/CN113766073B/en active Active
- 2018-09-27 US US16/640,169 patent/US11277518B2/en active Active
- 2018-09-27 WO PCT/US2018/053119 patent/WO2019067718A2/en not_active Ceased
- 2018-09-27 EP EP18783352.0A patent/EP3689002B1/en active Active
- 2018-09-27 CN CN201880062458.6A patent/CN111149370B/en active Active
-
2022
- 2022-03-10 US US17/691,966 patent/US11677879B2/en active Active
Patent Citations (1)
| Publication number | Priority date | Publication date | Assignee | Title |
|---|---|---|---|---|
| WO2007013981A2 (en) * | 2005-07-22 | 2007-02-01 | Gables Engineering, Inc. | Acoustic feedback cancellation system |
Non-Patent Citations (1)
| Title |
|---|
| TOON VAN WATERSCHOOT ET AL: "Fifty Years of Acoustic Feedback Control: State of the Art and Future Challenges", PROCEEDINGS OF THE IEEE., vol. 99, no. 2, 1 February 2011 (2011-02-01), US, pages 288 - 327, XP055225971, ISSN: 0018-9219, DOI: 10.1109/JPROC.2010.2090998 * |
Also Published As
| Publication number | Publication date |
|---|---|
| CN113766073A (en) | 2021-12-07 |
| EP3689002A2 (en) | 2020-08-05 |
| US11277518B2 (en) | 2022-03-15 |
| CN113766073B (en) | 2024-04-16 |
| WO2019067718A2 (en) | 2019-04-04 |
| CN111149370B (en) | 2021-10-01 |
| US20210136230A1 (en) | 2021-05-06 |
| WO2019067718A3 (en) | 2019-05-09 |
| US11677879B2 (en) | 2023-06-13 |
| US20220201125A1 (en) | 2022-06-23 |
| CN111149370A (en) | 2020-05-12 |
Similar Documents
| Publication | Publication Date | Title |
|---|---|---|
| US11677879B2 (en) | Howl detection in conference systems | |
| US10867620B2 (en) | Sibilance detection and mitigation | |
| EP2151822B1 (en) | Apparatus and method for processing and audio signal for speech enhancement using a feature extraction | |
| CN103325386B (en) | The method and system controlled for signal transmission | |
| EP2828856B1 (en) | Audio classification using harmonicity estimation | |
| WO2019113130A1 (en) | Voice activity detection systems and methods | |
| CN105118522B (en) | Noise detection method and device | |
| CN111292758B (en) | Voice activity detection method and device and readable storage medium | |
| CN101821971A (en) | Systems and methods for noisy activity detection | |
| EP3526792B1 (en) | Voice activity detection method and apparatus | |
| CN101010722A (en) | Detection of voice activity in an audio signal | |
| EP3118852B1 (en) | Method and device for detecting audio signal | |
| EP2881948A1 (en) | Spectral comb voice activity detection | |
| WO2006041735A2 (en) | Reverberation removal | |
| EP3261089B1 (en) | Sibilance detection and mitigation | |
| CN113593604B (en) | Method, device and storage medium for detecting audio quality | |
| CN104036785A (en) | Speech signal processing method, speech signal processing device and speech signal analyzing system | |
| WO2017143334A1 (en) | Method and system for multi-talker babble noise reduction using q-factor based signal decomposition | |
| HK40035084B (en) | Howl detection in conference systems | |
| HK40035084A (en) | Howl detection in conference systems | |
| Tiwari et al. | Speech enhancement using noise estimation with dynamic quantile tracking | |
| Liu et al. | Auditory filter-bank compression improves estimation of signal-to-noise ratio for speech in noise | |
| HK40021198A (en) | Howl detection in conference systems | |
| HK40021198B (en) | Howl detection in conference systems | |
| HK40065600B (en) | Howl detection in conference systems |
Legal Events
| Date | Code | Title | Description |
|---|---|---|---|
| STAA | Information on the status of an ep patent application or granted ep patent |
Free format text: STATUS: UNKNOWN |
|
| STAA | Information on the status of an ep patent application or granted ep patent |
Free format text: STATUS: THE INTERNATIONAL PUBLICATION HAS BEEN MADE |
|
| PUAI | Public reference made under article 153(3) epc to a published international application that has entered the european phase |
Free format text: ORIGINAL CODE: 0009012 |
|
| STAA | Information on the status of an ep patent application or granted ep patent |
Free format text: STATUS: REQUEST FOR EXAMINATION WAS MADE |
|
| 17P | Request for examination filed |
Effective date: 20200429 |
|
| AK | Designated contracting states |
Kind code of ref document: A2 Designated state(s): AL AT BE BG CH CY CZ DE DK EE ES FI FR GB GR HR HU IE IS IT LI LT LU LV MC MK MT NL NO PL PT RO RS SE SI SK SM TR |
|
| AX | Request for extension of the european patent |
Extension state: BA ME |
|
| DAV | Request for validation of the european patent (deleted) | ||
| DAX | Request for extension of the european patent (deleted) | ||
| REG | Reference to a national code |
Ref country code: HK Ref legal event code: DE Ref document number: 40035084 Country of ref document: HK |
|
| STAA | Information on the status of an ep patent application or granted ep patent |
Free format text: STATUS: EXAMINATION IS IN PROGRESS |
|
| 17Q | First examination report despatched |
Effective date: 20220426 |
|
| P01 | Opt-out of the competence of the unified patent court (upc) registered |
Effective date: 20230417 |
|
| GRAP | Despatch of communication of intention to grant a patent |
Free format text: ORIGINAL CODE: EPIDOSNIGR1 |
|
| STAA | Information on the status of an ep patent application or granted ep patent |
Free format text: STATUS: GRANT OF PATENT IS INTENDED |
|
| INTG | Intention to grant announced |
Effective date: 20240214 |
|
| GRAJ | Information related to disapproval of communication of intention to grant by the applicant or resumption of examination proceedings by the epo deleted |
Free format text: ORIGINAL CODE: EPIDOSDIGR1 |
|
| STAA | Information on the status of an ep patent application or granted ep patent |
Free format text: STATUS: EXAMINATION IS IN PROGRESS |
|
| GRAP | Despatch of communication of intention to grant a patent |
Free format text: ORIGINAL CODE: EPIDOSNIGR1 |
|
| STAA | Information on the status of an ep patent application or granted ep patent |
Free format text: STATUS: GRANT OF PATENT IS INTENDED |
|
| INTC | Intention to grant announced (deleted) | ||
| INTG | Intention to grant announced |
Effective date: 20240430 |
|
| RIN1 | Information on inventor provided before grant (corrected) |
Inventor name: FANG, QIANQIAN Inventor name: DENG, FENG Inventor name: GUNAWAN, DAVID Inventor name: LI, KAI |
|
| GRAS | Grant fee paid |
Free format text: ORIGINAL CODE: EPIDOSNIGR3 |
|
| GRAA | (expected) grant |
Free format text: ORIGINAL CODE: 0009210 |
|
| STAA | Information on the status of an ep patent application or granted ep patent |
Free format text: STATUS: THE PATENT HAS BEEN GRANTED |
|
| AK | Designated contracting states |
Kind code of ref document: B1 Designated state(s): AL AT BE BG CH CY CZ DE DK EE ES FI FR GB GR HR HU IE IS IT LI LT LU LV MC MK MT NL NO PL PT RO RS SE SI SK SM TR |
|
| REG | Reference to a national code |
Ref country code: GB Ref legal event code: FG4D |
|
| REG | Reference to a national code |
Ref country code: CH Ref legal event code: EP |
|
| REG | Reference to a national code |
Ref country code: IE Ref legal event code: FG4D |
|
| REG | Reference to a national code |
Ref country code: DE Ref legal event code: R096 Ref document number: 602018076019 Country of ref document: DE |
|
| REG | Reference to a national code |
Ref country code: LT Ref legal event code: MG9D |
|
| REG | Reference to a national code |
Ref country code: NL Ref legal event code: MP Effective date: 20241030 |
|
| PG25 | Lapsed in a contracting state [announced via postgrant information from national office to epo] |
Ref country code: HR Free format text: LAPSE BECAUSE OF FAILURE TO SUBMIT A TRANSLATION OF THE DESCRIPTION OR TO PAY THE FEE WITHIN THE PRESCRIBED TIME-LIMIT Effective date: 20241030 Ref country code: IS Free format text: LAPSE BECAUSE OF FAILURE TO SUBMIT A TRANSLATION OF THE DESCRIPTION OR TO PAY THE FEE WITHIN THE PRESCRIBED TIME-LIMIT Effective date: 20250228 Ref country code: PT Free format text: LAPSE BECAUSE OF FAILURE TO SUBMIT A TRANSLATION OF THE DESCRIPTION OR TO PAY THE FEE WITHIN THE PRESCRIBED TIME-LIMIT Effective date: 20250228 |
|
| PG25 | Lapsed in a contracting state [announced via postgrant information from national office to epo] |
Ref country code: FI Free format text: LAPSE BECAUSE OF FAILURE TO SUBMIT A TRANSLATION OF THE DESCRIPTION OR TO PAY THE FEE WITHIN THE PRESCRIBED TIME-LIMIT Effective date: 20241030 Ref country code: NL Free format text: LAPSE BECAUSE OF FAILURE TO SUBMIT A TRANSLATION OF THE DESCRIPTION OR TO PAY THE FEE WITHIN THE PRESCRIBED TIME-LIMIT Effective date: 20241030 |
|
| REG | Reference to a national code |
Ref country code: AT Ref legal event code: MK05 Ref document number: 1738109 Country of ref document: AT Kind code of ref document: T Effective date: 20241030 |
|
| PG25 | Lapsed in a contracting state [announced via postgrant information from national office to epo] |
Ref country code: BG Free format text: LAPSE BECAUSE OF FAILURE TO SUBMIT A TRANSLATION OF THE DESCRIPTION OR TO PAY THE FEE WITHIN THE PRESCRIBED TIME-LIMIT Effective date: 20241030 |
|
| PG25 | Lapsed in a contracting state [announced via postgrant information from national office to epo] |
Ref country code: ES Free format text: LAPSE BECAUSE OF FAILURE TO SUBMIT A TRANSLATION OF THE DESCRIPTION OR TO PAY THE FEE WITHIN THE PRESCRIBED TIME-LIMIT Effective date: 20241030 |
|
| PG25 | Lapsed in a contracting state [announced via postgrant information from national office to epo] |
Ref country code: NO Free format text: LAPSE BECAUSE OF FAILURE TO SUBMIT A TRANSLATION OF THE DESCRIPTION OR TO PAY THE FEE WITHIN THE PRESCRIBED TIME-LIMIT Effective date: 20250130 |
|
| PG25 | Lapsed in a contracting state [announced via postgrant information from national office to epo] |
Ref country code: AT Free format text: LAPSE BECAUSE OF FAILURE TO SUBMIT A TRANSLATION OF THE DESCRIPTION OR TO PAY THE FEE WITHIN THE PRESCRIBED TIME-LIMIT Effective date: 20241030 Ref country code: LV Free format text: LAPSE BECAUSE OF FAILURE TO SUBMIT A TRANSLATION OF THE DESCRIPTION OR TO PAY THE FEE WITHIN THE PRESCRIBED TIME-LIMIT Effective date: 20241030 Ref country code: GR Free format text: LAPSE BECAUSE OF FAILURE TO SUBMIT A TRANSLATION OF THE DESCRIPTION OR TO PAY THE FEE WITHIN THE PRESCRIBED TIME-LIMIT Effective date: 20250131 |
|
| PG25 | Lapsed in a contracting state [announced via postgrant information from national office to epo] |
Ref country code: PL Free format text: LAPSE BECAUSE OF FAILURE TO SUBMIT A TRANSLATION OF THE DESCRIPTION OR TO PAY THE FEE WITHIN THE PRESCRIBED TIME-LIMIT Effective date: 20241030 |
|
| PG25 | Lapsed in a contracting state [announced via postgrant information from national office to epo] |
Ref country code: RS Free format text: LAPSE BECAUSE OF FAILURE TO SUBMIT A TRANSLATION OF THE DESCRIPTION OR TO PAY THE FEE WITHIN THE PRESCRIBED TIME-LIMIT Effective date: 20250130 |
|
| PG25 | Lapsed in a contracting state [announced via postgrant information from national office to epo] |
Ref country code: SM Free format text: LAPSE BECAUSE OF FAILURE TO SUBMIT A TRANSLATION OF THE DESCRIPTION OR TO PAY THE FEE WITHIN THE PRESCRIBED TIME-LIMIT Effective date: 20241030 |
|
| PG25 | Lapsed in a contracting state [announced via postgrant information from national office to epo] |
Ref country code: DK Free format text: LAPSE BECAUSE OF FAILURE TO SUBMIT A TRANSLATION OF THE DESCRIPTION OR TO PAY THE FEE WITHIN THE PRESCRIBED TIME-LIMIT Effective date: 20241030 |
|
| PG25 | Lapsed in a contracting state [announced via postgrant information from national office to epo] |
Ref country code: EE Free format text: LAPSE BECAUSE OF FAILURE TO SUBMIT A TRANSLATION OF THE DESCRIPTION OR TO PAY THE FEE WITHIN THE PRESCRIBED TIME-LIMIT Effective date: 20241030 |
|
| PG25 | Lapsed in a contracting state [announced via postgrant information from national office to epo] |
Ref country code: RO Free format text: LAPSE BECAUSE OF FAILURE TO SUBMIT A TRANSLATION OF THE DESCRIPTION OR TO PAY THE FEE WITHIN THE PRESCRIBED TIME-LIMIT Effective date: 20241030 |
|
| PG25 | Lapsed in a contracting state [announced via postgrant information from national office to epo] |
Ref country code: SK Free format text: LAPSE BECAUSE OF FAILURE TO SUBMIT A TRANSLATION OF THE DESCRIPTION OR TO PAY THE FEE WITHIN THE PRESCRIBED TIME-LIMIT Effective date: 20241030 |
|
| PG25 | Lapsed in a contracting state [announced via postgrant information from national office to epo] |
Ref country code: CZ Free format text: LAPSE BECAUSE OF FAILURE TO SUBMIT A TRANSLATION OF THE DESCRIPTION OR TO PAY THE FEE WITHIN THE PRESCRIBED TIME-LIMIT Effective date: 20241030 |
|
| PG25 | Lapsed in a contracting state [announced via postgrant information from national office to epo] |
Ref country code: IT Free format text: LAPSE BECAUSE OF FAILURE TO SUBMIT A TRANSLATION OF THE DESCRIPTION OR TO PAY THE FEE WITHIN THE PRESCRIBED TIME-LIMIT Effective date: 20241030 |
|
| REG | Reference to a national code |
Ref country code: DE Ref legal event code: R097 Ref document number: 602018076019 Country of ref document: DE |
|
| PLBE | No opposition filed within time limit |
Free format text: ORIGINAL CODE: 0009261 |
|
| STAA | Information on the status of an ep patent application or granted ep patent |
Free format text: STATUS: NO OPPOSITION FILED WITHIN TIME LIMIT |
|
| PG25 | Lapsed in a contracting state [announced via postgrant information from national office to epo] |
Ref country code: SE Free format text: LAPSE BECAUSE OF FAILURE TO SUBMIT A TRANSLATION OF THE DESCRIPTION OR TO PAY THE FEE WITHIN THE PRESCRIBED TIME-LIMIT Effective date: 20241030 |
|
| 26N | No opposition filed |
Effective date: 20250731 |
|
| PGFP | Annual fee paid to national office [announced via postgrant information from national office to epo] |
Ref country code: DE Payment date: 20250820 Year of fee payment: 8 |
|
| PGFP | Annual fee paid to national office [announced via postgrant information from national office to epo] |
Ref country code: GB Payment date: 20250822 Year of fee payment: 8 |
|
| PGFP | Annual fee paid to national office [announced via postgrant information from national office to epo] |
Ref country code: FR Payment date: 20250820 Year of fee payment: 8 |
|
| REG | Reference to a national code |
Ref country code: CH Ref legal event code: H13 Free format text: ST27 STATUS EVENT CODE: U-0-0-H10-H13 (AS PROVIDED BY THE NATIONAL OFFICE) Effective date: 20260504 |