EP3663979A1 - Tiefenlernverfahren zur vorhersage der patientenreaktion auf eine therapie - Google Patents
Tiefenlernverfahren zur vorhersage der patientenreaktion auf eine therapie Download PDFInfo
- Publication number
- EP3663979A1 EP3663979A1 EP19214264.4A EP19214264A EP3663979A1 EP 3663979 A1 EP3663979 A1 EP 3663979A1 EP 19214264 A EP19214264 A EP 19214264A EP 3663979 A1 EP3663979 A1 EP 3663979A1
- Authority
- EP
- European Patent Office
- Prior art keywords
- cell
- tissue
- image
- cancer patient
- centers
- Prior art date
- Legal status (The legal status is an assumption and is not a legal conclusion. Google has not performed a legal analysis and makes no representation as to the accuracy of the status listed.)
- Withdrawn
Links
Images


Classifications
-
- G—PHYSICS
- G06—COMPUTING OR CALCULATING; COUNTING
- G06V—IMAGE OR VIDEO RECOGNITION OR UNDERSTANDING
- G06V10/00—Arrangements for image or video recognition or understanding
- G06V10/70—Arrangements for image or video recognition or understanding using pattern recognition or machine learning
- G06V10/82—Arrangements for image or video recognition or understanding using pattern recognition or machine learning using neural networks
-
- G—PHYSICS
- G01—MEASURING; TESTING
- G01N—INVESTIGATING OR ANALYSING MATERIALS BY DETERMINING THEIR CHEMICAL OR PHYSICAL PROPERTIES
- G01N1/00—Sampling; Preparing specimens for investigation
- G01N1/28—Preparing specimens for investigation including physical details of (bio-)chemical methods covered elsewhere, e.g. G01N33/50, C12Q
- G01N1/30—Staining; Impregnating ; Fixation; Dehydration; Multistep processes for preparing samples of tissue, cell or nucleic acid material and the like for analysis
-
- G—PHYSICS
- G06—COMPUTING OR CALCULATING; COUNTING
- G06F—ELECTRIC DIGITAL DATA PROCESSING
- G06F18/00—Pattern recognition
- G06F18/20—Analysing
- G06F18/24—Classification techniques
- G06F18/241—Classification techniques relating to the classification model, e.g. parametric or non-parametric approaches
- G06F18/2413—Classification techniques relating to the classification model, e.g. parametric or non-parametric approaches based on distances to training or reference patterns
- G06F18/24133—Distances to prototypes
- G06F18/24137—Distances to cluster centroïds
- G06F18/2414—Smoothing the distance, e.g. radial basis function networks [RBFN]
-
- G—PHYSICS
- G06—COMPUTING OR CALCULATING; COUNTING
- G06T—IMAGE DATA PROCESSING OR GENERATION, IN GENERAL
- G06T7/00—Image analysis
- G06T7/0002—Inspection of images, e.g. flaw detection
- G06T7/0012—Biomedical image inspection
-
- G—PHYSICS
- G06—COMPUTING OR CALCULATING; COUNTING
- G06T—IMAGE DATA PROCESSING OR GENERATION, IN GENERAL
- G06T7/00—Image analysis
- G06T7/10—Segmentation; Edge detection
- G06T7/136—Segmentation; Edge detection involving thresholding
-
- G—PHYSICS
- G06—COMPUTING OR CALCULATING; COUNTING
- G06T—IMAGE DATA PROCESSING OR GENERATION, IN GENERAL
- G06T7/00—Image analysis
- G06T7/30—Determination of transform parameters for the alignment of images, i.e. image registration
- G06T7/33—Determination of transform parameters for the alignment of images, i.e. image registration using feature-based methods
- G06T7/337—Determination of transform parameters for the alignment of images, i.e. image registration using feature-based methods involving reference images or patches
-
- G—PHYSICS
- G06—COMPUTING OR CALCULATING; COUNTING
- G06T—IMAGE DATA PROCESSING OR GENERATION, IN GENERAL
- G06T7/00—Image analysis
- G06T7/30—Determination of transform parameters for the alignment of images, i.e. image registration
- G06T7/35—Determination of transform parameters for the alignment of images, i.e. image registration using statistical methods
-
- G—PHYSICS
- G06—COMPUTING OR CALCULATING; COUNTING
- G06V—IMAGE OR VIDEO RECOGNITION OR UNDERSTANDING
- G06V10/00—Arrangements for image or video recognition or understanding
- G06V10/70—Arrangements for image or video recognition or understanding using pattern recognition or machine learning
- G06V10/764—Arrangements for image or video recognition or understanding using pattern recognition or machine learning using classification, e.g. of video objects
-
- G—PHYSICS
- G06—COMPUTING OR CALCULATING; COUNTING
- G06V—IMAGE OR VIDEO RECOGNITION OR UNDERSTANDING
- G06V20/00—Scenes; Scene-specific elements
- G06V20/60—Type of objects
- G06V20/69—Microscopic objects, e.g. biological cells or cellular parts
- G06V20/695—Preprocessing, e.g. image segmentation
-
- G—PHYSICS
- G06—COMPUTING OR CALCULATING; COUNTING
- G06V—IMAGE OR VIDEO RECOGNITION OR UNDERSTANDING
- G06V20/00—Scenes; Scene-specific elements
- G06V20/60—Type of objects
- G06V20/69—Microscopic objects, e.g. biological cells or cellular parts
- G06V20/698—Matching; Classification
-
- G—PHYSICS
- G01—MEASURING; TESTING
- G01N—INVESTIGATING OR ANALYSING MATERIALS BY DETERMINING THEIR CHEMICAL OR PHYSICAL PROPERTIES
- G01N2800/00—Detection or diagnosis of diseases
- G01N2800/52—Predicting or monitoring the response to treatment, e.g. for selection of therapy based on assay results in personalised medicine; Prognosis
-
- G—PHYSICS
- G01—MEASURING; TESTING
- G01N—INVESTIGATING OR ANALYSING MATERIALS BY DETERMINING THEIR CHEMICAL OR PHYSICAL PROPERTIES
- G01N2800/00—Detection or diagnosis of diseases
- G01N2800/70—Mechanisms involved in disease identification
- G01N2800/7023—(Hyper)proliferation
- G01N2800/7028—Cancer
-
- G—PHYSICS
- G06—COMPUTING OR CALCULATING; COUNTING
- G06T—IMAGE DATA PROCESSING OR GENERATION, IN GENERAL
- G06T2207/00—Indexing scheme for image analysis or image enhancement
- G06T2207/20—Special algorithmic details
- G06T2207/20084—Artificial neural networks [ANN]
-
- G—PHYSICS
- G06—COMPUTING OR CALCULATING; COUNTING
- G06T—IMAGE DATA PROCESSING OR GENERATION, IN GENERAL
- G06T2207/00—Indexing scheme for image analysis or image enhancement
- G06T2207/30—Subject of image; Context of image processing
- G06T2207/30004—Biomedical image processing
- G06T2207/30024—Cell structures in vitro; Tissue sections in vitro
-
- G—PHYSICS
- G06—COMPUTING OR CALCULATING; COUNTING
- G06T—IMAGE DATA PROCESSING OR GENERATION, IN GENERAL
- G06T2207/00—Indexing scheme for image analysis or image enhancement
- G06T2207/30—Subject of image; Context of image processing
- G06T2207/30242—Counting objects in image
Definitions
- IHC staining can be used to distinguish marker-positive cells that express a particular protein from marker-negative cells that do not express the protein. IHC staining typically involves multiple dyes, which includes one or more dyes connected to protein-specific antibodies and another dye that is a counterstain. A common counterstain is hematoxylin, which labels DNA and thus stains nuclei.
- a protein specific stain or biomarker can be used to identify the regions of the tissue of the cancer patient that are likely to exhibit a response to a predetermined therapy.
- a biomarker that stains epithelial cells can help to identify the suspected tumor regions.
- other protein specific biomarkers are used to characterize the cells within the cancerous tissue.
- the cells stained by a specific biomarker can be identified and quantified, and subsequently a score indicating the number of positively stained cells and negatively stained cells can be visually estimated by pathologists. This score can then be compared to scores of other cancer patients that have been calculated in the same way.
- the pathologist can predict, based on a comparison of the score calculated for the cancer patient with the scores of the other patients, how likely the cancer patient is to respond to a given treatment.
- visual assessment by pathologists is prone to variability and subjectivity.
- a computer-based method for generating a repeatable and objective score indicating a cancer patient's response to a given treatment.
- the invention relates to an in vitro method comprising:
- the invention further relates to an in vitro method comprising:
- the invention relates to an in vitro method comprising:
- a method for indicating how a cancer patient will respond to a predetermined therapy relies on spatial statistical analysis of classes of cell centers present in a digital image of tissue of the cancer patient.
- the cell centers are detected in the digital image of stained tissue of the cancer patient.
- For each cell center an image patch that includes the cell center is extracted from the digital image.
- a feature vector is generated based on each image patch using a convolutional neural network.
- a class is assigned to each cell center based on the feature vector associated with each cell center.
- a score is then computed for the digital image of tissue by performing spatial statistical analysis on the classes of the cell centers. The score is indicative of how the cancer patient will respond to the predetermined therapy.
- the predetermined therapy is recommended to the cancer patient if the score is larger than a predetermined threshold.
- the disclosed method uses a convolutional neural network to generate a feature vector of an image patch including a cell center extracted from a digital image of tissue of a cancer patient.
- the tissue has been stained.
- tissue has been stained with a stain that stains cellular nuclei or the tissue has been stained to mark membranes.
- a first step cell centers are detected on a digital image of tissue of a cancer patient, wherein the tissue has been stained.
- an image patch that includes the cell center is extracted.
- a feature vector is generated based on each image patch using a convolutional neural network.
- a class is assigned to each cell center and in a fifth step, a score for the digital image of tissue is computed by performing spatial statistical analysis on the classes of the cell centers, wherein the score is indicative of how the cancer patient will respond to a predetermined therapy.
- the spatial statistical analysis performed on the classes of the cell centers generates a profile for the digital image
- the score for the cancer patient is computed by comparing the profile for the digital image of the cancer patient with profiles generated from images of tissue from a plurality of patients whose responses to the predetermined therapy are known.
- the profile is generated by counting how many cell centers are assigned to each of the classes of cell centers present in the image.
- the profile is generated based on a spatial distribution of cell centers assigned to various classes in the digital image.
- Another embodiment of the method includes defining the classes of the cell centers using k-means clustering of feature vectors of cell centers detected in a plurality of digital images of tissue from a plurality of cancer patients.
- the convolutional neural network is a convolutional neural network selected from the group consisting of: a generative adversarial network (GAN), an information maximizing generative adversarial network (infoGAN), a boundary equilibrium generative adversarial network (BeGAN), and an autoencoder convolutional neural network.
- GAN generative adversarial network
- infoGAN information maximizing generative adversarial network
- BeGAN boundary equilibrium generative adversarial network
- autoencoder convolutional neural network an autoencoder convolutional neural network.
- the tissue has been stained with a stain that stains cellular nuclei.
- the tissue has been stained using an antibody specific to a protein selected from the group consisting of: HER1, HER2, HER3, KI67, PD-L1, PD-L2, CD3, CD4, CD8, CD20, and CD73.
- the tissue has been immunohistochemically stained using hematoxylin and eosin.
- the convolutional neural network is a discriminator part of an infoGAN
- the classes of the cell centers are defined by performing an arg-max operation on output values of predefined network nodes of the convolutional neural network.
- Performing the arg-max operation involves determining the input value of each predefined network node that yields the maximum output value of the predefined network node. For a generator with four neurons in the predictor layer that represent four classes (e.g., A-D), a given cell center is classified in the class corresponding to the neuron having the largest activation value.
- the spatial statistical analysis involves calculating a number of cells that have been assigned to a first class that are within a predefined maximum distance of cells that have been assigned to a second class.
- extracting the image patch involves extracting a first image patch that includes the cell center and then extracting a second image patch that is smaller than the first image patch and centered on the same cell center.
- the feature vector is generated based on an image patch using a convolutional neural network.
- the image patch is generated by stacking a first image patch and a second image patch.
- the first image patch is centered on a cell center
- the second image patch is generated by downscaling a third larger image patch to the size of the first image patch, wherein the third image patch is also centered on the cell center.
- the size of the third image patch is larger than the size of the first image patch.
- the feature vector is generated based on an image patch using a convolutional neural network.
- the image patch is generated from a first image patch that includes a cell center.
- the method of generating the image patch is selected from the group consisting of: color space transformation, two dimensional Fourier transformation, Fourier-Bessel rotational invariant transformation, and Fourier Mellin Transform.
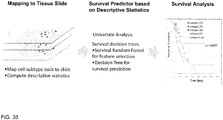
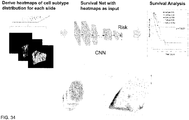
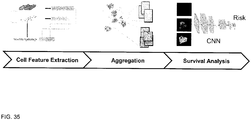
- Another aspect of the disclosure concerns a method for computing a score for a cancer patient indicating a survival probability of the cancer patient.
- the invention further relates to an in vitro method comprising:
- a first step of the method cell centers on a digital image of tissue of the cancer patient are detected, wherein the tissue has been stained, for example the tissue has been immunohistochemically stained to mark membranes or has been stained to mark cell nuclei.
- each cell center is classified by extracting an image patch that includes the cell center.
- image analysis is performed on each image patch using a convolutional neural network to generate a feature vector based on each image patch using the convolutional neural network.
- the feature vectors are then used to classify the cell centers.
- a profile is generated by spatial statistical analysis of the classified cell centers.
- a score for the cancer patient is computed by comparing the profile to those of other patients to indicate a survival probability of the cancer patient. The profile is compared to existing profiles of patients whose survival probability is known.
- the survival probability of the cancer patient is indicated.
- a profile is generated by classifying each feature vector using a database of Nc cluster analysis models. Alternatively, the step of generating the profile is performed based on how many cell centers are classified as belonging to a class.
- the convolutional neural network is a convolutional neural network selected from the group consisting of: a generative adversarial network (GAN), an information maximizing generative adversarial network (infoGAN), a boundary equilibrium generative adversarial network (BeGAN), and an autoencoder convolutional neural network.
- the tissue has been immunohistochemically stained to mark membranes.
- extracting the image patch involves extracting a first image patch that includes the cell center and then extracting a second image patch that is larger than the first image patch and has a common center pixel with the first image patch.
- the spatial statistical analysis indicates a spatial distribution in the digital image of cell centers that have similar feature vectors.
- the profile is generated based on a spatial distribution in the digital image of feature vectors that share a common feature compared to other feature vectors that do not share the common feature.
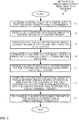
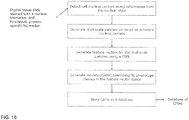
- FIG. 1 is a flowchart of steps 11-17 of a method 10 by which an analysis system analyzes a digital image of tissue from a cancer patient and predicts how the cancer patient will likely respond to a predetermined therapy.
- a first step 11 a high-resolution digital image is acquired of a tissue slice from the cancer patient that has been stained using one or more biomarkers or stains.
- step 12 cell centers are detected in the digital image of stained tissue of the cancer patient.
- step 13 for each cell center in the digital image, an image patch is extracted that includes the cell center.
- step 14 a feature vector is generated based on each image patch using a convolutional neural network.
- step 15 a class is assigned to each cell center based on the feature vector associated with the cell center.
- step 16 a score is computed for the digital image of tissue by performing spatial statistical analysis on the classes of the cell centers that are present in the digital image. The score is indicative of how the cancer patient will respond to a predetermined therapy. The spatial statistical analysis that is performed on the classes of cell centers generates a profile for the digital image.
- the score for the cancer patient is computed by comparing the profile for the digital image of the cancer patient with profiles generated from images of tissue from a plurality of other cancer patients whose responses to the predetermined therapy are known.
- the predetermined therapy is recommended if the score is larger than a predetermined threshold.
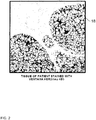
- FIG. 2 is a digital image 18 of stained tissue that has been acquired in step 11.
- Image 18 shows tissue from a cancer patient that has been immunohistochemically stained with an anti-Her2/neu antibody.
- the anti-Her2/neu antibody binds to the membrane protein Her2/neu so that with a subsequent 3,3'-Diaminobenzidine (DAB) staining step the location of the protein Her2/neu in the tissue sample is visualized.
- the tissue has been immunohistochemically stained using hematoxylin and eosin.
- the tissue has been stained using an antibody specific to a selected protein, such as HER1, HER2, HER3, KI67, PD-L1, PD-L2, CD3, CD4, CD8, CD20 or CD73.
- FIG. 3 is an image showing the optical density distribution of the DAB staining of the image of FIG. 2 . Areas of intense DAB staining are dark in FIG. 3 . Cell membranes are also apparent in FIG. 3 .
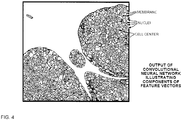
- FIGS. 4-8 illustrate the image analysis performed on the image of FIG. 2 in step 12 in order to detect cell centers in the image.
- the image analysis of the image of FIG. 2 was performed by a convolutional neural network.
- the image of FIG. 4 has been segmented to show cell membranes, cell nuclei and cell centers within epithelial cells. Regions of non-epithelial cells appear as white in FIG. 4 .
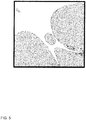
- FIG. 5 is a segmented image of the tissue of FIG. 4 showing only epithelium as gray and non-epithelial tissue as white.
- the image shown in FIG. 5 represents the output of an image analysis step in which epithelial and non-epithelial cells are identified.
- the image shown in FIG. 5 represents one layer of information contained in the image of FIG. 4 .
- FIG. 6 is a segmented image showing cell membranes. Tissue other than the membranes appears as white.
- the image shown in FIG. 6 represents the output of another analysis step in which cell membranes are identified and distinguished from other tissue.
- the image of FIG. 6 represents one layer of information contained in the image of FIG. 4 .
- FIG. 7 is a segmented image showing cell nuclei; other tissue appears as white.
- the image of FIG. 7 represents the output of another analysis step in which cell nuclei are identified and distinguished from other tissue.
- the image of FIG. 7 represents one layer of information contained in the image of FIG. 4 .
- FIG. 8 is a segmented image showing cell centers; other tissue appears as white.
- the image of FIG. 8 represents the output of analysis step 12 in which cell centers are identified.
- the cell centers are defined as the center of the area that has been identified as being the nucleus of a cell.
- the cell centers are defined as the center of the area that has been identified as the area surrounded by a continuous membrane.
- the image of FIG. 8 represents one layer of information contained in the image of FIG. 4 .
- FIG. 9 shows the segmented image of FIG. 4 superimposed on the image of the stained tissue.
- Cell centers have been identified in the regions corresponding to epithelial cells.
- FIG. 10 is a more detailed view of the region in FIG. 9 enclosed by the dashed rectangle.
- the cell centers are defined as the center of each area in the image that has been identified as being surrounded by a continuous membrane.
- the membrane is dark, and the area within the membrane is light.
- an image patch surrounding each cell center is extracted from the stained image of FIG. 2 .
- multiscale patches are used in which the patch is generated by superimposing multiple patches of different resolutions over one another.
- a multiscale patch can be generated by combining a patch having a resolution of 64 ⁇ m x 64 ⁇ m with another patch having a resolution of 16 ⁇ m x 16 ⁇ m.
- a convolutional neural network is used to generate a feature vector for each cell center by analyzing the associated multiscale patch.
- the features from the stained image at multiple resolutions are aggregated into an unsupervised feature vector.
- a class is assigned to each cell center based on the feature vector associated with that cell center.
- the classes are determined using cluster analysis models, such as k-means cluster analysis, to cluster the feature vectors of many cell centers from images of tissue from many cancer patients.
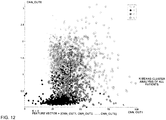
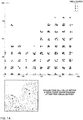
- FIG. 11 shows an example of the clustering calculations of step 15 used to determine four classes of cells (A, B, C, D) using images of stained tissue from only five cancer patients.
- the cluster analysis should be trained on images of many more than just five cancer patients.
- the four classes of cell centers (A-D) are defined using the feature vector output by the convolutional neural network for each cell center as listed in the table in FIG. 11.
- FIG. 11 shows only the data for the first twenty nine of the cell centers from the five patients.
- Each feature vector has six components: cnn_out1, cnn_out2, cnn_out3, cnn_out4, cnn_out5, and cnn_out6.
- FIG. 11 lists the six components of the feature vector for the first twenty nine cell centers.
- the second-to-last column lists the patient associated with the numbered cell center.
- the cell center #3 of patient 1 has a feature vector with the six components (1.2222222222, 20.185185185, 2.0503663004, 5.1961524227, 0.43344627062, 0.42155290038) and has been classified by k-means clustering into class B (cell_classification).
- FIG. 12 is a plot illustrating the k-means cluster analysis in which the cell centers of the five patients are have been classified into one of four classes (A-D). For example, the black dots represent cell centers in class B, and the open circles represent cell centers in class D.
- a class is assigned to each cell center in the stained image of the cancer patient based on the feature vector associated with that cell center. Consequently, each epithelial cell of the stained tissue of the cancer patient is classified as described above.
- FIG. 13 illustrates how each epithelial cell of the stained tissue of the digital image of FIG. 2 is classified into one of the four classes A, B, C and D defined using k-means clustering.
- the gray dots represent cells in class A
- the black dots represent cells in class B
- the striped dots represent cells in class C
- the circles represent cells in class D.
- a score is computed for the digital image 18 of tissue from the cancer patient by performing spatial statistical analysis on the classes of the cell centers.
- the spatial statistical analysis is used to generate a profile for the digital image 18.
- the score for the cancer patient is then computed by comparing the profile for the digital image of the cancer patient with profiles generated from images of tissue from many other patients whose responses to the predetermined therapy are known.
- One way to generate the profile for the digital image is simply to count how many cell centers are assigned to each of the classes of cell centers.
- Another way to generate the profile for the digital image is based on the spatial distribution of the classified cell centers in the digital image. For this example, the profile is defined by how many cell centers are assigned to a first class for which at least a predefined number of cell centers that are assigned to a second class are located closer than a predefined distance to the cell centers assigned to the first class.
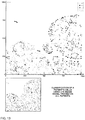
- FIGS. 14-16 illustrate alternative ways to generate a profile from a digital image of cancer tissue that can be used to indicate how the cancer patient will respond to a predetermined therapy.
- FIG. 14 shows a random jitter scatter plot used to visualize the distribution of cell centers classified into classes A-D within a defined area of a grid overlaying the digital image of FIG. 13 .
- cell centers falling within this area are grouped with adjacent cell centers.
- per grid area four subgroups within the grid area are formed in addition to another five subgroups on the border to the adjacent grid areas.
- the four classes are designated by dots in FIG. 14 in the same manner as illustrated in FIG. 13 (gray, black, striped, circle). Cells classified in the same class within a grid area are counted.
- the grid area in the upper right corner of FIG. 14 contains one cell center in class A, no cell centers in class B, three cell centers in class C, and two cell centers in class D.
- the scatter plot of FIG. 14 allows the predominant class of cell present within a grid area to be easily recognize.
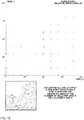
- FIG. 15 shows a quantification graph used to visualize the number of cell centers classified to a group within each grid area.
- the sizes of the bubbles in the graph correspond to the geometric mean of the number of cells classified to specific class.
- the bubble size corresponds to the geometric mean of the number of cell centers in a given area that have been classified into only classes C and D.
- a bubble with a larger diameter indicates a larger average number of cells in classes C and D in the area surrounding the bubble.
- spatial statistical analysis as shown in the examples of FIGS. 14-15 is carried out to determine a score indicative of the patient's response to treatment.
- FIG. 16 shows an example of a score that is calculated to indicate a patient's response to a particular treatment.
- the score is the mean value of the geometric mean of the number of cell centers classified in classes C and D per grid area of the digital image of tissue of the patient.
- the predictive accuracy of the score was trained on only five patients whose responses to the predetermined therapy are known. In an actual implementation, the predictive accuracy of the score should be trained on images of many more than just five cancer patients whose outcome after administering the therapy is known.
- the digital image of tissue from patient 4 (P4) generated an average geometric mean of the number of cell centers in classes C and D per grid area of 0.21767878042528.
- the average geometric mean of the number of cell centers in classes C and D per grid area was 0.18867317404639.
- patient 5 (P5) the average geometric mean was 0.12066538018773.
- FIG. 17 provides an overview of the data shown in the chart of FIG. 16 . It is known that patients 3 and 4 responded to the predetermined therapy, whereas patients 1, 2 and 5 did not respond to the predetermined therapy. Therefore, the average geometric mean of the number of cell centers in classes C and D per grid area can be used as a score to indicate how the particular cancer patient with the stained tissue of FIG. 2 will respond to the predetermined therapy. For the cancer patient with the stained tissue of FIG. 2 , which resulted in the spatial statistical analysis illustrated in FIG. 15 , the average geometric mean of the number of cell centers in classes C and D per grid area was 0.19. This score of 0.19 indicates that the cancer patient will probably respond to the predetermined therapy because 0.19 is similar to the score of patient 3 of 0.189 and the score of patent 4 of 0.218, both of which responded to the therapy.
- the predetermined therapy is recommended to the cancer patient if the score is larger than a predetermined threshold, such as 0.175, for example.
- the convolutional neural network is a discriminator part of an information maximizing generative adversarial network (infoGAN), and the classes of the cell centers are defined by performing an arg-max operation on output values of predefined network nodes of the convolutional neural network.
- Performing the arg-max operation involves determining the input value (argument) of each predefined network node that gives rise to a maximum output value of the predefined network node. For example, if a generator has four neurons (network nodes) in the predictor layer representing four classes, a given cell center is classified in the class corresponding to the neuron having the largest activation value.
- the four neurons (e.g., N1-N4) in the predictor layer of the generator represent the four classes A-D.
- the inputs for an exemplary cell center generate the activation values 0.1, 0.2, 0.15 and 0.01 in neurons N1-N4, respectively.
- the maximum activation value is 0.2 in neuron N2, which represents class B.
- the exemplary cell center is classified in class B.
- An oncologist's recommendation to treat a patient with a therapy is frequently based on a histopathological score derived from the patient's cancer tissue, such as the Gleason Score for prostate cancer or the HERCEPTIN HER2 immunohistochemistry score for breast cancers.
- These established scoring methods rely on the classification of cells into visually defined classes, such as HER2-positive tumor cells, or normal epithelial cells.
- the method presented here automatically derives cell classes by applying an unsupervised convolutional network method to image patches extracted from automatically detected nuclei center locations in digital tissue images. A statistics on the count of the detected nuclei assigned to the automatically found classes is the basis for a novel scoring method which is used to determine the recommendation to apply a treatment to the cancer patient.
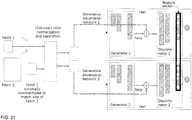
- the database of cell phenotypes comprises a set of Nc cluster analysis models (CAMs), each representing a cell phenotype class.
- the cluster analysis models are generated by clustering the feature vectors generated by a CNN into Nc classes.
- a CNN is trained using a Generative Adversarial Network (GAN) CNN architecture ( FIG. 21 ).
- GAN Generative Adversarial Network
- a Generator creates increasingly realistic artificial image patches ("fake” images), and a Discriminator simultaneously optimizes itself to discriminate between these fake images patches and "real” images.
- the desired feature vectors are equivalent to the output of last convolutional network layer of this GAN model after the training phase.
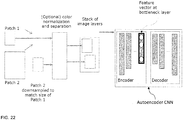
- Another implementation comprises the use of a convolutional neural network autoencoder ( FIG. 22 ) which consists of two parts, an Encoder which generates a feature vectors in its output neural network layer using training image patches, and a Decoder which is capable to generate artificial image patches using the feature vector.
- the autoencoders loss function is determined by the difference between the input image and its decoded representation.
- the image patches used to train the CNN model are generated by cropping quadratic regions of digital tissue slides around detected nuclei centers ( Fig 20 left). To capture simultaneously the nuclear morphology and the cellular context, two image regions are cropped, a small region 1, typically in the range of 32um, and a larger region 2, typically 64um or 128um. The larger region is then down-sampled to the size of the smaller region, so that both regions could be stacked.
- the stacked image comprises twice the number of image channels of the whole slide image.
- the number of image channels in the digital image is 3 (red, green, blue). In case of immunofluorescence or imaging cytometry the number of image channels in the digital images is in the range between 4 and 50.
- An automated image processing could be applied on the extracted patches to compensate for illumination artifacts, staining variations from sample preparation and slide staining, and to transfer the original image colors to another color space which is adapted to the dyes used in the staining process.
- those color spaces are relevant which separate the nuclear biomarker information from the functional biomarker (or biomarkers). Examples for nuclear biomarkers are hematoxylin, DAPI, Hoechst. Examples for functional biomarkers are antibodies targeting HER2, Estrogen and Progesterone receptors, PD-L1, PD-1, CTLA-4, CD8, CD3, CD4, CD20, CD68, CD163.
- the cell centers are detected using an automated image analysis method based on machine learning.
- the preferable method is a visual context random forest models trained by nucleus center annotations provided by domain experts ( N. Brieu, G. Schmidt. Learning Size Adaptive Local Maxima Selection For Robust Nuclei Detection in Histopathology Images, ISBI 2017 ).
- Another method for cell center detection involves direct segmentation of nuclei using a convolutional neural network and computation of cell centers using the center of gravity of the detected nuclei.
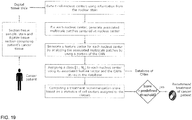
- the tissue has to be sectioned, stained using a nuclear biomarker, digitized using a digital slide scanner, and analyzed by the method described in the following section.
- Nuclei centers are detected by applying a pre-trained random forest model to all pixels of a region of interest of the digital tissue image.
- the region may comprise the whole tissue region, or a polygonal delineated region marked by a pathologist, such as the tumor center.
- Each detected nucleus center is classified according to the phenotype classes stored in the CAMs database.
- a statistical profile is generated on the relative count of cells belong to class 1, class 2, ... class Nc.
- the tissue profile is matched with profiles stored in a database for previously seen patients with known therapy success.
- a score for a given therapy is computed by measuring the distance from the patient's profile to the profiles in the database which has been shown to respond to that therapy. If the score is greater than a predefined threshold, then that therapy is recommended.
- the classification of the nuclei centers is refined after initial classification according to the initial classification of the nuclei in the vicinity.
- One option is to choose a circular vicinity of 120um around the nucleus center. For example, for a given nucleus with initial classification to class 1 its classification will be amended to class 1' if there are is at least one other nuclei with class 2 in its vicinity. The patient's tissue profile is then generated using the amended classes.
Landscapes
- Engineering & Computer Science (AREA)
- Theoretical Computer Science (AREA)
- Physics & Mathematics (AREA)
- General Physics & Mathematics (AREA)
- Health & Medical Sciences (AREA)
- Computer Vision & Pattern Recognition (AREA)
- General Health & Medical Sciences (AREA)
- Life Sciences & Earth Sciences (AREA)
- Multimedia (AREA)
- Evolutionary Computation (AREA)
- Molecular Biology (AREA)
- Medical Informatics (AREA)
- Biomedical Technology (AREA)
- Artificial Intelligence (AREA)
- Software Systems (AREA)
- Databases & Information Systems (AREA)
- Computing Systems (AREA)
- Evolutionary Biology (AREA)
- Bioinformatics & Computational Biology (AREA)
- Bioinformatics & Cheminformatics (AREA)
- Data Mining & Analysis (AREA)
- Pathology (AREA)
- Immunology (AREA)
- Biochemistry (AREA)
- Analytical Chemistry (AREA)
- Chemical & Material Sciences (AREA)
- Nuclear Medicine, Radiotherapy & Molecular Imaging (AREA)
- Radiology & Medical Imaging (AREA)
- Quality & Reliability (AREA)
- Probability & Statistics with Applications (AREA)
- General Engineering & Computer Science (AREA)
- Image Analysis (AREA)
- Investigating Or Analysing Biological Materials (AREA)
Applications Claiming Priority (1)
| Application Number | Priority Date | Filing Date | Title |
|---|---|---|---|
| US201862776443P | 2018-12-06 | 2018-12-06 |
Publications (1)
| Publication Number | Publication Date |
|---|---|
| EP3663979A1 true EP3663979A1 (de) | 2020-06-10 |
Family
ID=68835020
Family Applications (1)
| Application Number | Title | Priority Date | Filing Date |
|---|---|---|---|
| EP19214264.4A Withdrawn EP3663979A1 (de) | 2018-12-06 | 2019-12-06 | Tiefenlernverfahren zur vorhersage der patientenreaktion auf eine therapie |
Country Status (2)
| Country | Link |
|---|---|
| US (2) | US11348231B2 (de) |
| EP (1) | EP3663979A1 (de) |
Cited By (3)
| Publication number | Priority date | Publication date | Assignee | Title |
|---|---|---|---|---|
| WO2022226284A1 (en) * | 2021-04-22 | 2022-10-27 | H. Lee Moffitt Cancer Center And Research Institute, Inc. | Quantifying the tumor-immune ecosystem in non-small cell lung cancer (nsclc) to identify clinical biomarkers of therapy response |
| US20220351530A1 (en) * | 2021-05-03 | 2022-11-03 | B.G. Negev Technologies & Applications Ltd., At Ben-Gurion University | System and method of screening biological or biomedical specimens |
| WO2024173431A1 (en) * | 2023-02-14 | 2024-08-22 | Genentech, Inc. | Nuclei-based digital pathology systems and methods |
Families Citing this family (5)
| Publication number | Priority date | Publication date | Assignee | Title |
|---|---|---|---|---|
| EP3663979A1 (de) * | 2018-12-06 | 2020-06-10 | Definiens GmbH | Tiefenlernverfahren zur vorhersage der patientenreaktion auf eine therapie |
| EP4182844A4 (de) * | 2020-06-16 | 2024-07-03 | Verily Life Sciences LLC | Systeme und verfahren zur direkten vorhersage des überlebens von krebspatienten auf basis von histopathologischen bildern |
| WO2022093906A1 (en) | 2020-10-29 | 2022-05-05 | Paige Ai, Inc. | Systems and methods for processing images to determine image-based computational biomarkers from liquid specimens |
| CN113240743B (zh) * | 2021-05-18 | 2022-03-25 | 浙江大学 | 基于神经网络的异构图像位姿估计及配准方法、装置及介质 |
| WO2025170862A1 (en) * | 2024-02-09 | 2025-08-14 | Verily Life Sciences Llc | Predicting immunotherapy outcomes using deep learning |
Family Cites Families (4)
| Publication number | Priority date | Publication date | Assignee | Title |
|---|---|---|---|---|
| US11164312B2 (en) * | 2017-11-30 | 2021-11-02 | The Research Foundation tor the State University of New York | System and method to quantify tumor-infiltrating lymphocytes (TILs) for clinical pathology analysis based on prediction, spatial analysis, molecular correlation, and reconstruction of TIL information identified in digitized tissue images |
| EP3721373B1 (de) * | 2017-12-07 | 2025-03-05 | Ventana Medical Systems, Inc. | Tieenlernsysteme und verfahren zur gemeinsamen zell- und regionklassifizierung auf biologischen bildern |
| JP7228031B2 (ja) * | 2018-10-15 | 2023-02-22 | ベンタナ メディカル システムズ, インコーポレイテッド | 細胞の分類のためのシステムおよび方法 |
| EP3663979A1 (de) * | 2018-12-06 | 2020-06-10 | Definiens GmbH | Tiefenlernverfahren zur vorhersage der patientenreaktion auf eine therapie |
-
2019
- 2019-12-06 EP EP19214264.4A patent/EP3663979A1/de not_active Withdrawn
- 2019-12-06 US US16/705,238 patent/US11348231B2/en active Active
-
2022
- 2022-04-27 US US17/731,228 patent/US11748981B2/en active Active
Non-Patent Citations (13)
Cited By (3)
| Publication number | Priority date | Publication date | Assignee | Title |
|---|---|---|---|---|
| WO2022226284A1 (en) * | 2021-04-22 | 2022-10-27 | H. Lee Moffitt Cancer Center And Research Institute, Inc. | Quantifying the tumor-immune ecosystem in non-small cell lung cancer (nsclc) to identify clinical biomarkers of therapy response |
| US20220351530A1 (en) * | 2021-05-03 | 2022-11-03 | B.G. Negev Technologies & Applications Ltd., At Ben-Gurion University | System and method of screening biological or biomedical specimens |
| WO2024173431A1 (en) * | 2023-02-14 | 2024-08-22 | Genentech, Inc. | Nuclei-based digital pathology systems and methods |
Also Published As
| Publication number | Publication date |
|---|---|
| US11748981B2 (en) | 2023-09-05 |
| US20220254020A1 (en) | 2022-08-11 |
| US11348231B2 (en) | 2022-05-31 |
| US20200184641A1 (en) | 2020-06-11 |
Similar Documents
| Publication | Publication Date | Title |
|---|---|---|
| EP3663979A1 (de) | Tiefenlernverfahren zur vorhersage der patientenreaktion auf eine therapie | |
| US11669971B2 (en) | Colony contrast gathering | |
| US12100146B2 (en) | Assessing risk of breast cancer recurrence | |
| US10565479B1 (en) | Identifying and excluding blurred areas of images of stained tissue to improve cancer scoring | |
| US10474874B2 (en) | Applying pixelwise descriptors to a target image that are generated by segmenting objects in other images | |
| US11977984B2 (en) | Using a first stain to train a model to predict the region stained by a second stain | |
| US10445557B2 (en) | Learning pixel visual context from object characteristics to generate rich semantic images | |
| IL301650A (en) | A method of processing an image of tissue and a system for processing an image of tissue | |
| JP2022027473A (ja) | 半導体試料の検査に使用可能な訓練データの生成 | |
| CN119811636A (zh) | 基于人工智能的肺癌表型预测辅助分析方法及系统 | |
| US12039795B2 (en) | System and method for monitoring bacterial growth of bacterial colonies and predicting colony biomass |
Legal Events
| Date | Code | Title | Description |
|---|---|---|---|
| PUAI | Public reference made under article 153(3) epc to a published international application that has entered the european phase |
Free format text: ORIGINAL CODE: 0009012 |
|
| STAA | Information on the status of an ep patent application or granted ep patent |
Free format text: STATUS: THE APPLICATION HAS BEEN PUBLISHED |
|
| AK | Designated contracting states |
Kind code of ref document: A1 Designated state(s): AL AT BE BG CH CY CZ DE DK EE ES FI FR GB GR HR HU IE IS IT LI LT LU LV MC MK MT NL NO PL PT RO RS SE SI SK SM TR |
|
| AX | Request for extension of the european patent |
Extension state: BA ME |
|
| RAP1 | Party data changed (applicant data changed or rights of an application transferred) |
Owner name: ASTRAZENECA COMPUTATIONAL PATHOLOGY GMBH |
|
| STAA | Information on the status of an ep patent application or granted ep patent |
Free format text: STATUS: REQUEST FOR EXAMINATION WAS MADE |
|
| 17P | Request for examination filed |
Effective date: 20201209 |
|
| RBV | Designated contracting states (corrected) |
Designated state(s): AL AT BE BG CH CY CZ DE DK EE ES FI FR GB GR HR HU IE IS IT LI LT LU LV MC MK MT NL NO PL PT RO RS SE SI SK SM TR |
|
| STAA | Information on the status of an ep patent application or granted ep patent |
Free format text: STATUS: EXAMINATION IS IN PROGRESS |
|
| 17Q | First examination report despatched |
Effective date: 20210521 |
|
| P01 | Opt-out of the competence of the unified patent court (upc) registered |
Effective date: 20230522 |
|
| STAA | Information on the status of an ep patent application or granted ep patent |
Free format text: STATUS: THE APPLICATION IS DEEMED TO BE WITHDRAWN |
|
| 18D | Application deemed to be withdrawn |
Effective date: 20231107 |