EP3654611A1 - Method and device for determining data anomaly - Google Patents
Method and device for determining data anomaly Download PDFInfo
- Publication number
- EP3654611A1 EP3654611A1 EP18896044.7A EP18896044A EP3654611A1 EP 3654611 A1 EP3654611 A1 EP 3654611A1 EP 18896044 A EP18896044 A EP 18896044A EP 3654611 A1 EP3654611 A1 EP 3654611A1
- Authority
- EP
- European Patent Office
- Prior art keywords
- distribution
- historical
- data
- determining
- probability
- Prior art date
- Legal status (The legal status is an assumption and is not a legal conclusion. Google has not performed a legal analysis and makes no representation as to the accuracy of the status listed.)
- Granted
Links
Images

Classifications
-
- H—ELECTRICITY
- H04—ELECTRIC COMMUNICATION TECHNIQUE
- H04L—TRANSMISSION OF DIGITAL INFORMATION, e.g. TELEGRAPHIC COMMUNICATION
- H04L63/00—Network architectures or network communication protocols for network security
- H04L63/14—Network architectures or network communication protocols for network security for detecting or protecting against malicious traffic
- H04L63/1408—Network architectures or network communication protocols for network security for detecting or protecting against malicious traffic by monitoring network traffic
- H04L63/1425—Traffic logging, e.g. anomaly detection
-
- H—ELECTRICITY
- H04—ELECTRIC COMMUNICATION TECHNIQUE
- H04L—TRANSMISSION OF DIGITAL INFORMATION, e.g. TELEGRAPHIC COMMUNICATION
- H04L41/00—Arrangements for maintenance, administration or management of data switching networks, e.g. of packet switching networks
- H04L41/14—Network analysis or design
- H04L41/142—Network analysis or design using statistical or mathematical methods
-
- G—PHYSICS
- G06—COMPUTING OR CALCULATING; COUNTING
- G06F—ELECTRIC DIGITAL DATA PROCESSING
- G06F16/00—Information retrieval; Database structures therefor; File system structures therefor
- G06F16/90—Details of database functions independent of the retrieved data types
- G06F16/903—Querying
- G06F16/90335—Query processing
-
- G—PHYSICS
- G06—COMPUTING OR CALCULATING; COUNTING
- G06F—ELECTRIC DIGITAL DATA PROCESSING
- G06F18/00—Pattern recognition
- G06F18/20—Analysing
- G06F18/23—Clustering techniques
-
- G—PHYSICS
- G06—COMPUTING OR CALCULATING; COUNTING
- G06F—ELECTRIC DIGITAL DATA PROCESSING
- G06F21/00—Security arrangements for protecting computers, components thereof, programs or data against unauthorised activity
- G06F21/60—Protecting data
- G06F21/64—Protecting data integrity, e.g. using checksums, certificates or signatures
-
- G—PHYSICS
- G06—COMPUTING OR CALCULATING; COUNTING
- G06N—COMPUTING ARRANGEMENTS BASED ON SPECIFIC COMPUTATIONAL MODELS
- G06N20/00—Machine learning
-
- G—PHYSICS
- G06—COMPUTING OR CALCULATING; COUNTING
- G06N—COMPUTING ARRANGEMENTS BASED ON SPECIFIC COMPUTATIONAL MODELS
- G06N7/00—Computing arrangements based on specific mathematical models
- G06N7/01—Probabilistic graphical models, e.g. probabilistic networks
-
- H—ELECTRICITY
- H04—ELECTRIC COMMUNICATION TECHNIQUE
- H04L—TRANSMISSION OF DIGITAL INFORMATION, e.g. TELEGRAPHIC COMMUNICATION
- H04L43/00—Arrangements for monitoring or testing data switching networks
- H04L43/16—Threshold monitoring
-
- H—ELECTRICITY
- H04—ELECTRIC COMMUNICATION TECHNIQUE
- H04L—TRANSMISSION OF DIGITAL INFORMATION, e.g. TELEGRAPHIC COMMUNICATION
- H04L63/00—Network architectures or network communication protocols for network security
- H04L63/14—Network architectures or network communication protocols for network security for detecting or protecting against malicious traffic
- H04L63/1408—Network architectures or network communication protocols for network security for detecting or protecting against malicious traffic by monitoring network traffic
- H04L63/1416—Event detection, e.g. attack signature detection
Definitions
- One or more embodiments of the present disclosure relate to the field of computer technology, and in particular, to a method and a device for determining data anomaly.
- a user submits a credit request to a bank or a financial platform.
- the bank or financial platform sends the user's request data to a comprehensive computing platform for comprehensive evaluation to determine whether to approve the user's credit request and the approved credit amount.
- each platform often performs some privacy protection processing on the data before sending the data to other platforms for processing.
- the processed data will lose its business meaning. After the receiving platform receives these data, it is difficult to determine whether there is an anomaly in the data according to the business rules. For example, whether the data was attacked during the data transmission, whether the data was tampered with, or whether the user group has shifted.
- Data processing often goes through multiple links in the business chain.
- Data may also be abnormal during a certain business link or during the transmission between different business links, such as the system being attacked, the model being abnormal, and so on.
- One or more embodiments of the present disclosure describe a method and a device, which can determine and warn about data anomaly without independently of the business meaning of the data.
- a method for determining data anomaly including: obtaining a plurality of data packets within a predetermined time period, the plurality of data packets having the same data structure; obtaining a historical distribution of historical data having the same data structure as the data packets; comparing the plurality of data packets with the historical distribution; and determining whether data anomaly exists according to the comparison result.
- comparing the plurality of data packets with the historical distribution includes: substituting the plurality of data packets into the historical distribution, thereby obtaining a plurality of distribution state parameters of the plurality of data packets in the historical distribution; and comparing the plurality of distribution state parameters with a predetermined threshold related to the distribution state to determine a number of data packets having a distribution state parameter exceeding the threshold. Accordingly, determining whether data anomaly exists according to the comparison result includes determining whether data anomaly exists according to the number of data packets having a distribution state parameter exceeding the threshold.
- comparing the plurality of data packets with the historical distribution includes: determining a data distribution state of the plurality of data packets as a current distribution; and comparing the current distribution with the historical distribution.
- comparing the current distribution with the historical distribution includes: determining a distribution center of the current distribution; obtaining a distribution center of the historical distribution; and determining an offset between the distribution center of the current distribution and the distribution center of the historical distribution. Accordingly, determining whether data anomaly exists according to the comparison result includes determining that data anomaly exists in response to determining that the offset exceeds a predetermined offset threshold.
- comparing the current distribution with the historical distribution includes: determining a distribution state parameter of a randomly selected data packet in the current distribution, denoted as a first parameter; determining a distribution state parameter of the randomly selected data packet in the historical distribution, denoted as a second parameter; and determining a difference value between the first parameter and the second parameter.
- determining whether data anomaly exists according to the comparison result includes determining that data anomaly exists in response to determining that the difference value exceeds a predetermined difference threshold.
- the historical distribution is a historical probability distribution obtained by processing the historical data with a hybrid Gaussian model; correspondingly, the current distribution is embodied as a current probability distribution obtained by processing the plurality of current data packets with a hybrid Gaussian model; the distribution state parameter can be embodied as a probability value; and the distribution center is embodied as a peak position of the probability distribution curve.
- the historical distribution is a historical clustering distribution obtained with a clustering algorithm for the historical data; correspondingly, the current distribution is embodied as a current clustering distribution obtained by processing the plurality of current data packets with the same clustering algorithm; the distribution state parameters can be embodied as a distance between the position of the data packet in the clustering distribution space and the corresponding clustering center; the distribution center is embodied as the center position of the clustering distribution.
- a device for determining data anomaly including: a data packet obtaining unit configured to obtain a plurality of data packets within a predetermined time period, the plurality of data packets having the same data structure; a history obtaining unit configured to obtain a historical distribution of historical data having the same data structure as the data packets; a comparing unit configured to compare the plurality of data packets with the historical distribution; and a determining unit configured to determine whether data anomaly exists according to the comparison result.
- a computer-readable storage medium on which a computer program is stored, when the computer program is executed on a computer, the computer executes the method of the first aspect.
- a computing device including a memory and a processor, wherein the memory stores executable codes, and when the processor executes the executable codes, the processor implements the method of the first aspect.
- the currently obtained data packet is compared with the historical distribution obtained based on historical data statistics, and whether the current data packet has data anomaly is determined according to the comparison result. In this way, it is possible to effectively determine and warn about data abnormalities independently of the business meaning of the data.
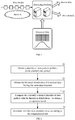
- FIG. 1 is a schematic diagram of an embodiment disclosed in the present disclosure.
- a computing platform such as an Alipay server, obtains a plurality of data packets within a predetermined time period, such as a credit request data packet in which a user requests a credit. These data packets have the same data structures, for example, have the same fields. The content of the fields can include user's age, gender, income, credit amount, and so on.
- the computing platform also obtains a historical distribution of historical data with the same data structures, which can be composed of a large number of similar data packets received in a relatively longer time period before.
- the computing platform compares the plurality of data packets with the historical distribution, and determines whether data anomaly exists according to the comparison result. If there is no data anomaly, the computing platform can continue to process the data or send the data to the next business link. If it is determined that there is an anomaly in the data, an early warning can be initiated to notify a relevant personnel to analyze the cause of the anomaly in the data and trigger a relevant solution.
- the specific implementation process of determining data anomaly is described below.
- FIG. 2 shows a method flowchart according to an embodiment.
- the execution entity of the method may be any computing platform with computing and processing capabilities, such as a server.
- the method includes: step 21, obtaining a plurality of data packets within a predetermined time period, the plurality of data packets having the same data structure; step 22, obtaining a history distribution of historical data having the same data structure; step 23, comparing the plurality of data packets with the historical distribution; step 24, determining whether data anomaly exists according to the comparison result.
- step 21 obtaining a plurality of data packets within a predetermined time period, the plurality of data packets having the same data structure
- step 22 obtaining a history distribution of historical data having the same data structure
- step 23 comparing the plurality of data packets with the historical distribution
- step 24 determining whether data anomaly exists according to the comparison result.
- a plurality of data packets is obtained within a predetermined time period.
- the plurality of data packets are data packets received from an external institution, such as a user's credit request data packet received by a Alipay server from a bank or a financial institution.
- the subsequent steps can be used to determine whether data anomaly exists in the data packet transmitted from the external institution.
- data anomaly may be caused by attacks, tampering during data transmission, or user group shifts.
- the plurality of data packets are data packets generated by a certain service link in a data processing service chain.
- the credit request data packet needs to be processed in a plurality of business links, including field analysis, dimensionality reduction, model calculation, and so on.
- subsequent analysis can be performed on the data packets generated in any business link.
- it can be determined whether there is any data anomaly in the data packets of this service link.
- the data anomaly in the data packets of a certain business link may be caused by a problem in data transmission between business links, or a problem in the system or model of the business link. Therefore, determining the anomaly of the data packets of the intermediate business links can also help determine whether there is anomaly in the system or model.
- each data packet can have the same fields.
- the above data packet is a credit request data packet, and the fields of each data packet at this time may include the user's age, gender, income, credit amount, and so on.
- the data packet is a record of user operations and is used to analyze a user's behavior pattern. At this time, the fields of each data packet may include user ID, operation behavior, operation object, operation time, and so on.
- the plurality of data packets obtained at step 21 are data packets within a predetermined time period from the current time.
- the above predetermined time period may be set to a shorter time period, so that the obtained plurality of data packets are recently generated data packets.
- the predetermined time period may be preset to 0.5s or Is; when the amount of data is relatively small, the predetermined time period may be preset to 30s or lmin.
- the number of obtained data packets can also be selected according to business requirements. In one embodiment, all data packets within the predetermined time period are obtained. In another embodiment, a predetermined number of data packets are obtained within the predetermined time period.
- the historical distribution of historical data is obtained.
- the above historical data has the same data structure as the data packet obtained at step 21.
- the historical data includes a large number of similar data packets received in a long time period previously, such as a week or a month.
- the historical data and the data packet obtained at step 21 have the same data sources.
- the data packet at step 21 is a credit request data packet from an external institution
- the above-mentioned historical data is also a credit request data packet received from an external institution and received within a relatively long time period.
- the data packet at step 21 is a data packet generated by an intermediate service link
- the above historical data is a data packet generated by the same service link within a longer time period previously.
- the historical distribution of historical data can be obtained by performing statistics and calculations on historical data.
- step 23 the currently obtained plurality of data packets is compared with the historical distribution; and at step 24, it is determined whether data anomaly exists in the current data packet according to the comparison result.
- comparing the current data packet with the historical distribution at step 23 there are various implementations for comparing the current data packet with the historical distribution at step 23.
- determining is made based on the comparison results generated by different comparison methods.
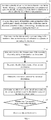
- FIG. 3 shows a flowchart of a comparing and determining process according to an embodiment. It can be understood that the process shown in FIG. 3 is a sub-step of steps 23 and 24 in FIG. 2 . As shown in FIG. 3 , the process includes the following steps.
- a plurality of data packets are substituted into the historical distribution, thereby obtaining a corresponding distribution state parameter of each of the plurality of data packets in the historical distribution, to obtain a plurality of distribution state parameters;
- the plurality of distribution state parameters are compared with a predetermined threshold related to the distribution state to determine a number of data packets exceeding the threshold; then, at step 33, it is determined whether data anomaly exists according to the number of data packets exceeding the threshold.
- the above process is to substitute the currently obtained plurality of data packets into the historical distribution to determine the distribution states of the plurality of data packets in the historical distribution. If a large number (exceeding the threshold) of abnormal states occurs, It is considered that data anomaly currently exists.
- historical distribution is the state of data distribution obtained by performing statistics and calculations on historical data. Different algorithms can be used to obtain historical distribution based on historical data. In the following, an implementation of the flow of FIG. 3 will be described with respect to different forms of historical distribution using a Gaussian mixture model and a clustering algorithm for example.
- the historical distribution is a historical probability distribution obtained by processing historical data using a Gaussian Mixture Model (GMM).
- GMM Gaussian Mixture Model
- the hybrid Gaussian model GMM is a model that accurately quantifies objects with a Gaussian probability density function. GMM can decompose an object into several forms based on a Gaussian probability density function.
- the Gaussian probability density function usually takes the form of a normal distribution curve. As mentioned earlier, both the currently obtained data packets and historical data have the same data structure, which contains several fields.
- a hybrid Gaussian model can be used to decompose the data field as a dimension to determine the mixed Gaussian probability density function as the historical probability distribution.
- the process of FIG. 3 may be performed as follows.
- the currently obtained plurality of data packets are substituted into the historical probability distribution, and the probability values of the plurality of data packets respectively in the historical probability distribution are obtained to obtain a plurality of probability values. That is, when the historical distribution is a Gaussian probability distribution, the distribution state parameter is expressed as a distribution probability value.
- the probability values of the N data packets in the historical probability distribution are p 1 , p 2 , ... p N , respectively.
- the determined a plurality of probability values are respectively compared with a predetermined probability threshold, and a number of data packets having a probability value smaller than the probability threshold is determined, denoted as a first number.
- the predetermined probability threshold is a relatively small probability value p 0 .
- the size of the probability threshold p 0 can be set according to business requirements.
- step 33 it is determined whether data anomaly exists according to the first number M1. More specifically, in one example, if the first number M1 exceeds a predetermined number threshold M0, it is determined that data anomaly exists. That is, once more than M0 data packets of the currently obtained N data packets are "small probability" data packets, it is considered that anomaly currently exists. In another example, if a ratio M1 / N of the first number M1 to the number N of the plurality of data packets exceeds a predetermined ratio threshold, it is determined that data anomaly exists. That is, once N data packets exceed a predetermined percentage of data packets as "small probability" data packets, it is considered that data anomaly currently exists.
- the number or proportion of "small probability" data packets in the currently obtained data packets is determined.
- the number or proportion exceeds a certain threshold, it can be determined that data anomaly currently exists.
- the clustering algorithm is an algorithm for performing similarity analysis and data statistics on a plurality of samples.
- the fields in the data packets can be used as dimensions to map each data packet to a point in a multidimensional space, and then a clustering algorithm is used to divide and cluster the plurality of data packets.
- a hierarchical clustering algorithm such as the BIRCH algorithm, CURE algorithm, or the like, or a density-based clustering algorithm, such as the DBSCAN algorithm, the OPTICS algorithm, and so on, and other possible clustering algorithms can be adopted.
- the process of FIG. 3 may be specifically performed as follows.
- the positions of the currently obtained plurality of data packets in the distribution space of the historical clustering distribution are determined, to obtain a plurality of positions, and distance between each of the plurality of positions and a corresponding cluster center position of the historical clustering distribution is determined, to obtain a plurality of distances.
- each data packet can be mapped to a point in a multi-dimensional space composed of fields as dimensions, which is also the distribution space of the historical clustering distribution. Accordingly, the positions P 1 , P 2 ,... P N of the currently obtained N data packets in the space of the historical clustering distribution can be determined through the above mapping.
- the position of the cluster center in the historical clustering distribution may be determined, and then the distances D 1 , D 2 , ... D N respectively between the positions P 1 , P 2 , ... P N and the cluster center position corresponding to the historical clustering distribution are determined. It can be understood that the distance is a distance between multi-dimensional vectors in the multi-dimensional space.
- the plurality of distances are respectively compared with a preset distance threshold to determine a number of distances exceeding the preset distance threshold, denoted as a second number.
- the cluster center is located in an area with the most densely distributed data. The further away from the cluster center, the lower the frequency or probability of corresponding data packet existing is . Therefore, the predetermined distance threshold can be set to a relatively large distance D 0 .
- step 33 it is determined whether data anomaly exists according to the second number. Specifically, in one example, if the second number M2 exceeds a predetermined number threshold M0, it is considered that data anomaly exists. That is, once there are more than M0 data packets in the N data packets currently far away from the cluster center, it is considered that data anomaly currently exists. In another example, if a ratio M2 / N of the second number M2 to the number N of the plurality of data packets exceeds a predetermined ratio threshold, it is determined that data anomaly exists. That is, once there are more than a predetermined percentage of the currently obtained N data packets that are away from the cluster center, it is considered that data anomaly currently exists.
- the number or proportion of data packets that are far away from the cluster center in the currently obtained data packets is determined.
- the number or proportion exceeds a certain threshold, it can be determined that data anomaly currently exists.
- the above examples of mixing the Gaussian distribution and the clustering distribution describe an implementation of comparing by substituting the current data packet into the historical distribution.
- the distribution states of the currently obtained plurality of data packets can be further determined as the current distribution, and the current distribution is compared with the historical distribution, to determine whether data anomaly exists.
- FIG. 4 shows a flowchart of a comparing and determining process according to another embodiment. It can be understood that the process shown in FIG. 4 is a sub-step of steps 23 and 24 in FIG. 2 .
- the data distribution states of the currently obtained plurality of data packets are determined as the current distribution; at step 42, the distribution center of the current distribution is determined; at step 43, the distribution center of the historical distribution is obtained; at step 44, an offset between the distribution center of the current distribution and the distribution center of the historical distribution is determined; at step 45, it is determined whether the offset exceeds a predetermined offset threshold; and when the offset exceeds the predetermined offset threshold, at step 46, it is determined that data anomaly exists.
- the above process compares the distribution center of the current distribution with the distribution center of the historical distribution. When an offset between the two exceeds a predetermined threshold, it is considered that data anomaly currently exists.
- a Gaussian mixture model and a clustering algorithm for example.
- the historical distribution is a historical probability distribution obtained by processing historical data with a hybrid Gaussian model.
- the same hybrid Gaussian model is used for processing the currently obtained plurality of data packets to obtain the mixed Gaussian distribution of the current data packet as the current probability distribution.
- a first peak position P1 is determined, where the first peak position is a peak position of a curve corresponding to the current probability distribution.
- a second peak position P2 is obtained, where the second peak position is a peak position of a curve corresponding to the historical probability distribution.
- the distribution center is embodied as the peak position of the probability distribution curve.
- a position offset ⁇ P between the first peak position P1 and the second peak position P2 is determined.
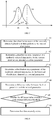
- FIG. 5 shows a schematic diagram of comparing peak positions described above.
- V1 is a curve schematically showing the current probability distribution
- V2 is a curve schematically showing the historical probability distribution. It can be seen that the peak position of the curve V1 is schematically shown as P1, and the peak position of the curve V2 is schematically shown as P2. If the offset ⁇ P between the peak positions P1 and P2 is larger than a preset threshold, then it can be considered that the current probability distribution has changed greatly compared to the historical probability distribution, so data anomaly may exist currently.
- the hybrid Gaussian model may perform data statistics based on more dimensions.
- the actual probability distribution curve is a three-dimensional and multi-dimensional curve.
- FIG. 5 is just a simplified illustration.
- the process of FIG. 4 may be similarly performed. Specifically, at step 41, the same clustering algorithm is used to determine the clustering distribution of the currently obtained plurality of data packets as the current clustering distribution. At step 42, a first center position is determined, and the first center position is a center position of a cluster corresponding to the current cluster distribution; at step 43, a second center position is obtained, and the second center position is the center position of the cluster corresponding to the historical cluster distribution.
- the distribution center is embodied as the center position of the cluster distribution. It can be understood that although different clustering algorithms can cluster the data into different clusters, the center of the entire clustering distribution can always be determined by clustering or searching for the center of gravity. In this way, the first center position and the second center position can be determined respectively.
- a distance D between the first center position and the second center position is determined. It can be understood that the distance may be a distance between multi-dimensional points or multi-dimensional vectors in a multi-dimensional space.
- step 45 it is determined whether the distance D exceeds a predetermined distance threshold. If D exceeds the distance threshold, it is determined that data anomaly exists.
- the center position of the current clustering distribution is compared with the center position of the historical clustering distribution. If the center of the clustering distribution is greatly shifted, it is considered that data anomaly currently exists.
- FIG. 6 shows a flowchart of a comparing and determining process according to another embodiment. It can be understood that the process shown in FIG. 6 is a sub-step of steps 23 and 24 in FIG. 2 . As shown in FIG.
- data distribution states of the currently obtained plurality of data packets are determined as the current distribution; at step 62, a distribution state parameter of a randomly selected data packet in the current distribution is determined, denoted as a first parameter; at step 63, a distribution state parameter of the randomly selected data packet in the historical distribution is determined, denoted as a second parameter; at step 64, a difference value between the first parameter and the second parameter is determined; and at step 65, it is determined whether the difference value exceeds a predetermined difference threshold; and when the difference value exceeds the predetermined difference threshold, at step 66, it is determined that data anomaly exists.
- the above process randomly selects a sample, compares the respective state parameters of the sample in the current distribution and in the historical distribution, and when the difference between the two exceeds a predetermined threshold, it is considered that data anomaly currently exists.
- a Gaussian mixture model and a clustering algorithm for example.
- the historical distribution is a historical probability distribution obtained by processing historical data with a hybrid Gaussian model. Accordingly, the flow of FIG. 6 may be performed as follows.
- the hybrid Gaussian model is used to determine the mixed Gaussian probability distribution of the currently obtained plurality of data packets as the current probability distribution.
- an occurrence probability of the randomly selected data packet in the current probability distribution is determined, denoted as a first probability p1;
- an occurrence probability of the randomly selected data packet in the historical probability distribution is determined, denoted as a second probability p2.
- a probability difference value ⁇ p between the first probability p1 and the second probability p2 is determined.
- FIG. 7 shows a schematic diagram of comparing probability values mentioned above.
- V1 is a curve schematically showing the current probability distribution
- V2 is a curve schematically showing the historical probability distribution. It can be seen that the corresponding probability of the randomly selected data packet R in the current probability distribution curve V1 is p1, and the corresponding probability in the historical probability distribution curve V2 is p2. If the difference value ⁇ p between the probabilities p1 and p2 is larger than a preset threshold, then it can be considered that the current probability distribution has changed greatly compared to the historical probability distribution, so data anomaly may exist currently.
- the hybrid Gaussian model is generally based on multi-dimensional data statistics, and the actual distribution curve is a three-dimensional and multi-dimensional curve.
- FIG. 7 is just a simplified illustration.
- the process of FIG. 6 may be similarly performed. Specifically, at step 61, the same clustering algorithm is used to determine the clustering distribution of the currently obtained plurality of data packets as the current clustering distribution.
- a distance between a position of the randomly selected data packet in the current clustering distribution and the center of the cluster corresponding to the current clustering distribution is determined, denoted as a first distance D1;
- a distance between a position of the randomly selected data packet in the historical clustering distribution and the center of the cluster corresponding to the current clustering distribution is determined, denoted as a first distance D2.
- the randomly selected data packet can be mapped to a point in the cluster distribution space, and the first distance D1 and the second distance D2 each is a distance between the point mapped by the randomly selected data packet and the center of the corresponding cluster distribution.
- the distance can be obtained by calculating the distance between multi-dimensional vectors in a multi-dimensional space.
- a distance difference value ⁇ D between the first distance D1 and the second distance D2 is determined.
- the distance of the same sample from the center in the current clustering distribution and from the center in the historical clustering distribution are compared. If there is a large deviation between the two, it is considered that there is a large deviation between the current clustering distribution and the history clustering distribution, and it is determined that data anomaly currently exists.
- the historical distribution is not limited to these two examples.
- Other algorithms can also be used, as long as the algorithm can analyze the statistics to obtain the distribution rule of historical data.
- the manner of comparing the currently obtained data packet with the historical distribution has been described above with reference to the specific processes of FIG. 3, FIG. 4 , and FIG. 6 , it can be understood that the manner of comparison is not limited to these specifically described examples. According to the specific form of historical distribution, other distribution state parameters can also be compared.
- the current obtained data packet can be compared with the historical distribution to determine whether data anomaly exists, so that the data anomaly can be found more effectively, and then early warning and early intervention can be performed.
- FIG. 8 shows a schematic block diagram of a determining device according to an embodiment.
- the determining device 800 includes: a data packet obtaining unit 81, configured to obtain a plurality of data packets within a predetermined time period, the plurality of data packets having the same data structure; a history obtaining unit 82, configured to obtain a historical distribution of historical data having the same data structure as the data packets; a comparing unit 83, configured to compare the plurality of data packets with the historical distribution; and a determining unit 84, configured to determine whether data anomaly exists according to the comparison result.
- the comparing unit 83 includes (shown by a dotted line on the left): a substitution module 831 configured to substitute the plurality of data packets into the historical distribution, thereby obtaining a corresponding distribution state parameter of each of the plurality of data packets in the historical distribution, to obtain a plurality of distribution state parameters; a threshold comparing module 832 configured to compare the plurality of distribution state parameters with a predetermined threshold related to the distribution state to determine a number of data packets having a distribution state parameter exceeding the threshold.
- the determining unit 84 is configured to determine whether data anomaly exists according to the number of data packets having a distribution state parameter exceeding the threshold.
- the comparing unit 83 includes (shown by a dotted line on the right): a distribution determining module 833 configured to determine a data distribution state of the plurality of data packets as a current distribution; and a distribution comparing module 834, configured to compare the current distribution with the historical distribution.
- the distribution comparing module 834 is configured to: determine a distribution center of the current distribution, and obtain a distribution center of the historical distribution; determine an offset between the distribution center of the current distribution and the distribution center of the historical distribution.
- the determining unit 84 is configured to determine that data anomaly exists in response to determining that the offset exceeds a predetermined offset threshold.
- the distribution comparing module 834 is configured to determine a distribution state parameter of a randomly selected data packet in the current distribution, denoted as a first parameter; determine a distribution state parameter of the randomly selected data packet in the historical distribution, denoted as a second parameter; and determine a difference value between the first parameter and the second parameter.
- the determining unit 84 is configured to determine that data anomaly exists in response to determining that the difference value exceeds a predetermined difference threshold.
- the historical distribution is a historical probability distribution obtained by processing the historical data with a hybrid Gaussian model.
- the substitution module 831 is configured to substitute the plurality of data packets into the historical probability distribution, thereby obtaining a probability value of each of the plurality of data packets in the historical probability distribution, to obtain a plurality of probability values;
- the threshold comparing module 832 is configured to compare the plurality of probability values with a predetermined probability threshold, and determine a number of data packets having a probability value smaller than the probability threshold, denoted a first number.
- the determining unit 84 is configured to determine that data anomaly exists in response to determining that the first number exceeds a predetermined number threshold, or that a ratio between the first number and the number of the plurality of data packets exceeds a predetermined ratio threshold.
- the distribution determining module 833 is configured to process the plurality of data packets with a hybrid Gaussian model to obtain a current probability distribution; and the distribution comparing module 834 is configured to compare the current probability distribution with the historical probability distribution.
- the distribution comparing module 834 is configured to: determine a first peak position, where the first peak position is a peak position of a curve corresponding to the current probability distribution; obtain a second peak position, where the second peak position is a peak position of a curve corresponding to the historical probability distribution; and determine a position offset between the first peak position and the second peak position.
- the determining unit 84 is configured to determine that data anomaly exists in response to determining that the position offset exceeds a predetermined offset threshold.
- the distribution comparing module 834 is configured to determine an occurrence probability of a randomly selected data packet in the current probability distribution, denoted as a first probability; determine an occurrence probability of the randomly selected data packet in the historical probability distribution, denoted as a second probability; and determine a probability difference value between the first probability and the second probability.
- the determining unit 84 is configured to determine that data anomaly exists in response to determining that the probability difference value exceeds a predetermined difference threshold.
- the historical distribution is a historical clustering distribution obtained with a clustering algorithm for the historical data.
- the substitution module 831 is configured to: determine a corresponding position of each of the plurality of data packets in the distribution space of the historical clustering distribution, to obtain a plurality of positions; and determine a distance between each of the plurality of positions and a corresponding cluster center position of the historical clustering distribution, to obtain a plurality of distances.
- the threshold comparing module 832 is configured to compare the plurality of distances with a preset distance threshold, to determine a number of distances exceeding the preset distance threshold, denoted as a second number.
- the determining unit 84 is configured to determine that data anomaly exists in response to determining that the second number exceeds a predetermined number threshold, or that a ratio between the second number and the number of the plurality of data packets exceeds a predetermined ratio threshold.
- the distribution determining module 833 is configured to process the plurality of data packets with the clustering algorithm to obtain a current clustering distribution; and the distribution comparing module 834 is configured to compare the current clustering distribution with the historical clustering distribution.
- the distribution comparing module 834 is configured to: determine a first center position, where the first center position is a center position of a cluster corresponding to the current cluster distribution; obtain a second center position, where the second center position is a center position of a cluster corresponding to the historical clustering distribution; and determine a distance between the first center position and the second center position.
- the determining unit 84 is configured to determine that data anomaly exists in response to determining that the distance exceeds a predetermined distance threshold.
- the distribution comparing module 834 is configured to determine a distance between a position of a randomly selected data packet in the current clustering distribution and a center of the cluster corresponding to the current clustering distribution, denoted as a first distance; determine a distance between a position of the randomly selected data packet in the historical clustering distribution and the center of the cluster corresponding to the current clustering distribution, denoted as a first distance; and determine a distance difference value between the first distance and the second distance.
- the determining unit 84 is configured to determine that data anomaly exists in response to determining that the distance difference value exceeds a predetermined difference threshold.
- the current obtained data packet can be compared with the historical distribution to determine whether data anomaly exists, so that the data anomaly can be found more effectively, and then early warning and early intervention can be performed.
- a computer-readable storage medium on which a computer program is stored, and when the computer program is executed in a computer, the computer is caused to perform the method described in conjunction with FIG. 2 to FIG. 6 .
- a computing device including a memory and a processor, where the memory stores executable codes, and when the processor executes the executable codes, performs the method described in conjunction with FIG. 2 to FIG. 6 .
Landscapes
- Engineering & Computer Science (AREA)
- Theoretical Computer Science (AREA)
- Computer Security & Cryptography (AREA)
- General Engineering & Computer Science (AREA)
- Physics & Mathematics (AREA)
- General Physics & Mathematics (AREA)
- Data Mining & Analysis (AREA)
- Computing Systems (AREA)
- Computer Networks & Wireless Communication (AREA)
- Signal Processing (AREA)
- Software Systems (AREA)
- Computer Hardware Design (AREA)
- Mathematical Physics (AREA)
- Artificial Intelligence (AREA)
- Evolutionary Computation (AREA)
- Computer Vision & Pattern Recognition (AREA)
- Pure & Applied Mathematics (AREA)
- Mathematical Optimization (AREA)
- Probability & Statistics with Applications (AREA)
- Algebra (AREA)
- Databases & Information Systems (AREA)
- Mathematical Analysis (AREA)
- Medical Informatics (AREA)
- Life Sciences & Earth Sciences (AREA)
- Evolutionary Biology (AREA)
- General Health & Medical Sciences (AREA)
- Bioinformatics & Computational Biology (AREA)
- Computational Linguistics (AREA)
- Computational Mathematics (AREA)
- Bioethics (AREA)
- Health & Medical Sciences (AREA)
- Bioinformatics & Cheminformatics (AREA)
- Data Exchanges In Wide-Area Networks (AREA)
Abstract
Description
- One or more embodiments of the present disclosure relate to the field of computer technology, and in particular, to a method and a device for determining data anomaly.
- With the upgrade of the Internet, data interaction between different platforms is becoming more frequent. For example, a user submits a credit request to a bank or a financial platform. The bank or financial platform sends the user's request data to a comprehensive computing platform for comprehensive evaluation to determine whether to approve the user's credit request and the approved credit amount. However, in order to consider the security and confidentiality of their users, each platform often performs some privacy protection processing on the data before sending the data to other platforms for processing. The processed data will lose its business meaning. After the receiving platform receives these data, it is difficult to determine whether there is an anomaly in the data according to the business rules. For example, whether the data was attacked during the data transmission, whether the data was tampered with, or whether the user group has shifted.
- Even in the same computing platform, data processing often goes through multiple links in the business chain. Data may also be abnormal during a certain business link or during the transmission between different business links, such as the system being attacked, the model being abnormal, and so on.
- On the other hand, in the context of big data, the amount of data has grown exponentially, and business rules are constantly changing and inexhaustible. Therefore, only using business rules to discover data anomaly has a huge and incomplete workload.
- Therefore, there is a demand for a more effective way to determine and warn about abnormalities in data.
- One or more embodiments of the present disclosure describe a method and a device, which can determine and warn about data anomaly without independently of the business meaning of the data.
- According to a first aspect, a method for determining data anomaly is provided, including: obtaining a plurality of data packets within a predetermined time period, the plurality of data packets having the same data structure; obtaining a historical distribution of historical data having the same data structure as the data packets; comparing the plurality of data packets with the historical distribution; and determining whether data anomaly exists according to the comparison result.
- According to an implementation, comparing the plurality of data packets with the historical distribution includes: substituting the plurality of data packets into the historical distribution, thereby obtaining a plurality of distribution state parameters of the plurality of data packets in the historical distribution; and comparing the plurality of distribution state parameters with a predetermined threshold related to the distribution state to determine a number of data packets having a distribution state parameter exceeding the threshold. Accordingly, determining whether data anomaly exists according to the comparison result includes determining whether data anomaly exists according to the number of data packets having a distribution state parameter exceeding the threshold.
- According to an implementation, comparing the plurality of data packets with the historical distribution includes: determining a data distribution state of the plurality of data packets as a current distribution; and comparing the current distribution with the historical distribution.
- According to an implementation, comparing the current distribution with the historical distribution includes: determining a distribution center of the current distribution; obtaining a distribution center of the historical distribution; and determining an offset between the distribution center of the current distribution and the distribution center of the historical distribution. Accordingly, determining whether data anomaly exists according to the comparison result includes determining that data anomaly exists in response to determining that the offset exceeds a predetermined offset threshold.
- According to another implementation, comparing the current distribution with the historical distribution includes: determining a distribution state parameter of a randomly selected data packet in the current distribution, denoted as a first parameter; determining a distribution state parameter of the randomly selected data packet in the historical distribution, denoted as a second parameter; and determining a difference value between the first parameter and the second parameter. Correspondingly, determining whether data anomaly exists according to the comparison result includes determining that data anomaly exists in response to determining that the difference value exceeds a predetermined difference threshold.
- According to an implementation, the historical distribution is a historical probability distribution obtained by processing the historical data with a hybrid Gaussian model; correspondingly, the current distribution is embodied as a current probability distribution obtained by processing the plurality of current data packets with a hybrid Gaussian model; the distribution state parameter can be embodied as a probability value; and the distribution center is embodied as a peak position of the probability distribution curve.
- According to another implementation, the historical distribution is a historical clustering distribution obtained with a clustering algorithm for the historical data; correspondingly, the current distribution is embodied as a current clustering distribution obtained by processing the plurality of current data packets with the same clustering algorithm; the distribution state parameters can be embodied as a distance between the position of the data packet in the clustering distribution space and the corresponding clustering center; the distribution center is embodied as the center position of the clustering distribution.
- According to a second aspect, a device for determining data anomaly is provided, including: a data packet obtaining unit configured to obtain a plurality of data packets within a predetermined time period, the plurality of data packets having the same data structure; a history obtaining unit configured to obtain a historical distribution of historical data having the same data structure as the data packets; a comparing unit configured to compare the plurality of data packets with the historical distribution; and a determining unit configured to determine whether data anomaly exists according to the comparison result.
- According to a third aspect, a computer-readable storage medium is provided on which a computer program is stored, when the computer program is executed on a computer, the computer executes the method of the first aspect.
- According to a fourth aspect, there is provided a computing device including a memory and a processor, wherein the memory stores executable codes, and when the processor executes the executable codes, the processor implements the method of the first aspect.
- With the method and device provided in some embodiments of the present disclosure, the currently obtained data packet is compared with the historical distribution obtained based on historical data statistics, and whether the current data packet has data anomaly is determined according to the comparison result. In this way, it is possible to effectively determine and warn about data abnormalities independently of the business meaning of the data.
- In order to explain the technical solution of the embodiments of the present disclosure more clearly, the drawings used in the description of the embodiments will be briefly introduced below. Apparently, the drawings in the following description are only some implementations of the present disclosure. For example, for those of ordinary skill in the art, other drawings can be obtained based on these drawings without paying creative labor.
-
FIG. 1 shows a schematic diagram of an embodiment disclosed in the present disclosure; -
FIG. 2 shows a flowchart of a method according to an embodiment; -
FIG. 3 shows a flowchart of a comparing and determining process according to an embodiment; -
FIG. 4 shows a flowchart of a comparing and determining process according to another embodiment; -
FIG. 5 shows a schematic diagram of comparing peak positions; -
FIG. 6 shows a flowchart of a comparing and determining process according to yet another embodiment; -
FIG. 7 shows a schematic diagram of comparing probability values; -
FIG. 8 shows a schematic block diagram of a determining device according to an embodiment. - The solutions provided in the present disclosure are described below with reference to the drawings.
-
FIG. 1 is a schematic diagram of an embodiment disclosed in the present disclosure. InFIG. 1 , a computing platform, such as an Alipay server, obtains a plurality of data packets within a predetermined time period, such as a credit request data packet in which a user requests a credit. These data packets have the same data structures, for example, have the same fields. The content of the fields can include user's age, gender, income, credit amount, and so on. On the other hand, the computing platform also obtains a historical distribution of historical data with the same data structures, which can be composed of a large number of similar data packets received in a relatively longer time period before. Then, the computing platform compares the plurality of data packets with the historical distribution, and determines whether data anomaly exists according to the comparison result. If there is no data anomaly, the computing platform can continue to process the data or send the data to the next business link. If it is determined that there is an anomaly in the data, an early warning can be initiated to notify a relevant personnel to analyze the cause of the anomaly in the data and trigger a relevant solution. The specific implementation process of determining data anomaly is described below. -
FIG. 2 shows a method flowchart according to an embodiment. The execution entity of the method may be any computing platform with computing and processing capabilities, such as a server. As shown inFIG. 2 , the method includes:step 21, obtaining a plurality of data packets within a predetermined time period, the plurality of data packets having the same data structure;step 22, obtaining a history distribution of historical data having the same data structure;step 23, comparing the plurality of data packets with the historical distribution;step 24, determining whether data anomaly exists according to the comparison result. The following describes the execution manner of the above steps with specific examples. - First, at
step 21, a plurality of data packets is obtained within a predetermined time period. - In one embodiment, the plurality of data packets are data packets received from an external institution, such as a user's credit request data packet received by a Alipay server from a bank or a financial institution. At this time, the subsequent steps can be used to determine whether data anomaly exists in the data packet transmitted from the external institution. Such data anomaly may be caused by attacks, tampering during data transmission, or user group shifts.
- In another embodiment, the plurality of data packets are data packets generated by a certain service link in a data processing service chain. For example, for a credit request data packet received from an external institution, the credit request data packet needs to be processed in a plurality of business links, including field analysis, dimensionality reduction, model calculation, and so on. At this time, subsequent analysis can be performed on the data packets generated in any business link. Through subsequent analysis, it can be determined whether there is any data anomaly in the data packets of this service link. The data anomaly in the data packets of a certain business link may be caused by a problem in data transmission between business links, or a problem in the system or model of the business link. Therefore, determining the anomaly of the data packets of the intermediate business links can also help determine whether there is anomaly in the system or model.
- It can be understood that the plurality of data packets described above have the same data structures. More specifically, each data packet can have the same fields. In one example, the above data packet is a credit request data packet, and the fields of each data packet at this time may include the user's age, gender, income, credit amount, and so on. In another example, the data packet is a record of user operations and is used to analyze a user's behavior pattern. At this time, the fields of each data packet may include user ID, operation behavior, operation object, operation time, and so on.
- In one embodiment, the plurality of data packets obtained at
step 21 are data packets within a predetermined time period from the current time. The above predetermined time period may be set to a shorter time period, so that the obtained plurality of data packets are recently generated data packets. For example, when the amount of data is relatively large, the predetermined time period may be preset to 0.5s or Is; when the amount of data is relatively small, the predetermined time period may be preset to 30s or lmin. The number of obtained data packets can also be selected according to business requirements. In one embodiment, all data packets within the predetermined time period are obtained. In another embodiment, a predetermined number of data packets are obtained within the predetermined time period. - After obtaining the above-mentioned plurality of data packets with the same structure, on the other hand, at
step 22, the historical distribution of historical data is obtained. It can be understood that the above historical data has the same data structure as the data packet obtained atstep 21. And, generally, the historical data includes a large number of similar data packets received in a long time period previously, such as a week or a month. In one embodiment, the historical data and the data packet obtained atstep 21 have the same data sources. For example, in a case where the data packet atstep 21 is a credit request data packet from an external institution, correspondingly, the above-mentioned historical data is also a credit request data packet received from an external institution and received within a relatively long time period. When the data packet atstep 21 is a data packet generated by an intermediate service link, correspondingly, the above historical data is a data packet generated by the same service link within a longer time period previously. - The historical distribution of historical data can be obtained by performing statistics and calculations on historical data.
- Next, at
step 23, the currently obtained plurality of data packets is compared with the historical distribution; and atstep 24, it is determined whether data anomaly exists in the current data packet according to the comparison result. - There are various implementations for comparing the current data packet with the historical distribution at
step 23. Correspondingly, atstep 24, determining is made based on the comparison results generated by different comparison methods. - In one implementation, the comparison is performed by substitution.
FIG. 3 shows a flowchart of a comparing and determining process according to an embodiment. It can be understood that the process shown inFIG. 3 is a sub-step ofsteps FIG. 2 . As shown inFIG. 3 , the process includes the following steps. Atstep 31, a plurality of data packets are substituted into the historical distribution, thereby obtaining a corresponding distribution state parameter of each of the plurality of data packets in the historical distribution, to obtain a plurality of distribution state parameters; atstep 32, the plurality of distribution state parameters are compared with a predetermined threshold related to the distribution state to determine a number of data packets exceeding the threshold; then, atstep 33, it is determined whether data anomaly exists according to the number of data packets exceeding the threshold. - The above process is to substitute the currently obtained plurality of data packets into the historical distribution to determine the distribution states of the plurality of data packets in the historical distribution. If a large number (exceeding the threshold) of abnormal states occurs, It is considered that data anomaly currently exists.
- As mentioned above, historical distribution is the state of data distribution obtained by performing statistics and calculations on historical data. Different algorithms can be used to obtain historical distribution based on historical data. In the following, an implementation of the flow of
FIG. 3 will be described with respect to different forms of historical distribution using a Gaussian mixture model and a clustering algorithm for example. - In one embodiment, the historical distribution is a historical probability distribution obtained by processing historical data using a Gaussian Mixture Model (GMM). It can be understood that the hybrid Gaussian model GMM is a model that accurately quantifies objects with a Gaussian probability density function. GMM can decompose an object into several forms based on a Gaussian probability density function. The Gaussian probability density function usually takes the form of a normal distribution curve. As mentioned earlier, both the currently obtained data packets and historical data have the same data structure, which contains several fields. In one example, a hybrid Gaussian model can be used to decompose the data field as a dimension to determine the mixed Gaussian probability density function as the historical probability distribution.
- When the historical distribution is expressed as a Gaussian probability distribution, the process of
FIG. 3 may be performed as follows. Atstep 31, the currently obtained plurality of data packets are substituted into the historical probability distribution, and the probability values of the plurality of data packets respectively in the historical probability distribution are obtained to obtain a plurality of probability values. That is, when the historical distribution is a Gaussian probability distribution, the distribution state parameter is expressed as a distribution probability value. Assuming that N data packets are obtained, then atstep 31, it can be determined that the probability values of the N data packets in the historical probability distribution are p1, p2, ... pN, respectively. - At
step 32, the determined a plurality of probability values are respectively compared with a predetermined probability threshold, and a number of data packets having a probability value smaller than the probability threshold is determined, denoted as a first number. Generally, the predetermined probability threshold is a relatively small probability value p0. The size of the probability threshold p0 can be set according to business requirements. In this step, the number M1 (M1 <= N) of the probability values p1, p2, ... pN having a probability value smaller than the probability threshold p0 is determined. That is, it is determined how many packets in the current data packets are "small probability" packets. - Next, at
step 33, it is determined whether data anomaly exists according to the first number M1. More specifically, in one example, if the first number M1 exceeds a predetermined number threshold M0, it is determined that data anomaly exists. That is, once more than M0 data packets of the currently obtained N data packets are "small probability" data packets, it is considered that anomaly currently exists. In another example, if a ratio M1 / N of the first number M1 to the number N of the plurality of data packets exceeds a predetermined ratio threshold, it is determined that data anomaly exists. That is, once N data packets exceed a predetermined percentage of data packets as "small probability" data packets, it is considered that data anomaly currently exists. - In this way, the number or proportion of "small probability" data packets in the currently obtained data packets is determined. When the number or proportion exceeds a certain threshold, it can be determined that data anomaly currently exists.
- The following describes the implementation of
FIG. 3 when the historical distribution is a cluster distribution. It can be understood that the clustering algorithm is an algorithm for performing similarity analysis and data statistics on a plurality of samples. For data packets with the same data structure, the fields in the data packets can be used as dimensions to map each data packet to a point in a multidimensional space, and then a clustering algorithm is used to divide and cluster the plurality of data packets. During the clustering process, a hierarchical clustering algorithm, such as the BIRCH algorithm, CURE algorithm, or the like, or a density-based clustering algorithm, such as the DBSCAN algorithm, the OPTICS algorithm, and so on, and other possible clustering algorithms can be adopted. - When the historical distribution is embodied as a clustering distribution, the process of
FIG. 3 may be specifically performed as follows. Atstep 31, the positions of the currently obtained plurality of data packets in the distribution space of the historical clustering distribution are determined, to obtain a plurality of positions, and distance between each of the plurality of positions and a corresponding cluster center position of the historical clustering distribution is determined, to obtain a plurality of distances. As mentioned earlier, each data packet can be mapped to a point in a multi-dimensional space composed of fields as dimensions, which is also the distribution space of the historical clustering distribution. Accordingly, the positions P1, P2,... PN of the currently obtained N data packets in the space of the historical clustering distribution can be determined through the above mapping. Further, the position of the cluster center in the historical clustering distribution may be determined, and then the distances D1, D2, ... DN respectively between the positions P1, P2, ... PN and the cluster center position corresponding to the historical clustering distribution are determined. It can be understood that the distance is a distance between multi-dimensional vectors in the multi-dimensional space. - Next, at
step 32, the plurality of distances are respectively compared with a preset distance threshold to determine a number of distances exceeding the preset distance threshold, denoted as a second number. Generally, the cluster center is located in an area with the most densely distributed data. The further away from the cluster center, the lower the frequency or probability of corresponding data packet existing is . Therefore, the predetermined distance threshold can be set to a relatively large distance D0. The size of the distance threshold D0 can be set according to business requirements. Accordingly, in this step, the number M2 (M2 <= N) of the distances D1, D2, ... DN that is larger than the distance threshold D0 is determined. That is, it is determined how many of the currently obtained data packets are data packets far from the cluster center. - Then, at
step 33, it is determined whether data anomaly exists according to the second number. Specifically, in one example, if the second number M2 exceeds a predetermined number threshold M0, it is considered that data anomaly exists. That is, once there are more than M0 data packets in the N data packets currently far away from the cluster center, it is considered that data anomaly currently exists. In another example, if a ratio M2 / N of the second number M2 to the number N of the plurality of data packets exceeds a predetermined ratio threshold, it is determined that data anomaly exists. That is, once there are more than a predetermined percentage of the currently obtained N data packets that are away from the cluster center, it is considered that data anomaly currently exists. - In this way, the number or proportion of data packets that are far away from the cluster center in the currently obtained data packets is determined. When the number or proportion exceeds a certain threshold, it can be determined that data anomaly currently exists.
- The above examples of mixing the Gaussian distribution and the clustering distribution describe an implementation of comparing by substituting the current data packet into the historical distribution. In the case of a large number of currently obtained data packets, for example, exceeding a certain number (such as 200), the distribution states of the currently obtained plurality of data packets can be further determined as the current distribution, and the current distribution is compared with the historical distribution, to determine whether data anomaly exists.
- Specifically,
FIG. 4 shows a flowchart of a comparing and determining process according to another embodiment. It can be understood that the process shown inFIG. 4 is a sub-step ofsteps FIG. 2 . As shown inFIG. 4 , atstep 41, the data distribution states of the currently obtained plurality of data packets are determined as the current distribution; atstep 42, the distribution center of the current distribution is determined; atstep 43, the distribution center of the historical distribution is obtained; atstep 44, an offset between the distribution center of the current distribution and the distribution center of the historical distribution is determined; atstep 45, it is determined whether the offset exceeds a predetermined offset threshold; and when the offset exceeds the predetermined offset threshold, atstep 46, it is determined that data anomaly exists. - The above process compares the distribution center of the current distribution with the distribution center of the historical distribution. When an offset between the two exceeds a predetermined threshold, it is considered that data anomaly currently exists. In the following, an implementation of the flow of
FIG. 4 will be described with respect to different forms of historical distribution using a Gaussian mixture model and a clustering algorithm for example. - In one embodiment, the historical distribution is a historical probability distribution obtained by processing historical data with a hybrid Gaussian model. Correspondingly, at
step 41, the same hybrid Gaussian model is used for processing the currently obtained plurality of data packets to obtain the mixed Gaussian distribution of the current data packet as the current probability distribution. Next, atstep 42, a first peak position P1 is determined, where the first peak position is a peak position of a curve corresponding to the current probability distribution. Atstep 43, a second peak position P2 is obtained, where the second peak position is a peak position of a curve corresponding to the historical probability distribution. In other words, in the case of a Gaussian probability distribution, the distribution center is embodied as the peak position of the probability distribution curve. - Then, at
step 44, a position offset ΔP between the first peak position P1 and the second peak position P2 is determined. Atstep 45, it is determined whether the position offset ΔP exceeds a predetermined offset threshold, and if the position offset exceeds a predetermined threshold, it is determined that data anomaly currently exists. -
FIG. 5 shows a schematic diagram of comparing peak positions described above. InFIG. 5 , V1 is a curve schematically showing the current probability distribution, and V2 is a curve schematically showing the historical probability distribution. It can be seen that the peak position of the curve V1 is schematically shown as P1, and the peak position of the curve V2 is schematically shown as P2. If the offset ΔP between the peak positions P1 and P2 is larger than a preset threshold, then it can be considered that the current probability distribution has changed greatly compared to the historical probability distribution, so data anomaly may exist currently. - It can be understood that since a data packet may contain more fields, correspondingly, the hybrid Gaussian model may perform data statistics based on more dimensions. The actual probability distribution curve is a three-dimensional and multi-dimensional curve.
FIG. 5 is just a simplified illustration. - The above has described the implementation of comparing peak positions shown in
FIG. 4 in the case of Gaussian distribution. When the historical distribution is a clustering distribution obtained with a clustering algorithm, the process ofFIG. 4 may be similarly performed. Specifically, atstep 41, the same clustering algorithm is used to determine the clustering distribution of the currently obtained plurality of data packets as the current clustering distribution. Atstep 42, a first center position is determined, and the first center position is a center position of a cluster corresponding to the current cluster distribution; atstep 43, a second center position is obtained, and the second center position is the center position of the cluster corresponding to the historical cluster distribution. In other words, in the case of cluster distribution, the distribution center is embodied as the center position of the cluster distribution. It can be understood that although different clustering algorithms can cluster the data into different clusters, the center of the entire clustering distribution can always be determined by clustering or searching for the center of gravity. In this way, the first center position and the second center position can be determined respectively. - Next, at
step 44, a distance D between the first center position and the second center position is determined. It can be understood that the distance may be a distance between multi-dimensional points or multi-dimensional vectors in a multi-dimensional space. - Then, at
step 45, it is determined whether the distance D exceeds a predetermined distance threshold. If D exceeds the distance threshold, it is determined that data anomaly exists. - In the above manner, the center position of the current clustering distribution is compared with the center position of the historical clustering distribution. If the center of the clustering distribution is greatly shifted, it is considered that data anomaly currently exists.
- In addition to comparing the distribution centers, it is also possible to randomly select a sample and compare the state parameters of the same sample in different distributions, to determine whether data anomaly exists.
FIG. 6 shows a flowchart of a comparing and determining process according to another embodiment. It can be understood that the process shown inFIG. 6 is a sub-step ofsteps FIG. 2 . As shown inFIG. 6 , atstep 61, data distribution states of the currently obtained plurality of data packets are determined as the current distribution; atstep 62, a distribution state parameter of a randomly selected data packet in the current distribution is determined, denoted as a first parameter; atstep 63, a distribution state parameter of the randomly selected data packet in the historical distribution is determined, denoted as a second parameter; atstep 64, a difference value between the first parameter and the second parameter is determined; and atstep 65, it is determined whether the difference value exceeds a predetermined difference threshold; and when the difference value exceeds the predetermined difference threshold, atstep 66, it is determined that data anomaly exists. - The above process randomly selects a sample, compares the respective state parameters of the sample in the current distribution and in the historical distribution, and when the difference between the two exceeds a predetermined threshold, it is considered that data anomaly currently exists. In the following, an implementation of the flow of
FIG. 6 will be described with respect to different forms of historical distribution also using a Gaussian mixture model and a clustering algorithm for example. - In one embodiment, the historical distribution is a historical probability distribution obtained by processing historical data with a hybrid Gaussian model. Accordingly, the flow of
FIG. 6 may be performed as follows. Atstep 61, the hybrid Gaussian model is used to determine the mixed Gaussian probability distribution of the currently obtained plurality of data packets as the current probability distribution. Atstep 62, an occurrence probability of the randomly selected data packet in the current probability distribution is determined, denoted as a first probability p1; atstep 63, an occurrence probability of the randomly selected data packet in the historical probability distribution is determined, denoted as a second probability p2. Then, atstep 64, a probability difference value Δp between the first probability p1 and the second probability p2 is determined. Atstep 65, it is determined whether the probability difference value Δp exceeds a predetermined difference threshold, and if the predetermined difference threshold is exceeded, it is determined that data anomaly currently exists. -
FIG. 7 shows a schematic diagram of comparing probability values mentioned above. InFIG. 7 , V1 is a curve schematically showing the current probability distribution, and V2 is a curve schematically showing the historical probability distribution. It can be seen that the corresponding probability of the randomly selected data packet R in the current probability distribution curve V1 is p1, and the corresponding probability in the historical probability distribution curve V2 is p2. If the difference value Δp between the probabilities p1 and p2 is larger than a preset threshold, then it can be considered that the current probability distribution has changed greatly compared to the historical probability distribution, so data anomaly may exist currently. - It can be understood that the hybrid Gaussian model is generally based on multi-dimensional data statistics, and the actual distribution curve is a three-dimensional and multi-dimensional curve.
FIG. 7 is just a simplified illustration. - The above has described the implementation of state parameters of the same sample shown in
FIG. 6 in the case of Gaussian distribution. In the case where the historical distribution is a clustering distribution obtained with a clustering algorithm, the process ofFIG. 6 may be similarly performed. Specifically, atstep 61, the same clustering algorithm is used to determine the clustering distribution of the currently obtained plurality of data packets as the current clustering distribution. Atstep 62, a distance between a position of the randomly selected data packet in the current clustering distribution and the center of the cluster corresponding to the current clustering distribution is determined, denoted as a first distance D1; atstep 63, a distance between a position of the randomly selected data packet in the historical clustering distribution and the center of the cluster corresponding to the current clustering distribution is determined, denoted as a first distance D2. It can be understood that the randomly selected data packet can be mapped to a point in the cluster distribution space, and the first distance D1 and the second distance D2 each is a distance between the point mapped by the randomly selected data packet and the center of the corresponding cluster distribution. The distance can be obtained by calculating the distance between multi-dimensional vectors in a multi-dimensional space. - At
step 64, a distance difference value ΔD between the first distance D1 and the second distance D2 is determined. Atstep 65, it is determined whether the distance difference value exceeds a predetermined difference threshold, and if it exceeds the difference threshold, it is determined that data anomaly currently exists. - In the above method, the distance of the same sample from the center in the current clustering distribution and from the center in the historical clustering distribution are compared. If there is a large deviation between the two, it is considered that there is a large deviation between the current clustering distribution and the history clustering distribution, and it is determined that data anomaly currently exists.
- Although the above has been described with reference to hybrid Gaussian model and clustering distribution, the historical distribution is not limited to these two examples. Other algorithms can also be used, as long as the algorithm can analyze the statistics to obtain the distribution rule of historical data. In addition, although the manner of comparing the currently obtained data packet with the historical distribution has been described above with reference to the specific processes of
FIG. 3, FIG. 4 , andFIG. 6 , it can be understood that the manner of comparison is not limited to these specifically described examples. According to the specific form of historical distribution, other distribution state parameters can also be compared. - With the method described in the above embodiment, even if the currently obtained data packet is protected with privacy and loses business meaning, through statistical distribution of historical data, the current obtained data packet can be compared with the historical distribution to determine whether data anomaly exists, so that the data anomaly can be found more effectively, and then early warning and early intervention can be performed.
- According to an embodiment of another aspect, a device for determining data anomaly is also provided.
FIG. 8 shows a schematic block diagram of a determining device according to an embodiment. As shown inFIG. 8 , the determiningdevice 800 includes: a datapacket obtaining unit 81, configured to obtain a plurality of data packets within a predetermined time period, the plurality of data packets having the same data structure; ahistory obtaining unit 82, configured to obtain a historical distribution of historical data having the same data structure as the data packets; a comparingunit 83, configured to compare the plurality of data packets with the historical distribution; and a determiningunit 84, configured to determine whether data anomaly exists according to the comparison result. - In one embodiment, the comparing
unit 83 includes (shown by a dotted line on the left): asubstitution module 831 configured to substitute the plurality of data packets into the historical distribution, thereby obtaining a corresponding distribution state parameter of each of the plurality of data packets in the historical distribution, to obtain a plurality of distribution state parameters; athreshold comparing module 832 configured to compare the plurality of distribution state parameters with a predetermined threshold related to the distribution state to determine a number of data packets having a distribution state parameter exceeding the threshold. Correspondingly, the determiningunit 84 is configured to determine whether data anomaly exists according to the number of data packets having a distribution state parameter exceeding the threshold. - In another embodiment, the comparing
unit 83 includes (shown by a dotted line on the right): adistribution determining module 833 configured to determine a data distribution state of the plurality of data packets as a current distribution; and a distribution comparing module 834, configured to compare the current distribution with the historical distribution. - In one embodiment, the distribution comparing module 834 is configured to: determine a distribution center of the current distribution, and obtain a distribution center of the historical distribution; determine an offset between the distribution center of the current distribution and the distribution center of the historical distribution. Correspondingly, the determining
unit 84 is configured to determine that data anomaly exists in response to determining that the offset exceeds a predetermined offset threshold. - In one embodiment, the distribution comparing module 834 is configured to determine a distribution state parameter of a randomly selected data packet in the current distribution, denoted as a first parameter; determine a distribution state parameter of the randomly selected data packet in the historical distribution, denoted as a second parameter; and determine a difference value between the first parameter and the second parameter. Correspondingly, the determining
unit 84 is configured to determine that data anomaly exists in response to determining that the difference value exceeds a predetermined difference threshold. - In one embodiment, the historical distribution is a historical probability distribution obtained by processing the historical data with a hybrid Gaussian model. Correspondingly, the
substitution module 831 is configured to substitute the plurality of data packets into the historical probability distribution, thereby obtaining a probability value of each of the plurality of data packets in the historical probability distribution, to obtain a plurality of probability values; thethreshold comparing module 832 is configured to compare the plurality of probability values with a predetermined probability threshold, and determine a number of data packets having a probability value smaller than the probability threshold, denoted a first number. The determiningunit 84 is configured to determine that data anomaly exists in response to determining that the first number exceeds a predetermined number threshold, or that a ratio between the first number and the number of the plurality of data packets exceeds a predetermined ratio threshold. - In one embodiment, when the historical distribution is a Gaussian probability distribution, the
distribution determining module 833 is configured to process the plurality of data packets with a hybrid Gaussian model to obtain a current probability distribution; and the distribution comparing module 834 is configured to compare the current probability distribution with the historical probability distribution. - More specifically, in one example, the distribution comparing module 834 is configured to: determine a first peak position, where the first peak position is a peak position of a curve corresponding to the current probability distribution; obtain a second peak position, where the second peak position is a peak position of a curve corresponding to the historical probability distribution; and determine a position offset between the first peak position and the second peak position. Correspondingly, the determining
unit 84 is configured to determine that data anomaly exists in response to determining that the position offset exceeds a predetermined offset threshold. - In another example, the distribution comparing module 834 is configured to determine an occurrence probability of a randomly selected data packet in the current probability distribution, denoted as a first probability; determine an occurrence probability of the randomly selected data packet in the historical probability distribution, denoted as a second probability; and determine a probability difference value between the first probability and the second probability. Correspondingly, the determining
unit 84 is configured to determine that data anomaly exists in response to determining that the probability difference value exceeds a predetermined difference threshold. - In one embodiment, the historical distribution is a historical clustering distribution obtained with a clustering algorithm for the historical data. Accordingly, the
substitution module 831 is configured to: determine a corresponding position of each of the plurality of data packets in the distribution space of the historical clustering distribution, to obtain a plurality of positions; and determine a distance between each of the plurality of positions and a corresponding cluster center position of the historical clustering distribution, to obtain a plurality of distances. Thethreshold comparing module 832 is configured to compare the plurality of distances with a preset distance threshold, to determine a number of distances exceeding the preset distance threshold, denoted as a second number. Correspondingly, the determiningunit 84 is configured to determine that data anomaly exists in response to determining that the second number exceeds a predetermined number threshold, or that a ratio between the second number and the number of the plurality of data packets exceeds a predetermined ratio threshold. - In one embodiment, when the historical distribution is a historical clustering distribution, the
distribution determining module 833 is configured to process the plurality of data packets with the clustering algorithm to obtain a current clustering distribution; and the distribution comparing module 834 is configured to compare the current clustering distribution with the historical clustering distribution. - More specifically, in one example, the distribution comparing module 834 is configured to: determine a first center position, where the first center position is a center position of a cluster corresponding to the current cluster distribution; obtain a second center position, where the second center position is a center position of a cluster corresponding to the historical clustering distribution; and determine a distance between the first center position and the second center position. Correspondingly, the determining
unit 84 is configured to determine that data anomaly exists in response to determining that the distance exceeds a predetermined distance threshold. - In another example, the distribution comparing module 834 is configured to determine a distance between a position of a randomly selected data packet in the current clustering distribution and a center of the cluster corresponding to the current clustering distribution, denoted as a first distance; determine a distance between a position of the randomly selected data packet in the historical clustering distribution and the center of the cluster corresponding to the current clustering distribution, denoted as a first distance; and determine a distance difference value between the first distance and the second distance. Correspondingly, the determining
unit 84 is configured to determine that data anomaly exists in response to determining that the distance difference value exceeds a predetermined difference threshold. - With the device described in the above embodiment, even if the currently obtained data packet is protected with privacy and loses business meaning, through statistical distribution of historical data, the current obtained data packet can be compared with the historical distribution to determine whether data anomaly exists, so that the data anomaly can be found more effectively, and then early warning and early intervention can be performed.
- According to another embodiment of the present disclosure, there is also provided a computer-readable storage medium on which a computer program is stored, and when the computer program is executed in a computer, the computer is caused to perform the method described in conjunction with
FIG. 2 to FIG. 6 . - According to an embodiment of still another aspect, a computing device is further provided, including a memory and a processor, where the memory stores executable codes, and when the processor executes the executable codes, performs the method described in conjunction with
FIG. 2 to FIG. 6 . - Those skilled in the art should be aware that, in one or more of the above examples, the functions described in the present disclosure may be implemented by hardware, software, firmware, or any combination thereof. When implemented in software, these functions may be stored or transmitted as one or more instructions or codes on a computer-readable medium.
- The specific embodiments described above further describe the objectives, technical solutions, and beneficial effects of the present disclosure in detail. It should be understood that the above are only specific embodiments of the present disclosure, and are not intended to be limiting. Any modification, equivalent replacement, or improvement made on the basis of the technical solution of the present disclosure should be included in the protection scope of the present disclosure.
Claims (28)
- A method for determining data anomaly, comprising:obtaining a plurality of data packets within a predetermined time period, the plurality of data packets having the same data structure;obtaining a historical distribution of historical data having the same data structure as the data packets;comparing the plurality of data packets with the historical distribution to obtain a comparison result; anddetermining whether data anomaly exists according to the comparison result.
- The method according to claim 1, wherein comparing the plurality of data packets with the historical distribution comprises:substituting the plurality of data packets into the historical distribution, thereby obtaining a corresponding distribution state parameter of each of the plurality of data packets in the historical distribution, to obtain a plurality of distribution state parameters;comparing the plurality of distribution state parameters with a predetermined threshold related to a distribution state to determine a number of data packets having a distribution state parameter exceeding the threshold; andwherein determining whether data anomaly exists according to the comparison result comprises: determining whether data anomaly exists according to the number of data packets having a distribution state parameter exceeding the threshold.
- The method according to claim 1, wherein comparing the plurality of data packets with the historical distribution comprises:determining a data distribution state of the plurality of data packets as a current distribution; andcomparing the current distribution with the historical distribution.
- The method according to claim 3, wherein comparing the current distribution with the historical distribution comprises:determining a distribution center of the current distribution;obtaining a distribution center of the historical distribution;determining an offset between the distribution center of the current distribution and the distribution center of the historical distribution; andwherein determining whether data anomaly exists according to the comparison result comprises: determining that data anomaly exists in response to determining that the offset exceeds a predetermined offset threshold.
- The method according to claim 3, wherein comparing the current distribution with the historical distribution comprises:determining a distribution state parameter of a randomly selected data packet in the current distribution, denoted as a first parameter;determining a distribution state parameter of the randomly selected data packet in the historical distribution, denoted as a second parameter;determining a difference value between the first parameter and the second parameter; andwherein determining whether data anomaly exists according to the comparison result comprises: determining that data anomaly exists in response to determining that the difference value exceeds a predetermined difference threshold.
- The method according to claim 2, wherein the historical distribution is a historical probability distribution obtained by processing the historical data with a hybrid Gaussian model, and wherein comparing the plurality of data packets with the historical distribution comprises:substituting the plurality of data packets into the historical probability distribution, thereby obtaining a probability value of each of the plurality of data packets in the historical probability distribution, to obtain a plurality of probability values;comparing the plurality of probability values with a predetermined probability threshold, and determining a number of data packets having a probability value smaller than the probability threshold, denoted a first number; andwherein determining whether data anomaly exists according to the comparison result comprises: determining that data anomaly exists in response to determining that the first number exceeds a predetermined number threshold, or that a ratio between the first number and the number of the plurality of data packets exceeds a predetermined ratio threshold.
- The method according to claim 3, wherein the historical distribution is a historical probability distribution obtained by processing the historical data with a hybrid Gaussian model;
determining a data distribution state of the plurality of data packets as a current distribution comprises: processing the plurality of data packets with a hybrid Gaussian model to obtain a current probability distribution; and
comparing the current distribution with the historical distribution comprises comparing the current probability distribution with the historical probability distribution. - The method of claim 7, wherein comparing the current probability distribution with the historical probability distribution comprises:determining a first peak position, where the first peak position is a peak position of a curve corresponding to the current probability distribution;obtaining a second peak position, where the second peak position is a peak position of a curve corresponding to the historical probability distribution;determining a position offset between the first peak position and the second peak position; andwherein determining whether data anomaly exists according to the comparison result comprises: determining that data anomaly exists in response to determining that the position offset exceeds a predetermined offset threshold.
- The method according to claim 7, wherein comparing the current probability distribution with the historical probability distribution comprises:determining an occurrence probability of a randomly selected data packet in the current probability distribution, denoted as a first probability;determining an occurrence probability of the randomly selected data packet in the historical probability distribution, denoted as a second probability;determining a probability difference value between the first probability and the second probability; and whereindetermining whether data anomaly exists according to the comparison result comprises determining that data anomaly exists in response to determining that the probability difference value exceeds a predetermined difference threshold.
- The method according to claim 2, wherein the historical distribution is a historical clustering distribution obtained with a clustering algorithm for the historical data, wherein comparing the plurality of data packets with the historical distribution comprises:determining a corresponding position of each of the plurality of data packets in the distribution space of the historical clustering distribution, to obtain a plurality of positions;determining a distance between each of the plurality of positions and a corresponding cluster center position of the historical clustering distribution, to obtain a plurality of distances;comparing the plurality of distances with a preset distance threshold, to determine a number of distances exceeding the preset distance threshold, denoted as a second number; andwherein determining whether data anomaly exists according to the comparison result comprises: determining that data anomaly exists in response to determining that the second number exceeds a predetermined number threshold, or that a ratio between the second number and the number of the plurality of data packets exceeds a predetermined ratio threshold.
- The method according to claim 3, wherein the historical distribution is a historical clustering distribution obtained with a clustering algorithm for the historical data, wherein determining a data distribution state of the plurality of data packets as a current distribution comprises:processing the plurality of data packets with the clustering algorithm to obtain a current clustering distribution; andwherein comparing the current distribution with the historical distribution comprises: comparing the current clustering distribution with the historical clustering distribution.
- The method according to claim 11, wherein comparing the current clustering distribution with the historical clustering distribution comprises:determining a first center position, where the first center position is a center position of a cluster corresponding to the current cluster distribution;obtaining a second center position, where the second center position is a center position of a cluster corresponding to the historical clustering distribution;determining a distance between the first center position and the second center position; andwherein determining whether data anomaly exists according to the comparison result comprises determining that data anomaly exists in response to determining that the distance exceeds a predetermined distance threshold.
- The method according to claim 11, wherein comparing the current clustering distribution with the historical clustering distribution comprises:determining a distance between a position of a randomly selected data packet in the current clustering distribution and a center of the cluster corresponding to the current clustering distribution, denoted as a first distance;determining a distance between a position of the randomly selected data packet in the historical clustering distribution and the center of the cluster corresponding to the current clustering distribution, denoted as a first distance;determining a distance difference value between the first distance and the second distance; andwherein determining whether data anomaly exists according to the comparison result comprises determining that data anomaly exists in response to determining that the distance difference value exceeds a predetermined difference threshold.
- A device for determining data anomaly, comprising:a data packet obtaining unit configured to obtain a plurality of data packets within a predetermined time period, the plurality of data packets having the same data structure;a history obtaining unit configured to obtain a historical distribution of historical data having the same data structure as the data packets;a comparing unit configured to compare the plurality of data packets with the historical distribution to obtain a comparison result; anda determining unit configured to determine whether data anomaly exists according to the comparison result.
- The device according to claim 14, wherein the comparing unit comprises:a substitution module configured to substitute a plurality of data packets into the historical distribution, thereby obtaining a corresponding distribution state parameter of each of the plurality of data packets in the historical distribution, to obtain a plurality of distribution state parameters;a threshold comparing module configured to compare the plurality of distribution state parameters with a predetermined threshold related to a distribution state to determine a number of data packets having a distribution state parameter exceeding the threshold; andthe determining unit is configured to determine whether data anomaly exists according to the number of data packets having a distribution state parameter exceeding the threshold.
- The device according to claim 14, wherein the comparing unit comprises:a distribution determining module configured to determine a data distribution state of the plurality of data packets as a current distribution; anda distribution comparing module configured to compare the current distribution with the historical distribution.
- The device according to claim 16, wherein the distribution comparing module is configured to:determine a distribution center of the current distribution, and obtain a distribution center of the historical distribution;determine an offset between the distribution center of the current distribution and the distribution center of the historical distribution; andthe determining unit is configured to determine that data anomaly exists in response to determining that the offset exceeds a predetermined offset threshold.
- The device according to claim 16, wherein the distribution comparing module is configured to:determine a distribution state parameter of a randomly selected data packet in the current distribution, denoted as a first parameter;determine a distribution state parameter of the randomly selected data packet in the historical distribution, denoted as a second parameter;determine a difference value between the first parameter and the second parameter; andthe determining unit is configured to determine that data anomaly exists in response to determining that the difference value exceeds a predetermined difference threshold.
- The device according to claim 15, wherein the historical distribution is a historical probability distribution obtained by processing the historical data with a hybrid Gaussian model;
the substitution module is configured to substitute the currently obtained plurality of data packets into the historical probability distribution, thereby obtaining a probability value of each of the plurality of data packets in the historical probability distribution, to obtain a plurality of probability values;
the threshold comparing module is configured to compare the plurality of probability values with a predetermined probability threshold, and determine a number of data packets having a probability value smaller than the probability threshold, denoted a first number; and
the determining unit is configured to determine that data anomaly exists in response to determining that the first number exceeds a predetermined number threshold, or that a ratio between the first number and the number of the plurality of data packets exceeds a predetermined ratio threshold. - The device according to claim 16, wherein the historical distribution is a historical probability distribution obtained by processing the historical data with a hybrid Gaussian model;
the distribution determining module is configured to process the plurality of data packets with a hybrid Gaussian model to obtain a current probability distribution; and
the distribution comparing module is configured to compare the current probability distribution with the historical probability distribution. - The device according to claim 20, wherein the distribution comparing module is configured as:determine a first peak position, where the first peak position is a peak position of a curve corresponding to the current probability distribution;obtain a second peak position, where the second peak position is a peak position of a curve corresponding to the historical probability distribution;determine a position offset between the first peak position and the second peak position; andthe determining unit is configured to determine that data anomaly exists in response to determining that the position offset exceeds a predetermined offset threshold.
- The device according to claim 20, wherein the distribution comparing module is configured:determine an occurrence probability of a randomly selected data packet in the current probability distribution, denoted as a first probability;determine an occurrence probability of the randomly selected data packet in the historical probability distribution, denoted as a second probability;determine a probability difference value between the first probability and the second probability; andthe determining unit is configured to determine that data anomaly exists in response to determining that the probability difference value exceeds a predetermined difference threshold.
- The device according to claim 15, wherein the historical distribution is a historical clustering distribution obtained with a clustering algorithm for the historical data;
the substitution module is configured to determine a corresponding position of each of the plurality of data packets in the distribution space of the historical clustering distribution, to obtain a plurality of positions; and
determine a distance between each of the plurality of positions and a corresponding cluster center position of the historical clustering distribution, to obtain a plurality of distances;
the threshold comparing module is configured to compare the plurality of distances with a preset distance threshold, and determine a number of distances exceeding the preset distance threshold, denoted as a second number; and
the determining unit is configured to determine that data anomaly exists in response to determining that the second number exceeds a predetermined number threshold, or that a ratio between the second number and the number of the plurality of data packets exceeds a predetermined ratio threshold. - The device according to claim 16, wherein the historical distribution is a historical clustering distribution obtained with a clustering algorithm for the historical data;
the distribution determining module is configured to process the plurality of data packets with the clustering algorithm to obtain a current clustering distribution; and
the distribution comparing module is configured to compare the current clustering distribution with the historical clustering distribution. - The device according to claim 24, wherein the distribution comparing module is configured to:determine a first center position, where the first center position is a center position of a cluster corresponding to the current cluster distribution;obtain a second center position, where the second center position is a center position of a cluster corresponding to the historical clustering distribution;determine a distance between the first center position and the second center position; andthe determining unit is configured to determine that data anomaly exists in response to determining that the distance exceeds a predetermined distance threshold.
- The device according to claim 24, wherein the distribution comparing module is configured:determine a distance between a position of a randomly selected data packet in the current clustering distribution and a center of the cluster corresponding to the current clustering distribution, denoted as a first distance;determine a distance between a position of the randomly selected data packet in the historical clustering distribution and the center of the cluster corresponding to the current clustering distribution, denoted as a first distance;determine a distance difference value between the first distance and the second distance; andthe determining unit is configured to determine that data anomaly exists in response to determining that the distance difference value exceeds a predetermined difference threshold.
- A computer-readable storage medium having stored thereon a computer program that, when executed on a computer, causes the computer to perform the method of any one of claims 1-13.
- A computing device, comprising a memory and a processor, wherein the memory stores executable codes, and when the processor executes the executable codes, the processor implements the method according to any one of claims 1-13.
Applications Claiming Priority (2)
| Application Number | Priority Date | Filing Date | Title |
|---|---|---|---|
| CN201711474464.6A CN110110160B (en) | 2017-12-29 | 2017-12-29 | Method and device for determining data abnormality |
| PCT/CN2018/116085 WO2019128525A1 (en) | 2017-12-29 | 2018-11-19 | Method and device for determining data anomaly |
Publications (3)
| Publication Number | Publication Date |
|---|---|
| EP3654611A1 true EP3654611A1 (en) | 2020-05-20 |
| EP3654611A4 EP3654611A4 (en) | 2020-08-19 |
| EP3654611B1 EP3654611B1 (en) | 2021-06-23 |
Family
ID=67066389
Family Applications (1)
| Application Number | Title | Priority Date | Filing Date |
|---|---|---|---|
| EP18896044.7A Active EP3654611B1 (en) | 2017-12-29 | 2018-11-19 | Methods, computer-readable storage medium and device for determining data anomaly |
Country Status (6)
| Country | Link |
|---|---|
| US (2) | US10917424B2 (en) |
| EP (1) | EP3654611B1 (en) |
| CN (1) | CN110110160B (en) |
| SG (1) | SG11202001225RA (en) |
| TW (1) | TWI703454B (en) |
| WO (1) | WO2019128525A1 (en) |
Families Citing this family (7)
| Publication number | Priority date | Publication date | Assignee | Title |
|---|---|---|---|---|
| CN110110160B (en) | 2017-12-29 | 2020-04-14 | 阿里巴巴集团控股有限公司 | Method and device for determining data abnormality |
| US11288385B2 (en) | 2018-04-13 | 2022-03-29 | Sophos Limited | Chain of custody for enterprise documents |
| CN110781220A (en) * | 2019-09-20 | 2020-02-11 | 江苏欣皓测试技术有限公司 | Fault early warning method and device, storage medium and electronic equipment |
| TWI749416B (en) * | 2019-11-29 | 2021-12-11 | 中國鋼鐵股份有限公司 | Method for diagnosing abnormality of equipment having variable rotation speeds |
| CN112329784A (en) * | 2020-11-23 | 2021-02-05 | 桂林电子科技大学 | Correlation filtering tracking method based on space-time perception and multimodal response |
| CN113048807B (en) * | 2021-03-15 | 2022-07-26 | 太原理工大学 | A method for detecting abnormal back pressure of air-cooled unit |
| CN114444924A (en) * | 2022-01-25 | 2022-05-06 | 国网北京市电力公司 | Intelligent risk identification prevention and control method, system, device and storage medium |
Family Cites Families (48)
| Publication number | Priority date | Publication date | Assignee | Title |
|---|---|---|---|---|
| US5705739A (en) * | 1996-08-27 | 1998-01-06 | Levine; Robert A. | Detecting specific medical conditions from erythrocyte density distrubition in a centrifuged anticoagulated whole blood sample |
| US7181765B2 (en) | 2001-10-12 | 2007-02-20 | Motorola, Inc. | Method and apparatus for providing node security in a router of a packet network |
| US7213264B2 (en) | 2002-01-31 | 2007-05-01 | Mazu Networks, Inc. | Architecture to thwart denial of service attacks |
| US7254633B2 (en) * | 2002-02-07 | 2007-08-07 | University Of Massachusetts Amherst | Probabilistic packet marking |
| GB0410254D0 (en) * | 2004-05-07 | 2004-06-09 | British Telecomm | Processing of data in networks |
| US7653007B2 (en) * | 2004-06-04 | 2010-01-26 | Alcatel-Lucent Usa Inc. | Per-flow traffic estimation |
| US7519564B2 (en) * | 2004-11-16 | 2009-04-14 | Microsoft Corporation | Building and using predictive models of current and future surprises |
| KR20080066653A (en) | 2005-06-29 | 2008-07-16 | 트러스티스 오브 보스턴 유니버시티 | Method for full network anomaly diagnosis and method for detecting and classifying network anomalies using device and traffic feature distribution |
| US20070076611A1 (en) * | 2005-10-05 | 2007-04-05 | Fujitsu Limited | Detecting anomalies from acceptable traffic affected by anomalous traffic |
| US7712134B1 (en) | 2006-01-06 | 2010-05-04 | Narus, Inc. | Method and apparatus for worm detection and containment in the internet core |
| WO2007100916A2 (en) * | 2006-02-28 | 2007-09-07 | The Trustees Of Columbia University In The City Of New York | Systems, methods, and media for outputting a dataset based upon anomaly detection |
| US8248946B2 (en) | 2006-06-06 | 2012-08-21 | Polytechnic Institute of New York Unversity | Providing a high-speed defense against distributed denial of service (DDoS) attacks |
| US8312541B2 (en) * | 2007-07-17 | 2012-11-13 | Cisco Technology, Inc. | Detecting neighbor discovery denial of service attacks against a router |
| EP2227889B1 (en) * | 2007-12-31 | 2011-07-13 | Telecom Italia S.p.A. | Method of detecting anomalies in a communication system using symbolic packet features |
| ATE511296T1 (en) * | 2007-12-31 | 2011-06-15 | Telecom Italia Spa | METHOD FOR DETECTING ANOMALIES IN A COMMUNICATIONS SYSTEM USING NUMERICAL PACKET FEATURES |
| EP2088742B1 (en) * | 2008-02-11 | 2013-04-10 | Universita' degli studi di Brescia | Method for determining if an encrypted flow of packets belongs to a predefined class of flows |
| US9258217B2 (en) | 2008-12-16 | 2016-02-09 | At&T Intellectual Property I, L.P. | Systems and methods for rule-based anomaly detection on IP network flow |
| US8618934B2 (en) * | 2009-04-27 | 2013-12-31 | Kolos International LLC | Autonomous sensing module, a system and a method of long-term condition monitoring of structures |
| TWI367452B (en) * | 2009-08-21 | 2012-07-01 | Shih Chin Lee | Method for detecting abnormal transactions of financial assets and information processing device performing the method |
| US8874763B2 (en) * | 2010-11-05 | 2014-10-28 | At&T Intellectual Property I, L.P. | Methods, devices and computer program products for actionable alerting of malevolent network addresses based on generalized traffic anomaly analysis of IP address aggregates |
| US9106689B2 (en) * | 2011-05-06 | 2015-08-11 | Lockheed Martin Corporation | Intrusion detection using MDL clustering |
| US9628499B1 (en) * | 2012-08-08 | 2017-04-18 | Google Inc. | Statistics-based anomaly detection |
| CN103111982B (en) | 2013-01-25 | 2015-04-15 | 中国海洋石油总公司 | Installation device and disassembly device for component |
| CN103441982A (en) * | 2013-06-24 | 2013-12-11 | 杭州师范大学 | Intrusion alarm analyzing method based on relative entropy |
| US9288220B2 (en) * | 2013-11-07 | 2016-03-15 | Cyberpoint International Llc | Methods and systems for malware detection |
| US20150256431A1 (en) * | 2014-03-07 | 2015-09-10 | Cisco Technology, Inc. | Selective flow inspection based on endpoint behavior and random sampling |
| WO2015167421A1 (en) * | 2014-04-28 | 2015-11-05 | Hewlett-Packard Development Company, L.P. | Network flow classification |
| US9635050B2 (en) * | 2014-07-23 | 2017-04-25 | Cisco Technology, Inc. | Distributed supervised architecture for traffic segregation under attack |
| US9344441B2 (en) | 2014-09-14 | 2016-05-17 | Cisco Technology, Inc. | Detection of malicious network connections |
| US9722906B2 (en) * | 2015-01-23 | 2017-08-01 | Cisco Technology, Inc. | Information reporting for anomaly detection |
| KR101621019B1 (en) * | 2015-01-28 | 2016-05-13 | 한국인터넷진흥원 | Method for detecting attack suspected anomal event |
| US20170046700A1 (en) * | 2015-08-10 | 2017-02-16 | Ca, Inc. | Anomaly detection and user-context driven authorization request for automatic payments through mobile devices |
| US9953160B2 (en) * | 2015-10-13 | 2018-04-24 | Paypal, Inc. | Applying multi-level clustering at scale to unlabeled data for anomaly detection and security |
| CN105262647A (en) * | 2015-11-27 | 2016-01-20 | 广州神马移动信息科技有限公司 | Abnormal index detection method and device |
| US9979740B2 (en) * | 2015-12-15 | 2018-05-22 | Flying Cloud Technologies, Inc. | Data surveillance system |
| US10542026B2 (en) * | 2015-12-15 | 2020-01-21 | Flying Cloud Technologies, Inc. | Data surveillance system with contextual information |
| US10469511B2 (en) | 2016-03-28 | 2019-11-05 | Cisco Technology, Inc. | User assistance coordination in anomaly detection |
| CN105871879B (en) * | 2016-05-06 | 2019-03-05 | 中国联合网络通信集团有限公司 | Network element abnormal behaviour automatic testing method and device |
| CN106101102B (en) * | 2016-06-15 | 2019-07-26 | 华东师范大学 | A kind of exception flow of network detection method based on PAM clustering algorithm |
| CN106204335A (en) | 2016-07-21 | 2016-12-07 | 广东工业大学 | A kind of electricity price performs abnormality judgment method, Apparatus and system |
| US11397792B2 (en) * | 2016-09-08 | 2022-07-26 | Nec Corporation | Anomaly detecting device, anomaly detecting method, and recording medium |
| US10375096B2 (en) | 2016-12-08 | 2019-08-06 | Cisco Technology, Inc. | Filtering onion routing traffic from malicious domain generation algorithm (DGA)-based traffic classification |
| AU2018207582B2 (en) | 2017-01-14 | 2021-12-23 | Hyprfire Pty Ltd | Method and system for detecting and mitigating a denial of service attack |
| CN107515889A (en) * | 2017-07-03 | 2017-12-26 | 国家计算机网络与信息安全管理中心 | A kind of microblog topic method of real-time and device |
| CN107491970B (en) * | 2017-08-17 | 2021-04-02 | 北京三快在线科技有限公司 | Real-time anti-cheating detection monitoring method and system and computing equipment |
| CN107481117A (en) * | 2017-08-21 | 2017-12-15 | 掌阅科技股份有限公司 | Detection method, electronic equipment and the computer-readable storage medium of abnormal behaviour |
| US10686816B1 (en) | 2017-09-28 | 2020-06-16 | NortonLifeLock Inc. | Insider threat detection under user-resource bi-partite graphs |
| CN110110160B (en) | 2017-12-29 | 2020-04-14 | 阿里巴巴集团控股有限公司 | Method and device for determining data abnormality |
-
2017
- 2017-12-29 CN CN201711474464.6A patent/CN110110160B/en active Active
-
2018
- 2018-10-23 TW TW107137363A patent/TWI703454B/en active
- 2018-11-19 SG SG11202001225RA patent/SG11202001225RA/en unknown
- 2018-11-19 WO PCT/CN2018/116085 patent/WO2019128525A1/en not_active Ceased
- 2018-11-19 EP EP18896044.7A patent/EP3654611B1/en active Active
-
2020
- 2020-03-06 US US16/810,961 patent/US10917424B2/en active Active
- 2020-06-24 US US16/911,078 patent/US10917426B2/en active Active
Also Published As
| Publication number | Publication date |
|---|---|
| US20200213341A1 (en) | 2020-07-02 |
| EP3654611B1 (en) | 2021-06-23 |
| US10917426B2 (en) | 2021-02-09 |
| CN110110160A (en) | 2019-08-09 |
| WO2019128525A1 (en) | 2019-07-04 |
| CN110110160B (en) | 2020-04-14 |
| TWI703454B (en) | 2020-09-01 |
| US20200329063A1 (en) | 2020-10-15 |
| EP3654611A4 (en) | 2020-08-19 |
| TW201931167A (en) | 2019-08-01 |
| SG11202001225RA (en) | 2020-03-30 |
| US10917424B2 (en) | 2021-02-09 |
Similar Documents
| Publication | Publication Date | Title |
|---|---|---|
| US10917426B2 (en) | Method and device for determining data anomaly | |
| US11055407B2 (en) | Distribution-based analysis of queries for anomaly detection with adaptive thresholding | |
| US20250274470A1 (en) | Intrusion detection using robust singular value decomposition | |
| US20210092160A1 (en) | Data set creation with crowd-based reinforcement | |
| US7900194B1 (en) | Kernel-based intrusion detection using bloom filters | |
| US20240320329A1 (en) | Machine Learning Model Adversarial Attack Monitoring | |
| CN110830289A (en) | Container abnormity monitoring method and monitoring system | |
| EP3836481A1 (en) | Method for determining certificate state | |
| CN112422484B (en) | Method, apparatus, and storage medium for determining scenario for processing security event | |
| US9450819B2 (en) | Autonomic network sentinels | |
| JPWO2016208159A1 (en) | Information processing apparatus, information processing system, information processing method, and program | |
| US20230300155A1 (en) | Performing cybersecurity operations based on impact scores of computing events over a rolling time interval | |
| US20170142147A1 (en) | Rating threat submitter | |
| US20210092159A1 (en) | System for the prioritization and dynamic presentation of digital content | |
| US20250030717A1 (en) | Detecting polymorphic botnets using an image recognition platform | |
| US10223189B1 (en) | Root cause detection and monitoring for storage systems | |
| CN113051573B (en) | Host safety real-time monitoring alarm system based on big data | |
| CN117332438A (en) | Intelligent cloud storage method, device and storage medium for banking data | |
| CN111709021B (en) | Attack event identification method based on mass alarms and electronic device | |
| US9898357B1 (en) | Root cause detection and monitoring for storage systems | |
| CN119210841B (en) | Service access method, device, computer equipment, computer readable storage medium and product based on dynamic trust evaluation | |
| CN115085960B (en) | Network security access authentication method, device, electronic device and readable storage medium | |
| KR102137109B1 (en) | An apparatus for classify log massage to patterns | |
| CN119945673B (en) | An Adaptive Key Lifecycle Management Method and System Based on Dynamic Data | |
| CN121770719A (en) | Block chain-based intelligent contract safety protection detection method and system |
Legal Events
| Date | Code | Title | Description |
|---|---|---|---|
| STAA | Information on the status of an ep patent application or granted ep patent |
Free format text: STATUS: THE INTERNATIONAL PUBLICATION HAS BEEN MADE |
|
| PUAI | Public reference made under article 153(3) epc to a published international application that has entered the european phase |
Free format text: ORIGINAL CODE: 0009012 |
|
| STAA | Information on the status of an ep patent application or granted ep patent |
Free format text: STATUS: REQUEST FOR EXAMINATION WAS MADE |
|
| 17P | Request for examination filed |
Effective date: 20200213 |
|
| AK | Designated contracting states |
Kind code of ref document: A1 Designated state(s): AL AT BE BG CH CY CZ DE DK EE ES FI FR GB GR HR HU IE IS IT LI LT LU LV MC MK MT NL NO PL PT RO RS SE SI SK SM TR |
|
| AX | Request for extension of the european patent |
Extension state: BA ME |
|
| A4 | Supplementary search report drawn up and despatched |
Effective date: 20200717 |
|
| RIC1 | Information provided on ipc code assigned before grant |
Ipc: H04L 29/06 20060101AFI20200713BHEP Ipc: G06F 21/55 20130101ALI20200713BHEP |
|
| STAA | Information on the status of an ep patent application or granted ep patent |
Free format text: STATUS: EXAMINATION IS IN PROGRESS |
|
| 17Q | First examination report despatched |
Effective date: 20201106 |
|
| RAP1 | Party data changed (applicant data changed or rights of an application transferred) |
Owner name: ADVANCED NEW TECHNOLOGIES CO., LTD. |
|
| GRAP | Despatch of communication of intention to grant a patent |
Free format text: ORIGINAL CODE: EPIDOSNIGR1 |
|
| STAA | Information on the status of an ep patent application or granted ep patent |
Free format text: STATUS: GRANT OF PATENT IS INTENDED |
|
| DAV | Request for validation of the european patent (deleted) | ||
| DAX | Request for extension of the european patent (deleted) | ||
| INTG | Intention to grant announced |
Effective date: 20210401 |
|
| GRAS | Grant fee paid |
Free format text: ORIGINAL CODE: EPIDOSNIGR3 |
|
| GRAA | (expected) grant |
Free format text: ORIGINAL CODE: 0009210 |
|
| STAA | Information on the status of an ep patent application or granted ep patent |
Free format text: STATUS: THE PATENT HAS BEEN GRANTED |
|
| AK | Designated contracting states |
Kind code of ref document: B1 Designated state(s): AL AT BE BG CH CY CZ DE DK EE ES FI FR GB GR HR HU IE IS IT LI LT LU LV MC MK MT NL NO PL PT RO RS SE SI SK SM TR |
|
| REG | Reference to a national code |
Ref country code: GB Ref legal event code: FG4D |
|
| REG | Reference to a national code |
Ref country code: CH Ref legal event code: EP |
|
| REG | Reference to a national code |
Ref country code: DE Ref legal event code: R096 Ref document number: 602018019143 Country of ref document: DE Ref country code: AT Ref legal event code: REF Ref document number: 1405290 Country of ref document: AT Kind code of ref document: T Effective date: 20210715 |
|
| REG | Reference to a national code |
Ref country code: IE Ref legal event code: FG4D |
|
| REG | Reference to a national code |
Ref country code: LT Ref legal event code: MG9D |
|
| PG25 | Lapsed in a contracting state [announced via postgrant information from national office to epo] |
Ref country code: BG Free format text: LAPSE BECAUSE OF FAILURE TO SUBMIT A TRANSLATION OF THE DESCRIPTION OR TO PAY THE FEE WITHIN THE PRESCRIBED TIME-LIMIT Effective date: 20210923 Ref country code: HR Free format text: LAPSE BECAUSE OF FAILURE TO SUBMIT A TRANSLATION OF THE DESCRIPTION OR TO PAY THE FEE WITHIN THE PRESCRIBED TIME-LIMIT Effective date: 20210623 Ref country code: LT Free format text: LAPSE BECAUSE OF FAILURE TO SUBMIT A TRANSLATION OF THE DESCRIPTION OR TO PAY THE FEE WITHIN THE PRESCRIBED TIME-LIMIT Effective date: 20210623 Ref country code: FI Free format text: LAPSE BECAUSE OF FAILURE TO SUBMIT A TRANSLATION OF THE DESCRIPTION OR TO PAY THE FEE WITHIN THE PRESCRIBED TIME-LIMIT Effective date: 20210623 |
|
| REG | Reference to a national code |
Ref country code: AT Ref legal event code: MK05 Ref document number: 1405290 Country of ref document: AT Kind code of ref document: T Effective date: 20210623 |
|
| REG | Reference to a national code |
Ref country code: DE Ref legal event code: R079 Ref document number: 602018019143 Country of ref document: DE Free format text: PREVIOUS MAIN CLASS: H04L0029060000 Ipc: H04L0065000000 |
|
| PG25 | Lapsed in a contracting state [announced via postgrant information from national office to epo] |
Ref country code: GR Free format text: LAPSE BECAUSE OF FAILURE TO SUBMIT A TRANSLATION OF THE DESCRIPTION OR TO PAY THE FEE WITHIN THE PRESCRIBED TIME-LIMIT Effective date: 20210924 Ref country code: NO Free format text: LAPSE BECAUSE OF FAILURE TO SUBMIT A TRANSLATION OF THE DESCRIPTION OR TO PAY THE FEE WITHIN THE PRESCRIBED TIME-LIMIT Effective date: 20210923 Ref country code: LV Free format text: LAPSE BECAUSE OF FAILURE TO SUBMIT A TRANSLATION OF THE DESCRIPTION OR TO PAY THE FEE WITHIN THE PRESCRIBED TIME-LIMIT Effective date: 20210623 Ref country code: SE Free format text: LAPSE BECAUSE OF FAILURE TO SUBMIT A TRANSLATION OF THE DESCRIPTION OR TO PAY THE FEE WITHIN THE PRESCRIBED TIME-LIMIT Effective date: 20210623 Ref country code: RS Free format text: LAPSE BECAUSE OF FAILURE TO SUBMIT A TRANSLATION OF THE DESCRIPTION OR TO PAY THE FEE WITHIN THE PRESCRIBED TIME-LIMIT Effective date: 20210623 |
|
| REG | Reference to a national code |
Ref country code: NL Ref legal event code: MP Effective date: 20210623 |
|
| PG25 | Lapsed in a contracting state [announced via postgrant information from national office to epo] |
Ref country code: SK Free format text: LAPSE BECAUSE OF FAILURE TO SUBMIT A TRANSLATION OF THE DESCRIPTION OR TO PAY THE FEE WITHIN THE PRESCRIBED TIME-LIMIT Effective date: 20210623 Ref country code: EE Free format text: LAPSE BECAUSE OF FAILURE TO SUBMIT A TRANSLATION OF THE DESCRIPTION OR TO PAY THE FEE WITHIN THE PRESCRIBED TIME-LIMIT Effective date: 20210623 Ref country code: ES Free format text: LAPSE BECAUSE OF FAILURE TO SUBMIT A TRANSLATION OF THE DESCRIPTION OR TO PAY THE FEE WITHIN THE PRESCRIBED TIME-LIMIT Effective date: 20210623 Ref country code: NL Free format text: LAPSE BECAUSE OF FAILURE TO SUBMIT A TRANSLATION OF THE DESCRIPTION OR TO PAY THE FEE WITHIN THE PRESCRIBED TIME-LIMIT Effective date: 20210623 Ref country code: RO Free format text: LAPSE BECAUSE OF FAILURE TO SUBMIT A TRANSLATION OF THE DESCRIPTION OR TO PAY THE FEE WITHIN THE PRESCRIBED TIME-LIMIT Effective date: 20210623 Ref country code: PT Free format text: LAPSE BECAUSE OF FAILURE TO SUBMIT A TRANSLATION OF THE DESCRIPTION OR TO PAY THE FEE WITHIN THE PRESCRIBED TIME-LIMIT Effective date: 20211025 Ref country code: SM Free format text: LAPSE BECAUSE OF FAILURE TO SUBMIT A TRANSLATION OF THE DESCRIPTION OR TO PAY THE FEE WITHIN THE PRESCRIBED TIME-LIMIT Effective date: 20210623 Ref country code: AT Free format text: LAPSE BECAUSE OF FAILURE TO SUBMIT A TRANSLATION OF THE DESCRIPTION OR TO PAY THE FEE WITHIN THE PRESCRIBED TIME-LIMIT Effective date: 20210623 Ref country code: CZ Free format text: LAPSE BECAUSE OF FAILURE TO SUBMIT A TRANSLATION OF THE DESCRIPTION OR TO PAY THE FEE WITHIN THE PRESCRIBED TIME-LIMIT Effective date: 20210623 |
|
| PG25 | Lapsed in a contracting state [announced via postgrant information from national office to epo] |
Ref country code: PL Free format text: LAPSE BECAUSE OF FAILURE TO SUBMIT A TRANSLATION OF THE DESCRIPTION OR TO PAY THE FEE WITHIN THE PRESCRIBED TIME-LIMIT Effective date: 20210623 |
|
| REG | Reference to a national code |
Ref country code: DE Ref legal event code: R097 Ref document number: 602018019143 Country of ref document: DE |
|
| PG25 | Lapsed in a contracting state [announced via postgrant information from national office to epo] |
Ref country code: DK Free format text: LAPSE BECAUSE OF FAILURE TO SUBMIT A TRANSLATION OF THE DESCRIPTION OR TO PAY THE FEE WITHIN THE PRESCRIBED TIME-LIMIT Effective date: 20210623 |
|
| PLBE | No opposition filed within time limit |
Free format text: ORIGINAL CODE: 0009261 |
|
| STAA | Information on the status of an ep patent application or granted ep patent |
Free format text: STATUS: NO OPPOSITION FILED WITHIN TIME LIMIT |
|
| 26N | No opposition filed |
Effective date: 20220324 |
|
| PG25 | Lapsed in a contracting state [announced via postgrant information from national office to epo] |
Ref country code: AL Free format text: LAPSE BECAUSE OF FAILURE TO SUBMIT A TRANSLATION OF THE DESCRIPTION OR TO PAY THE FEE WITHIN THE PRESCRIBED TIME-LIMIT Effective date: 20210623 |
|
| PG25 | Lapsed in a contracting state [announced via postgrant information from national office to epo] |
Ref country code: MC Free format text: LAPSE BECAUSE OF FAILURE TO SUBMIT A TRANSLATION OF THE DESCRIPTION OR TO PAY THE FEE WITHIN THE PRESCRIBED TIME-LIMIT Effective date: 20210623 |
|
| REG | Reference to a national code |
Ref country code: CH Ref legal event code: PL |
|
| PG25 | Lapsed in a contracting state [announced via postgrant information from national office to epo] |
Ref country code: LU Free format text: LAPSE BECAUSE OF NON-PAYMENT OF DUE FEES Effective date: 20211119 Ref country code: IT Free format text: LAPSE BECAUSE OF FAILURE TO SUBMIT A TRANSLATION OF THE DESCRIPTION OR TO PAY THE FEE WITHIN THE PRESCRIBED TIME-LIMIT Effective date: 20210623 Ref country code: BE Free format text: LAPSE BECAUSE OF NON-PAYMENT OF DUE FEES Effective date: 20211130 |
|
| REG | Reference to a national code |
Ref country code: BE Ref legal event code: MM Effective date: 20211130 |
|
| PG25 | Lapsed in a contracting state [announced via postgrant information from national office to epo] |
Ref country code: LI Free format text: LAPSE BECAUSE OF NON-PAYMENT OF DUE FEES Effective date: 20211130 Ref country code: CH Free format text: LAPSE BECAUSE OF NON-PAYMENT OF DUE FEES Effective date: 20211130 |
|
| PG25 | Lapsed in a contracting state [announced via postgrant information from national office to epo] |
Ref country code: IE Free format text: LAPSE BECAUSE OF NON-PAYMENT OF DUE FEES Effective date: 20211119 |
|
| P01 | Opt-out of the competence of the unified patent court (upc) registered |
Effective date: 20230524 |
|
| PG25 | Lapsed in a contracting state [announced via postgrant information from national office to epo] |
Ref country code: CY Free format text: LAPSE BECAUSE OF FAILURE TO SUBMIT A TRANSLATION OF THE DESCRIPTION OR TO PAY THE FEE WITHIN THE PRESCRIBED TIME-LIMIT Effective date: 20210623 |
|
| PG25 | Lapsed in a contracting state [announced via postgrant information from national office to epo] |
Ref country code: HU Free format text: LAPSE BECAUSE OF FAILURE TO SUBMIT A TRANSLATION OF THE DESCRIPTION OR TO PAY THE FEE WITHIN THE PRESCRIBED TIME-LIMIT; INVALID AB INITIO Effective date: 20181119 |
|
| PG25 | Lapsed in a contracting state [announced via postgrant information from national office to epo] |
Ref country code: MK Free format text: LAPSE BECAUSE OF FAILURE TO SUBMIT A TRANSLATION OF THE DESCRIPTION OR TO PAY THE FEE WITHIN THE PRESCRIBED TIME-LIMIT Effective date: 20210623 |
|
| PG25 | Lapsed in a contracting state [announced via postgrant information from national office to epo] |
Ref country code: TR Free format text: LAPSE BECAUSE OF FAILURE TO SUBMIT A TRANSLATION OF THE DESCRIPTION OR TO PAY THE FEE WITHIN THE PRESCRIBED TIME-LIMIT Effective date: 20210623 |
|
| PG25 | Lapsed in a contracting state [announced via postgrant information from national office to epo] |
Ref country code: MT Free format text: LAPSE BECAUSE OF FAILURE TO SUBMIT A TRANSLATION OF THE DESCRIPTION OR TO PAY THE FEE WITHIN THE PRESCRIBED TIME-LIMIT Effective date: 20210623 |
|
| PGFP | Annual fee paid to national office [announced via postgrant information from national office to epo] |
Ref country code: GB Payment date: 20250925 Year of fee payment: 8 |
|
| PGFP | Annual fee paid to national office [announced via postgrant information from national office to epo] |
Ref country code: FR Payment date: 20250908 Year of fee payment: 8 |
|
| PGFP | Annual fee paid to national office [announced via postgrant information from national office to epo] |
Ref country code: DE Payment date: 20250923 Year of fee payment: 8 |