EP3612835B1 - Method for detecting the rancidity of oilseeds, seeds and nuts - Google Patents
Method for detecting the rancidity of oilseeds, seeds and nuts Download PDFInfo
- Publication number
- EP3612835B1 EP3612835B1 EP18723663.3A EP18723663A EP3612835B1 EP 3612835 B1 EP3612835 B1 EP 3612835B1 EP 18723663 A EP18723663 A EP 18723663A EP 3612835 B1 EP3612835 B1 EP 3612835B1
- Authority
- EP
- European Patent Office
- Prior art keywords
- absorption
- rancidity
- reflection spectrum
- sample
- process according
- Prior art date
- Legal status (The legal status is an assumption and is not a legal conclusion. Google has not performed a legal analysis and makes no representation as to the accuracy of the status listed.)
- Active
Links
- 238000000034 method Methods 0.000 title claims description 80
- 238000001228 spectrum Methods 0.000 claims description 80
- 238000010521 absorption reaction Methods 0.000 claims description 68
- 235000013399 edible fruits Nutrition 0.000 claims description 43
- 238000001514 detection method Methods 0.000 claims description 34
- 150000001299 aldehydes Chemical class 0.000 claims description 26
- 238000007254 oxidation reaction Methods 0.000 claims description 24
- 230000003647 oxidation Effects 0.000 claims description 23
- 150000004665 fatty acids Chemical class 0.000 claims description 19
- 235000014113 dietary fatty acids Nutrition 0.000 claims description 18
- 229930195729 fatty acid Natural products 0.000 claims description 18
- 239000000194 fatty acid Substances 0.000 claims description 18
- 150000002632 lipids Chemical class 0.000 claims description 18
- 150000001875 compounds Chemical class 0.000 claims description 13
- 239000000126 substance Substances 0.000 claims description 10
- 235000020986 nuts and seeds Nutrition 0.000 claims description 9
- 229920006395 saturated elastomer Polymers 0.000 claims description 8
- 239000004615 ingredient Substances 0.000 claims description 6
- 239000000470 constituent Substances 0.000 claims description 4
- 230000001678 irradiating effect Effects 0.000 claims description 4
- 150000001335 aliphatic alkanes Chemical class 0.000 claims description 3
- 150000001336 alkenes Chemical class 0.000 claims description 3
- 125000000524 functional group Chemical group 0.000 claims description 3
- 238000002360 preparation method Methods 0.000 claims description 3
- 238000002470 solid-phase micro-extraction Methods 0.000 claims description 3
- 238000004587 chromatography analysis Methods 0.000 claims description 2
- 229930195733 hydrocarbon Natural products 0.000 claims description 2
- 235000021391 short chain fatty acids Nutrition 0.000 claims description 2
- 230000010354 integration Effects 0.000 claims 2
- 238000005204 segregation Methods 0.000 claims 1
- 235000014571 nuts Nutrition 0.000 description 46
- 239000000523 sample Substances 0.000 description 43
- 239000003921 oil Substances 0.000 description 30
- 235000019198 oils Nutrition 0.000 description 30
- 239000000047 product Substances 0.000 description 19
- 238000005259 measurement Methods 0.000 description 12
- 238000002290 gas chromatography-mass spectrometry Methods 0.000 description 9
- 230000003595 spectral effect Effects 0.000 description 9
- 244000144725 Amygdalus communis Species 0.000 description 8
- 235000020224 almond Nutrition 0.000 description 8
- 238000004458 analytical method Methods 0.000 description 8
- 239000004006 olive oil Substances 0.000 description 7
- 235000008390 olive oil Nutrition 0.000 description 7
- 230000001590 oxidative effect Effects 0.000 description 7
- 235000019489 Almond oil Nutrition 0.000 description 6
- 239000008168 almond oil Substances 0.000 description 6
- 238000000701 chemical imaging Methods 0.000 description 6
- 238000001319 headspace solid-phase micro-extraction Methods 0.000 description 6
- 230000004927 fusion Effects 0.000 description 5
- 238000010438 heat treatment Methods 0.000 description 5
- 230000001953 sensory effect Effects 0.000 description 5
- 239000000796 flavoring agent Substances 0.000 description 4
- 235000013305 food Nutrition 0.000 description 4
- 238000004519 manufacturing process Methods 0.000 description 4
- 239000000463 material Substances 0.000 description 4
- 238000012545 processing Methods 0.000 description 4
- 238000000926 separation method Methods 0.000 description 4
- MHAJPDPJQMAIIY-UHFFFAOYSA-N Hydrogen peroxide Chemical compound OO MHAJPDPJQMAIIY-UHFFFAOYSA-N 0.000 description 3
- 238000000862 absorption spectrum Methods 0.000 description 3
- 238000013459 approach Methods 0.000 description 3
- 238000006243 chemical reaction Methods 0.000 description 3
- 235000019634 flavors Nutrition 0.000 description 3
- 239000011521 glass Substances 0.000 description 3
- 238000011005 laboratory method Methods 0.000 description 3
- 238000000985 reflectance spectrum Methods 0.000 description 3
- 238000003860 storage Methods 0.000 description 3
- 235000011437 Amygdalus communis Nutrition 0.000 description 2
- 208000012639 Balance disease Diseases 0.000 description 2
- DTOSIQBPPRVQHS-PDBXOOCHSA-N alpha-linolenic acid Chemical compound CC\C=C/C\C=C/C\C=C/CCCCCCCC(O)=O DTOSIQBPPRVQHS-PDBXOOCHSA-N 0.000 description 2
- 230000015572 biosynthetic process Effects 0.000 description 2
- 239000013590 bulk material Substances 0.000 description 2
- 230000002596 correlated effect Effects 0.000 description 2
- 230000000875 corresponding effect Effects 0.000 description 2
- 230000007547 defect Effects 0.000 description 2
- 238000003795 desorption Methods 0.000 description 2
- 230000000694 effects Effects 0.000 description 2
- 238000005516 engineering process Methods 0.000 description 2
- 230000002255 enzymatic effect Effects 0.000 description 2
- 238000011156 evaluation Methods 0.000 description 2
- -1 food Natural products 0.000 description 2
- 239000012634 fragment Substances 0.000 description 2
- 235000021588 free fatty acids Nutrition 0.000 description 2
- 238000004817 gas chromatography Methods 0.000 description 2
- 150000002432 hydroperoxides Chemical class 0.000 description 2
- 150000002576 ketones Chemical class 0.000 description 2
- 238000001819 mass spectrum Methods 0.000 description 2
- 230000007246 mechanism Effects 0.000 description 2
- 238000012544 monitoring process Methods 0.000 description 2
- 238000000491 multivariate analysis Methods 0.000 description 2
- 229930014626 natural product Natural products 0.000 description 2
- 238000010238 partial least squares regression Methods 0.000 description 2
- WRIDQFICGBMAFQ-UHFFFAOYSA-N (E)-8-Octadecenoic acid Natural products CCCCCCCCCC=CCCCCCCC(O)=O WRIDQFICGBMAFQ-UHFFFAOYSA-N 0.000 description 1
- LQJBNNIYVWPHFW-UHFFFAOYSA-N 20:1omega9c fatty acid Natural products CCCCCCCCCCC=CCCCCCCCC(O)=O LQJBNNIYVWPHFW-UHFFFAOYSA-N 0.000 description 1
- QSBYPNXLFMSGKH-UHFFFAOYSA-N 9-Heptadecensaeure Natural products CCCCCCCC=CCCCCCCCC(O)=O QSBYPNXLFMSGKH-UHFFFAOYSA-N 0.000 description 1
- 238000005033 Fourier transform infrared spectroscopy Methods 0.000 description 1
- 230000005526 G1 to G0 transition Effects 0.000 description 1
- OYHQOLUKZRVURQ-HZJYTTRNSA-N Linoleic acid Chemical compound CCCCC\C=C/C\C=C/CCCCCCCC(O)=O OYHQOLUKZRVURQ-HZJYTTRNSA-N 0.000 description 1
- 102000004882 Lipase Human genes 0.000 description 1
- 108090001060 Lipase Proteins 0.000 description 1
- 239000004367 Lipase Substances 0.000 description 1
- ZQPPMHVWECSIRJ-UHFFFAOYSA-N Oleic acid Natural products CCCCCCCCC=CCCCCCCCC(O)=O ZQPPMHVWECSIRJ-UHFFFAOYSA-N 0.000 description 1
- 239000005642 Oleic acid Substances 0.000 description 1
- 235000021355 Stearic acid Nutrition 0.000 description 1
- 239000002253 acid Substances 0.000 description 1
- 150000007513 acids Chemical class 0.000 description 1
- 230000006978 adaptation Effects 0.000 description 1
- 239000003463 adsorbent Substances 0.000 description 1
- 150000001298 alcohols Chemical class 0.000 description 1
- 235000020661 alpha-linolenic acid Nutrition 0.000 description 1
- 238000011088 calibration curve Methods 0.000 description 1
- 238000012512 characterization method Methods 0.000 description 1
- 238000003776 cleavage reaction Methods 0.000 description 1
- 230000001010 compromised effect Effects 0.000 description 1
- 230000001276 controlling effect Effects 0.000 description 1
- 238000010411 cooking Methods 0.000 description 1
- 230000007423 decrease Effects 0.000 description 1
- 239000007857 degradation product Substances 0.000 description 1
- 238000013461 design Methods 0.000 description 1
- 238000011161 development Methods 0.000 description 1
- 238000003306 harvesting Methods 0.000 description 1
- 239000008240 homogeneous mixture Substances 0.000 description 1
- 238000000265 homogenisation Methods 0.000 description 1
- 150000002430 hydrocarbons Chemical class 0.000 description 1
- 230000007062 hydrolysis Effects 0.000 description 1
- 238000006460 hydrolysis reaction Methods 0.000 description 1
- 230000003301 hydrolyzing effect Effects 0.000 description 1
- 238000011835 investigation Methods 0.000 description 1
- QXJSBBXBKPUZAA-UHFFFAOYSA-N isooleic acid Natural products CCCCCCCC=CCCCCCCCCC(O)=O QXJSBBXBKPUZAA-UHFFFAOYSA-N 0.000 description 1
- 235000020778 linoleic acid Nutrition 0.000 description 1
- OYHQOLUKZRVURQ-IXWMQOLASA-N linoleic acid Natural products CCCCC\C=C/C\C=C\CCCCCCCC(O)=O OYHQOLUKZRVURQ-IXWMQOLASA-N 0.000 description 1
- 229960004488 linolenic acid Drugs 0.000 description 1
- 235000019421 lipase Nutrition 0.000 description 1
- 239000003550 marker Substances 0.000 description 1
- 238000004949 mass spectrometry Methods 0.000 description 1
- 239000011159 matrix material Substances 0.000 description 1
- 238000004476 mid-IR spectroscopy Methods 0.000 description 1
- 239000000203 mixture Substances 0.000 description 1
- 238000010606 normalization Methods 0.000 description 1
- QIQXTHQIDYTFRH-UHFFFAOYSA-N octadecanoic acid Chemical compound CCCCCCCCCCCCCCCCCC(O)=O QIQXTHQIDYTFRH-UHFFFAOYSA-N 0.000 description 1
- OQCDKBAXFALNLD-UHFFFAOYSA-N octadecanoic acid Natural products CCCCCCCC(C)CCCCCCCCC(O)=O OQCDKBAXFALNLD-UHFFFAOYSA-N 0.000 description 1
- ZQPPMHVWECSIRJ-KTKRTIGZSA-N oleic acid Chemical compound CCCCCCCC\C=C/CCCCCCCC(O)=O ZQPPMHVWECSIRJ-KTKRTIGZSA-N 0.000 description 1
- 238000003825 pressing Methods 0.000 description 1
- 230000000750 progressive effect Effects 0.000 description 1
- 238000004451 qualitative analysis Methods 0.000 description 1
- 238000004064 recycling Methods 0.000 description 1
- 239000013074 reference sample Substances 0.000 description 1
- 230000007017 scission Effects 0.000 description 1
- 150000004666 short chain fatty acids Chemical class 0.000 description 1
- 210000002023 somite Anatomy 0.000 description 1
- 238000002798 spectrophotometry method Methods 0.000 description 1
- 238000004611 spectroscopical analysis Methods 0.000 description 1
- 238000003045 statistical classification method Methods 0.000 description 1
- 239000008117 stearic acid Substances 0.000 description 1
- 238000002411 thermogravimetry Methods 0.000 description 1
- 235000021122 unsaturated fatty acids Nutrition 0.000 description 1
- 150000004670 unsaturated fatty acids Chemical class 0.000 description 1
- 239000003039 volatile agent Substances 0.000 description 1
- 239000012855 volatile organic compound Substances 0.000 description 1
- 239000002699 waste material Substances 0.000 description 1
- XLYOFNOQVPJJNP-UHFFFAOYSA-N water Substances O XLYOFNOQVPJJNP-UHFFFAOYSA-N 0.000 description 1
Images

Classifications
-
- G—PHYSICS
- G01—MEASURING; TESTING
- G01N—INVESTIGATING OR ANALYSING MATERIALS BY DETERMINING THEIR CHEMICAL OR PHYSICAL PROPERTIES
- G01N33/00—Investigating or analysing materials by specific methods not covered by groups G01N1/00 - G01N31/00
- G01N33/02—Food
- G01N33/025—Fruits or vegetables
-
- B—PERFORMING OPERATIONS; TRANSPORTING
- B07—SEPARATING SOLIDS FROM SOLIDS; SORTING
- B07C—POSTAL SORTING; SORTING INDIVIDUAL ARTICLES, OR BULK MATERIAL FIT TO BE SORTED PIECE-MEAL, e.g. BY PICKING
- B07C5/00—Sorting according to a characteristic or feature of the articles or material being sorted, e.g. by control effected by devices which detect or measure such characteristic or feature; Sorting by manually actuated devices, e.g. switches
- B07C5/34—Sorting according to other particular properties
- B07C5/342—Sorting according to other particular properties according to optical properties, e.g. colour
-
- G—PHYSICS
- G01—MEASURING; TESTING
- G01N—INVESTIGATING OR ANALYSING MATERIALS BY DETERMINING THEIR CHEMICAL OR PHYSICAL PROPERTIES
- G01N21/00—Investigating or analysing materials by the use of optical means, i.e. using sub-millimetre waves, infrared, visible or ultraviolet light
- G01N21/84—Systems specially adapted for particular applications
- G01N21/85—Investigating moving fluids or granular solids
- G01N2021/8557—Special shaping of flow, e.g. using a by-pass line, jet flow, curtain flow
- G01N2021/8564—Sample as drops
-
- G—PHYSICS
- G01—MEASURING; TESTING
- G01N—INVESTIGATING OR ANALYSING MATERIALS BY DETERMINING THEIR CHEMICAL OR PHYSICAL PROPERTIES
- G01N33/00—Investigating or analysing materials by specific methods not covered by groups G01N1/00 - G01N31/00
- G01N33/02—Food
- G01N33/03—Edible oils or edible fats
Definitions
- the invention relates to a method for creating a rancidity index table and assigning a rancidity index value to an absorption or reflection spectrum of oil crops, nuts and seeds. Furthermore, it relates to a method for detecting the rancidity of an oil crop, nut or seed.
- the invention also relates to a device for detecting rancid oil fruits, nuts or seeds.
- ARANTZAZU VALDES ET AL "Monitoring the oxidative stability and volatiles in blanched, roasted and fried almonds under normal and accelerated storage conditions by DSC, thermogravimetric analysis and ATR-FTIR : Effect of cooking on the oxidative stability of almonds", EUROPEAN JOURNAL OF LIPID SCIENCE AND TECHNOLOGY., Vol. 117, No. 8, 24 February 2015, pages 1199-1213, XP055494712, ISSN: 1438-7697, D01: 10.1002/ejlt.201400384 discloses a method for creating a rancidity index table according to the preamble of claim 1 and a method according to the preamble of claim 11, respectively.
- the detection of different ingredients in individual elements of a bulk material is of interest, for example to distinguish between spoiled elements and elements that are not to be able to meet spoiled elements of the bulk material.
- such methods usually work in the near-infrared range.
- the photo sensors used In order to enable these methods to be used in production systems, it is necessary for the photo sensors used to have high refresh rates, generally of 300 Hz or more. This enables a high throughput to be guaranteed while at the same time reliably analyzing the components of each individual element examined.
- data captured by the photo sensors is analyzed using common statistical classification methods such as partial least squares, principle component regression, or the like. This qualitative analysis gives very good results when there are clear differences between spoiled elements and non-spoiled elements in the absorption or reflection spectrum.
- the rate of oxidation of fatty acids is about 1:10:100:200 for stearic acid (18:0), oleic acid (18:1, ⁇ -9), linoleic acid (18:2, ⁇ -6), and ⁇ -linolenic acid (18:3 , ⁇ - 3).
- the samples are heat treated at 100°C for 1, 3, 5, 7, 10, 15 and 20 days and the oxidative stability of the samples after these heat treatments is checked. Changes observed in the infrared spectral bands are used to monitor the progress of oxidation of almond oils. The rancidity of almonds is not explicitly mentioned, only "off-flavor development" is spoken of.
- the measurements with HS-SPME/GC-MS and ATR-FTIR were carried out independently of each other and the measurement results from both measurement types were only used to determine whether the result of the other measurement type is plausible. However, the results of the two measurement types are not linked together. In particular, no rancidity index or any other index is created from the measurement results.
- the invention is therefore based on the object of providing a method which avoids the described disadvantages of the prior art and enables automated detection of the rancidity of individual oleaginous fruits, nuts and seeds.
- this method according to the invention is suitable for the automated detection and sorting of oil seeds, seeds and nuts depending on their degree of rancidity to be used, with a high product throughput individual fruits can be detected and detected rancid fruits can be separated individually from the product flow in sorting systems.
- identifying the volatile components of the sample by mass spectroscopic detection of components relevant to lipid oxidation allows the creation of chromatograms in a range between 20 and 300 selected Mass/charge ratios occur, preferably at least one mass/charge ratio selected from 43, 44, 55, 56, 57, 60, 70, 71, 73, 74, 81, 83, 97.
- identifying the volatile components of the sample by mass spectroscopic detection of components relevant to lipid oxidation comprises generating a fatty acid chromatogram at a first mass/charge ratio and an aldehyde chromatogram at a second mass/charge ratio.
- samples with which the method according to the invention is carried out are selected in number and properties in such a way that a representative cross-section of possible rancidities can be determined. This can be ensured, among other things, by suitable sample selection and preparation (e.g. storage at elevated temperature for different periods of time).
- One embodiment of the method according to the invention is based on the enrichment of volatile compounds in the headspace above the sample, specifically on headspace solid phase microextraction (HS-SPME), coupled to a gas chromatograph with mass-selective detection.
- This combination of analysis methods is abbreviated as HS-SPME-GC-MS.
- the invention is not limited to this embodiment, but the method according to the invention basically comprises the measurement and determination of volatile compounds in the vapor space of the sample, the separation of individual components of the volatile compounds by means of gas chromatography, the identification by mass-selective detection of at least individual of the separated volatile compounds and that selectively using identified volatile compounds to determine the rancidity index.
- lipid oxidation of unsaturated fatty acids starts with the formation of hydroperoxides and leads to a large array of different chemical structures and functional groups.
- these groups of substances can potentially be used as marker compounds to measure the degree of lipid oxidation.
- aldehydes which are derived from fatty acid chain cleavage after hydroperoxide formation. With continued oxidation, the aldehydes can form free fatty acids, which can also contribute to other undesirable sensory properties of rancid nuts.
- HSI serum-derived aldehydes
- HS-SPME-GC-MS HS-SPME-GC-MS as follows: Individual oilseeds, nuts or seeds are ground and a suitable representative sample amount, eg 300 mg, is weighed into an appropriately sized glass jar and sealed gas-tight. A glass-coated magnetic stirrer can be included in the glass vessel.
- the volatile components are enriched using suitable techniques based on headspace analysis using suitable adsorbent or absorptive materials that are capable of reversibly binding volatile organic compounds. Furthermore, desorption takes place thermally at elevated temperatures, preferably directly in the inlet system of a gas chromatographic system.
- the volatile compounds are separated on high-resolution capillary columns with a suitable stationary phase and a temperature program capable of separating the analytes.
- the detection is carried out using mass-selective detection in such a way that a mass spectrum can be acquired over the entire mass range of the relevant target compounds in order to enable unambiguous identification of the compounds. Mass spectra are recorded in scan mode with a scan range of mass/charge ratios (m/ z) of preferably 20-300.
- a rancidity index value can be calculated by integrating the peaks of the aldehyde chromatogram with m/z 44 and the fatty acid chromatogram with m/z 60.
- the numbers obtained can be expressed either as an aldehyde index value, or as a fatty acid index value, or as a total rancidity index.
- the sum of the peak areas is divided by a fixed number to get a number that is more convenient to use.
- the method according to the invention thus uses a quantitative approach in which no obvious distinguishing features are searched for in the absorption or reflection spectra, but weak but still significant differences in the absorption or reflection spectra are correlated with a reference from the laboratory.
- the absorption or reflection spectra are thus not used to separate oilseeds and seeds into two categories according to "good” (hardly any or no products of a rancidity reaction) and “poor” (products of a rancidity reaction present), but a rancidity index is created. This has the advantage that the degree of rancidity can be determined quantitatively.
- one or more threshold values for the rancidity index can only be provided in a subsequent step, from which an oil fruit, a nut or a seed is classified as no longer conforming to quality or falling into different quality levels.
- this enables the advantage of a very simple adaptation to different quality requirements for oilseeds and seeds.
- the method according to the invention also offers the advantage that, for the first time, it is possible to identify the rancidity of oil seeds and seeds by means of spectrometry.
- chemical markers were found in the laboratory that directly correlate with rancidity.
- the absorption or reflection spectra of the photo sensor recorded on selected samples were correlated with the rancidity index determined for the same samples in the laboratory, so that the rancidity index can be calculated directly from the absorption or reflection spectrum.
- the method according to the invention provides an assignment of a rancidity index value to individual oleaginous fruits, nuts and seeds 2 , with an individual oleaginous fruit, nut or seed 2 being irradiated with a light source 3 in a first method step. According to a preferred embodiment variant, this takes place in the near-infrared range.
- the light reflected by or transmitted through the oil fruit, nut or seed 2 is then projected onto a photo sensor 4, which detects an absorption or reflection spectrum in a near infrared range of 900 to 2500 nm, preferably 900 to 1700 nm .
- the absorption or reflection spectrum is recorded by the photo sensor 4 in a range from 1000 to 1500 nm.
- the absorption or reflection spectrum is detected by hyperspectral detection.
- the volatile fraction is determined by headspace analysis of the volatile fraction of individual homogenized oleaginous fruits/seeds/nuts on suitable ad- and/or absorptive materials. After thermal desorption, the separation and detection takes place on a gas chromatographic system with mass-selective detection. The selection of corresponding selective mass fragments of the degradation products formed by the lipid oxidation enables a clear assignment to relevant substance classes and thus the creation of a suitable calibration model for the spectral data from the spectrum measurement, in particular HSI measurement.
- an aldehyde index value is determined by integrating over at least one area of a determined aldehyde chromatogram
- a fatty acid index value is determined by integrating over at least one area of a determined fatty acid chromatogram.
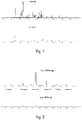
- figure 1 shows by way of illustration a chromatogram of a rancid sample and a fresh sample analyzed according to the method described above, the mass spectrometer upon detection in a scanning mode of mass/charge ratios (m/z) in a relevant mass range, e.g. from 20-300, was operated.
- m/z mass/charge ratios
- FIG. 12 shows an example of an aldehyde chromatogram of a rancid sample at the first mass/charge ratio (m/z) of 44 compared to a fresh sample.
- the determination of the aldehyde index value as described above obviously leads to a significantly higher aldehyde index value for the aldehyde chromatogram of the rancid sample than for the good sample.
- FIG. 12 shows an example of a fatty acid chromatogram of a rancid sample at the second mass/charge ratio (m/z) of 60 compared to a fresh sample.
- the determination of the fatty acid index value as described above obviously leads to a significantly higher fatty acid index value for the fatty acid chromatogram of the rancid sample than for the fresh sample analogously to in figure 2 described aldehyde index value.
- rancidity index table is created from the rancidity index values determined and the associated absorption and reflection spectra.
- the recorded absorption or reflection spectrum of the oil crop, nut or seed is assigned to the rancidity index value by assigning the rancidity index value to at least one of a mean value, a bandwidth or individual frequency bands of the recorded absorption or reflection spectrum.
- specific areas or a mean value of the respective absorption or reflection spectrum are defined as areas which are characteristic of the degree of rancidity of the oil fruits, nuts or seeds 2 .
- the invention provides a method for detecting the rancidity of an oil fruit, nut or seed 2 in order to solve the tasks set out at the beginning.
- a single oil fruit, nut or seed is irradiated with a light source. According to a preferred embodiment variant, this also takes place in the near-infrared range.
- the light reflected from the oil crop, nut or seed or transmitted through it is then projected onto a photo sensor, which records an absorption or reflection spectrum in a near-infrared range of preferably 900 to 1700 nm.
- the absorption or reflection spectrum is recorded by the photo sensor in a range from 1000 to 1500 nm.
- the absorption or reflection spectrum is preferably detected by hyperspectral detection using a hyperspectral camera.
- this method accesses the rancidity table of the previously described method, which contains the rancidity index values and the associated absorption or reflection spectra or characteristic ranges and/or wavelengths of these spectra.
- the following is a comparison of the absorbance or reflectance spectra obtained in this procedure with the absorbance or reflectance spectra contained in the rancidity index table.
- the recorded absorption or reflection spectrum is assigned to an absorption or reflection spectrum of the rancidity index table that is most similar to the recorded absorption or reflection spectrum. This enables the rancidity index value associated with the most similar absorption or reflection spectrum to be determined.
- This method offers the advantage that a previous calibration using the above-described method according to the invention for creating a rancidity index table enables the detection of the rancidity of an oil fruit, nut or seed in a production plant, with the rancidity of individual fruits being detected and not just a homogeneous one product stream.
- the recorded absorption or reflection spectrum is assigned to an absorption or reflection spectrum of the rancidity index table that is most similar to the recorded absorption or reflection spectrum by comparing at least one of a mean value, a bandwidth or individual frequency bands of the absorption or reflection spectra .
- certain areas or an average value of the respective absorption or reflection spectrum are defined as areas which are characteristic of the degree of rancidity of the oil fruits, nuts or seeds and used for this comparison. This advantageously increases the accuracy of the method.
- this detection method offers the advantage that in a further method step at least one threshold value can be defined and exceeding this at least one threshold value causes the oleaginous fruit, nut or seed to be separated or sorted in a differentiated manner.
- This offers the advantage that by defining a threshold value, it is possible to adapt to different quality requirements for the oil crops, nuts or seeds.
- the invention also includes a device, described in detail below, for detecting rancid oil fruits, nuts or seeds, this device being designed to process the detection method according to the invention, using a rancidity index table created according to the method for creating a rancidity index table.
- FIG 4 shows a schematic representation of a device 1 according to the invention for detecting rancid oil fruits, nuts or seeds 2, which comprises two light sources 3, 3', which can be provided together or alternatively, a photo sensor 4, a computer unit 5 and a sorting unit 6.
- the oil fruits, nuts or seeds 2 are successively passed by means of a transport device 7 in the form of a chute through the light beams emitted by the light source 3, 3a and are irradiated by them.
- the light sources 3, 3' emit light in the near-infrared range.
- the photo sensor 4 detects the light from the light source 3 reflected by the oil crop, the nut or the seed 2 or the transmitted light from the light source 3' and records the absorption or reflection spectrum of the oil crop, nut or the seed 2.
- the photo sensor 4 is connected to the computer unit 5 and transmits the recorded absorption or reflection spectrum to it.
- the computer unit 5 accesses the rancidity index table according to the method first described herein. This contains a series of rancidity index values and associated absorbance or reflectance spectra. The computer unit 5 compares the recorded absorption or reflection spectrum with the absorption or reflection spectra listed in the rancidity index table and assigns the recorded absorption or reflection spectrum to the most similar absorption or reflection spectrum in the rancidity index table. According to a preferred embodiment, this is done by comparing a mean value, a bandwidth or individual frequency bands of the absorption or reflection spectra, or a combination thereof. After assignment has taken place, the computer unit determines the rancidity index value assigned to the most similar absorption or reflection spectrum. As a result, a rancidity index value is assigned to each individual oil crop, nut or seed 2 detected by the device 1 .
- the oleaginous fruits, nuts or seeds 1 are guided past the sorting unit 6 , which is also connected to the computer unit 5 , with the computer unit 5 controlling the sorting unit 6 .
- the sorting unit 6 enables individual oleaginous fruits, nuts or seeds 2 to be sorted from a product stream of oleaginous fruits, nuts or seeds 2 guided through the device 1, for example by means of compressed air blasts 6a, which sort the oleaginous fruits, nuts or seeds into different sorting aisles 8 for Convey good products 2a and 9 for rancid products 2b, with the sorting aisles 8, 9 being implemented by chutes, for example.
- the computer unit 5 Based on a predetermined threshold value for the rancidity index value, the computer unit 5 makes a decision to convey the respective oil fruit, nut or the respective seed 2 to one of the sorting aisles.
- the sorting unit 6 can be designed as a flap device, a compressed air device (as shown) or the like. Further embodiments of the sorting unit 6 result from this exemplary reference for the person skilled in the art.
- HAI Hyperspectral Imaging
- a sample is irradiated with broadband light and the reflected light is recorded by a photo sensor, preferably in the near infrared range, and examined spectroscopically.
- spectra amplitude, frequency
- conclusions are drawn about properties or ingredients.
- Evidence of these properties and ingredients is the basis for distinguishing between good and bad products in the sorting process.
- Evidence of these properties/ingredients is based on a qualitative, relative approach. In a modeling process, the photometrically recorded spectra of the good products are compared with the bad product.
- areas of the spectrum are searched for in which the difference in properties is very large or the correlation to a searched substance is very high in contrast to other substances.
- the identified region(s) are then selected for the sorting process and the respective spectra normalized. This means that the absolute amplitudes of the spectrum are eliminated and only the differences between the range of good and bad products can be used for the sorting decision.
- the solution presented is based on a quantitative approach that eliminates the disadvantages of previous methods by not obtaining the sorting information from the spectral comparison of rancid oil fruits/nuts/seeds with non-rancid reference quantities, as was previously the case, but rather the chemical triggers of rancidity (lipid oxidation , hydrolysis) and the resulting substances (aldehydes, etc.) are examined with regard to their spectral fingerprint.
- rancidity index table developed according to the invention is used, which assigns the amplitudes in the corresponding spectral range to a rancidity value of, for example, 0-100% .
- This rancidity index table is developed using available analytical laboratory methods (e.g. gas chromatography etc.) on a statistically large quantity of oilseeds/nuts/seeds.
- rancidity index table is now used according to the invention using a photo sensor of a sorting system, preferably a hyperspectral camera, to detect the degree of rancidity of oilseeds, nuts and seeds, it being possible for the photo sensor to be calibrated using the rancidity index table of the sorting system.
- this table can be used to automatically deduce the quantitative degree (e.g. 0-100%) of rancidity from the absolute amplitude in the spectrum.
Description
Die Erfindung betrifft ein Verfahren zum Erstellen einer Ranzigkeitsindextabelle und Zuordnen eines Ranzigkeitsindexwerts zu einem Absorptions- oder Reflektionsspektrums von Ölfrüchten, Nüssen und Samen. Des Weiteren betrifft sie ein Verfahren zur Detektion der Ranzigkeit einer Ölfrucht, Nuss oder eines Samens.The invention relates to a method for creating a rancidity index table and assigning a rancidity index value to an absorption or reflection spectrum of oil crops, nuts and seeds. Furthermore, it relates to a method for detecting the rancidity of an oil crop, nut or seed.
Die Erfindung betrifft weiters eine Vorrichtung zur Detektion ranziger Ölfrüchte, Nüsse oder Samen.The invention also relates to a device for detecting rancid oil fruits, nuts or seeds.
Die Detektion und anschließende Sortierung von Schüttgütern mithilfe von Fotosensoren ist eine gängige Methode. Eine Ausführungsform eines solchen Verfahrens und einer solchen Vorrichtung zur Sortierung von Samen wird beispielsweise in der Veröffentlichung
Das Dokument
Das Dokument
Der Nachweis verschiedener Inhaltsstoffe in einzelnen Elementen eines Schüttguts ist von Interesse, um beispielsweise eine Unterscheidung zwischen verdorbenen Elementen und nicht verdorbenen Elementen des Schüttguts treffen zu können. Gemäß dem Stand der Technik arbeiten derartige Verfahren in der Regel im Nahinfrarotbereich. Um einen Einsatz dieser Verfahren in Produktionsanlagen zu ermöglichen ist es notwendig, dass die eingesetzten Fotosensoren hohe Bildwiederholraten, in der Regel von 300 Hz oder mehr aufweisen. Somit wird ermöglicht einen hohen Durchsatz bei gleichzeitig zuverlässiger Analyse der Inhaltsstoffe jedes einzelnen untersuchten Elements zu gewährleisten. Herkömmlicherweise werden von den Fotosensoren erfasste Daten mit gängigen statistischen Klassifikationsmethoden wie Partial Least Squares, Principle Component Regression oder ähnlichem analysiert. Diese qualitative Analyse führt zu sehr guten Ergebnissen, wenn es klare Unterschiede zwischen verdorbenen Elementen und nicht verdorbenen Elementen im Absorptions- oder Reflektionsspektrum gibt.The detection of different ingredients in individual elements of a bulk material is of interest, for example to distinguish between spoiled elements and elements that are not to be able to meet spoiled elements of the bulk material. According to the prior art, such methods usually work in the near-infrared range. In order to enable these methods to be used in production systems, it is necessary for the photo sensors used to have high refresh rates, generally of 300 Hz or more. This enables a high throughput to be guaranteed while at the same time reliably analyzing the components of each individual element examined. Traditionally, data captured by the photo sensors is analyzed using common statistical classification methods such as partial least squares, principle component regression, or the like. This qualitative analysis gives very good results when there are clear differences between spoiled elements and non-spoiled elements in the absorption or reflection spectrum.
Als nachteilig hat sich in derartigen Verfahren erwiesen, dass, wenn die Absorptions- oder Reflektionsspektra zu ähnlich werden, der Versuch einer Trennung zwischen verdorbenen Elementen und nicht verdorbenen Elementen in der Regel zu sehr vielen Fehlklassifikationen führt. Besonders nachteilig ist, dass im Falle einer nachfolgenden Sortierung dies zu sehr hohem Ausschuss von nicht verdorbenen Elementen führt. Gleichzeitig ergibt sich der Nachteil, dass nur eine sehr niedrige Detektionsrate von verdorbenen Elementen realisiert wird. Vor allem bei Naturprodukten wie Lebensmitteln ist dieser nachteilige Effekt besonders präsent, da die natürliche spektrale Streuung von nicht verdorbenen Elementen sehr groß im Vergleich zu kontrolliert hergestellten Elementen, wie beispielsweise Plastikflakes, ist.It has proven to be disadvantageous in such methods that if the absorption or reflection spectra become too similar, the attempt to separate corrupted elements and non-corrupted elements usually leads to a large number of misclassifications. It is particularly disadvantageous that in the case of a subsequent sorting this is too much leads to high waste of non-spoiled elements. At the same time, there is the disadvantage that only a very low detection rate of spoiled elements is realized. This disadvantageous effect is particularly present in natural products such as food, since the natural spectral scattering of elements that have not spoiled is very large compared to elements that have been manufactured in a controlled manner, such as plastic flakes.
Insbesondere bei Ölfrüchten, Nüsse und Samen, welche in Produktionsanlagen automatisiert verarbeitet werden, besteht ein großes Interesse ranzige, und somit verdorbene, Elemente von nicht ranzigen Elementen automatisiert zu unterschieden.In the case of oil fruits, nuts and seeds in particular, which are processed automatically in production plants, there is great interest in automatically distinguishing rancid, and therefore spoiled, elements from non-rancid elements.
Die geschmackliche Qualität von Nüssen und anderen Samen oder Ölfrüchten wird oft durch Lipidoxidation beeinträchtigt, was zu unerwünschten ranzigen Aromen führt. Die Lipidoxidation von Nüssen und anderen Ölfrüchten mit einem hohen Fettgehalt und daraus resultierende Ranzigkeit kann im Zuge der Lagerung und Verarbeitung auftreten. Dies beeinträchtigt massiv die sensorischen Eigenschaften (Verminderung der Genussqualität) und führt zu einem wertgeminderten Produkt.The flavor quality of nuts and other seeds or oilseeds is often compromised by lipid oxidation, resulting in undesirable rancid flavors. Lipid oxidation of nuts and other oilseeds with a high fat content and resulting rancidity can occur during storage and processing. This massively impairs the sensory properties (reduction in the quality of enjoyment) and leads to a reduced-value product.
Die Mechanismen der Lipidoxidation sind in der Literatur gut bekannt und beschrieben. Es gibt zwei verschiedene Mechanismen, die Ranzigkeit verursachen. Hydrolytische Ranzigkeit wird durch die Reaktion von Wasser mit Lipiden in Gegenwart von enzymatischer Aktivität (Lipase) verursacht. Oxidative Ranzigkeit kann in autooxidative, photooxidative und enzymatische Oxidationsreaktionen unterschieden werden. Die Fettsäurezusammensetzung ist neben anderen Faktoren hinsichtlich der Stabilität des Produktes kritisch. Die Stabilität von ungesättigten Säuren nimmt durch die Erhöhung des Grades der Ungesättigtheit dramatisch ab. Die Oxidationsgeschwindigkeit der Fettsäuren beträgt etwa 1: 10: 100: 200 für Stearinsäure (18: 0), Ölsäure (18: 1, ω - 9), Linolsäure (18: 2, ω - 6) und α - Linolensäure (18: 3, ω - 3).The mechanisms of lipid oxidation are well known and described in the literature. There are two different mechanisms that cause rancidity. Hydrolytic rancidity is caused by the reaction of water with lipids in the presence of enzymatic activity (lipase). Oxidative rancidity can be divided into auto-oxidative, photo-oxidative and enzymatic oxidation reactions. The fatty acid composition is critical to the stability of the product, among other factors. The stability of unsaturated acids decreases dramatically as the level of unsaturation increases. The rate of oxidation of fatty acids is about 1:10:100:200 for stearic acid (18:0), oleic acid (18:1, ω-9), linoleic acid (18:2, ω-6), and α-linolenic acid (18:3 , ω - 3).
Für die Bestimmung der Ranzigkeit können verschiedene Methoden verwendet werden. Die meisten Methoden erfordern eine große Probenmenge, so dass eine homogene Mischung von gemahlenen Ölfrüchten, Nüssen bzw. Samen verwendet wird. Dies beinhaltet den Nachteil, dass durch Homogenisierung einer großen Anzahl von Ölfrüchten, Nüssen bzw. Samen wertvolle Informationen von einzelnen verloren gehen. Ein weiterer Nachteil der bekannten Methoden ist darin zu sehen, dass diese Methoden bloße Labormethoden sind, die sich nicht für die Anwendung in automatisierten Detektionsverfahren und Sortieranlagen eignen. Darüber hinaus sind diese Labormethoden enorm zeitaufwändig und, wie oben erwähnt, für homogenisierte Produkte, nicht aber für einzelne Ölfrüchte, Samen und Nüsse anwendbar. Aus dem Dokument
Diese Studie wurde nicht an einzelnen Mandelkernen, sondern an aus einer Vielzahl von Mandeln gewonnenem Mandelöl, d.h. einem homogenisierten Produkt, durchgeführt. Es ist weder erwähnt, noch angedeutet, wie mithilfe der Ergebnisse dieser Studie eine Detektion und gegebenenfalls Aussortierung von einzelnen Mandeln in einem Produktstrom bewerkstelligt werden könnte. Das Ziel der Studie war es vielmehr, ein Verfahren basierend auf HS-SPME gekoppelt mit GC-MS vorzuschlagen, mit dem die rasche Analyse und Charakterisierung von aus der Lipidoxidation resultierenden flüchtigen Komponenten in Mandelölen möglich sein soll. Als Ergänzung zur Messung mit HS-SPME/GC-MS wurden auch die ATR-FTIR Spektren von Mandelölen während des Oxidationsprozesses überwacht. Es ist erwähnt, dass bei der HS-SPME-GC-MS Analyse die optimale Zeit für die oxidative Wärmebehandlung der Proben sieben Tage beträgt, weil erst nach dieser Zeit signifikante Unterschiede im Aldehydgehalt erkennbar sind und diese Zeit eine "vernünftig kurze Zeitdauer" der Analysezeit darstellt. Was die zusätzliche Analyse durch ATR-FIR betrifft, so ist erläutert, dass die Proben nach Wärmebehandlungszeiten von 1 bis 20 Tagen unter oxidativen Bedingungen vermessen wurden, wobei nach Wärmebehandlungszeiten von einem, drei und fünf Tagen noch keine signifikanten Unterschiede in den erhaltenen Spektren gefunden wurden. Erst nach dem fünften Tag der Wärmebehandlung konnten spektrale Veränderungen beobachtet werden, die auf fortschreitende Oxidation der Proben hindeuteten. Die Messungen mit HS-SPME/GC-MS bzw. ATR-FTIR wurden unabhängig voneinander durchgeführt und die Messresultate aus beiden Messarten dienten lediglich zur Feststellung, ob das Ergebnis der jeweils anderen Messart plausibel ist. Die Ergebnisse der beiden Messarten werden jedoch nicht miteinander verknüpft. Insbesondere wird kein Ranzigkeitsindex oder ein anderer Index aus den Messergebnissen erstellt.This study was not conducted on individual almond kernels, but on almond oil obtained from a variety of almonds, ie a homogenized product. It is neither mentioned nor indicated how the results of this study could be used to detect and, if necessary, sort out individual almonds in a product flow. Rather, the aim of the study was to propose a method based on HS-SPME coupled with GC-MS, with which the rapid analysis and characterization of volatile components in almond oils resulting from lipid oxidation should be possible. In addition to the measurement with HS-SPME/GC-MS, the ATR-FTIR spectra of almond oils were also monitored during the oxidation process. It is mentioned that in the HS-SPME-GC-MS analysis the optimal time for the oxidative heat treatment of the samples is seven days, because only after this time significant differences in the aldehyde content can be seen and this time represents a "reasonably short period" of the analysis time represents. As for the additional analysis by ATR-FIR, it is explained that the samples were measured after heat treatment times of 1 to 20 days under oxidative conditions, whereby no significant differences in the spectra obtained were found after heat treatment times of one, three and five days . Only after the fifth day of heat treatment could spectral changes be observed, which indicated progressive oxidation of the samples. The measurements with HS-SPME/GC-MS and ATR-FTIR were carried out independently of each other and the measurement results from both measurement types were only used to determine whether the result of the other measurement type is plausible. However, the results of the two measurement types are not linked together. In particular, no rancidity index or any other index is created from the measurement results.
In dem Dokument
Der Erfindung liegt somit die Aufgabe zugrunde ein Verfahren bereitzustellen, welches die geschilderten Nachteile des Standes der Technik vermeidet und eine automatisierte Detektion der Ranzigkeit von einzelnen Ölfrüchten, Nüssen und Samen ermöglicht.The invention is therefore based on the object of providing a method which avoids the described disadvantages of the prior art and enables automated detection of the rancidity of individual oleaginous fruits, nuts and seeds.
Erfindungsgemäß wird diese Aufgabenstellung durch ein Verfahren zum Erstellen einer Ranzigkeitsindextabelle und Zuordnen eines Ranzigkeitsindexwert zu einem Absorptions- oder Reflektionsspektrums von Ölfrüchten, Nüssen und Samen, umfassend die Schritte:
- Bestrahlen einer Probe einer Ölfrucht, einer Nuss oder eines Samens mit einer Lichtquelle,
- Projizieren des reflektierten und/oder transmittierten Lichts auf einen Fotosensor,
- Erfassen des Absorptions- oder Reflektionsspektrums der Probe in einem Wellenlängenbereich von 900 bis 2500 nm, vorzugsweise von 900 bis 1700 nm, noch bevorzugter von 1000 bis 1500nm, durch den Fotosensor,
- Extrahieren von Inhaltsstoffen der Probe durch Probenvorbereitungstechniken auf Basis einer Bestimmung flüchtiger Verbindungen aus einem Dampfraum über der Probe, vorzugsweise Festphasenmikroextraktion,
- Trennen von flüchtigen Komponenten der Probe mittels gaschromatographischer Techniken,
- Identifizieren von abgetrennten flüchtigen Komponenten der Probe durch massenspektroskopische Detektion von für die Lipidoxidation relevanten Bestandteilen der flüchtigen Komponenten,
- Bestimmen eines Ranzigkeitsindexwerts der Probe aus identifizierten flüchtigen Komponenten der Probe,
- Zuordnen zumindest von einzelnen charakteristischen Wellenlängen oder Wellenlängenbereichen des erfassten Absorptions- oder Reflektionsspektrums der Probe zu dem Ranzigkeitsindexwert,
- Wiederholen der vorangegangenen Schritte für eine repräsentative Anzahl an Proben und Bilden einer Ranzigkeitstabelle aus den ermittelten Ranzigkeitsindexwerten und zugeordneten Absorptions- oder Reflektionsspektren bzw. charakteristischen Wellenlängen oder Wellenlängenbereichen der erfassten Absorptions- oder Reflektionsspektren
gelöst.
- irradiating a sample of an oil crop, nut or seed with a light source,
- Projecting the reflected and/or transmitted light onto a photo sensor,
- detecting the absorption or reflection spectrum of the sample in a wavelength range from 900 to 2500 nm, preferably from 900 to 1700 nm, more preferably from 1000 to 1500 nm, by the photo sensor,
- extracting constituents of the sample by sample preparation techniques based on a determination of volatile compounds from a headspace above the sample, preferably solid phase micro-extraction,
- Separation of volatile components of the sample using gas chromatographic techniques,
- Identification of separated volatile components of the sample by mass spectroscopic detection of components of the volatile components relevant to lipid oxidation,
- determining a rancidity index value of the sample from identified volatile components of the sample,
- Assigning at least individual characteristic wavelengths or wavelength ranges of the recorded absorption or reflection spectrum of the sample to the rancidity index value,
- Repeating the previous steps for a representative number of samples and creating a rancidity table from the determined rancidity index values and associated absorption or reflection spectra or characteristic wavelengths or wavelength ranges of the detected absorption or reflection spectra
solved.
Im Unterschied zu analytischen, enorm zeitaufwändigen Methoden im Labor, wie den oben beschriebenen bekannten Verfahren, ist dieses erfindungsgemäße Verfahren geeignet, zur automatisierten Detektion und Sortierung von Ölfrüchten, Samen und Nüssen in Abhängigkeit ihres Ausmaßes an Ranzigkeit verwendet zu werden, wobei ein hoher Produktdurchsatz an einzelnen Früchten detektierbar ist und detektierte ranzige Früchte einzeln in Sortieranlagen aus dem Produktstrom trennbar sind.In contrast to analytical, extremely time-consuming methods in the laboratory, such as the known methods described above, this method according to the invention is suitable for the automated detection and sorting of oil seeds, seeds and nuts depending on their degree of rancidity to be used, with a high product throughput individual fruits can be detected and detected rancid fruits can be separated individually from the product flow in sorting systems.
In einer bevorzugten Ausführungsform der Erfindung umfasst das Identifizieren der flüchtigen Komponenten der Probe durch massenspektroskopische Detektion von für die Lipidoxidation relevanten Bestandteilen das Identifizieren von einer oder mehr Stoffgruppen/Funktionsgruppen, ausgewählt aus:
- Hydroperoxide
- Zyklische Hydroperoxide
- Gesättigte, einfach und zweifach ungesättigte Aldehyde
- Kohlenwasserstoffe (Alkane, Alkene)
- Alkohole (gesättigt und ungesättigt)
- Ketone (gesättigt und ungesättigt)
- Kurzkettige Fettsäuren
- Alkylfurane.
- hydroperoxides
- Cyclic hydroperoxides
- Saturated, mono and diunsaturated aldehydes
- Hydrocarbons (alkanes, alkenes)
- Alcohols (saturated and unsaturated)
- Ketones (saturated and unsaturated)
- Short-chain fatty acids
- alkylfurans.
Insbesondere kann das Identifizieren der flüchtigen Komponenten der Probe durch massenspektroskopische Detektion von für die Lipidoxidation relevanten Bestandteilen das Erstellen von Chromatogrammen bei in einem Bereich zwischen 20 und 300 ausgewählten Masse/Ladungsverhältnissen erfolgen, vorzugsweise bei zumindest einem Masse/Ladungsverhältnis, ausgewählt aus 43, 44, 55, 56, 57, 60, 70, 71, 73, 74, 81, 83, 97.In particular, identifying the volatile components of the sample by mass spectroscopic detection of components relevant to lipid oxidation allows the creation of chromatograms in a range between 20 and 300 selected Mass/charge ratios occur, preferably at least one mass/charge ratio selected from 43, 44, 55, 56, 57, 60, 70, 71, 73, 74, 81, 83, 97.
In einer spezifischen Ausführungsform der Erfindung umfasst das Identifizieren der flüchtigen Komponenten der Probe durch massenspektroskopische Detektion von für die Lipidoxidation relevanten Bestandteilen das Erstellen eines Fettsäurenchromatogramms bei einem ersten Masse/Ladungsverhältnis, sowie eines Aldehydchromatogramms bei einem zweiten Masse/Ladungsverhältnis.In a specific embodiment of the invention, identifying the volatile components of the sample by mass spectroscopic detection of components relevant to lipid oxidation comprises generating a fatty acid chromatogram at a first mass/charge ratio and an aldehyde chromatogram at a second mass/charge ratio.
Die Proben, mit denen das erfindungsgemäße Verfahren durchgeführt, sind in Zahl und Eigenschaft solcherart ausgewählt, dass ein repräsentativer Querschnitt an möglichen Ranzigkeiten ermittelt werden kann. Dies kann unter anderem durch eine geeignete Probenauswahl und -vorbereitung (z.B. Lagerung bei erhöhter Temperatur für verschiedene Zeitperioden) sichergestellt werden.The samples with which the method according to the invention is carried out are selected in number and properties in such a way that a representative cross-section of possible rancidities can be determined. This can be ensured, among other things, by suitable sample selection and preparation (e.g. storage at elevated temperature for different periods of time).
Bei der von der Erfindung bevorzugten Messung der Absorptions- oder Reflektionsspektren der Ölfrüchte, Nüsse bzw. Samen durch Hyper-Spektral-Bildgebung (HSI) zur Bestimmung der Ranzigkeit und anschließende Sortierung sind detaillierte Informationen der einzelnen Ölfrüchte, Nüsse bzw. Samen für ein gutes Kalibriermodell wesentlich. Dies wird durch das erfindungsgemäße Verfahren gewährleistet, wodurch eine wesentlich zielsicherere Aussortierung von ranzigen Ölfrüchten, Nüssen bzw. Samen erzielt werden kann als bisher. Insbesondere bietet die Erfindung eine hochgenaue und unterscheidungskräftige Referenzanalytik, mit der der tatsächliche Oxidationsstatus einzelner Nüsse/Ölfrüchte/Samen bestimmt und Extremwerte davon erfasst werden können.When measuring the absorption or reflection spectra of the oleaginous fruits, nuts or seeds by hyperspectral imaging (HSI) to determine rancidity and subsequent sorting, which is preferred by the invention, detailed information on the individual oleaginous fruits, nuts or seeds is a good calibration model significant. This is ensured by the method according to the invention, as a result of which rancid oil fruits, nuts or seeds can be sorted out in a much more targeted manner than before. In particular, the invention offers a highly precise and distinctive reference analysis with which the actual oxidation status of individual nuts/oilseeds/seeds can be determined and extreme values thereof can be recorded.
Eine Ausführungsform des erfindungsgemäßen Verfahrens basiert auf der Anreicherung flüchtiger Verbindungen im Dampfraum über der Probe, im speziellen auf Headspace Solid Phase Microextraction (HS-SPME), gekoppelt an einen Gaschromatographen mit massenselektiver Detektion. Diese Kombination von Analyseverfahren wird mit HS-SPME-GC-MS abgekürzt. Die Erfindung ist jedoch nicht auf diese Ausführungsform beschränkt, sondern das erfindungsgemäße Verfahren umfasst grundsätzlich die Messung und Bestimmung flüchtiger Verbindungen im Dampfraum der Probe, das Trennen einzelner Bestandteile der flüchtigen Verbindungen mittels Gaschromatographie, das Identifizieren durch massenselektive Detektieren zumindest einzelner der getrennten flüchtigen Verbindungen und das selektive Heranziehen von identifizierten flüchtigen Verbindungen zur Bestimmung des Ranzigkeitsindex.One embodiment of the method according to the invention is based on the enrichment of volatile compounds in the headspace above the sample, specifically on headspace solid phase microextraction (HS-SPME), coupled to a gas chromatograph with mass-selective detection. This combination of analysis methods is abbreviated as HS-SPME-GC-MS. However, the invention is not limited to this embodiment, but the method according to the invention basically comprises the measurement and determination of volatile compounds in the vapor space of the sample, the separation of individual components of the volatile compounds by means of gas chromatography, the identification by mass-selective detection of at least individual of the separated volatile compounds and that selectively using identified volatile compounds to determine the rancidity index.
Die Lipidoxidation von ungesättigten Fettsäuren beginnt mit der Bildung von Hydroperoxiden und führt zu einer großen Gruppe von verschiedenen chemischen Strukturen und funktionellen Gruppen. So können diese Stoffgruppen potentiell als Markerverbindungen verwendet werden, um den Grad der Lipidoxidation zu messen.The lipid oxidation of unsaturated fatty acids starts with the formation of hydroperoxides and leads to a large array of different chemical structures and functional groups. Thus, these groups of substances can potentially be used as marker compounds to measure the degree of lipid oxidation.
Es empfiehlt sich für die Hyperspektralanalyse alle Wellenlängen im nahen Infrarotbereich zu berücksichtigen, die die strukturellen Eigenschaften, die oben beschrieben wurden, messen können.It is advisable for hyperspectral analysis to consider all near-infrared wavelengths that can measure the structural properties described above.
Verbindungen, die für einen unerwünschten ranzigen Geschmack verantwortlich sind, sind beispielsweise Aldehyde, die sich nach der Hydroperoxidbildung von der Fettsäurekettenspaltung ableiten. Bei fortlaufender Oxidation können die Aldehyde freie Fettsäuren bilden, die auch zu weiteren unerwünschten sensorischen Eigenschaften von ranzigen Nüssen beitragen können. Für die Bewertung der Qualität einzelner Ölfrüchte oder Samen werden diese (mit unterschiedlicher Ranzigkeit und unterschiedlicher Herkunft) zuerst durch HSI gemessen, zeitnah einzeln markiert und verpackt und von HS-SPME-GC-MS wie folgt analysiert:
Einzelne Ölfrüchte, Nüsse oder Samen werden gemahlen und eine geeignete repräsentative Probenmenge, z.B. 300 mg, wird in ein Glasgefäß geeigneter Größe eingewogen und gasdicht verschlossen. Es kann ein glasbeschichteter Magnetrührer im Glasgefäß enthalten sein. Es erfolgt eine Anreicherung der flüchtigen Komponenten mit geeigneten Techniken basierend auf Dampfraumanalyse an geeigneten ad- oder absorptiven Materialien, die in der Lage sind, flüchtige organische Verbindungen reversibel zu binden. Weiters erfolgt eine Desorption thermisch bei erhöhten Temperaturen, vorzugsweise direkt im Einlasssystem eines gaschromatographischen Systems. Die Trennung der flüchtigen Verbindungen erfolgt auf hochauflösenden Kapillarsäulen mit einer geeigneten stationären Phase und einem Temperaturprogramm, welches in der Lage ist, die Analyten zu trennen. Die Detektion erfolgt mittels massenselektiver Detektion in der Art und Weise, dass ein Massenspektrum über den gesamten Massenbereich der relevanten Zielverbindungen erfasst werden kann, um eine eindeutige Identifikation der Verbindungen zu ermöglichen Massenspektren werden im ScanModus mit einem Scan-Bereich von Masse/Ladungsverhältnissen (m/z) von vorzugsweise 20-300 erfasst.Compounds that are responsible for an undesirable rancid taste are, for example, aldehydes, which are derived from fatty acid chain cleavage after hydroperoxide formation. With continued oxidation, the aldehydes can form free fatty acids, which can also contribute to other undesirable sensory properties of rancid nuts. For the assessment of the quality of individual oil fruits or seeds, these (with different rancidity and different origin) are first measured by HSI, promptly individually marked and packaged and analyzed by HS-SPME-GC-MS as follows:
Individual oilseeds, nuts or seeds are ground and a suitable representative sample amount, eg 300 mg, is weighed into an appropriately sized glass jar and sealed gas-tight. A glass-coated magnetic stirrer can be included in the glass vessel. The volatile components are enriched using suitable techniques based on headspace analysis using suitable adsorbent or absorptive materials that are capable of reversibly binding volatile organic compounds. Furthermore, desorption takes place thermally at elevated temperatures, preferably directly in the inlet system of a gas chromatographic system. The volatile compounds are separated on high-resolution capillary columns with a suitable stationary phase and a temperature program capable of separating the analytes. The detection is carried out using mass-selective detection in such a way that a mass spectrum can be acquired over the entire mass range of the relevant target compounds in order to enable unambiguous identification of the compounds. Mass spectra are recorded in scan mode with a scan range of mass/charge ratios (m/ z) of preferably 20-300.
Weitere Informationen können aus dem Extrahieren von ausgewählten Masse/Ladungsverhältnissen gewonnen werden. Es hat sich gezeigt, dass m/z = 44 ein universelles und ausgewähltes Fragment für lineare und gesättigte Aldehyde darstellt, dass für die Bestimmung der Ranzigkeit hervorragend geeignet ist. Zusätzliche Information über potentielle Ranzigkeit können über freie Fettsäure unter Verwendung des Masse/Ladungsverhältniss m/z = 60 erhalten. Gemäß einer Ausführungsform des Verfahrens wird in Folge dessen das Aldehydchromatogramm bei einem m/z von 44 und das Fettsäurenchromatogramm bei einem m/z von 60 erstellt.Further information can be gleaned from extracting selected mass/charge ratios. It has been shown that m/z = 44 represents a universal and selected fragment for linear and saturated aldehydes that is excellently suited for determining rancidity. Additional information about potential rancidity can be obtained via free fatty acid using the mass/charge ratio m/z=60. According to one embodiment of the method, the aldehyde chromatogram is then produced at an m/z of 44 and the fatty acid chromatogram at an m/z of 60.
In einer Ausführungsform der Erfindung kann ein Ranzigkeitsindexwert durch die Integration der Peaks des Aldehydchromatogramms mit einem m/z von 44 und des Fettsäurenchromatogramms mit einem m/z von 60 berechnet werden. Die erhaltenen Zahlen können entweder als Aldehydindexwert oder als Fettsäureindexwert oder als Totalranzigkeitsindex ausgedrückt werden. Für eine bessere Lesbarkeit wird die Summe der Peak-Bereiche durch eine feste Zahl geteilt, um eine Zahl zu erhalten, die bequemer zu handhaben ist. Durch die Analyse einer großen Gruppe von verschiedenen Proben unterschiedlicher Herkunft und Qualität kann eine breite Palette von Ranzigkeitsindexwerten ermittelt bzw. überprüft werden, die für das Kalibrierungsmodell verwendet werden.In one embodiment of the invention, a rancidity index value can be calculated by integrating the peaks of the aldehyde chromatogram with m/
Das erfindungsgemäße Verfahren verwendet somit einen quantitativen Ansatz, bei dem nicht nach offensichtlichen Unterscheidungsmerkmalen in den Absorptions- oder Reflektionsspektren gesucht wird, sondern schwache, aber noch signifikante Unterschiede in den Absorptions- oder Reflektionsspektren in Korrelation zu einer Referenz aus dem Labor gestellt wird. Die Absorptions- oder Reflektionsspektren werden somit nicht dazu verwendet, Ölfrüchte und Samen nach "Gut" (kaum bis keine Produkte einer Ranzigkeitsreaktion) und "Schlecht" (Produkte einer Ranzigkeitsreaktion vorhanden) in zwei Kategorien zu trennen, sondern es wird ein Ranzigkeitsindex erstellt. Hierdurch wird der Vorteil erreicht, dass somit quantitativ der Grad der Ranzigkeit erfasst werden kann. Besonders vorteilhaft ist, dass erst in einem nachfolgenden Schritt ein oder mehrere Schwellenwerte für den Ranzigkeitsindex bereitgestellt werden kann/können, ab welchem eine Ölfrucht, eine Nuss beziehungsweise ein Samen als nicht mehr qualitätskonform bzw. in unterschiedliche Qualitätsstufen fallend eingestuft wird. Dies ermöglicht insbesondere den Vorteil einer sehr einfachen Anpassung an unterschiedliche Qualitätsansprüche für Ölfrüchte und Samen.The method according to the invention thus uses a quantitative approach in which no obvious distinguishing features are searched for in the absorption or reflection spectra, but weak but still significant differences in the absorption or reflection spectra are correlated with a reference from the laboratory. The absorption or reflection spectra are thus not used to separate oilseeds and seeds into two categories according to "good" (hardly any or no products of a rancidity reaction) and "poor" (products of a rancidity reaction present), but a rancidity index is created. This has the advantage that the degree of rancidity can be determined quantitatively. It is particularly advantageous that one or more threshold values for the rancidity index can only be provided in a subsequent step, from which an oil fruit, a nut or a seed is classified as no longer conforming to quality or falling into different quality levels. In particular, this enables the advantage of a very simple adaptation to different quality requirements for oilseeds and seeds.
Das erfindungsgemäße Verfahren bietet des Weiteren den Vorteil, dass erstmals eine Identifizierbarkeit der Ranzigkeit von Ölfrüchten und Samen mittels Spektrometrie ermöglicht wird. Hierzu wurden im Labor chemische Marker gefunden, die direkt mit der Ranzigkeit korrelieren. Danach wurden erneut mit Hilfe von statistischen Korrelationsmethoden die an ausgewählten Proben aufgenommenen Absorptions- oder Reflektionsspektren des Fotosensors mit den für dieselben Proben im Labor ermittelten Ranzigkeitsindex korreliert, sodass aus dem Absorptions- oder Reflektionsspektrum direkt der Ranzigkeitsindex errechnet werden kann.The method according to the invention also offers the advantage that, for the first time, it is possible to identify the rancidity of oil seeds and seeds by means of spectrometry. For this purpose, chemical markers were found in the laboratory that directly correlate with rancidity. Then, again with the help of statistical correlation methods, the absorption or reflection spectra of the photo sensor recorded on selected samples were correlated with the rancidity index determined for the same samples in the laboratory, so that the rancidity index can be calculated directly from the absorption or reflection spectrum.
Vorteilhafte Ausgestaltungen des erfindungsgemäßen Verfahrens, sowie alternativer Ausführungsvarianten werden in weiterer Folge, und anhand der Figuren näher erläutert.
-
Figur 1 zeigt ein Chromatogramm einer ranzigen Probe und einer frischen Probe. -
Figur 2 -
Figur 3 -
Figur 4
-
figure 1 shows a chromatogram of a rancid sample and a fresh sample. -
figure 2 shows a chromatogram of the extracted m/z 44 (saturated aldehydes) of a rancid and a fresh nut. -
figure 3 Figure 12 shows chromatograms of extracted m/z 60 (fatty acids) from a rancid and a fresh nut. -
figure 4 shows a device for detecting rancid oil fruits, nuts or seeds in a schematic representation.
Das erfindungsgemäße Verfahren stellt eine Zuordnung eines Ranzigkeitsindexwert zu einzelnen Ölfrüchten, Nüssen und Samen 2 bereit, wobei in einem ersten Verfahrensschritt eine einzelne Ölfrucht, Nuss oder ein Samen 2 mit einer Lichtquelle 3 bestrahlt wird. Dies erfolgt gemäß einer bevorzugten Ausführungsvariante im Nahinfrarotbereich.The method according to the invention provides an assignment of a rancidity index value to individual oleaginous fruits, nuts and
Das von der Ölfrucht, Nuss oder dem Samen 2 reflektierte oder durch diese bzw. diesen transmittierte Licht wird in weiterer Folge auf einen Fotosensor 4 projiziert, welcher ein Absorptions- oder Reflektionsspektrum in einem Nahinfrarotbereich von 900 bis 2500 nm, vorzugsweise 900 bis 1700 nm erfasst. In einer besonders bevorzugten Ausführungsvariante wird das Absorptions- oder Reflektionsspektrum in einem Bereich von 1000 bis 1500nm durch den Fotosensor 4 erfasst. In einer bevorzugten Ausführungsvariante erfolgt das Erfassen des Absorptions- oder Reflektionsspektrum durch hyperspektrale Erfassung.The light reflected by or transmitted through the oil fruit, nut or
Zur Bestimmung des Ranzigkeitsindexwerts der Ölfrucht, Nuss oder des Samens 2, dessen Absorptions- oder Reflektionsspektrum zuvor erfasst wurde, wird zeitnah im Anschluss an die Messung des Spektrums die flüchtige Fraktion durch Dampfraumanalyse der flüchtigen Fraktion einzelner homogenisierter Ölfrüchte/Samen/Nüsse an geeigneten ad- und/oder absorptiven Materialien angereicht. Nach thermischer Desorption erfolgt die Trennung und Detektion an einem gaschromatographischen System mit massenselektiver Detektion. Die Auswahl entsprechender selektiver Massenfragmente der durch die Lipidoxidation gebildeten Abbauprodukte ermöglicht eine eindeutige Zuordnung zu relevanten Substanzklassen und damit zum Erstellen eines geeigneten Kalibrationsmodells für die spektralen Daten aus der Spektrumsmessung, insbesondere HSI Messung.To determine the rancidity index value of the oleaginous fruit, nut or
In einer bevorzugten Ausführungsvariante erfolgt das Bestimmen eines Aldehydindexwerts durch Integrieren über zumindest einen Bereich eines ermittelten Aldehydchromatogramms, und das Bestimmen eines Fettsäureindexwerts durch Integrieren über zumindest einen Bereich eines ermittelten Fettsäurenchromatogramms.In a preferred embodiment, an aldehyde index value is determined by integrating over at least one area of a determined aldehyde chromatogram, and a fatty acid index value is determined by integrating over at least one area of a determined fatty acid chromatogram.
Diese Schritte werden für eine repräsentative Vielzahl an Ölfrüchten, Nüssen beziehungsweise Samen wiederholt, und eine Ranzigkeitsindextabelle aus den ermittelten Ranzigkeitsindexwerten und den zugeordneten Absorptions- und Reflektionsspektren erstellt.These steps are repeated for a representative variety of oilseeds, nuts and seeds, respectively, and a rancidity index table is created from the rancidity index values determined and the associated absorption and reflection spectra.
In einer bevorzugten Ausführungsvariante des Verfahrens erfolgt das Zuordnen des erfassten Absorptions- oder Reflektionsspektrums der Ölfrucht, Nuss oder des Samens zu dem Ranzigkeitsindexwert durch Zuordnung des Ranzigkeitsindexwerts zu zumindest einem aus einem Mittelwert, einer Bandbreite oder einzelner Frequenzbänder des erfassten Absorptions- oder Reflektionsspektrums. Hierbei werden bestimmte Bereiche oder ein Mittelwert des jeweiligen Absorptions- oder Reflektionsspektrums als Bereiche festgelegt, welche charakteristisch für den Grad der Ranzigkeit der Ölfrüchte, Nüsse oder Samen 2 sind.In a preferred embodiment of the method, the recorded absorption or reflection spectrum of the oil crop, nut or seed is assigned to the rancidity index value by assigning the rancidity index value to at least one of a mean value, a bandwidth or individual frequency bands of the recorded absorption or reflection spectrum. In this case, specific areas or a mean value of the respective absorption or reflection spectrum are defined as areas which are characteristic of the degree of rancidity of the oil fruits, nuts or
Des Weiteren stellt die Erfindung zur Lösung der eingangs gestellten Aufgaben ein Verfahren zur Detektion der Ranzigkeit einer Ölfrucht, Nuss oder eines Samens 2 bereit. In diesem Detektionsverfahren wird in einem ersten Verfahrensschritt eine einzelne Ölfrucht, Nuss oder ein Samen mit einer Lichtquelle bestrahlt. Dies erfolgt gemäß einer bevorzugten Ausführungsvariante ebenfalls im Nahinfrarotbereich.Furthermore, the invention provides a method for detecting the rancidity of an oil fruit, nut or
Das von der Ölfrucht, Nuss oder dem Samen reflektierte oder durch diese bzw. diesen hindurch transmittierte Licht wird in weiterer Folge auf einen Fotosensor projiziert, welcher ein Absorptions- oder Reflektionsspektrum in einem Nahinfrarotbereich von vorzugsweise 900 bis 1700 nm erfasst. In einer besonders bevorzugten Ausführungsvariante wird das Absorptions- oder Reflektionsspektrum in einem Bereich von 1000 bis 1500 nm durch den Fotosensor erfasst. Bevorzugt erfolgt das Erfassen des Absorptions- oder Reflektionsspektrums durch hyperspektrale Erfassung mittels einer Hyperspektralkamera.The light reflected from the oil crop, nut or seed or transmitted through it is then projected onto a photo sensor, which records an absorption or reflection spectrum in a near-infrared range of preferably 900 to 1700 nm. In a particularly preferred embodiment variant, the absorption or reflection spectrum is recorded by the photo sensor in a range from 1000 to 1500 nm. The absorption or reflection spectrum is preferably detected by hyperspectral detection using a hyperspectral camera.
In einem weiteren Schritt greift dieses Verfahren auf die Ranzigkeitstabelle des zuvor beschriebenen Verfahrens zurück, welche die Ranzigkeitsindexwerte und die zugeordneten Absorptions- oder Reflektionsspektren bzw. charakteristische Bereiche und/oder Wellenlängen dieser Spektren enthält. Es folgt ein Vergleich des in diesem Verfahren erfassten Absorptions- oder Reflektionsspektrums mit den Absorptions- oder Reflektionsspektren, welche in der Ranzigkeitsindextabelle enthalten sind. Hierdurch wird eine Zuordnung des erfassten Absorptions- oder Reflektionsspektrums zu einem dem erfassten Absorptions- oder Reflektionsspektrum ähnlichsten Absorptions- oder Reflektionsspektrum der Ranzigkeitsindextabelle getroffen. Dies ermöglicht das Ermitteln des dem ähnlichsten Absorptions- oder Reflektionsspektrum zugeordneten Ranzigkeitsindexwerts.In a further step, this method accesses the rancidity table of the previously described method, which contains the rancidity index values and the associated absorption or reflection spectra or characteristic ranges and/or wavelengths of these spectra. The following is a comparison of the absorbance or reflectance spectra obtained in this procedure with the absorbance or reflectance spectra contained in the rancidity index table. As a result, the recorded absorption or reflection spectrum is assigned to an absorption or reflection spectrum of the rancidity index table that is most similar to the recorded absorption or reflection spectrum. This enables the rancidity index value associated with the most similar absorption or reflection spectrum to be determined.
Dieses Verfahren bietet den Vorteil, dass durch eine vorangegangene Kalibrierung mittels des zuvor beschriebenen erfindungsgemäßen Verfahrens zur Erstellung einer Ranzigkeitsindextabelle die Detektion der Ranzigkeit einer Ölfrucht, Nuss oder eines Samens in einer Produktionsanlage ermöglicht wird, wobei die Ranzigkeit einzelner Früchte detektiert wird und nicht nur ein homogener Produktstrom.This method offers the advantage that a previous calibration using the above-described method according to the invention for creating a rancidity index table enables the detection of the rancidity of an oil fruit, nut or seed in a production plant, with the rancidity of individual fruits being detected and not just a homogeneous one product stream.
Gemäß einer bevorzugten Ausführungsvariante des erfindungsgemäßen Detektionsverfahrens erfolgt die Zuordnung des erfassten Absorptions- oder Reflektionsspektrums zu einem dem erfassten Absorptions- oder Reflektionsspektrum ähnlichsten Absorptions- oder Reflektionsspektrum der Ranzigkeitsindextabelle durch Vergleich von zumindest einem aus einem Mittelwert, einer Bandbreite oder einzelner Frequenzbänder der Absorptions- oder Reflektionsspektren. Hierbei werden bestimmte Bereiche, oder ein Mittelwert des jeweiligen Absorptions- oder Reflektionsspektrums als Bereiche festgelegt, welche charakteristisch für den Grad der Ranzigkeit der Ölfrüchte, Nüsse oder Samen sind und zu diesem Vergleich herangezogen. Dies erhöht vorteilhafterweise die Genauigkeit des Verfahrens.According to a preferred embodiment of the detection method according to the invention, the recorded absorption or reflection spectrum is assigned to an absorption or reflection spectrum of the rancidity index table that is most similar to the recorded absorption or reflection spectrum by comparing at least one of a mean value, a bandwidth or individual frequency bands of the absorption or reflection spectra . In this case, certain areas or an average value of the respective absorption or reflection spectrum are defined as areas which are characteristic of the degree of rancidity of the oil fruits, nuts or seeds and used for this comparison. This advantageously increases the accuracy of the method.
Des Weiteren bietet dieses Detektionsverfahren den Vorteil, dass in einem weiteren Verfahrensschritt zumindest ein Schwellenwert festgelegt werden kann und ein Überschreiten dieses zumindest einen Schwellenwerts das Ausscheiden oder differenzierte Sortieren der Ölfrucht, Nuss oder des Samens bewirkt. Dies bietet den Vorteil, dass durch die Festlegung eines Schwellenwerts eine Anpassung an verschiedene Qualitätsanforderungen für die Ölfrüchte, Nüsse bzw. die Samen ermöglicht wird.Furthermore, this detection method offers the advantage that in a further method step at least one threshold value can be defined and exceeding this at least one threshold value causes the oleaginous fruit, nut or seed to be separated or sorted in a differentiated manner. This offers the advantage that by defining a threshold value, it is possible to adapt to different quality requirements for the oil crops, nuts or seeds.
Schließlich umfasst die Erfindung auch eine nachfolgend detailliert beschriebene Vorrichtung zur Detektion ranziger Ölfrüchte, Nüsse oder Samen, wobei diese Vorrichtung dazu ausgebildet ist, das erfindungsgemäße Detektionsverfahren abzuarbeiten, wobei eine gemäß dem erfindungsgemäßen Verfahren zur Erstellung einer Ranzigkeitsindextabelle erstellte Ranzigkeitsindextabelle verwendet wird.Finally, the invention also includes a device, described in detail below, for detecting rancid oil fruits, nuts or seeds, this device being designed to process the detection method according to the invention, using a rancidity index table created according to the method for creating a rancidity index table.
Der Fotosensor 4 ist mit der Rechnereinheit 5 verbunden und übermittelt an diese das erfasste Absorptions- oder Reflexionsspektrum.The
Die Rechnereinheit 5 greift zur Bewertung des Absorptions- oder Reflexionsspektrums auf die Ranzigkeitsindextabelle gemäß dem hierin zuerst beschriebenen Verfahren zurück. Diese enthält eine Reihe an Ranzigkeitsindexwerten und zugeordneten Absorptions- oder Reflektionsspektren. Die Rechnereinheit 5 vergleicht das erfasste Absorptions- oder Reflexionsspektrum mit den in der Ranzigkeitsindextabelle angeführten Absorptions- oder Reflexionsspektren und ordnet das erfasste Absorptions- oder Reflektionsspektrum dem ähnlichsten Absorptions- oder Reflektionsspektrum der Ranzigkeitsindextabelle zu. Dies erfolgt gemäß einer bevorzugten Ausführungsvariante durch einen Vergleich von einem Mittelwert, einer Bandbreite oder einzelner Frequenzbänder der Absorptions- oder Reflektionsspektren, oder einer Kombination davon. Nach erfolgter Zuordnung ermittelt die Rechnereinheit den dem ähnlichsten Absorptions- oder Reflektionsspektrum zugeordneten Ranzigkeitsindexwert. Hierdurch wird jeder einzelnen durch die Vorrichtung 1 detektierten Ölfrucht, Nuss bzw. Samen 2 ein Ranzigkeitsindexwert zugeordnet.In order to evaluate the absorption or reflection spectrum, the
Nachgeordnet zum Fotosensor 4 werden die Ölfrüchte, Nüsse oder Samen 1 an der Sortiereinheit 6 vorbeigeführt, welche ebenfalls mit der Rechnereinheit 5 verbunden ist, wobei die Rechnereinheit 5 die Sortiereinheit 6 steuert. Die Sortiereinheit 6 ermöglicht eine Sortierung einzelner Ölfrüchte, Nüsse oder Samen 2 aus einem Produktstrom von durch die Vorrichtung 1 geführten Ölfrüchten, Nüssen oder Samen 2, beispielsweise mittels Druckluftstößen 6a, die die Ölfrüchte, Nüsse oder Samen je nach zugeordnetem Ranzigkeitsindexwert in unterschiedliche Sortiergänge 8 für Gutprodukte 2a und 9 für ranzige Produkte 2b befördern, wobei die Sortiergänge 8, 9 z.B. durch Rutschen realisiert sind. Die Rechnereinheit 5 trifft anhand eines vorgegebenen Schwellenwerts für den Ranzigkeitsindexwert eine Entscheidung die jeweilige Ölfrucht, Nuss bzw. den jeweiligen Samen 2 in einen der Sortiergänge zu befördern. Die Sortiereinheit 6 kann als Klappenvorrichtung, Druckluftvorrichtung (wie dargestellt) oder ähnliches ausgeführt sein. Weitere Ausführungsformen der Sortiereinheit 6 ergeben sich für den Fachmann aus diesem beispielhaften Verweis.Subsequent to the
Zusammenfassend liegen der vorliegenden Erfindung, wie in den unabhängigen Ansprüchen und den bevorzugten Ausführungsformen definiert, die folgenden Konzepte und Vorteile zugrunde:
Die Detektion und Sortierung von Schüttgütern mithilfe von Fotosensoren mittels Hyperspectral Imaging (HSI) ist eine gängige Methode. Dabei wird eine Probe mit breitbandigem Licht bestrahlt und das reflektierte Licht von einem Fotosensor, vorzugsweise im nahen Infrarotbereich, erfasst und spektroskopisch untersucht. Auf Grund der Auswertung der Spektren (Amplitude, Frequenz) wird auf Eigenschaften bzw. Inhaltsstoffe geschlossen. Der Nachweis dieser Eigenschaften, Inhaltsstoffe ist die Basis für die Unterscheidung von guten und schlechten Produkten im Sortierprozess. Der Nachweis dieser Eigenschaften/Inhaltsstoffe basiert auf einem qualitativen, relativen Ansatz. Es werden in einem Modellierprozess die photometrisch erfassten Spektrenverläufe der Gutprodukte mit dem Schlechtprodukt verglichen. Dabei werden Bereiche des Spektrums gesucht, in denen der Unterschied der Eigenschaften sehr groß ist bzw. die Korrelation zu einer gesuchten Substanz im Unterschied zu anderen Substanzen sehr hoch ist. Der/die identifizierten Bereich(e) werden dann für den Sortierprozess ausgewählt und die jeweiligen Spektren normiert. Das heißt, dass die absoluten Amplituden des Spektrums eliminiert und nur die Unterschiede zwischen dem Spektrum des Gut- und Schlechtproduktes für die Entscheidung in der Sortierung herangezogen werden.In summary, the present invention as defined in the independent claims and preferred embodiments is based on the following concepts and advantages:
The detection and sorting of bulk materials using photo sensors using Hyperspectral Imaging (HSI) is a common method. A sample is irradiated with broadband light and the reflected light is recorded by a photo sensor, preferably in the near infrared range, and examined spectroscopically. Based on the evaluation of the spectra (amplitude, frequency), conclusions are drawn about properties or ingredients. Evidence of these properties and ingredients is the basis for distinguishing between good and bad products in the sorting process. Evidence of these properties/ingredients is based on a qualitative, relative approach. In a modeling process, the photometrically recorded spectra of the good products are compared with the bad product. Here, areas of the spectrum are searched for in which the difference in properties is very large or the correlation to a searched substance is very high in contrast to other substances. The identified region(s) are then selected for the sorting process and the respective spectra normalized. This means that the absolute amplitudes of the spectrum are eliminated and only the differences between the range of good and bad products can be used for the sorting decision.
Bedingt durch diese Vorgangsweise kommt es aus folgenden Gründen zu Fehlklas sifikationen:
- Sind die Unterschiede zwischen den beiden Spektren sehr klein, so wird die kleine Differenz im Normierungsprozess derart stark vergrößert, dass das Signal/Rauschverhältnis stark steigt, wodurch sich die Unsicherheit der Entscheidung stark erhöht.
- Die Unterschiede im Spektrum werden anhand einer Referenzprobe von guten/schlechten Exemplaren bestimmt. Soweit es sich aber um Naturprodukte mit spektraler Streuung handelt, ist dieser Vergleich mit einer hohen Unsicherheit behaftet und kann bei jeder Produktcharge schwanken.
- If the differences between the two spectra are very small, the small difference in the normalization process is increased to such an extent that the signal-to-noise ratio increases sharply, which greatly increases the uncertainty of the decision.
- The differences in the spectrum are determined using a reference sample of good/bad specimens. However, as far as natural products with spectral scatter are concerned, this comparison is subject to a high level of uncertainty and can vary with each product batch.
Das Resultat dieser Fehlklassifikation ist eine mangelhafte Trennung von guten und verdorbenen Lebensmittelen.The result of this misclassification is an inadequate separation of good and spoiled food.
Dieses Problem tritt insbesondere bei Ölfrüchten, Nüssen und Samen auf, wenn sie in Produktionsanlagen automatisiert verarbeitet werden. Bei dieser automatisierten Verarbeitung steht das Interesse ranzige und somit verdorbene Elemente von nicht ranzigen Elementen automatisiert zu unterschieden, im Mittelpunkt. Noch bevor die Produkte weiterverarbeitet werden (Pressen, Reiben, Schälen, etc.), sollen einzelne, qualitativ minderwertige Früchte/Nüsse/Samen automatisiert, mit hoher Durchsatzrate, eliminiert werden.This problem occurs in particular with oilseeds, nuts and seeds when they are processed automatically in production plants. This automated processing focuses on the interest of automatically distinguishing rancid and therefore spoiled elements from non-rancid elements. Even before the products are further processed (pressing, grating, peeling, etc.), individual, low-quality fruits/nuts/seeds are to be eliminated automatically with a high throughput rate.
Die vorgestellte Lösung basiert auf einem quantitativen Ansatz, der die Nachteile der bisherigen Verfahren beseitigt, indem nicht wie bisher, die Sortierinformation aus dem spektralen Vergleich von ranzigen Ölfrüchte/Nüsse/Samen mit nicht ranzigen Vergleichsmengen gewonnen wird, sondern die chemischen Auslöser der Ranzigkeit (Lipidoxidation, Hydrolyse) und die dabei entstehenden Stoffe (Aldehyde, etc.) hinsichtlich ihres spektralen Fingerabdrucks untersucht werden.The solution presented is based on a quantitative approach that eliminates the disadvantages of previous methods by not obtaining the sorting information from the spectral comparison of rancid oil fruits/nuts/seeds with non-rancid reference quantities, as was previously the case, but rather the chemical triggers of rancidity (lipid oxidation , hydrolysis) and the resulting substances (aldehydes, etc.) are examined with regard to their spectral fingerprint.
Da die Ranzigkeit keine zweiwertige Größe ist, d.h. eine bloße Unterscheidung in ranzig/nicht ranzig unzureichend ist, sondern Ranzigkeit in verschiedenen Graden vorliegt, wird eine erfindungsgemäß entwickelte Ranzigkeitsindextabelle verwendet, welche die Amplituden im entsprechenden spektralen Bereich einem Ranzigkeitswert von z.B. 0-100% zuordnet.Since rancidity is not a two-valued variable, ie a mere distinction between rancid/not rancid is insufficient, but rather there are different degrees of rancidity, a rancidity index table developed according to the invention is used, which assigns the amplitudes in the corresponding spectral range to a rancidity value of, for example, 0-100% .
Diese Ranzigkeitsindextabelle wird unter Verwendung der zur Verfügung stehenden analytischen Labormethoden (z.B. Gaschromatographie etc.) anhand einer statistisch großen Menge von Ölfrüchten/Nüssen/Samen entwickelt.This rancidity index table is developed using available analytical laboratory methods (e.g. gas chromatography etc.) on a statistically large quantity of oilseeds/nuts/seeds.
Die Ranzigkeitsindextabelle wird nun erfindungsgemäß unter Anwendung eines Fotosensors einer Sortieranlage, bevorzugt einer Hyperspektralkamera, zur Detektion des Ranzigkeitsgrads von Ölfrüchten, Nüssen und Samen verwendet, wobei der Fotosensor mithilfe der Ranzigkeitsindextabelle der Sortieranlage kalibriert werden kann. Das heißt, dass im maßgebenden Spektralbereich anhand dieser Tabelle von der absoluten Amplitude im Spektrum automatisch auf den quantitativen Grad (z.B. 0-100%) der Ranzigkeit geschlossen werden kann.The rancidity index table is now used according to the invention using a photo sensor of a sorting system, preferably a hyperspectral camera, to detect the degree of rancidity of oilseeds, nuts and seeds, it being possible for the photo sensor to be calibrated using the rancidity index table of the sorting system. This means that in the relevant spectral range, this table can be used to automatically deduce the quantitative degree (e.g. 0-100%) of rancidity from the absolute amplitude in the spectrum.
Das auf der erfindungsgemäß erstellten Ranzigkeitsindextabelle basierende Detektionsverfahren bzw. eine dieses Detektionsverfahren abarbeitende Sortieranlage zeichnet sich durch folgende Vorteile aus:
- Hohe Verarbeitungsgeschwindigkeit und Entscheidungssicherheit im online Sortierprozess, bedingt durch die Auswertung der Ranzigkeitsindextabelle;
- Qualitativ hochwertige Ranzigkeitsindextabelle, basierend auf dem aktuellen Stand der offline Labortechnik, kann online im Sortierprozess verwendet werden;
- Die Sortierung der Ranzigkeit ist keine zweiwertige Größe (ranzig/nicht ranzig), sondern eine analoge Größe, die basierend auf der Amplitude bei einer gewissen Wellenlänge bzw. auf den Mittelwerten der Amplituden in einem Wellenlängenbereich zurückgeführt werden kann;
- Basierend auf einem Ranzigkeitswert kann eine Sortierung nach verschiedenen Qualitäten (x % Ranzigkeit) durchgeführt werden und somit eine Verwertung von verschiedenen Qualitätsstufen erzielt werden;
- Exakte Einstellung des Sortiergrenzwertes in der Sortieranlage.
- High processing speed and decision-making security in the online sorting process, due to the evaluation of the rancidity index table;
- High-quality rancidity index table, based on the current state of offline laboratory technology, can be used online in the sorting process;
- The grading of rancidity is not a binary quantity (rancid/not rancid), but an analogue quantity that can be traced back based on the amplitude at a certain wavelength or on the mean values of the amplitudes in a range of wavelengths;
- Based on a rancidity value, sorting can be carried out according to different qualities (x% rancidity) and thus recycling of different quality levels can be achieved;
- Exact setting of the sorting limit in the sorting system.
Claims (14)
- A process for establishing a rancidity index table and allocating a rancidity index value to an absorption or reflection spectrum of oil fruits, nuts and seeds (2), comprising the steps of:- irradiating a sample of an oil fruit, a nut or a seed (2) with a light source (3),- projecting the reflected and/or transmitted light onto a photosensor (4),- detecting the absorption or reflection spectrum in a wavelength range from 900 to 2500 nm, preferably from 900 to 1700 nm, more preferably from 1000 to 1500 nm, by means of the photosensor (4),- extracting ingredients of the sample by sample preparation techniques based on a determination of volatile compounds from a vapour space above the sample, preferably by solid phase microextraction,- separating volatile components of the sample by applying gas-chromatographic techniques,- identifying separated volatile components of the sample by mass spectroscopic detection of constituents of the volatile components which are relevant for lipid oxidation,characterized in that the process comprises the steps of- determining a rancidity index value of the sample from identified volatile components of the sample,- allocating at least individual characteristic wavelengths or wavelength ranges of the detected absorption or reflection spectrum of the sample to the rancidity index value,- repeating the previous steps for a representative number of samples and forming a rancidity table from the determined rancidity index values and allocated absorption or reflection spectra or, respectively, characteristic wavelengths or wavelength ranges of the detected absorption or reflection spectra.
- A process according to claim 1, characterized in that identifying the volatile components of the sample by mass spectroscopic detection of constituents relevant for lipid oxidation comprises identifying one or more groups of substances/functional groups selected from:- hydroperoxides- cyclic hydroperoxides- saturated, mono- and di-unsaturated aldehydes- hydrocarbons (alkanes, alkenes)- alcohols (saturated and unsaturated)- ketones (saturated and unsaturated)- short chain fatty acids- alkyl furans.
- A process according to claim 1 or 2, characterized in that the identification of the volatile components of the sample by mass spectroscopic detection of constituents relevant for lipid oxidation occurs by establishing chromatograms at mass/charge ratios selected in a range of between 20 and 300, preferably at at least one mass/charge ratio selected from 43, 44, 55, 56, 57, 60, 70, 71, 73, 74, 81, 83, 97.
- A process according to claim 3, characterized by the creation of a fatty acid chromatogram at a mass/charge ratio characteristic of fatty acids, in particular at a mass/charge ratio of 60.
- A process according to claim 4, characterized by the determination of a fatty acid index value by integration across at least a portion of the fatty acid chromatogram.
- A process according to any of claims 3 to 5, characterized by the creation of an aldehyde chromatogram at a mass/charge ratio characteristic of aldehydes, in particular at a mass/charge ratio of 44.
- A process according to claim 6, characterized by the determination of an aldehyde index value by integration across at least a portion of the aldehyde chromatogram.
- A process according to claims 5 and 7, characterized in that the determination of a rancidity index value occurs by forming the sum of the aldehyde index value and the fatty acid index value.
- A process according to any of the preceding claims, characterized in that the allocation of the detected absorption or reflection spectra of the samples to the rancidity index values is effected by allocating the rancidity index values to at least one of an average, a bandwidth or individual frequency bands of the detected absorption or reflection spectra.
- A process according to any of the preceding claims, characterized in that the detection of the absorption or reflection spectrum is effected by hyperspectral detection by means of the photosensor (4).
- A process for the detection of rancidity in an oil fruit, a nut or a seed (2), comprising the steps of:- irradiating the oil fruit, nut or seed (2) with at least one light source (3),- projecting the reflected and/or transmitted light onto a photosensor (4),- detecting an absorption or reflection spectrum in a wavelength range from 900 to 2500 nm, preferably from 900 to 1700 nm, more preferably from 1000 to 1500 nm, by means of the photosensor (4),characterized in that the process comprises the steps of- providing a rancidity index table according to any of claims 1 to 10 which contains the rancidity index values and the allocated absorption or reflection spectra or, respectively, characteristic wavelengths or wavelength ranges of the absorption or reflection spectrum,- allocating the detected absorption or reflection spectrum or, respectively, characteristic wavelengths or wavelength ranges of the detected absorption or reflection spectrum to an absorption or reflection spectrum of the rancidity index table which is most similar to the detected absorption or reflection spectrum or, respectively, to characteristic wavelengths or wavelength ranges of the absorption or reflection spectrum,- determining the rancidity index value allocated to the most similar absorption or reflection spectrum or, respectively, characteristic wavelengths or wavelength ranges of the absorption or reflection spectrum.
- A process according to claim 11, characterized in that the allocation of the detected absorption or reflection spectrum to the most similar absorption or reflection spectrum of the rancidity index table is effected by comparing at least one of an average, a bandwidth or individual frequency bands of the absorption or reflection spectra.
- A process according to any of claims 11 or 12, characterized by the segregation of the oil fruit, nut or seed (2), if the determined rancidity index value exceeds a threshold value.
- A device (1) for the detection of rancid oil fruits, nuts or seeds (2), comprising a light source (3), a photosensor (4), a computer unit (5) and a sorting unit (6), wherein
the light source (3) is designed for irradiating the oil fruit, nut or seed (2), the photosensor (4) is connected to the computer unit (3) and designed for detecting an absorption or reflection spectrum of the light reflected from the oil fruit, nut or seed (2) or transmitted through the oil fruit, nut or seed (2) and transmitting it to the computer unit (5), and the sorting unit (6) is connected to the computer unit (5), the computer unit (5) being configured such that it controls the sorting unit (6) by executing the process according to any of claims 11 to 13.
Applications Claiming Priority (2)
| Application Number | Priority Date | Filing Date | Title |
|---|---|---|---|
| ATA50322/2017A AT519918B1 (en) | 2017-04-21 | 2017-04-21 | Method for the detection of the rancidity of oil fruits, seeds and nuts |
| PCT/AT2018/060075 WO2018191768A1 (en) | 2017-04-21 | 2018-04-20 | Method for detecting the rancidity of oilseeds, seeds and nuts |
Publications (2)
| Publication Number | Publication Date |
|---|---|
| EP3612835A1 EP3612835A1 (en) | 2020-02-26 |
| EP3612835B1 true EP3612835B1 (en) | 2022-08-17 |
Family
ID=62148050
Family Applications (1)
| Application Number | Title | Priority Date | Filing Date |
|---|---|---|---|
| EP18723663.3A Active EP3612835B1 (en) | 2017-04-21 | 2018-04-20 | Method for detecting the rancidity of oilseeds, seeds and nuts |
Country Status (8)
| Country | Link |
|---|---|
| US (1) | US11073506B2 (en) |
| EP (1) | EP3612835B1 (en) |
| CN (1) | CN110785661B (en) |
| AT (1) | AT519918B1 (en) |
| CL (1) | CL2019003014A1 (en) |
| ES (1) | ES2929664T3 (en) |
| PT (1) | PT3612835T (en) |
| WO (1) | WO2018191768A1 (en) |
Families Citing this family (2)
| Publication number | Priority date | Publication date | Assignee | Title |
|---|---|---|---|---|
| CA3128185A1 (en) * | 2019-01-31 | 2020-08-06 | Four Growers, Inc. | Crop harvesting robot |
| AT525827A1 (en) | 2022-02-07 | 2023-08-15 | Insort Gmbh | Method and device for determining whether an oil crop, a nut, in particular a hazelnut or a seed is rotten |
Family Cites Families (28)
| Publication number | Priority date | Publication date | Assignee | Title |
|---|---|---|---|---|
| US6646264B1 (en) * | 2000-10-30 | 2003-11-11 | Monsanto Technology Llc | Methods and devices for analyzing agricultural products |
| CN1425909A (en) * | 2002-12-31 | 2003-06-25 | 天津大学 | Infrared spectrum detection method for effective component in traditional Chinese medicine drip pills preparation |
| GB0405821D0 (en) * | 2004-03-15 | 2004-04-21 | Evanesco Ltd | Fluid monitoring apparatus and methods |
| US20050250212A1 (en) * | 2004-05-07 | 2005-11-10 | Hormoz Azizian | FT-NIR fatty acid determination method |
| WO2006079846A1 (en) * | 2005-01-31 | 2006-08-03 | Graf International Limited | A method of detecting and identifying bacteria |
| CN101310738B (en) * | 2007-05-24 | 2011-10-26 | 天津天士力现代中药资源有限公司 | Intermediate infrared spectrum polycomponent quantitative analysis method of traditional Chinese medicine extract |
| US20090305423A1 (en) * | 2008-06-09 | 2009-12-10 | Ohio State University Research Foundation | Methods for Monitoring Composition and Flavor Quality of Cheese Using a Rapid Spectroscopic Method |
| CN101504363A (en) * | 2009-03-18 | 2009-08-12 | 哈尔滨商业大学 | Edible fatty acid value detection method based on near-infrared spectrum analysis |
| WO2011027315A1 (en) * | 2009-09-04 | 2011-03-10 | Moshe Danny S | Grading of agricultural products via hyper spectral imaging and analysis |
| SE1000620A1 (en) * | 2010-06-09 | 2011-12-10 | Umbio Ab | Procedure for real-time hyperspectral image analysis |
| CN101907564B (en) * | 2010-06-24 | 2013-07-17 | 江苏大学 | Rapeseed quality non-destructive testing method and device based on near infrared spectrum technology |
| CN101915746B (en) * | 2010-07-22 | 2012-09-12 | 中国人民解放军空军油料研究所 | Method for identifying aviation fuels and additives |
| AT12076U1 (en) * | 2010-07-27 | 2011-10-15 | Evk Di Kerschhaggl Gmbh | METHOD, SENSOR UNIT AND MACHINE FOR DETECTING '' SUGAR TIPS '' - DEFECTS IN POTATOES |
| CN102012920B (en) * | 2010-11-29 | 2012-07-04 | 天津出入境检验检疫局化矿金属材料检测中心 | Method for establishing identification database of imported iron ore origins |
| CN102175640A (en) * | 2011-03-11 | 2011-09-07 | 张瑞 | Near-infrared online detecting method in herba epimedii processing production |
| CN102353643A (en) * | 2011-06-22 | 2012-02-15 | 中国林业科学研究院林产化学工业研究所 | Method for rapid determination of oil content in Camellia oleifera seeds by using near-infrared diffuse reflectance spectroscopy (NIRS) |
| KR20130076093A (en) * | 2011-12-28 | 2013-07-08 | 강원대학교산학협력단 | Direct evaluation of the rancidity of soybean in powder form during storage using fluorescence spectrum test |
| JP6088770B2 (en) | 2012-04-20 | 2017-03-01 | 国立大学法人広島大学 | Grain component analysis apparatus and grain component analysis method |
| CN103808674A (en) * | 2012-11-09 | 2014-05-21 | 云南太阳魂庄园葡萄酒业销售有限公司 | Grape wine quality characteristic objective evaluation system method based on ultraviolet-visible spectral scanning spectrum, and application thereof |
| CN103487384B (en) * | 2013-10-15 | 2016-01-27 | 无锡艾科瑞思产品设计与研究有限公司 | Based on the packed paddy composition method for quick of near infrared spectrum |
| CN103592257B (en) * | 2013-12-02 | 2016-07-06 | 广东产品质量监督检验研究院 | A kind of method of toluene, ethylbenzene and xylene content near infrared spectrum quick test woodwork coating diluent |
| CN104297441B (en) * | 2014-10-29 | 2016-04-13 | 内蒙古天奇中蒙制药股份有限公司 | The application of the online quality monitoring hierarchy of control of a kind of infrared spectrum in Mongolian medicinal preparation |
| US9459205B1 (en) * | 2015-04-27 | 2016-10-04 | Empire Technology Development Llc | Refractive index measurement of liquids over a broad spectral range |
| CN104865222B (en) * | 2015-04-30 | 2018-03-23 | 北京林业大学 | A kind of lossless detection method of Paeonia suffruticosa seed content of fatty acid |
| CN104931454A (en) * | 2015-06-23 | 2015-09-23 | 浙江理工大学 | Method for rapidly determining Lycra fiber content of textiles using near infrared spectroscopic analysis |
| CN105628648A (en) * | 2015-12-31 | 2016-06-01 | 深圳市芭田生态工程股份有限公司 | Method for measuring vitamin C in agricultural product by utilization of spectroscopic method |
| CN106290230B (en) * | 2016-07-26 | 2019-08-30 | 安徽农业大学 | A kind of method of discrimination of the black tea withering degree of near infrared spectrum combination chemical component |
| CN106018335A (en) * | 2016-08-04 | 2016-10-12 | 浙江大学 | Method for nondestructively determining content of phytic acid in whole cottonseed based on near infrared spectroscopy |
-
2017
- 2017-04-21 AT ATA50322/2017A patent/AT519918B1/en active
-
2018
- 2018-04-20 EP EP18723663.3A patent/EP3612835B1/en active Active
- 2018-04-20 PT PT187236633T patent/PT3612835T/en unknown
- 2018-04-20 WO PCT/AT2018/060075 patent/WO2018191768A1/en active Application Filing
- 2018-04-20 CN CN201880041395.6A patent/CN110785661B/en active Active
- 2018-04-20 ES ES18723663T patent/ES2929664T3/en active Active
- 2018-04-20 US US16/606,907 patent/US11073506B2/en active Active
-
2019
- 2019-10-21 CL CL2019003014A patent/CL2019003014A1/en unknown
Also Published As
| Publication number | Publication date |
|---|---|
| US20200378941A1 (en) | 2020-12-03 |
| EP3612835A1 (en) | 2020-02-26 |
| CN110785661B (en) | 2022-09-13 |
| ES2929664T3 (en) | 2022-11-30 |
| WO2018191768A1 (en) | 2018-10-25 |
| AT519918B1 (en) | 2020-12-15 |
| CL2019003014A1 (en) | 2020-06-12 |
| PT3612835T (en) | 2022-11-15 |
| US11073506B2 (en) | 2021-07-27 |
| AT519918A1 (en) | 2018-11-15 |
| CN110785661A (en) | 2020-02-11 |
Similar Documents
| Publication | Publication Date | Title |
|---|---|---|
| DE60201684T2 (en) | METHOD FOR SORTING ITEMS COMPOSED OF AN ORGANIC MATERIAL | |
| DE102007062112A1 (en) | Vegetable oil purity judging method, involves measuring terahertz-time domain-spectrum of standard vegetable oil to adjust spectral data base, and analyzing purity of detected vegetable oil based on spectral data base | |
| EP3612835B1 (en) | Method for detecting the rancidity of oilseeds, seeds and nuts | |
| EP2199791A1 (en) | Method for calculating the haemolysis of a blood sample and device | |
| Janin et al. | Methods for PDO olive oils traceability: state of art and discussion about the possible contribution of strontium isotopic tool | |
| CH708057A2 (en) | Near-infrared method for determining the constituents of the lotus root. | |
| Scavarda et al. | Cocoa smoky off-flavour: A MS-based analytical decision maker for routine controls | |
| WO2023148692A1 (en) | Method and device for determining whether an oilseed, a nut, in particular a hazelnut, or a seed is rancid | |
| EP3322936A1 (en) | Method for controlling a combustion process | |
| AT7250U1 (en) | METHOD FOR IDENTIFYING, CLASSIFYING AND SORTING ITEMS, OBJECTS AND MATERIALS, AND A DETECTION SYSTEM PROVIDED FOR THEM | |
| DE102012217676B4 (en) | Method for identifying the composition of a sample | |
| EP2635882A1 (en) | Method for determining chemical constituents of solid or liquid substances with the aid of thz spectroscopy | |
| Kamal et al. | Comparison of principal component and partial least square regression method in NIRS data analysis for cocoa bean quality assessment | |
| EP4058783A1 (en) | Open-loop/closed-loop process control on the basis of a spectroscopic determination of undetermined substance concentrations | |
| WO2015197781A1 (en) | Method for classifying a mixture of substances | |
| DE19827743A1 (en) | Classifying types of wood and/or determining quality especially for manufacturing cellulose | |
| DE102007019790B4 (en) | Method and device for characterizing a plant sample | |
| DE102015223436B4 (en) | Method for the contactless and non-destructive determination of a proportion of at least one free fatty acid or at least one oxidation product on a surface of a foodstuff or animal feed | |
| DE19953387A1 (en) | Process for evaluating electromagnetic spectra of substances with regard to their application-specific effects | |
| DE102021124782A1 (en) | Method and device for determining a parameter of a size distribution of a mixture, plant for the production of material panels and computer program product | |
| DE102021004464A1 (en) | Method for controlling a drying process of an agricultural product | |
| WO2002048700A2 (en) | Method for classifying chemical substances according to olfactory characteristics | |
| DE102021105644A1 (en) | Analysis of milk | |
| DE202019100945U1 (en) | Apparatus for determining the quality of substitute fuels | |
| DD156025A1 (en) | METHOD OF OPTIONALLY MULTIPURPOSE QUALITY ASSORTMENT OF AGRICULTURAL PRODUCTS |
Legal Events
| Date | Code | Title | Description |
|---|---|---|---|
| STAA | Information on the status of an ep patent application or granted ep patent |
Free format text: STATUS: UNKNOWN |
|
| STAA | Information on the status of an ep patent application or granted ep patent |
Free format text: STATUS: THE INTERNATIONAL PUBLICATION HAS BEEN MADE |
|
| PUAI | Public reference made under article 153(3) epc to a published international application that has entered the european phase |
Free format text: ORIGINAL CODE: 0009012 |
|
| STAA | Information on the status of an ep patent application or granted ep patent |
Free format text: STATUS: REQUEST FOR EXAMINATION WAS MADE |
|
| 17P | Request for examination filed |
Effective date: 20191121 |
|
| AK | Designated contracting states |
Kind code of ref document: A1 Designated state(s): AL AT BE BG CH CY CZ DE DK EE ES FI FR GB GR HR HU IE IS IT LI LT LU LV MC MK MT NL NO PL PT RO RS SE SI SK SM TR |
|
| AX | Request for extension of the european patent |
Extension state: BA ME |
|
| RAV | Requested validation state of the european patent: fee paid |
Extension state: MD Effective date: 20191121 |
|
| RAX | Requested extension states of the european patent have changed |
Extension state: BA Payment date: 20191121 |
|
| GRAP | Despatch of communication of intention to grant a patent |
Free format text: ORIGINAL CODE: EPIDOSNIGR1 |
|
| STAA | Information on the status of an ep patent application or granted ep patent |
Free format text: STATUS: GRANT OF PATENT IS INTENDED |
|
| INTG | Intention to grant announced |
Effective date: 20220407 |
|
| GRAS | Grant fee paid |
Free format text: ORIGINAL CODE: EPIDOSNIGR3 |
|
| GRAA | (expected) grant |
Free format text: ORIGINAL CODE: 0009210 |
|
| STAA | Information on the status of an ep patent application or granted ep patent |
Free format text: STATUS: THE PATENT HAS BEEN GRANTED |
|
| AK | Designated contracting states |
Kind code of ref document: B1 Designated state(s): AL AT BE BG CH CY CZ DE DK EE ES FI FR GB GR HR HU IE IS IT LI LT LU LV MC MK MT NL NO PL PT RO RS SE SI SK SM TR |
|
| REG | Reference to a national code |
Ref country code: CH Ref legal event code: EP |
|
| REG | Reference to a national code |
Ref country code: DE Ref legal event code: R096 Ref document number: 502018010426 Country of ref document: DE |
|
| REG | Reference to a national code |
Ref country code: IE Ref legal event code: FG4D Free format text: LANGUAGE OF EP DOCUMENT: GERMAN |
|
| REG | Reference to a national code |
Ref country code: AT Ref legal event code: REF Ref document number: 1512501 Country of ref document: AT Kind code of ref document: T Effective date: 20220915 |
|
| REG | Reference to a national code |
Ref country code: PT Ref legal event code: SC4A Ref document number: 3612835 Country of ref document: PT Date of ref document: 20221115 Kind code of ref document: T Free format text: AVAILABILITY OF NATIONAL TRANSLATION Effective date: 20221109 |
|
| REG | Reference to a national code |
Ref country code: NL Ref legal event code: FP |
|
| REG | Reference to a national code |
Ref country code: ES Ref legal event code: FG2A Ref document number: 2929664 Country of ref document: ES Kind code of ref document: T3 Effective date: 20221130 |
|
| REG | Reference to a national code |
Ref country code: LT Ref legal event code: MG9D Ref country code: NO Ref legal event code: T2 Effective date: 20220817 |
|
| PG25 | Lapsed in a contracting state [announced via postgrant information from national office to epo] |
Ref country code: SE Free format text: LAPSE BECAUSE OF FAILURE TO SUBMIT A TRANSLATION OF THE DESCRIPTION OR TO PAY THE FEE WITHIN THE PRESCRIBED TIME-LIMIT Effective date: 20220817 Ref country code: RS Free format text: LAPSE BECAUSE OF FAILURE TO SUBMIT A TRANSLATION OF THE DESCRIPTION OR TO PAY THE FEE WITHIN THE PRESCRIBED TIME-LIMIT Effective date: 20220817 Ref country code: LV Free format text: LAPSE BECAUSE OF FAILURE TO SUBMIT A TRANSLATION OF THE DESCRIPTION OR TO PAY THE FEE WITHIN THE PRESCRIBED TIME-LIMIT Effective date: 20220817 Ref country code: LT Free format text: LAPSE BECAUSE OF FAILURE TO SUBMIT A TRANSLATION OF THE DESCRIPTION OR TO PAY THE FEE WITHIN THE PRESCRIBED TIME-LIMIT Effective date: 20220817 Ref country code: FI Free format text: LAPSE BECAUSE OF FAILURE TO SUBMIT A TRANSLATION OF THE DESCRIPTION OR TO PAY THE FEE WITHIN THE PRESCRIBED TIME-LIMIT Effective date: 20220817 |
|
| PG25 | Lapsed in a contracting state [announced via postgrant information from national office to epo] |
Ref country code: PL Free format text: LAPSE BECAUSE OF FAILURE TO SUBMIT A TRANSLATION OF THE DESCRIPTION OR TO PAY THE FEE WITHIN THE PRESCRIBED TIME-LIMIT Effective date: 20220817 Ref country code: IS Free format text: LAPSE BECAUSE OF FAILURE TO SUBMIT A TRANSLATION OF THE DESCRIPTION OR TO PAY THE FEE WITHIN THE PRESCRIBED TIME-LIMIT Effective date: 20221217 Ref country code: HR Free format text: LAPSE BECAUSE OF FAILURE TO SUBMIT A TRANSLATION OF THE DESCRIPTION OR TO PAY THE FEE WITHIN THE PRESCRIBED TIME-LIMIT Effective date: 20220817 Ref country code: GR Free format text: LAPSE BECAUSE OF FAILURE TO SUBMIT A TRANSLATION OF THE DESCRIPTION OR TO PAY THE FEE WITHIN THE PRESCRIBED TIME-LIMIT Effective date: 20221118 |
|
| PG25 | Lapsed in a contracting state [announced via postgrant information from national office to epo] |
Ref country code: SM Free format text: LAPSE BECAUSE OF FAILURE TO SUBMIT A TRANSLATION OF THE DESCRIPTION OR TO PAY THE FEE WITHIN THE PRESCRIBED TIME-LIMIT Effective date: 20220817 Ref country code: RO Free format text: LAPSE BECAUSE OF FAILURE TO SUBMIT A TRANSLATION OF THE DESCRIPTION OR TO PAY THE FEE WITHIN THE PRESCRIBED TIME-LIMIT Effective date: 20220817 Ref country code: DK Free format text: LAPSE BECAUSE OF FAILURE TO SUBMIT A TRANSLATION OF THE DESCRIPTION OR TO PAY THE FEE WITHIN THE PRESCRIBED TIME-LIMIT Effective date: 20220817 Ref country code: CZ Free format text: LAPSE BECAUSE OF FAILURE TO SUBMIT A TRANSLATION OF THE DESCRIPTION OR TO PAY THE FEE WITHIN THE PRESCRIBED TIME-LIMIT Effective date: 20220817 |
|
| VS25 | Lapsed in a validation state [announced via postgrant information from nat. office to epo] |
Ref country code: MD Free format text: LAPSE BECAUSE OF FAILURE TO SUBMIT A TRANSLATION OF THE DESCRIPTION OR TO PAY THE FEE WITHIN THE PRESCRIBED TIME-LIMIT Effective date: 20220817 |
|
| REG | Reference to a national code |
Ref country code: DE Ref legal event code: R097 Ref document number: 502018010426 Country of ref document: DE |
|
| PG25 | Lapsed in a contracting state [announced via postgrant information from national office to epo] |
Ref country code: SK Free format text: LAPSE BECAUSE OF FAILURE TO SUBMIT A TRANSLATION OF THE DESCRIPTION OR TO PAY THE FEE WITHIN THE PRESCRIBED TIME-LIMIT Effective date: 20220817 Ref country code: EE Free format text: LAPSE BECAUSE OF FAILURE TO SUBMIT A TRANSLATION OF THE DESCRIPTION OR TO PAY THE FEE WITHIN THE PRESCRIBED TIME-LIMIT Effective date: 20220817 |
|
| PLBE | No opposition filed within time limit |
Free format text: ORIGINAL CODE: 0009261 |
|
| STAA | Information on the status of an ep patent application or granted ep patent |
Free format text: STATUS: NO OPPOSITION FILED WITHIN TIME LIMIT |
|
| PG25 | Lapsed in a contracting state [announced via postgrant information from national office to epo] |
Ref country code: AL Free format text: LAPSE BECAUSE OF FAILURE TO SUBMIT A TRANSLATION OF THE DESCRIPTION OR TO PAY THE FEE WITHIN THE PRESCRIBED TIME-LIMIT Effective date: 20220817 |
|
| PGFP | Annual fee paid to national office [announced via postgrant information from national office to epo] |
Ref country code: NL Payment date: 20230417 Year of fee payment: 6 |
|
| 26N | No opposition filed |
Effective date: 20230519 |
|
| PGFP | Annual fee paid to national office [announced via postgrant information from national office to epo] |
Ref country code: PT Payment date: 20230417 Year of fee payment: 6 Ref country code: NO Payment date: 20230418 Year of fee payment: 6 Ref country code: IT Payment date: 20230428 Year of fee payment: 6 Ref country code: FR Payment date: 20230417 Year of fee payment: 6 Ref country code: ES Payment date: 20230517 Year of fee payment: 6 Ref country code: DE Payment date: 20230418 Year of fee payment: 6 Ref country code: CH Payment date: 20230502 Year of fee payment: 6 |
|
| PG25 | Lapsed in a contracting state [announced via postgrant information from national office to epo] |
Ref country code: SI Free format text: LAPSE BECAUSE OF FAILURE TO SUBMIT A TRANSLATION OF THE DESCRIPTION OR TO PAY THE FEE WITHIN THE PRESCRIBED TIME-LIMIT Effective date: 20220817 |
|
| PGFP | Annual fee paid to national office [announced via postgrant information from national office to epo] |
Ref country code: TR Payment date: 20230418 Year of fee payment: 6 |
|
| PGFP | Annual fee paid to national office [announced via postgrant information from national office to epo] |
Ref country code: BE Payment date: 20230417 Year of fee payment: 6 |
|
| PGFP | Annual fee paid to national office [announced via postgrant information from national office to epo] |
Ref country code: GB Payment date: 20230420 Year of fee payment: 6 |
|
| PG25 | Lapsed in a contracting state [announced via postgrant information from national office to epo] |
Ref country code: LU Free format text: LAPSE BECAUSE OF NON-PAYMENT OF DUE FEES Effective date: 20230420 |
|
| PG25 | Lapsed in a contracting state [announced via postgrant information from national office to epo] |
Ref country code: MC Free format text: LAPSE BECAUSE OF FAILURE TO SUBMIT A TRANSLATION OF THE DESCRIPTION OR TO PAY THE FEE WITHIN THE PRESCRIBED TIME-LIMIT Effective date: 20220817 |
|
| PG25 | Lapsed in a contracting state [announced via postgrant information from national office to epo] |
Ref country code: MC Free format text: LAPSE BECAUSE OF FAILURE TO SUBMIT A TRANSLATION OF THE DESCRIPTION OR TO PAY THE FEE WITHIN THE PRESCRIBED TIME-LIMIT Effective date: 20220817 |
|
| REG | Reference to a national code |
Ref country code: IE Ref legal event code: MM4A |
|
| PG25 | Lapsed in a contracting state [announced via postgrant information from national office to epo] |
Ref country code: IE Free format text: LAPSE BECAUSE OF NON-PAYMENT OF DUE FEES Effective date: 20230420 |