EP3605554A1 - Mesure du flux sanguin basée sur la pente vaisseau-carte - Google Patents
Mesure du flux sanguin basée sur la pente vaisseau-carte Download PDFInfo
- Publication number
- EP3605554A1 EP3605554A1 EP18290092.8A EP18290092A EP3605554A1 EP 3605554 A1 EP3605554 A1 EP 3605554A1 EP 18290092 A EP18290092 A EP 18290092A EP 3605554 A1 EP3605554 A1 EP 3605554A1
- Authority
- EP
- European Patent Office
- Prior art keywords
- time series
- vessel
- vessels
- diagnostic images
- vessel map
- Prior art date
- Legal status (The legal status is an assumption and is not a legal conclusion. Google has not performed a legal analysis and makes no representation as to the accuracy of the status listed.)
- Withdrawn
Links
Images


Classifications
-
- A—HUMAN NECESSITIES
- A61—MEDICAL OR VETERINARY SCIENCE; HYGIENE
- A61B—DIAGNOSIS; SURGERY; IDENTIFICATION
- A61B6/00—Apparatus for radiation diagnosis, e.g. combined with radiation therapy equipment
- A61B6/50—Clinical applications
- A61B6/504—Clinical applications involving diagnosis of blood vessels, e.g. by angiography
-
- G—PHYSICS
- G16—INFORMATION AND COMMUNICATION TECHNOLOGY [ICT] SPECIALLY ADAPTED FOR SPECIFIC APPLICATION FIELDS
- G16H—HEALTHCARE INFORMATICS, i.e. INFORMATION AND COMMUNICATION TECHNOLOGY [ICT] SPECIALLY ADAPTED FOR THE HANDLING OR PROCESSING OF MEDICAL OR HEALTHCARE DATA
- G16H50/00—ICT specially adapted for medical diagnosis, medical simulation or medical data mining; ICT specially adapted for detecting, monitoring or modelling epidemics or pandemics
- G16H50/20—ICT specially adapted for medical diagnosis, medical simulation or medical data mining; ICT specially adapted for detecting, monitoring or modelling epidemics or pandemics for computer-aided diagnosis, e.g. based on medical expert systems
-
- A—HUMAN NECESSITIES
- A61—MEDICAL OR VETERINARY SCIENCE; HYGIENE
- A61B—DIAGNOSIS; SURGERY; IDENTIFICATION
- A61B6/00—Apparatus for radiation diagnosis, e.g. combined with radiation therapy equipment
- A61B6/48—Diagnostic techniques
- A61B6/481—Diagnostic techniques involving the use of contrast agents
-
- G—PHYSICS
- G06—COMPUTING; CALCULATING OR COUNTING
- G06T—IMAGE DATA PROCESSING OR GENERATION, IN GENERAL
- G06T7/00—Image analysis
- G06T7/0002—Inspection of images, e.g. flaw detection
- G06T7/0012—Biomedical image inspection
-
- G—PHYSICS
- G16—INFORMATION AND COMMUNICATION TECHNOLOGY [ICT] SPECIALLY ADAPTED FOR SPECIFIC APPLICATION FIELDS
- G16H—HEALTHCARE INFORMATICS, i.e. INFORMATION AND COMMUNICATION TECHNOLOGY [ICT] SPECIALLY ADAPTED FOR THE HANDLING OR PROCESSING OF MEDICAL OR HEALTHCARE DATA
- G16H50/00—ICT specially adapted for medical diagnosis, medical simulation or medical data mining; ICT specially adapted for detecting, monitoring or modelling epidemics or pandemics
- G16H50/50—ICT specially adapted for medical diagnosis, medical simulation or medical data mining; ICT specially adapted for detecting, monitoring or modelling epidemics or pandemics for simulation or modelling of medical disorders
-
- G—PHYSICS
- G06—COMPUTING; CALCULATING OR COUNTING
- G06T—IMAGE DATA PROCESSING OR GENERATION, IN GENERAL
- G06T2207/00—Indexing scheme for image analysis or image enhancement
- G06T2207/20—Special algorithmic details
- G06T2207/20081—Training; Learning
-
- G—PHYSICS
- G06—COMPUTING; CALCULATING OR COUNTING
- G06T—IMAGE DATA PROCESSING OR GENERATION, IN GENERAL
- G06T2207/00—Indexing scheme for image analysis or image enhancement
- G06T2207/30—Subject of image; Context of image processing
- G06T2207/30004—Biomedical image processing
- G06T2207/30101—Blood vessel; Artery; Vein; Vascular
- G06T2207/30104—Vascular flow; Blood flow; Perfusion
Definitions
- the present invention relates to an apparatus for assessing a coronary vasculature, a corresponding method and a respective computer program.
- the present invention relates to an apparatus for globally assessing coronary artery disease by enabling a direct determination of flow-related hemodynamic parameters using contrast agent dynamics as tracked via two time-series of diagnostic images.
- Coronary blood flow measurements are an important tool for the assessment of coronary artery disease, as they allow to improve the understanding of the coronary lesions. More particularly, these measurements allow to determine consequences of coronary artery disease, such as the ischemic potential, and also provide treatment guidance for a patient. For this purpose, coronary blood flow measurements are typically performed under resting conditions and under hyperemic conditions in order to determine flow-related properties, such as flow velocity or volumetric flow rate for both states.
- CFR Coronary Flow Reserve
- TFC TIMI frame count
- approaches based on contrast agent dynamics are typically time consuming, complex and affected by foreshortening of the used artery segment. Further, these approaches generally allow the assessment of the flow related properties in a global manner, i.e. for the entire coronary artery tree (or portions thereof).
- One possible way to determine the flow-related properties for a particular patient in a more site-specific manner is to approximate these properties using a geometric model of the coronary artery, or vessel, and computing the corresponding flow-related properties using a fluid dynamics model which models the blood flow through the vessel modeled in the geometric model.
- these approaches require an appropriate determination of boundary conditions and, thus, require sufficient expertise and experience.
- flow-related properties such as blood flow velocity, volumetric flow rate or the like
- an apparatus for assessing a coronary vasculature comprising an input unit configured to receive a first time series of diagnostic images of a plurality of vessels in the coronary vasculature, and a second time series of diagnostic images of the plurality of vessels in the coronary vasculature, a computation unit configured to compute, for the first time series of diagnostic images, a first time series of vessel map feature values of a first dynamic vessel map representing the plurality of vessels, and compute, for the second time series of diagnostic images, a second time series of vessel map feature values of a second dynamic vessel map representing the plurality of vessels, an analyzation unit configured to compare the first time series of vessel map feature values and the second time series of vessel map feature values and to derive, based on the comparing, at least one global hemodynamic parameter.
- time series refers to a plurality of diagnostic images that have been acquired over time. More particularly, these time series may comprise a plurality of diagnostic images with which the contrast agent dynamics through a vasculature can be visualized and, by means of this visualization, the contrast agent dynamics can be tracked.
- the diagnostic images may hereby be acquired by any medical imaging modality capable of visualizing contrast agent in the vasculature.
- One particular imaging method which allows to acquire the diagnostic images is X-ray imaging.
- Each one of the diagnostic images of the first time series and the second time series hereby represents the visualization of the contrast agent dynamics for a particular point in time.
- point in time shall be understood as referring to a certain point in measurement time relative to the moment of injection of the contrast agent.
- the time is measured starting at the moment at which the contrast agent is injected.
- the acquisition of the diagnostic images starts upon injection of the contrast agent.
- the first diagnostic images of a particular time series only visualize a small part of the vasculature as the contrast agent has not yet reached and/or completely filled any of the vessels.
- the contrast agent reaches more and more vessels.
- the amount of vessels visible in the diagnostic images grows over time and represents a vessel map.
- vessel map is to be interpreted broadly and may also refer to single vessels being visible in the diagnostic images at the beginning of the injection. Over time, the contrast agent flows into more and more vessels and the vessel map occupies more and more area in the diagnostic images. Given that the contrast agent dynamic is affected by the same narrowings and friction as the blood flow, the time-evolution of the vessel map during contrast agent inflow provides an indication about the hemodynamics inside the vasculature.
- vessel map feature thus refers to a particular feature of the vessel map as visualized in the diagnostic images.
- this feature of the vessel map may particularly be an area occupied by the vessels in the diagnostic images.
- the feature of the vessel map may also be the quantity of the vessels visible in the pictures.
- Other vessel map features may also be envisioned as long as they allow to track the contrast agent evolution through the vasculature over time.
- time series of vessel map feature values hereby refers to a plurality of vessel map feature values as derived from the vessel maps visualized in the corresponding plurality of diagnostic images of the time series of diagnostic images.
- a vessel map feature value is derived and, thus, corresponds to that particular point in measurement time.
- the thus derived first time series of vessel map features and the second time series of vessel map features are compared to another and, based on the comparison, a global hemodynamic parameter is derived.
- the term global means that the hemodynamic parameter is not specified for one particular vessel or vessel location, i.e. is not a parameter that would locally occur at that position, but is a hemodynamic parameter representing the vasculature as a whole.
- vasculature may particularly refer to a plurality of vessels of one vessel tree.
- the term vasculature may also refer to sub-branches, such as the LAD or LCX) of one vessel tree.
- the term hemodynamic parameter may refer to any kind of parameter indicative of the blood flow properties inside the vessels.
- the hemodynamic parameter may particularly be a flow-related hemodynamic parameter.
- the hemodynamic parameter may be the coronary flow reserve.
- the first and second time series have been acquired under different respective conditions.
- the first time series may be acquired under resting conditions of a patient and the second time series may be acquired under hyperemic conditions.
- the different states could also refer to a time series acquired during contrast agent inflow and the other time series under contrast agent outflow, whereby the measurement time for the first time series is measured in relation to the time point of injection of the contrast agent and the measurement time for the second time series is measured in relation to the time point of starting of the outflow of the contrast agent
- the apparatus therefore enables a global assessment of the coronary vasculature by means of a global hemodynamic parameter, whereby the global hemodynamic parameter may be directly derived from imaging data without the need of segmentation of the diagnostic images and the identification of individual vessels.
- the first time series of diagnostic images and the second time series of diagnostic images is obtained using X-ray angiography.
- any medical imaging modality capable of visualizing contrast agent may be used to monitor the contrast agent dynamics through the vasculature of interest.
- X-ray angiography in particular invasive X-ray angiography, is used to obtain the first and second time series of diagnostic images.
- the diagnostic images of the first time series and the second time series, respectively should be collected from the same projection direction, such as to obtain comparable diagnostic images for both conditions.
- the acquisition of the first and second time series using invasive X-ray angiography encompasses insertion of a contrast agent injection catheter and injection of the contrast agent into the vasculature.
- X-ray image acquisition is started, so that a plurality of X-ray angiography images are collected at predefined intervals.
- the acquisition of these images is performed every 10 to 200 ms, more specifically every 20 to 100 ms, even more specifically every 50 ms. This achieves rates of 15 to 30 images per second.
- the first dynamic vessel map represents the inflow of a contrast agent into the plurality of vessels as a function of time under resting conditions and the second dynamic vessel map represents the inflow of a contrast agent into the plurality of vessels as a function of time under hyperemic conditions.
- the first and second time series should be acquired under different conditions, such as to obtain two comparable datasets.
- these different conditions may particularly refer to the condition of a patient.
- one of the two conditions may be a condition of a patient, where the patient is in a resting state and the other one of the two conditions may be a condition of a patient, where the patient is in a hyperemic state.
- This hyperemic state may particularly be induced by administering a vasodilatory agent to the patient.
- the global hemodynamic parameter is determined based on two time-resolved measurements for establishing the contrast agent evolution through the vasculature over time under two different physical conditions. That is, in both cases a vessel map feature is regarded which value is constantly rising, with the difference between the value for the two different physiological states being indicative of a flow-related global hemodynamic parameter.
- the first dynamic vessel map represents the inflow of a contrast agent into the plurality of vessels as a function of time and the second dynamic vessel map represents the outflow of a contrast agent into the plurality of vessels as a function of time.
- the condition may be a condition of the contrast agent dynamics.
- the first time series of diagnostic images may particularly be acquired during inflow of the contrast agent into the vasculature and the second time series of diagnostic images may be acquired during outflow.
- the contrast agent infusion rate should be known, as should be the bolus length.
- the patient may particularly be in a contrast-induced hyperemic state, that is, the hyperemia is caused by the contrast agent inside the vessels.
- the first time series tracks the growing of the vessel map visualized in the diagnostic image and the second time series tracks the decrease thereof. For both cases respective vessel map feature values are acquired and subsequently compared.
- the first time series of vessel map feature values comprises a first plurality of values indicative of an area occupied by the plurality of vessels in each diagnostic image of the first time series of diagnostic images as a function of time and the second time series of vessel map feature values comprises a second plurality of values indicative of an area occupied by the plurality of vessels in each diagnostic image of the second time series of diagnostic images as a function of time.
- the feature of the vessel map may particularly refer to the area occupied by the vessels of the vasculature to be examined in the diagnostic images. That is, in these embodiments it is determined, for each diagnostic image, i.e. for each point in (measurement) time, a value indicating how much of the area of the image is occupied by the vessels. This area should increase with contrast agent inflow and decrease with contrast agent outflow, thereby allowing to draw conclusions about the contrast agent dynamics.
- the value indicating the area occupied by the vessels may particularly be a relative value, where 0.0 means that no area is occupied and 1.0 means that the entire diagnostic image area is covered by the vessels. It shall further be understood that the relative value may not be determined for the entire diagnostic image area, but may also be determined for a section of said diagnostic image area, e.g. for the inner 90% to 70% of the diagnostic image area.
- a value indicating the area occupied by the vessels in the diagnostic image shall be acquired for each diagnostic image of the first time series and for each diagnostic image of the second time series.
- the diagnostic image area or a section thereof has to be selected equally for both time series. This allows to obtain accurate information about the contrast inflow (or outflow) and, by that, about the global flow dynamics inside the vessels in the vasculature.
- the analyzation unit is configured to compare the first time series of vessel map feature values and the second time series of vessel map feature values by determining a first slope value for the first plurality of values indicative of the area occupied by the plurality of vessels as function of time, determining a second slope value for the second plurality of values indicative of the area occupied by the plurality of vessels as function of time, and comparing the first and second slope value to derive the at least one global hemodynamic parameter.
- the determination of the at least one global hemodynamic parameter may particularly be based on a comparison of a slope value indicating the slope of the area occupied by the vessels as a function of time for the first time series and the second time series respectively.
- the values determined per diagnostic image of both time series for the area occupied by the vessels are regarded as a function of time, i.e. a course of these values is calculated as a function of measurement time, whereby the measurement time is determined relative to the time point of injection of the contrast agent or to the time point of start of the contrast agent outflow.
- a slope value is determined. This slope value may particularly correspond to a maximum slope or an average slope.
- the thus determined slope values are compared for both time series. That is, the slope value determined for one particular diagnostic image of the first time series acquired at one particular point in measurement time relative to the injection of the contrast agent is compared to the slope value determined for the corresponding diagnostic image of the second time series acquired at the corresponding point in measurement time, i.e. relative to the injection of the contrast agent or the start of the outflow of the contrast agent. Based on this comparison, differences between the slope under different conditions may be determined, thereby allowing to draw conclusions regarding the flow dynamics inside the vessels.
- the analyzation unit further comprises a classifier unit trained with a ground truth for the at least one global hemodynamic parameter, wherein the classifier unit is configured to derive, based on the comparing and the ground truth, the at least one global hemodynamic parameter.
- the analyzation unit implements a machine learning algorithm. That is, the analyzation unit comprises a classifier unit that has been trained with a ground truth relating to the slope comparison and the respective global hemodynamic parameter values of interest. The training of the classifier may particularly be performed using a training dataset that has been derived from previous measurements of the same patient or of a plurality of different patients. Based on this ground truth, the analyzation unit is enabled to obtain the at least one global hemodynamic parameter using an empirical function, by comparison of the slope of the vessel area occupied in the image as a function of time under resting conditions and hyperemic conditions, respectively.
- the input unit is further configured to receive first intravascular measurement data comprising a first pressure value acquired under resting conditions at a proximal measurement position inside a vessel of interest of the plurality of vessels and receive second intravascular measurement data comprising a first pressure value acquired under hyperemic conditions at the proximal measurement position inside the vessel of interest and the apparatus further comprises a comparing unit configured to determine a deviation between the first pressure value acquired under resting conditions and the first pressure value acquired under hyperemic conditions, compare the deviation to a predetermined threshold and, if the deviation is larger than the predetermined threshold, output a corresponding indication.
- the accuracy of the at least one global hemodynamic parameter is an important factor in the assessment of coronary artery disease.
- an approach is implemented with allows to detect potential inaccuracies/unreliability of the at least one global hemodynamic parameter determined by the analyzation unit.
- the catheter used for injecting the contrast agent into the vasculature may allow to determine an aortic pressure value in the vessel in which the catheter is introduced. That is, the catheter is introduced into the vessel and positioned at a first measurement position, which corresponds to a proximal position, and used to obtain a pressure value at this position under both, resting and hyperemic conditions. This is achieved by means of a pressure sensor connected to the outside of the injection catheter, whereby the pressure propagates through the hollow length of the injection catheter. In some embodiments, the pressure measurement is not performed by the catheter, but by an additional pressure wire introduced into a vessel of interest.
- proximal shall be understood within its conventional meaning, i.e. as defining a position close to the main mass of the body.
- a proximal position is a position closer to the heart, typically close to the aorta, than a respective distal position when viewed along a longitudinal axis of the coronary vessel.
- the term proximal measurement position particularly may refer to an intravascular position relatively close to or in the aorta, at which a pressure value is measured by an invasive measurement. This pressure value is hereby measured once under resting conditions and once under hyperemic conditions at the same proximal measurement position.
- pressure values obtained by the catheter at the proximal measurement position are then compared to one another to detect if a significant change in (aortic) pressure or heart rate has occurred between the measurement under resting conditions and the measurement under hyperemic conditions. That is, a deviation between the pressure values obtained under resting and hyperemic conditions, respectively, is compared to a predetermined threshold. If it is determined that the deviation exceeds the threshold, an indication thereof is generated.
- a suitable threshold for this measure might lie within the range of 15 to 5 mmHg. A particular threshold may hereby be 10 mmHg.
- the term indication may refer to a warning that is output to a user to inform the user about the occurrence of the deviation.
- the term indication may alternatively or additionally refer to a correction factor that is generated and provided to the analyzation unit to correct the at least one global hemodynamic parameter. This correction factor may particularly be provided in terms of a training- or model-based correction.
- inaccuracies in the determined global hemodynamic parameters may be reduced and/or the user may be warned if there is potential for such inaccuracies, thereby improving the assessment process.
- the first intravascular measurement data further comprises a second pressure value acquired under resting conditions at a distal measurement position inside the vessel of interest
- the second intravascular measurement data further comprises a second pressure value acquired under hyperemic conditions at the distal measurement position inside the vessel of interest.
- the apparatus further comprises a determination unit configured to determine a value indicative of a hydrostatic pressure difference between the proximal measurement position and the distal measurement position inside the vessel of interest and a calculation unit configured to calculate, based on the first and second pressure value of the first intravascular measurement data, the first and second pressure value of the second intravascular measurement data and the value indicative of the hydrostatic pressure difference, at least one local hemodynamic parameter.
- the at least one value indicative of the hydrostatic pressure difference comprises a height difference between the proximal measurement position and the distal measurement position.
- the at least one local hemodynamic parameter comprises a coronary flow reserve (CFR).
- This global hemodynamic parameter is typically a flow-related hemodynamic parameter, i.e. a hemodynamic parameter that globally assesses the flow dynamics in the vasculature of interest.
- a hemodynamic parameter that globally assesses the flow dynamics in the vasculature of interest.
- it may also be useful to perform local assessment of specific vessels in the vasculature. This may particularly be the case, if a vessel is identified has having a stenosis or the like.
- CFR hemodynamic parameter coronary flow reserve
- the pressure gradient ⁇ p Bernoulli 1 / 2 ⁇ ⁇ ⁇ v 1 2 ⁇ v 2 2 is typically negligible, since the flow velocities are usually very similar.
- the information obtained using intravascular pressure measurements is combined with a value indicative of a hydrostatic pressure difference retrieved by means of a further medical measurement modality.
- suitable medical measurement modalities particularly encompass computed tomography, X-ray angiography or any type of three-dimensional tracking of the pressure wire, such as electromagnetic tracking, ultrasound tracking, impedance-based tracking or the like.
- optical shape sensing may also be employed to determine the value.
- the intravascular measurements may hereby particularly be performed, under both, hyperemic and resting conditions, whereby for both cases at least two pressure values are determined, one at a proximal and one at a distal measurement position. This allows to determine the pressure difference between the proximal and distal measurement position under hyperemic conditions as well as resting conditions.
- These intravascular pressure measurements may particularly be performed by means of a pressure wire that is introduced into the vessel of interest.
- the pressure wire is used to measure a pressure value at at least two measurement positions, namely the proximal measurement position and a distal measurement position.
- the term distal measurement position hereby refers to an intravascular position inside the vessel of interest, which is distant from the main mass of the body. That is, for the coronary vasculature, a distal position relates to a position more distant from the heart compared to the proximal position when viewed along a longitudinal axis of the coronary vessel.
- the first intravascular measurement data hereby comprises the first and second pressure value obtained at the proximal and distal measurement position, respectively, under resting conditions.
- the second intravascular measurement data comprises the first and second pressure value obtained at the proximal and distal measurement position under hyperemic conditions.
- the determination unit further receives measurement data from the additional medical measurement modality.
- This measurement data may particularly refer to one or more tracking images and/or one or more diagnostic images, whereby the value indicative of the hydrostatic pressure difference may be derived from these images.
- an electromagnetic tracking image is obtained.
- the determination unit uses this electromagnetic tracking image to determine the value indicative of the hydrostatic pressure difference.
- a value indicative of the pressure difference may hereby particularly be a height difference ⁇ h .
- the elevation i.e. the determination of the height difference ⁇ h shall particularly be performed at least across a cardiac cycle in order to correct the hemostatic effects in their variability during the cardiac cycle.
- a motion correction to correct for the variability of the height difference ⁇ h due to breathing motion may also be performed.
- this determination of the local CFR value does not require a previous determination of a global CFR value as also performed by the apparatus. What is necessary is that the apparatus is provided with first and second intravascular measurement data measured at a proximal and distal measurement position under resting and hyperemic conditions, respectively, and measurement data which allows to determine the elevation between the two measurement positions.
- the determining of the value indicative of the hydrostatic pressure difference is performed based on at least one diagnostic image obtained from at least one of the first time series of diagnostic images and the second time series of diagnostic images.
- the determination unit may particularly use at least one diagnostic image from the first time series and/or the second time series.
- the diagnostic image data may particularly be a single or multiple angiography images taken at specific projection angles.
- further diagnostic image data may be used, such as a CT model.
- a method for assessing a coronary vasculature comprising the steps of receiving a first time series of diagnostic images of a plurality of vessels in the coronary vasculature, receiving a second time series of diagnostic images of the plurality of vessels in the coronary vasculature, computing, for the first time series of diagnostic images, a first time series of vessel map feature values of a first dynamic vessel map representing the plurality of vessels, computing, for the second time series of diagnostic images, a second time series of vessel map feature values of a second dynamic vessel map representing the plurality of vessels, comparing the first time series of vessel map feature values and the second time series of vessel map feature values, and deriving, based on the comparing, at least one global hemodynamic parameter.
- the method further comprises the steps of receiving first intravascular measurement data comprising a first pressure value acquired under resting conditions at a proximal measurement position inside a vessel of interest of the plurality of vessels and a second pressure value acquired under resting conditions at a distal measurement position inside the vessel of interest, receiving second intravascular measurement data comprising a first pressure value acquired under hyperemic conditions at the proximal measurement position inside the vessel of interest and a second pressure value acquired under hyperemic conditions at the distal measurement position inside the vessel of interest, determining, based on at least one diagnostic image obtained from at least one of the first time series of diagnostic images and the second time series of diagnostic images, a value indicative of a hydrostatic pressure difference between the proximal measurement position and the distal measurement position inside the vessel of interest and calculating, based on the first and second pressure value of the first intravascular measurement data, the first and second pressure value of the second intravascular measurement data and the value indicative of the hydrostatic pressure difference, at least one local hemodynamic parameter.
- a computer program for controlling an apparatus according to any of the above embodiments is provided, which, when executed by a processing unit, is adapted to perform the method according to one or more of its embodiments.
- a computer-readable medium having stored thereon the computer program is provided.
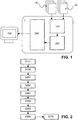
- Fig. 1 represents schematically a first exemplary embodiment of an apparatus 1 for determining at least one global hemodynamic parameter in order to assess the coronary vasculature.
- Apparatus 1 comprises an input unit 100, a computation unit 200 and an analyzation unit 300 and is communicatively coupled to display unit 700.
- Input unit 100 is configured to receive a first time series 10 of diagnostic images and a second time series 20 of diagnostic images from a medical imaging modality.
- the first time series 10 is acquired under resting conditions, i.e. while the patient is at rest.
- the second time series 20 is acquired under hyperemic conditions, i.e. the patient received a vasodilatory agent to induce hyperemia.
- the first time series 10 and second time series 20 each comprise a plurality of diagnostic images collected during contrast agent inflow using invasive X-ray angiography.
- the contrast agent is hereby introduced by inserting a contrast injection catheter into a vessel in a patient's coronary vasculature and injecting the contrast agent using this catheter.
- the acquisition of the first time series 10 of diagnostic images is hereby optionally started concurrently with the starting of the injection of the contrast agent into the vasculature and stopped once the contrast agent has been completely injected. That is, the first time series 10 shows the full inflow of the contrast agent into the coronary vasculature under resting conditions and the second time series 20 shows the full inflow of the contrast agent under hyperemic conditions.
- the first time series 10 and second time series 20 are then provided to computation unit 200.
- Computation unit 200 is configured to receive the first time series 10 and the second time series 20 and, in the exemplary embodiment according to Fig. 1 , applies a coarse segmentation to each diagnostic image of the first time series 10 and of the second time series 20. This segmentation allows to determine a vessel map feature for each diagnostic image in the first time series 10 and the second time series 20, respectively.
- this vessel map feature particularly is a vessel area that is occupied by the vessels in a predefined portion of the diagnostic image (i.e. that is visualized due to contrast agent having already entered a particular part of the vasculature). Accordingly, a value for the vessel map area is calculated for each diagnostic image in the first time series 10 and the second time series 20. These values are then provided to analyzation unit 300.
- Analyzation unit 300 is configured to consider each value for the vessel map area in the diagnostic images of the first time series 10 as a function of time and each value for the vessel map area in the diagnostic images of the second time series 20 as a function of time. That is, analyzation unit 300 determines two mappings for the vessel map area values, one for the first time series 10 and one for the second time series 20. This enables the analyzation unit 300 to derive a slope for both mappings and to compare the slope of these functions to one another. In the exemplary embodiment of Fig.
- analyzation unit hereby determines the maximal slope and compares the maximal slope for the vessel map area of the first time series 10 to the maximal slope for the vessel map area of the second time series to determine a global flow-related hemodynamic parameter, which, in the exemplary embodiment of Fig. 1 , is a global value for the coronary flow reserve (CFR). It shall be understood that, in some embodiments, the average slope may be used to determine the global flow-related hemodynamic parameter, such as the CFR.
- CFR coronary flow reserve
- the analyzation unit 300 may optionally implement a machine-learning algorithm. That is, the analyzation unit 300 may comprise a classifier unit that has been trained with a ground truth relating to the slope relation and the respective global CFR values (or other global hemodynamic parameter values) using a training dataset derived e.g. from a plurality of different patients. Based on this ground truth, the analyzation unit then determines a respective global CFR value indicated by the comparison of the slope of the vessel area occupied in the image as a function of time at a resting state and a hyperemic state, respectively. The analyzation unit optionally provides the determined global CFR value to display unit 700.
- Display unit 700 computes a graphical representation of the determined global CFR value and provides this representation to a user.
- Fig. 2 represents schematically a flow chart of the method for determining a global flow-related hemodynamic parameter using apparatus 1 according to the exemplary embodiment of Fig. 1 .
- step S101 input unit 100 receives a first time series 10 of diagnostic images, the first time series 10 having been acquired under resting conditions.
- step S102 input unit 100 further receives a second time series 20 of diagnostic images, having been acquired under hyperemic conditions.
- step S201 computation unit 200 receives the first time series 10 of diagnostic images and applies a coarse segmentation to each diagnostic image of the first time series 10 to determine a vessel map feature value for each diagnostic image, i.e. a value representing the time evolution of the feature map.
- step S202 computation unit 200 receives the second time series 20 of diagnostic images and applies a coarse segmentation to each diagnostic image of the second time series to determine a respective vessel map feature value for each diagnostic image.
- the vessel map feature is the area that is occupied by the vessels in a predefined portion of the diagnostic images.
- a value for the vessel map area is calculated for each diagnostic image in the first time series 10 and the second time series 20 in steps S201 and S202 and subsequently provided to analyzation unit 300.
- analyzation unit 300 determines a mapping for the values representing the area occupied by the vessels in the diagnostic images of the first time series 10 by considering each value determined for the first time series as a function of time to derive a first slope for the time series of these values. In the exemplary embodiment of Fig. 2 , this first slope is a maximal slope. In step S302 analyzation unit 300 determines a mapping for the values representing the area occupied by the vessels in the diagnostic images of the second time series 10 by considering each value for the second time series 20 as a function of time to derive a second slope of the time series of these values. In the exemplary embodiment of Fig. 2 , this second slope is also a maximal slope.
- analyzation unit 300 compares the first and second maximal slope to one another.
- analyzation unit 300 uses the comparison to determine a global flow-related hemodynamic parameter, such as the coronary flow reserve (CFR).
- CFR coronary flow reserve
- a graphical representation of the result of this determination is generated by display unit 700 and presented to a user.
- Fig. 3 illustrates a graphical representation of a determination of a flow-related hemodynamic parameter according to the first exemplary embodiment.
- Diagnostic images 11, 12, 13 and 14 visualize the vessel map evolution during contrast agent injection over time for a resting condition. It shall be understood that the diagnostic images for a hyperemic conditions would visualize the vessel map in a corresponding manner.
- Diagnostic image 11 only shows a small part of the vessel map, i.e. the area occupied by the vessel map in the diagnostic image 11 has a relatively small value.
- diagnostic image 14 which was acquired at full inflow of the contrast agent, visualizes a large vessel map, i.e. the area occupied by the vessel map in the diagnostic image 14 has a relatively large value.
- curve 15 is determined, in which the values for the area occupied by the vessel map in the diagnostic images is computed as a function of time.
- curve 16 is provided, in which the corresponding values for the area occupied by the vessel map in the diagnostic images is also computed as a function of time. This allows to derive a slope value for both curves. The slope value may then be used to determine the global flow-related hemodynamic parameter.
- FIG. 4 schematically illustrates an apparatus 2 for assessing a coronary vasculature according to a second exemplary embodiment.
- Apparatus 2 comprises an input unit 100, a computation unit 200, an analyzation unit 300 and a comparing unit 400 and is communicatively coupled to a display unit 700.
- the input unit 100 is configured to receive a first time series 10 of diagnostic images and a second time series 20 of diagnostic images from a medical imaging modality and to further receive first intravascular measurement data 30 comprising a first pressure value determined by an intravascular measurement device at a proximal position inside the vessel and second intravascular measurement data 40 comprising a second pressure value determined by an intravascular measurement device at a proximal position inside the vessel.
- the intravascular measurement device may particularly be the injection catheter for injection of the contrast agent.
- the first time series 10 of diagnostic images and the first intravascular measurement data 30 are acquired under resting conditions. That is, the first intravascular measurement data 30 determined using the catheter when injecting the contrast agent for collection of the first time series 10.
- the second time series 20 of diagnostic images and the second intravascular measurement data 40 are acquired under hyperemic conditions, i.e. the second intravascular measurement data 30 is determined using the catheter for contrast agent injection for collection of the second time series 20.
- the first time series 10 and the second time series 20 are then provided to computation unit 200 for coarse segmentation as described in relation to Fig. 1 in order to compute a first time series of vessel map feature values and a second time series of vessel map feature values, respectively.
- the thus computed first and second time series of vessel map feature values are subsequently provided to analyzation unit 300 and analyzed therein as also described in relation to Fig. 1 .
- analyzation unit 300 considers each value for the vessel map area in the diagnostic images of the first time series 10 as a function of time and each value for the vessel map area in the diagnostic images of the second time series 20 as a function of time, derives a slope for both curves and compares the slope for both curves to one another to determine a global flow-related hemodynamic parameter, which, in the exemplary embodiment of Fig. 4 , is a global CFR value.
- the first intravascular measurement data 30 comprising a first pressure value acquired under resting conditions and the second intravascular measurement data 40 comprising a first pressure value acquired under hyperemic conditions are provided to the comparing unit 400.
- Comparing unit 400 compares the first pressure value acquired under resting conditions and the second pressure value acquired under hyperemic conditions and determines if there is a deviation between these values. More specifically, comparing unit 400 determines a value for this deviation. Comparing unit 400 then compares this deviation value to a predetermined threshold value. If the value exceeds the threshold value, comparing unit 400 provides an indication thereof.
- comparing unit 400 particularly sends an indication to display unit 700 and display unit 700 computes a graphical representation of the indication, such as a warning or an alarm signal, to show the user that the determined global flow-related hemodynamic parameter may be unreliable.
- comparing unit may also use the comparison to determine a correction factor and may be configured to apply the correction factor to the determined global hemodynamic parameter in order to overcome the potential unreliability.
- an indication that a correction has been performed may be provided to display unit 700 and display unit 700 may generate a graphical representation of that indication, so the user is aware of the correction.
- display unit 700 may also receive the determined global hemodynamic parameter and generate a representation thereof to present to the user.
- Fig. 5 represents a flow chart for a method for assessing a coronary vasculature according to the second exemplary embodiment.
- Steps S101 and S102 correspond to steps S101 and S102 according to the first embodiment and explained in relation to Fig. 2 , i.e. in these steps a first time series 10 of diagnostic images and a second time series 20 of diagnostic images from a medical imaging modality are received at the input unit 100.
- the input unit 100 further receives first intravascular measurement data 30 comprising a first pressure value determined at a proximal position inside a vessel under resting conditions.
- step S104 input unit 100 receives second intravascular measurement data 40 comprising a first pressure value measured at a proximal position inside the vessel under hyperemic conditions.
- steps S201 to S304 of Fig. 5 the first time series 10 and the second time series 20 processed by computation unit 200 and analyzation unit 300 as described in relation to Fig. 1 in order to determine a global flow-related hemodynamic parameter.
- This global flow-related hemodynamic parameter may be reliable or unreliable.
- the first and second intravascular measurement data 30, 40 are used by comparing unit 400 in steps S401 to S403.
- step S401 comparing unit 400 compares the first pressure value acquired under resting conditions and the second pressure value acquired under hyperemic conditions and determines a value indicative of the deviation of the two pressure values.
- step S402 comparing unit 400 compares this deviation value to a predetermined threshold value and, if the value exceeds the threshold value, provides an indication that the determined global hemodynamic parameter may be unreliable in step S403.
- This indication may be a warning that can be graphically represented to a user by display unit 700 in step S701.
- the indication may also correspond to a correction factor that can be applied to the global hemodynamic parameter determination in step S403.
- the display unit 700 may generate a graphical representation of an indication that a correction has been performed and present said representation to a user in step S701.
- Fig. 6 schematically illustrates an apparatus 3 for assessing a coronary vasculature according to a third exemplary embodiment.
- Apparatus 3 also comprises an input unit 100, a computation unit 200, an analyzation unit 300 and a comparing unit 400 and is communicatively coupled to a display unit 700.
- the respective functionalities of these units correspond to the ones explained in relation to Fig. 4 and will not be discussed in detail in the following to avoid unnecessary repetitions.
- apparatus 3 comprises a determination unit 500 and a calculation unit 600.
- the input unit 100 is configured to receive a first time series 10 of diagnostic images and a second time series 20 of diagnostic images from a medical imaging modality and to further receive first intravascular measurement data 30 and second intravascular measurement data 40.
- the first intravascular measurement data 30 hereby comprises a first pressure value acquired under resting conditions at a proximal position inside a vessel of interest and a second pressure value acquired under resting conditions at a distal position.
- the second intravascular measurement data 40 comprises a first pressure value acquired under hyperemic conditions at a proximal position inside a vessel of interest and a second pressure value acquired under hyperemic conditions at a distal position.
- the first and second intravascular measurement data may particularly have been obtained by inserting a pressure wire into a vessel of interest and measuring the pressure values at two measurement positions, a proximal and a distal position, under resting and hyperemic conditions.
- the input unit 100 may also receive one or more measurement results from a different medical measurement modality.
- the input unit 100 may receive three-dimensional tracking images of a pressure wire for performing the intravascular pressure measurement.
- the apparatus may even work entirely without receiving the first and second time series of diagnostic images.
- the first time series 10 of diagnostic images and the second time series 20 of diagnostic images may be processed by the computation unit 200 and the analyzation unit 300 to determine a global hemodynamic parameter, as described in detail herein above.
- the first intravascular measurement data 30 and the second intravascular measurement data 40 may optionally be used to provide input on the reliability of the global hemodynamic parameter and/or to correct the global hemodynamic parameter when necessary.
- the comparing unit 400 compares the first pressure value acquired under resting conditions and the second pressure value acquired under hyperemic conditions and determines if there is a deviation between these values. Comparing unit 400 then compares the value of this deviation to a predetermined threshold value to determine if the threshold is exceeded. If that is the case, an indication is provided which indicates the reliability of the global hemodynamic parameter and may also indicate a correction factor to correct the global hemodynamic parameter.
- apparatus 3 comprises a determination unit 500.
- One or more diagnostic images from the first time series 10 or the second time series 20 are provided to the determination unit 500.
- one or more tracking images obtained by a respective tracking modality may be provided to determination unit 500.
- Determination unit 500 segments the diagnostic or tracking images and determines, based on this segmentation, a value indicative of a hydrostatic pressure difference.
- the one or more images may be used to generate, based on the segmentation, a geometric three-dimensional model of the vessel of interest. From this model, two positions, one for each pressure sensor, can be determined. This is possible if the pressure sensor is visible in the images from two different angulations. From these two positions, it is possible to determine the value indicative of the hydrostatic pressure difference.
- this value may particularly be a height difference ⁇ h between the proximal measurement position and the distal measurement position inside the vessel.
- the height difference may also be determined using a single 2D diagnostic image, such as a single two-dimensional X-ray image.
- the C-arm for collecting such X-ray images has to have a suitable orientation. Such a suitable orientation is given if one of the two axes of the X-ray detector is parallel to the pull of gravity.
- the value indicative of the hydrostatic pressure difference, in particular the height difference may be determined using a three-dimensional computed tomography (CT) road map, whereby the two intravascular measurement positions are indicated in the road map.
- CT computed tomography
- Calculation unit 600 receives the height difference ⁇ h and, further, the first intravascular measurement data 30 and the second intravascular measurement data 40.
- the calculation unit 600 extracts, from the first intravascular measurement data 30, the first pressure value determined at the proximal position and the second pressure value determined at the distal position and determines a pressure difference ⁇ p meas _ R for the measurement obtained under resting conditions. Further, the calculation unit 600 extracts, from the second intravascular measurement data 40, the first pressure value determined at the proximal position and the second pressure value determined at the distal position and determines a pressure difference ⁇ p meas _ H for the measurement obtained under hyperemic conditions.
- the calculation unit 600 uses the height difference ⁇ h and the pressure difference ⁇ p meas _ R under resting conditions as well as the pressure difference ⁇ p meas_H measured under hyperemic conditions to determine a local flow-related hemodynamic parameter.
- This local flow-related hemodynamic parameter may particularly correspond to the coronary flow reserve (CFR).
- the thus determined local flow-related hemodynamic parameter is provided to the display unit 700 along with the global flow-related hemodynamic parameter.
- the display unit 700 is configured to generate a graphical representation of the global hemodynamic parameter and the local hemodynamic parameter, respectively and to present said graphical representation to a user.
- Fig. 7 represents a flow chart for a method for locally determining a flow-related hemodynamic parameter as described herein above.
- step S101 medical measurement data is received at the input unit 100.
- This medical measurement data may particularly refer to a diagnostic image or a tracking image, obtained from a vessel of interest.
- the diagnostic image may be one of the plurality of diagnostic images in the first time series 10 or one of the plurality of diagnostic images in the second time series 20.
- the diagnostic image may be a diagnostic image that has been obtained during a measurement dedicated to obtaining a diagnostic image for the sole purpose of determining the hydrostatic pressure difference and, thus, the local hemodynamic parameter.
- the tracking image may be obtained using a 3d-tracking method, such as electromagnetic tracking or optical tracking, for tracking the catheter for introducing the contrast agent.
- the tracking image may be obtained using a 3d-tracking method for tracking a dedicated pressure wire.
- the first and second intravascular measurement data is received at the input unit 100, respectively.
- the first and second intravascular measurement data each comprise a first pressure value measured at a proximal measurement position and a second pressure value measured at a distal measurement position, whereby the first intravascular measurement data has been acquired under resting conditions and the second intravascular measurement data has been acquired under hyperemic conditions.
- step S501 the medical measurement data, in particular the diagnostic or tracking image is segmented at determination unit 500 and, based on this segmentation, a value indicative of a hydrostatic pressure difference is determined.
- this value corresponds to the height difference ⁇ h between the proximal measurement position at which the first pressure value was measured and the distal measurement position at which the second pressure value was measured.
- the thus determined height difference ⁇ h is then provided to calculation unit 600.
- step S601 the calculation unit 600 extracts, from the first intravascular measurement data 30, the first pressure value determined at the proximal position and the second pressure value determined at the distal position.
- step S602 the calculation unit then determines a pressure difference ⁇ p meas _ R between the first pressure value and the second pressure value of the first intravascular measurement data. That is, the pressure difference for the pressure measurement under resting conditions is obtained in step S602.
- step S604 the calculation unit 600 extracts, from the second intravascular measurement data 40, the first pressure value determined at the proximal position and the second pressure value determined at the distal position. In step S605, the calculation unit then determines the corresponding pressure difference ⁇ p meas _ H for the measurement performed under hyperemic conditions.
- step S606 the calculation unit determines a local flow-related hemodynamic parameter based on the height difference ⁇ h , the pressure difference ⁇ p meas _ R under resting conditions and the pressure difference ⁇ p meas_H measured under hyperemic conditions.
- this local flow-related hemodynamic parameter corresponds to the coronary flow reserve (CFR) and is calculated as indicated herein above.
- the resulting CFR value is then provided to a display unit 700 in step S701 which generates and displays a graphical representation thereof to a user.
- the diagnostic images have been obtained using X-ray angiography, it shall be understood that in other embodiments, the diagnostic images may be retrieved by other imaging methods, such as helical computed tomography or sequential computed tomography, magnetic resonance imaging, ultrasound imaging, or the like.
- the input unit, the computation unit, the analyzation unit, the comparing unit, the determination unit and the calculation unit are implemented as several separate entities, these units may also correspond to the same entity. More specifically, they may be implemented as respective modules and/or a computer program to be executed by a processing device.
- the assessment has been performed for the coronary physiology
- the modeling may likewise be performed on other physiologies of the human body.
- the approach may be applied to assess the peripheral arteries in the human body.
- first and second time series have been obtained under resting and hyperemic conditions
- first and second time series may also be obtained to correspond to other different conditions, such as the inflow and outflow of the contrast agent from the vasculature.
- the apparatus can also be implemented to include a contrast agent injection into sub-branches (such as the LAD/LCX) or may include a segmentation scheme to allow to determine a global hemodynamic parameter per vascular area.
- the segmentation scheme may cover an explicit vessel segmentation at peak filling of the contrast agent to determine the global hemodynamic parameter per vessel segment or an analysis of the vessel map on a regional basis.
- the slope was used to determine a global hemodynamic value, it shall be understood that the slope may also be used for other applications such as estimation of stenosis severity by adding the slope to the model.
- the pressure measurements were used to determine the coronary flow reserve, it shall be understood that the measurements may also be used to determine, based on a vessel segmentation, values such as the fluid dynamic resistance of the vessel and, therefrom, a corresponding flow velocity value.
- the vessel segmentation may also be used to determine local vessel diameters and, thereby, the pressure gradient ⁇ p Bernoulli 1/2 * ⁇ * v 1 2 ⁇ v 2 2 may be estimated to further improve the accuracy of the pressure-based determination of the CFR.
- a single unit or device may fulfill the functions of several items recited in the claims.
- the mere fact that certain measures are recited in mutually different dependent claims does not indicate that a combination of these measures cannot be used to advantage.
- Procedures like the receiving of the time series of diagnostic images and/or of intravascular measurement data, the calculation of the time series of vessel map features, the comparing of feature values, the deriving of the global hemodynamic parameter, the deriving of a local hemodynamic parameter et cetera performed by one or several units or devices can be performed by any other number of units or devices.
- These procedures in accordance with the invention can hereby be implemented as program code means of a computer program and/or as dedicated hardware.
- a computer program may be stored/distributed on a suitable medium, such as an optical storage medium or a solid-state medium, supplied together with or as part of other hardware, but may also be distributed in other forms, such as via the Internet or other wired or wireless telecommunication systems.
- a suitable medium such as an optical storage medium or a solid-state medium, supplied together with or as part of other hardware, but may also be distributed in other forms, such as via the Internet or other wired or wireless telecommunication systems.
- the invention relates to an apparatus for assessing a coronary vasculature, comprising an input unit configured to receive a first time series of diagnostic images of a plurality of vessels in the coronary vasculature, and a second time series of diagnostic images of the plurality of vessels in the coronary vasculature, a computation unit configured to compute, for the first time series of diagnostic images, a first time series of vessel map feature values of a first dynamic vessel map representing the plurality of vessels, and compute, for the second time series of diagnostic images, a second time series of vessel map feature values of a second dynamic vessel map representing the plurality of vessels and an analyzation unit configured to compare the first time series of vessel map feature values and the second time series of vessel map feature values and to derive, based on the comparing, at least one global hemodynamic parameter.
- a global assessment of coronary artery disease is enabled which allows to determine respective global flow-related hemodynamic parameter directly from time sequences of diagnostic images without the need to segment and detect individual vessels.
Priority Applications (6)
| Application Number | Priority Date | Filing Date | Title |
|---|---|---|---|
| EP18290092.8A EP3605554A1 (fr) | 2018-08-03 | 2018-08-03 | Mesure du flux sanguin basée sur la pente vaisseau-carte |
| US17/263,469 US20210161495A1 (en) | 2018-08-03 | 2019-08-02 | Blood flow measurement based on vessel-map slope |
| EP19745626.2A EP3830839A1 (fr) | 2018-08-03 | 2019-08-02 | Mesure de débit sanguin basée sur une pente de carte vasculaire |
| JP2021505246A JP2021532878A (ja) | 2018-08-03 | 2019-08-02 | 血管マップの傾きに基づく血流測定 |
| PCT/EP2019/070854 WO2020025780A1 (fr) | 2018-08-03 | 2019-08-02 | Mesure de débit sanguin basée sur une pente de carte vasculaire |
| CN201980065281.XA CN112805790A (zh) | 2018-08-03 | 2019-08-02 | 基于血管图斜率的血流测量 |
Applications Claiming Priority (1)
| Application Number | Priority Date | Filing Date | Title |
|---|---|---|---|
| EP18290092.8A EP3605554A1 (fr) | 2018-08-03 | 2018-08-03 | Mesure du flux sanguin basée sur la pente vaisseau-carte |
Publications (1)
| Publication Number | Publication Date |
|---|---|
| EP3605554A1 true EP3605554A1 (fr) | 2020-02-05 |
Family
ID=63405139
Family Applications (2)
| Application Number | Title | Priority Date | Filing Date |
|---|---|---|---|
| EP18290092.8A Withdrawn EP3605554A1 (fr) | 2018-08-03 | 2018-08-03 | Mesure du flux sanguin basée sur la pente vaisseau-carte |
| EP19745626.2A Pending EP3830839A1 (fr) | 2018-08-03 | 2019-08-02 | Mesure de débit sanguin basée sur une pente de carte vasculaire |
Family Applications After (1)
| Application Number | Title | Priority Date | Filing Date |
|---|---|---|---|
| EP19745626.2A Pending EP3830839A1 (fr) | 2018-08-03 | 2019-08-02 | Mesure de débit sanguin basée sur une pente de carte vasculaire |
Country Status (5)
| Country | Link |
|---|---|
| US (1) | US20210161495A1 (fr) |
| EP (2) | EP3605554A1 (fr) |
| JP (1) | JP2021532878A (fr) |
| CN (1) | CN112805790A (fr) |
| WO (1) | WO2020025780A1 (fr) |
Cited By (1)
| Publication number | Priority date | Publication date | Assignee | Title |
|---|---|---|---|---|
| EP4009334A1 (fr) * | 2020-12-03 | 2022-06-08 | Koninklijke Philips N.V. | Flux coronaire dérivé par l'angiographie |
Citations (2)
| Publication number | Priority date | Publication date | Assignee | Title |
|---|---|---|---|---|
| US20130116739A1 (en) * | 2011-11-07 | 2013-05-09 | Paieon Inc. | Method and system for detecting and analyzing heart mecahnics |
| US20150327780A1 (en) * | 2014-05-16 | 2015-11-19 | Kabushiki Kaisha Toshiba | Image processing apparatus, image processing method, and storage medium |
Family Cites Families (9)
| Publication number | Priority date | Publication date | Assignee | Title |
|---|---|---|---|---|
| JP2003525067A (ja) * | 1999-03-09 | 2003-08-26 | フローレンス・メディカル・リミテッド | Cfrおよび付加的な臨床的血流力学パラメータを圧力ベースで測定するための方法およびシステム |
| CN101005803B (zh) * | 2004-08-17 | 2012-01-11 | 皇家飞利浦电子股份有限公司 | 灵活融合3dra-ct的方法 |
| GB0904435D0 (en) * | 2009-03-13 | 2009-04-29 | King David H | Haemodynamic data estimation |
| US9119540B2 (en) * | 2010-09-16 | 2015-09-01 | Siemens Aktiengesellschaft | Method and system for non-invasive assessment of coronary artery disease |
| CN103300820A (zh) * | 2012-03-13 | 2013-09-18 | 西门子公司 | 用于冠状动脉狭窄的非侵入性功能评估的方法和系统 |
| AU2015242353B2 (en) * | 2014-04-04 | 2020-01-23 | St. Jude Medical Systems Ab | Intravascular pressure and flow data diagnostic systems, devices, and methods |
| WO2015164086A1 (fr) * | 2014-04-22 | 2015-10-29 | Siemens Aktiengesellschaft | Procédé et système pour calcul hémodynamique dans des artères coronaires |
| US9595089B2 (en) * | 2014-05-09 | 2017-03-14 | Siemens Healthcare Gmbh | Method and system for non-invasive computation of hemodynamic indices for coronary artery stenosis |
| CN107978371B (zh) * | 2017-11-30 | 2021-04-02 | 博动医学影像科技(上海)有限公司 | 快速计算微循环阻力的方法及系统 |
-
2018
- 2018-08-03 EP EP18290092.8A patent/EP3605554A1/fr not_active Withdrawn
-
2019
- 2019-08-02 EP EP19745626.2A patent/EP3830839A1/fr active Pending
- 2019-08-02 CN CN201980065281.XA patent/CN112805790A/zh active Pending
- 2019-08-02 WO PCT/EP2019/070854 patent/WO2020025780A1/fr unknown
- 2019-08-02 US US17/263,469 patent/US20210161495A1/en active Pending
- 2019-08-02 JP JP2021505246A patent/JP2021532878A/ja active Pending
Patent Citations (2)
| Publication number | Priority date | Publication date | Assignee | Title |
|---|---|---|---|---|
| US20130116739A1 (en) * | 2011-11-07 | 2013-05-09 | Paieon Inc. | Method and system for detecting and analyzing heart mecahnics |
| US20150327780A1 (en) * | 2014-05-16 | 2015-11-19 | Kabushiki Kaisha Toshiba | Image processing apparatus, image processing method, and storage medium |
Non-Patent Citations (1)
| Title |
|---|
| CHRISTIAN TESCHE ET AL: "Coronary CT Angiography-derived Fractional Flow Reserve", RADIOLOGY, vol. 285, no. 1, 1 October 2017 (2017-10-01), US, pages 17 - 33, XP055549698, ISSN: 0033-8419, DOI: 10.1148/radiol.2017162641 * |
Cited By (1)
| Publication number | Priority date | Publication date | Assignee | Title |
|---|---|---|---|---|
| EP4009334A1 (fr) * | 2020-12-03 | 2022-06-08 | Koninklijke Philips N.V. | Flux coronaire dérivé par l'angiographie |
Also Published As
| Publication number | Publication date |
|---|---|
| US20210161495A1 (en) | 2021-06-03 |
| JP2021532878A (ja) | 2021-12-02 |
| WO2020025780A1 (fr) | 2020-02-06 |
| CN112805790A (zh) | 2021-05-14 |
| EP3830839A1 (fr) | 2021-06-09 |
Similar Documents
| Publication | Publication Date | Title |
|---|---|---|
| KR101939778B1 (ko) | 필요 혈류량 결정 방법 및 장치, 혈류 영상 생성 방법 및 장치, 심근 관류 영상 처리 방법 및 장치 | |
| US11636635B2 (en) | Medical information processing apparatus and medical information processing method | |
| US10552958B2 (en) | Fractional flow reserve determination | |
| EP3713482B1 (fr) | Dispositif, programme informatique et support de stockage lisible par ordinateur pour évaluer un système vasculaire coronaire | |
| EP3456243A1 (fr) | Géométrie de récipients améliorée et conditions limites supplémentaires pour simulations ifr/ffr hémodynamiques d'imagerie intravasculaire | |
| EP3678546B1 (fr) | Recalage et comparaison de courbes de retrait intracoronaire mesuré et simulé | |
| US20220051401A1 (en) | Providing a scene with synthetic contrast | |
| US20210161495A1 (en) | Blood flow measurement based on vessel-map slope | |
| EP3886702B1 (fr) | Sélection d'image radiographique la plus pertinente pour une simulation hémodynamique | |
| EP4011282A1 (fr) | Appareil pour caractériser une paroi de vaisseau | |
| US11664128B2 (en) | Estimating flow to vessel bifurcations for simulated hemodynamics | |
| JPWO2020025780A5 (fr) | ||
| CN114173649A (zh) | 使用功能信息进行的血管配准 |
Legal Events
| Date | Code | Title | Description |
|---|---|---|---|
| PUAI | Public reference made under article 153(3) epc to a published international application that has entered the european phase |
Free format text: ORIGINAL CODE: 0009012 |
|
| AK | Designated contracting states |
Kind code of ref document: A1 Designated state(s): AL AT BE BG CH CY CZ DE DK EE ES FI FR GB GR HR HU IE IS IT LI LT LU LV MC MK MT NL NO PL PT RO RS SE SI SK SM TR |
|
| AX | Request for extension of the european patent |
Extension state: BA ME |
|
| RAP1 | Party data changed (applicant data changed or rights of an application transferred) |
Owner name: KONINKLIJKE PHILIPS N.V. |
|
| STAA | Information on the status of an ep patent application or granted ep patent |
Free format text: STATUS: THE APPLICATION IS DEEMED TO BE WITHDRAWN |
|
| 18D | Application deemed to be withdrawn |
Effective date: 20200806 |