EP3596232B1 - Digital molecular assays - Google Patents
Digital molecular assays Download PDFInfo
- Publication number
- EP3596232B1 EP3596232B1 EP18767684.6A EP18767684A EP3596232B1 EP 3596232 B1 EP3596232 B1 EP 3596232B1 EP 18767684 A EP18767684 A EP 18767684A EP 3596232 B1 EP3596232 B1 EP 3596232B1
- Authority
- EP
- European Patent Office
- Prior art keywords
- analyte
- reporter
- reporter molecules
- molecules
- optical reporter
- Prior art date
- Legal status (The legal status is an assumption and is not a legal conclusion. Google has not performed a legal analysis and makes no representation as to the accuracy of the status listed.)
- Active
Links
- 238000003556 assay Methods 0.000 title claims description 120
- 239000012491 analyte Substances 0.000 claims description 161
- 230000003287 optical effect Effects 0.000 claims description 148
- 238000000034 method Methods 0.000 claims description 82
- 239000002105 nanoparticle Substances 0.000 claims description 47
- 239000000427 antigen Substances 0.000 claims description 34
- 108091007433 antigens Proteins 0.000 claims description 34
- 102000036639 antigens Human genes 0.000 claims description 34
- 238000001228 spectrum Methods 0.000 claims description 30
- 230000008859 change Effects 0.000 claims description 27
- 230000003595 spectral effect Effects 0.000 claims description 18
- 239000012634 fragment Substances 0.000 claims description 11
- 108091028043 Nucleic acid sequence Proteins 0.000 claims description 9
- 239000002773 nucleotide Substances 0.000 claims description 9
- 125000003729 nucleotide group Chemical group 0.000 claims description 9
- 230000007423 decrease Effects 0.000 claims description 8
- 230000027455 binding Effects 0.000 description 71
- 239000000523 sample Substances 0.000 description 69
- 238000005259 measurement Methods 0.000 description 59
- 239000002245 particle Substances 0.000 description 35
- 238000001514 detection method Methods 0.000 description 22
- 239000000243 solution Substances 0.000 description 18
- 102000004169 proteins and genes Human genes 0.000 description 16
- 108091032973 (ribonucleotides)n+m Proteins 0.000 description 15
- 108090000623 proteins and genes Proteins 0.000 description 15
- 108020004414 DNA Proteins 0.000 description 14
- 108090000765 processed proteins & peptides Proteins 0.000 description 14
- 238000004458 analytical method Methods 0.000 description 12
- 210000004369 blood Anatomy 0.000 description 12
- 239000008280 blood Substances 0.000 description 12
- 230000003993 interaction Effects 0.000 description 12
- 238000010521 absorption reaction Methods 0.000 description 11
- 239000012895 dilution Substances 0.000 description 11
- 238000010790 dilution Methods 0.000 description 11
- 230000005284 excitation Effects 0.000 description 10
- 238000005286 illumination Methods 0.000 description 9
- 108020004707 nucleic acids Proteins 0.000 description 9
- 102000039446 nucleic acids Human genes 0.000 description 9
- 150000007523 nucleic acids Chemical class 0.000 description 9
- 102000004196 processed proteins & peptides Human genes 0.000 description 9
- 230000008878 coupling Effects 0.000 description 8
- 238000010168 coupling process Methods 0.000 description 8
- 238000005859 coupling reaction Methods 0.000 description 8
- 238000010586 diagram Methods 0.000 description 8
- 208000037265 diseases, disorders, signs and symptoms Diseases 0.000 description 8
- 230000000694 effects Effects 0.000 description 8
- 238000009396 hybridization Methods 0.000 description 8
- 238000003018 immunoassay Methods 0.000 description 8
- 238000000691 measurement method Methods 0.000 description 8
- 230000008569 process Effects 0.000 description 8
- 108091034117 Oligonucleotide Proteins 0.000 description 7
- 150000001413 amino acids Chemical class 0.000 description 7
- 230000008901 benefit Effects 0.000 description 7
- 239000012472 biological sample Substances 0.000 description 7
- 210000004027 cell Anatomy 0.000 description 7
- 238000013461 design Methods 0.000 description 7
- 201000010099 disease Diseases 0.000 description 7
- 238000012545 processing Methods 0.000 description 7
- 230000002776 aggregation Effects 0.000 description 6
- 238000004220 aggregation Methods 0.000 description 6
- 230000006399 behavior Effects 0.000 description 6
- 238000002474 experimental method Methods 0.000 description 6
- PCHJSUWPFVWCPO-UHFFFAOYSA-N gold Chemical compound [Au] PCHJSUWPFVWCPO-UHFFFAOYSA-N 0.000 description 6
- 229910052737 gold Inorganic materials 0.000 description 6
- 239000010931 gold Substances 0.000 description 6
- 239000002096 quantum dot Substances 0.000 description 6
- 108020003175 receptors Proteins 0.000 description 6
- 102000005962 receptors Human genes 0.000 description 6
- 238000004088 simulation Methods 0.000 description 6
- 239000007787 solid Substances 0.000 description 6
- 238000010256 biochemical assay Methods 0.000 description 5
- 230000015572 biosynthetic process Effects 0.000 description 5
- 238000004891 communication Methods 0.000 description 5
- 230000000295 complement effect Effects 0.000 description 5
- 239000002299 complementary DNA Substances 0.000 description 5
- 238000005755 formation reaction Methods 0.000 description 5
- 239000011521 glass Substances 0.000 description 5
- 239000000203 mixture Substances 0.000 description 5
- 210000002381 plasma Anatomy 0.000 description 5
- 229920001184 polypeptide Polymers 0.000 description 5
- 239000000047 product Substances 0.000 description 5
- 230000035945 sensitivity Effects 0.000 description 5
- 239000000758 substrate Substances 0.000 description 5
- 238000012360 testing method Methods 0.000 description 5
- 108020004635 Complementary DNA Proteins 0.000 description 4
- 238000013459 approach Methods 0.000 description 4
- -1 aqueous Substances 0.000 description 4
- 239000000090 biomarker Substances 0.000 description 4
- 230000001413 cellular effect Effects 0.000 description 4
- 238000005119 centrifugation Methods 0.000 description 4
- 238000001446 dark-field microscopy Methods 0.000 description 4
- 230000006866 deterioration Effects 0.000 description 4
- 238000002405 diagnostic procedure Methods 0.000 description 4
- 238000003384 imaging method Methods 0.000 description 4
- 239000000543 intermediate Substances 0.000 description 4
- 150000002632 lipids Chemical class 0.000 description 4
- 230000004048 modification Effects 0.000 description 4
- 238000012986 modification Methods 0.000 description 4
- 229920000642 polymer Polymers 0.000 description 4
- 238000006862 quantum yield reaction Methods 0.000 description 4
- 210000002966 serum Anatomy 0.000 description 4
- 239000000126 substance Substances 0.000 description 4
- 230000009897 systematic effect Effects 0.000 description 4
- 238000012546 transfer Methods 0.000 description 4
- 108700028369 Alleles Proteins 0.000 description 3
- 238000002965 ELISA Methods 0.000 description 3
- 238000002820 assay format Methods 0.000 description 3
- 230000009286 beneficial effect Effects 0.000 description 3
- 230000008033 biological extinction Effects 0.000 description 3
- 238000010804 cDNA synthesis Methods 0.000 description 3
- 238000004132 cross linking Methods 0.000 description 3
- 230000002950 deficient Effects 0.000 description 3
- 230000005670 electromagnetic radiation Effects 0.000 description 3
- 230000007613 environmental effect Effects 0.000 description 3
- 239000012530 fluid Substances 0.000 description 3
- 238000000198 fluorescence anisotropy Methods 0.000 description 3
- 230000006870 function Effects 0.000 description 3
- 230000007614 genetic variation Effects 0.000 description 3
- 230000036541 health Effects 0.000 description 3
- 238000010191 image analysis Methods 0.000 description 3
- 239000002082 metal nanoparticle Substances 0.000 description 3
- 210000000056 organ Anatomy 0.000 description 3
- 244000052769 pathogen Species 0.000 description 3
- 230000037361 pathway Effects 0.000 description 3
- 238000004451 qualitative analysis Methods 0.000 description 3
- 230000004044 response Effects 0.000 description 3
- 239000012898 sample dilution Substances 0.000 description 3
- 229920006395 saturated elastomer Polymers 0.000 description 3
- 238000000926 separation method Methods 0.000 description 3
- 239000002356 single layer Substances 0.000 description 3
- 238000004416 surface enhanced Raman spectroscopy Methods 0.000 description 3
- 210000001519 tissue Anatomy 0.000 description 3
- 230000003612 virological effect Effects 0.000 description 3
- XLYOFNOQVPJJNP-UHFFFAOYSA-N water Substances O XLYOFNOQVPJJNP-UHFFFAOYSA-N 0.000 description 3
- 238000012935 Averaging Methods 0.000 description 2
- 108090000790 Enzymes Proteins 0.000 description 2
- 102000004190 Enzymes Human genes 0.000 description 2
- 241001465754 Metazoa Species 0.000 description 2
- 206010028980 Neoplasm Diseases 0.000 description 2
- 238000001069 Raman spectroscopy Methods 0.000 description 2
- 241000607479 Yersinia pestis Species 0.000 description 2
- 210000001124 body fluid Anatomy 0.000 description 2
- 201000011510 cancer Diseases 0.000 description 2
- 239000000356 contaminant Substances 0.000 description 2
- 238000011109 contamination Methods 0.000 description 2
- 238000007796 conventional method Methods 0.000 description 2
- 230000006378 damage Effects 0.000 description 2
- 230000003247 decreasing effect Effects 0.000 description 2
- 230000009977 dual effect Effects 0.000 description 2
- 238000005516 engineering process Methods 0.000 description 2
- 239000000284 extract Substances 0.000 description 2
- 238000007306 functionalization reaction Methods 0.000 description 2
- 230000013595 glycosylation Effects 0.000 description 2
- 238000006206 glycosylation reaction Methods 0.000 description 2
- 239000002440 industrial waste Substances 0.000 description 2
- 238000003780 insertion Methods 0.000 description 2
- 230000037431 insertion Effects 0.000 description 2
- 238000011898 label-free detection Methods 0.000 description 2
- 239000010410 layer Substances 0.000 description 2
- 238000004519 manufacturing process Methods 0.000 description 2
- 239000000463 material Substances 0.000 description 2
- 230000007246 mechanism Effects 0.000 description 2
- 229910052751 metal Inorganic materials 0.000 description 2
- 239000002184 metal Substances 0.000 description 2
- 229910044991 metal oxide Inorganic materials 0.000 description 2
- 150000004706 metal oxides Chemical class 0.000 description 2
- 239000004038 photonic crystal Substances 0.000 description 2
- 108091033319 polynucleotide Proteins 0.000 description 2
- 102000040430 polynucleotide Human genes 0.000 description 2
- 239000002157 polynucleotide Substances 0.000 description 2
- 238000011002 quantification Methods 0.000 description 2
- 238000004064 recycling Methods 0.000 description 2
- 238000012216 screening Methods 0.000 description 2
- 239000004065 semiconductor Substances 0.000 description 2
- 238000001179 sorption measurement Methods 0.000 description 2
- 238000002198 surface plasmon resonance spectroscopy Methods 0.000 description 2
- 210000002700 urine Anatomy 0.000 description 2
- 230000000007 visual effect Effects 0.000 description 2
- ODHCTXKNWHHXJC-VKHMYHEASA-N 5-oxo-L-proline Chemical compound OC(=O)[C@@H]1CCC(=O)N1 ODHCTXKNWHHXJC-VKHMYHEASA-N 0.000 description 1
- 230000005730 ADP ribosylation Effects 0.000 description 1
- 101710095342 Apolipoprotein B Proteins 0.000 description 1
- 102100040202 Apolipoprotein B-100 Human genes 0.000 description 1
- 108091023037 Aptamer Proteins 0.000 description 1
- 208000023275 Autoimmune disease Diseases 0.000 description 1
- 241000894006 Bacteria Species 0.000 description 1
- 206010006187 Breast cancer Diseases 0.000 description 1
- 208000026310 Breast neoplasm Diseases 0.000 description 1
- 208000024172 Cardiovascular disease Diseases 0.000 description 1
- VYZAMTAEIAYCRO-UHFFFAOYSA-N Chromium Chemical compound [Cr] VYZAMTAEIAYCRO-UHFFFAOYSA-N 0.000 description 1
- 208000035473 Communicable disease Diseases 0.000 description 1
- 108020004394 Complementary RNA Proteins 0.000 description 1
- RYGMFSIKBFXOCR-UHFFFAOYSA-N Copper Chemical compound [Cu] RYGMFSIKBFXOCR-UHFFFAOYSA-N 0.000 description 1
- 241000195493 Cryptophyta Species 0.000 description 1
- 102000004127 Cytokines Human genes 0.000 description 1
- 108090000695 Cytokines Proteins 0.000 description 1
- LEVWYRKDKASIDU-QWWZWVQMSA-N D-cystine Chemical compound OC(=O)[C@H](N)CSSC[C@@H](N)C(O)=O LEVWYRKDKASIDU-QWWZWVQMSA-N 0.000 description 1
- 201000010374 Down Syndrome Diseases 0.000 description 1
- 208000030453 Drug-Related Side Effects and Adverse reaction Diseases 0.000 description 1
- 241000233866 Fungi Species 0.000 description 1
- 206010071602 Genetic polymorphism Diseases 0.000 description 1
- 101150054472 HER2 gene Proteins 0.000 description 1
- 102000006947 Histones Human genes 0.000 description 1
- 108010033040 Histones Proteins 0.000 description 1
- 108090001030 Lipoproteins Proteins 0.000 description 1
- 102000004895 Lipoproteins Human genes 0.000 description 1
- 206010027476 Metastases Diseases 0.000 description 1
- 208000012902 Nervous system disease Diseases 0.000 description 1
- 208000025966 Neurological disease Diseases 0.000 description 1
- 108020004711 Nucleic Acid Probes Proteins 0.000 description 1
- 108091005461 Nucleic proteins Proteins 0.000 description 1
- 102000015636 Oligopeptides Human genes 0.000 description 1
- 108010038807 Oligopeptides Proteins 0.000 description 1
- 229910019142 PO4 Inorganic materials 0.000 description 1
- 206010035148 Plague Diseases 0.000 description 1
- 102000029797 Prion Human genes 0.000 description 1
- 108091000054 Prion Proteins 0.000 description 1
- 206010036790 Productive cough Diseases 0.000 description 1
- AUNGANRZJHBGPY-SCRDCRAPSA-N Riboflavin Chemical compound OC[C@@H](O)[C@@H](O)[C@@H](O)CN1C=2C=C(C)C(C)=CC=2N=C2C1=NC(=O)NC2=O AUNGANRZJHBGPY-SCRDCRAPSA-N 0.000 description 1
- RTAQQCXQSZGOHL-UHFFFAOYSA-N Titanium Chemical compound [Ti] RTAQQCXQSZGOHL-UHFFFAOYSA-N 0.000 description 1
- 206010070863 Toxicity to various agents Diseases 0.000 description 1
- 108020004566 Transfer RNA Proteins 0.000 description 1
- 206010052779 Transplant rejections Diseases 0.000 description 1
- 239000007983 Tris buffer Substances 0.000 description 1
- 208000037280 Trisomy Diseases 0.000 description 1
- 206010044686 Trisomy 13 Diseases 0.000 description 1
- 208000006284 Trisomy 13 Syndrome Diseases 0.000 description 1
- 206010044688 Trisomy 21 Diseases 0.000 description 1
- 241000700605 Viruses Species 0.000 description 1
- 208000027418 Wounds and injury Diseases 0.000 description 1
- 230000002159 abnormal effect Effects 0.000 description 1
- 230000021736 acetylation Effects 0.000 description 1
- 238000006640 acetylation reaction Methods 0.000 description 1
- 230000010933 acylation Effects 0.000 description 1
- 238000005917 acylation reaction Methods 0.000 description 1
- 230000002411 adverse Effects 0.000 description 1
- 230000004075 alteration Effects 0.000 description 1
- 230000009435 amidation Effects 0.000 description 1
- 238000007112 amidation reaction Methods 0.000 description 1
- 239000003146 anticoagulant agent Substances 0.000 description 1
- 229940127219 anticoagulant drug Drugs 0.000 description 1
- 239000012062 aqueous buffer Substances 0.000 description 1
- 230000010516 arginylation Effects 0.000 description 1
- 239000012911 assay medium Substances 0.000 description 1
- 229920001222 biopolymer Polymers 0.000 description 1
- 230000004397 blinking Effects 0.000 description 1
- 238000009534 blood test Methods 0.000 description 1
- 238000006664 bond formation reaction Methods 0.000 description 1
- 239000007853 buffer solution Substances 0.000 description 1
- 239000006227 byproduct Substances 0.000 description 1
- 238000011088 calibration curve Methods 0.000 description 1
- 150000001720 carbohydrates Chemical class 0.000 description 1
- 235000014633 carbohydrates Nutrition 0.000 description 1
- 230000015556 catabolic process Effects 0.000 description 1
- 210000003850 cellular structure Anatomy 0.000 description 1
- 239000003795 chemical substances by application Substances 0.000 description 1
- 229910052804 chromium Inorganic materials 0.000 description 1
- 239000011651 chromium Substances 0.000 description 1
- 210000000349 chromosome Anatomy 0.000 description 1
- 239000003184 complementary RNA Substances 0.000 description 1
- 239000002131 composite material Substances 0.000 description 1
- 150000001875 compounds Chemical class 0.000 description 1
- 239000000470 constituent Substances 0.000 description 1
- 238000010276 construction Methods 0.000 description 1
- 229910052802 copper Inorganic materials 0.000 description 1
- 239000010949 copper Substances 0.000 description 1
- 238000012937 correction Methods 0.000 description 1
- 229960003067 cystine Drugs 0.000 description 1
- 238000007405 data analysis Methods 0.000 description 1
- 230000007547 defect Effects 0.000 description 1
- 238000006731 degradation reaction Methods 0.000 description 1
- 238000012217 deletion Methods 0.000 description 1
- 230000037430 deletion Effects 0.000 description 1
- 230000017858 demethylation Effects 0.000 description 1
- 238000010520 demethylation reaction Methods 0.000 description 1
- 230000036425 denaturation Effects 0.000 description 1
- 238000004925 denaturation Methods 0.000 description 1
- 230000001419 dependent effect Effects 0.000 description 1
- 230000008021 deposition Effects 0.000 description 1
- 229960000633 dextran sulfate Drugs 0.000 description 1
- 238000009792 diffusion process Methods 0.000 description 1
- 239000012470 diluted sample Substances 0.000 description 1
- 238000003113 dilution method Methods 0.000 description 1
- 208000035475 disorder Diseases 0.000 description 1
- 239000006185 dispersion Substances 0.000 description 1
- 238000009826 distribution Methods 0.000 description 1
- 230000008030 elimination Effects 0.000 description 1
- 238000003379 elimination reaction Methods 0.000 description 1
- 239000003623 enhancer Substances 0.000 description 1
- 108700020302 erbB-2 Genes Proteins 0.000 description 1
- 238000011156 evaluation Methods 0.000 description 1
- 230000007717 exclusion Effects 0.000 description 1
- 238000000799 fluorescence microscopy Methods 0.000 description 1
- 235000013305 food Nutrition 0.000 description 1
- 230000022244 formylation Effects 0.000 description 1
- 238000006170 formylation reaction Methods 0.000 description 1
- 238000005194 fractionation Methods 0.000 description 1
- 230000006251 gamma-carboxylation Effects 0.000 description 1
- 239000000499 gel Substances 0.000 description 1
- 230000005182 global health Effects 0.000 description 1
- 150000004676 glycans Chemical class 0.000 description 1
- 230000036252 glycation Effects 0.000 description 1
- 150000003278 haem Chemical group 0.000 description 1
- 229940022353 herceptin Drugs 0.000 description 1
- 239000005556 hormone Substances 0.000 description 1
- 229940088597 hormone Drugs 0.000 description 1
- 239000000017 hydrogel Substances 0.000 description 1
- 230000033444 hydroxylation Effects 0.000 description 1
- 238000005805 hydroxylation reaction Methods 0.000 description 1
- 230000003116 impacting effect Effects 0.000 description 1
- 230000002779 inactivation Effects 0.000 description 1
- 208000015181 infectious disease Diseases 0.000 description 1
- 230000008595 infiltration Effects 0.000 description 1
- 238000001764 infiltration Methods 0.000 description 1
- 208000027866 inflammatory disease Diseases 0.000 description 1
- 208000014674 injury Diseases 0.000 description 1
- 238000007689 inspection Methods 0.000 description 1
- 238000009434 installation Methods 0.000 description 1
- 230000026045 iodination Effects 0.000 description 1
- 238000006192 iodination reaction Methods 0.000 description 1
- 230000001788 irregular Effects 0.000 description 1
- 238000000670 ligand binding assay Methods 0.000 description 1
- 238000004811 liquid chromatography Methods 0.000 description 1
- 150000002678 macrocyclic compounds Chemical class 0.000 description 1
- 229920002521 macromolecule Polymers 0.000 description 1
- 238000012423 maintenance Methods 0.000 description 1
- 238000013507 mapping Methods 0.000 description 1
- 239000011159 matrix material Substances 0.000 description 1
- 230000001404 mediated effect Effects 0.000 description 1
- 230000004060 metabolic process Effects 0.000 description 1
- 150000002739 metals Chemical class 0.000 description 1
- 230000009401 metastasis Effects 0.000 description 1
- 230000011987 methylation Effects 0.000 description 1
- 238000007069 methylation reaction Methods 0.000 description 1
- 238000002493 microarray Methods 0.000 description 1
- 244000005700 microbiome Species 0.000 description 1
- 239000011859 microparticle Substances 0.000 description 1
- 239000004005 microsphere Substances 0.000 description 1
- 230000009149 molecular binding Effects 0.000 description 1
- 238000012544 monitoring process Methods 0.000 description 1
- 150000002772 monosaccharides Chemical class 0.000 description 1
- 208000030454 monosomy Diseases 0.000 description 1
- 210000003097 mucus Anatomy 0.000 description 1
- 230000035772 mutation Effects 0.000 description 1
- 230000007498 myristoylation Effects 0.000 description 1
- 239000002853 nucleic acid probe Substances 0.000 description 1
- 235000003715 nutritional status Nutrition 0.000 description 1
- 229920001542 oligosaccharide Polymers 0.000 description 1
- 150000002482 oligosaccharides Chemical class 0.000 description 1
- 230000003647 oxidation Effects 0.000 description 1
- 238000007254 oxidation reaction Methods 0.000 description 1
- 239000003208 petroleum Substances 0.000 description 1
- NBIIXXVUZAFLBC-UHFFFAOYSA-K phosphate Chemical compound [O-]P([O-])([O-])=O NBIIXXVUZAFLBC-UHFFFAOYSA-K 0.000 description 1
- 239000010452 phosphate Substances 0.000 description 1
- 150000003905 phosphatidylinositols Chemical class 0.000 description 1
- 230000026731 phosphorylation Effects 0.000 description 1
- 238000006366 phosphorylation reaction Methods 0.000 description 1
- 229920003023 plastic Polymers 0.000 description 1
- 239000004033 plastic Substances 0.000 description 1
- 150000008442 polyphenolic compounds Chemical class 0.000 description 1
- 235000013824 polyphenols Nutrition 0.000 description 1
- 229920001282 polysaccharide Polymers 0.000 description 1
- 239000005017 polysaccharide Substances 0.000 description 1
- 230000004481 post-translational protein modification Effects 0.000 description 1
- 238000001556 precipitation Methods 0.000 description 1
- 230000035935 pregnancy Effects 0.000 description 1
- 230000013823 prenylation Effects 0.000 description 1
- 238000002360 preparation method Methods 0.000 description 1
- 238000003825 pressing Methods 0.000 description 1
- 230000002797 proteolythic effect Effects 0.000 description 1
- 229940043131 pyroglutamate Drugs 0.000 description 1
- 238000003908 quality control method Methods 0.000 description 1
- 238000004445 quantitative analysis Methods 0.000 description 1
- 238000010791 quenching Methods 0.000 description 1
- 230000000171 quenching effect Effects 0.000 description 1
- 230000006340 racemization Effects 0.000 description 1
- 230000008707 rearrangement Effects 0.000 description 1
- 230000001105 regulatory effect Effects 0.000 description 1
- 238000009877 rendering Methods 0.000 description 1
- 238000002165 resonance energy transfer Methods 0.000 description 1
- 230000027756 respiratory electron transport chain Effects 0.000 description 1
- 230000002441 reversible effect Effects 0.000 description 1
- 238000007363 ring formation reaction Methods 0.000 description 1
- 238000009781 safety test method Methods 0.000 description 1
- 210000003296 saliva Anatomy 0.000 description 1
- 238000005070 sampling Methods 0.000 description 1
- 230000028327 secretion Effects 0.000 description 1
- 210000003765 sex chromosome Anatomy 0.000 description 1
- 229910052709 silver Inorganic materials 0.000 description 1
- 239000004332 silver Substances 0.000 description 1
- 238000004557 single molecule detection Methods 0.000 description 1
- 239000002689 soil Substances 0.000 description 1
- 239000002904 solvent Substances 0.000 description 1
- 210000003802 sputum Anatomy 0.000 description 1
- 208000024794 sputum Diseases 0.000 description 1
- 230000003068 static effect Effects 0.000 description 1
- 238000003860 storage Methods 0.000 description 1
- 238000006467 substitution reaction Methods 0.000 description 1
- 235000000346 sugar Nutrition 0.000 description 1
- 150000008163 sugars Chemical class 0.000 description 1
- 230000019635 sulfation Effects 0.000 description 1
- 238000005670 sulfation reaction Methods 0.000 description 1
- 239000006228 supernatant Substances 0.000 description 1
- 239000010409 thin film Substances 0.000 description 1
- 229910052719 titanium Inorganic materials 0.000 description 1
- 239000010936 titanium Substances 0.000 description 1
- 231100000331 toxic Toxicity 0.000 description 1
- 230000002588 toxic effect Effects 0.000 description 1
- 231100000041 toxicology testing Toxicity 0.000 description 1
- 239000003053 toxin Substances 0.000 description 1
- 231100000765 toxin Toxicity 0.000 description 1
- 108700012359 toxins Proteins 0.000 description 1
- 230000005945 translocation Effects 0.000 description 1
- 230000032258 transport Effects 0.000 description 1
- 238000012384 transportation and delivery Methods 0.000 description 1
- LENZDBCJOHFCAS-UHFFFAOYSA-N tris Chemical compound OCC(N)(CO)CO LENZDBCJOHFCAS-UHFFFAOYSA-N 0.000 description 1
- 206010053884 trisomy 18 Diseases 0.000 description 1
- 238000010798 ubiquitination Methods 0.000 description 1
- 230000034512 ubiquitination Effects 0.000 description 1
- 238000005199 ultracentrifugation Methods 0.000 description 1
- 238000011179 visual inspection Methods 0.000 description 1
- 238000012800 visualization Methods 0.000 description 1
- 230000003313 weakening effect Effects 0.000 description 1
Images


Classifications
-
- G—PHYSICS
- G01—MEASURING; TESTING
- G01N—INVESTIGATING OR ANALYSING MATERIALS BY DETERMINING THEIR CHEMICAL OR PHYSICAL PROPERTIES
- G01N21/00—Investigating or analysing materials by the use of optical means, i.e. using sub-millimetre waves, infrared, visible or ultraviolet light
- G01N21/17—Systems in which incident light is modified in accordance with the properties of the material investigated
- G01N21/47—Scattering, i.e. diffuse reflection
- G01N21/49—Scattering, i.e. diffuse reflection within a body or fluid
- G01N21/51—Scattering, i.e. diffuse reflection within a body or fluid inside a container, e.g. in an ampoule
-
- C—CHEMISTRY; METALLURGY
- C12—BIOCHEMISTRY; BEER; SPIRITS; WINE; VINEGAR; MICROBIOLOGY; ENZYMOLOGY; MUTATION OR GENETIC ENGINEERING
- C12Q—MEASURING OR TESTING PROCESSES INVOLVING ENZYMES, NUCLEIC ACIDS OR MICROORGANISMS; COMPOSITIONS OR TEST PAPERS THEREFOR; PROCESSES OF PREPARING SUCH COMPOSITIONS; CONDITION-RESPONSIVE CONTROL IN MICROBIOLOGICAL OR ENZYMOLOGICAL PROCESSES
- C12Q1/00—Measuring or testing processes involving enzymes, nucleic acids or microorganisms; Compositions therefor; Processes of preparing such compositions
- C12Q1/68—Measuring or testing processes involving enzymes, nucleic acids or microorganisms; Compositions therefor; Processes of preparing such compositions involving nucleic acids
- C12Q1/6813—Hybridisation assays
- C12Q1/6816—Hybridisation assays characterised by the detection means
- C12Q1/6823—Release of bound markers
-
- C—CHEMISTRY; METALLURGY
- C12—BIOCHEMISTRY; BEER; SPIRITS; WINE; VINEGAR; MICROBIOLOGY; ENZYMOLOGY; MUTATION OR GENETIC ENGINEERING
- C12Q—MEASURING OR TESTING PROCESSES INVOLVING ENZYMES, NUCLEIC ACIDS OR MICROORGANISMS; COMPOSITIONS OR TEST PAPERS THEREFOR; PROCESSES OF PREPARING SUCH COMPOSITIONS; CONDITION-RESPONSIVE CONTROL IN MICROBIOLOGICAL OR ENZYMOLOGICAL PROCESSES
- C12Q1/00—Measuring or testing processes involving enzymes, nucleic acids or microorganisms; Compositions therefor; Processes of preparing such compositions
- C12Q1/68—Measuring or testing processes involving enzymes, nucleic acids or microorganisms; Compositions therefor; Processes of preparing such compositions involving nucleic acids
- C12Q1/6813—Hybridisation assays
- C12Q1/6816—Hybridisation assays characterised by the detection means
- C12Q1/6825—Nucleic acid detection involving sensors
-
- G—PHYSICS
- G01—MEASURING; TESTING
- G01N—INVESTIGATING OR ANALYSING MATERIALS BY DETERMINING THEIR CHEMICAL OR PHYSICAL PROPERTIES
- G01N15/00—Investigating characteristics of particles; Investigating permeability, pore-volume, or surface-area of porous materials
- G01N15/06—Investigating concentration of particle suspensions
- G01N15/0606—Investigating concentration of particle suspensions by collecting particles on a support
- G01N15/0612—Optical scan of the deposits
-
- G—PHYSICS
- G01—MEASURING; TESTING
- G01N—INVESTIGATING OR ANALYSING MATERIALS BY DETERMINING THEIR CHEMICAL OR PHYSICAL PROPERTIES
- G01N33/00—Investigating or analysing materials by specific methods not covered by groups G01N1/00 - G01N31/00
- G01N33/48—Biological material, e.g. blood, urine; Haemocytometers
- G01N33/483—Physical analysis of biological material
- G01N33/487—Physical analysis of biological material of liquid biological material
- G01N33/49—Blood
-
- G—PHYSICS
- G01—MEASURING; TESTING
- G01N—INVESTIGATING OR ANALYSING MATERIALS BY DETERMINING THEIR CHEMICAL OR PHYSICAL PROPERTIES
- G01N33/00—Investigating or analysing materials by specific methods not covered by groups G01N1/00 - G01N31/00
- G01N33/48—Biological material, e.g. blood, urine; Haemocytometers
- G01N33/50—Chemical analysis of biological material, e.g. blood, urine; Testing involving biospecific ligand binding methods; Immunological testing
- G01N33/53—Immunoassay; Biospecific binding assay; Materials therefor
- G01N33/543—Immunoassay; Biospecific binding assay; Materials therefor with an insoluble carrier for immobilising immunochemicals
- G01N33/54306—Solid-phase reaction mechanisms
-
- G—PHYSICS
- G01—MEASURING; TESTING
- G01N—INVESTIGATING OR ANALYSING MATERIALS BY DETERMINING THEIR CHEMICAL OR PHYSICAL PROPERTIES
- G01N33/00—Investigating or analysing materials by specific methods not covered by groups G01N1/00 - G01N31/00
- G01N33/48—Biological material, e.g. blood, urine; Haemocytometers
- G01N33/50—Chemical analysis of biological material, e.g. blood, urine; Testing involving biospecific ligand binding methods; Immunological testing
- G01N33/53—Immunoassay; Biospecific binding assay; Materials therefor
- G01N33/543—Immunoassay; Biospecific binding assay; Materials therefor with an insoluble carrier for immobilising immunochemicals
- G01N33/54313—Immunoassay; Biospecific binding assay; Materials therefor with an insoluble carrier for immobilising immunochemicals the carrier being characterised by its particulate form
- G01N33/54346—Nanoparticles
-
- G—PHYSICS
- G16—INFORMATION AND COMMUNICATION TECHNOLOGY [ICT] SPECIALLY ADAPTED FOR SPECIFIC APPLICATION FIELDS
- G16B—BIOINFORMATICS, i.e. INFORMATION AND COMMUNICATION TECHNOLOGY [ICT] SPECIALLY ADAPTED FOR GENETIC OR PROTEIN-RELATED DATA PROCESSING IN COMPUTATIONAL MOLECULAR BIOLOGY
- G16B30/00—ICT specially adapted for sequence analysis involving nucleotides or amino acids
-
- C—CHEMISTRY; METALLURGY
- C12—BIOCHEMISTRY; BEER; SPIRITS; WINE; VINEGAR; MICROBIOLOGY; ENZYMOLOGY; MUTATION OR GENETIC ENGINEERING
- C12Q—MEASURING OR TESTING PROCESSES INVOLVING ENZYMES, NUCLEIC ACIDS OR MICROORGANISMS; COMPOSITIONS OR TEST PAPERS THEREFOR; PROCESSES OF PREPARING SUCH COMPOSITIONS; CONDITION-RESPONSIVE CONTROL IN MICROBIOLOGICAL OR ENZYMOLOGICAL PROCESSES
- C12Q2563/00—Nucleic acid detection characterized by the use of physical, structural and functional properties
- C12Q2563/107—Nucleic acid detection characterized by the use of physical, structural and functional properties fluorescence
-
- C—CHEMISTRY; METALLURGY
- C12—BIOCHEMISTRY; BEER; SPIRITS; WINE; VINEGAR; MICROBIOLOGY; ENZYMOLOGY; MUTATION OR GENETIC ENGINEERING
- C12Q—MEASURING OR TESTING PROCESSES INVOLVING ENZYMES, NUCLEIC ACIDS OR MICROORGANISMS; COMPOSITIONS OR TEST PAPERS THEREFOR; PROCESSES OF PREPARING SUCH COMPOSITIONS; CONDITION-RESPONSIVE CONTROL IN MICROBIOLOGICAL OR ENZYMOLOGICAL PROCESSES
- C12Q2563/00—Nucleic acid detection characterized by the use of physical, structural and functional properties
- C12Q2563/155—Particles of a defined size, e.g. nanoparticles
-
- C—CHEMISTRY; METALLURGY
- C12—BIOCHEMISTRY; BEER; SPIRITS; WINE; VINEGAR; MICROBIOLOGY; ENZYMOLOGY; MUTATION OR GENETIC ENGINEERING
- C12Q—MEASURING OR TESTING PROCESSES INVOLVING ENZYMES, NUCLEIC ACIDS OR MICROORGANISMS; COMPOSITIONS OR TEST PAPERS THEREFOR; PROCESSES OF PREPARING SUCH COMPOSITIONS; CONDITION-RESPONSIVE CONTROL IN MICROBIOLOGICAL OR ENZYMOLOGICAL PROCESSES
- C12Q2565/00—Nucleic acid analysis characterised by mode or means of detection
- C12Q2565/60—Detection means characterised by use of a special device
- C12Q2565/601—Detection means characterised by use of a special device being a microscope, e.g. atomic force microscopy [AFM]
-
- G—PHYSICS
- G01—MEASURING; TESTING
- G01N—INVESTIGATING OR ANALYSING MATERIALS BY DETERMINING THEIR CHEMICAL OR PHYSICAL PROPERTIES
- G01N15/00—Investigating characteristics of particles; Investigating permeability, pore-volume, or surface-area of porous materials
- G01N2015/0038—Investigating nanoparticles
-
- G—PHYSICS
- G01—MEASURING; TESTING
- G01N—INVESTIGATING OR ANALYSING MATERIALS BY DETERMINING THEIR CHEMICAL OR PHYSICAL PROPERTIES
- G01N21/00—Investigating or analysing materials by the use of optical means, i.e. using sub-millimetre waves, infrared, visible or ultraviolet light
- G01N21/17—Systems in which incident light is modified in accordance with the properties of the material investigated
- G01N2021/1765—Method using an image detector and processing of image signal
- G01N2021/177—Detector of the video camera type
-
- G—PHYSICS
- G01—MEASURING; TESTING
- G01N—INVESTIGATING OR ANALYSING MATERIALS BY DETERMINING THEIR CHEMICAL OR PHYSICAL PROPERTIES
- G01N21/00—Investigating or analysing materials by the use of optical means, i.e. using sub-millimetre waves, infrared, visible or ultraviolet light
- G01N21/62—Systems in which the material investigated is excited whereby it emits light or causes a change in wavelength of the incident light
- G01N21/63—Systems in which the material investigated is excited whereby it emits light or causes a change in wavelength of the incident light optically excited
- G01N21/64—Fluorescence; Phosphorescence
- G01N21/6428—Measuring fluorescence of fluorescent products of reactions or of fluorochrome labelled reactive substances, e.g. measuring quenching effects, using measuring "optrodes"
- G01N2021/6432—Quenching
-
- G—PHYSICS
- G01—MEASURING; TESTING
- G01N—INVESTIGATING OR ANALYSING MATERIALS BY DETERMINING THEIR CHEMICAL OR PHYSICAL PROPERTIES
- G01N21/00—Investigating or analysing materials by the use of optical means, i.e. using sub-millimetre waves, infrared, visible or ultraviolet light
- G01N21/17—Systems in which incident light is modified in accordance with the properties of the material investigated
- G01N21/55—Specular reflectivity
- G01N21/552—Attenuated total reflection
- G01N21/553—Attenuated total reflection and using surface plasmons
- G01N21/554—Attenuated total reflection and using surface plasmons detecting the surface plasmon resonance of nanostructured metals, e.g. localised surface plasmon resonance
-
- G—PHYSICS
- G01—MEASURING; TESTING
- G01N—INVESTIGATING OR ANALYSING MATERIALS BY DETERMINING THEIR CHEMICAL OR PHYSICAL PROPERTIES
- G01N21/00—Investigating or analysing materials by the use of optical means, i.e. using sub-millimetre waves, infrared, visible or ultraviolet light
- G01N21/62—Systems in which the material investigated is excited whereby it emits light or causes a change in wavelength of the incident light
- G01N21/63—Systems in which the material investigated is excited whereby it emits light or causes a change in wavelength of the incident light optically excited
- G01N21/64—Fluorescence; Phosphorescence
- G01N21/645—Specially adapted constructive features of fluorimeters
- G01N21/6456—Spatial resolved fluorescence measurements; Imaging
- G01N21/6458—Fluorescence microscopy
-
- G—PHYSICS
- G01—MEASURING; TESTING
- G01N—INVESTIGATING OR ANALYSING MATERIALS BY DETERMINING THEIR CHEMICAL OR PHYSICAL PROPERTIES
- G01N21/00—Investigating or analysing materials by the use of optical means, i.e. using sub-millimetre waves, infrared, visible or ultraviolet light
- G01N21/62—Systems in which the material investigated is excited whereby it emits light or causes a change in wavelength of the incident light
- G01N21/63—Systems in which the material investigated is excited whereby it emits light or causes a change in wavelength of the incident light optically excited
- G01N21/64—Fluorescence; Phosphorescence
- G01N21/645—Specially adapted constructive features of fluorimeters
- G01N21/648—Specially adapted constructive features of fluorimeters using evanescent coupling or surface plasmon coupling for the excitation of fluorescence
-
- G—PHYSICS
- G01—MEASURING; TESTING
- G01N—INVESTIGATING OR ANALYSING MATERIALS BY DETERMINING THEIR CHEMICAL OR PHYSICAL PROPERTIES
- G01N2470/00—Immunochemical assays or immunoassays characterised by the reaction format or reaction type
- G01N2470/04—Sandwich assay format
Definitions
- Point-of-care diagnostics and other assays performable in the field are a pressing need. If the delay and expense associated with sending assays such as diagnostic tests, especially blood tests, to dedicated laboratories for analysis could be eliminated, responses could be made more efficiently and effectively.
- Clinical laboratories deliver diagnostic tests by performing biochemical assays on precision, benchtop instruments. Efforts to miniaturize these instruments or replicate their function on mobile electronic devices are fraught with difficulty. In many cases the results are unusable.
- US2009258371 relates to a method of detecting very low levels of analyte within a thin film fluid sample contained in a thin thickness chamber.
- the present invention is defined by the appended claims.
- Provided herein are methods for the rapid and accurate measurement of analytes by assay of binding events, by direct, digital measurement of individually resolved analyte / reporter binding events.
- the digital molecular assay methods disclosed herein are capable of particle-by-particle readout using optical reporter molecules that detect and report the binding of a single analyte molecule, and report each such binding in binary format. Such digital molecular assay methods are useful in a variety of applications, such as on mobile electronic devices for use in the field.
- Digital assays eliminate inherent uncertainties of analog assays in at least three ways: (1) digital assays are based on binary events that are highly resistant to analog noise; (2) digital assays eliminate errors originating from the unknown fraction of inactive assay molecules in an analog assay; (3) digital assays eliminate problems associated with spatial inhomogeneity such as non-uniform illumination.
- an antigen - antibody assay designed to measure the concentration of antigen in a sample that is mixed with a known concentration of antibodies.
- the assay has an optical readout in which antibodies that bind antigen emit a different optical signal than those that do not. (Unbound antibodies might emit no signal, for example.)
- a bulk optical readout signal may be used to estimate antigen concentration.
- Digital assays reduce or eliminate this problem by counting individual binding events between analyte and reporter molecule, such as antigen and antibody or complimentary nucleotide sequences, rather than averaging the results of millions of them.
- Mobile devices are well suited for digital assays because they include high quality cameras capable of sampling millions of biochemical events - as many as one per pixel or tens of millions per exposure. Mobile devices also include significant processing power for image analysis and communication capabilities for reporting results and offloading processing if necessary.
- Digital assays select features in an image and classify them as valid or null.
- Null features include anything in an image that does not meet specific criteria for position, brightness, wavelength or shape, for example.
- Inactive antibodies are a common source of null features, but irregular sample illumination, imprecise optical alignment, sample irregularities - all common problems in a mobile setting and in other scenarios with inadequate controls - also contribute.
- null features are discarded for data analysis; only valid features contribute to assay results. Valid features are counted as bound or unbound, and those are the only possibilities. Yes or no; one or zero.
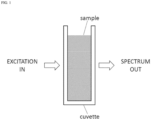
- FIG. 1 is a conceptual illustration of an analog assay.
- a cuvette contains a sample.
- the sample may be a solution containing antigen and antibodies, for example.
- the antibodies may be labeled so that, upon binding an antigen molecule, the newly formed antibody - antigen complex emits an optical signal when interrogated by an optical excitation.
- the optical signal may be a spectral measurement; i.e. light intensity versus wavelength.
- the cuvette even though it may hold a small sample volume, just a few milliliters is a common size, contains many billions of antibodies and antigen molecules.
- the observed spectrum is a composite of spectra emitted by billions of bound, labeled antibody - antigen complexes. But, an unknown fraction of the antibodies don't work; they can't bind antigen because they are jammed up in aggregates, denatured or have other problems.
- FIG. 2 is a conceptual diagram of analog assay procedures.
- the assay begins with an unknown antigen concentration mixed with an antibody concentration.
- the ratio of active antibodies (ready and able to bind antigen) to inactive antibodies (unable or unavailable to bind antigen) is not known.
- trained technicians following strict procedures in a controlled environment can keep the active-to-inactive ratio high or at least consistent.
- the ratio of active-to-inactive antibodies is much lower and, worse, totally inconsistent.
- Active antibodies bind antigen at a rate determined by: the antigen - antibody affinity, the concentration of antigen, and the unknown concentration of active antibodies.
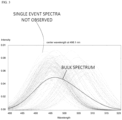
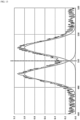
- FIG. 3 is a simulation of analog assay results.
- the bulk spectrum (heavy solid curve) represents what is observed (“SPECTRUM OUT") in an analog assay.
- the numerous, light dashed curves represent spectra from single antigen - antibody binding events. These spectra are not observable in an analog assay, however.
- unbound, active antibodies emit light around 495 nm wavelength while bound, active antibodies emit light around 505 nm wavelength.
- An unknown number of inactive antibodies do not emit light. This means that the bulk spectrum does not provide sufficient information to measure the number of bound antibodies as a fraction of all active antibodies.
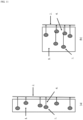
- FIG. 4 is a conceptual diagram of part of a digital molecular assay system.
- the digital molecular assay illustrated in FIG. 4 depicts an example wherein mobile dark-field microscopy performed with a smartphone camera, for example, captures an image of a plasmonic nanoparticle sandwich-type immunoassay.
- a total internal reflection (TIR) substrate is coated with plasmonic nanoparticles functionalized with capture antibodies designed to bind an antigen of interest.
- Additional plasmonic nanoparticles, functionalized with the same or different antibodies i.e., designed to bind an equivalent part of the antigen, or a different part
- Excitation light is introduced into the substrate from an edge.
- Bound antibodies emit different optical signals than unbound and inactive antibodies.
- Antibodies may be inactive due to many factors, such as degradation or, more commonly, aggregation.
- the differing signals may appear in an image as different sizes, brightness, spectra, shapes, et cetera, and be sorted as active or null considering one or more of these factors.
- FIG. 5 is also conceptual diagram of part of a digital molecular assay system; it is an alternative of the example above wherein the TIR substrate is coated with plasmonic nanoparticles functionalized with capture nucleotide sequences of DNA or RNA, complimentary to part of the analyte DNA/RNA of interest. Additional plasmonic nanoparticles, functionalized with different cDNA/cRNA (i.e., designed to bind another section of the analyte DNA/RNA) are introduced, along with the analyte DNA/RNA in a sample. Bound DNA/RNA sequences emit different optical signals than unbound and inactive antibodies
- FIG. 6 is a conceptual diagram of digital molecular assay image data; i.e. part of an image captured by a mobile device camera operating as a dark field microscope.
- the image includes spots produced by bound antigen - antibody complexes, spots from unbound antibodies, spots from inactive or null antibodies and a defect zone which may be an area of the image that is defective for any of a number of reasons. Illumination of the image may be non-uniform, even far from uniform. As long as the spatial illumination pattern is known, by recording an image at the illumination wavelength, for example, results at any point in the image may be normalized to the known illumination.
- FIG. 7 is a depiction of digital molecular assay data obtained by a mobile device camera operating as microscope.
- the figure is less impressive when shown in grayscale as it is in this disclosure compared to the original color image, so it has been manually enhanced for submission in black-and-white.
- White circles have been drawn around spots in the image that correspond to active antibodies. All other spots in the image are null or inactive antibodies. Of the active antibodies, 4 out of 11 are bound; these are depicted by way of example with a gray circle around the white one.
- the identification of active versus null, and bound versus unbound is performed by image analysis software. Image analysis may be performed on the mobile device.
- the mobile device may send the image to another processor. It may send the image to a virtual server in the computer cloud, for example.
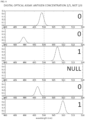
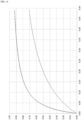
- FIG. 8 is a simulation of digital assay results.
- FIG. 8 represents spectra from six spots in an image from a digital assay.
- the criteria for bound versus unbound is whether the spectrum from a spot lies above or below 500 nm in wavelength. Spots with spectra that do not fall in the range shown in the figure are null. From top to bottom, the spectra correspond to spots from unbound, unbound, bound, inactive (null), unbound and bound antibody sites. There are two positive results, three negative and one null. Thus the fraction of bound antibodies is 2/5.
- an actual experiment is complicated by optical signals from inactive antibodies.
- the selection criteria may be more complicated than spectral center above or below a certain wavelength.
- the criteria may involve narrow spectral bands, intensity criteria, spectral shape, and spatial shape as examples.
- the selection criteria also take into account knowledge of a spatial illumination pattern. Intensity measured at an emission wavelength is normalized by illumination intensity at an excitation wavelength at the same location in an image. This eliminates problems of spatial inhomogeneity which plague analog measurements.
- the assay proceeds digitally on a particle-by-particle basis considering "EXCITATION IN” and "SPECTRUM OUT" for each particle. The result for a given particle can only be 0 or 1.
- Digital molecular assays may be performed with mobile devices as illustrated in FIG. 9 which shows a mobile electronic device with a clip-on assay chip reader.
- the assay chip reader may include optical components that adapt the mobile device camera for dark field imaging, for example.
- the assay chip is designed to receive analyte solution and may be precoated with antibodies.
- codes may be placed on an assay chip and read out from the same images used to measure binding events.
- FIG. 10 illustrates codes that may be embedded in a digital assay. Examples include bar codes, quick response (QR) codes, quantum dots that emit light at engineered wavelengths, nanoparticle reporters of temperature, humidity, light exposure, gas exposure and other environmental data. Identifying marks representing particular assay types or sample identification may also be included.
- Antigen and antibodies may be linked to optical reporter molecules for assay readout. Assays involving other cross-linking mechanisms may also be performed digitally. For example, assays based on hybridization of DNA or RNA fragments bound to optical reporter molecules may be performed as digital molecular assays where complementary DNA or RNA fragments take the place of antigen and antibody molecules. As an example, a first part of a short DNA sequence may be bound to an optical reporter and a second part of the short DNA sequence may be bound to another optical reporter. When the first and second part bind to a longer, complementary DNA sequence, the two optical reporters are brought close together and therefore emit a different optical signal compared to when they are farther apart. This kind of assay may be used to detect the complementary DNA sequence.
- analyte or “analyte molecule”, as used herein, alone or in combination, is used to describe a molecule or particle for which the presence or absence, or amount, in a sample is originally unknown, and for which knowledge of the presence or absence, or amount, contained in a sample would be useful.
- analytes include biomolecules, such as: peptides, proteins, cytokines, and prions; antibodies, and fragments thereof; nucleic acids (DNA/RNA) and particles containing them, such as histones; small organic and bioinorganic molecules, such as carbohydrates, lipids, hormones, and intermediates and products of metabolism; macromolecules, such as macrocycles, biopolymers (e.g.
- An analyte may also be categorized as a biomarker, that is, a composition and/or molecule or a complex of compositions and/or molecules that is associated with a biological state of an organism (e.g., a condition such as a disease or a non-disease state) and can report the presence of disease, injury, or cellular or organismal damage.
- a biomarker that is, a composition and/or molecule or a complex of compositions and/or molecules that is associated with a biological state of an organism (e.g., a condition such as a disease or a non-disease state) and can report the presence of disease, injury, or cellular or organismal damage.
- markers bind to an antibody or a fragment thereof, they may be referred to as antigens.
- Values for meaningful (e.g., normal and abnormal) levels of analytes detected by the digital molecular assays disclosed herein will be known to those of skill in the relevant art.
- area detector refers to a recording device that can record an image from a source, i.e., record not only the intensity of an incoming optical signal, but the origin of an optical signal.
- area detectors are television cameras, digital SLR cameras, and cellphone cameras.
- assay chip refers to a microarray of reporter molecules (e.g. optical reporter molecules) spotted or otherwise deposited onto a reporter surface, optionally enclosed within a relatively thin, flat cuvette such as a slide, which can be exposed to a sample containing analyte such that the interaction between the capture elements of the optical reporter molecules and the analyte can be observed.
- reporter molecules e.g. optical reporter molecules
- An assay chip may comprise as the optical reporter molecules plasmonic nanoparticles functionalized with antibodies, proteins, DNA, RNA, etc.
- an assay chip reader refers to a system or device for observing and recording signals from an assay chip.
- An assay chip reader may be part of a digital molecular assay system as disclosed herein, and typically comprises a chamber for receiving an assay chip, a recording device such as an image sensor (e.g., a camera), a means for transmitting the data collected from the assay to memory, and optionally, a light source such as a light-emitting diode (LED).
- the assay chip reader may contain microfluidic hardware such as pumps, channels, chambers for solutions, valves, mixers, and the like; and hardware and/or software for performing at least some analysis of the data.
- an assay chip reader may be coupled with a smartphone or other mobile device and used as part of a portable assay system; miniaturized microplate and chip readers are known in the art.
- binding isotherm refers to the degree of binding of bound reporter molecules to analyte molecules at different concentrations of analyte.
- degree of binding which can be defined as the ratio of bound reporter molecules / total reporter molecules, increases with increased analyte concentration, and eventually approaches 1, as nearly all reporter molecules are bound to analyte molecules.
- binning refers to the combination of signals from two or more pixels into one signal. Binning can be used when spatial resolution can be sacrificed in order to improve signal-to-noise.
- 2x2 binning refers to the grouping of pixels into 2x2 squares, and summing the signals from the pixels contained in each square.
- biomolecule includes any type of organic or bioinorganic molecule for which detection (either qualitative or quantitative) may be desired, including but not limited to, peptides, proteins, nucleic acids, sugars, mono- and polysaccharides, lipids, lipoproteins, whole cells, and the like.
- a “megapixel camera” is a camera that can record one million, or multiples of one million, pixels per image. Many smartphone cameras comprise ten-megapixel or more cameras.
- the term "communication interface,” as used herein, refers to a means for transferring data from a device or system as used herein to another device or system.
- wireless communications interfaces include those used in wireless devices such as mobile phones, for example cellular, wi-fi, and Bluetooth technologies.
- concentration refers to the amount of a solute in a solution per unit volume of solution. Concentration can be specified in units of molar concentration, i.e. number of moles of solute per liter of solution, or number concentration, i.e., number of molecules of solute per liter of solution. Molar concentration and number concentration can be readily interconverted. As used herein, the term “concentration” is expanded to include systems outside the traditional definition of "solution”, e.g., systems containing molecules tethered to a solid support.
- deconvolution is used to describe a method for determining, from a collective optical signal that is composed of individual optical signals from a plurality of optical reporter molecules, the individual optical signals from the individual optical reporter molecules.
- Deconvolution can use curve-fitting techniques to determine the individual spectral features from individual optical reporter molecules that partially overlap across a spectral region and that have combined to form a single collective spectrum.
- Deconvolution can use curve-fitting techniques to determine individual images from individual optical reporter molecules that partially overlap in a spatial region of a detector and that have combined to form a single collective image. It will be understood that deconvolution techniques are particularly useful for small groups of optical reporter molecules.
- detect or “detection”, as used herein, alone or in combination, is used to describe a method of determination of the existence, presence, or fact of an analyte in a sample.
- the term "divergence” indicates the deviation from perpendicularity that is accommodated by the recording device.
- An idealized area-detector type recording device will accept only light rays that are perpendicular to the plane of the detector. Actual area detectors will allow light rays that arrive at an angle from the perpendicular. Although this feature can increase signal-to-noise (since more light rays are accepted by the detector), it also decreases spatial resolution, depending on the size of the divergence angle allowed, and the size of the area detector pixel and distance between the area detector and the sample plane.
- incubate as used herein, alone or in combination, is used to describe a process of exposing reporter molecules to a sample that can potentially contain an analyte molecule.
- oblong as used herein, alone or in combination, is used to describe a volume having unequal dimensions.
- oblong volumes include prisms or cylinders for which the distance between the end faces is either significantly larger or significantly smaller than dimensions parallel to the end faces.
- a further example of an oblong volume is an ellipsoid for which one axis is either significantly larger or significantly smaller than the other axes.
- optical path is used to describe the path from reporter molecule to detector.
- optical reporter molecule or, equivalently, “optical reporter,” as used herein, alone or in combination, is used to describe a reporter molecule that is capable of reporting either the presence or absence, or the amount or concentration of, an analyte molecule, with an optical signal.
- An optical reporter molecule bound to analyte (“bound optical reporter molecule”) will emit a different signal than an optical reporter molecule not bound to analyte (“unbound optical reporter molecule”).
- optical signal as used herein, alone or in combination, is used to describe a signal that originates from an optical reporter molecule.
- the optical signal may fall in the visible range of the spectrum, or outside the visible range of the spectrum.
- the signal may be, for example:
- optical signal from an optical reporter molecule may change upon binding of an analyte molecule.
- the change in optical signal upon binding may be one of the following:
- pixel refers to an area on an area detector, for example an image sensor, whose signal can be measured independently from other pixels.
- Area detectors are commonly divided into a two-dimensional grid of pixels, with the size of each pixel, and the count of pixels in the two directions, determined by the area detector manufacturer.
- precision is used to refer to the estimate of error that is associated with a reported or estimated value.
- a low precision measurement, observation, or estimation is associated with a high degree of uncertainty about the closeness of this number to the actual value.
- a high precision measurement, observation, or estimation is associated with a low degree of uncertainty about the closeness of this number to the actual value.
- Precision can often be quantified by the use of error bars on graphs or ranges for numerical values. For example, an estimated value that is reported as 10.5 ⁇ 0.1 indicates that the true value is very likely between 10.4 and 10.6; with a small but nonzero chance that the true value is outside this range.
- polypeptide proteins
- polypeptide polypeptide
- peptide oligopeptide
- polypeptides can contain amino acids other than the 20 amino acids commonly referred to as the 20 naturally occurring amino acids.
- polypeptides can include one or more amino acids, including the terminal amino acids, which are modified by any means known in the art (whether naturally or non- naturally). Examples of polypeptide modifications include e.g., by glycosylation, or other- post-translational modification.
- Modifications which can be present in polypeptides of the present disclosure include, but are not limited to: acetylation, acylation, ADP-ribosylation, amidation, covalent attachment of flavin, covalent attachment of a heme moiety, covalent attachment of a polynucleotide or polynucleotide derivative, covalent attachment of a lipid or lipid derivative, covalent attachment of phosphatidylinositol, cross-linking, cyclization, disulfide bond formation, demethylation, formation of covalent cross-links, formation of cystine, formation of pyroglutamate, formylation, gamma-carboxylation, glycation, glycosylation, GPI anchor formation, hydroxylation, iodination, methylation, myristoylation, oxidation, proteolytic processing, phosphorylation, prenylation, racemization, selenoylation, sulfation, transfer-RNA mediated addition of amino acids
- a qualitative analysis method reports the presence or absence of a single molecule of analyte in a sample. In some embodiments, a qualitative analysis method incorrectly reports the absence of analyte in a sample that contains analyte at a level below a certain threshold.
- Quantitative analysis is used to describe a method for determining the amount of an analyte molecule in a sample.
- the term "recording device”, as used herein, alone or in combination, refers to a device for recording an optical signal.
- the optical signal is converted to an electrical signal.
- the recording device is a charge-coupled (“CCD”) device.
- the recording device is a complementary metal-oxide semiconductor (“CMOS”) device.
- reporter molecule is used to describe a molecule that can report either the presence or absence, or the amount or concentration of, an analyte molecule, and alone or in combination with another reporter molecule, produce a detectable signal in a digital molecular assay.
- a reporter molecule will bind to an analyte molecule, and the reporter molecule / analyte molecule complex will differ significantly in in one or more spectral properties.
- Reporter molecules can be antibodies or fragment thereof, nucleic acids, proteins, and peptides, any of which may be chemically or biochemically modified.
- Reporter molecules can also be chimeric molecules comprising a moiety of biochemical origin and a synthetic moiety; examples include an antibody-functionalized plasmonic nanoparticle and a nucleotide-functionalized plasmonic nanoparticle. Reporter molecules can be aptamers based on either nucleic acids or peptides.
- reporter volume is used to describe the volume of the measurement device in which the reporter molecules are located.
- the reporter volume may be substantially the same as the sample compartment, or the reporter volume may be smaller.
- the dimension of the reporter volume that is parallel to the optical paths for the reporter molecules will be small.
- the reporter volume will constitute a monolayer.
- sample as used herein, alone or in combination, is used to describe a composition that contains the analyte of interest.
- a sample will often be in fluid, e.g. aqueous, solution.
- a sample may be chemical or biological. Blood, plasma, water from a source to be tested, extracts from plant, animal, or human tissue samples, are examples of biological samples.
- a chemical sample would be one that did not contain material of biological origin, such as a water sample containing petrochemical or industrial waste.
- Biological samples drawn from an organism can include, but are not limited to, the following: blood, serum, plasma, urine, mucus, saliva, sputum, stool, and other physiological secretions, as well as extracts of tissues, and or any other constituents of the body which can contain the target particle of interest.
- Other similar specimens such as cell or tissue culture or culture broth are also of interest.
- a biological sample may be fresh or stored (e.g. blood or blood fraction stored in a blood bank).
- the biological sample may be a bodily fluid expressly obtained for the assays of this invention or a bodily fluid obtained for another purpose which can be sub-sampled for the assays of this invention.
- the biological sample is whole blood. Whole blood may be obtained from the subject using standard clinical procedures.
- the biological sample is plasma. Plasma may be obtained from whole blood samples by centrifugation of anti-coagulated blood. Such process provides a buffy coat of white cell components and a supernatant of the plasma.
- the biological sample is serum. Serum may be obtained by centrifugation of whole blood samples that have been collected in tubes that are free of anti-coagulant.
- the blood is permitted to clot prior to centrifugation.
- the yellowish-reddish fluid that is obtained by centrifugation is the serum.
- the sample is urine.
- the sample may be pretreated as necessary by dilution in an appropriate buffer solution, heparinized, concentrated if desired, or fractionated by any number of methods including but not limited to ultracentrifugation, fractionation by fast performance liquid chromatography (FPLC), or precipitation of apolipoprotein B containing proteins with dextran sulfate or other methods.
- FPLC fast performance liquid chromatography
- Any of a number of standard aqueous buffer solutions at physiological pH, such as phosphate, Tris, or the like, can be used.
- saturation in reference to binding phenomena, refers to a state in which nearly all reporter molecules are bound to analyte molecules.
- a characteristic of a condition of saturation is that an increase in the concentration of analyte causes a small increase in the degree of binding of reporter molecules.
- swipe refers to a handheld personal computer with a mobile operating system and an integrated mobile broadband cellular network connection for voice, SMS, and internet data communication, and, typically, wi-fi.
- tablette computer refers to a thin, flat, portable personal computer, typically with a mobile operating system, LCD touchscreen display, a rechargeable battery, and a wireless (optionally, cellular) communication interface.
- digital molecular assay methods, systems, and devices disclosed herein are useful in a variety of fields and applications. None of the system and deceives disclosed herein are part of the claimed invention.
- digital molecular assays would be useful in "the field," that is, in a portable setting.
- digital molecular assays would be useful in medical assessment and diagnostics and detection of pathogens, particularly in remote areas, areas that are underserved or difficult to access (e.g. due to violent conflict), areas affected by an epidemic, and in other instances where access to traditional assay equipment and/or professionals is limited. They would also be useful within a hospital or clinic, or in a home-visit setting, where they could be performed or used at point of care or bedside.
- Digital molecular assays would be equally useful in a veterinary setting as in a medical, whether in a veterinary office, on a ranch or farm, or anywhere animals in need of testing are located. They could also be used in horticultural or agricultural applications to test plants or soil for pathogens or symbiotic microorganisms, or detect other genotypes and phenotypes of interest.
- Digital molecular assays could also be used to test water for contamination, e.g., by bacteria, algae, or fungi, or the toxic products thereof; by petroleum or its products and byproducts, and industrial waste). Such assays would be useful for food safety testing and for agricultural uses, such as field or processing facility testing for pathogens, toxins, adulterants, contaminants, and pests.
- biochemical assays are adaptable to the digital molecular assay format disclosed herein. Examples include: immunoassays in which capture and binding of an antigen by an antibody or a fragment thereof; hybridization assays in which one or more segments of DNA or RNA complimentary to analyte DNA/RNA of interest is used to capture the analyte; and ligand binding assays in which a binding partner to a receptor, enzyme, or other protein, or vice versa, is used as the capture agent for the partner analyte (e.g., protein or fragment thereof).
- immunoassays in which capture and binding of an antigen by an antibody or a fragment thereof
- hybridization assays in which one or more segments of DNA or RNA complimentary to analyte DNA/RNA of interest is used to capture the analyte
- ligand binding assays in which a binding partner to a receptor, enzyme, or other protein, or vice versa, is used as the capture agent for the partner analyte (e.g
- immunoassays and hybridization assays can employ a sandwich format in which binding partner pairs, e.g. antibodies or cDNA/RNA, to the same analyte molecule, e.g., an antigen or target DNA/RNA, are used.
- binding partner pairs e.g., antibodies, wherein both antibodies are specific to the same molecule, e.g., the same antigen, and wherein one or both members of the pair comprises an optical reporter molecule as described herein.
- the combination of multiple capture and reporter elements still comprises a signal-producing arrangement which, while comprising multiple optical reporter molecules, may still itself be termed an optical reporter molecule.
- Capture binding partners and detection binding partner pairs can be used in the reporter molecule.
- a heterogeneous assay protocol is used in which, typically, two binding partners, e.g., two antibodies or two sequences of DNA or RNA, are used.
- One binding partner is a capture partner, usually immobilized on a solid support such as a plasmonic nanoparticle, and the other binding partner is a detection binding partner, typically with a detectable label attached, such as another plasmonic nanoparticle.
- Antibodies and antibody pairs are commercially available, and can also be designed and prepared by methods well-known in the art.
- Reporter molecules can be attached to a reporter surface, either by nonspecific adsorption, or by specific covalent linkage.
- the loading of reporter molecules will be determined to a large part by the concentration of the reporter molecules in the preparation solution. More concentrated solutions will provide a higher density of reporter molecules, while at the same time increasing the count of clusters of reporter molecules that contain two or more particles. This latter effect is by no means fatal to successful operation: smaller clusters of reporter molecules can be analyzed with curve-fitting techniques discussed below, while larger clusters that are not suitable for these techniques can be flagged as inactive.
- a loading of a maximum of about 1 reporter molecule per square micron will prove to be optimal in certain embodiments. For single-molecule detection, a density that would equate to no more than one analyte molecule (bound to optical reporter molecule) per pixel would be useful.
- Analysis using sandwich assays can be performed with a multi-step procedure: the reporter surface that has been functionalized with capture molecules is exposed to the analyte. A certain fraction of capture molecules will bind to analyte, depending on analyte concentration. In a second step, the reporter surface is exposed to a solution with detection molecules. Only those capture molecules that have bound to an analyte in the first step will bind to detection molecules in the second step.
- a clear advantage of this method is that the capture and detection molecules can be chosen so as to optimize the optical signal that is delivered from the capture molecule / analyte / detection molecule assembly, as compared to the unbound capture molecule.
- the methods disclosed herein can be used to identify a phenotypic or genotypic state of interest associated with a clinically diagnosed disease state.
- disease states include, for example, cancer, cardiovascular disease, inflammatory disease, autoimmune disease, neurological disease, infectious disease and pregnancy related disorders.
- states of health can be detected using markers.
- the methods disclosed herein can be used to detect genetic variation.
- the genetic variation herein may include, but is not limited to, one or more substitution, inversion, insertion, deletion, or mutation in nucleotide sequences (e.g., DNA and RNA) and proteins (e.g., peptide and protein), one or more microdeletion, one or more rare allele, polymorphism, single nucleotide polymorphism (SNP), large-scale genetic polymorphism, such as inversions and translocations, differences in the abundance and/or copy number (e.g., copy number variants, CNVs) of one or more nucleotide molecules (e.g., DNA), trisomy, monosomy, and genomic rearrangements.
- the genetic variation may be related to metastasis, presence, absence, and/or risk of a disease, such as cancer, pharmacokinetic variability, drug toxicity, adverse events, recurrence, and/or presence, absence, or risk of organ transplant rejection in the subject.
- a disease such as cancer
- pharmacokinetic variability drug toxicity
- adverse events adverse events
- recurrence and/or presence, absence, or risk of organ transplant rejection in the subject.
- copy number changes in the HER2 gene affect whether a breast cancer patient will respond to Herceptin treatment or not.
- detecting an increase in copy number of chromosome 21 (or 18, or 13, or sex chromosomes) in blood from a pregnant woman may be used to as a non-invasive diagnostic for Down's Syndrome (or Patau's Syndrome or Edwards' Syndrome) in an unborn child.
- An additional example is the detection of alleles from a transplanted organ that are not present in the recipient genome - monitoring the frequency, or copy number, of these allele
- the digital molecular assay methods described herein employ a measurement device or system, either of which comprises the parts required for analysis of samples.
- the measurement device contains a sample compartment, into which samples are introduced, either by direct addition of the sample of interest, or by insertion of a cuvette or slide, which itself contains the sample of interest.
- the sample compartment further provides a component that contains reporter molecules, whose function is to bind to the analyte of interest and produce an optical signal.
- the measurement device provides an illumination device for excitation of chromophores contained in the reporter molecules.
- the measurement device contains a recording device (e.g. an image sensor, e.g. a digital camera), which detects and records the optical signal from the reporter molecules.
- the measurement device can contain additional components, such as controls for operation, a device for displaying or reporting analysis results, and an interface with an external computer. The presence of the various optional components, and their specifics, may differ among various designs of measurement devices.
- the system or device as a whole can incorporate a mount for orienting the device for convenient sample addition or removal.
- the system can be coupled to a mobile computing device.
- the mobile computing device could be a smartphone, handheld computer, tablet computer, or a similar portable computing device.
- the mobile computing device includes all necessary components, such as: display, a processor, a memory, and program instructions stored in the memory and executable by the processor, to enable highly automated performance of steps such as: (i) introduction of sample, (ii) optical excitation, (iii) optional pre-screening of the sample to evaluate sample quality and optimal exposure time, (iv) recording of an image by the recording device, (v) subtraction of detector bias, if required, (vi) digitization of detector signal, (vii) recording of digital signal in nonvolatile memory, (viii) recycling of detector, if needed, and (ix) processing of digital signal.
- the functions could further include determining the result of the digital assay, and conveying the result in visual form to the end user.
- a smartphone or other mobile computing device as the detection instrument for digital molecular assays allows inexpensive, portable, and multifunctional systems to perform assays in the field, i.e., outside the laboratory.
- Applications can include point-of-care diagnostic systems for measuring viral loads, nutritional status, disease biomarkers, or environmental contaminants without the need to transport a sample to a central laboratory. Such tests could be performed in private residences, global-health facilities, in law enforcement installations, and medical clinics.
- the mobile computing device can connect to the internet, which will enable combination of sensor data with patient information and geographical location. Connectivity to an external computation facility can be provided for data interpretation, geographic and demographic mapping, database construction and maintenance, and delivery of notifications to remote medical experts and authorities. Compact, field-operable digital measurement devices will free assays from the requirements for trained technicians in laboratories. Instead, these assays could be performed by anyone, due to the size and affordability of the detection system.
- a biosensor is a device that uses biological molecules (e.g., one or more enzymes, antibodies, or nucleotide sequences) to detect the presence of chemicals. Many kinds of biosensors may be used in a digital molecular assay.
- a biosensor typically consists of a capture component (often termed the “bioreceptor”) and a reporter component, (“biotransducer”), together comprising a reporter molecule as disclosed herein, as well as a system which includes a detector, processor, and display, and optionally other elements such as a signal amplifier, magnifying lens, and light source.
- the interaction between (typically the binding of) the analyte and the capture element produces an alteration in the reporter element, which outputs a measurable physicochemical signal. This interaction produces a signal which indicates the presence or concentration of the target analyte in the sample.
- Reporter components as disclosed herein include optical transducers including plasmonic nanoparticles, other localized surface plasmon resonance (LSPR) systems, plasmon scattering systems, photonic crystals, and any other technology that can detect a single molecule and produce an optical signal.
- LSPR localized surface plasmon resonance
- Capture elements may be natural or engineered biomolecules, such as an antibody or fragment (Fab, Fv or scFv) or domain (VH, VHH) thereof, or a nucleic acid (one or more sections of complimentary DNA or RNA to the analyte of interest).
- Fab antibody or fragment
- Fv Fv
- scFv domain
- VHH VHH
- nucleic acid one or more sections of complimentary DNA or RNA to the analyte of interest
- the capture element is attached to reporter element, e.g. by functionalization and layered deposition, or entrapment in a matrix, e.g. a hydrogel or xerogel such as sol-gel.
- reporter surface The surface of the sensor to which reporter molecules (comprising capture and reporter elements) are attached, termed the "reporter surface,” may be, for example, polymer or glass; or glass coated in metal or bearing the metal nanoparticles (e.g. gold or silver; other metals such as titanium, chromium, and copper have also been used) that comprise the reporter element. This surface forms or is aligned along at least one wall of a chamber or flow cell, into or through which the analyte solution is passed.
- the chamber or flow cell may be made of glass or polymer; the glass or polymer reporter surface may bear gold nanoparticles functionalized with capture elements, applied via methods known in the art. For analysis with dark field microscopy, light is passed through the edge of the glass or polymer reporter surface, orthogonal to the plane of the reporter surface.
- the measurement device provides a sample compartment suitable for introduction of a sample of interest. Measurement devices that employ optical measurement techniques will benefit from a sample compartment that is oblong, with one short dimension.
- the light path for the optical signal from the reporter molecules to the recording device will align parallel with the short dimension. This orientation will minimize absorption and dispersion of the optical signal that would cause problems for longer optical paths. This criterion allows for the use of either prismatic or cylindrical sample compartments.
- the sample compartment comprises a component, termed the reporter volume, that contains reporter molecules.
- This component obviates the need to add reporter molecules to the sample of interest, and will instead enable recycling of the reporter molecules. More importantly, the reporter molecules will be held in a substantially stationary arrangement, so that inactive reporter molecules can be identified and recorder previous to clinical use of the measurement device.
- the reporter volume is defined by a physical enclosure that retains reporter molecules within itself.
- the physical enclosure may be porous, to allow passage of analyte into the reporter volume for contact with the reporter molecule.
- the reporter volume is not defined by a physical enclosure; instead, other means can be provided to retain reporter molecules within the reporter volume and keep the reporter molecule stationary.
- the reporter molecules are associated with a three-dimensional support.
- the reporter molecules are covalently bound to the three-dimensional support.
- the reporter molecules are not covalently bound to the three-dimensional support, but are impregnated in the three-dimensional support in such a manner as to hinder diffusion from the three-dimensional support.
- the reporter molecules are substantially trapped in the three-dimensional support, and are stationary.
- the reporter volume will preferably be narrow in the dimension that is perpendicular to the optical pathway for the reporter molecules.
- This geometry provides an important advantage: the optical pathway from a first reporter molecule is unlikely to encounter a second reporter molecule before arriving at the recording device.
- FIG. 11 A narrow reporter volume is shown in FIG. 11(a) , with a recording device to the right, and a non-uniform arrangement of reporter molecules in the reporter volume. It will be seen that, in this geometry, the optical paths from reporter molecules to recording device are well separated. In contrast, a wide reporter volume is shown in FIG. 11(b) . In this geometry, at least one reporter molecule overlaps with a second reporter molecule.
- the degree to which optical paths overlap can be estimated from a small number of parameters that define the receptor volume, including the particular distribution of reporter molecules (random, semi-random, aggregated, ordered), the concentration and effective size of the reporter molecules, and the thickness of the reporter volume.
- substantially all optical paths between reporter molecules and the recording device encounter no other reporter molecule. In certain embodiments, substantially all optical paths between reporter molecules and the recording device encounter at most one other reporter molecule.
- the reporter volume is sufficiently thin so as to allow for a single layer for the reporter molecules.
- overlap of optical paths is not possible, since all reporter molecules are substantially in a plane perpendicular to the optical path, and parallel to the recording device, as depicted in FIG 12(a) .
- Various monolayer techniques can be used to obtain such a system, such as the use of surface active molecules. Crosslinking of surface active molecules can render the reporter molecules stationary. Discussion of reporter surfaces is presented below in detail.
- each reporter molecule will be separated by at least a pixel from any neighboring reporter molecule, in order to most easily identify inactive reporter molecules and observe the optical signal from active reporter molecules. Furthermore, depending on the divergence of the optical paths that enters the recording device, a much larger separation may be desirable. This is shown in FIG.
- reporter molecules will be coupled to larger particles, such as microspheres or microparticles, or nanoparticles. Coupling of reporter molecules to larger particles will tend to increase the average distance between reporter molecules, due to the size of the larger particles. This is depicted in FIG 12(c) , in which reporter molecules 3 are attached onto, or within, larger particles 5 .
- the sample compartment comprises a reporter surface for attachment of reporter molecules.
- the reporter surface is oriented perpendicular to the shortest dimension of an oblong sample compartment, in order to minimize the optical path from reporter molecule to recording device. This arrangement of reporter molecules allows easy attachment of reporter molecules to a solid support, and further provides a narrow reporter volume, which is beneficial for the reasons discussed above.
- the reporter surface is oriented opposite a window that is substantially transparent to the signal produced by the reporter molecules.
- the transparent reporter surface can contact a waveguide that is suitable for dark-field microscopy.
- the reporter surface comprises a metallic layer.
- the metallic layer is suitable for surface plasmon resonance.
- the reporter surface and transparent window can be located on the two end faces of a prismatic sample compartment, or alternatively on the two end faces of a cylindrical sample compartment. In certain embodiments the end faces are parallel and proximal, approximating or forming an assay slide or assay chip.
- the measurement devices and systems comprise, and the methods disclosed herein employ, a variety of reporter molecules.
- a single type of reporter molecule is employed, which will provide a well-behaved binding response to various concentrations of analytes.
- two or more different reporter molecules having differing affinities for the same analyte can be employed, which can accommodate a larger range of analyte concentration than a measurement device having a single type of reporter molecule, as described in further detail below.
- two or more different reporter molecules having affinities for different analytes are provided.
- the reporter molecules may comprise a chromophore.
- the chromophore has been covalently attached to the reporter molecule; alternatively, it may attach to the reporter molecule via functionalization, e.g. to the surface of a quantum dot or plasmonic nanoparticle.
- the chromophore absorbs electromagnetic radiation.
- the chromophore absorbs electromagnetic radiation in a spectral region chosen from visible and ultraviolet.
- the chromophore may scatter electromagnetic radiation.
- the chromophore is luminescent.
- the chromophore is fluorescent.
- the chromophore is phosphorescent.
- the reporter molecules may each comprise a chromophore that provides an optical signal upon binding of analyte.
- the optical signal may be a change in the extinction coefficient of an absorption band, a change in the ⁇ max of an absorption band, a change in the quantum yield of an emission band, a change in the fluorescence anisotropy of an emission band, a shift in the center of a spectrum above or below a specified wavelength, wavelength of maximum intensity ( ⁇ max ), a change in the size or intensity of the signal, an increase or decrease in brightness, a change in the shape of the signal, the presence or absence of spectral bands; and a change in shape of a spectrum.
- the optical signal is caused by an interaction between analyte and chromophore. In certain embodiments, the optical signal is caused indirectly by the binding of analyte to reporter molecule. In certain embodiments, binding of the analyte by the reporter molecule induces a conformational change that affects an absorption or emission property of the chromophore. In certain embodiments, binding of the analyte by the reporter molecule induces an interaction between a chromophore on the analyte and a chromophore on the reporter molecule.
- the reporter molecule comprises two chromophores. In certain embodiments, binding of an analyte by the reporter molecule induces a geometric change in the reporter molecule that increases a non-radiative interaction between the two chromophores. In certain embodiments, binding of an analyte by the reporter molecule induces a geometric change in the reporter molecule that decreases a non-radiative interaction between the two chromophores. In certain embodiments, the non-radiative interaction is fluorescence quenching. In certain embodiments, the non-radiative interaction is fluorescence energy transfer. In certain embodiments, the non-radiative interaction is phosphorescence energy transfer. In certain embodiments, the non-radiative interaction is plasmon-coupled resonance energy transfer.
- the chromophore is a plasmonic nanoparticle and/or a quantum dot.
- the plasmonic nanoparticle and/or quantum dot may be functionalized to bear a capture element.
- the capture element is a biological molecule such as an antibody, nucleotide, peptide, or fragment thereof
- the chromophore-capture element becomes an optical reporter molecule, and a biosensor.
- an analyte such as an antigen or complimentary nucleotide
- changes the mass of the induces a change in nanoparticle's spectral properties, due to effects such as electron transfer, energy transfer, plasmon resonance, and changes in the particle's mass and mobility.
- the methods described herein accommodate a certain fraction of reporter molecules that is inactive, i.e., the optical signal from these inactive reporter molecules is either absent or substantially different from the bulk of reporter molecules. This behavior can be due to the failure of a reporter molecule to bind to the analyte. Alternatively, a reporter molecule can bind to the analyte but does not produce an optical signal, or produces an optical signal that is substantially different from the remainder of optical molecules.
- the system utilizes a nanoparticle as a reporter molecule.
- the nanoparticle can become inactive on aggregation with other nanoparticles.
- an inactive reporter molecule comprises individual proteins (including antibodies) that have aggregated, a peptide or protein that has not correctly folded, a peptide or protein that comprises an incorrect residue, a defective chromophore.
- the number of inactive reporter molecules can remain substantially constant during the operating lifetime of the measurement device, particularly in cases in which inactive reporter molecules have defective composition. It is also possible that the number of inactive molecules will increase during the operating lifetime of the measurement device, due to chemical deterioration of reporter molecules, particularly photochemical deterioration caused by repeated high intensity exposure to light sources, or aggregation of protein forming part of the reporter molecule.
- Inactive reporter molecules can be identified by a change in optical behavior: either their failure to produce an optical signal on exposure to analyte molecules, or the their production of an optical signal on exposure to analyte molecules that is significantly different from the bulk of the reporter molecules.
- the plurality of reporter molecules is distributed randomly. In certain embodiments, the plurality of reporter molecules comprises aggregates of reporter molecules. In certain embodiments, the plurality of reporter molecules comprises a regular geometric ordering in one or more dimensions. In certain embodiments, each reporter molecule is associated with an exclusion zone, within which no other reporter molecule is located. Recording device and microscope , not part of the claimed invention
- a recording device is provided to record the optical signal from the reporter molecules.
- the optical signal from the reporter molecules passes through a transparent window of the sample compartment.
- the recording device will be an image sensor, such as a camera.
- a CMOS (complementary metal-oxide semiconductor) camera for example, is useful because it can read each pixel individually; additionally, CMOS cameras consume very little power, allowing them to last longer when used as part of a device in the field. Almost all smartphone cameras have CMOS cameras, many with resolution of over 10 megapixels, making them useful in the methods, systems, and devices disclosed herein.
- the recording device allows the observation of one or more signals from the sample compartment.
- each of a plurality of signals originates from a different region of the sample compartment.
- each signal in the plurality of signals originates from a pixel in a regular geometric grid that spans the sample compartment.
- the pixels of a recording device are arranged in a rectangular or square array. In certain embodiments, the pixels of a recording device are arranged in a 512 x 512 square array, a 1024 x 1024 square array, a 2048 x 2048 square array, or a 4096 x 4096 square array. In certain embodiments, the signal from each pixel is recorded separately from all other pixels. In certain embodiments, the signal from 2x2 sets of pixels is binned together.
- the measurement device can allow the observation of a plurality of signals from different regions of the plurality of reporter molecules.
- the different regions of the plurality of reporter molecules are disposed in a regular grid.
- the individual optical signal from substantially all reporter molecules can be observed without interference from any other reporter molecule.
- the recording device can capture individual pixels and/or individual reporter molecules.
- the use of plasmonic nanoparticles / quantum dots as substrates to which capture elements are functionalized facilitates this detection. Used in combination with a magnifying lens, the recording device could detect even smaller signals. Such lenses are well known in the art.
- the recording device can use any technique that is known in the art for detection and quantification of reporter molecule / analyte complexes. Recording devices can use optical absorption and emission methods that are paired with the reporter molecule design.
- the recording device can make optical absorption measurements. For example, binding with a reporter molecule can be coupled with an enzyme-linked immunosorbent assay (ELISA) that produces a colored product in the presence of an analyte.
- ELISA enzyme-linked immunosorbent assay
- the ELISA is functionalized onto a plasmonic nanoparticle or quantum dot, the presence and quantity of analyte would then be reported by, for example, the wavelength, intensity, etc. of an absorption feature; and would yield a signal from each nanoparticle as opposed to a bulk signal.
- the optical output could include fluorescence emission from fluorophore either on the reporter molecule or coupled with the reporter molecule that is excited by a light source. The presence and quantity of analyte would then be reported by the intensity of the fluorescence emission.
- the fluorophore could be proximal to a surface, such as a photonic crystal, such that the fluorescence emission is enhanced.
- Multiple fluorophores can be employed to tune the fluorescence signal to a desirable outcome.
- the optical signal can be modulated by excitation transfer among two or more fluorophores.
- polarizers can be introduced into either the excitation or emission optical pathway, or both.
- a light source can be coupled with the emission methods.
- the light source can be a conventional broadband source, light emitting diode, or laser, and can be delivered to the sample either directly or via a wavelength selection device such as a grating, in order to optimize excitation.
- Light can be directed through a total internal reflection component incorporating a waveguide and forming the base of the reporter surface, thus providing dark field excitation.
- the optical assay medium could include a surface configured for surface-enhanced Raman scattering (SERS).
- SERS surface-enhanced Raman scattering
- the optical output could include Raman scattering of the light source by reporter molecules on the SERS surface. The presence and quantity of analyte would then be reported by the intensity of the Raman scattering.
- identification method For certain systems, two solutions, the first free of analyte, and the second with a high concentration of analyte, will be contacted sequentially with the reporter surface. It will be appreciated that these two solutions will cause an absence of analyte binding by reporter molecule, and near saturation of analyte binding by reporter molecule, respectively. Images are recorded using the recording device, and a comparison is made between the images for the analyte-free and analyte-saturated conditions. Reporter molecules that do not meet selectivity criteria are marked as inactive.
- the identification method maintains a record for the location of reporter molecules in the measurement device.
- the location of reporter molecules can be referenced by x/y coordinates, for example, relative to an appropriate geometric grid in the measurement device, or relative to the pixel coordinates on the recorder device.
- the record of inactive reporter molecules can be maintained on non-volatile computer memory.
- the identification method will provide criteria for tagging reporter molecules as inactive.
- the criteria are set to strike a balance between eliminating poorly behaving reporter molecules from use, while maintaining a sufficiently high count of reporter molecules for the particular accuracy and sensitivity requirements for the measurement device.
- a numerical threshold can be chosen, based on the type of optical signal that is observed.
- a certain reporter molecule may undergo a shift in emission ⁇ max on binding to an analyte molecule, and the ⁇ max shifts by 20 nanometers (nm) for the bulk of the compounds in this example.
- a threshold of a 5 nm shift might be chosen for this particular example.
- the numerical threshold can be chosen in order to exclude a certain fraction of reporter molecules. Referring to the previous example, a ⁇ max shift of 12 nm may be observed for 95% of the reporter molecules. A threshold ⁇ max of 12 nm may then be chosen in order to retain 95% of the reporter molecules as active, and discard 5% of the reporter molecules as inactive.
- any criteria can be chosen for assigning reporter molecules as inactive. Since the binding of any one reporter molecule is independent of all other reporter molecules, elimination of a reporter molecule from the pool of active reporter molecules does not affect the behavior of the remaining molecules.
- the identification method described above can be repeated periodically during the operating lifetime of a measurement device. This practice will be particularly beneficial for reporter devices whose performance is susceptible to deterioration over time. Ideally, the identification method will require a minimal amount of operator intervention, with the measurement device automatically performing all required steps. For the case of nanoparticle-based reporter molecules, images can be recorded periodically, and any aggregation that may occur over time can be identified by pattern-matching software.
- the identification method can also comprise the steps of subjecting the measurement device to one or more solutions containing intermediate concentrations of analyte. This will be particularly important for quantitative measurement of analyte, for which a range of reporter molecule saturation is envisioned. By use of several solutions, spanning a range of analyte concentrations, a calibration curve can be constructed to better match optical reporting data with concentration of analyte.
- a key benefit from the use of spatially resolved signals from a field of reporter molecules is that regions of the recording device that are particularly problematic can be flagged as such, and discarded in subsequent analyses. This includes not only cases for inactive reporter molecules, i.e., improperly folded antibodies, but for any region that presents difficulties. This may include overlapping spots from two or more closely spaced reporter molecules, or reporter molecules whose free and bound states are poorly distinguishable, for whatever reason. Binding of each individual reporter molecule is independent of all others, and discarding a small set of optical signals can improve accuracy or precision, while impacting sensitivity only marginally.
- the digital measurement methods will minimize or eliminate several sources of error, which by definition is the source of low accuracy.
- one source of error arises from reporter molecules which are inactive: either they do not bind to the analyte molecule, or bind to the analyte molecule and do not provide the expected optical signal. Either situation, if not taken into account, introduces error into the estimation of analyte concentration, since the observed signal will be lower than expected.
- reporter molecules In contrast, using the digital molecular assay, and observing spectral shifts for each reporter molecule, free reporter molecules will display zero shift, while bound reporter molecules will display full shift. There is no intermediate state. Naturally, not all chromophores will shift by the same value, but the expected value and range can be determined prior to usage in the field. Reporter molecules with outlying values can be discarded as inactive.
- the signal-to-noise for the disclosed digital methods will be at least as good as conventional methods.
- concentrations of analytes will lead to a weaker bulk signal.
- concentrations of analytes will lead to a smaller number of discrete signals, each of which having the same intensity or value.
- the individual signals for discrete reporter molecules lend themselves to curve-fitting techniques that can improve the signal-to-noise ratio.
- the signal from each active reporter molecule will fall in either of two regions of the spectrum, for which idealized noise-free curves (corresponding to the curves in FIG. 8 ) can be constructed, based on previous knowledge of the reporter molecule. Since each reporter can only be free or bound, the observed signal from a reporter molecule can be assigned as either free or bound. This stands in contrast to many curve-fitting applications, for which superposition of the signals from two or more states, in varying ratios, must be accommodated in order to model the observed signal.
- FIG. 13 An example of curve-fitting is shown in FIG. 13 . Emission from two signals, shown in gray, is summed, with the simulated addition of "noise" to form a net observed signal, shown in black. The signals are similar to those presented in FIG. 7 , and the vertical dashed line in FIG. 12 corresponds to the same delineation of analyte-free and analyte-bound reporter molecule at 500 nm that was discussed for FIG. 8 . Curve-fitting techniques can, given the observed signal, estimate the individual signals that combined to give the overall signal. Observed signals that comprise a small number of well-separated individual signals can be evaluated using curve-fitting with high accuracy and precision of curve-fitting.
- a single reporter molecule can provide only one of two possible signals, corresponding to the analyte-bound and analyte-free states, with no intermediate state possible.
- the observed signal can be clearly attributed to two reporter molecules, one with emission below 500 nm, and the other with emission above 500 nm, corresponding to an analyte-bound and an analyte-free reporter molecule.
- the digital property of this experiment will substantially simplify the curve fitting process.
- curve-fitting techniques can prove advantageous for handling two or more reporter molecules whose optical signals cannot be resolved spatially.
- two reporter molecules whose signals cannot be resolved from each other, four states are possible: (a) both receptors bound; (b) both receptors free; and (c) & (d): one reporter free (the last two states can be expected to have similar but not necessarily identical optical signals).
- This situation is necessarily more complex than the single reporter molecule; however, it is still very manageable, compared to the optical signal from bulk samples.
- Curve-fitting methods can be used for handling two or more reporter molecules whose optical signals are partially resolved spatially, i.e., the optical signals from the two or more reporter molecules is spread unequally across a number of pixels. It can be expected that this scenario will be more common than exact spatial overlap from two or more reporter molecules, especially for recording devices with finely spaced pixels. This scenario can benefit from curve fitting of not a single spectrum from a single pixel (or a summed spectrum from a collection of closely spaced pixels), but instead a collection of individual spectra from a collection of closely spaced pixels, combined with profiles for the (partially overlapping) spots.
- the ratio of bound / total reporter molecules increases asymptotically to 1 as the concentration of free analyte increases.
- the analyte is present in excess, compared to a much smaller concentration of reporter molecule, so free analyte concentration and total analyte concentration are approximately equal. This approximation will be used throughout this discussion.
- a higher affinity reporter molecule will bind to a higher proportion of analyte molecule at any given analyte concentration.
- the total reporter molecule concentration refers only to the active reporter molecule.
- FIG. 14 Shown in FIG. 14 are two binding isotherm curves.
- the horizontal axis corresponds to analyte concentration
- the vertical axis corresponds to the ratio of bound / total reporter molecule.
- the curved lines represent the two binding isotherms, which determine the bound / total reporter molecule ratio at any given analyte concentration.
- the bound / total receptor ratio asymptotically approaches 1 as the analyte concentration increases, and as the reporter molecule approaches saturation, i.e., most every reporter molecule binds to an analyte molecule.
- the upper, dark curve corresponds to a higher affinity reporter molecule
- the lower curve corresponds to a lower affinity reporter molecule. It will be apparent that the affinity of reporter molecule for analyte will play a large role in the ease of quantifying analytes at different ranges of analyte concentration.
- the vertical axis (bound / total ratio of reporter molecule) is the dependent variable, and analyte concentration is the independent variable, since the bound / total ratio depends on the analyte concentration.
- the graph is used in reverse; that is, the bound / total ratio is obtained from the experiment, and is located on the vertical axis. From the graph and the binding isotherm curve, the corresponding free analyte concentration is found on the horizontal axis.
- this process can be understood by drawing a horizontal line from the observed bound / total ratio on the y-axis to the isotherm curve, and dropping a vertical line to the x-axis, in order to find the analyte concentration. (In practice this process is done mathematically or numerically; however the error analysis still holds.)
- FIG. 15 corresponds to a sample with a free analyte concentration of approximately 0.10, which corresponds to a bound / total ratio of approximately 0.72.
- This condition is indicated on the binding isotherm as a solid circle.
- a "correct" determination of 0.72 for bound / total ratio, on the vertical axis, is traced horizontally to the binding isotherm, and down to the horizontal axis. This process is indicated by two black arrows.
- the result of underestimating the bound / total ratio by about 5% is shown with two gray arrows, with a corresponding grey circle on the binding isotherm.
- FIG. 16 corresponds to a sample with a higher free analyte concentration of approximately 0.40, corresponding to a bound / total ratio of approximately 0.92, and again marked with a solid circle on the binding isotherm.
- a correct determination is indicated with two black arrows, as with the previous example.
- Underestimation of the bound / total ratio by 5% is again shown with gray arrows and gray circle.
- a 5% underestimation in bound / total ratio leads to a substantial error of about 40% in analyte concentration.
- the difference in behavior between FIG. 15 and FIG. 16 is due to the different slope of the binding isotherm graph at the two spots depicted in these two graphs, and this error propagation will be more serious at higher concentrations of analyte, where the binding isotherm curve is flatter.
- Analytical devices that utilize molecular binding for quantification of analytes are susceptible to another source of error: in many cases, not all reporter molecules are active for binding of analyte. This causes error in estimation of the bound / total ratio which, as outlined above, can propagate into substantial error in the estimated analyte concentration.
- FIG. 14 Shown in FIG. 14 are two binding isotherm curves.
- the upper, dark curve corresponds to a higher affinity reporter molecule.
- the advantage of using this reporter molecule is that nearly complete saturation can be achieved at relatively low concentration: at 0.40 nM, the reporter molecule is 90% saturated.
- the disadvantage is that this reporter molecule is useful for quantifying smaller concentrations of about 0.10 nM, since the shallow region of the binding isotherm curve is subject to significant error, as discussed above.
- the lower, light curve which corresponds to a lower affinity reporter molecule, is useful to quantify a larger range of sample concentrations, since the curve is relatively steep for the entire range.
- the reporter molecule achieves at most 70% saturation in this range, and determination of the signal corresponding to 100% saturation will be difficult to achieve.
- the digital molecular assay methods disclosed herein can include the step of sample dilution, which will improve the precision of estimated analyte concentration by reducing the susceptibility of the measurement to errors in bound / total reporter molecule concentration.
- sample dilution the step of sample dilution, which will improve the precision of estimated analyte concentration by reducing the susceptibility of the measurement to errors in bound / total reporter molecule concentration.
- the measurement methods can include a step of prediluting a sample before introduction into the measurement device.
- the measurement methods can, after reporting an analyte concentration, indicate to the user that a repeat measurement of the sample would improve precision, and can further advise the user on a recommended dilution level.
- the measurement methods can include a rapid pre-screen of a sample that is optimized to quickly provide a low-precision estimate of analyte concentration, in order to suggest an optimal dilution.
- thresholds or cutoffs have been established that correspond to critical values. These thresholds or cutoffs can correspond to regulatory levels set by environmental laws, or to critical biomarker levels that correspond to certain health conditions.
- the measurement methods can adjust the recommended scan parameters and dilution level in order to provide measurement conditions that are adequate for the intended use.
- the measurement device can provide a mechanism for the automatic dilution of a sample. This can be accomplished by ejecting a fraction of an existing sample, followed by introduction of solute for dilution. This can also be accomplished by introducing a new sample that has been pre-diluted with solute.
- the recommended dilution level can be calculated by a computing device, either incorporated into the measurement device or connected to the measurement device.
- the computing device can provide the recommended dilution level to the operator via an interface (such as a display, printout, or synthesized voice report).
- the computing device can also directly control the measurement device to perform any steps needed to automatically analyze a diluted sample, without the need for user intervention.
- the thresholds or cutoffs can be pre-set in the computing device, either in the form of firmware, which can be optionally updated in the case a threshold or cutoff changes, or in the form of software.
- the operating software can prompt the user for further input on the sample that is being measured.
- the user can input history parameters for a subject, such as age, weight, gender, and the like, that may alter a threshold or cutoff and that may therefore influence the precision that is required for a given measurement.
- Dual antibody immunoassays are widely used in classic clinical assays, and standard antibody pairs for this application can be readily obtained.
- plasmon coupling between metal nanoparticles which will become linked via the analyte in the sandwich immunoassay, provides a robust readout of binding of the analyte molecule to the particles.
- Plasmon coupling offers a great strength in that the scattering wavelength of the coupled particles can differ substantially from the individual particle scattering wavelengths, leading to distinct color changes easily discerned at the single particle level by color-even on a cell phone camera.
- spherical gold nanoparticles can work well.
- label free detection is unnecessary and detection is achieved by the secondary metal nanoparticle as a signal enhancer.
- This strategy has been utilized in the detection of conformational changes in proteins and DNA molecules and will enable easy detection of single analyte binding in images acquired using simple cameras, such as the ones available on cell phones.
- the enhanced color change due to the second nanoparticle depends on the size of the second nanoparticle as well as the effective distance between the nanoparticles.
- the interparticle separation (antibody I-analyte-antibody II) expected in our assay will be 20-30 nm and is within the limits of the effective plasmonic coupling. While we typically use 40 nm gold nanoparticles, the dependency of the exponential decay in the plasmonic coupling with interparticle distance on the size of the second nanoparticle (i.e. smaller nanoparticles show rapid decrease in plasmonic coupling compared to larger ones) further allows fine tuning of the spectral shift by using large gold nanoparticles.
- Dark-field imaging is one appropriate way to monitor the scattering light from individual particle pairs in the assay.
- Dark-field microscopy is an optical technique wherein the sample is not directly illuminated. Instead, scattered light is used for the visualization of objects that results in a near-black background intensity leading to a greatly enhanced contrast between objects and background.
- nanoplasmonic materials yield large number of photons without blinking or photobleaching, phenomena that mar fluorescence-based detection that is commonly used in conventional biosensing assays, thus enabling observation of individual particles with a simple optical setup.
- the key to the digital molecular assay is individual evaluation of each particle in the field of view. This can be achieved in various ways, but one way involves before and after image comparison, in which the capture particle is first arrayed (randomly or in patterns) on a substrate. The arrayed particles are imaged before introduction of sample providing the 'before' information. The sample is next flowed into the chamber along with the secondary labeled antibody. In a successful analyte capture, a secondary label particle will be associated with the capture particle leading to a defined change in brightness and color. Each particle in the before image will be characterized to determine that is has the expected brightness and color of single capture particles. Any aggregated or otherwise altered particles will be ignored in subsequent analysis.
- hybridization of surface-bound nucleic acid probes is combined with plasmonic coupling between nanoparticles to provide a digital molecular assay for nucleic acid analytes.
- a surface is modified with a first oligonucleotide to which has been attached a first nanoparticle.
- the surface modification can be performed by noncovalent adsorption, or by covalent binding.
- the sequence of the first oligonucleotide is chosen to hybridize with a first complementary sequence that is contained in the desired analyte nucleic acid. Exposure of the modified surface then induces hybridization of the analyte with the first short oligonucleotide sequence.
- a second oligonucleotide to which is added a second nanoparticle, is introduced.
- the sequence of the second oligonucleotide is chosen to hybridize with a second complementary sequence that is contained in the desired analyte nucleic acid, with the first and second complementary sequences sufficiently separated from each other to allow simultaneous hybridization of both the first and the second oligonucleotide sequences.
- the supramolecular assembly caused by the hybridization of the analyte nucleic acid with the first and the second oligonucleotide sequences can be designed to bring the first and second nanoparticles into close proximity, as for the sandwich immunoassay described above.
- adoption of canonical helical structures by the hybridized analyte nucleotide will simplify the molecular geometry, and facilitate the choice of such parameters as sequence length and the nature and placement of attachment to nanoparticles.
Description
- This application claims the benefit of priority of
United States Provisional Application No. 62/470,303, filed March 12, 2017 - Point-of-care diagnostics and other assays performable in the field are a pressing need. If the delay and expense associated with sending assays such as diagnostic tests, especially blood tests, to dedicated laboratories for analysis could be eliminated, responses could be made more efficiently and effectively. Clinical laboratories deliver diagnostic tests by performing biochemical assays on precision, benchtop instruments. Efforts to miniaturize these instruments or replicate their function on mobile electronic devices are fraught with difficulty. In many cases the results are unusable.
US2009258371 relates to a method of detecting very low levels of analyte within a thin film fluid sample contained in a thin thickness chamber. - What are needed are inexpensive, but accurate, point-of-care says such as diagnostic tests that provide quick and accurate results, for example doctors and their patients.
- The present invention is defined by the appended claims. Provided herein are methods for the rapid and accurate measurement of analytes by assay of binding events, by direct, digital measurement of individually resolved analyte / reporter binding events. The digital molecular assay methods disclosed herein are capable of particle-by-particle readout using optical reporter molecules that detect and report the binding of a single analyte molecule, and report each such binding in binary format. Such digital molecular assay methods are useful in a variety of applications, such as on mobile electronic devices for use in the field.
-
-
FIG. 1 is a conceptual illustration of an analog assay. -
FIG. 2 is a conceptual diagram of analog assay procedures. -
FIG. 3 is a simulation of analog assay results. -
FIG. 4 is a conceptual diagram of part of a digital molecular assay system. -
FIG. 5 is a conceptual diagram of part of an alternate digital molecular assay system. -
FIG. 6 is a conceptual diagram of digital molecular assay image data. -
FIG. 7 is an image of digital molecular assay data. -
FIG. 8 is a simulation of digital molecular assay results. -
FIG. 9 shows a mobile electronic device with a clip-on assay chip reader. -
FIG. 10 illustrates codes that may be embedded in a digital molecular assay. -
FIG. 11 shows the effect of variations in reporter volume thickness on reporter molecules. In thisfigure 1 represents the reporter volume; 2 represents the surface of a recorder device, 3 represents a reporter molecule, and 4 represents an optical path from reporter molecule to recorder device. -
FIG. 12 shows thin reporter volumes and properties thereof. In thisfigure 1 represents the reporter volume; 2 represents the surface of a recorder device, 3 represents a reporter molecule, 4 represents an optical path from reporter molecule to recorder device, and 5 represents a larger particle that is attached to, or contains, the reporter molecule 4. -
FIG. 13 shows the application of curve-fitting methods to optical spectra. The horizontal axis refers to wavelength in nm, and the vertical axis refers to the intensity of an optical signal. -
FIG. 14 shows binding isotherm plots for a strongly binding reporter molecule (upper curve) and a weakly binding reporter molecule (lower curve). -
FIG. 15 shows the effect of error on the determination of analyte concentration at low reporter molecule saturation. The horizontal axis is analyte concentration, and the vertical axis is the ratio of bound / total reporter molecule concentration. The dark horizontal and vertical arrows indicated with 1 represent a "correct" determination of reporter molecule concentration and analyte concentration. The light horizontal and vertical arrows indicated with 2 represent an "incorrect" determination of reporter molecule concentration and analyte concentration. -
FIG. 16 shows the effect of error on the determination of analyte concentration at high reporter molecule saturation. The horizontal axis is analyte concentration, and the vertical axis is the ratio of bound / total reporter molecule concentration. The dark horizontal and vertical arrows indicated with 1 represent a "correct" determination of reporter molecule concentration and analyte concentration. The light horizontal and vertical arrows indicated with 2 represent an "incorrect" determination of reporter molecule concentration and analyte concentration. - Although there is great demand for performing biochemical assays on mobile electronic devices, attempts to simply miniaturize conventional assays and perform them outside the controlled environment of professional, clinical laboratories have not succeeded in the past. Conventional biochemical assays cannot be reliably miniaturized because they are inherently analog measurements.
- Digital assays eliminate inherent uncertainties of analog assays in at least three ways: (1) digital assays are based on binary events that are highly resistant to analog noise; (2) digital assays eliminate errors originating from the unknown fraction of inactive assay molecules in an analog assay; (3) digital assays eliminate problems associated with spatial inhomogeneity such as non-uniform illumination.
- Consider, for example, an antigen - antibody assay designed to measure the concentration of antigen in a sample that is mixed with a known concentration of antibodies. The assay has an optical readout in which antibodies that bind antigen emit a different optical signal than those that do not. (Unbound antibodies might emit no signal, for example.) Given the affinity of antigen - antibody binding, a bulk optical readout signal may be used to estimate antigen concentration.
- This procedure can be made to work reasonably well in a professional laboratory setting with strict quality controls. It fails miserably, however, when performed with mobile devices in a field setting. Conventional, analog biochemical assays are delicate and give wildly inaccurate results when performed on cell phones, tablets, and similar devices.
- One problem is that without strict laboratory protocols a large fraction of the supposedly known concentration of antibodies may be inactive. In a field setting anywhere from 10% to 100% of the antibodies may be rendered inactive due to improper handling, contamination, denaturation and other problems. Worse, the fraction of inactive antibodies is unknown. It is unobservable and represents a systematic error that cannot be eliminated by averaging observed data. The fraction of unbound antibodies and the fraction of inactive antibodies is confounded; their signals are indistinguishable.
- Digital assays reduce or eliminate this problem by counting individual binding events between analyte and reporter molecule, such as antigen and antibody or complimentary nucleotide sequences, rather than averaging the results of millions of them. Mobile devices are well suited for digital assays because they include high quality cameras capable of sampling millions of biochemical events - as many as one per pixel or tens of millions per exposure. Mobile devices also include significant processing power for image analysis and communication capabilities for reporting results and offloading processing if necessary.
- Digital assays select features in an image and classify them as valid or null. Null features include anything in an image that does not meet specific criteria for position, brightness, wavelength or shape, for example. Inactive antibodies are a common source of null features, but irregular sample illumination, imprecise optical alignment, sample irregularities - all common problems in a mobile setting and in other scenarios with inadequate controls - also contribute. In a digital assay, null features are discarded for data analysis; only valid features contribute to assay results. Valid features are counted as bound or unbound, and those are the only possibilities. Yes or no; one or zero. If, in a digital assay, 463 valid features are counted as bound and 886 features are counted as unbound, then the bound fraction is 463 / ( 463 + 886 ) = 463 / 1349 = 0.343 This kind of result comes from a digital process. When it is combined with known analyte binding affinity, it provides the desired analyte concentration. The fraction of events classified as null makes no difference in the result.
- It is helpful to keep in mind that it is the assay itself that is digital. This concept has nothing to do with the ubiquitous digitizing of analog results. Signals produced by analog assays may be digitized for analysis or storage, but digitizing an analog signal cannot remove systematic errors that are "baked in" to it. As an analogy, musical recordings made with analog equipment retain static pops and hiss - inseparable from the music in an analog recording process - even if the recording is stored digitally.
- Turning now to the figures,
FIG. 1 is a conceptual illustration of an analog assay. A cuvette contains a sample. The sample may be a solution containing antigen and antibodies, for example. The antibodies may be labeled so that, upon binding an antigen molecule, the newly formed antibody - antigen complex emits an optical signal when interrogated by an optical excitation. The optical signal may be a spectral measurement; i.e. light intensity versus wavelength. The cuvette, even though it may hold a small sample volume, just a few milliliters is a common size, contains many billions of antibodies and antigen molecules. The observed spectrum is a composite of spectra emitted by billions of bound, labeled antibody - antigen complexes. But, an unknown fraction of the antibodies don't work; they can't bind antigen because they are jammed up in aggregates, denatured or have other problems. -
FIG. 2 is a conceptual diagram of analog assay procedures. The assay begins with an unknown antigen concentration mixed with an antibody concentration. The ratio of active antibodies (ready and able to bind antigen) to inactive antibodies (unable or unavailable to bind antigen) is not known. In a professional laboratory setting, trained technicians following strict procedures in a controlled environment can keep the active-to-inactive ratio high or at least consistent. In a field or point-of-care setting, however the ratio of active-to-inactive antibodies is much lower and, worse, totally inconsistent. - Active antibodies bind antigen at a rate determined by: the antigen - antibody affinity, the concentration of antigen, and the unknown concentration of active antibodies.
-
FIG. 3 is a simulation of analog assay results. The bulk spectrum (heavy solid curve) represents what is observed ("SPECTRUM OUT") in an analog assay. The numerous, light dashed curves represent spectra from single antigen - antibody binding events. These spectra are not observable in an analog assay, however. In the simulation ofFIG. 3 , unbound, active antibodies emit light around 495 nm wavelength while bound, active antibodies emit light around 505 nm wavelength. An unknown number of inactive antibodies do not emit light. This means that the bulk spectrum does not provide sufficient information to measure the number of bound antibodies as a fraction of all active antibodies. - The situation is worse in an actual experiment because inactive antibodies may still emit light, but that light provides no information about antigen binding. It just contributes to systematic error.
-
FIG. 4 is a conceptual diagram of part of a digital molecular assay system. The digital molecular assay illustrated inFIG. 4 depicts an example wherein mobile dark-field microscopy performed with a smartphone camera, for example, captures an image of a plasmonic nanoparticle sandwich-type immunoassay. In this assay a total internal reflection (TIR) substrate is coated with plasmonic nanoparticles functionalized with capture antibodies designed to bind an antigen of interest. Additional plasmonic nanoparticles, functionalized with the same or different antibodies (i.e., designed to bind an equivalent part of the antigen, or a different part) are introduced, along with the antigen of interest in a sample. Excitation light is introduced into the substrate from an edge. Bound antibodies emit different optical signals than unbound and inactive antibodies. Antibodies may be inactive due to many factors, such as degradation or, more commonly, aggregation. The differing signals may appear in an image as different sizes, brightness, spectra, shapes, et cetera, and be sorted as active or null considering one or more of these factors. -
FIG. 5 is also conceptual diagram of part of a digital molecular assay system; it is an alternative of the example above wherein the TIR substrate is coated with plasmonic nanoparticles functionalized with capture nucleotide sequences of DNA or RNA, complimentary to part of the analyte DNA/RNA of interest. Additional plasmonic nanoparticles, functionalized with different cDNA/cRNA (i.e., designed to bind another section of the analyte DNA/RNA) are introduced, along with the analyte DNA/RNA in a sample. Bound DNA/RNA sequences emit different optical signals than unbound and inactive antibodies -
FIG. 6 is a conceptual diagram of digital molecular assay image data; i.e. part of an image captured by a mobile device camera operating as a dark field microscope. The image includes spots produced by bound antigen - antibody complexes, spots from unbound antibodies, spots from inactive or null antibodies and a defect zone which may be an area of the image that is defective for any of a number of reasons. Illumination of the image may be non-uniform, even far from uniform. As long as the spatial illumination pattern is known, by recording an image at the illumination wavelength, for example, results at any point in the image may be normalized to the known illumination. -
FIG. 7 is a depiction of digital molecular assay data obtained by a mobile device camera operating as microscope. The figure is less impressive when shown in grayscale as it is in this disclosure compared to the original color image, so it has been manually enhanced for submission in black-and-white. White circles have been drawn around spots in the image that correspond to active antibodies. All other spots in the image are null or inactive antibodies. Of the active antibodies, 4 out of 11 are bound; these are depicted by way of example with a gray circle around the white one. The identification of active versus null, and bound versus unbound is performed by image analysis software. Image analysis may be performed on the mobile device. Alternative, the mobile device may send the image to another processor. It may send the image to a virtual server in the computer cloud, for example. - As an example of image processing to distinguish bound from unbound antibodies in a digital molecular assay,
FIG. 8 is a simulation of digital assay results.FIG. 8 represents spectra from six spots in an image from a digital assay. The criteria for bound versus unbound is whether the spectrum from a spot lies above or below 500 nm in wavelength. Spots with spectra that do not fall in the range shown in the figure are null. From top to bottom, the spectra correspond to spots from unbound, unbound, bound, inactive (null), unbound and bound antibody sites. There are two positive results, three negative and one null. Thus the fraction of bound antibodies is 2/5. As mentioned above, an actual experiment is complicated by optical signals from inactive antibodies. Thus the selection criteria may be more complicated than spectral center above or below a certain wavelength. The criteria may involve narrow spectral bands, intensity criteria, spectral shape, and spatial shape as examples. - The selection criteria also take into account knowledge of a spatial illumination pattern. Intensity measured at an emission wavelength is normalized by illumination intensity at an excitation wavelength at the same location in an image. This eliminates problems of spatial inhomogeneity which plague analog measurements. The assay proceeds digitally on a particle-by-particle basis considering "EXCITATION IN" and "SPECTRUM OUT" for each particle. The result for a given particle can only be 0 or 1.
- Digital molecular assays may be performed with mobile devices as illustrated in
FIG. 9 which shows a mobile electronic device with a clip-on assay chip reader. The assay chip reader may include optical components that adapt the mobile device camera for dark field imaging, for example. The assay chip is designed to receive analyte solution and may be precoated with antibodies. - Since a digital assay is based on imaging and image analysis, codes may be placed on an assay chip and read out from the same images used to measure binding events.
FIG. 10 illustrates codes that may be embedded in a digital assay. Examples include bar codes, quick response (QR) codes, quantum dots that emit light at engineered wavelengths, nanoparticle reporters of temperature, humidity, light exposure, gas exposure and other environmental data. Identifying marks representing particular assay types or sample identification may also be included. - The examples discussed above are presented using antigen - antibody binding. Antigen and antibodies may be linked to optical reporter molecules for assay readout. Assays involving other cross-linking mechanisms may also be performed digitally. For example, assays based on hybridization of DNA or RNA fragments bound to optical reporter molecules may be performed as digital molecular assays where complementary DNA or RNA fragments take the place of antigen and antibody molecules. As an example, a first part of a short DNA sequence may be bound to an optical reporter and a second part of the short DNA sequence may be bound to another optical reporter. When the first and second part bind to a longer, complementary DNA sequence, the two optical reporters are brought close together and therefore emit a different optical signal compared to when they are farther apart. This kind of assay may be used to detect the complementary DNA sequence.
- In conclusion, it is a fool's errand to use a mobile device as a surrogate for professional laboratory instrumentation with analog assays. Digital molecular assays allow particle by particle readout of individual interactions between single analyte molecules and reporter molecules, rendering irrelevant the practical problems attendant with traditional assays. Leveraging the imaging and image processing capabilities of mobile devices to provide diagnostic results that reduce or eliminate common sources of systematic errors found in analog assays, digital molecular assays enable in-field assessments such as point-of-care diagnostic tests that help doctors and patients obtain critical health information quickly and inexpensively, and the collection and analysis of data across a wide range of applications.
- Unless defined otherwise, all technical and scientific terms used herein have the same meaning as commonly understood by one of ordinary skill in the art to which this invention belongs.
- As used herein, the terms below have the meanings indicated.
- When ranges of values are disclosed, and the notation "from n1 ... to n2" or "between n1 ... and n2" is used, where n1 and n2 are the numbers, then unless otherwise specified, this notation is intended to include the numbers themselves and the range between them. This range may be integral or continuous between and including the end values. By way of example, the range "from 2 to 6 carbons" is intended to include two, three, four, five, and six carbons, since carbons come in integer units. Compare, by way of example, the range "from 1 to 3 µM (micromolar)," which is intended to include 1 µM, 3 µM, and everything in between to any number of significant figures (e.g., 1.255 µM, 2.1 µM, 2.9999 µM, etc.).
- The term "about," as used herein, is intended to qualify the numerical values which it modifies, denoting such a value as variable within a margin of error. When no particular margin of error, such as a standard deviation to a mean value given in a chart or table of data, is recited, the term "about" should be understood to mean that range which would encompass the recited value and the range which would be included by rounding up or down to that figure as well, taking into account significant figures.
- The term "accuracy", as used herein, alone or in combination, is used to refer to the closeness of a reported or estimated value from the true value. An inaccurate measurement, observation, or estimation deviates from the true value. An accurate measurement, observation, or estimation does not deviate from the true value.
- The term "analyte", or "analyte molecule", as used herein, alone or in combination, is used to describe a molecule or particle for which the presence or absence, or amount, in a sample is originally unknown, and for which knowledge of the presence or absence, or amount, contained in a sample would be useful. Examples of analytes include biomolecules, such as: peptides, proteins, cytokines, and prions; antibodies, and fragments thereof; nucleic acids (DNA/RNA) and particles containing them, such as histones; small organic and bioinorganic molecules, such as carbohydrates, lipids, hormones, and intermediates and products of metabolism; macromolecules, such as macrocycles, biopolymers (e.g. oligosaccharides, polyphenols, and plastics); and viruses, viral particles, viral products (e.g. virokines). An analyte may also be categorized as a biomarker, that is, a composition and/or molecule or a complex of compositions and/or molecules that is associated with a biological state of an organism (e.g., a condition such as a disease or a non-disease state) and can report the presence of disease, injury, or cellular or organismal damage. When such markers bind to an antibody or a fragment thereof, they may be referred to as antigens. Values for meaningful (e.g., normal and abnormal) levels of analytes detected by the digital molecular assays disclosed herein will be known to those of skill in the relevant art.
- The term "area detector", as used herein, alone or in combination, refers to a recording device that can record an image from a source, i.e., record not only the intensity of an incoming optical signal, but the origin of an optical signal. Common examples of area detectors are television cameras, digital SLR cameras, and cellphone cameras.
- The term "assay chip", as used herein, alone or in combination, refers to a microarray of reporter molecules (e.g. optical reporter molecules) spotted or otherwise deposited onto a reporter surface, optionally enclosed within a relatively thin, flat cuvette such as a slide, which can be exposed to a sample containing analyte such that the interaction between the capture elements of the optical reporter molecules and the analyte can be observed. Techniques for the production of assay chips are known in the art. An assay chip may comprise as the optical reporter molecules plasmonic nanoparticles functionalized with antibodies, proteins, DNA, RNA, etc.
- The term "assay chip reader", as used herein, alone or in combination, refers to a system or device for observing and recording signals from an assay chip. An assay chip reader may be part of a digital molecular assay system as disclosed herein, and typically comprises a chamber for receiving an assay chip, a recording device such as an image sensor (e.g., a camera), a means for transmitting the data collected from the assay to memory, and optionally, a light source such as a light-emitting diode (LED). Additionally, the assay chip reader may contain microfluidic hardware such as pumps, channels, chambers for solutions, valves, mixers, and the like; and hardware and/or software for performing at least some analysis of the data. In certain embodiments, an assay chip reader may be coupled with a smartphone or other mobile device and used as part of a portable assay system; miniaturized microplate and chip readers are known in the art.
- The term "binding isotherm", as used herein, alone or in combination, refers to the degree of binding of bound reporter molecules to analyte molecules at different concentrations of analyte. In general, the degree of binding, which can be defined as the ratio of bound reporter molecules / total reporter molecules, increases with increased analyte concentration, and eventually approaches 1, as nearly all reporter molecules are bound to analyte molecules.
- The term "binning", as used herein, alone or in combination, refers to the combination of signals from two or more pixels into one signal. Binning can be used when spatial resolution can be sacrificed in order to improve signal-to-noise. "2x2 binning", by way of example, refers to the grouping of pixels into 2x2 squares, and summing the signals from the pixels contained in each square.
- The term "biomolecule", as used herein, alone or in combination, includes any type of organic or bioinorganic molecule for which detection (either qualitative or quantitative) may be desired, including but not limited to, peptides, proteins, nucleic acids, sugars, mono- and polysaccharides, lipids, lipoproteins, whole cells, and the like.
- The term "camera," as used herein, refers to a type of image sensor for recording visual images, for example as digital images. A "megapixel camera" is a camera that can record one million, or multiples of one million, pixels per image. Many smartphone cameras comprise ten-megapixel or more cameras.
- The term "communication interface," as used herein, refers to a means for transferring data from a device or system as used herein to another device or system. Examples of wireless communications interfaces include those used in wireless devices such as mobile phones, for example cellular, wi-fi, and Bluetooth technologies.
- The term "concentration", as used herein, alone or in combination, refers to the amount of a solute in a solution per unit volume of solution. Concentration can be specified in units of molar concentration, i.e. number of moles of solute per liter of solution, or number concentration, i.e., number of molecules of solute per liter of solution. Molar concentration and number concentration can be readily interconverted. As used herein, the term "concentration" is expanded to include systems outside the traditional definition of "solution", e.g., systems containing molecules tethered to a solid support.
- The term "deconvolution", as used herein, alone or combination, is used to describe a method for determining, from a collective optical signal that is composed of individual optical signals from a plurality of optical reporter molecules, the individual optical signals from the individual optical reporter molecules. Deconvolution can use curve-fitting techniques to determine the individual spectral features from individual optical reporter molecules that partially overlap across a spectral region and that have combined to form a single collective spectrum. Deconvolution can use curve-fitting techniques to determine individual images from individual optical reporter molecules that partially overlap in a spatial region of a detector and that have combined to form a single collective image. It will be understood that deconvolution techniques are particularly useful for small groups of optical reporter molecules.
- The term "detect" or "detection", as used herein, alone or in combination, is used to describe a method of determination of the existence, presence, or fact of an analyte in a sample.
- The term "divergence" indicates the deviation from perpendicularity that is accommodated by the recording device. An idealized area-detector type recording device will accept only light rays that are perpendicular to the plane of the detector. Actual area detectors will allow light rays that arrive at an angle from the perpendicular. Although this feature can increase signal-to-noise (since more light rays are accepted by the detector), it also decreases spatial resolution, depending on the size of the divergence angle allowed, and the size of the area detector pixel and distance between the area detector and the sample plane.
- The term "incubate", as used herein, alone or in combination, is used to describe a process of exposing reporter molecules to a sample that can potentially contain an analyte molecule.
- The term "oblong" as used herein, alone or in combination, is used to describe a volume having unequal dimensions. Examples of oblong volumes include prisms or cylinders for which the distance between the end faces is either significantly larger or significantly smaller than dimensions parallel to the end faces. A further example of an oblong volume is an ellipsoid for which one axis is either significantly larger or significantly smaller than the other axes.
- The term "optical path", as used herein, alone or in combination, is used to describe the path from reporter molecule to detector.
- The term "optical reporter molecule," or, equivalently, "optical reporter," as used herein, alone or in combination, is used to describe a reporter molecule that is capable of reporting either the presence or absence, or the amount or concentration of, an analyte molecule, with an optical signal. The presence or absence of the analyte molecule (optionally, in certain assay formats, with another optical reporter molecule) in contact with the optical reporter molecule, induces a change in the optical signal. An optical reporter molecule bound to analyte ("bound optical reporter molecule") will emit a different signal than an optical reporter molecule not bound to analyte ("unbound optical reporter molecule").
- The term "optical signal", as used herein, alone or in combination, is used to describe a signal that originates from an optical reporter molecule. The optical signal may fall in the visible range of the spectrum, or outside the visible range of the spectrum. The signal may be, for example:
- wavelength of light;
- intensity of signal;
- brightness;
- the shape of a signal or spectrum;
- the presence or absence of spectral bands;
- the extinction coefficient of an absorption band;
- the λmax of an absorption band;
- the quantum yield of an emission band; or
- the fluorescence anisotropy of an emission band.
- The optical signal from an optical reporter molecule may change upon binding of an analyte molecule. The change in optical signal upon binding may be one of the following:
- a shift in the center of a spectrum above or below a specified wavelength;
- a shift in wavelength of maximum intensity (λmax);
- a change in the size or intensity of the signal;
- an increase or decrease in brightness;
- a change in the shape of the signal;
- the presence or absence of spectral bands;
- a change in shape of a spectrum.
- a change in the extinction coefficient of an absorption band;
- a change in the λmax of an absorption band;
- a change in the quantum yield of an emission band; and
- a change in the fluorescence anisotropy of an emission band.
- The term "pixel", as used herein, alone or in combination, refers to an area on an area detector, for example an image sensor, whose signal can be measured independently from other pixels. Area detectors are commonly divided into a two-dimensional grid of pixels, with the size of each pixel, and the count of pixels in the two directions, determined by the area detector manufacturer.
- The term "precision", as used herein, alone or in combination, is used to refer to the estimate of error that is associated with a reported or estimated value. A low precision measurement, observation, or estimation is associated with a high degree of uncertainty about the closeness of this number to the actual value. A high precision measurement, observation, or estimation is associated with a low degree of uncertainty about the closeness of this number to the actual value. Precision can often be quantified by the use of error bars on graphs or ranges for numerical values. For example, an estimated value that is reported as 10.5 ± 0.1 indicates that the true value is very likely between 10.4 and 10.6; with a small but nonzero chance that the true value is outside this range.
- The terms "protein," "polypeptide," "peptide," and "oligopeptide," are used interchangeably herein and include any composition that includes two or more amino acids joined together by a peptide bond. It will be appreciated that polypeptides can contain amino acids other than the 20 amino acids commonly referred to as the 20 naturally occurring amino acids. Also, polypeptides can include one or more amino acids, including the terminal amino acids, which are modified by any means known in the art (whether naturally or non- naturally). Examples of polypeptide modifications include e.g., by glycosylation, or other- post-translational modification. Modifications which can be present in polypeptides of the present disclosure, include, but are not limited to: acetylation, acylation, ADP-ribosylation, amidation, covalent attachment of flavin, covalent attachment of a heme moiety, covalent attachment of a polynucleotide or polynucleotide derivative, covalent attachment of a lipid or lipid derivative, covalent attachment of phosphatidylinositol, cross-linking, cyclization, disulfide bond formation, demethylation, formation of covalent cross-links, formation of cystine, formation of pyroglutamate, formylation, gamma-carboxylation, glycation, glycosylation, GPI anchor formation, hydroxylation, iodination, methylation, myristoylation, oxidation, proteolytic processing, phosphorylation, prenylation, racemization, selenoylation, sulfation, transfer-RNA mediated addition of amino acids to proteins such as arginylation, and ubiquitination.
- The term "qualitative analysis", as used herein, alone or in combination, is used to describe a method for determining the absence or presence of an analyte molecule in a sample. In some embodiments, a qualitative analysis method reports the presence or absence of a single molecule of analyte in a sample. In some embodiments, a qualitative analysis method incorrectly reports the absence of analyte in a sample that contains analyte at a level below a certain threshold.
- The term "quantitative analysis", as used herein, alone or in combination, is used to describe a method for determining the amount of an analyte molecule in a sample.
- The term "recording device", as used herein, alone or in combination, refers to a device for recording an optical signal. In certain embodiments, the optical signal is converted to an electrical signal. In certain embodiments, the recording device is a charge-coupled ("CCD") device. In certain embodiments, the recording device is a complementary metal-oxide semiconductor ("CMOS") device.
- The term "reporter molecule", as used herein, alone or in combination, is used to describe a molecule that can report either the presence or absence, or the amount or concentration of, an analyte molecule, and alone or in combination with another reporter molecule, produce a detectable signal in a digital molecular assay. Typically, a reporter molecule will bind to an analyte molecule, and the reporter molecule / analyte molecule complex will differ significantly in in one or more spectral properties. Reporter molecules can be antibodies or fragment thereof, nucleic acids, proteins, and peptides, any of which may be chemically or biochemically modified. Reporter molecules can also be chimeric molecules comprising a moiety of biochemical origin and a synthetic moiety; examples include an antibody-functionalized plasmonic nanoparticle and a nucleotide-functionalized plasmonic nanoparticle. Reporter molecules can be aptamers based on either nucleic acids or peptides.
- The term "reporter volume", as used herein, alone or in combination, is used to describe the volume of the measurement device in which the reporter molecules are located. The reporter volume may be substantially the same as the sample compartment, or the reporter volume may be smaller. In certain embodiments, the dimension of the reporter volume that is parallel to the optical paths for the reporter molecules will be small. In certain embodiments, the reporter volume will constitute a monolayer.
- The term "sample", as used herein, alone or in combination, is used to describe a composition that contains the analyte of interest. A sample will often be in fluid, e.g. aqueous, solution. A sample may be chemical or biological. Blood, plasma, water from a source to be tested, extracts from plant, animal, or human tissue samples, are examples of biological samples. A chemical sample would be one that did not contain material of biological origin, such as a water sample containing petrochemical or industrial waste. Biological samples drawn from an organism can include, but are not limited to, the following: blood, serum, plasma, urine, mucus, saliva, sputum, stool, and other physiological secretions, as well as extracts of tissues, and or any other constituents of the body which can contain the target particle of interest. Other similar specimens such as cell or tissue culture or culture broth are also of interest.
- A biological sample may be fresh or stored (e.g. blood or blood fraction stored in a blood bank). The biological sample may be a bodily fluid expressly obtained for the assays of this invention or a bodily fluid obtained for another purpose which can be sub-sampled for the assays of this invention. In one embodiment, the biological sample is whole blood. Whole blood may be obtained from the subject using standard clinical procedures. In another embodiment, the biological sample is plasma. Plasma may be obtained from whole blood samples by centrifugation of anti-coagulated blood. Such process provides a buffy coat of white cell components and a supernatant of the plasma. In another embodiment, the biological sample is serum. Serum may be obtained by centrifugation of whole blood samples that have been collected in tubes that are free of anti-coagulant. The blood is permitted to clot prior to centrifugation. The yellowish-reddish fluid that is obtained by centrifugation is the serum. In another embodiment, the sample is urine. The sample may be pretreated as necessary by dilution in an appropriate buffer solution, heparinized, concentrated if desired, or fractionated by any number of methods including but not limited to ultracentrifugation, fractionation by fast performance liquid chromatography (FPLC), or precipitation of apolipoprotein B containing proteins with dextran sulfate or other methods. Any of a number of standard aqueous buffer solutions at physiological pH, such as phosphate, Tris, or the like, can be used.
- The term "saturation", as used herein, in reference to binding phenomena, refers to a state in which nearly all reporter molecules are bound to analyte molecules. A characteristic of a condition of saturation is that an increase in the concentration of analyte causes a small increase in the degree of binding of reporter molecules.
- The term "smartphone" as used herein, refers to a handheld personal computer with a mobile operating system and an integrated mobile broadband cellular network connection for voice, SMS, and internet data communication, and, typically, wi-fi.
- The tem "tablet computer" or "tablet," as used herein, refers to a thin, flat, portable personal computer, typically with a mobile operating system, LCD touchscreen display, a rechargeable battery, and a wireless (optionally, cellular) communication interface.
- The digital molecular assay methods, systems, and devices disclosed herein are useful in a variety of fields and applications. None of the system and deceives disclosed herein are part of the claimed invention. In particular, digital molecular assays would be useful in "the field," that is, in a portable setting. For example, digital molecular assays would be useful in medical assessment and diagnostics and detection of pathogens, particularly in remote areas, areas that are underserved or difficult to access (e.g. due to violent conflict), areas affected by an epidemic, and in other instances where access to traditional assay equipment and/or professionals is limited. They would also be useful within a hospital or clinic, or in a home-visit setting, where they could be performed or used at point of care or bedside.
- Digital molecular assays would be equally useful in a veterinary setting as in a medical, whether in a veterinary office, on a ranch or farm, or anywhere animals in need of testing are located. They could also be used in horticultural or agricultural applications to test plants or soil for pathogens or symbiotic microorganisms, or detect other genotypes and phenotypes of interest.
- Digital molecular assays could also be used to test water for contamination, e.g., by bacteria, algae, or fungi, or the toxic products thereof; by petroleum or its products and byproducts, and industrial waste). Such assays would be useful for food safety testing and for agricultural uses, such as field or processing facility testing for pathogens, toxins, adulterants, contaminants, and pests.
- Many types of biochemical assays are adaptable to the digital molecular assay format disclosed herein. Examples include: immunoassays in which capture and binding of an antigen by an antibody or a fragment thereof; hybridization assays in which one or more segments of DNA or RNA complimentary to analyte DNA/RNA of interest is used to capture the analyte; and ligand binding assays in which a binding partner to a receptor, enzyme, or other protein, or vice versa, is used as the capture agent for the partner analyte (e.g., protein or fragment thereof).
- It will be appreciated that immunoassays and hybridization assays can employ a sandwich format in which binding partner pairs, e.g. antibodies or cDNA/RNA, to the same analyte molecule, e.g., an antigen or target DNA/RNA, are used. The disclosure thus encompasses binding partner pairs, e.g., antibodies, wherein both antibodies are specific to the same molecule, e.g., the same antigen, and wherein one or both members of the pair comprises an optical reporter molecule as described herein. The combination of multiple capture and reporter elements still comprises a signal-producing arrangement which, while comprising multiple optical reporter molecules, may still itself be termed an optical reporter molecule.
- Capture binding partners and detection binding partner pairs, e.g., capture and detection antibody or nucleotide pairs, can be used in the reporter molecule. Thus, although the digital molecular assays disclosed herein allow for label-free detection of analytes, in some embodiments, a heterogeneous assay protocol is used in which, typically, two binding partners, e.g., two antibodies or two sequences of DNA or RNA, are used. One binding partner is a capture partner, usually immobilized on a solid support such as a plasmonic nanoparticle, and the other binding partner is a detection binding partner, typically with a detectable label attached, such as another plasmonic nanoparticle. Antibodies and antibody pairs are commercially available, and can also be designed and prepared by methods well-known in the art.
- Reporter molecules can be attached to a reporter surface, either by nonspecific adsorption, or by specific covalent linkage. The loading of reporter molecules will be determined to a large part by the concentration of the reporter molecules in the preparation solution. More concentrated solutions will provide a higher density of reporter molecules, while at the same time increasing the count of clusters of reporter molecules that contain two or more particles. This latter effect is by no means fatal to successful operation: smaller clusters of reporter molecules can be analyzed with curve-fitting techniques discussed below, while larger clusters that are not suitable for these techniques can be flagged as inactive. Considering the conflicting goals of increasing reporter molecule count and maintaining a manageably small number of reporter molecule clusters, a loading of a maximum of about 1 reporter molecule per square micron will prove to be optimal in certain embodiments. For single-molecule detection, a density that would equate to no more than one analyte molecule (bound to optical reporter molecule) per pixel would be useful.
- Analysis using sandwich assays can be performed with a multi-step procedure: the reporter surface that has been functionalized with capture molecules is exposed to the analyte. A certain fraction of capture molecules will bind to analyte, depending on analyte concentration. In a second step, the reporter surface is exposed to a solution with detection molecules. Only those capture molecules that have bound to an analyte in the first step will bind to detection molecules in the second step. A clear advantage of this method is that the capture and detection molecules can be chosen so as to optimize the optical signal that is delivered from the capture molecule / analyte / detection molecule assembly, as compared to the unbound capture molecule.
- The methods disclosed herein can be used to identify a phenotypic or genotypic state of interest associated with a clinically diagnosed disease state. Such disease states include, for example, cancer, cardiovascular disease, inflammatory disease, autoimmune disease, neurological disease, infectious disease and pregnancy related disorders. Alternatively, states of health can be detected using markers.
- The methods disclosed herein can be used to detect genetic variation. The genetic variation herein may include, but is not limited to, one or more substitution, inversion, insertion, deletion, or mutation in nucleotide sequences (e.g., DNA and RNA) and proteins (e.g., peptide and protein), one or more microdeletion, one or more rare allele, polymorphism, single nucleotide polymorphism (SNP), large-scale genetic polymorphism, such as inversions and translocations, differences in the abundance and/or copy number (e.g., copy number variants, CNVs) of one or more nucleotide molecules (e.g., DNA), trisomy, monosomy, and genomic rearrangements. In some embodiments, the genetic variation may be related to metastasis, presence, absence, and/or risk of a disease, such as cancer, pharmacokinetic variability, drug toxicity, adverse events, recurrence, and/or presence, absence, or risk of organ transplant rejection in the subject. For example, copy number changes in the HER2 gene affect whether a breast cancer patient will respond to Herceptin treatment or not. Similarly, detecting an increase in copy number of chromosome 21 (or 18, or 13, or sex chromosomes) in blood from a pregnant woman may be used to as a non-invasive diagnostic for Down's Syndrome (or Patau's Syndrome or Edwards' Syndrome) in an unborn child. An additional example is the detection of alleles from a transplanted organ that are not present in the recipient genome - monitoring the frequency, or copy number, of these alleles may identify signs of potential organ rejection.
- The digital molecular assay methods described herein employ a measurement device or system, either of which comprises the parts required for analysis of samples. The measurement device contains a sample compartment, into which samples are introduced, either by direct addition of the sample of interest, or by insertion of a cuvette or slide, which itself contains the sample of interest. The sample compartment further provides a component that contains reporter molecules, whose function is to bind to the analyte of interest and produce an optical signal. For designs which rely on emission methods, the measurement device provides an illumination device for excitation of chromophores contained in the reporter molecules. The measurement device contains a recording device (e.g. an image sensor, e.g. a digital camera), which detects and records the optical signal from the reporter molecules. Finally, the measurement device can contain additional components, such as controls for operation, a device for displaying or reporting analysis results, and an interface with an external computer. The presence of the various optional components, and their specifics, may differ among various designs of measurement devices.
- The system or device as a whole can incorporate a mount for orienting the device for convenient sample addition or removal. The system can be coupled to a mobile computing device. The mobile computing device could be a smartphone, handheld computer, tablet computer, or a similar portable computing device. In some examples, the mobile computing device includes all necessary components, such as: display, a processor, a memory, and program instructions stored in the memory and executable by the processor, to enable highly automated performance of steps such as: (i) introduction of sample, (ii) optical excitation, (iii) optional pre-screening of the sample to evaluate sample quality and optimal exposure time, (iv) recording of an image by the recording device, (v) subtraction of detector bias, if required, (vi) digitization of detector signal, (vii) recording of digital signal in nonvolatile memory, (viii) recycling of detector, if needed, and (ix) processing of digital signal. The functions could further include determining the result of the digital assay, and conveying the result in visual form to the end user.
- The use of a smartphone or other mobile computing device as the detection instrument for digital molecular assays allows inexpensive, portable, and multifunctional systems to perform assays in the field, i.e., outside the laboratory. Applications can include point-of-care diagnostic systems for measuring viral loads, nutritional status, disease biomarkers, or environmental contaminants without the need to transport a sample to a central laboratory. Such tests could be performed in private residences, global-health facilities, in law enforcement installations, and medical clinics. The mobile computing device can connect to the internet, which will enable combination of sensor data with patient information and geographical location. Connectivity to an external computation facility can be provided for data interpretation, geographic and demographic mapping, database construction and maintenance, and delivery of notifications to remote medical experts and authorities. Compact, field-operable digital measurement devices will free assays from the requirements for trained technicians in laboratories. Instead, these assays could be performed by anyone, due to the size and affordability of the detection system.
- Digital molecular assay systems or devices as disclosed herein comprise elements which may be termed "biosensors." A biosensor is a device that uses biological molecules (e.g., one or more enzymes, antibodies, or nucleotide sequences) to detect the presence of chemicals. Many kinds of biosensors may be used in a digital molecular assay. A biosensor typically consists of a capture component (often termed the "bioreceptor") and a reporter component, ("biotransducer"), together comprising a reporter molecule as disclosed herein, as well as a system which includes a detector, processor, and display, and optionally other elements such as a signal amplifier, magnifying lens, and light source. The interaction between (typically the binding of) the analyte and the capture element produces an alteration in the reporter element, which outputs a measurable physicochemical signal. This interaction produces a signal which indicates the presence or concentration of the target analyte in the sample.
- Reporter components as disclosed herein include optical transducers including plasmonic nanoparticles, other localized surface plasmon resonance (LSPR) systems, plasmon scattering systems, photonic crystals, and any other technology that can detect a single molecule and produce an optical signal.
- Capture elements may be natural or engineered biomolecules, such as an antibody or fragment (Fab, Fv or scFv) or domain (VH, VHH) thereof, or a nucleic acid (one or more sections of complimentary DNA or RNA to the analyte of interest).
- The capture element is attached to reporter element, e.g. by functionalization and layered deposition, or entrapment in a matrix, e.g. a hydrogel or xerogel such as sol-gel. The surface of the sensor to which reporter molecules (comprising capture and reporter elements) are attached, termed the "reporter surface," may be, for example, polymer or glass; or glass coated in metal or bearing the metal nanoparticles (e.g. gold or silver; other metals such as titanium, chromium, and copper have also been used) that comprise the reporter element. This surface forms or is aligned along at least one wall of a chamber or flow cell, into or through which the analyte solution is passed.
- In an example of an plasmonic nanoparticle biosensor, the chamber or flow cell may be made of glass or polymer; the glass or polymer reporter surface may bear gold nanoparticles functionalized with capture elements, applied via methods known in the art. For analysis with dark field microscopy, light is passed through the edge of the glass or polymer reporter surface, orthogonal to the plane of the reporter surface.
- The measurement device provides a sample compartment suitable for introduction of a sample of interest. Measurement devices that employ optical measurement techniques will benefit from a sample compartment that is oblong, with one short dimension. The light path for the optical signal from the reporter molecules to the recording device will align parallel with the short dimension. This orientation will minimize absorption and dispersion of the optical signal that would cause problems for longer optical paths. This criterion allows for the use of either prismatic or cylindrical sample compartments.
- The sample compartment comprises a component, termed the reporter volume, that contains reporter molecules. This component obviates the need to add reporter molecules to the sample of interest, and will instead enable recycling of the reporter molecules. More importantly, the reporter molecules will be held in a substantially stationary arrangement, so that inactive reporter molecules can be identified and recorder previous to clinical use of the measurement device.
- In some embodiments, the reporter volume is defined by a physical enclosure that retains reporter molecules within itself. The physical enclosure may be porous, to allow passage of analyte into the reporter volume for contact with the reporter molecule. In some embodiments, the reporter volume is not defined by a physical enclosure; instead, other means can be provided to retain reporter molecules within the reporter volume and keep the reporter molecule stationary.
- In certain embodiments, the reporter molecules are associated with a three-dimensional support. In one design, the reporter molecules are covalently bound to the three-dimensional support. Alternatively, the reporter molecules are not covalently bound to the three-dimensional support, but are impregnated in the three-dimensional support in such a manner as to hinder diffusion from the three-dimensional support. In such a design, the reporter molecules are substantially trapped in the three-dimensional support, and are stationary.
- The reporter volume will preferably be narrow in the dimension that is perpendicular to the optical pathway for the reporter molecules. This geometry provides an important advantage: the optical pathway from a first reporter molecule is unlikely to encounter a second reporter molecule before arriving at the recording device. This is shown in
FIG. 11 . A narrow reporter volume is shown inFIG. 11(a) , with a recording device to the right, and a non-uniform arrangement of reporter molecules in the reporter volume. It will be seen that, in this geometry, the optical paths from reporter molecules to recording device are well separated. In contrast, a wide reporter volume is shown inFIG. 11(b) . In this geometry, at least one reporter molecule overlaps with a second reporter molecule. This overlap is unfavorable for two reasons: (a) the second reporter molecule can partially reabsorb the signal from the first reporter molecule, thus causing error, and (b) identification of inactive reporter molecules, which requires accurate measurement of free and bound signal from reporter molecules, will be made more complicated. - The degree to which optical paths overlap can be estimated from a small number of parameters that define the receptor volume, including the particular distribution of reporter molecules (random, semi-random, aggregated, ordered), the concentration and effective size of the reporter molecules, and the thickness of the reporter volume. In certain embodiments of the disclosure, substantially all optical paths between reporter molecules and the recording device encounter no other reporter molecule. In certain embodiments, substantially all optical paths between reporter molecules and the recording device encounter at most one other reporter molecule.
- In some embodiments, the reporter volume is sufficiently thin so as to allow for a single layer for the reporter molecules. In this design, overlap of optical paths is not possible, since all reporter molecules are substantially in a plane perpendicular to the optical path, and parallel to the recording device, as depicted in
FIG 12(a) . Various monolayer techniques can be used to obtain such a system, such as the use of surface active molecules. Crosslinking of surface active molecules can render the reporter molecules stationary. Discussion of reporter surfaces is presented below in detail. - It should be noted that the preferred distance of closest approach for optical paths of different reporter molecules is determined not only by the size of the reporter molecules (which can determine whether an optical path of one molecule penetrates a second molecule) but also by the spatial resolution of the detector, and in particular the pixel size. Ideally, each reporter molecule will be separated by at least a pixel from any neighboring reporter molecule, in order to most easily identify inactive reporter molecules and observe the optical signal from active reporter molecules. Furthermore, depending on the divergence of the optical paths that enters the recording device, a much larger separation may be desirable. This is shown in
FIG. 12(b) , for which the distance between reporter volume and recording device has been increased, for clarity, and for which a small, but nonzero divergence of optical signal that enters the recording device. It will be apparent that, even though the reporter molecules do not physically overlap each other, optical signals from closely spaced reporter molecules can potentially overlap. - In order to minimize overlap between optical paths of different reporter molecules, it will be apparent that features and techniques that minimize aggregation of reporter molecules or, conversely, increase separation between reporter molecules, will be advantageous. In one embodiment, individual reporter molecules will be coupled to larger particles, such as microspheres or microparticles, or nanoparticles. Coupling of reporter molecules to larger particles will tend to increase the average distance between reporter molecules, due to the size of the larger particles. This is depicted in
FIG 12(c) , in whichreporter molecules 3 are attached onto, or within, larger particles 5. - In certain embodiments, the sample compartment comprises a reporter surface for attachment of reporter molecules. The reporter surface is oriented perpendicular to the shortest dimension of an oblong sample compartment, in order to minimize the optical path from reporter molecule to recording device. This arrangement of reporter molecules allows easy attachment of reporter molecules to a solid support, and further provides a narrow reporter volume, which is beneficial for the reasons discussed above.
- The reporter surface is oriented opposite a window that is substantially transparent to the signal produced by the reporter molecules. The transparent reporter surface can contact a waveguide that is suitable for dark-field microscopy. In certain embodiments, the reporter surface comprises a metallic layer. In certain further embodiments, the metallic layer is suitable for surface plasmon resonance. The reporter surface and transparent window can be located on the two end faces of a prismatic sample compartment, or alternatively on the two end faces of a cylindrical sample compartment. In certain embodiments the end faces are parallel and proximal, approximating or forming an assay slide or assay chip.
- The measurement devices and systems comprise, and the methods disclosed herein employ, a variety of reporter molecules. In one embodiment, a single type of reporter molecule is employed, which will provide a well-behaved binding response to various concentrations of analytes. Alternatively, two or more different reporter molecules having differing affinities for the same analyte, can be employed, which can accommodate a larger range of analyte concentration than a measurement device having a single type of reporter molecule, as described in further detail below. In certain embodiments, two or more different reporter molecules having affinities for different analytes are provided.
- The reporter molecules may comprise a chromophore. In certain embodiments, the chromophore has been covalently attached to the reporter molecule; alternatively, it may attach to the reporter molecule via functionalization, e.g. to the surface of a quantum dot or plasmonic nanoparticle. In certain embodiments, the chromophore absorbs electromagnetic radiation. In certain embodiments, the chromophore absorbs electromagnetic radiation in a spectral region chosen from visible and ultraviolet. Alternatively, the chromophore may scatter electromagnetic radiation. In certain embodiments, the chromophore is luminescent. In certain embodiments, the chromophore is fluorescent. In certain embodiments, the chromophore is phosphorescent.
- In certain embodiments of the disclosure, the reporter molecules may each comprise a chromophore that provides an optical signal upon binding of analyte. The optical signal may be a change in the extinction coefficient of an absorption band, a change in the λmax of an absorption band, a change in the quantum yield of an emission band, a change in the fluorescence anisotropy of an emission band, a shift in the center of a spectrum above or below a specified wavelength, wavelength of maximum intensity (λmax), a change in the size or intensity of the signal, an increase or decrease in brightness, a change in the shape of the signal, the presence or absence of spectral bands; and a change in shape of a spectrum.
- In certain embodiments of the disclosure, the optical signal is caused by an interaction between analyte and chromophore. In certain embodiments, the optical signal is caused indirectly by the binding of analyte to reporter molecule. In certain embodiments, binding of the analyte by the reporter molecule induces a conformational change that affects an absorption or emission property of the chromophore. In certain embodiments, binding of the analyte by the reporter molecule induces an interaction between a chromophore on the analyte and a chromophore on the reporter molecule.
- In certain embodiments of the disclosure, the reporter molecule comprises two chromophores. In certain embodiments, binding of an analyte by the reporter molecule induces a geometric change in the reporter molecule that increases a non-radiative interaction between the two chromophores. In certain embodiments, binding of an analyte by the reporter molecule induces a geometric change in the reporter molecule that decreases a non-radiative interaction between the two chromophores. In certain embodiments, the non-radiative interaction is fluorescence quenching. In certain embodiments, the non-radiative interaction is fluorescence energy transfer. In certain embodiments, the non-radiative interaction is phosphorescence energy transfer. In certain embodiments, the non-radiative interaction is plasmon-coupled resonance energy transfer.
- In certain embodiments, the chromophore is a plasmonic nanoparticle and/or a quantum dot. The plasmonic nanoparticle and/or quantum dot may be functionalized to bear a capture element. When the capture element is a biological molecule such as an antibody, nucleotide, peptide, or fragment thereof, the chromophore-capture element becomes an optical reporter molecule, and a biosensor. Contact with (e.g., binding of) an analyte, such as an antigen or complimentary nucleotide, changes the mass of the induces a change in nanoparticle's spectral properties, due to effects such as electron transfer, energy transfer, plasmon resonance, and changes in the particle's mass and mobility.
- The methods described herein accommodate a certain fraction of reporter molecules that is inactive, i.e., the optical signal from these inactive reporter molecules is either absent or substantially different from the bulk of reporter molecules. This behavior can be due to the failure of a reporter molecule to bind to the analyte. Alternatively, a reporter molecule can bind to the analyte but does not produce an optical signal, or produces an optical signal that is substantially different from the remainder of optical molecules.
- In certain embodiments, the system utilizes a nanoparticle as a reporter molecule. The nanoparticle can become inactive on aggregation with other nanoparticles.
- In certain embodiments of the disclosure, an inactive reporter molecule comprises individual proteins (including antibodies) that have aggregated, a peptide or protein that has not correctly folded, a peptide or protein that comprises an incorrect residue, a defective chromophore.
- The number of inactive reporter molecules can remain substantially constant during the operating lifetime of the measurement device, particularly in cases in which inactive reporter molecules have defective composition. It is also possible that the number of inactive molecules will increase during the operating lifetime of the measurement device, due to chemical deterioration of reporter molecules, particularly photochemical deterioration caused by repeated high intensity exposure to light sources, or aggregation of protein forming part of the reporter molecule.
- Inactive reporter molecules can be identified by a change in optical behavior: either their failure to produce an optical signal on exposure to analyte molecules, or the their production of an optical signal on exposure to analyte molecules that is significantly different from the bulk of the reporter molecules.
- In certain embodiments, the plurality of reporter molecules is distributed randomly. In certain embodiments, the plurality of reporter molecules comprises aggregates of reporter molecules. In certain embodiments, the plurality of reporter molecules comprises a regular geometric ordering in one or more dimensions. In certain embodiments, each reporter molecule is associated with an exclusion zone, within which no other reporter molecule is located. Recording device and microscope, not part of the claimed invention
- A recording device is provided to record the optical signal from the reporter molecules. In certain embodiments, the optical signal from the reporter molecules passes through a transparent window of the sample compartment. In certain embodiments, the recording device will be an image sensor, such as a camera. A CMOS (complementary metal-oxide semiconductor) camera, for example, is useful because it can read each pixel individually; additionally, CMOS cameras consume very little power, allowing them to last longer when used as part of a device in the field. Almost all smartphone cameras have CMOS cameras, many with resolution of over 10 megapixels, making them useful in the methods, systems, and devices disclosed herein.
- In certain embodiments of the disclosure, the recording device allows the observation of one or more signals from the sample compartment. In certain embodiments, each of a plurality of signals originates from a different region of the sample compartment. In certain embodiments, each signal in the plurality of signals originates from a pixel in a regular geometric grid that spans the sample compartment.
- In certain embodiments, the pixels of a recording device are arranged in a rectangular or square array. In certain embodiments, the pixels of a recording device are arranged in a 512 x 512 square array, a 1024 x 1024 square array, a 2048 x 2048 square array, or a 4096 x 4096 square array. In certain embodiments, the signal from each pixel is recorded separately from all other pixels. In certain embodiments, the signal from 2x2 sets of pixels is binned together.
- The measurement device can allow the observation of a plurality of signals from different regions of the plurality of reporter molecules. In certain further embodiments, the different regions of the plurality of reporter molecules are disposed in a regular grid. Alternatively, the individual optical signal from substantially all reporter molecules can be observed without interference from any other reporter molecule.
- In certain embodiments, the recording device can capture individual pixels and/or individual reporter molecules. The use of plasmonic nanoparticles / quantum dots as substrates to which capture elements are functionalized facilitates this detection. Used in combination with a magnifying lens, the recording device could detect even smaller signals. Such lenses are well known in the art.
- The recording device can use any technique that is known in the art for detection and quantification of reporter molecule / analyte complexes. Recording devices can use optical absorption and emission methods that are paired with the reporter molecule design.
- The recording device can make optical absorption measurements. For example, binding with a reporter molecule can be coupled with an enzyme-linked immunosorbent assay (ELISA) that produces a colored product in the presence of an analyte. When the ELISA is functionalized onto a plasmonic nanoparticle or quantum dot, the presence and quantity of analyte would then be reported by, for example, the wavelength, intensity, etc. of an absorption feature; and would yield a signal from each nanoparticle as opposed to a bulk signal.
- Alternatively, the optical output could include fluorescence emission from fluorophore either on the reporter molecule or coupled with the reporter molecule that is excited by a light source. The presence and quantity of analyte would then be reported by the intensity of the fluorescence emission. The fluorophore could be proximal to a surface, such as a photonic crystal, such that the fluorescence emission is enhanced. Multiple fluorophores can be employed to tune the fluorescence signal to a desirable outcome. Thus, the optical signal can be modulated by excitation transfer among two or more fluorophores.
- Fluorescence and phosphorescence quantum yield, λmax shift, and anisotropy are envisioned in this disclosure. For anisotropy measurements, polarizers can be introduced into either the excitation or emission optical pathway, or both. A light source can be coupled with the emission methods. The light source can be a conventional broadband source, light emitting diode, or laser, and can be delivered to the sample either directly or via a wavelength selection device such as a grating, in order to optimize excitation. Light can be directed through a total internal reflection component incorporating a waveguide and forming the base of the reporter surface, thus providing dark field excitation.
- In some embodiments, the optical assay medium could include a surface configured for surface-enhanced Raman scattering (SERS). Thus, the optical output could include Raman scattering of the light source by reporter molecules on the SERS surface. The presence and quantity of analyte would then be reported by the intensity of the Raman scattering.
- Provided herein are methods for identifying inactive reporter molecules, termed "identification method". For certain systems, two solutions, the first free of analyte, and the second with a high concentration of analyte, will be contacted sequentially with the reporter surface. It will be appreciated that these two solutions will cause an absence of analyte binding by reporter molecule, and near saturation of analyte binding by reporter molecule, respectively. Images are recorded using the recording device, and a comparison is made between the images for the analyte-free and analyte-saturated conditions. Reporter molecules that do not meet selectivity criteria are marked as inactive.
- In the case of inactivation due to nanoparticle aggregation, identification of inactive reporter molecules will be straightforward. Formation of aggregates will be apparent on visual inspection of the images from the recording device, and will not require the "analyte-free" and "analyte-saturated" procedure outlined above.
- The identification method maintains a record for the location of reporter molecules in the measurement device. The location of reporter molecules can be referenced by x/y coordinates, for example, relative to an appropriate geometric grid in the measurement device, or relative to the pixel coordinates on the recorder device. The record of inactive reporter molecules can be maintained on non-volatile computer memory.
- The identification method will provide criteria for tagging reporter molecules as inactive. The criteria are set to strike a balance between eliminating poorly behaving reporter molecules from use, while maintaining a sufficiently high count of reporter molecules for the particular accuracy and sensitivity requirements for the measurement device. In order to eliminate bias, and enable automated tagging, a numerical threshold can be chosen, based on the type of optical signal that is observed. By way of example only, a certain reporter molecule may undergo a shift in emission λmax on binding to an analyte molecule, and the λmax shifts by 20 nanometers (nm) for the bulk of the compounds in this example. A threshold of a 5 nm shift might be chosen for this particular example.
- In order to satisfy requirements for accuracy and sensitivity, the numerical threshold can be chosen in order to exclude a certain fraction of reporter molecules. Referring to the previous example, a λmax shift of 12 nm may be observed for 95% of the reporter molecules. A threshold λmax of 12 nm may then be chosen in order to retain 95% of the reporter molecules as active, and discard 5% of the reporter molecules as inactive.
- A variety of criteria can be applied for assigning an inactive status. Importantly, any criteria can be chosen for assigning reporter molecules as inactive. Since the binding of any one reporter molecule is independent of all other reporter molecules, elimination of a reporter molecule from the pool of active reporter molecules does not affect the behavior of the remaining molecules.
- If indicated, the identification method described above can be repeated periodically during the operating lifetime of a measurement device. This practice will be particularly beneficial for reporter devices whose performance is susceptible to deterioration over time. Ideally, the identification method will require a minimal amount of operator intervention, with the measurement device automatically performing all required steps. For the case of nanoparticle-based reporter molecules, images can be recorded periodically, and any aggregation that may occur over time can be identified by pattern-matching software.
- The identification method can also comprise the steps of subjecting the measurement device to one or more solutions containing intermediate concentrations of analyte. This will be particularly important for quantitative measurement of analyte, for which a range of reporter molecule saturation is envisioned. By use of several solutions, spanning a range of analyte concentrations, a calibration curve can be constructed to better match optical reporting data with concentration of analyte.
- A key benefit from the use of spatially resolved signals from a field of reporter molecules is that regions of the recording device that are particularly problematic can be flagged as such, and discarded in subsequent analyses. This includes not only cases for inactive reporter molecules, i.e., improperly folded antibodies, but for any region that presents difficulties. This may include overlapping spots from two or more closely spaced reporter molecules, or reporter molecules whose free and bound states are poorly distinguishable, for whatever reason. Binding of each individual reporter molecule is independent of all others, and discarding a small set of optical signals can improve accuracy or precision, while impacting sensitivity only marginally.
- It is expected that accuracy for the disclosed digital measurement methods will be at least as good as for conventional analog methods. The digital measurement methods will minimize or eliminate several sources of error, which by definition is the source of low accuracy. By way of example, one source of error arises from reporter molecules which are inactive: either they do not bind to the analyte molecule, or bind to the analyte molecule and do not provide the expected optical signal. Either situation, if not taken into account, introduces error into the estimation of analyte concentration, since the observed signal will be lower than expected.
- It is expected that precision for the disclosed digital measurement methods will be at least as good as for conventional analog measurements. Conventional methods, which observe a bulk signal from the entirety of reporter molecules, can provide precision estimates using various statistical and numerical methods in most, but not all cases.
- Consider the system such as that depicted in
FIG. 3 , which contains a collection of reporter molecules that comprise a chromophore. The observed spectral shift of the bulk signal will be the average of all shifts (if any), and may be quite small, for small analyte concentrations. This shift may be difficult to discern, especially considering the curve broadening due to the different micro-environments surrounding each chromophore. - In contrast, using the digital molecular assay, and observing spectral shifts for each reporter molecule, free reporter molecules will display zero shift, while bound reporter molecules will display full shift. There is no intermediate state. Naturally, not all chromophores will shift by the same value, but the expected value and range can be determined prior to usage in the field. Reporter molecules with outlying values can be discarded as inactive.
- It is expected that the signal-to-noise for the disclosed digital methods will be at least as good as conventional methods. For bulk detection, smaller concentrations of analytes will lead to a weaker bulk signal. For digital detection, smaller concentrations of analytes will lead to a smaller number of discrete signals, each of which having the same intensity or value.
- The individual signals for discrete reporter molecules, shown as simulations in
FIG. 8 , lend themselves to curve-fitting techniques that can improve the signal-to-noise ratio. The signal from each active reporter molecule will fall in either of two regions of the spectrum, for which idealized noise-free curves (corresponding to the curves inFIG. 8 ) can be constructed, based on previous knowledge of the reporter molecule. Since each reporter can only be free or bound, the observed signal from a reporter molecule can be assigned as either free or bound. This stands in contrast to many curve-fitting applications, for which superposition of the signals from two or more states, in varying ratios, must be accommodated in order to model the observed signal. - An example of curve-fitting is shown in
FIG. 13 . Emission from two signals, shown in gray, is summed, with the simulated addition of "noise" to form a net observed signal, shown in black. The signals are similar to those presented inFIG. 7 , and the vertical dashed line inFIG. 12 corresponds to the same delineation of analyte-free and analyte-bound reporter molecule at 500 nm that was discussed forFIG. 8 . Curve-fitting techniques can, given the observed signal, estimate the individual signals that combined to give the overall signal. Observed signals that comprise a small number of well-separated individual signals can be evaluated using curve-fitting with high accuracy and precision of curve-fitting. Furthermore, because of the digital nature of binding, i.e., the reporter molecule is either bound to the analyte or is free of analyte, a single reporter molecule can provide only one of two possible signals, corresponding to the analyte-bound and analyte-free states, with no intermediate state possible. In the example shown inFIG. 12 , the observed signal can be clearly attributed to two reporter molecules, one with emission below 500 nm, and the other with emission above 500 nm, corresponding to an analyte-bound and an analyte-free reporter molecule. The digital property of this experiment will substantially simplify the curve fitting process. - In addition, the use of curve-fitting techniques can prove advantageous for handling two or more reporter molecules whose optical signals cannot be resolved spatially. In the case of two reporter molecules, whose signals cannot be resolved from each other, four states are possible: (a) both receptors bound; (b) both receptors free; and (c) & (d): one reporter free (the last two states can be expected to have similar but not necessarily identical optical signals). This situation is necessarily more complex than the single reporter molecule; however, it is still very manageable, compared to the optical signal from bulk samples.
- Curve-fitting methods can be used for handling two or more reporter molecules whose optical signals are partially resolved spatially, i.e., the optical signals from the two or more reporter molecules is spread unequally across a number of pixels. It can be expected that this scenario will be more common than exact spatial overlap from two or more reporter molecules, especially for recording devices with finely spaced pixels. This scenario can benefit from curve fitting of not a single spectrum from a single pixel (or a summed spectrum from a collection of closely spaced pixels), but instead a collection of individual spectra from a collection of closely spaced pixels, combined with profiles for the (partially overlapping) spots.
- The relation between the count of bound reporter molecules and the concentration of analyte, known as the "binding isotherm", is complex and indirect. In short, the ratio of bound / total reporter molecules increases asymptotically to 1 as the concentration of free analyte increases. (Generally, the analyte is present in excess, compared to a much smaller concentration of reporter molecule, so free analyte concentration and total analyte concentration are approximately equal. This approximation will be used throughout this discussion.) A higher affinity reporter molecule will bind to a higher proportion of analyte molecule at any given analyte concentration. Importantly, the total reporter molecule concentration refers only to the active reporter molecule.
- Shown in
FIG. 14 are two binding isotherm curves. The horizontal axis corresponds to analyte concentration, and the vertical axis corresponds to the ratio of bound / total reporter molecule. The curved lines represent the two binding isotherms, which determine the bound / total reporter molecule ratio at any given analyte concentration. For each curve, the bound / total receptor ratio asymptotically approaches 1 as the analyte concentration increases, and as the reporter molecule approaches saturation, i.e., most every reporter molecule binds to an analyte molecule. The upper, dark curve corresponds to a higher affinity reporter molecule, and the lower curve corresponds to a lower affinity reporter molecule. It will be apparent that the affinity of reporter molecule for analyte will play a large role in the ease of quantifying analytes at different ranges of analyte concentration. - In
FIG. 14 , the vertical axis (bound / total ratio of reporter molecule) is the dependent variable, and analyte concentration is the independent variable, since the bound / total ratio depends on the analyte concentration. For analytical purposes, the graph is used in reverse; that is, the bound / total ratio is obtained from the experiment, and is located on the vertical axis. From the graph and the binding isotherm curve, the corresponding free analyte concentration is found on the horizontal axis. Visually, this process can be understood by drawing a horizontal line from the observed bound / total ratio on the y-axis to the isotherm curve, and dropping a vertical line to the x-axis, in order to find the analyte concentration. (In practice this process is done mathematically or numerically; however the error analysis still holds.) -
FIG. 15 corresponds to a sample with a free analyte concentration of approximately 0.10, which corresponds to a bound / total ratio of approximately 0.72. This condition is indicated on the binding isotherm as a solid circle. A "correct" determination of 0.72 for bound / total ratio, on the vertical axis, is traced horizontally to the binding isotherm, and down to the horizontal axis. This process is indicated by two black arrows. The result of underestimating the bound / total ratio by about 5% is shown with two gray arrows, with a corresponding grey circle on the binding isotherm. -
FIG. 16 corresponds to a sample with a higher free analyte concentration of approximately 0.40, corresponding to a bound / total ratio of approximately 0.92, and again marked with a solid circle on the binding isotherm. A correct determination is indicated with two black arrows, as with the previous example. Underestimation of the bound / total ratio by 5% is again shown with gray arrows and gray circle. In this example, a 5% underestimation in bound / total ratio leads to a substantial error of about 40% in analyte concentration. The difference in behavior betweenFIG. 15 andFIG. 16 is due to the different slope of the binding isotherm graph at the two spots depicted in these two graphs, and this error propagation will be more serious at higher concentrations of analyte, where the binding isotherm curve is flatter. - Analytical devices that utilize molecular binding for quantification of analytes are susceptible to another source of error: in many cases, not all reporter molecules are active for binding of analyte. This causes error in estimation of the bound / total ratio which, as outlined above, can propagate into substantial error in the estimated analyte concentration.
- By way of example, consider a measurement device in which 10% of the reporter molecules are inactive. Saturation of reporter molecules will produce only 90% of the expected maximal signal, since 10% of the reporter molecules fail to provide an optical signal (either due to failure to bind analyte, or failure of the receptor / analyte complex to produce an optical signal). Inspection of
FIGS 15 and16 will reveal the substantial error that will be introduced into measurements, particularly at higher analyte concentrations. To some extent, this error can be addressed by pre-screening measurement devices under saturation conditions to estimate the maximum signal, to be used as a benchmark for future measurements. However, this procedure is not ideal, since full saturation can never be accomplished. - Shown in
FIG. 14 are two binding isotherm curves. The upper, dark curve corresponds to a higher affinity reporter molecule. The advantage of using this reporter molecule is that nearly complete saturation can be achieved at relatively low concentration: at 0.40 nM, the reporter molecule is 90% saturated. The disadvantage is that this reporter molecule is useful for quantifying smaller concentrations of about 0.10 nM, since the shallow region of the binding isotherm curve is subject to significant error, as discussed above. - In contrast, the lower, light curve, which corresponds to a lower affinity reporter molecule, is useful to quantify a larger range of sample concentrations, since the curve is relatively steep for the entire range. However, the reporter molecule achieves at most 70% saturation in this range, and determination of the signal corresponding to 100% saturation will be difficult to achieve.
- The digital molecular assay methods disclosed herein can include the step of sample dilution, which will improve the precision of estimated analyte concentration by reducing the susceptibility of the measurement to errors in bound / total reporter molecule concentration. By way of example, consider the sample discussed above, whose binding behavior is depicted in
FIG. 15 . Because of the high degree of reporter molecule saturation, the binding isotherm curve is very shallow in the region around the analyte concentration of 0.40, and determination of analyte concentration is therefore very susceptible to even small errors in bound / total reporter molecule concentration. This ratio is made more precise by digital measurements, as discussed above; however, it would be preferable, from the outset, that the determination of analyte concentration not be as susceptible to errors in bound / total reporter molecule concentration. - Consider the effect of a four-fold dilution of this sample, i.e., addition of sufficient volume of solute in order for the concentration of analyte to drop from 0.40 to 0.10. As a result of this dilution, the binding behavior would now be represented by
FIG. 14 . Because of the steeper binding isotherm curve in the region around the new analyte concentration of 0.10, determination of analyte concentration is much less susceptible to errors in bound / total reporter concentration. - The sensitivity properties of digital measurements make the step of sample dilution an appealing procedure for improving precision. It will be readily apparent that the precision of a bulk "analog" measurement of bound reporter molecule concentration will suffer upon sample dilution. Going from
FIG. 14 to FIG. 13 , bound reporter molecule concentration drops from 0.92 to 0.72, representing a 22% drop in bound concentration. A bulk analog signal that is proportional to bound reporter molecule concentration would drop in magnitude by 22%. This drop in magnitude would almost certainly be accompanied by an increase in signal-to-noise, since the magnitude of noise would remain constant. Therefore, the increase in precision due to the binding isotherm effect described above will be counteracted by a decrease in precision due to worsened signal-to-noise in the determination of bound reporter concentration. - In contrast, digital measurements are much less sensitive to this deterioration of signal-to-noise with dilution. As discussed above, a decreased count of bound reporter molecules affects digital measurements differently than analogue measurements. Rather than weakening the bulk signal of analog measurements and thus worsening signal-to-noise, a decreased count of bound reporter molecules will simply reduce the count of discrete optical signals that are received by the reporter device. Importantly, the intensity of each of these discrete optical signals will remain unchanged.
- For this reason, dilution methods to improve precision as described above are not accompanied by a decrease in precision due to analog signal-to-noise effects, and will therefore prove beneficial for digital measurements. The measurement methods can include a step of prediluting a sample before introduction into the measurement device. Alternatively, the measurement methods can, after reporting an analyte concentration, indicate to the user that a repeat measurement of the sample would improve precision, and can further advise the user on a recommended dilution level.
- The measurement methods can include a rapid pre-screen of a sample that is optimized to quickly provide a low-precision estimate of analyte concentration, in order to suggest an optimal dilution.
- In many uses that are envisioned for the disclosed methods, thresholds or cutoffs have been established that correspond to critical values. These thresholds or cutoffs can correspond to regulatory levels set by environmental laws, or to critical biomarker levels that correspond to certain health conditions. The measurement methods can adjust the recommended scan parameters and dilution level in order to provide measurement conditions that are adequate for the intended use.
- In certain embodiments, the measurement device can provide a mechanism for the automatic dilution of a sample. This can be accomplished by ejecting a fraction of an existing sample, followed by introduction of solute for dilution. This can also be accomplished by introducing a new sample that has been pre-diluted with solute.
- In certain embodiments, the recommended dilution level can be calculated by a computing device, either incorporated into the measurement device or connected to the measurement device. The computing device can provide the recommended dilution level to the operator via an interface (such as a display, printout, or synthesized voice report). The computing device can also directly control the measurement device to perform any steps needed to automatically analyze a diluted sample, without the need for user intervention.
- In certain embodiments, the thresholds or cutoffs can be pre-set in the computing device, either in the form of firmware, which can be optionally updated in the case a threshold or cutoff changes, or in the form of software. In addition, the operating software can prompt the user for further input on the sample that is being measured. For example, in the case of the measurement of biomarkers, the user can input history parameters for a subject, such as age, weight, gender, and the like, that may alter a threshold or cutoff and that may therefore influence the precision that is required for a given measurement.
- The invention is further illustrated by the following examples.
- In one implementation of the digital molecular assay in a dual antibody immunoassay format is described here. Dual antibody immunoassays are widely used in classic clinical assays, and standard antibody pairs for this application can be readily obtained. For detection, plasmon coupling between metal nanoparticles, which will become linked via the analyte in the sandwich immunoassay, provides a robust readout of binding of the analyte molecule to the particles. Plasmon coupling offers a great strength in that the scattering wavelength of the coupled particles can differ substantially from the individual particle scattering wavelengths, leading to distinct color changes easily discerned at the single particle level by color-even on a cell phone camera.
- In this example, spherical gold nanoparticles (e.g. between 10 nm and 100 nm in diameter) can work well. For the present purposes, label free detection is unnecessary and detection is achieved by the secondary metal nanoparticle as a signal enhancer. This involves the binding of another nanoparticle (gold) through a second antibody resulting in a plasmonic coupling between the two nanoparticles leading to marked to spectral shifts. This strategy has been utilized in the detection of conformational changes in proteins and DNA molecules and will enable easy detection of single analyte binding in images acquired using simple cameras, such as the ones available on cell phones. The enhanced color change due to the second nanoparticle depends on the size of the second nanoparticle as well as the effective distance between the nanoparticles. The interparticle separation (antibody I-analyte-antibody II) expected in our assay will be 20-30 nm and is within the limits of the effective plasmonic coupling. While we typically use 40 nm gold nanoparticles, the dependency of the exponential decay in the plasmonic coupling with interparticle distance on the size of the second nanoparticle (i.e. smaller nanoparticles show rapid decrease in plasmonic coupling compared to larger ones) further allows fine tuning of the spectral shift by using large gold nanoparticles.
- Dark-field imaging is one appropriate way to monitor the scattering light from individual particle pairs in the assay. Dark-field microscopy is an optical technique wherein the sample is not directly illuminated. Instead, scattered light is used for the visualization of objects that results in a near-black background intensity leading to a greatly enhanced contrast between objects and background. Indeed, nanoplasmonic materials yield large number of photons without blinking or photobleaching, phenomena that mar fluorescence-based detection that is commonly used in conventional biosensing assays, thus enabling observation of individual particles with a simple optical setup.
- The key to the digital molecular assay is individual evaluation of each particle in the field of view. This can be achieved in various ways, but one way involves before and after image comparison, in which the capture particle is first arrayed (randomly or in patterns) on a substrate. The arrayed particles are imaged before introduction of sample providing the 'before' information. The sample is next flowed into the chamber along with the secondary labeled antibody. In a successful analyte capture, a secondary label particle will be associated with the capture particle leading to a defined change in brightness and color. Each particle in the before image will be characterized to determine that is has the expected brightness and color of single capture particles. Any aggregated or otherwise altered particles will be ignored in subsequent analysis. After analyte capture, all images of objects at the locations of good capture particles are analyzed. A statistical criterion for image interpretation is utilized to distinguish failed (e.g. aggregated or nonspecifically bound particles) from clean analyte captures. Background analysis and error correction is enhanced by including non-functionalized particles as fiducial markers. These can be used to sense successful infiltration of solvent, air exposure, or any of a variety of other failure modes that can renders portions of the particle field unusable. In bulk assays, these sorts of errors simply degrade the signal. But in the digital molecular assay format, such errors can be removed ahead of time. In fact, in many single molecule fluorescence imaging experiments it is common for large regions of the field of view to be unusable for various reasons, but with plenty of good molecules in between, the experiments can still run successfully.
- In a modification of the above example, hybridization of surface-bound nucleic acid probes is combined with plasmonic coupling between nanoparticles to provide a digital molecular assay for nucleic acid analytes. A surface is modified with a first oligonucleotide to which has been attached a first nanoparticle. The surface modification can be performed by noncovalent adsorption, or by covalent binding. The sequence of the first oligonucleotide is chosen to hybridize with a first complementary sequence that is contained in the desired analyte nucleic acid. Exposure of the modified surface then induces hybridization of the analyte with the first short oligonucleotide sequence. At this point, a second oligonucleotide, to which is added a second nanoparticle, is introduced. The sequence of the second oligonucleotide is chosen to hybridize with a second complementary sequence that is contained in the desired analyte nucleic acid, with the first and second complementary sequences sufficiently separated from each other to allow simultaneous hybridization of both the first and the second oligonucleotide sequences.
- The supramolecular assembly caused by the hybridization of the analyte nucleic acid with the first and the second oligonucleotide sequences can be designed to bring the first and second nanoparticles into close proximity, as for the sandwich immunoassay described above. Although not strictly necessary for the successful design of this system, adoption of canonical helical structures by the hybridized analyte nucleotide will simplify the molecular geometry, and facilitate the choice of such parameters as sequence length and the nature and placement of attachment to nanoparticles.
Claims (16)
- A method for determining the presence or concentration of at least one analyte in a sample, comprising:incubating at least one type of optical reporter molecules with at least one type of analyte molecules, in an image of a plurality of signals emitted by the at least one type of optical reporter molecules incubated with at least one type of analyte molecules,for each type of optical reporter molecules, determining in the image which optical reporter molecules are active and which are inactive;determining the number of discrete active optical reporter molecules bound to analyte molecules ("bound active optical reporter molecules") and the number of discrete active optical reporter molecules unbound to analyte ("unbound optical reporter molecules") in the image by individually resolving bound and unbound optical reporter molecules; anddetermining the presence or concentration of analyte from the number of bound active optical reporter molecules as a fraction of, or as proportional to a fraction of, the total number of active optical reporter molecules.
- The method of claim 1, wherein the concentration of the at least one analyte is determined.
- The method of claim 2, wherein the analyte is chosen from:• a nucleotide sequence; and• an antigen.
- The method of claim 3, wherein the optical reporter molecule comprises a capture element chosen from:• one or more nucleotide sequences binds the analyte; and• an antibody or a fragment thereof that binds the analyte.
- The method of claim 4, wherein each optical reporter molecule comprises a plasmonic nanoparticle.
- The method of claim 5, wherein the optical reporter molecule comprises one or more nucleotide sequences functionalized onto one or more plasmonic nanoparticles.
- The method of claim 5, wherein the optical reporter molecule comprises one or more antibodies functionalized onto one or more plasmonic nanoparticles.
- The method of any one of claims 1-7, wherein the signal from the optical reporter molecule is chosen from:• wavelength of light;• intensity of signal;• brightness;• the shape of a signal or spectrum; and• the presence or absence of spectral bands.
- The method of claim 8, wherein the bound and unbound optical reporter molecules are individually resolved by:• a shift in the center of a spectrum above or below a specified wavelength;• a change in the size or intensity of the signal;• an increase or decrease in brightness;• a change in the shape of the signal;• the presence or absence of spectral bands; and• a change in shape of a spectrum.
- The method of claim 9, wherein the signal emitted by the optical reporter molecule is wavelength of light, and the bound and unbound optical reporter molecules are individually resolved by a shift in the center of a spectrum above or below a specified wavelength.
- The method of any one of claims 1-10, wherein the method employs a sandwich-type assay.
- The method of claim 11, wherein a first type of optical reporter molecules are affixed to a surface (the reporter surface) such that each affixed optical reporter molecule is spatially resolvable, and the first type of optical reporter molecules comprises a capture element for an analyte functionalized onto a plasmonic nanoparticle.
- The method of claim 12, wherein a second type of optical reporter molecules are added with or after the sample, and the second type of optical reporter molecules comprises a capture element for the analyte functionalized onto a plasmonic nanoparticle.
- The method of claim 13, wherein the analyte is an antigen, and each optical reporter molecule comprises as the capture element an antibody or a fragment thereof.
- The method of claim 13, wherein the analyte is a nucleotide sequence, and each optical reporter molecule comprises as the capture element one or more nucleotide sequences complimentary to the analyte nucleotide sequence.
- The method of claim 1, wherein the method is performed on a digital molecular assay system comprising a mobile device.
Priority Applications (1)
| Application Number | Priority Date | Filing Date | Title |
|---|---|---|---|
| EP23162843.9A EP4219752A1 (en) | 2017-03-12 | 2018-03-12 | Digital molecular assays |
Applications Claiming Priority (2)
| Application Number | Priority Date | Filing Date | Title |
|---|---|---|---|
| US201762470303P | 2017-03-12 | 2017-03-12 | |
| PCT/US2018/022061 WO2018169885A1 (en) | 2017-03-12 | 2018-03-12 | Digital molecular assays |
Related Child Applications (2)
| Application Number | Title | Priority Date | Filing Date |
|---|---|---|---|
| EP23162843.9A Division EP4219752A1 (en) | 2017-03-12 | 2018-03-12 | Digital molecular assays |
| EP23162843.9A Division-Into EP4219752A1 (en) | 2017-03-12 | 2018-03-12 | Digital molecular assays |
Publications (3)
| Publication Number | Publication Date |
|---|---|
| EP3596232A1 EP3596232A1 (en) | 2020-01-22 |
| EP3596232A4 EP3596232A4 (en) | 2020-11-18 |
| EP3596232B1 true EP3596232B1 (en) | 2023-05-03 |
Family
ID=63523268
Family Applications (2)
| Application Number | Title | Priority Date | Filing Date |
|---|---|---|---|
| EP18767684.6A Active EP3596232B1 (en) | 2017-03-12 | 2018-03-12 | Digital molecular assays |
| EP23162843.9A Pending EP4219752A1 (en) | 2017-03-12 | 2018-03-12 | Digital molecular assays |
Family Applications After (1)
| Application Number | Title | Priority Date | Filing Date |
|---|---|---|---|
| EP23162843.9A Pending EP4219752A1 (en) | 2017-03-12 | 2018-03-12 | Digital molecular assays |
Country Status (13)
| Country | Link |
|---|---|
| US (2) | US11680900B2 (en) |
| EP (2) | EP3596232B1 (en) |
| JP (2) | JP7252909B2 (en) |
| KR (2) | KR102535909B1 (en) |
| CN (1) | CN110462057A (en) |
| AU (1) | AU2018236166A1 (en) |
| BR (1) | BR112019018869A2 (en) |
| CA (1) | CA3055960A1 (en) |
| DK (1) | DK3596232T3 (en) |
| ES (1) | ES2951936T3 (en) |
| FI (1) | FI3596232T3 (en) |
| IL (1) | IL269238A (en) |
| WO (1) | WO2018169885A1 (en) |
Families Citing this family (7)
| Publication number | Priority date | Publication date | Assignee | Title |
|---|---|---|---|---|
| BR112019018869A2 (en) | 2017-03-12 | 2020-04-14 | Ilytica Llc | method for determining the presence or concentration of at least one analyte in a sample, method for determining the presence or concentration of antigen in a sample, method for determining the presence or concentration of a target nucleotide sequence in a sample and digital assay system to determine an analyte concentration in a sample |
| EP4051102A4 (en) * | 2019-10-28 | 2023-11-22 | Genotix Biotechnologies Inc. | Analyte detection and quantification by discrete enumeration of particle complexes |
| WO2021193589A1 (en) * | 2020-03-23 | 2021-09-30 | 積水化学工業株式会社 | Testing method, testing kit, and testing system |
| CA3178629A1 (en) * | 2020-05-29 | 2021-12-02 | Jesus Ching | Programmable nuclease diagnostic device |
| US20220020481A1 (en) | 2020-07-20 | 2022-01-20 | Abbott Laboratories | Digital pass verification systems and methods |
| US20220163522A1 (en) * | 2020-11-23 | 2022-05-26 | Arizona Board Of Regents On Behalf Of Arizona State University | Compositions and methods for rapid covid-19 detection |
| US20220381777A1 (en) * | 2021-05-27 | 2022-12-01 | Palamedrix, Inc. | Solution phase single molecule capture and associated techniques |
Family Cites Families (24)
| Publication number | Priority date | Publication date | Assignee | Title |
|---|---|---|---|---|
| US7169556B2 (en) * | 1996-07-29 | 2007-01-30 | Nanosphere, Inc. | Nanoparticles having oligonucleotides attached thereto and uses therefor |
| AU2002320058A1 (en) * | 2001-06-06 | 2002-12-16 | The General Hspital Corporation | Magnetic-nanoparticle conjugates and methods of use |
| US20060127946A1 (en) * | 2002-08-16 | 2006-06-15 | Montagu Jean I | Reading of fluorescent arrays |
| JP2005049297A (en) | 2003-07-31 | 2005-02-24 | National Institute Of Advanced Industrial & Technology | Bioelement for photodetection, and biodetection method |
| US7397043B2 (en) | 2005-01-26 | 2008-07-08 | Nomadics, Inc. | Standoff optical detection platform based on surface plasmon-coupled emission |
| US7723120B2 (en) | 2005-10-26 | 2010-05-25 | General Electric Company | Optical sensor array system and method for parallel processing of chemical and biochemical information |
| WO2008051287A2 (en) | 2006-04-06 | 2008-05-02 | Amerigenics, Inc. | Real time detection of molecules, cell and particles using photonic bandgap structures |
| US20090170070A1 (en) * | 2006-06-15 | 2009-07-02 | Koninklijke Philips Electronics N.V. | Increased specificity of analyte detection by measurement of bound and unbound labels |
| EP2644272B1 (en) * | 2006-11-06 | 2016-04-20 | CLONDIAG GmbH | Device and process for assays using binding members |
| JP2008157923A (en) * | 2006-12-01 | 2008-07-10 | Canon Inc | Chemically sensing device and method |
| US20100285490A1 (en) * | 2006-12-29 | 2010-11-11 | Invitrogen Corporation | Detection apparatus |
| EP2265931B9 (en) | 2008-03-19 | 2017-08-30 | Ruprecht-Karls-Universität Heidelberg | A method and an apparatus for localization of single dye molecules in the fluorescent microscopy |
| WO2009126505A1 (en) * | 2008-04-09 | 2009-10-15 | Abbott Point Of Care, Inc. | Method of detecting very low levels of analyte within a thin film fluid sample contained in a thin thickness chamber |
| US8222047B2 (en) | 2008-09-23 | 2012-07-17 | Quanterix Corporation | Ultra-sensitive detection of molecules on single molecule arrays |
| US20140256593A1 (en) * | 2011-11-22 | 2014-09-11 | University Of Maryland, Baltimore | Plasmonic substrates for metal-enhanced fluorescence based sensing, imaging and assays |
| CA2870635C (en) * | 2012-04-17 | 2019-04-09 | Joel R. L. Ehrenkranz | Device for performing a diagnostic test and methods for use thereof |
| US9389229B2 (en) | 2012-07-18 | 2016-07-12 | Theranos, Inc. | Methods for detecting and measuring aggregation |
| ES2440368B1 (en) | 2012-07-26 | 2015-03-06 | Univ Zaragoza | Biosensor with metal nanoparticles |
| US8947656B2 (en) * | 2013-01-04 | 2015-02-03 | The Board Of Trustees Of The University Of Illinois | Smartphone biosensor |
| CA2951600C (en) * | 2014-08-04 | 2022-12-06 | Ventana Medical Systems, Inc. | Image analysis system using context features |
| JP6820839B2 (en) * | 2014-12-24 | 2021-01-27 | ラムダジェン コーポレイション | Mobile / wearable device that captures LSPR sensor |
| WO2016187588A1 (en) * | 2015-05-21 | 2016-11-24 | Lamdagen Corporation | Plasmonic nanoparticles and lspr-based assays |
| BR112019018869A2 (en) | 2017-03-12 | 2020-04-14 | Ilytica Llc | method for determining the presence or concentration of at least one analyte in a sample, method for determining the presence or concentration of antigen in a sample, method for determining the presence or concentration of a target nucleotide sequence in a sample and digital assay system to determine an analyte concentration in a sample |
| JP2023522172A (en) | 2020-04-09 | 2023-05-29 | イリティカ エルエルシー | Aggregation-triggered assay for enhanced sensitivity |
-
2018
- 2018-03-12 BR BR112019018869A patent/BR112019018869A2/en unknown
- 2018-03-12 WO PCT/US2018/022061 patent/WO2018169885A1/en unknown
- 2018-03-12 CA CA3055960A patent/CA3055960A1/en active Pending
- 2018-03-12 ES ES18767684T patent/ES2951936T3/en active Active
- 2018-03-12 KR KR1020197029818A patent/KR102535909B1/en active IP Right Grant
- 2018-03-12 KR KR1020237016428A patent/KR20230073353A/en not_active Application Discontinuation
- 2018-03-12 EP EP18767684.6A patent/EP3596232B1/en active Active
- 2018-03-12 FI FIEP18767684.6T patent/FI3596232T3/en active
- 2018-03-12 CN CN201880021344.7A patent/CN110462057A/en active Pending
- 2018-03-12 US US16/493,237 patent/US11680900B2/en active Active
- 2018-03-12 AU AU2018236166A patent/AU2018236166A1/en active Pending
- 2018-03-12 EP EP23162843.9A patent/EP4219752A1/en active Pending
- 2018-03-12 DK DK18767684.6T patent/DK3596232T3/en active
- 2018-03-12 JP JP2019570354A patent/JP7252909B2/en active Active
-
2019
- 2019-09-10 IL IL26923819A patent/IL269238A/en unknown
-
2022
- 2022-12-28 JP JP2022211841A patent/JP2023052168A/en active Pending
-
2023
- 2023-04-28 US US18/309,215 patent/US20230258561A1/en active Pending
Also Published As
| Publication number | Publication date |
|---|---|
| JP7252909B2 (en) | 2023-04-05 |
| JP2023052168A (en) | 2023-04-11 |
| CN110462057A (en) | 2019-11-15 |
| AU2018236166A1 (en) | 2019-10-24 |
| EP3596232A4 (en) | 2020-11-18 |
| EP4219752A1 (en) | 2023-08-02 |
| FI3596232T3 (en) | 2023-08-01 |
| BR112019018869A2 (en) | 2020-04-14 |
| EP3596232A1 (en) | 2020-01-22 |
| KR20230073353A (en) | 2023-05-25 |
| US20200132600A1 (en) | 2020-04-30 |
| IL269238A (en) | 2019-11-28 |
| CA3055960A1 (en) | 2018-09-20 |
| US11680900B2 (en) | 2023-06-20 |
| KR20190127816A (en) | 2019-11-13 |
| DK3596232T3 (en) | 2023-08-07 |
| ES2951936T3 (en) | 2023-10-25 |
| US20230258561A1 (en) | 2023-08-17 |
| KR102535909B1 (en) | 2023-05-23 |
| JP2020514775A (en) | 2020-05-21 |
| WO2018169885A1 (en) | 2018-09-20 |
Similar Documents
| Publication | Publication Date | Title |
|---|---|---|
| US20230258561A1 (en) | Digital molecular assays | |
| Kanchi et al. | Smartphone based bioanalytical and diagnosis applications: A review | |
| Spindel et al. | Evaluation of optical detection platforms for multiplexed detection of proteins and the need for point-of-care biosensors for clinical use | |
| Kwon et al. | Medical diagnostics with mobile devices: Comparison of intrinsic and extrinsic sensing | |
| US11719641B2 (en) | Spatially resolved ligand-receptor binding assays | |
| Wong et al. | Mobile app-based quantitative scanometric analysis | |
| US20210318309A1 (en) | Assays with induced aggregation for enhanced sensitivity | |
| US11609233B2 (en) | Indicator-based analysis of a sample | |
| CN108139325A (en) | Crosstalk correction in the multiplexing analysis of biological sample | |
| Singh et al. | Ultratrace level determination and quantitative analysis of kidney injury biomarkers in patient samples attained by zinc oxide nanorods | |
| CN111366563B (en) | Digital plasma immunoadsorption kit and manufacturing and testing method thereof | |
| Gupta et al. | Cellphone camera imaging of a periodically patterned chip as a potential method for point-of-care diagnostics | |
| WO2020005768A1 (en) | Plasmonic swarm biosensing system and methods of use | |
| Belushkin | Nanoparticle-enhanced Imaging Based Plasmonic Biosensor | |
| Esteso et al. | Enhanced Fluorescence in a Lens-Less Fiber-Optic Sensor for C-Reactive Protein Detection | |
| Monroe | Highly sensitive and multiplexed platforms for allergy diagnostics |
Legal Events
| Date | Code | Title | Description |
|---|---|---|---|
| STAA | Information on the status of an ep patent application or granted ep patent |
Free format text: STATUS: THE INTERNATIONAL PUBLICATION HAS BEEN MADE |
|
| PUAI | Public reference made under article 153(3) epc to a published international application that has entered the european phase |
Free format text: ORIGINAL CODE: 0009012 |
|
| STAA | Information on the status of an ep patent application or granted ep patent |
Free format text: STATUS: REQUEST FOR EXAMINATION WAS MADE |
|
| 17P | Request for examination filed |
Effective date: 20190912 |
|
| AK | Designated contracting states |
Kind code of ref document: A1 Designated state(s): AL AT BE BG CH CY CZ DE DK EE ES FI FR GB GR HR HU IE IS IT LI LT LU LV MC MK MT NL NO PL PT RO RS SE SI SK SM TR |
|
| AX | Request for extension of the european patent |
Extension state: BA ME |
|
| DAV | Request for validation of the european patent (deleted) | ||
| DAX | Request for extension of the european patent (deleted) | ||
| REG | Reference to a national code |
Ref country code: DE Ref legal event code: R079 Ref document number: 602018049254 Country of ref document: DE Free format text: PREVIOUS MAIN CLASS: C12Q0001680000 Ipc: C12Q0001682500 Ref country code: DE Ref legal event code: R079 Free format text: PREVIOUS MAIN CLASS: C12Q0001680000 Ipc: C12Q0001682500 |
|
| REG | Reference to a national code |
Ref country code: HK Ref legal event code: DE Ref document number: 40022415 Country of ref document: HK |
|
| A4 | Supplementary search report drawn up and despatched |
Effective date: 20201021 |
|
| RIC1 | Information provided on ipc code assigned before grant |
Ipc: G01N 33/00 20060101ALI20201015BHEP Ipc: G01N 33/543 20060101ALI20201015BHEP Ipc: G01N 33/53 20060101ALI20201015BHEP Ipc: C12Q 1/6825 20180101AFI20201015BHEP |
|
| STAA | Information on the status of an ep patent application or granted ep patent |
Free format text: STATUS: EXAMINATION IS IN PROGRESS |
|
| 17Q | First examination report despatched |
Effective date: 20210914 |
|
| GRAP | Despatch of communication of intention to grant a patent |
Free format text: ORIGINAL CODE: EPIDOSNIGR1 |
|
| STAA | Information on the status of an ep patent application or granted ep patent |
Free format text: STATUS: GRANT OF PATENT IS INTENDED |
|
| INTG | Intention to grant announced |
Effective date: 20221020 |
|
| GRAS | Grant fee paid |
Free format text: ORIGINAL CODE: EPIDOSNIGR3 |
|
| GRAA | (expected) grant |
Free format text: ORIGINAL CODE: 0009210 |
|
| STAA | Information on the status of an ep patent application or granted ep patent |
Free format text: STATUS: THE PATENT HAS BEEN GRANTED |
|
| AK | Designated contracting states |
Kind code of ref document: B1 Designated state(s): AL AT BE BG CH CY CZ DE DK EE ES FI FR GB GR HR HU IE IS IT LI LT LU LV MC MK MT NL NO PL PT RO RS SE SI SK SM TR |
|
| REG | Reference to a national code |
Ref country code: GB Ref legal event code: FG4D |
|
| REG | Reference to a national code |
Ref country code: DE Ref legal event code: R096 Ref document number: 602018049254 Country of ref document: DE |
|
| REG | Reference to a national code |
Ref country code: AT Ref legal event code: REF Ref document number: 1564632 Country of ref document: AT Kind code of ref document: T Effective date: 20230515 Ref country code: CH Ref legal event code: EP |
|
| REG | Reference to a national code |
Ref country code: IE Ref legal event code: FG4D |
|
| P01 | Opt-out of the competence of the unified patent court (upc) registered |
Effective date: 20230525 |
|
| REG | Reference to a national code |
Ref country code: DK Ref legal event code: T3 Effective date: 20230731 |
|
| REG | Reference to a national code |
Ref country code: NL Ref legal event code: FP |
|
| REG | Reference to a national code |
Ref country code: SE Ref legal event code: TRGR |
|
| REG | Reference to a national code |
Ref country code: LT Ref legal event code: MG9D |
|
| REG | Reference to a national code |
Ref country code: NO Ref legal event code: T2 Effective date: 20230503 |
|
| REG | Reference to a national code |
Ref country code: ES Ref legal event code: FG2A Ref document number: 2951936 Country of ref document: ES Kind code of ref document: T3 Effective date: 20231025 |
|
| PG25 | Lapsed in a contracting state [announced via postgrant information from national office to epo] |
Ref country code: PT Free format text: LAPSE BECAUSE OF FAILURE TO SUBMIT A TRANSLATION OF THE DESCRIPTION OR TO PAY THE FEE WITHIN THE PRESCRIBED TIME-LIMIT Effective date: 20230904 |
|
| PG25 | Lapsed in a contracting state [announced via postgrant information from national office to epo] |
Ref country code: RS Free format text: LAPSE BECAUSE OF FAILURE TO SUBMIT A TRANSLATION OF THE DESCRIPTION OR TO PAY THE FEE WITHIN THE PRESCRIBED TIME-LIMIT Effective date: 20230503 Ref country code: PL Free format text: LAPSE BECAUSE OF FAILURE TO SUBMIT A TRANSLATION OF THE DESCRIPTION OR TO PAY THE FEE WITHIN THE PRESCRIBED TIME-LIMIT Effective date: 20230503 Ref country code: LV Free format text: LAPSE BECAUSE OF FAILURE TO SUBMIT A TRANSLATION OF THE DESCRIPTION OR TO PAY THE FEE WITHIN THE PRESCRIBED TIME-LIMIT Effective date: 20230503 Ref country code: LT Free format text: LAPSE BECAUSE OF FAILURE TO SUBMIT A TRANSLATION OF THE DESCRIPTION OR TO PAY THE FEE WITHIN THE PRESCRIBED TIME-LIMIT Effective date: 20230503 Ref country code: HR Free format text: LAPSE BECAUSE OF FAILURE TO SUBMIT A TRANSLATION OF THE DESCRIPTION OR TO PAY THE FEE WITHIN THE PRESCRIBED TIME-LIMIT Effective date: 20230503 Ref country code: GR Free format text: LAPSE BECAUSE OF FAILURE TO SUBMIT A TRANSLATION OF THE DESCRIPTION OR TO PAY THE FEE WITHIN THE PRESCRIBED TIME-LIMIT Effective date: 20230804 |
|
| PG25 | Lapsed in a contracting state [announced via postgrant information from national office to epo] |
Ref country code: SK Free format text: LAPSE BECAUSE OF FAILURE TO SUBMIT A TRANSLATION OF THE DESCRIPTION OR TO PAY THE FEE WITHIN THE PRESCRIBED TIME-LIMIT Effective date: 20230503 |
|
| PG25 | Lapsed in a contracting state [announced via postgrant information from national office to epo] |
Ref country code: SM Free format text: LAPSE BECAUSE OF FAILURE TO SUBMIT A TRANSLATION OF THE DESCRIPTION OR TO PAY THE FEE WITHIN THE PRESCRIBED TIME-LIMIT Effective date: 20230503 Ref country code: SK Free format text: LAPSE BECAUSE OF FAILURE TO SUBMIT A TRANSLATION OF THE DESCRIPTION OR TO PAY THE FEE WITHIN THE PRESCRIBED TIME-LIMIT Effective date: 20230503 Ref country code: RO Free format text: LAPSE BECAUSE OF FAILURE TO SUBMIT A TRANSLATION OF THE DESCRIPTION OR TO PAY THE FEE WITHIN THE PRESCRIBED TIME-LIMIT Effective date: 20230503 Ref country code: EE Free format text: LAPSE BECAUSE OF FAILURE TO SUBMIT A TRANSLATION OF THE DESCRIPTION OR TO PAY THE FEE WITHIN THE PRESCRIBED TIME-LIMIT Effective date: 20230503 |
|
| REG | Reference to a national code |
Ref country code: DE Ref legal event code: R097 Ref document number: 602018049254 Country of ref document: DE |
|
| PLBE | No opposition filed within time limit |
Free format text: ORIGINAL CODE: 0009261 |
|
| STAA | Information on the status of an ep patent application or granted ep patent |
Free format text: STATUS: NO OPPOSITION FILED WITHIN TIME LIMIT |
|
| PGFP | Annual fee paid to national office [announced via postgrant information from national office to epo] |
Ref country code: IS Payment date: 20240228 Year of fee payment: 7 |
|
| 26N | No opposition filed |
Effective date: 20240206 |
|
| PGFP | Annual fee paid to national office [announced via postgrant information from national office to epo] |
Ref country code: IE Payment date: 20240327 Year of fee payment: 7 Ref country code: NL Payment date: 20240326 Year of fee payment: 7 |