EP3588441A1 - Imagification of multivariate data sequences - Google Patents
Imagification of multivariate data sequences Download PDFInfo
- Publication number
- EP3588441A1 EP3588441A1 EP18181012.8A EP18181012A EP3588441A1 EP 3588441 A1 EP3588441 A1 EP 3588441A1 EP 18181012 A EP18181012 A EP 18181012A EP 3588441 A1 EP3588441 A1 EP 3588441A1
- Authority
- EP
- European Patent Office
- Prior art keywords
- variable
- image
- value
- data item
- color
- Prior art date
- Legal status (The legal status is an assumption and is not a legal conclusion. Google has not performed a legal analysis and makes no representation as to the accuracy of the status listed.)
- Granted
Links
- 238000000034 method Methods 0.000 claims abstract description 70
- 230000008569 process Effects 0.000 claims abstract description 29
- 239000003086 colorant Substances 0.000 claims abstract description 11
- 238000013528 artificial neural network Methods 0.000 claims abstract description 10
- 238000012545 processing Methods 0.000 claims description 27
- 238000003672 processing method Methods 0.000 claims description 14
- 238000001514 detection method Methods 0.000 claims description 7
- 230000002547 anomalous effect Effects 0.000 claims description 3
- 238000004590 computer program Methods 0.000 claims description 2
- 239000013598 vector Substances 0.000 description 30
- 238000013527 convolutional neural network Methods 0.000 description 18
- 238000010586 diagram Methods 0.000 description 10
- 230000015654 memory Effects 0.000 description 8
- 230000000694 effects Effects 0.000 description 6
- 238000013500 data storage Methods 0.000 description 4
- 238000013526 transfer learning Methods 0.000 description 4
- 238000013507 mapping Methods 0.000 description 3
- 238000007781 pre-processing Methods 0.000 description 3
- 238000012549 training Methods 0.000 description 3
- 238000004891 communication Methods 0.000 description 2
- 238000010801 machine learning Methods 0.000 description 2
- 230000007246 mechanism Effects 0.000 description 2
- 230000003287 optical effect Effects 0.000 description 2
- 230000009466 transformation Effects 0.000 description 2
- 241000251323 Matthiola oxyceras Species 0.000 description 1
- 230000001133 acceleration Effects 0.000 description 1
- 238000004458 analytical method Methods 0.000 description 1
- 238000013459 approach Methods 0.000 description 1
- 230000003247 decreasing effect Effects 0.000 description 1
- 238000005516 engineering process Methods 0.000 description 1
- 238000000605 extraction Methods 0.000 description 1
- 238000001914 filtration Methods 0.000 description 1
- 230000006870 function Effects 0.000 description 1
- 238000009499 grossing Methods 0.000 description 1
- 230000012447 hatching Effects 0.000 description 1
- 230000003993 interaction Effects 0.000 description 1
- 238000003058 natural language processing Methods 0.000 description 1
- 210000002569 neuron Anatomy 0.000 description 1
- 230000002093 peripheral effect Effects 0.000 description 1
- 238000011176 pooling Methods 0.000 description 1
- 238000011160 research Methods 0.000 description 1
- 238000005070 sampling Methods 0.000 description 1
- 239000007787 solid Substances 0.000 description 1
- 238000012360 testing method Methods 0.000 description 1
- 230000001131 transforming effect Effects 0.000 description 1
- 230000000007 visual effect Effects 0.000 description 1
Images


Classifications
-
- G—PHYSICS
- G06—COMPUTING; CALCULATING OR COUNTING
- G06T—IMAGE DATA PROCESSING OR GENERATION, IN GENERAL
- G06T11/00—2D [Two Dimensional] image generation
- G06T11/20—Drawing from basic elements, e.g. lines or circles
- G06T11/206—Drawing of charts or graphs
-
- G—PHYSICS
- G06—COMPUTING; CALCULATING OR COUNTING
- G06F—ELECTRIC DIGITAL DATA PROCESSING
- G06F18/00—Pattern recognition
- G06F18/20—Analysing
- G06F18/24—Classification techniques
- G06F18/243—Classification techniques relating to the number of classes
- G06F18/2433—Single-class perspective, e.g. one-against-all classification; Novelty detection; Outlier detection
-
- G—PHYSICS
- G06—COMPUTING; CALCULATING OR COUNTING
- G06V—IMAGE OR VIDEO RECOGNITION OR UNDERSTANDING
- G06V10/00—Arrangements for image or video recognition or understanding
- G06V10/40—Extraction of image or video features
- G06V10/44—Local feature extraction by analysis of parts of the pattern, e.g. by detecting edges, contours, loops, corners, strokes or intersections; Connectivity analysis, e.g. of connected components
- G06V10/443—Local feature extraction by analysis of parts of the pattern, e.g. by detecting edges, contours, loops, corners, strokes or intersections; Connectivity analysis, e.g. of connected components by matching or filtering
- G06V10/449—Biologically inspired filters, e.g. difference of Gaussians [DoG] or Gabor filters
- G06V10/451—Biologically inspired filters, e.g. difference of Gaussians [DoG] or Gabor filters with interaction between the filter responses, e.g. cortical complex cells
- G06V10/454—Integrating the filters into a hierarchical structure, e.g. convolutional neural networks [CNN]
-
- G—PHYSICS
- G06—COMPUTING; CALCULATING OR COUNTING
- G06V—IMAGE OR VIDEO RECOGNITION OR UNDERSTANDING
- G06V10/00—Arrangements for image or video recognition or understanding
- G06V10/70—Arrangements for image or video recognition or understanding using pattern recognition or machine learning
- G06V10/764—Arrangements for image or video recognition or understanding using pattern recognition or machine learning using classification, e.g. of video objects
-
- G—PHYSICS
- G06—COMPUTING; CALCULATING OR COUNTING
- G06V—IMAGE OR VIDEO RECOGNITION OR UNDERSTANDING
- G06V10/00—Arrangements for image or video recognition or understanding
- G06V10/70—Arrangements for image or video recognition or understanding using pattern recognition or machine learning
- G06V10/82—Arrangements for image or video recognition or understanding using pattern recognition or machine learning using neural networks
-
- G—PHYSICS
- G06—COMPUTING; CALCULATING OR COUNTING
- G06V—IMAGE OR VIDEO RECOGNITION OR UNDERSTANDING
- G06V40/00—Recognition of biometric, human-related or animal-related patterns in image or video data
- G06V40/10—Human or animal bodies, e.g. vehicle occupants or pedestrians; Body parts, e.g. hands
- G06V40/18—Eye characteristics, e.g. of the iris
- G06V40/193—Preprocessing; Feature extraction
Definitions
- the present invention relates to image processing, and in particular to the imagification of multivariate data sequences.
- Imagification is a process of representing records of data, or windows of multiple records in sequence, as images such that each record or window shares a one-to-one relationship with a corresponding image that may be used to classify, or make a prediction based on, that record or window using automated image recognition technology.
- imagification was designed to be combined with a Convolutional Neural Network based transfer learning approach which enables accurate automated classification with significantly less data than would normally be required.
- a neural network is a layered network of artificial units which map an input vector (in the input layer) to an output vector (in the output layer) according to numerical weights on edges between units. Weights are adjusted according to a training algorithm.
- a neural network with multiple layers is known as a Deep Neural Network (DNN).
- DNN Deep Neural Network
- a Convolutional Neural Network (CNN) is a particular type of DNN in which neurons in each layer are grouped into filters, each of which detects the presence or absence of different overlapping features in the input data.
- a multilayer neural network architecture of a CNN may comprise one or more convolutional layers, followed by sub-sampling layers (pooling) and one or more fully connected layers. DNNs, and in particular CNNs, have been proven in many tasks to be highly accurate at classifying images. By transforming non-image data into images, the classification accuracy of such networks may be harnessed and applied to arbitrary datasets.
- CNNs may be used to extract feature vectors (vectors of numbers that uniquely identify each image) from images. Because two similar images will have two similar vectors, a k-nearest-neighbours model (or any vector-based classifier) may classify images based on the similarity of a queried image's vector to vectors of images already seen by the model.
- a k-nearest-neighbours model or any vector-based classifier
- CNNs provide a powerful and accurate means of extracting features from images and using the extracted features to perform image recognition. The capability of a trained CNN to extract feature vectors in such a way extends to images that the CNN has never seen, even from different subject domains.
- Classifying trends in time series data had proved difficult in some domains such as finance (e.g. stock market prediction), as had categorization of features in time series data in other domains (such as classification of complex multi-activity data), but by representing this data as images and using pre-trained CNNs to extract complex features it is possible to use these features for prediction.
- image similarity methods can be used to retrieve similar time series data from the past, taking as input the feature vectors extracted from CNNs.
- Time series data is an example of a data sequence which may be multivariate. So that such data may be classified using CNNs performing direct classification, using CNN-based transfer learning, or using any other image classification method, it is necessary to transform multivariate data into images which accurately represent that data.
- EP3239897A1 proposes an imagification technique applied to multivariate data.
- the data is divided in to segments, according to a sliding window, and for each segment of data different color channels (e.g. Red, Green, Blue) are each mapped to a different continuous variable in that record, and the vector of those variables is mapped to the amplitude of the plot.
- color channels e.g. Red, Green, Blue
- multivariate data is imagified by mapping coordinates from each data point in a sequence to a value in some color space.
- x, y and (not shown) z values for acceleration are mapped to red, green and blue color values respectively in an RGB color space.
- the vector of the x, y, z values is plotted with the color produced by this mapping to produce an imagification window, as shown in Figure 2(a) of the accompanying drawings in which different colors are represented by different types of hatching.
- Other image attributes such as position of plot, pattern of plot, size of plot, shape of plot or transparency of plot, may be used instead of color to map data values.
- EP3239897A1 proposes that a transformation using the 3D time series L2 (Euclidean) norm at time T may be used to encode the height of the plot in the image.
- the L2-norm also written “ l 2 -norm"
- features are then extracted from such images so that the similarity between any two images, and therefore between the data points from which they were derived, may be calculated.
- Features may have a numeric or categorical value and are usually represented as an N-dimensional vector space for algorithmic processing (where N corresponds to the overall number of features). The goal is to establish an informative set of features that are able to represent the intrinsic properties of the data, while at the same time being sufficiently generic to avoid overfitting the model to a particular dataset.
- features may be extracted using a CNN or any other suitable feature extraction method, and similarity may be based on cosine distance or any other suitable distance metric.
- classification and anomaly detection are both possible using methods, such as k-nearest-neighbours, that classify based on similarity.
- a queried data point is classified as belonging to the class (e.g. "running” rather than "walking") in which members are closest to that queried point in feature space.
- anomaly detection a queried data point is regarded as anomalous if it is a certain distance in feature space (i.e. sufficiently dissimilar) from any known class.
- the shape of the plot (which may for example be used to represent energy) is symmetrical about the x-axis, which effectively duplicates information and thus makes the model longer to train and evaluate.
- the color is fixed column-wise, which prevents the encoding of extra information into the image.
- Bayes Error Rate may be degraded (in statistical classification, Bayes error rate is the lowest possible error rate for any classifier of a random outcome, for example into one of two categories, and is analogous to the irreducible error).
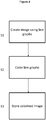
- An embodiment according to a first aspect may provide a computer-implemented image processing method comprising: for a specified multivariate data set, creating a digital image comprising a plurality of superimposed line graphs, each line graph corresponding to a different one of a plurality of variables in the multivariate data set and representing respective values of the variable concerned in successive data items of the multivariate data set; colorizing the created digital image by carrying out a colorization process for each data item of the multivariate data set, the colorization process comprising: for each variable having a positive value in the data item, assigning a color value to pixels representing an area under the line graph for that variable in dependence upon a color pre-allocated to that variable and a mean value of the data item; for each variable having a negative value in the data item, assigning a color value to pixels representing an area above the line graph for that variable in dependence upon a color pre-allocated to that variable and a mean value of the data item; and summing the color values for pixels where the areas for at least two
- An embodiment according to a second aspect provides image processing apparatus comprising: a digital image creator to create, for a specified multivariate data set, a digital image comprising a plurality of superimposed line graphs, each line graph corresponding to a different one of a plurality of variables in the multivariate data set and representing respective values of the variable concerned in successive data items of the multivariate data set; an image colorizer to colorize the created digital image by carrying out a colorization process for each data item of the multivariate data set, the colorization process comprising: for each variable having a positive value in the data item, assigning a color value to pixels representing an area under the line graph for that variable in dependence upon a color pre-allocated to that variable and a mean value of the data item; for each variable having a negative value in the data item, assigning a color value to pixels representing an area above the line graph for that variable in dependence upon a color pre-allocated to that variable and a mean value of the data item; and summing the color values for pixels where the areas
- An embodiment according to the first or second aspect may allow multivariate data sets to be transformed into images without any, or almost any, loss of information.
- a global multivariate data sequence may be encoded within an image without losing track of the evolution of each data sequence.
- assigning a color value may comprise: separating the variables according to whether the value for the variable in the data item is positive or negative; ordering all positive variable values for the data item from the largest value to the smallest value, and for the areas under the line graph corresponding to the positive variable values in order recursively assigning colors to the pixels of those areas; and ordering all negative variable values for the data item from the largest value to the smallest value, and for the areas above the line graph corresponding to the negative variable values in order recursively assigning colors to the pixels of those areas.
- the color for each variable may be assigned according to one of the ratio of the value of the variable over the mean value of the data item and the product of the value of the variable with the mean value of the data item.
- the mean value may be the L2 norm.
- An embodiment may provide a computer-implemented method for creating a visual representation of a multivariate data sequence (including but not limited to time series data sets) suitable for machine learning applications.
- an embodiment according to a third aspect may provide a data classification method to classify a multivariate data set, which method comprises: obtaining a colorized image, representing a multivariate data set to be classified, in accordance with the image processing method of the first aspect; inputting the colorized image and at least one pre-classified image into a deep neural network trained for image recognition for the purpose of data classification; comparing the colorized image with each pre-classified image; and classifying the multivariate data set in accordance with a degree of similarity between the colorized image and each pre-classified image.
- an embodiment according to a fourth aspect may provide an anomaly detection method to detect a potential anomaly in a multivariate data set, which method comprises: obtaining a colorized image, representing a multivariate data set under consideration, in accordance with the image processing method of the first aspect; inputting the colorized image and a pre-classified image into a deep neural network trained for image recognition for the purpose of data classification; comparing the colorized image with the pre-classified image; and classifying the multivariate data set as anomalous according to a degree of dissimilarity between the colorized image and the pre-classified image.
- an embodiment comprises a new image processing technique, which for convenience may be referred to hereafter as a "Multi Area Colorization Technique”.
- step S1 a digital image comprising a plurality of superimposed line graphs is created for a specified multivariate data set.
- Each line graph corresponds to a different one of a plurality of variables in the multivariate data set and represents respective values of the variable concerned in successive data items of the multivariate data set. For example, at each point on the horizontal axis of the line graph the height of the line graph above or below the horizontal axis represents the value of the variable for that data item.
- step S2 the digital image created in step S1 is colorized by carrying out a colorization process for each data item of the multivariate data set, as follows.
- a color value is assigned to pixels representing an area under the line graph for that variable in dependence upon a color pre-allocated to that variable and a mean value of the data item.
- a color value is assigned to pixels representing an area above the line graph for that variable in dependence upon a color pre-allocated to that variable and a mean value of the data item. The color values for pixels where the areas for at least two of the line graphs overlap are summed. In step S3 the colorized image is stored.
- Image processing apparatus 10 for carrying out the method of Figure 4 is shown in Figure 5 .
- Apparatus 10 comprises a digital image creator 11, an image colorizer 12 and image storage 20.
- Digital image creator 11 is configured to create, for a specified multivariate data set, a digital image comprising a plurality of superimposed line graphs. Each line graph corresponds to a different one of a plurality of variables in the multivariate data set and represents respective values of the variable concerned in successive data items of the multivariate data set.
- Image colorizer 12 is configured to colorize the created digital image by carrying out a colorization process for each data item of the multivariate data set, as follows.
- Image storage 20 is configured to store the colorized image.
- FIG. 6 is a flowchart of a method for predicting trends in time series data.
- the method may be considered to comprise three distinct processes: image processing (P61), classifier training (P62), and trend prediction (P63). It is with the first of these, image processing, that the present application is concerned.
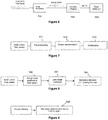
- FIG. 7 is a diagram illustrating an embodiment of the image processing process P61, which may be considered to comprise three steps: pre-processing (step S71), shape representation (step S72) and colorization (step S73).
- FIG 8 is a flow chart of the pre-processing step S71.
- each of the x, y and z axes is allocated a fixed position in the color channel space of the image. This allocation may be done randomly as long as it is used consistently for the entire data set. Where (as in this example) the number of variables (axes) in the data set is less than or equal to three, it is appropriate to use RGB color channel space. However, for higher dimensions (N-time series) a color space other than RGB may be more appropriate.
- HSV, HSL and HSP are alternative representations of the RGB color model, designed so as to align more closely with the way human vision perceives color-making attributes, which may be particularly suitable for higher dimensions. Each color will be chosen to make sure that any superposition does not re-create an already-selected color.
- step S81 from each item of data its own mean is removed in order to zero-center the data.
- the data values may also be divided, at step S82, by the maximum value of the L2 (Euclidean) norm in order for them to remain in the interval [-1, 1].
- FIG 9 is a flow chart of the shape representation process (step S72).
- step S90 the pre-processed data set output from the pre-processing step S71 is represented as lines on a graph. The values in the data set are plotted separately for each variable (axis). The resulting line graphs are intermediate images of the kind which, if displayed, would appear similar to one of those shown in Figures 10(a) and 10(b) .
- Figure 11 is a flow chart of the colorization process (step S73).
- the colorization process involves encoding the angle/direction of the vectors (x, y, z) as colors within the plotted line graphs.
- step S111 for a vector (x, y. z) the variables are separated according to whether the value for the variable is positive or negative.
- step S112 any positive values are ordered from the biggest to the smallest and, separately, any negative values are ordered from the biggest to the smallest.
- step S113 the portions of the graph between the line and the horizontal axis which correspond to the positive values and the portions of the graph between the line and the horizontal axis which correspond to the negative values, are colored. If a plotting library is used to color the graph portions recursively, the graph portions corresponding to the positive values are recursively colored independently to the graph portions corresponding to the negative values.
- the re-ordering step S112 is carried out in order to allow use of a plotting library, with which it is only possible to draw a given rectangle with a given color. However, this step is not essential if some other means are used to color the areas under the graphs.
- This colorization process is carried out for all vectors in turn until the entire image has been colored.
- the color for each variable is chosen according to the ratio or product of the value of the variable over or with a norm of the variable values for the vector.
- the colors are summed in order to retain relative information about the value of each variable.
- the pixels of the graph portion above the line graph for y having negative height -5 are given the color corresponding to (5/30)*255. In this way a colorful image representing almost all details of the multivariate data set is achieved.
- the image in this case may not represent all details of the data set as the mean of each data set is lost when the values are re-centered around zero to fit into the image.
- Figures 12(a) and 12(b) show in corresponding grayscale images created by the the afore-mentioned colorization process so as to correspond to the intermediate images of Figures 10(a) and 10(b) respectively.
- Another image representing a data set different from that of Figures 10(a) / 12(a) and 10(b)/12(b) is shown in Figure 13 , where for improved clarity only a very coarse grayscale has been used.
- a color image produced by the afore-mentioned technique may be composed of a very large number of different colors, for example 256 where the pixel color value range is 0 to 255.
- a data set After a data set has been imagified as discussed, it may be classified and/or tested for anomalies as described earlier with reference to Figures 3(a) and 3(b) or by using any other technique capable of such tasks.
- the images may for example be processed using a classification system 30 as described with reference to Figure 13 .
- Figure 14 is a block diagram of a classification system 30 configured to receive images, image 1 and image 2, from image storage 20.
- Image 1 may correspond to a data set which has already been classified, whilst image 2 may correspond to a data requiring classification.
- Each image is input into a feature extractor 31, in this example a convolutional neural network (CNN), in order to extract from the images respective feature vectors, feature vector 1 and feature vector 2, which represent the features of the images.
- the feature vectors are input into a similarity determination device 32 which determines the similarity between the feature vectors, and hence the respective corresponding windows of data, based on cosine distance or any other suitable distance metric.
- classification and anomaly detection may subsequently be carried out using methods, such as k-nearest-neighbours, that classify based on similarity.
- Multi Area Colorization Technique is to the analysis of human activities recorded through wearable and smart sensors. This particular usage is well suited to imagification, where it becomes possible to classify activities based on images where it was not possible when considering the sequence of raw data. Using the above-described technique, itmay be possible to get an approximation of Bayes Error Rate and for a human to then classify different activities more easily.
- Figures 10(a) and (b) and 12(a) and (b) were created as examples during a machine learning project on a data set known as the UCI Daily and Sports Activities Data Set.
- the data set comprises motion sensor data of 19 daily and sports activities each performed by 8 subjects in their own style for 5 minutes.
- Five Xsens MTx units were used on the torso, arms, and legs.
- the motion sensor time series were imagified using the above described technique and used for further classification.
- the process might also be applied to other representation data format as embeddings.
- other representation data format For example, in natural language processing, it is possible to obtain a vector representation of a word.
- the vector representation contains real values that may be considered as time series values, and these values may then be plotted as an image using the above-mentioned technique.
- the imagification may be applied to any embedding. For example, the imagification may be applied over a graph embedding.
- Figure 15 is a block diagram of a computing device, such as a data storage server, which embodies the present invention, and which may be used to implement some or all of the steps of a method embodying the present invention, and perform some or all of the tasks of apparatus of an embodiment.
- the computing device of Figure 15 may be used to implement all the steps of the image processing method illustrated in Figure 4 and perform all the tasks of the image processing apparatus shown in Figure 5 , or only to implement the colorization technique of Figure 11 and only to perform the tasks of the image colorizer 12 in Figure 5 .
- the computing device comprises a processor 993, and memory, 994.
- the computing device also includes a network interface 997 for communication with other such computing devices, for example with other computing devices of invention embodiments.
- an embodiment may be composed of a network of such computing devices.
- the computing device also includes one or more input mechanisms such as keyboard and mouse 996, and a display unit such as one or more monitors 995.
- the components are connectable to one another via a bus 992.
- the memory 994 which may for example carry out the tasks of computer storage 20 in the image processing apparatus, may include a computer readable medium, which term may refer to a single medium or multiple media (e.g., a centralized or distributed database and/or associated caches and servers) configured to carry computer-executable instructions or have data structures stored thereon.
- Computer-executable instructions may include, for example, instructions and data accessible by and causing a general purpose computer, special purpose computer, or special purpose processing device (e.g., one or more processors) to perform one or more functions or operations.
- computer-readable storage medium may also include any medium that is capable of storing, encoding or carrying a set of instructions for execution by the machine and that cause the machine to perform any one or more of the methods of the present disclosure.
- the term “computer-readable storage medium” may accordingly be taken to include, but not be limited to, solid-state memories, optical media and magnetic media.
- such computer-readable media may include non-transitory computer-readable storage media, including Random Access Memory (RAM), Read-Only Memory (ROM), Electrically Erasable Programmable Read-Only Memory (EEPROM), Compact Disc Read-Only Memory (CD-ROM) or other optical disk storage, magnetic disk storage or other magnetic storage devices, flash memory devices (e.g., solid state memory devices).
- the processor 993 is configured to control the computing device and execute processing operations, for example executing computer program code stored in the memory 994 to implement the methods described with reference to Figures 4 , 7, 8, 9 and/or 11 and defined in the claims.
- the memory 994 stores data being read and written by the processor 993.
- a processor may include one or more general-purpose processing devices such as a microprocessor, central processing unit, or the like.
- the processor may include a complex instruction set computing (CISC) microprocessor, reduced instruction set computing (RISC) microprocessor, very long instruction word (VLIW) microprocessor, or a processor implementing other instruction sets or processors implementing a combination of instruction sets.
- CISC complex instruction set computing
- RISC reduced instruction set computing
- VLIW very long instruction word
- the processor may also include one or more special-purpose processing devices such as an application specific integrated circuit (ASIC), a field programmable gate array (FPGA), a digital signal processor (DSP), network processor, or the like.
- ASIC application specific integrated circuit
- FPGA field programmable gate array
- DSP digital signal processor
- a processor is configured to execute instructions for performing the operations and steps discussed herein.
- the display unit 995 may display a representation of data stored by the computing device and may also display a cursor and dialog boxes and screens enabling interaction between a user and the programs and data stored on the computing device. For example, the display unit 995 may display the multivariate data to be imagified and the resulting images.
- the input mechanisms 996 may enable a user to input data, such as the multivariate data to be imagified, and instructions to the computing device.
- the network interface (network I/F) 997 may be connected to a network, such as the Internet, and is connectable to other such computing devices via the network, such as the classification system 30.
- the network I/F 997 may control data input/output from/to other apparatus via the network.
- peripheral devices such as microphone, speakers, printer, power supply unit, fan, case, scanner, trackerball etc may be included in the computing device.
- Methods embodying the present invention may be carried out on a computing device such as that illustrated in Figure 15 .
- a computing device need not have every component illustrated in Figure 15 , and may be composed of a subset of those components.
- a method embodying the present invention may be carried out by a single computing device in communication with one or more data storage servers via a network.
- the computing device may be a data storage itself storing at least a portion of the data.
- a method embodying the present invention may be carried out by a plurality of computing devices operating in cooperation with one another.
- One or more of the plurality of computing devices may be a data storage server storing at least a portion of the data.
Abstract
Description
- The present invention relates to image processing, and in particular to the imagification of multivariate data sequences.
- Imagification is a process of representing records of data, or windows of multiple records in sequence, as images such that each record or window shares a one-to-one relationship with a corresponding image that may be used to classify, or make a prediction based on, that record or window using automated image recognition technology. In particular, imagification was designed to be combined with a Convolutional Neural Network based transfer learning approach which enables accurate automated classification with significantly less data than would normally be required.
- A neural network is a layered network of artificial units which map an input vector (in the input layer) to an output vector (in the output layer) according to numerical weights on edges between units. Weights are adjusted according to a training algorithm. A neural network with multiple layers is known as a Deep Neural Network (DNN). A Convolutional Neural Network (CNN) is a particular type of DNN in which neurons in each layer are grouped into filters, each of which detects the presence or absence of different overlapping features in the input data. As shown in
Figure 1 of the accompanying drawings, a multilayer neural network architecture of a CNN may comprise one or more convolutional layers, followed by sub-sampling layers (pooling) and one or more fully connected layers. DNNs, and in particular CNNs, have been proven in many tasks to be highly accurate at classifying images. By transforming non-image data into images, the classification accuracy of such networks may be harnessed and applied to arbitrary datasets. - Furthermore, in addition to classification, CNNs may be used to extract feature vectors (vectors of numbers that uniquely identify each image) from images. Because two similar images will have two similar vectors, a k-nearest-neighbours model (or any vector-based classifier) may classify images based on the similarity of a queried image's vector to vectors of images already seen by the model. Recent research has demonstrated that CNNs provide a powerful and accurate means of extracting features from images and using the extracted features to perform image recognition. The capability of a trained CNN to extract feature vectors in such a way extends to images that the CNN has never seen, even from different subject domains. The process of applying a trained neural network (or indeed any model) to a problem of a different but similar domain is called 'transfer learning', and enables a solution to the new problem to be trained with significantly less data than would otherwise be required. Therefore, transfer learning through CNNs trained on arbitrary images provides a way to classify imagified data samples, even when taken from relatively small datasets.
- Classifying trends in time series data had proved difficult in some domains such as finance (e.g. stock market prediction), as had categorization of features in time series data in other domains (such as classification of complex multi-activity data), but by representing this data as images and using pre-trained CNNs to extract complex features it is possible to use these features for prediction. In particular, given an image of time series data within a given time window, image similarity methods can be used to retrieve similar time series data from the past, taking as input the feature vectors extracted from CNNs.
- Time series data is an example of a data sequence which may be multivariate. So that such data may be classified using CNNs performing direct classification, using CNN-based transfer learning, or using any other image classification method, it is necessary to transform multivariate data into images which accurately represent that data.
-
EP3239897A1 , the content of which is hereby incorporated by reference, proposes an imagification technique applied to multivariate data. In this technique the data is divided in to segments, according to a sliding window, and for each segment of data different color channels (e.g. Red, Green, Blue) are each mapped to a different continuous variable in that record, and the vector of those variables is mapped to the amplitude of the plot. - That is, multivariate data is imagified by mapping coordinates from each data point in a sequence to a value in some color space. For example, as shown in
Figure 2(b) of the accompanying drawings, x, y and (not shown) z values for acceleration, e.g. as measured by a wrist-worn accelerometer, are mapped to red, green and blue color values respectively in an RGB color space. For each data point in the sequence, the vector of the x, y, z values is plotted with the color produced by this mapping to produce an imagification window, as shown inFigure 2(a) of the accompanying drawings in which different colors are represented by different types of hatching. Other image attributes, such as position of plot, pattern of plot, size of plot, shape of plot or transparency of plot, may be used instead of color to map data values. -
EP3239897A1 proposes that a transformation using the 3D time series L2 (Euclidean) norm at time T may be used to encode the height of the plot in the image. The L2-norm (also written "l 2-norm") |x| is a vector norm defined for a vector
- After multivariate data sequences are converted into images, features are then extracted from such images so that the similarity between any two images, and therefore between the data points from which they were derived, may be calculated. Features may have a numeric or categorical value and are usually represented as an N-dimensional vector space for algorithmic processing (where N corresponds to the overall number of features). The goal is to establish an informative set of features that are able to represent the intrinsic properties of the data, while at the same time being sufficiently generic to avoid overfitting the model to a particular dataset.
- Features may be extracted using a CNN or any other suitable feature extraction method, and similarity may be based on cosine distance or any other suitable distance metric. Based on the similarity between a queried, unclassified image and images classified earlier, classification and anomaly detection are both possible using methods, such as k-nearest-neighbours, that classify based on similarity. As shown in
Figure 3(a) of the accompanying drawings, for classification a queried data point is classified as belonging to the class (e.g. "running" rather than "walking") in which members are closest to that queried point in feature space. As shown inFigure 3(b) of the accompanying drawings, for anomaly detection a queried data point is regarded as anomalous if it is a certain distance in feature space (i.e. sufficiently dissimilar) from any known class. - However, it is desirable to improve upon the method proposed in
EP3239897A1 . In particular, by using the L2 (Euclidean) norm of the vector for determining the size of the plot in the image, information on how each value of the vector varies independently along its respective axis may be lost. In addition, by using the square of each value in the L2 norm, where values on a given axis have a higher mean than others the other axis will not be used in the same proportion as the one with the higher mean, creating a possible square bias between the training and test datasets. Information on the vector direction may also be lost as the L2 norm does not retain any negative values. Furthermore, the shape of the plot (which may for example be used to represent energy) is symmetrical about the x-axis, which effectively duplicates information and thus makes the model longer to train and evaluate. Finally, the color is fixed column-wise, which prevents the encoding of extra information into the image. - If information is lost in the image transformation process proposed in
EP3239897A1 , the Bayes Error Rate may be degraded (in statistical classification, Bayes error rate is the lowest possible error rate for any classifier of a random outcome, for example into one of two categories, and is analogous to the irreducible error). - It is desirable to provide a solution to this and/or the other above-mentioned problems in the prior art imagification method.
- An embodiment according to a first aspect may provide a computer-implemented image processing method comprising: for a specified multivariate data set, creating a digital image comprising a plurality of superimposed line graphs, each line graph corresponding to a different one of a plurality of variables in the multivariate data set and representing respective values of the variable concerned in successive data items of the multivariate data set; colorizing the created digital image by carrying out a colorization process for each data item of the multivariate data set, the colorization process comprising: for each variable having a positive value in the data item, assigning a color value to pixels representing an area under the line graph for that variable in dependence upon a color pre-allocated to that variable and a mean value of the data item; for each variable having a negative value in the data item, assigning a color value to pixels representing an area above the line graph for that variable in dependence upon a color pre-allocated to that variable and a mean value of the data item; and summing the color values for pixels where the areas for at least two of the line graphs overlap; and storing the colorized image.
- An embodiment according to a second aspect provides image processing apparatus comprising: a digital image creator to create, for a specified multivariate data set, a digital image comprising a plurality of superimposed line graphs, each line graph corresponding to a different one of a plurality of variables in the multivariate data set and representing respective values of the variable concerned in successive data items of the multivariate data set; an image colorizer to colorize the created digital image by carrying out a colorization process for each data item of the multivariate data set, the colorization process comprising: for each variable having a positive value in the data item, assigning a color value to pixels representing an area under the line graph for that variable in dependence upon a color pre-allocated to that variable and a mean value of the data item; for each variable having a negative value in the data item, assigning a color value to pixels representing an area above the line graph for that variable in dependence upon a color pre-allocated to that variable and a mean value of the data item; and summing the color values for pixels where the areas for at least two of the line graphs overlap; and image storage to store the colorized image.
- An embodiment according to the first or second aspect may allow multivariate data sets to be transformed into images without any, or almost any, loss of information. In particular, a global multivariate data sequence may be encoded within an image without losing track of the evolution of each data sequence.
- In the above-described first and second aspects, assigning a color value may comprise: separating the variables according to whether the value for the variable in the data item is positive or negative; ordering all positive variable values for the data item from the largest value to the smallest value, and for the areas under the line graph corresponding to the positive variable values in order recursively assigning colors to the pixels of those areas; and ordering all negative variable values for the data item from the largest value to the smallest value, and for the areas above the line graph corresponding to the negative variable values in order recursively assigning colors to the pixels of those areas.
- In the above-described first and second aspects, the color for each variable may be assigned according to one of the ratio of the value of the variable over the mean value of the data item and the product of the value of the variable with the mean value of the data item.
- In the above-described first and second aspects, the mean value may be the L2 norm.
- An embodiment may provide a computer-implemented method for creating a visual representation of a multivariate data sequence (including but not limited to time series data sets) suitable for machine learning applications.
- In particular, an embodiment according to a third aspect may provide a data classification method to classify a multivariate data set, which method comprises: obtaining a colorized image, representing a multivariate data set to be classified, in accordance with the image processing method of the first aspect; inputting the colorized image and at least one pre-classified image into a deep neural network trained for image recognition for the purpose of data classification; comparing the colorized image with each pre-classified image; and classifying the multivariate data set in accordance with a degree of similarity between the colorized image and each pre-classified image.
- Similarly, an embodiment according to a fourth aspect may provide an anomaly detection method to detect a potential anomaly in a multivariate data set, which method comprises: obtaining a colorized image, representing a multivariate data set under consideration, in accordance with the image processing method of the first aspect; inputting the colorized image and a pre-classified image into a deep neural network trained for image recognition for the purpose of data classification; comparing the colorized image with the pre-classified image; and classifying the multivariate data set as anomalous according to a degree of dissimilarity between the colorized image and the pre-classified image.
- Reference will now be made, by way of example, to the accompanying drawings, in which:
-
Figure 1 (described above) is a diagram for use in explaining the stages of a convolutional neural network; -
Figures 2(a) and 2(b) (described above) are diagrams for use in explaining a previously-proposed imagification technique; -
Figures 3(a) and 3(b) (described above) are diagrams for use in explaining respectively classification and anomaly detection using images; -
Figure 4 is a flowchart of an image processing method according to an embodiment; -
Figure 5 is a diagram of image processing apparatus according to an embodiment; -
Figure 6 is a flowchart of a method for predicting trends in time series data; -
Figure 7 is a diagram illustrating an embodiment of an image processing process; -
Figure 8 is a flow chart of the first step of the image processing process ofFigure 7 ; -
Figure 9 is a flow chart of the second step of the image processing process ofFigure 7 ; -
Figures 10(a) and 10(b) are examples of intermediate images resulting from the second step of the image processing process ofFigure 7 ; -
Figure 11 is a flow chart of the third step of the image processing process ofFigure 7 ; -
Figures 12(a) and 12(b) are examples of images resulting from the third step of the image processing process ofFigure 7 ; -
Figure 13 is another example of an image resulting from the third step of the image processing process ofFigure 7 ; -
Figure 14 is a block diagram of a classification system; and -
Figure 15 is a block diagram of a computing device suitable for carrying out a method according to an embodiment. - As discussed above it is desirable to achieve an efficient representation of a multivariate sequence of data within images whilst retaining as much of the original data as possible.
- To this end an embodiment comprises a new image processing technique, which for convenience may be referred to hereafter as a "Multi Area Colorization Technique".
- A flowchart of a computer-implemented image processing method according to an embodiment of the Multi Area Colorization Technique is shown in
Figure 4 . In step S1 a digital image comprising a plurality of superimposed line graphs is created for a specified multivariate data set. Each line graph corresponds to a different one of a plurality of variables in the multivariate data set and represents respective values of the variable concerned in successive data items of the multivariate data set. For example, at each point on the horizontal axis of the line graph the height of the line graph above or below the horizontal axis represents the value of the variable for that data item. In step S2 the digital image created in step S1 is colorized by carrying out a colorization process for each data item of the multivariate data set, as follows. For each variable having a positive value in the data item, a color value is assigned to pixels representing an area under the line graph for that variable in dependence upon a color pre-allocated to that variable and a mean value of the data item. For each variable having a negative value in the data item, a color value is assigned to pixels representing an area above the line graph for that variable in dependence upon a color pre-allocated to that variable and a mean value of the data item. The color values for pixels where the areas for at least two of the line graphs overlap are summed. In step S3 the colorized image is stored. -
Image processing apparatus 10 for carrying out the method ofFigure 4 is shown inFigure 5 .Apparatus 10 comprises adigital image creator 11, animage colorizer 12 andimage storage 20.Digital image creator 11 is configured to create, for a specified multivariate data set, a digital image comprising a plurality of superimposed line graphs. Each line graph corresponds to a different one of a plurality of variables in the multivariate data set and represents respective values of the variable concerned in successive data items of the multivariate data set.Image colorizer 12 is configured to colorize the created digital image by carrying out a colorization process for each data item of the multivariate data set, as follows. For each variable having a positive value in the data item, a color value is assigned to pixels representing an area under the line graph for that variable in dependence upon a color pre-allocated to that variable and a mean value of the data item. For each variable having a negative value in the data item, a color value is assigned to pixels representing an area above the line graph for that variable in dependence upon a color pre-allocated to that variable and a mean value of the data item. The color values for pixels where the areas for at least two of the line graphs overlap are summed.Image storage 20 is configured to store the colorized image. - A specific embodiment will now be described with reference to imagification of a multivariate data set comprising time series data with three variables, namely movement along the x-, y- and z-axes, for use in predicting trends in the data set.
Figure 6 is a flowchart of a method for predicting trends in time series data. The method may be considered to comprise three distinct processes: image processing (P61), classifier training (P62), and trend prediction (P63). It is with the first of these, image processing, that the present application is concerned. -
Figure 7 is a diagram illustrating an embodiment of the image processing process P61, which may be considered to comprise three steps: pre-processing (step S71), shape representation (step S72) and colorization (step S73). -
Figure 8 is a flow chart of the pre-processing step S71. At step S80 each of the x, y and z axes is allocated a fixed position in the color channel space of the image. This allocation may be done randomly as long as it is used consistently for the entire data set. Where (as in this example) the number of variables (axes) in the data set is less than or equal to three, it is appropriate to use RGB color channel space. However, for higher dimensions (N-time series) a color space other than RGB may be more appropriate. For example, HSV, HSL and HSP are alternative representations of the RGB color model, designed so as to align more closely with the way human vision perceives color-making attributes, which may be particularly suitable for higher dimensions. Each color will be chosen to make sure that any superposition does not re-create an already-selected color. - Depending upon the nature of the multivariate data set, it may be desirable then to apply filtering, a de-noiser, or a smoother, etc., in order to achieve smoother representation. For example, at step S81 from each item of data its own mean is removed in order to zero-center the data. Such smoothing is optional if the ratio of the means over their variation is small (for example, means = [0.1, 0.01, 0.5] with variations greater than 1).The data values may also be divided, at step S82, by the maximum value of the L2 (Euclidean) norm in order for them to remain in the interval [-1, 1].
-
Figure 9 is a flow chart of the shape representation process (step S72). In step S90 the pre-processed data set output from the pre-processing step S71 is represented as lines on a graph. The values in the data set are plotted separately for each variable (axis). The resulting line graphs are intermediate images of the kind which, if displayed, would appear similar to one of those shown inFigures 10(a) and 10(b) . -
Figure 11 is a flow chart of the colorization process (step S73). In this example, the colorization process involves encoding the angle/direction of the vectors (x, y, z) as colors within the plotted line graphs. - Firstly, at step S111, for a vector (x, y. z) the variables are separated according to whether the value for the variable is positive or negative.
- Then, at step S112, any positive values are ordered from the biggest to the smallest and, separately, any negative values are ordered from the biggest to the smallest.
- Finally, at step S113, the portions of the graph between the line and the horizontal axis which correspond to the positive values and the portions of the graph between the line and the horizontal axis which correspond to the negative values, are colored. If a plotting library is used to color the graph portions recursively, the graph portions corresponding to the positive values are recursively colored independently to the graph portions corresponding to the negative values.
- The re-ordering step S112 is carried out in order to allow use of a plotting library, with which it is only possible to draw a given rectangle with a given color. However, this step is not essential if some other means are used to color the areas under the graphs.
- This colorization process is carried out for all vectors in turn until the entire image has been colored.
- In each case the color for each variable is chosen according to the ratio or product of the value of the variable over or with a norm of the variable values for the vector. Any norm can be used, e.g. X = f(X)/norm(f(X)) with X = [x, y, z], providing the norm of X[t] = 1, for example the L2 (Euclidean) norm. When graph portions corresponding to different variables are superimposed, the colors are summed in order to retain relative information about the value of each variable. For example, with the mapping {x:r, y:g, z:b}, for data set X = [1, -5, 2] the L2-norm is 30. Therefore, with a pixel color value range of 0 to 255:


- Accordingly, firstly the pixels of the graph portion under the line graph for z having
positive height 2 are given the color correspondng to (2/30)*255 (=B). Then the pixels of the graph portion under the line graph for x havingpositive height 1 are given the color corresponding to (3/30)*255 (= R+B). The pixels of the graph portion above the line graph for y having negative height -5 are given the color corresponding to (5/30)*255. In this way a colorful image representing almost all details of the multivariate data set is achieved. - The image in this case may not represent all details of the data set as the mean of each data set is lost when the values are re-centered around zero to fit into the image.
- One drawback is that this method is sensitive to noise around the mean. If the means were conserved as metadata, there would be a bijection between the time series and image + metadata.
- Unfortunately it is not possible in this patent application to present color images, but
Figures 12(a) and 12(b) show in corresponding grayscale images created by the the afore-mentioned colorization process so as to correspond to the intermediate images ofFigures 10(a) and 10(b) respectively. Another image representing a data set different from that ofFigures 10(a) /12(a) and10(b)/12(b) is shown inFigure 13 , where for improved clarity only a very coarse grayscale has been used. However it should be understood that in practice a color image produced by the afore-mentioned technique may be composed of a very large number of different colors, for example 256 where the pixel color value range is 0 to 255. - The above-mentioned technique may for example be implemented using the following image processing algorithm:
- Fixed randomly attribution:
- r -> 'x'
- g -> 'y'
- b -> 'z'
- For 3D_times_series in dataset:
- x, y, x = 3D_times_series
- x, y, x = x-mean(x), y-mean(y), z-mean(z)
- ###
- Preprocess possible
- ###
- For index, triplet in (x, y, z)
- norm = norm(triplet)
- PositiveorderedIndex = orderIndex(triplet > 0, 'increasing')
- NegativeorderedIndex = orderIndex(triplet < 0, 'decreasing)
- OrderFillUp(PositiveorderedIndex, (x,y,z,norm))
- OrderFillUp(NegativeorderedIndex, (x,y,z,norm))
- After a data set has been imagified as discussed, it may be classified and/or tested for anomalies as described earlier with reference to
Figures 3(a) and 3(b) or by using any other technique capable of such tasks. The images may for example be processed using aclassification system 30 as described with reference toFigure 13 . -
Figure 14 is a block diagram of aclassification system 30 configured to receive images,image 1 andimage 2, fromimage storage 20.Image 1 may correspond to a data set which has already been classified, whilstimage 2 may correspond to a data requiring classification. Each image is input into afeature extractor 31, in this example a convolutional neural network (CNN), in order to extract from the images respective feature vectors,feature vector 1 andfeature vector 2, which represent the features of the images. The feature vectors are input into asimilarity determination device 32 which determines the similarity between the feature vectors, and hence the respective corresponding windows of data, based on cosine distance or any other suitable distance metric. Based on the similarity between the unclassified image and one or more images classified earlier, classification and anomaly detection may subsequently be carried out using methods, such as k-nearest-neighbours, that classify based on similarity. - One application of the Multi Area Colorization Technique is to the analysis of human activities recorded through wearable and smart sensors. This particular usage is well suited to imagification, where it becomes possible to classify activities based on images where it was not possible when considering the sequence of raw data. Using the above-described technique, itmay be possible to get an approximation of Bayes Error Rate and for a human to then classify different activities more easily.
-
Figures 10(a) and (b) and12(a) and (b) were created as examples during a machine learning project on a data set known as the UCI Daily and Sports Activities Data Set. The data set comprises motion sensor data of 19 daily and sports activities each performed by 8 subjects in their own style for 5 minutes. Five Xsens MTx units were used on the torso, arms, and legs. The motion sensor time series were imagified using the above described technique and used for further classification. - The process might also be applied to other representation data format as embeddings. For example, in natural language processing, it is possible to obtain a vector representation of a word. The vector representation contains real values that may be considered as time series values, and these values may then be plotted as an image using the above-mentioned technique. Moreover, the imagification may be applied to any embedding. For example, the imagification may be applied over a graph embedding.
-
Figure 15 is a block diagram of a computing device, such as a data storage server, which embodies the present invention, and which may be used to implement some or all of the steps of a method embodying the present invention, and perform some or all of the tasks of apparatus of an embodiment. For example, the computing device ofFigure 15 may be used to implement all the steps of the image processing method illustrated inFigure 4 and perform all the tasks of the image processing apparatus shown inFigure 5 , or only to implement the colorization technique ofFigure 11 and only to perform the tasks of theimage colorizer 12 inFigure 5 . - The computing device comprises a
processor 993, and memory, 994. Optionally, the computing device also includes anetwork interface 997 for communication with other such computing devices, for example with other computing devices of invention embodiments. - For example, an embodiment may be composed of a network of such computing devices. Optionally, the computing device also includes one or more input mechanisms such as keyboard and
mouse 996, and a display unit such as one or more monitors 995. The components are connectable to one another via abus 992. - The
memory 994, which may for example carry out the tasks ofcomputer storage 20 in the image processing apparatus, may include a computer readable medium, which term may refer to a single medium or multiple media (e.g., a centralized or distributed database and/or associated caches and servers) configured to carry computer-executable instructions or have data structures stored thereon. Computer-executable instructions may include, for example, instructions and data accessible by and causing a general purpose computer, special purpose computer, or special purpose processing device (e.g., one or more processors) to perform one or more functions or operations. Thus, the term "computer-readable storage medium" may also include any medium that is capable of storing, encoding or carrying a set of instructions for execution by the machine and that cause the machine to perform any one or more of the methods of the present disclosure. The term "computer-readable storage medium" may accordingly be taken to include, but not be limited to, solid-state memories, optical media and magnetic media. By way of example, and not limitation, such computer-readable media may include non-transitory computer-readable storage media, including Random Access Memory (RAM), Read-Only Memory (ROM), Electrically Erasable Programmable Read-Only Memory (EEPROM), Compact Disc Read-Only Memory (CD-ROM) or other optical disk storage, magnetic disk storage or other magnetic storage devices, flash memory devices (e.g., solid state memory devices). - The
processor 993 is configured to control the computing device and execute processing operations, for example executing computer program code stored in thememory 994 to implement the methods described with reference toFigures 4 ,7, 8, 9 and/or 11 and defined in the claims. Thememory 994 stores data being read and written by theprocessor 993. As referred to herein, a processor may include one or more general-purpose processing devices such as a microprocessor, central processing unit, or the like. The processor may include a complex instruction set computing (CISC) microprocessor, reduced instruction set computing (RISC) microprocessor, very long instruction word (VLIW) microprocessor, or a processor implementing other instruction sets or processors implementing a combination of instruction sets. The processor may also include one or more special-purpose processing devices such as an application specific integrated circuit (ASIC), a field programmable gate array (FPGA), a digital signal processor (DSP), network processor, or the like. In one or more embodiments, a processor is configured to execute instructions for performing the operations and steps discussed herein. - The
display unit 995 may display a representation of data stored by the computing device and may also display a cursor and dialog boxes and screens enabling interaction between a user and the programs and data stored on the computing device. For example, thedisplay unit 995 may display the multivariate data to be imagified and the resulting images. Theinput mechanisms 996 may enable a user to input data, such as the multivariate data to be imagified, and instructions to the computing device. - The network interface (network I/F) 997 may be connected to a network, such as the Internet, and is connectable to other such computing devices via the network, such as the
classification system 30. The network I/F 997 may control data input/output from/to other apparatus via the network. - Other peripheral devices such as microphone, speakers, printer, power supply unit, fan, case, scanner, trackerball etc may be included in the computing device.
- Methods embodying the present invention may be carried out on a computing device such as that illustrated in
Figure 15 . Such a computing device need not have every component illustrated inFigure 15 , and may be composed of a subset of those components. A method embodying the present invention may be carried out by a single computing device in communication with one or more data storage servers via a network. The computing device may be a data storage itself storing at least a portion of the data. - A method embodying the present invention may be carried out by a plurality of computing devices operating in cooperation with one another. One or more of the plurality of computing devices may be a data storage server storing at least a portion of the data.
- The above-described embodiments of the present invention may advantageously be used independently of any other of the embodiments or in any feasible combination with one or more others of the embodiments.
Claims (11)
- A computer-implemented image processing method comprising:for a specified multivariate data set, creating a digital image comprising a plurality of superimposed line graphs, each line graph corresponding to a different one of a plurality of variables in the multivariate data set and representing respective values of the variable concerned in successive data items of the multivariate data set;colorizing the created digital image by carrying out a colorization process for each data item of the multivariate data set, the colorization process comprising:for each variable having a positive value in the data item, assigning a color value to pixels representing an area under the line graph for that variable in dependence upon a color pre-allocated to that variable and a mean value of the data item;for each variable having a negative value in the data item, assigning a color value to pixels representing an area above the line graph for that variable in dependence upon a color pre-allocated to that variable and a mean value of the data item; andsumming the color values for pixels where the areas for at least two of the line graphs overlap; andstoring the colorized image.
- An image processing method as claimed in claim 1, wherein assigning a color value comprises:separating the variables according to whether the value for the variable in the data item is positive or negative;ordering all positive variable values for the data item from the largest value to the smallest value, and for the areas under the line graph corresponding to the positive variable values in order recursively assigning colors to the pixels of those areas; andordering all negative variable values for the data item from the largest value to the smallest value, and for the areas above the line graph corresponding to the negative variable values in order recursively assigning colors to the pixels of those areas.
- An image processing method as claimed in claim 1 or 2, wherein the color for each variable is assigned according to one of the ratio of the value of the variable over the mean value of the data item and the product of the value of the variable with the mean value of the data item.
- An image processing method as claimed in claim 1, 2 or 3, wherein the mean value is the L2 norm.
- A data classification method to classify a multivariate data set, which method comprises:obtaining a colorized image, representing a multivariate data set to be classified, in accordance with the image processing method of any of claims 1 to 4;inputting the colorized image and at least one pre-classified image into a deep neural network trained for image recognition for the purpose of data classification;comparing the colorized image with each pre-classified image; andclassifying the multivariate data set in accordance with a degree of similarity between the colorized image and each pre-classified image.
- An anomaly detection method to detect a potential anomaly in a multivariate data set, which method comprises:obtaining a colorized image, representing a multivariate data set under consideration, in accordance with the image processing method of any of claims 1 to 4;inputting the colorized image and a pre-classified image into a deep neural network trained for image recognition for the purpose of data classification;comparing the colorized image with the pre-classified image; andclassifying the multivariate data set as anomalous according to a degree of dissimilarity between the colorized image and the pre-classified image.
- A computer program which, when stored on a computer, causes that computer to carry out the image processing method of any one of claims 1 to 4, or the data classification method of claim 5, or the anomaly detection method of claim 6..
- Image processing apparatus comprising:a digital image creator to create, for a specified multivariate data set, a digital image comprising a plurality of superimposed line graphs, each line graph corresponding to a different one of a plurality of variables in the multivariate data set and representing respective values of the variable concerned in successive data items of the multivariate data set;an image colorizer to colorize the created digital image by carrying out a colorization process for each data item of the multivariate data set, the colorization process comprising:for each variable having a positive value in the data item, assigning a color value to pixels representing an area under the line graph for that variable in dependence upon a color pre-allocated to that variable and a mean value of the data item;for each variable having a negative value in the data item, assigning a color value to pixels representing an area above the line graph for that variable in dependence upon a color pre-allocated to that variable and a mean value of the data item; andsumming the color values for pixels where the areas for at least two of the line graphs overlap; andimage storage to store the colorized image.
- An image processing apparatus as claimed in claim 8, wherein the image colorizer assigns a color value by:separating the variables according to whether the value for the variable in the data item is positive or negative;ordering all positive variable values for the data item from the largest value to the smallest value, and for the areas under the line graph corresponding to the positive variable values in order recursively assigning colors to the pixels of those areas; andordering all negative variable values for the data item from the largest value to the smallest value, and for the areas above the line graph corresponding to the negative variable values in order recursively assigning colors to the pixels of those areas.
- An image processing method as claimed in claim 8 or 9, wherein the image colorizer assigns the color for each variable according to one of the ratio of the value of the variable over the mean value of the data item and the product of the value of the variable with the mean value of the data item.
- An image processing apparatus as claimed in claim 8, 9 or 10, wherein the mean value is the L2 norm.
Priority Applications (2)
| Application Number | Priority Date | Filing Date | Title |
|---|---|---|---|
| EP18181012.8A EP3588441B1 (en) | 2018-06-29 | 2018-06-29 | Imagification of multivariate data sequences |
| JP2018219065A JP7225731B2 (en) | 2018-06-29 | 2018-11-22 | Imaging multivariable data sequences |
Applications Claiming Priority (1)
| Application Number | Priority Date | Filing Date | Title |
|---|---|---|---|
| EP18181012.8A EP3588441B1 (en) | 2018-06-29 | 2018-06-29 | Imagification of multivariate data sequences |
Publications (2)
| Publication Number | Publication Date |
|---|---|
| EP3588441A1 true EP3588441A1 (en) | 2020-01-01 |
| EP3588441B1 EP3588441B1 (en) | 2023-08-09 |
Family
ID=62837830
Family Applications (1)
| Application Number | Title | Priority Date | Filing Date |
|---|---|---|---|
| EP18181012.8A Active EP3588441B1 (en) | 2018-06-29 | 2018-06-29 | Imagification of multivariate data sequences |
Country Status (2)
| Country | Link |
|---|---|
| EP (1) | EP3588441B1 (en) |
| JP (1) | JP7225731B2 (en) |
Cited By (1)
| Publication number | Priority date | Publication date | Assignee | Title |
|---|---|---|---|---|
| CN112839059A (en) * | 2021-02-22 | 2021-05-25 | 北京六方云信息技术有限公司 | WEB intrusion detection processing method and device and electronic equipment |
Families Citing this family (1)
| Publication number | Priority date | Publication date | Assignee | Title |
|---|---|---|---|---|
| JP7462254B1 (en) | 2023-11-09 | 2024-04-05 | AI inside株式会社 | Program, method, information processing device, and system |
Citations (3)
| Publication number | Priority date | Publication date | Assignee | Title |
|---|---|---|---|---|
| EP3239897A1 (en) | 2016-04-29 | 2017-11-01 | Fujitsu Limited | Method and apparatus for determining the similarity between multivariate data sets |
| US20170351708A1 (en) * | 2016-06-06 | 2017-12-07 | Think-Cell Software Gmbh | Automated data extraction from scatter plot images |
| CN107609601A (en) * | 2017-09-28 | 2018-01-19 | 北京计算机技术及应用研究所 | A kind of ship seakeeping method based on multilayer convolutional neural networks |
Family Cites Families (2)
| Publication number | Priority date | Publication date | Assignee | Title |
|---|---|---|---|---|
| JP5214760B2 (en) | 2011-03-23 | 2013-06-19 | 株式会社東芝 | Learning apparatus, method and program |
| JP6832504B2 (en) | 2016-08-08 | 2021-02-24 | パナソニックIpマネジメント株式会社 | Object tracking methods, object tracking devices and programs |
-
2018
- 2018-06-29 EP EP18181012.8A patent/EP3588441B1/en active Active
- 2018-11-22 JP JP2018219065A patent/JP7225731B2/en active Active
Patent Citations (3)
| Publication number | Priority date | Publication date | Assignee | Title |
|---|---|---|---|---|
| EP3239897A1 (en) | 2016-04-29 | 2017-11-01 | Fujitsu Limited | Method and apparatus for determining the similarity between multivariate data sets |
| US20170351708A1 (en) * | 2016-06-06 | 2017-12-07 | Think-Cell Software Gmbh | Automated data extraction from scatter plot images |
| CN107609601A (en) * | 2017-09-28 | 2018-01-19 | 北京计算机技术及应用研究所 | A kind of ship seakeeping method based on multilayer convolutional neural networks |
Non-Patent Citations (1)
| Title |
|---|
| U. R. BHABUK: "Advanced Graphs Using Excel : Multiple histograms: Overlayed or Back to Back", 29 March 2013 (2013-03-29), XP055534305, Retrieved from the Internet <URL:http://excelgraphs.blogspot.com/2013/03/overlayed-multiple-histograms.html> [retrieved on 20181213] * |
Cited By (1)
| Publication number | Priority date | Publication date | Assignee | Title |
|---|---|---|---|---|
| CN112839059A (en) * | 2021-02-22 | 2021-05-25 | 北京六方云信息技术有限公司 | WEB intrusion detection processing method and device and electronic equipment |
Also Published As
| Publication number | Publication date |
|---|---|
| JP7225731B2 (en) | 2023-02-21 |
| EP3588441B1 (en) | 2023-08-09 |
| JP2020004360A (en) | 2020-01-09 |
Similar Documents
| Publication | Publication Date | Title |
|---|---|---|
| CN109409222B (en) | Multi-view facial expression recognition method based on mobile terminal | |
| CN110321910B (en) | Point cloud-oriented feature extraction method, device and equipment | |
| CN109697434B (en) | Behavior recognition method and device and storage medium | |
| CN110532920B (en) | Face recognition method for small-quantity data set based on FaceNet method | |
| CN111738231B (en) | Target object detection method and device, computer equipment and storage medium | |
| CN111291809B (en) | Processing device, method and storage medium | |
| US20150325046A1 (en) | Evaluation of Three-Dimensional Scenes Using Two-Dimensional Representations | |
| CN111160350B (en) | Portrait segmentation method, model training method, device, medium and electronic equipment | |
| CN110929622A (en) | Video classification method, model training method, device, equipment and storage medium | |
| KR20160034814A (en) | Client device with neural network and system including the same | |
| KR20200144398A (en) | Apparatus for performing class incremental learning and operation method thereof | |
| Schlegel et al. | Multivariate time series analysis for driving style classification using neural networks and hyperdimensional computing | |
| CN113095370A (en) | Image recognition method and device, electronic equipment and storage medium | |
| CN114492634B (en) | Fine granularity equipment picture classification and identification method and system | |
| EP3588441B1 (en) | Imagification of multivariate data sequences | |
| Sun et al. | Two-stage deep regression enhanced depth estimation from a single RGB image | |
| Singh et al. | CNN based approach for traffic sign recognition system | |
| EP3893146A1 (en) | An apparatus for determining a classifier for identifying objects in an image, an apparatus for identifying objects in an image and corresponding methods | |
| Li | Parallel two-class 3D-CNN classifiers for video classification | |
| CN117011219A (en) | Method, apparatus, device, storage medium and program product for detecting quality of article | |
| Prabha et al. | Real Time Facial Emotion Recognition Methods using Different Machine Learning Techniques | |
| Zheng et al. | Sparse classification using group matching pursuit | |
| Pallavi | Suggestive GAN for supporting Dysgraphic drawing skills | |
| Zhou et al. | Terrain Classification Algorithm for Lunar Rover Using a Deep Ensemble Network with High-Resolution Features and Interdependencies between Channels | |
| US20240071049A1 (en) | Spatially Preserving Flattening in Deep Learning Neural Networks |
Legal Events
| Date | Code | Title | Description |
|---|---|---|---|
| PUAI | Public reference made under article 153(3) epc to a published international application that has entered the european phase |
Free format text: ORIGINAL CODE: 0009012 |
|
| STAA | Information on the status of an ep patent application or granted ep patent |
Free format text: STATUS: REQUEST FOR EXAMINATION WAS MADE |
|
| 17P | Request for examination filed |
Effective date: 20190808 |
|
| AK | Designated contracting states |
Kind code of ref document: A1 Designated state(s): AL AT BE BG CH CY CZ DE DK EE ES FI FR GB GR HR HU IE IS IT LI LT LU LV MC MK MT NL NO PL PT RO RS SE SI SK SM TR |
|
| AX | Request for extension of the european patent |
Extension state: BA ME |
|
| STAA | Information on the status of an ep patent application or granted ep patent |
Free format text: STATUS: EXAMINATION IS IN PROGRESS |
|
| 17Q | First examination report despatched |
Effective date: 20210518 |
|
| STAA | Information on the status of an ep patent application or granted ep patent |
Free format text: STATUS: EXAMINATION IS IN PROGRESS |
|
| REG | Reference to a national code |
Ref country code: DE Ref legal event code: R079 Ref document number: 602018054897 Country of ref document: DE Free format text: PREVIOUS MAIN CLASS: G06T0011200000 Ipc: G06V0010440000 Ref country code: DE Ref legal event code: R079 Free format text: PREVIOUS MAIN CLASS: G06T0011200000 Ipc: G06V0010440000 |
|
| GRAP | Despatch of communication of intention to grant a patent |
Free format text: ORIGINAL CODE: EPIDOSNIGR1 |
|
| STAA | Information on the status of an ep patent application or granted ep patent |
Free format text: STATUS: GRANT OF PATENT IS INTENDED |
|
| RIC1 | Information provided on ipc code assigned before grant |
Ipc: G06F 18/2433 20230101ALI20230203BHEP Ipc: G06V 40/18 20220101ALI20230203BHEP Ipc: G06V 10/82 20220101ALI20230203BHEP Ipc: G06V 10/764 20220101ALI20230203BHEP Ipc: G06V 10/44 20220101AFI20230203BHEP |
|
| INTG | Intention to grant announced |
Effective date: 20230220 |
|
| GRAS | Grant fee paid |
Free format text: ORIGINAL CODE: EPIDOSNIGR3 |
|
| GRAA | (expected) grant |
Free format text: ORIGINAL CODE: 0009210 |
|
| STAA | Information on the status of an ep patent application or granted ep patent |
Free format text: STATUS: THE PATENT HAS BEEN GRANTED |
|
| AK | Designated contracting states |
Kind code of ref document: B1 Designated state(s): AL AT BE BG CH CY CZ DE DK EE ES FI FR GB GR HR HU IE IS IT LI LT LU LV MC MK MT NL NO PL PT RO RS SE SI SK SM TR |
|
| REG | Reference to a national code |
Ref country code: GB Ref legal event code: FG4D |
|
| REG | Reference to a national code |
Ref country code: CH Ref legal event code: EP |
|
| REG | Reference to a national code |
Ref country code: DE Ref legal event code: R096 Ref document number: 602018054897 Country of ref document: DE |
|
| REG | Reference to a national code |
Ref country code: IE Ref legal event code: FG4D |
|
| REG | Reference to a national code |
Ref country code: LT Ref legal event code: MG9D |
|
| REG | Reference to a national code |
Ref country code: NL Ref legal event code: MP Effective date: 20230809 |
|
| REG | Reference to a national code |
Ref country code: AT Ref legal event code: MK05 Ref document number: 1598394 Country of ref document: AT Kind code of ref document: T Effective date: 20230809 |
|
| PG25 | Lapsed in a contracting state [announced via postgrant information from national office to epo] |
Ref country code: GR Free format text: LAPSE BECAUSE OF FAILURE TO SUBMIT A TRANSLATION OF THE DESCRIPTION OR TO PAY THE FEE WITHIN THE PRESCRIBED TIME-LIMIT Effective date: 20231110 |
|
| PG25 | Lapsed in a contracting state [announced via postgrant information from national office to epo] |
Ref country code: IS Free format text: LAPSE BECAUSE OF FAILURE TO SUBMIT A TRANSLATION OF THE DESCRIPTION OR TO PAY THE FEE WITHIN THE PRESCRIBED TIME-LIMIT Effective date: 20231209 |
|
| PG25 | Lapsed in a contracting state [announced via postgrant information from national office to epo] |
Ref country code: SE Free format text: LAPSE BECAUSE OF FAILURE TO SUBMIT A TRANSLATION OF THE DESCRIPTION OR TO PAY THE FEE WITHIN THE PRESCRIBED TIME-LIMIT Effective date: 20230809 Ref country code: RS Free format text: LAPSE BECAUSE OF FAILURE TO SUBMIT A TRANSLATION OF THE DESCRIPTION OR TO PAY THE FEE WITHIN THE PRESCRIBED TIME-LIMIT Effective date: 20230809 Ref country code: PT Free format text: LAPSE BECAUSE OF FAILURE TO SUBMIT A TRANSLATION OF THE DESCRIPTION OR TO PAY THE FEE WITHIN THE PRESCRIBED TIME-LIMIT Effective date: 20231211 Ref country code: NO Free format text: LAPSE BECAUSE OF FAILURE TO SUBMIT A TRANSLATION OF THE DESCRIPTION OR TO PAY THE FEE WITHIN THE PRESCRIBED TIME-LIMIT Effective date: 20231109 Ref country code: NL Free format text: LAPSE BECAUSE OF FAILURE TO SUBMIT A TRANSLATION OF THE DESCRIPTION OR TO PAY THE FEE WITHIN THE PRESCRIBED TIME-LIMIT Effective date: 20230809 Ref country code: LV Free format text: LAPSE BECAUSE OF FAILURE TO SUBMIT A TRANSLATION OF THE DESCRIPTION OR TO PAY THE FEE WITHIN THE PRESCRIBED TIME-LIMIT Effective date: 20230809 Ref country code: LT Free format text: LAPSE BECAUSE OF FAILURE TO SUBMIT A TRANSLATION OF THE DESCRIPTION OR TO PAY THE FEE WITHIN THE PRESCRIBED TIME-LIMIT Effective date: 20230809 Ref country code: IS Free format text: LAPSE BECAUSE OF FAILURE TO SUBMIT A TRANSLATION OF THE DESCRIPTION OR TO PAY THE FEE WITHIN THE PRESCRIBED TIME-LIMIT Effective date: 20231209 Ref country code: HR Free format text: LAPSE BECAUSE OF FAILURE TO SUBMIT A TRANSLATION OF THE DESCRIPTION OR TO PAY THE FEE WITHIN THE PRESCRIBED TIME-LIMIT Effective date: 20230809 Ref country code: GR Free format text: LAPSE BECAUSE OF FAILURE TO SUBMIT A TRANSLATION OF THE DESCRIPTION OR TO PAY THE FEE WITHIN THE PRESCRIBED TIME-LIMIT Effective date: 20231110 Ref country code: FI Free format text: LAPSE BECAUSE OF FAILURE TO SUBMIT A TRANSLATION OF THE DESCRIPTION OR TO PAY THE FEE WITHIN THE PRESCRIBED TIME-LIMIT Effective date: 20230809 Ref country code: AT Free format text: LAPSE BECAUSE OF FAILURE TO SUBMIT A TRANSLATION OF THE DESCRIPTION OR TO PAY THE FEE WITHIN THE PRESCRIBED TIME-LIMIT Effective date: 20230809 |
|
| PG25 | Lapsed in a contracting state [announced via postgrant information from national office to epo] |
Ref country code: PL Free format text: LAPSE BECAUSE OF FAILURE TO SUBMIT A TRANSLATION OF THE DESCRIPTION OR TO PAY THE FEE WITHIN THE PRESCRIBED TIME-LIMIT Effective date: 20230809 |