EP3577564B1 - Extraction efficace de valeurs de mémoire pendant une relecture de trace - Google Patents
Extraction efficace de valeurs de mémoire pendant une relecture de trace Download PDFInfo
- Publication number
- EP3577564B1 EP3577564B1 EP18713409.3A EP18713409A EP3577564B1 EP 3577564 B1 EP3577564 B1 EP 3577564B1 EP 18713409 A EP18713409 A EP 18713409A EP 3577564 B1 EP3577564 B1 EP 3577564B1
- Authority
- EP
- European Patent Office
- Prior art keywords
- trace
- memory
- replay
- memory address
- section
- Prior art date
- Legal status (The legal status is an assumption and is not a legal conclusion. Google has not performed a legal analysis and makes no representation as to the accuracy of the status listed.)
- Active
Links
- 230000015654 memory Effects 0.000 title claims description 207
- 230000002688 persistence Effects 0.000 claims description 131
- 238000012545 processing Methods 0.000 claims description 46
- 238000000034 method Methods 0.000 claims description 40
- 238000012163 sequencing technique Methods 0.000 description 47
- 230000005540 biological transmission Effects 0.000 description 12
- 238000004458 analytical method Methods 0.000 description 7
- 238000013459 approach Methods 0.000 description 7
- 238000010586 diagram Methods 0.000 description 4
- 230000006870 function Effects 0.000 description 4
- 230000006855 networking Effects 0.000 description 4
- 230000008901 benefit Effects 0.000 description 3
- 238000004891 communication Methods 0.000 description 3
- 230000007246 mechanism Effects 0.000 description 3
- 239000007787 solid Substances 0.000 description 3
- 230000006399 behavior Effects 0.000 description 2
- 239000000470 constituent Substances 0.000 description 2
- 238000011161 development Methods 0.000 description 2
- 230000005055 memory storage Effects 0.000 description 2
- 230000003287 optical effect Effects 0.000 description 2
- 229920001690 polydopamine Polymers 0.000 description 2
- 230000008569 process Effects 0.000 description 2
- 238000013403 standard screening design Methods 0.000 description 2
- 241000238876 Acari Species 0.000 description 1
- 210000001072 colon Anatomy 0.000 description 1
- 230000006835 compression Effects 0.000 description 1
- 238000007906 compression Methods 0.000 description 1
- 230000003247 decreasing effect Effects 0.000 description 1
- 230000000694 effects Effects 0.000 description 1
- 230000003993 interaction Effects 0.000 description 1
- 238000002955 isolation Methods 0.000 description 1
- 238000012423 maintenance Methods 0.000 description 1
- 230000008520 organization Effects 0.000 description 1
- 238000011176 pooling Methods 0.000 description 1
- 230000004044 response Effects 0.000 description 1
- 230000001360 synchronised effect Effects 0.000 description 1
Images


Classifications
-
- G—PHYSICS
- G06—COMPUTING; CALCULATING OR COUNTING
- G06F—ELECTRIC DIGITAL DATA PROCESSING
- G06F3/00—Input arrangements for transferring data to be processed into a form capable of being handled by the computer; Output arrangements for transferring data from processing unit to output unit, e.g. interface arrangements
- G06F3/06—Digital input from, or digital output to, record carriers, e.g. RAID, emulated record carriers or networked record carriers
- G06F3/0601—Interfaces specially adapted for storage systems
- G06F3/0602—Interfaces specially adapted for storage systems specifically adapted to achieve a particular effect
- G06F3/0614—Improving the reliability of storage systems
- G06F3/0619—Improving the reliability of storage systems in relation to data integrity, e.g. data losses, bit errors
-
- G—PHYSICS
- G06—COMPUTING; CALCULATING OR COUNTING
- G06F—ELECTRIC DIGITAL DATA PROCESSING
- G06F11/00—Error detection; Error correction; Monitoring
- G06F11/36—Preventing errors by testing or debugging software
- G06F11/362—Software debugging
- G06F11/3636—Software debugging by tracing the execution of the program
-
- G—PHYSICS
- G06—COMPUTING; CALCULATING OR COUNTING
- G06F—ELECTRIC DIGITAL DATA PROCESSING
- G06F11/00—Error detection; Error correction; Monitoring
- G06F11/30—Monitoring
- G06F11/34—Recording or statistical evaluation of computer activity, e.g. of down time, of input/output operation ; Recording or statistical evaluation of user activity, e.g. usability assessment
- G06F11/3466—Performance evaluation by tracing or monitoring
- G06F11/3476—Data logging
-
- G—PHYSICS
- G06—COMPUTING; CALCULATING OR COUNTING
- G06F—ELECTRIC DIGITAL DATA PROCESSING
- G06F11/00—Error detection; Error correction; Monitoring
- G06F11/36—Preventing errors by testing or debugging software
- G06F11/362—Software debugging
-
- G—PHYSICS
- G06—COMPUTING; CALCULATING OR COUNTING
- G06F—ELECTRIC DIGITAL DATA PROCESSING
- G06F11/00—Error detection; Error correction; Monitoring
- G06F11/36—Preventing errors by testing or debugging software
- G06F11/3664—Environments for testing or debugging software
-
- G—PHYSICS
- G06—COMPUTING; CALCULATING OR COUNTING
- G06F—ELECTRIC DIGITAL DATA PROCESSING
- G06F12/00—Accessing, addressing or allocating within memory systems or architectures
- G06F12/02—Addressing or allocation; Relocation
- G06F12/08—Addressing or allocation; Relocation in hierarchically structured memory systems, e.g. virtual memory systems
- G06F12/0802—Addressing of a memory level in which the access to the desired data or data block requires associative addressing means, e.g. caches
- G06F12/0806—Multiuser, multiprocessor or multiprocessing cache systems
- G06F12/0808—Multiuser, multiprocessor or multiprocessing cache systems with cache invalidating means
-
- G—PHYSICS
- G06—COMPUTING; CALCULATING OR COUNTING
- G06F—ELECTRIC DIGITAL DATA PROCESSING
- G06F12/00—Accessing, addressing or allocating within memory systems or architectures
- G06F12/02—Addressing or allocation; Relocation
- G06F12/08—Addressing or allocation; Relocation in hierarchically structured memory systems, e.g. virtual memory systems
- G06F12/12—Replacement control
- G06F12/121—Replacement control using replacement algorithms
- G06F12/128—Replacement control using replacement algorithms adapted to multidimensional cache systems, e.g. set-associative, multicache, multiset or multilevel
-
- G—PHYSICS
- G06—COMPUTING; CALCULATING OR COUNTING
- G06F—ELECTRIC DIGITAL DATA PROCESSING
- G06F3/00—Input arrangements for transferring data to be processed into a form capable of being handled by the computer; Output arrangements for transferring data from processing unit to output unit, e.g. interface arrangements
- G06F3/06—Digital input from, or digital output to, record carriers, e.g. RAID, emulated record carriers or networked record carriers
- G06F3/0601—Interfaces specially adapted for storage systems
- G06F3/0628—Interfaces specially adapted for storage systems making use of a particular technique
- G06F3/0646—Horizontal data movement in storage systems, i.e. moving data in between storage devices or systems
- G06F3/065—Replication mechanisms
-
- G—PHYSICS
- G06—COMPUTING; CALCULATING OR COUNTING
- G06F—ELECTRIC DIGITAL DATA PROCESSING
- G06F3/00—Input arrangements for transferring data to be processed into a form capable of being handled by the computer; Output arrangements for transferring data from processing unit to output unit, e.g. interface arrangements
- G06F3/06—Digital input from, or digital output to, record carriers, e.g. RAID, emulated record carriers or networked record carriers
- G06F3/0601—Interfaces specially adapted for storage systems
- G06F3/0668—Interfaces specially adapted for storage systems adopting a particular infrastructure
- G06F3/067—Distributed or networked storage systems, e.g. storage area networks [SAN], network attached storage [NAS]
-
- G—PHYSICS
- G06—COMPUTING; CALCULATING OR COUNTING
- G06F—ELECTRIC DIGITAL DATA PROCESSING
- G06F11/00—Error detection; Error correction; Monitoring
- G06F11/30—Monitoring
- G06F11/34—Recording or statistical evaluation of computer activity, e.g. of down time, of input/output operation ; Recording or statistical evaluation of user activity, e.g. usability assessment
- G06F11/3466—Performance evaluation by tracing or monitoring
- G06F11/3471—Address tracing
-
- G—PHYSICS
- G06—COMPUTING; CALCULATING OR COUNTING
- G06F—ELECTRIC DIGITAL DATA PROCESSING
- G06F12/00—Accessing, addressing or allocating within memory systems or architectures
- G06F12/02—Addressing or allocation; Relocation
- G06F12/08—Addressing or allocation; Relocation in hierarchically structured memory systems, e.g. virtual memory systems
- G06F12/12—Replacement control
-
- G—PHYSICS
- G06—COMPUTING; CALCULATING OR COUNTING
- G06F—ELECTRIC DIGITAL DATA PROCESSING
- G06F2212/00—Indexing scheme relating to accessing, addressing or allocation within memory systems or architectures
- G06F2212/70—Details relating to dynamic memory management
Definitions
- developers When writing code during the development of software applications, developers commonly spend a significant amount of time “debugging” the code to find runtime and other source code errors. In doing so, developers may take several approaches to reproduce and localize a source code bug, such as observing behavior of a program based on different inputs, inserting debugging code (e.g., to print variable values, to track branches of execution, etc.), temporarily removing code portions, etc. Tracking down runtime errors to pinpoint code bugs can occupy a significant portion of application development time.
- debuggers have been developed in order to assist developers with the code debugging process. These tools offer developers the ability to trace, visualize, and alter the execution of computer code. For example, debuggers may visualize the execution of code instructions, may present code variable values at various times during code execution, may enable developers to alter code execution paths, and/or may enable developers to set "breakpoints" and/or "watchpoints" on code elements of interest (which, when reached during execution, causes execution of the code to be suspended), among other things.
- time travel debugging
- execution of a program e.g., executable entities such as threads
- trace file(s) can then be used to replay execution of the program later, for both forward and backward analysis.
- time travel debuggers can enable a developer to set forward breakpoints/watchpoints (like conventional debuggers) as well as reverse breakpoints/watchpoints.
- One challenge in implementing "time travel" debuggers involves how to return a memory value at a given point in a trace.
- One approach is to record a full copy of addressable memory of an executable entity at trace time, often using the same memory addresses that were seen by the executable entity at trace time. Then, replay involves loading this full memory copy, and performing memory reads and writes directly into it. Using this approach, reproducing memory values at a particular point involves reading the value from the memory copy.
- this approach produces prohibitively large amount of data at trace time (since a full copy of addressable memory is stored), and requires this large amount of data to be loaded at replay time.
- requiring maintenance of a large memory copy at replay time makes it impractical to perform parallel or speculative replay operations, and to store the values of memory at multiple particular points in time (for later retrieval).
- Another approach is to replay code up to the last point that a memory address of interest was consumed prior to the point of interest in the trace, and return the value seen at that address. This has an advantage over the previous approach of using much less memory at replay time, but it introduces complexity and leads to poor performance for returning memory values, since a replay is performed in response to every request for a memory value.
- US 2007/0168989 A1 discloses compression techniques to reduce the size of the recording of the program's execution of a program under tested. For example, if a value for a memory address can be predicted via a virtual processor during playback, the value needs not be stored in the recording and a compressed recording can be stored instead. To facilitate random access with respect to time during playback, key frames can be stored within the compressed recording. An index mechanism can associate key frames with particular memory addresses. Additionally, a snapshot of values for memory addresses can be used to further facilitate determining the value of a memory address without having to simulate execution. Multiprocessor executions are also discussed in some examples.
- HARISH PATIL et al "PinPlay: A Framework for Deterministic Replay and Reproducible Analysis of Parallel Programs" (COG' 10, ACM, 24 April 2010, pages 2-11, DOI: 10.1145/1772954.1772958 ) discloses an execution capture and deterministic replay system called PinPlay, which enables repeatable analysis of parallel programs.
- PinPlay extends the capability of Pin-based analysis by providing a tool for capturing one execution instance of a program (as log files called pinballs).
- a logger is configured to maintain a copy of all memory changes made by the user-level code in the input program. It also relates a technique of acquiring locks before each memory operation to be analyzed and releasing afterwards to avoid erroneous analysis of memory values.
- BECKER D et al.: "Synchronizing the Timestamps of Concurrent Events in Traces of Hybrid MPI/OpenMP Applications” (2010 IEEE INTERNATIONAL CONFERENCE ON CLUSTER COMPUTING, IEEE, 20 September 2010, pages 38-47, DOI: 10.1109/CLUSTER.2010.13 ) discloses techniques that eliminate inconsistent interprocess timings post-mortem in traces of pure Message Passing Interface (MPI) applications in parallel computing architectures. It addresses the problem that, in the absence of synchronized clocks on most cluster systems, the analysis may be rendered ineffective because inaccurate relative event timings may misrepresent the logical event order and lead to errors when quantifying the impact of certain behaviors. Techniques like performing local time shifts of event traces are used to guarantee correct message-passing events between multiple processors.
- MPI Message Passing Interface
- each persistence data structure corresponds to a different trace section of a trace, and stores the most recently seen value for each memory address encountered by that trace section.
- the foregoing embodiments provide advantages over prior approaches, including providing responsive performance for requests for memory values, while requiring a relatively small amount of memory information to be maintained during replay, and enabling low-cost mechanisms for storing the values of memory at multiple points in time.
- the claimed method for preserving memory values during trace replay includes identifying, from among a plurality of trace data streams, a plurality of trace sections that each represents one or more events executed by an executable entity over a period of time.
- the method also includes performing a parallel replay of two or more of the plurality of trace sections at the plurality of processing units, including concurrently replaying each trace of the two or more trace sections at a different processing unit of the plurality of processing units.
- the method also includes, while concurrently replaying each trace section at a different processing unit, maintaining a different persistence data structure corresponding to each trace section. This includes, for each trace section, storing in the trace section's corresponding persistence data structure a record of each memory address consumed by the processing unit while replaying the trace section, and a most recent memory value stored at each memory address during replay of the trace section.
- the embodiments of the claimed invention described herein preserve memory values during trace replay by maintaining plurality of persistence data structures during trace replay.
- Each persistence data structure corresponds to a different trace section of a trace, and stores the most recently seen value for each memory address encountered by that trace section.
- At least some examples of the disclosure also use the persistence data structures to return a memory value during trace replay. In these examples, returning a memory value involves progressively searching these persistence data structures-starting at the point of time of the requested memory value and going backwards until a persistence data structure storing the memory address of the requested memory value is encountered.
- Figure 1 illustrates an example computing environment 100 that facilitates preserving memory values during replay of trace files, and efficient retrieval of those memory values.
- examples may comprise or utilize a special-purpose or general-purpose computer system 101 that includes computer hardware, such as, for example, one or more processors 102, system memory 103, one or more data stores 104, and/or input/output hardware 105 (e.g., such as the depicted keyboard/mouse hardware 105a, networking hardware 105b, and display device 105c).
- computer system 101, and the components therein could comprise a virtualized environment.
- Examples include physical and other computer-readable media for carrying or storing computer-executable instructions and/or data structures.
- Such computer-readable media can be any available media that can be accessed by the computer system 101.
- Computer-readable media that store computer-executable instructions and/or data structures are computer storage devices.
- Computer-readable media that carry computer-executable instructions and/or data structures are transmission media. Examples of the disclosure can comprise at least two distinctly different kinds of computer-readable media: computer storage devices and transmission media.
- Computer storage devices are physical hardware devices that store computer-executable instructions and/or data structures.
- Computer storage devices include various computer hardware, such as RAM, ROM, EEPROM, solid state drives (“SSDs”), flash memory, phase-change memory (“PCM”), optical disk storage, magnetic disk storage or other magnetic storage devices, or any other hardware device(s) which can be used to store program code in the form of computer-executable instructions or data structures, and which can be accessed and executed by the computer system 101.
- computer storage devices may include the depicted system memory 103, the depicted data store 104 which can store computer-executable instructions and/or data structures, or other storage such as on-processor storage, as discussed later.
- Transmission media can include a network and/or data links which can be used to carry program code in the form of computer-executable instructions or data structures, and which can be accessed by the computer system 101.
- a "network" is defined as one or more data links that enable the transport of electronic data between computer systems and/or modules and/or other electronic devices.
- the input/output hardware 105 may comprise networking hardware 105b (e.g., a hard-wired or wireless network interface module) that connects a network and/or data link that can be used to carry program code in the form of computer-executable instructions or data structures.
- networking hardware 105b e.g., a hard-wired or wireless network interface module
- program code in the form of computer-executable instructions or data structures can be transferred automatically from transmission media to computer storage devices (or vice versa).
- program code in the form of computer-executable instructions or data structures received over a network or data link can be buffered in RAM within networking hardware 105b, and then eventually transferred to the system memory 103 and/or to less volatile computer storage devices (e.g., data store 104) at the computer system 101.
- computer storage devices can be included in computer system components that also (or even primarily) utilize transmission media.
- Computer-executable instructions comprise, for example, instructions and data which, when executed at the processor(s) 102, cause the computer system 101 to perform a certain function or group of functions.
- Computer-executable instructions may be, for example, binaries, intermediate format instructions such as assembly language, or even source code.
- a computer system may include a plurality of constituent computer systems.
- program modules may be located in both local and remote memory storage devices.
- the data store 104 which typically comprises durable storage, can store computer-executable instructions and/or data structures representing application code such as, for example, a trace record component 106a, a trace replay component 106b, an operating system 107, and an application 108 (including portions of executable code 108a of the application 108).
- the data store 104 can also store other types of data, such as one or more trace file(s) 109 and persisted replay data 110.
- the system memory 103 can store corresponding runtime data, such as runtime data structures, computer-executable instructions, etc.
- Figure 1 illustrates the system memory 103 as including runtime record/replay data 106' (including replay data structures 106c), runtime operating system data 107', and runtime application data 108' (including runtime variables, data structures, etc. of application 108 as it executes, as well as runtime code portions 108a' which are in-memory copies of code portions 108a).
- runtime record/replay data 106' including replay data structures 106c
- runtime operating system data 107' including runtime operating system data 107'
- runtime application data 108' including runtime variables, data structures, etc. of application 108 as it executes, as well as runtime code portions 108a' which are in-memory copies of code portions 108a).
- the trace record component 106a is usable to trace execution of an application, such as application 108 (including its executable code portions 108a), and to store trace data in the trace file(s) 109.
- the trace record component 106a is a standalone application, while in other examples it is integrated into another software component, such as the operating system 107, a hypervisor, a debugging suite, etc.
- the trace record component 106a may also exist at an entirely different computer system. Thus, the trace record component 106a may trace execution of code at another computer system.
- the trace file(s) 109 resulting from that tracing can be transferred (e.g., using the networking hardware 105b) to the computer system 101 for replay by the trace replay component 106b. While the trace file(s) 109 are depicted as being stored in the data store 104, they may also be recorded exclusively or temporarily in the system memory 103, or at some other storage device.
- FIG. 1 also includes a simplified representation of the internal hardware components of the processor(s) 102.
- each processor 102 includes processing unit(s) 102a.
- Each processing unit may be physical (i.e., a physical processor core) and/or logical (i.e., a logical core presented by a physical core that supports hyper-threading, in which more than one application thread executes at the physical core).
- logical i.e., a logical core presented by a physical core that supports hyper-threading, in which more than one application thread executes at the physical core.
- the processor 102 may in some examples include only a single physical processing unit (core), it could include two or more virtual processing units 102a presented by that single physical processing unit.
- Each processing unit 102a executes processor instructions that are defined by applications (e.g., trace record component 106a, trace replay component 106b, operating system 107, application code portions 108a, etc.), and which instructions are selected from among a predefined processor instruction set architecture.
- the particular instruction set architecture of each processor 102 varies based on processor manufacturer and processor model.
- Common instruction set architectures include the IA-64 and IA-32 architectures from INTEL, INC., the AMD64 architecture from ADVANCED MICRO DEVICES, INC., and various Advanced RISC Machine (“ARM”) architectures from ARM HOLDINGS, PLC, although a great number of other instruction set architectures exist and can be used.
- an "instruction" is the smallest externally visible (i.e., external to the processor) unit of code that is executable by a processor.
- Each processing unit 102a obtains processor instructions from a shared processor cache 102b (i.e., shared by the processing units 102a), and executes the processor instructions based on data in the shared cache 102b, based on data in registers 102c, and/or without input data.
- the shared cache 102b is a small amount (i.e., small relative to the typical amount of system memory 103) of random-access memory that stores on-processor copies of portions of the system memory 103.
- the shared cache 102b when executing the executable code portions 108a of application 108, stores a subset of the runtime code portions 108b' in a code cache section of the shared cache 102b, and stores other runtime application data 108' (e.g., variables, data structures, etc.) in a data cache section of the shared cache 102b. If the processing unit(s) 102a require data not already stored in the shared cache 102b, then a "cache miss" occurs, and that data is fetched from the system memory 103 (potentially evicting some other data from the shared cache 102b).
- the registers 102c are hardware based storage locations that are defined based on the instruction set architecture of the processors(s) 102.
- the trace replay component 106b replays one or more trace file(s) 109 by executing the code of the executable entity upon which the trace file(s) 109 are based at the processor(s) 102, while supplying that code with traced data (e.g., register values, memory values, etc.) from the trace file(s) 109 at appropriate times.
- traced data e.g., register values, memory values, etc.
- the trace record component 106a may record execution of one or more code portions 108a of application 108 at the processor(s) 102, while storing trace data (e.g., memory values read by code instructions, register values supplied code instructions, etc.) in the trace files(s) 109.
- the trace replay component 106b can re-execute the code portion(s) 108a at the processor(s) 102, while supplying that code with the trace data from the trace files(s) 109 so that the code is executed in the same manner that it was at trace time.
- the trace replay component 106b also maintains a plurality of persistence data structures that each store the most recent value of each memory address accessed (i.e., read from or written to) a corresponding trace section of the trace file 109. This is described in connection with the detailed trace replay component 200 of Figure 2 , and the environment 300 of Figure 3 .
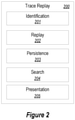
- Figure 2 illustrates details of an example replay component 200, such as the trace replay component 106b of Figure 1 .
- the trace replay component 200 can include a number of sub-components, such as, for example, an identification component 201, a replay component 202, a persistence component 203, a search component 204, and/or a presentation component 205.
- the depicted identity and arrangement of sub-components 201-205 are merely one example as an aide in description, and one of ordinary skill in the art will recognize that the particular identity and number of sub-components of the trace replay component 200 can vary greatly based on implementation.
- the identification component 201 is responsible for identifying executable events in a trace file and memory locations of interest, for identifying trace sections of interest in order to obtain a memory value for a memory location of interest, for identifying an ordering among trace sections, and/or for identifying persistence data structures that are of interest for corresponding trace sections, etc.
- the replay component 202 performs trace replay operations, such as instructing one or more processing units 102a to execute instructions from traced code portions 108a, while supplying those code portions with data from a trace file 109. As is described in more detail later in connection with Figure 3 , this may include instructing one or more processing units 102a to perform reads from and/or writes to system memory 103 through a cache.
- the persistence component 203 causes memory addresses and their corresponding values to be persisted to one or more persistence data structure(s) at various times during a trace replay.
- Persistence data structure(s) may, for example, be an in-memory replay data structure 106c, or may be stored on disk (e.g., persisted replay data 110). These persistence data structure(s) are then usable by the search component 204 to obtain desired memory values at specified times in the trace execution. These memory values can then be displayed using a presentation component 205 (e.g., such as at debugger user interface).
- Figure 3 illustrates an example environment 300 for preserving memory values during replay of trace files using a cache and persistence data structures.
- the example 300 of Figure 3 illustrates a replay component 301 (e.g., such as the trace replay component 106b of Figure 1 and/or the trace replay component 200 of Figure 2 ) that causes read 305a and/or write 305b operations to be performed on a memory 302 (e.g., by a processing unit 102a of Figure 1 ).
- the memory 302 may comprise a portion of system memory 103 of Figure 1 , such as runtime application data 108'.
- the memory 302 comprises a data structure maintained by the replay component 301 (e.g., such as one of the replay data structures 106c) that reproduces the memory reads and/or writes actually observed during a trace.
- the memory 302 may comprise a replay data structure 106c comprising an entire copy of memory that was addressable by the executable entity being traced, a cache data structure that reproduces the reads seen by the entity being traced, etc.
- the memory 302 could include both memories storing the code of the executable entity (e.g., a code portion 108a') as well as operating memory used by the code of the executable entity.
- a read 305a operation may comprise a code read by a processing unit 102a that obtains executable instructions from the memory 302, and/or a data read by a processing unit 102a that obtains runtime data (e.g., variables or other data structures) stored in the memory 302.
- a write 305b operation may comprise a data write that stores runtime data in the memory 302.
- Figure 3 depicts read 305a and write 305b operations
- a processor may treat the operation as an "execute” or a "fetch” operation.
- a read 305a operation should be construed to comprise an "execute” and/or a "fetch" memory access operation in appropriate circumstances, such as when the operation is accessing code data.
- the replay component 301 (e.g., replay component 202) causes the read 305a and write 305b operations to be performed through a cache 303.
- the cache 303 operates in a similar manner to a processor cache (e.g., cache 102b of Figure 1 ), and in some examples it is in fact at least a portion of the processor cache 102b (whether that be physical or virtualized).
- the cache 303 stores a plurality of cache lines, each of which can be associated with a memory address (e.g., in system memory 103), and store a cached copy of a portion of memory starting at that memory address and potentially spanning several memory addresses (depending on the size of the cache line).
- Figure 3 also illustrates persistence data structures 304, which includes a plurality of individual persistence data structures.
- Figure 3 illustrates six individual persistence data structures 304a-304f, though the ellipses indicate that persistence data structures 304 can include any number of individual persistence data structures.
- the individual persistence data structures may be each individually independent, or may be related in some way, such as part of a linked list, part of a hierarchical structure, indexed by a common hash table, etc. to make up the overall persistence data structure 304.
- the persistence data structures 304 are used by the replay component 301 (e.g., using persistence component 203) to store the values of memory addresses that are encountered by the code that is being replayed by the replay component 202.
- the persistence data structures 304 are depicted as being connected to the replay component 301 via connection 306a and/or the cache 303 via connection 306b.
- the connection 306b between the cache 303 and the persistence data structures 304 indicates that in some examples the persistence data structures 304 store evictions from the cache 303.
- memory addresses/values that have been consumed by code is that being replayed are available either from the cache 303 (i.e., if it has been recently accessed) or from the persistence data structures 304 (i.e., if a memory address cached and then later evicted to the persistence data structures 304).
- connection 306a between the replay component 301 and the persistence data structures 304 indicates that replay component 301 can store memory addresses/values in the persistence data structures 304 using whatever scheme/rules it so chooses, and that the examples herein are not limited to storing cache evictions.
- the persistence data structures 304 may store individual reads, including reads that would not make it into the cache 303.
- the persistence data structures 304 stores memory addresses/values that correspond to reads that are considered un-cached by the processor architecture being used.
- examples include storing individual persistence data structures (e.g., 304a-304f) that correspond to individual sections of a trace file 109.
- Figure 4 illustrates an example trace file 400 that enables separate replay of individual sections trace data streams and that, in turn, enables the creation of an individual persistence data structure for each section.
- the trace file 400 independently stores a log of execution of each of a plurality of executable entities (e.g., different threads, different executable entities corresponding to different portions of executable code 108a of the application 108, etc.) that are executing in parallel.
- the trace file 400 represents the execution of three parallel threads of an application, in which each parallel thread executed a different processing unit 102a or processor 102 (including any combination of physical and/or virtual processing units/processors).
- the trace file 400 includes a separate data stream 401 for each processing unit 102a/processor 102—and thus for each executable entity of the application.
- the trace file 400 therefore includes three data streams 401a-401c—but it could include any number of data streams 401 depending on a number of processing units 102a available at the computer system 101 (whether they be in a single processor 102 or multiple processors 102) and/or a number of executable entities created by the application 108.
- the data streams 401 may be included in a single file trace file 109, or may each be stored in different files.
- Each data stream 401 includes data packets 402 storing trace data that is usable by the trace replay component 301 to reproduce execution of the corresponding executable entity, by supplying appropriate recorded state data (e.g., register values, memory addresses and values, etc.) to executable code of the executable entity at appropriate times.
- appropriate recorded state data e.g., register values, memory addresses and values, etc.
- the data packets 402 are depicted as being separated by broken lines, and/or by key frames (which are discussed later). Thus, for example, three of the data packets in data stream 401a are specifically identified as data packets 402a-402c, and one of the data packets in data stream 401b is specifically identified as data packet 402d. As depicted, individual data packets 402 may be of differing sizes, depending on trace file implementation and on the particular data stored in each packet.
- Example data that may be included in a data packet includes information for identifying a code instruction executed, register values provided to that code instruction, memory addresses/values read, the side effects (e.g., resulting register values) of executing the code instruction, etc.
- the trace record component 106a uses the format of trace file 400 to record each data stream 401 independently during parallel execution of the code being traced.
- the timing of the executable events recorded by the trace record component 106a into data packets in one data stream is generally independent from the timing of the events recorded by the trace recoding component 106a into data packets in another data stream (while accounting for a general ordering based on orderable events, discussed below).
- the replay component 203 can replay sections of each data stream 401 independently and in parallel. For example, the ordering of the individual events in data packet 402b are recorded separately from the individual events in data packet 402d. As such, the events in these trace sections can be replayed independent from each other, even though they originally occurred in parallel.
- the trace file 400 also stores sequencing events that record the timing and sequence of execution of certain events that are "orderable" across the data streams 401. Orderable events may correspond to events by one thread that could affect execution of another thread, such as accessing shared memory. Thus, while the replay component 202 can generally replay each data stream 401 independently and in parallel, the orderable events to enforce a general ordering among sections of the traces. In some examples, orderable events are recorded using a sequencing number, comprising a monotonically incrementing number ("MIN”), which is guaranteed to not repeat. For example, the trace file 400 includes twelve sequencing numbers (depicted as circled numerals 1-12), each corresponding to the occurrence of different orderable events across data streams 401a-401c.
- MIN monotonically incrementing number
- Figure 4 also illustrates a first section 404a of data stream 401a that is bounded by sequencing numbers 1 and 4, and a second section 404b of data stream 401b bounded by sequencing numbers 2 and 6. While it is known that the orderable event at sequencing number 1 occurred before the orderable event at sequencing number 2, that the orderable event at sequencing number 2 occurred before the orderable event at sequencing number 4, and that the orderable event at sequencing number 4 occurred before the orderable event at sequencing number 6, the particular ordering of individual events in section 404a versus the particular ordering of individual events in section 404b is not known. As such, sections 404a and 404b can be replayed in parallel with each other by the replay component 202.
- Orderable events may be defined according to a "trace memory model," having defined orderable and non-orderable events that are used to identify how to store interactions across executable entities, such as threads. For example, orderable and/or non-orderable events may be defined based on how the threads interact through shared memory, their shared use of data in the shared memory, etc.
- a trace memory model may be weaker or stronger than a memory model used by the processor 102.
- the trace memory model used may be a memory model defined by a programming language used to compile code (e.g., C++14), or some other memory model defined for purposes of tracing.
- a first example trace memory model may treat as orderable only kernel calls (from user mode), traps, and exceptions. This trace memory model would have low overhead, since these operations are relatively "expensive" is their own right, they are likely tracked anyway and provide a very coarse grained overview of ordering.
- a second example trace memory model may treat as orderable full fences (i.e., operations that are have both acquire & release semantics). Examples of such operations may include INTEL'S "locked" instructions, kernel calls, exceptions, and traps. This memory model would provide enough ordering for nearly all cross-thread communication that happens in the process when the code uses "interlocked" types of primitives to communicate cross threads, which is common in operating such as WINDOWS from MICROSOFT CORPORATION).
- a third example trace memory model may treat all acquires and releases as orderable.
- This memory model may be suitable for processors based ARM instruction sets, because ARM does not treat most loads and stores as acquires or releases. On other architectures, such as from INTEL (in which a majority of memory accesses are acquires or releases), this would equate to ordering almost all memory accesses.
- a fourth example trace memory model may treat as orderable all memory loads. This would provide for strong ordering but may lead to decreased performance as compared to the other example memory models.
- the foregoing memory models have been presented as examples only, and one of ordinary skill in the art will recognize, in view of the disclosure herein, there a vast variety of memory models may be chosen.
- the trace file 400 can also include key frames, which are depicted as shaded horizontal lines (e.g., such as particularly identified key frames 403a-403f).
- a key frame is a type of data packet that stores sufficient information to begin replay execution of an executable entity from the time of the key frame onward.
- a key frame may store values for all relevant processor registers, information necessary to reproduce memory values from that point onward, etc.
- there is a key frame at the beginning of each trace data stream 401 i.e., key frames 403a-403c
- a key frame at sequencing numbers 1-7, 9, and 11 e.g., key frame 403d at sequencing number 2.
- Figure 4 also depicts a key frame 403e occurring in data stream 401a between sequencing numbers 4 and 5, and a key frame 403f occurring in data stream 401c between sequencing numbers 7 and 12.
- key frames enable the replay component 202 to initiate replay of each trace data stream 401 at various points.
- the replay component 202 can use key frames to initiate execution at different parts in the stream, including at the start of the stream (i.e., using key frame 403a), at sequencing numbers 1, 4, 5, and 9 (which, as depicted, each also correspond with a key frame), and at key frame 403e between sequencing numbers 4 and 5.
- Each section of a particular trace data stream that is bounded by key frames is independent from other sections of that trace, and can also be replayed in parallel.
- key frames depicted in data stream 401a define five such sections (i.e, a first section bounded by key frame 403a and the key frame at sequencing number 1, a second section bounded by the key frame at sequencing number 1 and the key frame at sequencing number 4, a third section bounded by the key frame at sequencing number 4 and key frame 403e, a fourth section bounded by key frame 403e and the key frame at sequencing number 5, and a fifth section bounded by the key frame at sequencing number 5 and the key frame at sequencing number 9).
- Each of these sections is independent from the others, and can be replayed in parallel with those sections.
- independently recorded streams and orderable events/sequencing numbers enable portions of different data streams 401 to be replayed in parallel.
- key frames within individual data streams enable different sections of the same data stream to be replayed in parallel.
- the identification component 201 can identify individual trace sections 401 (e.g., sections between key frames and/or sequencing numbers), and identify one or more orderings among these sections (e.g., based on the sequencing numbers). The replay component 201 can then replay these trace sections, potentially in parallel, while the persistence component 203 stores encountered memory locations/values in a persistence data structure 304 corresponding to each trace section.
- individual trace sections 401 e.g., sections between key frames and/or sequencing numbers
- the replay component 201 can then replay these trace sections, potentially in parallel, while the persistence component 203 stores encountered memory locations/values in a persistence data structure 304 corresponding to each trace section.
- the identification component 201 can identify an executable event of interest in the trace file 400, including a memory address of interest that corresponds to that executable event (e.g., a memory address read from or written to by that event). The identification component 201 can then identify independent trace sections among the trace data streams 401 that would execute prior to that event, and which persistence data structures (e.g., 304a-304f) correspond to those trace sections. The identification component 201 also can identify one or more orderings among these trace sections based, for example, on the sequencing numbers. The search component 204 then searches through the identified persistence data structures 304, in turn, using an ordering identified by the identification component 201, until the memory address of interest is encountered. The presentation component 205 then returns a value of the memory address of interest from the persistence data structure.
- an executable event of interest in the trace file 400, including a memory address of interest that corresponds to that executable event (e.g., a memory address read from or written to by that event).
- the identification component 201 can then identify independent trace sections among
- the persistence data structures 304 need not exist prior to a request for a memory value. For example, after the identification component 201 identifies independent trace sections among the trace data streams 401 that would execute prior to that event, the identification component 201 may determine that one or more of the corresponding persistence data structures 304 does not yet exist. Thus, the replay component 202 can then replay the identified trace sections to create the persistence data structures 304 on-demand.
- Figure 5 illustrates an example timing diagram 500 of replay of trace file 400 of Figure 4 , with a specified event of interest 502.
- Figure 5 illustrates a timeline showing replay of executable entity 501a as recorded by data stream 401a, replay of executable entity 501b as recorded by data stream 401b, and replay of executable entity 501c as recorded by data stream 401c.
- the timing diagram 500 also represents the occurrence of the orderable events of Figure 4 , including sequencing numbers 1-12.
- key frames are denoted with a vertical line.
- sequencing numbers 1-7, 9 and 11 are depicted in connection with a key frame.
- key frames occurring at a sequencing number are identified herein by the corresponding sequencing number.
- the timing diagram 500 also represents four additional key frames 502a-502d not occurring along with a sequencing number, including key frames 502a and 502b at the beginning of data streams 401b and 401c, and key frames 502c and 502d occurring in data streams 401a and 401c (i.e., corresponding to key frames 403e and 403f in Figure 4 ).
- different trace sections are defined based on bounding key frames.
- these sections are identified generally herein based on the two key frames bordering the sections, separated by a colon (:).
- 1:4 refers the trace section that occurs between the key frame at sequencing number 1 and the key frame at sequencing number 4.
- use of a square bracket i.e., "[" or "]" indicates the endpoint as being inclusive
- use of a parenthesis i.e., "(" or ")
- [1:4) would denote section a section beginning with the instruction at sequencing number one, and ending with the instruction just prior to sequencing number 4.
- the identification component 201 chooses one or more orderings among the trace sections.
- the chosen ordering defines a total ordering across all instructions in the trace file 400.
- Such an ordering may be chosen to ensure that a debugger can present a consistent view of program state (e.g., memory and registers) at all points in the trace, and no matter how the replay component 202 actually arrived at that point in execution (e.g., whether it performed a forward replay or a backwards replay to arrive at a breakpoint).
- program state e.g., memory and registers
- replay component 202 e.g., whether it performed a forward replay or a backwards replay to arrive at a breakpoint.
- other examples may present one of multiple valid orderings each time a different point in the trace is reached.
- the chosen ordering also provides an ordering with which the search component 204 searches persistence data structures 304 (though in reverse order).
- valid orderings place the trace sections in an order that would ensure that sequencing events are presented in proper order (i.e., in their monotonically increasing order), but do not need to reproduce the exact order in which all instructions executed at trace time.
- a valid ordering needs to ensure that the instruction at sequencing event three is presented prior to the instruction at sequencing event four—but does not need to ensure that the instruction just after sequencing event three is presented prior to the instruction just after sequencing event four, since they are in different threads (and since, as discussed previously, threads are recorded independently).
- a valid ordering would place section 3:7 prior to trace section 4:502c.
- a valid ordering need not include sections from all traces (e.g., because execution of one thread may not be relevant to obtaining desired data at a given point of interest), and multiple valid orderings could be chosen.
- One valid ordering using only trace data streams 401a and 401c that could be chosen to arrive at event of interest 504 is: [1:4), [502b:3], [4:502c), (3:7), [502c:5), and [5:9).
- Another valid ordering using all the trace data streams could be: [1:4), [502a:2), [502b:3), [2:6), [3:7), [4:502c), [502c:5), and [5:9).
- the replay component 202 need not actually perform the replay of the code sections according to this determined ordering. Instead, replay component 202 can execute the sections in any order, so long as the results obtained by the replay are presented according to the constraints of the determined ordering. Thus, the replay component 202 can queue the trace sections for replay in any order, and can execute them in any order at one or more processing units 102a, so long as the results are presented in the chosen ordering.
- FIG 5 also illustrates seven persistence data structures 503a-503g (referred to generally as persistence data structures 503), each of which corresponds to one of the trace sections.
- persistence data structure 503a corresponds to section 1:4
- persistence data structure 503b corresponds to trace section 502a:2, etc.
- each persistence data structure 503 is created by the persistence component 203 while the replay component 202 replays the corresponding trace section.
- the persistence component 203 writes into each persistence data structure 503 the memory addresses that are consumed by a processing unit 102a as that processing unit replays executable events in the corresponding trace section, as well as the memory values consumed at those addresses.
- a memory address/value may be consumed due to a memory read or a write operation by an executable event.
- a persistence data structure is created by recording evictions from cache 303, though it may be created in some other way.
- each persistence data structure 503 only records the most recently seen value at a memory address for a give trace section.
- trace section 502a:2 the same memory address is consumed two times (as indicated by the ticks), and in trace section 502b:3 that memory address is again consumed three times; however, there is only one entry for the memory address in each of persistence data structures 503b and 503c (as indicated by the solid circles in persistence data structures 503b and 503c).
- Those entries reflect the value seen the final time the address was consumed in that section (e.g., the farthest right memory address consumption in each section).
- the persistence component 204 overwrites a prior value associated with that address in the section's persistence data structure 503. As will become clear later, recording only the latest value seen brings about efficiencies during search by the search component 204.
- creation of a given persistence data structure 503 may be fully independent for that data structure, or may utilize information from another persistence data structure 503.
- persistence data structure 503f (based on section 2:6)
- it may be initially populated, at least in part, with values from persistence data structure 503b (based on section 503b:2), if it exists.
- persistence data structure 503b (based on section 503b:2)
- Figure 5 also includes a point of interest 504 in section 5:9 that consumes a memory address, such as the memory address already referred to in connection with sections 502a:2 and 502b:3 and persistence data structures 503b and 503c.
- Point of interest 504 may, for example, be a user-specified point of interest.
- the replay component 202 may first replay events 505 prior to that event (i.e., starting at key frame 5) in section 5:9 in order to determine if the same memory address was consumed by those events. If it was, then the replay component 202 can simply return that value.
- the search component search component 204 can locate the value in that persistence data structure.
- the replay component may also consult the cache 303 to see if a cache line corresponding to the memory address. If it's in the cache 303, then the replay component 202 can return the value from the cache 303.
- the search component 204 searches persistence data structures 503 from prior trace sections, in reverse order based on the defined ordering, until a persistence data structure 503 recording the memory address is found.
- the search component 204 would initiate a search of persistence data structures 503 in the order of 503g, 503f, 503e, 503d, 503c, 503b, and 503a.
- the search component 204 would actually search persistence data structures 503g, 503f, 503e, 503d, and 503c, stopping at persistence data structure 503c where it obtains the value. Note that because the persistence data structures 503 record only the most recently seen value, there is no need to continue searching once a match is found. Thus persistence data structures 503b and 503a are not searched.
- persistence data structures 503 may be created prior to a request of a memory value, or may be created on-demand when a request is made. It will be appreciated that persistence data structures 503 may be persisted to durable storage (e.g., in persisted replay data 110). As such, the persistence data structures 503 may be created not only in a current debugging session, but may have been created from an entirely separate prior debugging session. In addition, examples may also discard persistence data structures 503 in order to preserve memory and/or disk space. For example, examples may discard the least recently created persistence data structures 503, the least recently accessed persistence data structures 503, etc.
- some of the persistence data structures 503 may be combinable.
- adjacent persistence data structures that are separated by a key frame that does not correspond to a sequencing number may, in some examples, be merged or combined into a single structure.
- persistence data structures 503d and 503e maybe combinable.
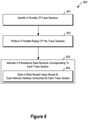
- Figure 6 illustrates an example flow chart of a method 600 for preserving memory values during trace replay.
- Figure 6 is described in connection with the components and data described in connection with Figures 1-5 . While method 600 is illustrated as a series of acts, the particular ordering of the acts in the method 600 is not limited to the ordering shown.
- method 600 includes an act 601 of identifying a plurality of trace sections.
- Act 601 can comprise identifying, from among a plurality of trace data streams, a plurality of trace sections that each represents one or more events executed by an executable entity over a period of time.
- the identification component 201 can identify a plurality of trace sections (e.g., sections 1:4, 502a:2, 502b:3, 2:6, 3:7, 4:502c, 502c:5, and 5:9, as seen in Figure 5 ) from among trace data streams 401 of trace file 400, to be replayed by the replay component 202.
- trace sections may be selected based on routine replay of a trace file 400, or may be selected based on a specific request (e.g., for event of interest 504 at a debugging application) to obtain a value of a memory address for a particular event of interest.
- a specific request e.g., for event of interest 504 at a debugging application
- Method 600 also includes an act 602 of performing a parallel replay of the trace sections.
- Act 602 can comprise performing a parallel replay of two or more of the plurality of trace sections at the plurality of processing units, including concurrently replaying each trace of the two or more trace sections at a different processing unit of the plurality of processing units.
- the replay component 202 can queue a plurality of trace sections (e.g., sections 1:4, 502a:2, 502b:3, 2:6, 3:7, 4:502c, 502c:5, and 5:9) for replay by the processing units 102a.
- the processing units 102a can then replay each trace section independently, and in any order.
- Method 600 also includes an act 603 of maintaining a persistence data structure corresponding to each trace section.
- Act 603 can comprise, while concurrently replaying each trace section at a different processing unit, maintaining a different persistence data structure corresponding to each trace section.
- the persistence component 203 can maintain persistence data structures 304/503, including a different persistence data structure for each trace section that is being replayed.
- act 603 also includes an act 604 of storing a most recent value stored at each memory address consumed by each trace section.
- Act 604 can comprise, for each trace section, storing, in the trace section's corresponding persistence data structure, a record of each memory address consumed by the processing unit while replaying the trace section, and a most recent memory value stored at each memory address during replay of the trace section.
- the persistence component 203 can record, in each persistence data structure 503, each memory address encountered during replay of the corresponding trace section along with values encountered.
- each persistence data structure 503 includes only the most recently seen value at each address.
- trace sections 502a:2 and 502b:3 both encountered the same memory address multiple times, but their persistence data (503b and 503c) only each include a single entry for that address, storing the most recently seen value for that address.
- the persistence component 203 maintains the persistence data structures 503 by recording the evictions from the cache 303.
- the method 600 may also include defining an ordering among the plurality of trace sections based at least on orderable events across the plurality of trace data streams.
- the identification component 201 can identify an ordering among sections 1:4, 502a:2, 502b:3, 2:6, 3:7, 4:502c, 502c:5, and 5:9) based, at least in part, on the sequencing numbers. While these sections can be replayed individually and in any order by the processing units 102a, the results of the replay are presented based on the defined ordering, in order to provide a valid view of execution that can be used for later analysis, such as by search component 204.
- Figure 7 illustrates an example flow chart of a method 700 for returning a memory value during trace replay.
- Figure 7 is described in connection with the components and data described in connection with Figure 1-5 . While method 700 is illustrated as a series of acts, the particular ordering of the acts in the method 700 is not limited to the ordering shown.
- method 700 includes an act 701 of identifying an event for which a memory value at a memory address is requested.
- Act 701 can comprise identifying, in a particular trace data stream, an event for which a memory value at a memory address associated with the event is requested.
- the identification component 201 can identify an event of interest 504 in data steam 401a of trace file 400.
- the event of interest may, for example, be an event of interest specified in a debugging application.
- Method 700 also includes an act 702 of identifying an ordering among trace sections across a plurality of trace data streams.
- Act 702 can comprise identifying a defined ordering among a plurality of trace sections across a plurality of trace data streams that include the particular trace data stream.
- the identification component 202 can identify an ordering among trace sections 1:4, 502a:2, 502b:3, 2:6, 3:7, 4:502c, 502c:5, and 5:9 of Figure 5 based, at least in part the sequencing numbers.
- Method 700 also includes an act 703 of identifying a plurality of persistence data structures, each associated with a different trace section.
- Act 703 can comprise identifying a plurality of persistence data structures that are each associated with a different trace section, and that occur prior to the location in the trace data stream based on the defined ordering.
- the identification component 202 can identify persistence data structures 503a-503e, corresponding to trace sections 1:4, 502a:2, 502b:3, 2:6, 3:7, 4:502c, 502c:5, and 5:9.
- Method 700 also includes an act 704 of identifying an ordering among the plurality of persistence data structures.
- Act 704 can comprise identifying an ordering among the plurality of persistence data structures based on the defined ordering.
- the identification component 202 can identify an ordering of the persistence data structures 503, based on a reverse ordering of the trace sections.
- the identification component 202 can identify an ordering of the persistence data structures 503 as: 503g, 503f, 503e, 503d, 503c, 503b, and 503a.
- Method 700 also includes an act 705 of searching the persistence data structures, in turn, until the memory address is identified.
- Act 705 can comprise searching, in turn, and based on the identified ordering among the plurality of persistence data structures, one or more of the plurality persistence data structures until the memory address is identified in a particular persistence data structure.
- the search component 204 can initiate a search for the requested memory address according to the ordering identified in act 704. In this case, the search component 204 would identify the requested memory address in persistence data structure 503c.
- Method 700 also includes an act 706 of ceasing further searching and returning a value stored in a persistence data structure.
- Act 706 can comprise, when the memory address is identified in the particular persistence data structure ceasing further searching the plurality persistence data structures, and returning the value associated at the memory address, as stored in the particular persistence data structure. For example, upon identifying the requested memory address in persistence data structure 503c, the search component 204 can cease the search, and then the presentation component 205 can return/display the value stored for the address in persistence data structure 503c.
- the method 700 may include one or more of (i) prior to searching the persistence data structures, replaying one or more instructions in the particular data stream that occurs between an orderable event and the event for which a memory value is requested to search for the memory address, or (ii) prior to searching the persistence data structures, searching a processor cache for the memory address.
- the examples described herein preserve memory values during trace replay by maintaining plurality of persistence data structures during trace replay, which then provide an efficient mechanism returning a memory value, by progressively searching these persistence data structures only until the memory address of the requested memory value is encountered.
- Examples described herein may comprise or utilize a special-purpose or general-purpose computer system that includes computer hardware, such as, for example, one or more processors and system memory, as discussed in greater detail below. Examples also include physical and other computer-readable media for carrying or storing computer-executable instructions and/or data structures. Such computer-readable media can be any available media that can be accessed by a general-purpose or special-purpose computer system. Computer-readable media that store computer-executable instructions and/or data structures are computer storage media. Computer-readable media that carry computer-executable instructions and/or data structures are transmission media. Thus, by way of example, and not limitation, examples can comprise at least two distinctly different kinds of computer-readable media: computer storage media and transmission media.
- Computer storage media are physical storage media that store computer-executable instructions and/or data structures.
- Physical storage media include computer hardware, such as RAM, ROM, EEPROM, solid state drives (“SSDs”), flash memory, phase-change memory (“PCM”), optical disk storage, magnetic disk storage or other magnetic storage devices, or any other hardware storage device(s) which can be used to store program code in the form of computer-executable instructions or data structures, which can be accessed and executed by a general-purpose or special-purpose computer system to implement the disclosed functionality.
- Transmission media can include a network and/or data links which can be used to carry program code in the form of computer-executable instructions or data structures, and which can be accessed by a general-purpose or special-purpose computer system.
- a "network" is defined as one or more data links that enable the transport of electronic data between computer systems and/or modules and/or other electronic devices.
- program code in the form of computer-executable instructions or data structures can be transferred automatically from transmission media to computer storage media (or vice versa).
- program code in the form of computer-executable instructions or data structures received over a network or data link can be buffered in RAM within a network interface module (e.g., a "NIC"), and then eventually transferred to computer system RAM and/or to less volatile computer storage media at a computer system.
- a network interface module e.g., a "NIC”
- computer storage media can be included in computer system components that also (or even primarily) utilize transmission media.
- Computer-executable instructions comprise, for example, instructions and data which, when executed at one or more processors, cause a general-purpose computer system, special-purpose computer system, or special-purpose processing device to perform a certain function or group of functions.
- Computer-executable instructions may be, for example, binaries, intermediate format instructions such as assembly language, or even source code.
- Examples described herein may be practiced in network computing environments with many types of computer system configurations, including, personal computers, desktop computers, laptop computers, message processors, hand-held devices, multi-processor systems, microprocessor-based or programmable consumer electronics, network PCs, minicomputers, mainframe computers, mobile telephones, PDAs, tablets, pagers, routers, switches, and the like.
- the examples may also be practiced in distributed system environments where local and remote computer systems, which are linked (either by hardwired data links, wireless data links, or by a combination of hardwired and wireless data links) through a network, both perform tasks.
- a computer system may include a plurality of constituent computer systems.
- program modules may be located in both local and remote memory storage devices.
- Cloud computing environments may be distributed, although this is not required. When distributed, cloud computing environments may be distributed internationally within an organization and/or have components possessed across multiple organizations.
- “cloud computing” is defined as a model for enabling on-demand network access to a shared pool of configurable computing resources (e.g., networks, servers, storage, applications, and services). The definition of “cloud computing” is not limited to any of the other numerous advantages that can be obtained from such a model when properly deployed.
- a cloud computing model can be composed of various characteristics, such as on-demand self-service, broad network access, resource pooling, rapid elasticity, measured service, and so forth.
- a cloud computing model may also come in the form of various service models such as, for example, Software as a Service (“SaaS”), Platform as a Service (“PaaS”), and Infrastructure as a Service (“IaaS”).
- SaaS Software as a Service
- PaaS Platform as a Service
- IaaS Infrastructure as a Service
- the cloud computing model may also be deployed using different deployment models such as private cloud, community cloud, public cloud, hybrid cloud, and so forth.
- Some examples may comprise a system that includes one or more hosts that are each capable of running one or more virtual machines.
- virtual machines emulate an operational computing system, supporting an operating system and perhaps one or more other applications as well.
- each host includes a hypervisor that emulates virtual resources for the virtual machines using physical resources that are abstracted from view of the virtual machines.
- the hypervisor also provides proper isolation between the virtual machines.
- the hypervisor provides the illusion that the virtual machine is interfacing with a physical resource, even though the virtual machine only interfaces with the appearance (e.g., a virtual resource) of a physical resource. Examples of physical resources including processing capacity, memory, disk space, network bandwidth, media drives, and so forth.
Claims (12)
- Procédé, mis en œuvre au niveau d'un système informatique (101) qui inclut une pluralité d'unités de traitement (102a), pour préserver des valeurs de mémoire durant une réexécution de traces, le procédé comprenant :une identification (601), parmi une pluralité de flux de données de traces (401), d'une pluralité de sections de traces qui représentent chacune un ou plusieurs événements exécutés par une entité exécutable (501a-501c) sur une période de temps ;une réalisation (602) d'une réexécution parallèle de deux de la pluralité de sections de traces ou plus au niveau de la pluralité d'unités de traitement, y compris une réexécution de manière simultanée de chaque trace des deux sections de traces ou plus au niveau d'une unité de traitement différente de la pluralité d'unités de traitement ; ettout en réexécutant de manière simultanée chaque section de traces au niveau d'une unité de traitement différente, un maintien (603) d'une structure de données de persistance (304, 503) différente correspondant à chaque section de traces, y compris, pour chaque section de traces :
un stockage (604), dans la structure de données de persistance (304, 503) correspondante de la section de traces, d'un enregistrement de chaque adresse mémoire consommée par l'unité de traitement tout en réexécutant la section de traces, et d'une valeur de mémoire la plus récente stockée à chaque adresse mémoire durant la réexécution de la section de traces. - Procédé selon la revendication 1, comprenant en outre une définition d'un ordre dans toutes les instructions dans la pluralité de flux de données de traces, au moins sur la base d'événements pouvant être ordonnés se produisant dans la pluralité de flux de données de traces.
- Procédé selon la revendication 1, dans lequel le stockage d'un enregistrement de chaque adresse mémoire et de la valeur de mémoire la plus récente stockée à chaque adresse mémoire comprend un stockage d'évictions de cache de processeur.
- Procédé selon la revendication 1, dans lequel le stockage d'un enregistrement de chaque adresse mémoire et de la valeur de mémoire la plus récente stockée à chaque adresse mémoire comprend un stockage d'une valeur d'une lecture non mise en cache.
- Procédé selon la revendication 1, dans lequel l'identification de la pluralité de sections de traces comprend une identification d'au moins une section de traces bordée par au moins un de : un événement pouvant être ordonné ou une image clé.
- Procédé selon la revendication 1, dans lequel le maintien d'une structure de données de persistance (304, 503g) pour au moins une section de traces comprend une obtention d'au moins une valeur de mémoire à partir d'une autre structure de données de persistance (304, 503f) qui correspond à une section de traces adjacente sur le même flux de données (401a).
- Procédé selon la revendication 1, dans lequel le stockage d'une valeur de mémoire la plus récente stockée à une adresse mémoire durant une réexécution d'au moins une section de traces comprend un écrasement d'une valeur de mémoire préalable à l'adresse mémoire.
- Procédé selon la revendication 1, dans lequel le stockage de la valeur de mémoire la plus récente stockée à chaque adresse mémoire durant une réexécution de la section de traces comprend un stockage, pour chaque adresse mémoire consommée par l'unité de traitement tout en réexécutant la section de traces, de seulement la valeur de mémoire la plus récente stockée à l'adresse mémoire durant une réexécution de la section de traces.
- Système informatique (101), comprenant :un ou plusieurs processeurs (102) ; etun ou plusieurs supports de stockage lisibles par ordinateur (104) présentant stockées sur ceux-ci des instructions exécutables par ordinateur qui, lorsqu'elles sont exécutées au niveau des un ou plusieurs processeurs (102), amènent le système informatique (101) à préserver des valeurs de mémoire durant une réexécution de traces, les instructions exécutables par ordinateur incluant des instructions qui sont exécutables pour amener le système informatique (102) à réaliser au moins ce qui suit :identifier (601), parmi une pluralité de flux de données de traces (401), une pluralité de sections de traces qui représentent chacune un ou plusieurs événements exécutés par une entité exécutable (501a-501c) sur une période de temps ;réaliser (602) une réexécution parallèle de deux de la pluralité de sections de traces ou plus au niveau d'une pluralité d'unités de traitement des un ou plusieurs processeurs, y compris une réexécution de manière simultanée de chaque trace des deux sections de traces ou plus au niveau d'une unité de traitement différente ; ettout en réexécutant de manière simultanée chaque section de traces au niveau d'une unité de traitement différente, maintenir (603) une structure de données de persistance (304, 503) différente correspondant à chaque section de traces, y compris, pour chaque section de traces :
stocker (604), dans la structure de données de persistance (304, 503) correspondante de la section de traces, un enregistrement de chaque adresse mémoire consommée par l'unité de traitement tout en réexécutant la section de traces, et une valeur de mémoire la plus récente stockée à chaque adresse mémoire durant la réexécution de la section de traces. - Système informatique selon la revendication 9, dans lequel les instructions exécutables par ordinateur, lorsqu'elles sont exécutées au niveau des un ou plusieurs processeurs, amènent également le système informatique à définir un ordre parmi la pluralité de sections de traces au moins sur la base d'événements pouvant être ordonnés dans la pluralité de flux de données de traces.
- Système informatique selon la revendication 9, dans lequel le stockage d'un enregistrement de chaque adresse mémoire et de la valeur de mémoire la plus récente stockée à chaque adresse mémoire comprend un stockage d'évictions de cache de processeur.
- Système informatique selon la revendication 9, dans lequel le maintien d'une structure de données de persistance (304, 503g) pour au moins une section de traces comprend une obtention d'au moins une valeur de mémoire à partir d'une autre structure de données de persistance (304, 503f) qui correspond à une section de traces adjacente sur le même flux de données (401a).
Applications Claiming Priority (2)
| Application Number | Priority Date | Filing Date | Title |
|---|---|---|---|
| US15/423,030 US10180799B2 (en) | 2017-02-02 | 2017-02-02 | Efficient retrieval of memory values during trace replay |
| PCT/US2018/015628 WO2018144350A2 (fr) | 2017-02-02 | 2018-01-29 | Extraction efficace de valeurs de mémoire pendant une relecture de trace |
Publications (2)
| Publication Number | Publication Date |
|---|---|
| EP3577564A2 EP3577564A2 (fr) | 2019-12-11 |
| EP3577564B1 true EP3577564B1 (fr) | 2022-03-02 |
Family
ID=61768405
Family Applications (1)
| Application Number | Title | Priority Date | Filing Date |
|---|---|---|---|
| EP18713409.3A Active EP3577564B1 (fr) | 2017-02-02 | 2018-01-29 | Extraction efficace de valeurs de mémoire pendant une relecture de trace |
Country Status (4)
| Country | Link |
|---|---|
| US (1) | US10180799B2 (fr) |
| EP (1) | EP3577564B1 (fr) |
| CN (1) | CN110249315B (fr) |
| WO (1) | WO2018144350A2 (fr) |
Families Citing this family (5)
| Publication number | Priority date | Publication date | Assignee | Title |
|---|---|---|---|---|
| US10185645B2 (en) * | 2017-03-08 | 2019-01-22 | Microsoft Technology Licensing, Llc | Resource lifetime analysis using a time-travel trace |
| US10698792B2 (en) * | 2018-05-02 | 2020-06-30 | Microsoft Technology Licensing, Llc | Execution control with cross-level trace mapping |
| US11068378B2 (en) * | 2019-04-11 | 2021-07-20 | Microsoft Technology Licensing, Llc | Memory value exposure in time-travel debugging traces |
| US10990506B2 (en) | 2019-04-11 | 2021-04-27 | Microsoft Technology Licensing, Llc | Cross-thread memory indexing in time-travel debugging traces |
| US11550493B2 (en) * | 2020-11-06 | 2023-01-10 | Hewlett Packard Enterprise Development Lp | Container index including a tracking data structure |
Family Cites Families (15)
| Publication number | Priority date | Publication date | Assignee | Title |
|---|---|---|---|---|
| US5802272A (en) * | 1994-12-19 | 1998-09-01 | Digital Equipment Corporation | Method and apparatus for tracing unpredictable execution flows in a trace buffer of a high-speed computer system |
| US6901581B1 (en) | 2002-10-02 | 2005-05-31 | Eridon Corporation | Method for software debugging via simulated re-execution of a computer program |
| US7822741B2 (en) * | 2004-06-21 | 2010-10-26 | Microsoft Corporation | API for programmatic retrieval and replay of database trace |
| US8271955B1 (en) | 2004-07-23 | 2012-09-18 | Green Hille Software, Inc. | Forward post-execution software debugger |
| US7620938B2 (en) * | 2005-10-31 | 2009-11-17 | Microsoft Corporation | Compressed program recording |
| US8832682B2 (en) | 2008-03-28 | 2014-09-09 | Vmware, Inc. | Trace collection for a virtual machine |
| US8423965B2 (en) | 2009-06-23 | 2013-04-16 | Microsoft Corporation | Tracing of data flow |
| US8626993B2 (en) * | 2011-11-18 | 2014-01-07 | Apple Inc. | Method for tracking memory usages of a data processing system |
| US9098308B2 (en) * | 2012-06-26 | 2015-08-04 | Marvell World Trade Ltd. | Method and apparatus for code performance analysis based on execution trace information |
| US8935673B1 (en) | 2012-11-30 | 2015-01-13 | Cadence Design Systems, Inc. | System and method for debugging computer program based on execution history |
| US10331452B2 (en) * | 2013-06-27 | 2019-06-25 | Intel Corporation | Tracking mode of a processing device in instruction tracing systems |
| US9875173B2 (en) | 2014-06-30 | 2018-01-23 | Microsoft Technology Licensing, Llc | Time travel debugging in managed runtime |
| US10430309B2 (en) * | 2015-02-23 | 2019-10-01 | Red Hat, Inc. | Duplicating a task sequence from a graphical user interface interaction for a development application in view of trace data |
| US9535820B2 (en) * | 2015-03-27 | 2017-01-03 | Intel Corporation | Technologies for application validation in persistent memory systems |
| GB201508034D0 (en) | 2015-05-12 | 2015-06-24 | Undo Ltd | Debugging systems |
-
2017
- 2017-02-02 US US15/423,030 patent/US10180799B2/en active Active
-
2018
- 2018-01-29 WO PCT/US2018/015628 patent/WO2018144350A2/fr unknown
- 2018-01-29 CN CN201880009735.7A patent/CN110249315B/zh active Active
- 2018-01-29 EP EP18713409.3A patent/EP3577564B1/fr active Active
Also Published As
| Publication number | Publication date |
|---|---|
| CN110249315B (zh) | 2023-06-20 |
| WO2018144350A2 (fr) | 2018-08-09 |
| EP3577564A2 (fr) | 2019-12-11 |
| US10180799B2 (en) | 2019-01-15 |
| US20180217768A1 (en) | 2018-08-02 |
| WO2018144350A3 (fr) | 2018-10-11 |
| CN110249315A (zh) | 2019-09-17 |
Similar Documents
| Publication | Publication Date | Title |
|---|---|---|
| US10235273B2 (en) | Indexing a trace by insertion of key frames for replay responsiveness | |
| EP3577564B1 (fr) | Extraction efficace de valeurs de mémoire pendant une relecture de trace | |
| EP3785124B1 (fr) | États de validité de mémoire dans un débogage à déplacement temporel | |
| US11055197B2 (en) | Tentative execution of code in a debugger | |
| US9959194B1 (en) | Indexing a trace by insertion of memory snapshots for replay responsiveness | |
| US10296442B2 (en) | Distributed time-travel trace recording and replay | |
| US10949332B2 (en) | Data race analysis based on altering function internal loads during time-travel debugging | |
| CN110168508B (zh) | 监测断点出现的存储器位置的方法、计算机系统和介质 | |
| CN110168507B (zh) | 可执行代码的推测重放 | |
| EP3652648B1 (fr) | Relecture de traces de déplacement dans le temps dépendant d'un comportement indéfini de processeur | |
| US11836070B2 (en) | Reducing trace recording overheads with targeted recording via partial snapshots | |
| CN113711190A (zh) | 时间旅行调试追踪中的跨线程存储器索引 | |
| EP3559813B1 (fr) | Reproduction parallèle d'un code exécutable | |
| AU2018309575B2 (en) | Focused execution of traced code in a debugger | |
| CN113785284A (zh) | 基于历史调试追踪来标识数据不一致和数据争用 | |
| CN113678110A (zh) | 时间旅行调试追踪中的存储器值暴露 |
Legal Events
| Date | Code | Title | Description |
|---|---|---|---|
| STAA | Information on the status of an ep patent application or granted ep patent |
Free format text: STATUS: UNKNOWN |
|
| STAA | Information on the status of an ep patent application or granted ep patent |
Free format text: STATUS: THE INTERNATIONAL PUBLICATION HAS BEEN MADE |
|
| PUAI | Public reference made under article 153(3) epc to a published international application that has entered the european phase |
Free format text: ORIGINAL CODE: 0009012 |
|
| STAA | Information on the status of an ep patent application or granted ep patent |
Free format text: STATUS: REQUEST FOR EXAMINATION WAS MADE |
|
| 17P | Request for examination filed |
Effective date: 20190730 |
|
| AK | Designated contracting states |
Kind code of ref document: A2 Designated state(s): AL AT BE BG CH CY CZ DE DK EE ES FI FR GB GR HR HU IE IS IT LI LT LU LV MC MK MT NL NO PL PT RO RS SE SI SK SM TR |
|
| AX | Request for extension of the european patent |
Extension state: BA ME |
|
| DAV | Request for validation of the european patent (deleted) | ||
| DAX | Request for extension of the european patent (deleted) | ||
| STAA | Information on the status of an ep patent application or granted ep patent |
Free format text: STATUS: EXAMINATION IS IN PROGRESS |
|
| 17Q | First examination report despatched |
Effective date: 20210906 |
|
| RAP3 | Party data changed (applicant data changed or rights of an application transferred) |
Owner name: MICROSOFT TECHNOLOGY LICENSING, LLC |
|
| GRAP | Despatch of communication of intention to grant a patent |
Free format text: ORIGINAL CODE: EPIDOSNIGR1 |
|
| STAA | Information on the status of an ep patent application or granted ep patent |
Free format text: STATUS: GRANT OF PATENT IS INTENDED |
|
| RAP3 | Party data changed (applicant data changed or rights of an application transferred) |
Owner name: MICROSOFT TECHNOLOGY LICENSING, LLC |
|
| RIC1 | Information provided on ipc code assigned before grant |
Ipc: G06F 12/12 20160101ALI20211013BHEP Ipc: G06F 11/36 20060101ALI20211013BHEP Ipc: G06F 11/34 20060101AFI20211013BHEP |
|
| INTG | Intention to grant announced |
Effective date: 20211105 |
|
| GRAS | Grant fee paid |
Free format text: ORIGINAL CODE: EPIDOSNIGR3 |
|
| GRAA | (expected) grant |
Free format text: ORIGINAL CODE: 0009210 |
|
| STAA | Information on the status of an ep patent application or granted ep patent |
Free format text: STATUS: THE PATENT HAS BEEN GRANTED |
|
| AK | Designated contracting states |
Kind code of ref document: B1 Designated state(s): AL AT BE BG CH CY CZ DE DK EE ES FI FR GB GR HR HU IE IS IT LI LT LU LV MC MK MT NL NO PL PT RO RS SE SI SK SM TR |
|
| REG | Reference to a national code |
Ref country code: GB Ref legal event code: FG4D |
|
| REG | Reference to a national code |
Ref country code: CH Ref legal event code: EP Ref country code: AT Ref legal event code: REF Ref document number: 1472832 Country of ref document: AT Kind code of ref document: T Effective date: 20220315 |
|
| REG | Reference to a national code |
Ref country code: DE Ref legal event code: R096 Ref document number: 602018031567 Country of ref document: DE |
|
| REG | Reference to a national code |
Ref country code: IE Ref legal event code: FG4D |
|
| REG | Reference to a national code |
Ref country code: NL Ref legal event code: FP |
|
| REG | Reference to a national code |
Ref country code: LT Ref legal event code: MG9D |
|
| PG25 | Lapsed in a contracting state [announced via postgrant information from national office to epo] |
Ref country code: SE Free format text: LAPSE BECAUSE OF FAILURE TO SUBMIT A TRANSLATION OF THE DESCRIPTION OR TO PAY THE FEE WITHIN THE PRESCRIBED TIME-LIMIT Effective date: 20220302 Ref country code: RS Free format text: LAPSE BECAUSE OF FAILURE TO SUBMIT A TRANSLATION OF THE DESCRIPTION OR TO PAY THE FEE WITHIN THE PRESCRIBED TIME-LIMIT Effective date: 20220302 Ref country code: NO Free format text: LAPSE BECAUSE OF FAILURE TO SUBMIT A TRANSLATION OF THE DESCRIPTION OR TO PAY THE FEE WITHIN THE PRESCRIBED TIME-LIMIT Effective date: 20220602 Ref country code: LT Free format text: LAPSE BECAUSE OF FAILURE TO SUBMIT A TRANSLATION OF THE DESCRIPTION OR TO PAY THE FEE WITHIN THE PRESCRIBED TIME-LIMIT Effective date: 20220302 Ref country code: HR Free format text: LAPSE BECAUSE OF FAILURE TO SUBMIT A TRANSLATION OF THE DESCRIPTION OR TO PAY THE FEE WITHIN THE PRESCRIBED TIME-LIMIT Effective date: 20220302 Ref country code: ES Free format text: LAPSE BECAUSE OF FAILURE TO SUBMIT A TRANSLATION OF THE DESCRIPTION OR TO PAY THE FEE WITHIN THE PRESCRIBED TIME-LIMIT Effective date: 20220302 Ref country code: BG Free format text: LAPSE BECAUSE OF FAILURE TO SUBMIT A TRANSLATION OF THE DESCRIPTION OR TO PAY THE FEE WITHIN THE PRESCRIBED TIME-LIMIT Effective date: 20220602 |
|
| REG | Reference to a national code |
Ref country code: AT Ref legal event code: MK05 Ref document number: 1472832 Country of ref document: AT Kind code of ref document: T Effective date: 20220302 |
|
| PG25 | Lapsed in a contracting state [announced via postgrant information from national office to epo] |
Ref country code: PL Free format text: LAPSE BECAUSE OF FAILURE TO SUBMIT A TRANSLATION OF THE DESCRIPTION OR TO PAY THE FEE WITHIN THE PRESCRIBED TIME-LIMIT Effective date: 20220302 Ref country code: LV Free format text: LAPSE BECAUSE OF FAILURE TO SUBMIT A TRANSLATION OF THE DESCRIPTION OR TO PAY THE FEE WITHIN THE PRESCRIBED TIME-LIMIT Effective date: 20220302 Ref country code: GR Free format text: LAPSE BECAUSE OF FAILURE TO SUBMIT A TRANSLATION OF THE DESCRIPTION OR TO PAY THE FEE WITHIN THE PRESCRIBED TIME-LIMIT Effective date: 20220603 Ref country code: FI Free format text: LAPSE BECAUSE OF FAILURE TO SUBMIT A TRANSLATION OF THE DESCRIPTION OR TO PAY THE FEE WITHIN THE PRESCRIBED TIME-LIMIT Effective date: 20220302 |
|
| PG25 | Lapsed in a contracting state [announced via postgrant information from national office to epo] |
Ref country code: SM Free format text: LAPSE BECAUSE OF FAILURE TO SUBMIT A TRANSLATION OF THE DESCRIPTION OR TO PAY THE FEE WITHIN THE PRESCRIBED TIME-LIMIT Effective date: 20220302 Ref country code: SK Free format text: LAPSE BECAUSE OF FAILURE TO SUBMIT A TRANSLATION OF THE DESCRIPTION OR TO PAY THE FEE WITHIN THE PRESCRIBED TIME-LIMIT Effective date: 20220302 Ref country code: RO Free format text: LAPSE BECAUSE OF FAILURE TO SUBMIT A TRANSLATION OF THE DESCRIPTION OR TO PAY THE FEE WITHIN THE PRESCRIBED TIME-LIMIT Effective date: 20220302 Ref country code: PT Free format text: LAPSE BECAUSE OF FAILURE TO SUBMIT A TRANSLATION OF THE DESCRIPTION OR TO PAY THE FEE WITHIN THE PRESCRIBED TIME-LIMIT Effective date: 20220704 Ref country code: EE Free format text: LAPSE BECAUSE OF FAILURE TO SUBMIT A TRANSLATION OF THE DESCRIPTION OR TO PAY THE FEE WITHIN THE PRESCRIBED TIME-LIMIT Effective date: 20220302 Ref country code: CZ Free format text: LAPSE BECAUSE OF FAILURE TO SUBMIT A TRANSLATION OF THE DESCRIPTION OR TO PAY THE FEE WITHIN THE PRESCRIBED TIME-LIMIT Effective date: 20220302 Ref country code: AT Free format text: LAPSE BECAUSE OF FAILURE TO SUBMIT A TRANSLATION OF THE DESCRIPTION OR TO PAY THE FEE WITHIN THE PRESCRIBED TIME-LIMIT Effective date: 20220302 |
|
| PG25 | Lapsed in a contracting state [announced via postgrant information from national office to epo] |
Ref country code: IS Free format text: LAPSE BECAUSE OF FAILURE TO SUBMIT A TRANSLATION OF THE DESCRIPTION OR TO PAY THE FEE WITHIN THE PRESCRIBED TIME-LIMIT Effective date: 20220702 Ref country code: AL Free format text: LAPSE BECAUSE OF FAILURE TO SUBMIT A TRANSLATION OF THE DESCRIPTION OR TO PAY THE FEE WITHIN THE PRESCRIBED TIME-LIMIT Effective date: 20220302 |
|
| REG | Reference to a national code |
Ref country code: DE Ref legal event code: R097 Ref document number: 602018031567 Country of ref document: DE |
|
| PLBE | No opposition filed within time limit |
Free format text: ORIGINAL CODE: 0009261 |
|
| STAA | Information on the status of an ep patent application or granted ep patent |
Free format text: STATUS: NO OPPOSITION FILED WITHIN TIME LIMIT |
|
| PG25 | Lapsed in a contracting state [announced via postgrant information from national office to epo] |
Ref country code: DK Free format text: LAPSE BECAUSE OF FAILURE TO SUBMIT A TRANSLATION OF THE DESCRIPTION OR TO PAY THE FEE WITHIN THE PRESCRIBED TIME-LIMIT Effective date: 20220302 |
|
| 26N | No opposition filed |
Effective date: 20221205 |
|
| PG25 | Lapsed in a contracting state [announced via postgrant information from national office to epo] |
Ref country code: SI Free format text: LAPSE BECAUSE OF FAILURE TO SUBMIT A TRANSLATION OF THE DESCRIPTION OR TO PAY THE FEE WITHIN THE PRESCRIBED TIME-LIMIT Effective date: 20220302 |
|
| PGFP | Annual fee paid to national office [announced via postgrant information from national office to epo] |
Ref country code: DE Payment date: 20221207 Year of fee payment: 6 |
|
| P01 | Opt-out of the competence of the unified patent court (upc) registered |
Effective date: 20230505 |
|
| PG25 | Lapsed in a contracting state [announced via postgrant information from national office to epo] |
Ref country code: IT Free format text: LAPSE BECAUSE OF FAILURE TO SUBMIT A TRANSLATION OF THE DESCRIPTION OR TO PAY THE FEE WITHIN THE PRESCRIBED TIME-LIMIT Effective date: 20220302 |
|
| REG | Reference to a national code |
Ref country code: CH Ref legal event code: PL |
|
| PG25 | Lapsed in a contracting state [announced via postgrant information from national office to epo] |
Ref country code: LU Free format text: LAPSE BECAUSE OF NON-PAYMENT OF DUE FEES Effective date: 20230129 |
|
| REG | Reference to a national code |
Ref country code: BE Ref legal event code: MM Effective date: 20230131 |
|
| PG25 | Lapsed in a contracting state [announced via postgrant information from national office to epo] |
Ref country code: LI Free format text: LAPSE BECAUSE OF NON-PAYMENT OF DUE FEES Effective date: 20230131 Ref country code: CH Free format text: LAPSE BECAUSE OF NON-PAYMENT OF DUE FEES Effective date: 20230131 |
|
| PG25 | Lapsed in a contracting state [announced via postgrant information from national office to epo] |
Ref country code: BE Free format text: LAPSE BECAUSE OF NON-PAYMENT OF DUE FEES Effective date: 20230131 |
|
| PGFP | Annual fee paid to national office [announced via postgrant information from national office to epo] |
Ref country code: GB Payment date: 20231219 Year of fee payment: 7 |
|
| PG25 | Lapsed in a contracting state [announced via postgrant information from national office to epo] |
Ref country code: IE Free format text: LAPSE BECAUSE OF NON-PAYMENT OF DUE FEES Effective date: 20230129 |
|
| PGFP | Annual fee paid to national office [announced via postgrant information from national office to epo] |
Ref country code: NL Payment date: 20231219 Year of fee payment: 7 Ref country code: FR Payment date: 20231219 Year of fee payment: 7 |