EP3566992B1 - Equipment service graphical interface - Google Patents
Equipment service graphical interface Download PDFInfo
- Publication number
- EP3566992B1 EP3566992B1 EP19173157.9A EP19173157A EP3566992B1 EP 3566992 B1 EP3566992 B1 EP 3566992B1 EP 19173157 A EP19173157 A EP 19173157A EP 3566992 B1 EP3566992 B1 EP 3566992B1
- Authority
- EP
- European Patent Office
- Prior art keywords
- equipment
- user interface
- graphical user
- entity
- locations
- Prior art date
- Legal status (The legal status is an assumption and is not a legal conclusion. Google has not performed a legal analysis and makes no representation as to the accuracy of the status listed.)
- Active
Links
Images


Classifications
-
- G—PHYSICS
- G06—COMPUTING OR CALCULATING; COUNTING
- G06F—ELECTRIC DIGITAL DATA PROCESSING
- G06F3/00—Input arrangements for transferring data to be processed into a form capable of being handled by the computer; Output arrangements for transferring data from processing unit to output unit, e.g. interface arrangements
- G06F3/01—Input arrangements or combined input and output arrangements for interaction between user and computer
- G06F3/048—Interaction techniques based on graphical user interfaces [GUI]
- G06F3/0481—Interaction techniques based on graphical user interfaces [GUI] based on specific properties of the displayed interaction object or a metaphor-based environment, e.g. interaction with desktop elements like windows or icons, or assisted by a cursor's changing behaviour or appearance
- G06F3/04817—Interaction techniques based on graphical user interfaces [GUI] based on specific properties of the displayed interaction object or a metaphor-based environment, e.g. interaction with desktop elements like windows or icons, or assisted by a cursor's changing behaviour or appearance using icons
-
- B—PERFORMING OPERATIONS; TRANSPORTING
- B66—HOISTING; LIFTING; HAULING
- B66B—ELEVATORS; ESCALATORS OR MOVING WALKWAYS
- B66B5/00—Applications of checking, fault-correcting, or safety devices in elevators
- B66B5/0006—Monitoring devices or performance analysers
-
- B—PERFORMING OPERATIONS; TRANSPORTING
- B66—HOISTING; LIFTING; HAULING
- B66B—ELEVATORS; ESCALATORS OR MOVING WALKWAYS
- B66B5/00—Applications of checking, fault-correcting, or safety devices in elevators
- B66B5/0006—Monitoring devices or performance analysers
- B66B5/0037—Performance analysers
-
- G—PHYSICS
- G06—COMPUTING OR CALCULATING; COUNTING
- G06F—ELECTRIC DIGITAL DATA PROCESSING
- G06F16/00—Information retrieval; Database structures therefor; File system structures therefor
-
- G—PHYSICS
- G06—COMPUTING OR CALCULATING; COUNTING
- G06F—ELECTRIC DIGITAL DATA PROCESSING
- G06F3/00—Input arrangements for transferring data to be processed into a form capable of being handled by the computer; Output arrangements for transferring data from processing unit to output unit, e.g. interface arrangements
- G06F3/01—Input arrangements or combined input and output arrangements for interaction between user and computer
- G06F3/017—Gesture based interaction, e.g. based on a set of recognized hand gestures
-
- G—PHYSICS
- G06—COMPUTING OR CALCULATING; COUNTING
- G06F—ELECTRIC DIGITAL DATA PROCESSING
- G06F3/00—Input arrangements for transferring data to be processed into a form capable of being handled by the computer; Output arrangements for transferring data from processing unit to output unit, e.g. interface arrangements
- G06F3/01—Input arrangements or combined input and output arrangements for interaction between user and computer
- G06F3/048—Interaction techniques based on graphical user interfaces [GUI]
- G06F3/0481—Interaction techniques based on graphical user interfaces [GUI] based on specific properties of the displayed interaction object or a metaphor-based environment, e.g. interaction with desktop elements like windows or icons, or assisted by a cursor's changing behaviour or appearance
- G06F3/0482—Interaction with lists of selectable items, e.g. menus
-
- G—PHYSICS
- G06—COMPUTING OR CALCULATING; COUNTING
- G06F—ELECTRIC DIGITAL DATA PROCESSING
- G06F3/00—Input arrangements for transferring data to be processed into a form capable of being handled by the computer; Output arrangements for transferring data from processing unit to output unit, e.g. interface arrangements
- G06F3/01—Input arrangements or combined input and output arrangements for interaction between user and computer
- G06F3/048—Interaction techniques based on graphical user interfaces [GUI]
- G06F3/0487—Interaction techniques based on graphical user interfaces [GUI] using specific features provided by the input device, e.g. functions controlled by the rotation of a mouse with dual sensing arrangements, or of the nature of the input device, e.g. tap gestures based on pressure sensed by a digitiser
- G06F3/0488—Interaction techniques based on graphical user interfaces [GUI] using specific features provided by the input device, e.g. functions controlled by the rotation of a mouse with dual sensing arrangements, or of the nature of the input device, e.g. tap gestures based on pressure sensed by a digitiser using a touch-screen or digitiser, e.g. input of commands through traced gestures
-
- G—PHYSICS
- G06—COMPUTING OR CALCULATING; COUNTING
- G06F—ELECTRIC DIGITAL DATA PROCESSING
- G06F30/00—Computer-aided design [CAD]
-
- G—PHYSICS
- G06—COMPUTING OR CALCULATING; COUNTING
- G06F—ELECTRIC DIGITAL DATA PROCESSING
- G06F30/00—Computer-aided design [CAD]
- G06F30/10—Geometric CAD
- G06F30/13—Architectural design, e.g. computer-aided architectural design [CAAD] related to design of buildings, bridges, landscapes, production plants or roads
-
- G—PHYSICS
- G06—COMPUTING OR CALCULATING; COUNTING
- G06F—ELECTRIC DIGITAL DATA PROCESSING
- G06F9/00—Arrangements for program control, e.g. control units
- G06F9/06—Arrangements for program control, e.g. control units using stored programs, i.e. using an internal store of processing equipment to receive or retain programs
- G06F9/44—Arrangements for executing specific programs
- G06F9/451—Execution arrangements for user interfaces
-
- H—ELECTRICITY
- H04—ELECTRIC COMMUNICATION TECHNIQUE
- H04W—WIRELESS COMMUNICATION NETWORKS
- H04W4/00—Services specially adapted for wireless communication networks; Facilities therefor
- H04W4/02—Services making use of location information
- H04W4/021—Services related to particular areas, e.g. point of interest [POI] services, venue services or geofences
-
- H—ELECTRICITY
- H04—ELECTRIC COMMUNICATION TECHNIQUE
- H04W—WIRELESS COMMUNICATION NETWORKS
- H04W4/00—Services specially adapted for wireless communication networks; Facilities therefor
- H04W4/02—Services making use of location information
- H04W4/029—Location-based management or tracking services
-
- B—PERFORMING OPERATIONS; TRANSPORTING
- B66—HOISTING; LIFTING; HAULING
- B66B—ELEVATORS; ESCALATORS OR MOVING WALKWAYS
- B66B1/00—Control systems of elevators in general
- B66B1/34—Details, e.g. call counting devices, data transmission from car to control system, devices giving information to the control system
- B66B1/3415—Control system configuration and the data transmission or communication within the control system
- B66B1/3423—Control system configuration, i.e. lay-out
-
- B—PERFORMING OPERATIONS; TRANSPORTING
- B66—HOISTING; LIFTING; HAULING
- B66B—ELEVATORS; ESCALATORS OR MOVING WALKWAYS
- B66B1/00—Control systems of elevators in general
- B66B1/34—Details, e.g. call counting devices, data transmission from car to control system, devices giving information to the control system
- B66B1/3415—Control system configuration and the data transmission or communication within the control system
- B66B1/3446—Data transmission or communication within the control system
- B66B1/3461—Data transmission or communication within the control system between the elevator control system and remote or mobile stations
-
- B—PERFORMING OPERATIONS; TRANSPORTING
- B66—HOISTING; LIFTING; HAULING
- B66B—ELEVATORS; ESCALATORS OR MOVING WALKWAYS
- B66B25/00—Control of escalators or moving walkways
- B66B25/006—Monitoring for maintenance or repair
-
- G—PHYSICS
- G06—COMPUTING OR CALCULATING; COUNTING
- G06F—ELECTRIC DIGITAL DATA PROCESSING
- G06F2203/00—Indexing scheme relating to G06F3/00 - G06F3/048
- G06F2203/048—Indexing scheme relating to G06F3/048
- G06F2203/04806—Zoom, i.e. interaction techniques or interactors for controlling the zooming operation
Definitions
- the present disclosure relates to equipment service systems, and more particularly, to an equipment service graphical interface.
- Equipment system operators may oversee multiple equipment systems at one or more geographic locations.
- Equipment systems can include many components with varying maintenance schedules, expected service lives, and component ages. Overseeing equipment system servicing can be challenging due to the large volume of data, geographical distribution of equipment, and variations in equipment characteristics installed at one or more locations.
- JP 2014/002624 discloses a maintenance business support system for an elevator which sequentially collects the monitoring log of an elevator operation status and the terminal operation status log of a mobile terminal of a maintenance worker.
- JP 2014 002624 A discloses a method and a system according to the preambles of claims 1 and 6, respectively.
- Further embodiments may include where the detected user input action includes a hovering action over at least one of the one or more icons, and the one or more equipment status details are associated with a specific instance of the equipment at the entity location depicted on the map image.
- Further embodiments may include where one or more display characteristics of the one or more icons vary based on the status of the equipment indicative of one or more differences in operational conditions of the equipment.
- Further embodiments may include outputting an activity history on the graphical user interface that summarizes a total number of visits, scheduled visits, predictive maintenance events, and service requests for the equipment at the one or more equipment locations displayed on the graphical user interface for a second predetermined period of time.
- Further embodiments may include outputting a unit summary on the graphical user interface of a plurality of units of the equipment at the one or more equipment locations displayed on the graphical user interface, where each of the units includes an elevator system.
- Further embodiments may include updating the graphical user interface with a plurality of unit status details based on detecting a unit selection from the plurality of units, and replacing the map image on the graphical user interface with a schematic view of a plurality of components of the elevator system including the unit selection.
- inventions may include where the unit status details include the health score for the unit selected, the activity history for the unit selected, and one or more time history plots for the unit selected.
- Further embodiments may include detecting a change in a zoom level of the map image on the graphical user interface, identifying a plurality of entity locations of the entity within a geographic area displayed on the map image, retrieving the equipment servicing data associated with the equipment at the plurality of entity locations from the data repository, updating the map image on the graphical user interface with a plurality of icons indicative of the status of the equipment at the plurality of entity locations, determining an update to a plurality of summary data associated with the equipment at the plurality of entity locations, and updating one or more values displayed on the graphical user interface with the update to the summary data.
- a system includes a processing system, a user interface driver, and a memory system.
- the user interface driver is operable to output a graphical user interface and receive input through the graphical user interface.
- the memory system includes a plurality of instructions stored thereon that, when executed by the processing system, cause the system to perform a plurality of operations.
- the operations include identifying an entity and an entity location of a plurality of equipment.
- a data repository is accessed that includes a plurality of equipment servicing data associated with the equipment at the entity location.
- a map image is output on the graphical user interface including one or more icons indicating one or more equipment locations and status of the equipment based on the equipment servicing data from the data repository.
- One or more equipment status details are selectively displayed on the graphical user interface responsive to a detected user input action.
- inventions of the present disclosure include providing an equipment service graphical interface with a graphical user interface operable to selectively display equipment status details and resizable map images with icons indicating one or more equipment locations and status.
- the equipment service graphical interface can access a data repository and provide summarized results to reduce network traffic with respect to multiple monitoring access systems.
- an exemplary embodiment of an equipment service system 20 including a data collection system 24 is depicted for collecting equipment servicing data for a plurality of equipment 10.
- the equipment 10 can include one or more units 25 with one or more equipment controllers 26 operable to monitor and control the units 25 at one or more entity locations.
- Each of the units 25 can be, for example, an elevator system, where an entity location may include multiple elevator systems (e.g., multiple single elevator car systems or multi-car elevator banks) within a same physical structure, such as a building or parking garage, or may be a campus location with multiple structures including the units 25.
- An entity, such as company or property management group may oversee multiple locations, such as locations 34, 36, that each includes multiple units 25 and equipment controllers 26.
- the equipment controllers 26 may each include respective processors 42 (e.g., microprocessors), and storage mediums 48 that may be computer writeable and readable for controlling and monitoring operations of the units 25.
- the equipment controllers 26 may establish communication through one or more communication pathways 30 with the data collection system 24.
- the communication pathways 30 may be associated with such communication protocols as Bluetooth ® , Wi-Fi, infrared, mobile broadband (e.g., 3G, 4G, etc.), satellite, and others over wired, wireless, and/or optical connections.
- the data collection system 24 may be cloudbased (i.e., in a cloud network environment).
- the data collection system may be local to locations 34, 36, controllers 26, and/or units 25 and may transmit the collected data along the communication pathways to a remote computer system, such as the cloud, equipment service graphical interface 56, monitoring access systems 50, or some other device.
- a remote computer system such as the cloud, equipment service graphical interface 56, monitoring access systems 50, or some other device.
- the equipment service system 20 can also include one or more monitoring access systems 50 operable to interface with the data collection system 24 to retrieve equipment servicing data associated with the equipment 10.
- the monitoring access systems 50 can include, for example, one or more laptop computers 50A, smartphones 50B, tablet computers 50C, and/or other electronic devices.
- the data collection system 24 can include a system 28 operable to provide an equipment service graphical interface 56 including a plurality of graphical user interfaces to the monitoring access systems 50 for interactively viewing and analyzing equipment servicing data associated with the equipment 10.
- the system 28 can be distributed over one or more computer systems that form the data collection system 24, for instance, as one or more cloud-based/networked computer systems. In the example of FIG.
- the system 28 includes a processing system 40, a user interface driver 44, and a memory system 46.
- the user interface driver 44 is operable to output one or more graphical user interfaces for one or more of the monitoring access systems 50 and receive input through graphical user interfaces from one or more monitoring access systems 50. For instance, a keypad, a touchscreen, a pointer device, or other such input device of the one or more monitoring access systems 50 collects user input for further processing by the system 28.
- the memory system 46 includes a plurality of instructions stored thereon that, when executed by the processing system 40, cause the system 28 to perform a plurality of operations.
- the processing system 40 may be but is not limited to a single-processor or multi-processor system of any of a wide array of possible architectures, including field programmable gate array (FPGA), central processing unit (CPU), application specific integrated circuits (ASIC), digital signal processor (DSP) or graphics processing unit (GPU) hardware arranged homogenously or heterogeneously.
- the memory system 46 may include one or more storage devices such as, for example, a random access memory (RAM), read only memory (ROM), or other electronic, optical, magnetic or any other computer readable storage medium.
- equipment servicing data associated with the equipment 10 is stored in a data repository 52, which may be part of the data collection system 24.
- the data repository 52 is accessible by the system 28 and supports filtering and summarizing actions for the one or more monitoring access systems 50.
- the equipment controllers 26, the system 28, or other elements run diagnostics and monitor the performance of the units 25, with the results being stored as equipment servicing data associated with the equipment 10 in the data repository 52.
- the system 28 selectively provides data summarizing the equipment servicing data as needed/requested through the monitoring access systems 50.
- the equipment controllers 26 or other elements can push the equipment servicing data to the data repository 52 as events are observed associated with the units 25.
- the data repository 52 can collect data for many instances of the equipment 10 that may not be relevant to a particular user of the monitoring access systems 50.
- the system 28 can filter the equipment servicing data selected for summarizing and reporting to the monitoring access systems 50 to ensure that relevant data values are reported.
- the system 28 may also interface with a mapping system 54 operable to provide one or more map images for displaying and overlaying of icons indicative of the status of the equipment 10 at the plurality of entity locations 34, 36.
- the memory system 46 can include instructions operable to produce the equipment service graphical interface 56 for interactive display on the monitoring access systems 50, including a plurality of graphical user interfaces as further described herein with respect to FIGS. 2-10 .
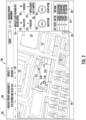
- FIG. 2 depicts an example of a graphical user interface 200 of the equipment service graphical interface 56 of FIG. 1 that can be generated by the system 28 for the monitoring access systems 50 of FIG. 1 .
- the graphical user interface 200 can include an information bar 202, a map image 204, a status data panel 206, an entity 208, and an entity location 210.
- the information bar 202 can include a variety of high-level information, such as a name of the entity 208, a number of buildings managed by the entity 208, a number of maintenance contracts with the entity 208, and other such information. Further, the information bar 202 can support search operations, alerts, and provide other information associated with the entity 208.
- the map image 204 can graphically depict a plurality of structures, such as one or more structures 212 that include equipment 10 of FIG. 1 managed by the entity 208 and one or more structures 214 that do not include equipment 10 of FIG. 1 managed by the entity 208.
- the entity location 210 includes equipment 10 ( FIG. 1 ) at multiple equipment locations 216A, 216B, 216C, 216D as depicted graphically as one or more icons (e.g., pins) that overlay the map image 204.
- the unit specific health status for each unit 25 ( FIG. 1 ) of the equipment 10 at the equipment locations 216A-216D can also be graphically depicted as an icon to summarize the condition of each unit 25.
- the display characteristics of the one or more icons can vary based on the status of the equipment 10 indicative of one or more differences in operational conditions of the equipment 10. For instance, an "In-Service” indicator may be green while a “Shutdown” indicator may be red.
- FIG. 2 Further icons that may be displayed depending on the operating conditions can include a "Trending Sick” indicator, a “Needs Attention” indicator, an "Open Service Request” indicator, and other such indicators.
- Status and condition of the equipment 10 presently visible on the map image 204 can be summarized on a status summary bar 220.
- the status summary bar 220 indicates that four units 25 include one unit 25 having a status of "Shutdown” (at equipment location 216A), three units 25 having a status of "In-Service” (at equipment locations 216B, 216C, 216D), and no units 25 having a status of "Open Service Request", "Trending Sick", or "Needs Attention”.
- the status data panel 206 may also include a health score 222 on the graphical user interface 200 that summarizes a plurality of conditions of the equipment 10 at the one or more equipment locations 216A-216D displayed on the graphical user interface 200.
- the health score 222 may represent an average health status of the equipment at the entity location 210 (e.g., one or more structures 212 that include equipment 10) over a predetermined period of time. For instance, if one of the units 25 at equipment location 216A was in a Needs Attention state for two days out of thirty days while units 25 at equipment locations 216B-216D remained In-Service for the same period of thirty days, then the resulting health score 222 may indicate 98% (126 healthy unit days / 128 total unit days).
- the period of time for computing the health score 222 is configurable.
- the health score 222 is an instantaneous reading of the health of the units 25.
- the status data panel 206 may also include an uptime indicator 224 on the graphical user interface 200 that summarizes a performance history of the equipment 10 at the one or more equipment locations 216A-216D displayed on the graphical user interface 200 for a predetermined period of time, such as thirty days. In one embodiment, the predetermined period of time may be greater than or less than thirty days.
- the uptime indicator 224 may represent an average uptime status of the equipment at the entity location 210 (e.g., one or more structures 212 that includes equipment 10) over the predetermined period of time.
- the resulting uptime indicator 224 may indicate 99% (127 active unit days / 128 total unit days).
- the period of time for computing the uptime indicator 224 is configurable.
- the uptime indicator 224 may be a higher score than the health score 222 if the equipment 10 was operational but encountered one or more events that resulted in degraded operation, for example.
- the status data panel 206 may also include an activity history 226 on the graphical user interface 200 that summarizes a total number of visits 228, scheduled visits 230, predictive maintenance events 232, and service requests 234 for the equipment 10 at the one or more equipment locations 216A-216D displayed on the graphical user interface 200 for a predetermined period of time.
- Total visits 228 may be indicative of a total number of service visits by a mechanic in a predetermined period of time.
- Scheduled visits 230 may be indicative of a total number of scheduled service visits (i.e., regularly scheduled maintenance appointments) by a mechanic in a predetermined period of time.
- Predictive visits 232 may be indicative of a total number of service visits made as a result of sensor data indicating a component had not yet failed but was in need of maintenance in a predetermined period of time.
- Service requests 234 may be indicative of a total number of service requests made by the customer/building owner in a predetermined period of time.
- the predictive maintenance events 232 can be flagged, for example, by one or more equipment controllers 26 ( FIG. 1 ) or other diagnostic/prognostic systems of the equipment service system 20 ( FIG. 1 ), for instance, using trending of sensor data for the equipment 10 and/or other techniques known in the art.
- the predetermined period of time for the activity history 226 may differ from the predetermined period of time for the health score 222 and/or the uptime indicator 224 (e.g., twelve months versus thirty days). In some embodiments, the period of time for computing the activity history 226 is configurable. Although a number of specific examples of status and summarized data are depicted in the example of FIG. 2 , it will be understood that variations include other indicators or fewer indicators are contemplated.
- the map image 204 is interactive and supports panning, zooming, rotation, and/or other actions through map controls 236 and/or through point/click actions, keyboard commands, or touchscreen gestures.
- the values of the status data panel 206 can be dynamically adjusted depending on whether one or more structures 212 that include equipment 10 of FIG. 1 managed by the entity 208 are visible on the map image 204. For instance, user requested changes to the zoom level or viewable area of the map image 204 may result in the system 28 ( FIG.
- mapping system 54 querying the mapping system 54 for updates to the map image 204 and querying the data repository 52 to retrieve an updated data set corresponding with any equipment locations 216A-216D having positions that are within a viewable area of the map image 204.
- the system 28 can buffer data for a larger area than is presently visible on the map image 204 to enable smoother panning or other display adjustments.
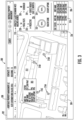
- FIG. 3 depicts an example of a graphical user interface 300 of the equipment service graphical interface 56 of FIG. 1 that can be generated by the system 28 for the monitoring access systems 50 of FIG. 1 .
- the graphical user interface 300 includes the same information bar 202, status data panel 206, entity 208, entity location 210, one or more structures 212 that include equipment 10 of FIG. 1 managed by the entity 208, equipment locations 216A-216D, unit specific information 218, status summary bar 220, health score 222, uptime indicator 224, and activity history 226 as previously described with respect to FIG. 2 .
- a map image 304 of FIG. 3 is a zoomed-in view of the map image 204 of FIG. 2 (e.g., as selected through the map controls 236).
- the map image 304 also depicts a pop-up summary 305 of one or more equipment status details associated with a specific instance of the equipment 10 at the entity location 210.
- the pop-up summary 305 is associated with the unit 25 ( FIG. 1 ) at equipment location 216C.
- the pop-up summary 305 can include information such as a unit identifier number, a unit name, a number of floors/landings (e.g., when embodied as an elevator system), a unit-specific health score, a unit-specific uptime, and/or other data.
- the system 28 can output the pop-up summary 305 based on a detected user input action, such as a hovering action over at least one of the one or more icons on the map image 304.
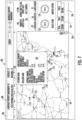
- FIG. 4 depicts an example of a graphical user interface 400 of the equipment service graphical interface 56 of FIG. 1 that can be generated by the system 28 for the monitoring access systems 50 of FIG. 1 .
- the graphical user interface 400 is an example of updating the graphical user interface 300 of FIG. 3 with a plurality of unit status details based on detecting a unit selection from the plurality of units 25 ( FIG. 1 ).
- the graphical user interface 400 includes the same information bar 202, entity 208, and entity location 210 as in FIGS. 2 and 3 ; however, other unit-specific details are displayed. For example, an action or gesture associated with the unit 25 at equipment location 216C of FIGS. 2-3 , which was summarized by the pop-up summary 305 of FIG.
- the system 28 may trigger a more detailed view of the unit 25.
- the system 28 may replace the map image 304 on the graphical user interface 300 of FIG. 3 with a schematic view 404 of a plurality of components 403 of an elevator system 401 comprising the unit selection in graphical user interface 400.
- Components 403 can include names, operational summaries, and approximate placement information with respect to a specific model of the elevator system 401 at the selected location.
- the components 403 may include a machine, a car guide, a door operator, a door detection device, a microprocessor board, a drive, belts, a monitoring system, and/or other elements.
- the system 28 may also display the unit status details 406, such as a health score 422 and uptime 424 for the unit selected, an activity history 426 for the unit selected, and one or more time history plots 425 for the unit selected.
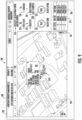
- FIG. 5 depicts an example of a graphical user interface 500 of the equipment service graphical interface 56 of FIG. 1 that can be generated by the system 28 for the monitoring access systems 50 of FIG. 1 .
- the graphical user interface 500 includes the same information bar 202, status data panel 206, entity 208, entity location 210, one or more structures 212 that include equipment 10 of FIG. 1 managed by the entity 208, equipment locations 216A-216D, unit specific information 218, status summary bar 220, health score 222, uptime indicator 224, and activity history 226 as previously described with respect to FIG. 2 .
- a map image 504 of FIG. 5 is similar to the map image 204 of FIG.
- the map image 504 also depicts a pop-up summary 505 of one or more equipment status details associated with a specific instance of the equipment 10 at the entity location 210.
- the pop-up summary 505 is associated with the unit 25 ( FIG. 1 ) at equipment location 216A.
- the pop-up summary 505 can include information such as a unit identifier number, a unit name, a number of floors/landings (e.g., when embodied as an elevator system), a unit-specific health score, a unit-specific uptime, and/or other data.
- the system 28 can output the pop-up summary 505 based on a detected user input action, such as a hovering action over at least one of the one or more icons on the map image 504.
- a detected user input action such as a hovering action over at least one of the one or more icons on the map image 504.
- the pop-up summary 505 is an example for a unit 25 in an unhealthy/shutdown state.
- FIG. 6 depicts an example of a graphical user interface 600 of the equipment service graphical interface 56 of FIG. 1 that can be generated by the system 28 for the monitoring access systems 50 of FIG. 1 .
- the graphical user interface 600 is an example of updating the graphical user interface 500 of FIG. 5 with a plurality of unit status details based on detecting a unit selection from the plurality of units 25 ( FIG. 1 ).
- the graphical user interface 600 includes the same information bar 202, entity 208, and entity location 210 as in FIGS. 2-5 ; however, other unit-specific details are displayed. For example, an action or gesture associated with the unit 25 at equipment location 216A of FIG. 5 , which was summarized by the pop-up summary 505 of FIG.
- the system 28 may trigger a more detailed view of the unit 25.
- the system 28 may replace the map image 504 on the graphical user interface 500 of FIG. 5 with a schematic view 604 of a plurality of components 603 of an elevator system 601 comprising the unit selection in graphical user interface 600.
- the configuration of the elevator system 601 differs from the configuration of the elevator system 401 of FIG. 4 .
- Components 603 can include names, operational summaries, and approximate placement information with respect to a specific model of the elevator system 601 at the selected location.
- the components 603 may include hoist ropes, a door operator, a counterweight, a controller, a machine/motor, a governor, and/or other elements.
- the system 28 may also display the unit status details 606, such as a health score 622 and uptime 624 for the unit selected, an activity history 626 for the unit selected, and one or more time history plots 625 for the unit selected.
- FIG. 7 depicts an example of a graphical user interface 700 of the equipment service graphical interface 56 of FIG. 1 that can be generated by the system 28 for the monitoring access systems 50 of FIG. 1 .
- the graphical user interface 700 includes the same information bar 202, and entity 208 of FIG. 2 after using the map controls 236 to perform a zoom-out operation resulting in a change in map area covered in a map image 704 as compared to the map image 204 of FIG. 2 .
- the map image 704 covers a plurality of entity locations 710, which may be in different towns/states/provinces/countries as graphically depicted as icons or pins.
- a status data panel 706 of the graphical user interface 700 can include financial information 718, a status summary bar 720, a health score 722, an uptime indicator 724, an activity history 726, and other such information associated with the equipment 10 at the entity locations 710 depicted in the map image 704.
- the map image 704 also depicts a pop-up summary 705 of one or more equipment status details associated with the equipment 10 at a selected instance of an entity location 710.
- the pop-up summary 705 can include, for example, an entity name, a building name, a contract number, a number of units at the building, a number of open service requests, a number of shutdown units, a number of in-service units, a number of trending sick units, a number of units needing attention and/or other values.
- FIG. 8 depicts an example of a graphical user interface 800 of the equipment service graphical interface 56 of FIG. 1 that can be generated by the system 28 for the monitoring access systems 50 of FIG. 1 .
- the graphical user interface 800 includes a similar format as previously described with respect to the graphical user interface 200 of FIG. 2 , such as the information bar 202, status data panel 206, entity 208, entity location 810, one or more structures 812 that include equipment 10 of FIG. 1 managed by the entity 208, equipment locations 816A-816D, unit specific information 218, status summary bar 220, health score 222, uptime indicator 224, and activity history 226.
- FIG. 8 depicts a different physical location, where the one or more structures 812 are at different geographic locations than the one or more structures 212 of FIG. 2 .
- units 25 ( FIG. 1 ) at equipment locations 816A and 816D have a status of "In-Service” and units 25 at equipment locations 816B and 816C have a status of "Trending Sick”.
- FIG. 9 depicts an example of a graphical user interface 900 of the equipment service graphical interface 56 of FIG. 1 that can be generated by the system 28 for the monitoring access systems 50 of FIG. 1 .
- the graphical user interface 900 includes a similar format as previously described with respect to the graphical user interface 800 of FIG. 8 , such as the information bar 202, status data panel 206, entity 208, entity location 810, one or more structures 812 that include equipment 10 of FIG. 1 managed by the entity 208, equipment locations 816A-816D, unit specific information 218, status summary bar 220, health score 222, uptime indicator 224, and activity history 226.
- the pop-up summary 905 also depicts a pop-up summary 905 of one or more equipment status details associated with a specific instance of the equipment 10 at the entity location 810.
- the pop-up summary 905 is associated with the unit 25 ( FIG. 1 ) at equipment location 816C.
- the pop-up summary 905 can include information such as a unit identifier number, a unit name, a number of floors/landings (e.g., when embodied as an elevator system), a unit-specific health score, a unit-specific uptime, and/or other data.
- the system 28 can output the pop-up summary 905 based on a detected user input action, such as a hovering action over at least one of the one or more icons on the map image 904.
- FIG. 10 depicts an example of a graphical user interface 1000 of the equipment service graphical interface 56 of FIG. 1 that can be generated by the system 28 for the monitoring access systems 50 of FIG. 1 .
- the graphical user interface 1000 is an example of updating the graphical user interface 900 of FIG. 9 with a plurality of unit status details based on detecting a unit selection from the plurality of units 25 ( FIG. 1 ).
- the graphical user interface 1000 includes the same information bar 202, entity 208, and entity location 810 as in FIGS. 8-9 ; however, other unit-specific details are displayed. For example, an action or gesture associated with the unit 25 at equipment location 816C of FIG. 9 , which was summarized by the pop-up summary 905 of FIG.
- the system 28 may replace the map image 904 on the graphical user interface 900 of FIG. 9 with a schematic view 1004 of a plurality of components 1003 of an elevator system 1001 comprising the unit selection in graphical user interface 1000.
- the configuration of the elevator system 1001 may differ from the configuration of the elevator system 401 of FIG. 4 , for example.
- Components 1003 can include names, operational summaries, and approximate placement information with respect to a specific model of the elevator system 1001 at the selected location.
- the components 1003 may include hoist ropes, a door operator, a counterweight, a controller, a machine/motor, a governor, and/or other elements.
- the system 28 may also display the unit status details 1006, such as a health score 1022 and uptime 1024 for the unit selected, an activity history 1026 for the unit selected, and one or more time history plots 1025 for the unit selected.
- FIG. 11 depicts a process 1100 that can be performed by the system 28 of FIG. 1 as shown and described herein and/or by variations thereon.
- Various aspects of the process 1100 can be carried out using one or more sensors, one or more processors, and/or one or more machines and/or controllers.
- sensors e.g., accelerometers, speed sensors, position sensors, temperature sensors, strain gauges, torque sensors, cameras, etc.
- the process 1100 is described in reference to FIGS. 1-11 .
- the process 1100 can be invoked through one or more monitoring access systems 50 using, for example, the equipment service graphical interface 56 of FIG. 1 .
- the process 1100 is primarily described with respect to the examples of FIGS. 1-3 but is applicable to the examples of FIGS. 4-10 and other embodiments as well.
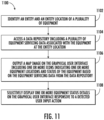
- the system 28 identifies an entity 208 and an entity location 210 of a plurality of equipment 10.
- the system 28 accesses a data repository 52 including a plurality of equipment servicing data associated with the equipment 10 at the entity location 210.
- the system 28 outputs a map image 204 on the graphical user interface 200 including one or more icons indicating one or more equipment locations 216A-216D and status of the equipment 10 based on the equipment servicing data from the data repository 52.
- One or more display characteristics of the one or more icons can vary based on the status of the equipment 10 indicative of one or more differences in operational conditions of the equipment 10. Differences in display characteristics can include variations in color, shape, flashing, animation, and/or other distinguishing properties.
- the system 28 can selectively display one or more equipment status details on the graphical user interface 200 responsive to a detected user input action.
- the detected user input action can include a hovering action over at least one of the one or more icons.
- the one or more equipment status details can be associated with a specific instance of the equipment 10 at the entity location depicted on the map image 204, such as displaying the pop-up summary 305.
- the system 28 can output a health score 222 on the graphical user interface 200 that summarizes a plurality of conditions of the equipment 10 at the one or more equipment locations 216A-216D displayed on the graphical user interface 200.
- the system 28 can output an uptime indicator 224 on the graphical user interface 200 that summarizes a performance history of the equipment 10 at the one or more equipment locations 216A-216D displayed on the graphical user interface 200 for a first predetermined period of time.
- the system 28 can output an activity history 226 on the graphical user interface 200 that summarizes a total number of visits 228, scheduled visits 230, predictive maintenance events 232, and service requests 234 for the equipment 10 at the one or more equipment locations 216A-216D displayed on the graphical user interface 200 for a second predetermined period of time.
- the system 28 can output a unit summary (e.g., unit specific information 218 and/or status summary bar 220) on the graphical user interface 200 of a plurality of units 25 of the equipment 10 at the one or more equipment locations 216A-216D displayed on the graphical user interface 200, where each of the units 25 may be an elevator or escalator system.
- the system 28 can update the graphical user interface 200 with a plurality of unit status details 406 based on detecting a unit selection from the plurality of units 25. For example, the system 28 can replace the map image 204 on the graphical user interface 200 with a schematic view 404 of a plurality of components 403 of an elevator system 401 comprising the unit selection.
- the unit status details 406 may include a health score 422 for the unit selected, an uptime for the unit selected, the activity history 426 for the unit selected, and/or one or more time history plots 425 for the unit selected.
- the system 28 can detect a change in a zoom level of the map image 204 on the graphical user interface 200, for example, through the map controls 236.
- the system 28 can identify a plurality of entity locations 710 of the entity 208 within a geographic area displayed on the map image 704.
- the system 28 may retrieve the equipment servicing data associated with the equipment 10 at the plurality of entity locations 710 from the data repository 52.
- the system 28 can update the map image 704 on the graphical user interface 700 with a plurality of icons indicative of the status of the equipment 10 at the plurality of entity locations 710.
- the system 28 can determine an update to a plurality of summary data associated with the equipment 10 at the plurality of entity locations 710.
- the system 28 may update one or more values displayed on the graphical user interface 700 with the update to the summary data.
- process 1100 of FIG. 11 can be performed in an alternate order and include a greater or fewer number of steps.
- Computer readable program codes may include source codes, object codes, executable codes, and others.
- Computer readable mediums may be any type of media capable of being accessed by a computer, and may include Read Only Memory (ROM), Random Access Memory (RAM), a hard disk drive, a compact disc (CD), a digital video disc (DVD), or other forms.
- ROM Read Only Memory
- RAM Random Access Memory
- CD compact disc
- DVD digital video disc
- a component may be, but is not limited to, a process running on a processor, a processor, an object, an executable, a thread of execution, a program, and/or a computer. It is understood that an application running on a server and the server may be a component.
- One or more components may reside within a process and/or thread of execution and a component may be localized on one computer and/or distributed between two or more computers.
Landscapes
- Engineering & Computer Science (AREA)
- Theoretical Computer Science (AREA)
- General Engineering & Computer Science (AREA)
- Physics & Mathematics (AREA)
- General Physics & Mathematics (AREA)
- Human Computer Interaction (AREA)
- Geometry (AREA)
- Computer Hardware Design (AREA)
- Software Systems (AREA)
- Evolutionary Computation (AREA)
- Signal Processing (AREA)
- Computer Networks & Wireless Communication (AREA)
- Structural Engineering (AREA)
- Data Mining & Analysis (AREA)
- Architecture (AREA)
- Civil Engineering (AREA)
- Databases & Information Systems (AREA)
- Computational Mathematics (AREA)
- Mathematical Analysis (AREA)
- Mathematical Optimization (AREA)
- Pure & Applied Mathematics (AREA)
- User Interface Of Digital Computer (AREA)
- Management, Administration, Business Operations System, And Electronic Commerce (AREA)
- Indicating And Signalling Devices For Elevators (AREA)
Description
- The present disclosure relates to equipment service systems, and more particularly, to an equipment service graphical interface.
- Equipment system operators may oversee multiple equipment systems at one or more geographic locations. Equipment systems can include many components with varying maintenance schedules, expected service lives, and component ages. Overseeing equipment system servicing can be challenging due to the large volume of data, geographical distribution of equipment, and variations in equipment characteristics installed at one or more locations.
-
JP 2014/002624 JP 2014 002624 A claims - According to the present invention, a method is provided as claimed in
claim 1. - Further embodiments may include where the detected user input action includes a hovering action over at least one of the one or more icons, and the one or more equipment status details are associated with a specific instance of the equipment at the entity location depicted on the map image.
- Further embodiments may include where one or more display characteristics of the one or more icons vary based on the status of the equipment indicative of one or more differences in operational conditions of the equipment.
- Further embodiments may include outputting an activity history on the graphical user interface that summarizes a total number of visits, scheduled visits, predictive maintenance events, and service requests for the equipment at the one or more equipment locations displayed on the graphical user interface for a second predetermined period of time.
- Further embodiments may include outputting a unit summary on the graphical user interface of a plurality of units of the equipment at the one or more equipment locations displayed on the graphical user interface, where each of the units includes an elevator system.
- Further embodiments may include updating the graphical user interface with a plurality of unit status details based on detecting a unit selection from the plurality of units, and replacing the map image on the graphical user interface with a schematic view of a plurality of components of the elevator system including the unit selection.
- Further embodiments may include where the unit status details include the health score for the unit selected, the activity history for the unit selected, and one or more time history plots for the unit selected.
- Further embodiments may include detecting a change in a zoom level of the map image on the graphical user interface, identifying a plurality of entity locations of the entity within a geographic area displayed on the map image, retrieving the equipment servicing data associated with the equipment at the plurality of entity locations from the data repository, updating the map image on the graphical user interface with a plurality of icons indicative of the status of the equipment at the plurality of entity locations, determining an update to a plurality of summary data associated with the equipment at the plurality of entity locations, and updating one or more values displayed on the graphical user interface with the update to the summary data.
- According to another aspect of the present invention, a system according to
claim 6 includes a processing system, a user interface driver, and a memory system. The user interface driver is operable to output a graphical user interface and receive input through the graphical user interface. The memory system includes a plurality of instructions stored thereon that, when executed by the processing system, cause the system to perform a plurality of operations. The operations include identifying an entity and an entity location of a plurality of equipment. A data repository is accessed that includes a plurality of equipment servicing data associated with the equipment at the entity location. A map image is output on the graphical user interface including one or more icons indicating one or more equipment locations and status of the equipment based on the equipment servicing data from the data repository. One or more equipment status details are selectively displayed on the graphical user interface responsive to a detected user input action. - Technical effects of embodiments of the present disclosure include providing an equipment service graphical interface with a graphical user interface operable to selectively display equipment status details and resizable map images with icons indicating one or more equipment locations and status. The equipment service graphical interface can access a data repository and provide summarized results to reduce network traffic with respect to multiple monitoring access systems.
- The foregoing features and elements may be combined in various combinations without exclusivity, unless expressly indicated otherwise. These features and elements as well as the operation thereof will become more apparent in light of the following description and the accompanying drawings. However, it should be understood that the following description and drawings are intended to be exemplary in nature and non-limiting.
- Various features will become apparent to those skilled in the art from the following detailed description of the disclosed non-limiting embodiments. The drawings that accompany the detailed description can be briefly described as follows:
-
FIG. 1 is a schematic illustration of an equipment service system according to a, non-limiting, exemplary embodiment of the present invention; -
FIG. 2 depicts a graphical user interface in accordance with an embodiment of the present disclosure; -
FIG. 3 depicts a graphical user interface in accordance with an embodiment of the present disclosure; -
FIG. 4 depicts a graphical user interface in accordance with an embodiment of the present disclosure; -
FIG. 5 depicts a graphical user interface in accordance with an embodiment of the present disclosure; -
FIG. 6 depicts a graphical user interface in accordance with an embodiment of the present disclosure; -
FIG. 7 depicts a graphical user interface in accordance with an embodiment of the present disclosure; -
FIG. 8 depicts a graphical user interface in accordance with an embodiment of the present disclosure; -
FIG. 9 depicts a graphical user interface in accordance with an embodiment of the present disclosure; -
FIG. 10 depicts a graphical user interface in accordance with an embodiment of the present disclosure; and -
FIG. 11 is a flowchart illustrating a method in accordance with an embodiment of the present invention. - A detailed description of one or more embodiments of the disclosed apparatus and method are presented herein by way of exemplification and not limitation with reference to the Figures.
- Referring to
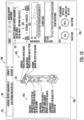
FIG. 1 , an exemplary embodiment of anequipment service system 20 including adata collection system 24 is depicted for collecting equipment servicing data for a plurality ofequipment 10. Theequipment 10 can include one ormore units 25 with one ormore equipment controllers 26 operable to monitor and control theunits 25 at one or more entity locations. Each of theunits 25 can be, for example, an elevator system, where an entity location may include multiple elevator systems (e.g., multiple single elevator car systems or multi-car elevator banks) within a same physical structure, such as a building or parking garage, or may be a campus location with multiple structures including theunits 25. An entity, such as company or property management group, may oversee multiple locations, such aslocations multiple units 25 andequipment controllers 26. Theequipment controllers 26 may each include respective processors 42 (e.g., microprocessors), andstorage mediums 48 that may be computer writeable and readable for controlling and monitoring operations of theunits 25. Theequipment controllers 26 may establish communication through one ormore communication pathways 30 with thedata collection system 24. Thecommunication pathways 30 may be associated with such communication protocols as Bluetooth®, Wi-Fi, infrared, mobile broadband (e.g., 3G, 4G, etc.), satellite, and others over wired, wireless, and/or optical connections. Thedata collection system 24 may be cloudbased (i.e., in a cloud network environment). In one embodiment, the data collection system may be local tolocations controllers 26, and/orunits 25 and may transmit the collected data along the communication pathways to a remote computer system, such as the cloud, equipment servicegraphical interface 56,monitoring access systems 50, or some other device. - The
equipment service system 20 can also include one or moremonitoring access systems 50 operable to interface with thedata collection system 24 to retrieve equipment servicing data associated with theequipment 10. Themonitoring access systems 50 can include, for example, one ormore laptop computers 50A,smartphones 50B, tablet computers 50C, and/or other electronic devices. Thedata collection system 24 can include asystem 28 operable to provide an equipment servicegraphical interface 56 including a plurality of graphical user interfaces to themonitoring access systems 50 for interactively viewing and analyzing equipment servicing data associated with theequipment 10. Thesystem 28 can be distributed over one or more computer systems that form thedata collection system 24, for instance, as one or more cloud-based/networked computer systems. In the example ofFIG. 1 , thesystem 28 includes aprocessing system 40, auser interface driver 44, and amemory system 46. Theuser interface driver 44 is operable to output one or more graphical user interfaces for one or more of themonitoring access systems 50 and receive input through graphical user interfaces from one or moremonitoring access systems 50. For instance, a keypad, a touchscreen, a pointer device, or other such input device of the one or moremonitoring access systems 50 collects user input for further processing by thesystem 28. Thememory system 46 includes a plurality of instructions stored thereon that, when executed by theprocessing system 40, cause thesystem 28 to perform a plurality of operations. Theprocessing system 40 may be but is not limited to a single-processor or multi-processor system of any of a wide array of possible architectures, including field programmable gate array (FPGA), central processing unit (CPU), application specific integrated circuits (ASIC), digital signal processor (DSP) or graphics processing unit (GPU) hardware arranged homogenously or heterogeneously. Thememory system 46 may include one or more storage devices such as, for example, a random access memory (RAM), read only memory (ROM), or other electronic, optical, magnetic or any other computer readable storage medium. - In embodiments, equipment servicing data associated with the
equipment 10 is stored in adata repository 52, which may be part of thedata collection system 24. Thedata repository 52 is accessible by thesystem 28 and supports filtering and summarizing actions for the one or moremonitoring access systems 50. In embodiments, theequipment controllers 26, thesystem 28, or other elements run diagnostics and monitor the performance of theunits 25, with the results being stored as equipment servicing data associated with theequipment 10 in thedata repository 52. Thesystem 28 selectively provides data summarizing the equipment servicing data as needed/requested through themonitoring access systems 50. Theequipment controllers 26 or other elements can push the equipment servicing data to thedata repository 52 as events are observed associated with theunits 25. Thedata repository 52 can collect data for many instances of theequipment 10 that may not be relevant to a particular user of themonitoring access systems 50. Thesystem 28 can filter the equipment servicing data selected for summarizing and reporting to themonitoring access systems 50 to ensure that relevant data values are reported. Thesystem 28 may also interface with amapping system 54 operable to provide one or more map images for displaying and overlaying of icons indicative of the status of theequipment 10 at the plurality ofentity locations memory system 46 can include instructions operable to produce the equipment servicegraphical interface 56 for interactive display on themonitoring access systems 50, including a plurality of graphical user interfaces as further described herein with respect toFIGS. 2-10 . -
FIG. 2 depicts an example of agraphical user interface 200 of the equipment servicegraphical interface 56 ofFIG. 1 that can be generated by thesystem 28 for themonitoring access systems 50 ofFIG. 1 . Thegraphical user interface 200 can include aninformation bar 202, amap image 204, astatus data panel 206, anentity 208, and anentity location 210. In the example ofFIG. 2 , theinformation bar 202 can include a variety of high-level information, such as a name of theentity 208, a number of buildings managed by theentity 208, a number of maintenance contracts with theentity 208, and other such information. Further, theinformation bar 202 can support search operations, alerts, and provide other information associated with theentity 208. Themap image 204 can graphically depict a plurality of structures, such as one ormore structures 212 that includeequipment 10 ofFIG. 1 managed by theentity 208 and one ormore structures 214 that do not includeequipment 10 ofFIG. 1 managed by theentity 208. In the example ofFIG. 2 , theentity location 210 includes equipment 10 (FIG. 1 ) atmultiple equipment locations map image 204. - Further details about the
equipment 10 may be provided on thestatus data panel 206 including unitspecific information 218, such as a unit specific health status, a unit identifier number, and a unit name. The unit specific health status for each unit 25 (FIG. 1 ) of theequipment 10 at theequipment locations 216A-216D can also be graphically depicted as an icon to summarize the condition of eachunit 25. The display characteristics of the one or more icons can vary based on the status of theequipment 10 indicative of one or more differences in operational conditions of theequipment 10. For instance, an "In-Service" indicator may be green while a "Shutdown" indicator may be red. Further icons that may be displayed depending on the operating conditions can include a "Trending Sick" indicator, a "Needs Attention" indicator, an "Open Service Request" indicator, and other such indicators. Status and condition of theequipment 10 presently visible on themap image 204 can be summarized on astatus summary bar 220. For instance, in the example ofFIG. 2 , thestatus summary bar 220 indicates that fourunits 25 include oneunit 25 having a status of "Shutdown" (atequipment location 216A), threeunits 25 having a status of "In-Service" (atequipment locations units 25 having a status of "Open Service Request", "Trending Sick", or "Needs Attention". - The
status data panel 206 may also include ahealth score 222 on thegraphical user interface 200 that summarizes a plurality of conditions of theequipment 10 at the one ormore equipment locations 216A-216D displayed on thegraphical user interface 200. Thehealth score 222 may represent an average health status of the equipment at the entity location 210 (e.g., one ormore structures 212 that include equipment 10) over a predetermined period of time. For instance, if one of theunits 25 atequipment location 216A was in a Needs Attention state for two days out of thirty days whileunits 25 atequipment locations 216B-216D remained In-Service for the same period of thirty days, then the resultinghealth score 222 may indicate 98% (126 healthy unit days / 128 total unit days). In some embodiments, the period of time for computing thehealth score 222 is configurable. In one embodiment, thehealth score 222 is an instantaneous reading of the health of theunits 25. - The
status data panel 206 may also include anuptime indicator 224 on thegraphical user interface 200 that summarizes a performance history of theequipment 10 at the one ormore equipment locations 216A-216D displayed on thegraphical user interface 200 for a predetermined period of time, such as thirty days. In one embodiment, the predetermined period of time may be greater than or less than thirty days. Theuptime indicator 224 may represent an average uptime status of the equipment at the entity location 210 (e.g., one ormore structures 212 that includes equipment 10) over the predetermined period of time. For instance, if one of theunits 25 atequipment location 216A was in a Shutdown state for one day out of thirty days whileunits 25 atequipment locations 216B-216D remained In-Service for the same period of thirty days, then the resultinguptime indicator 224 may indicate 99% (127 active unit days / 128 total unit days). In some embodiments, the period of time for computing theuptime indicator 224 is configurable. Theuptime indicator 224 may be a higher score than thehealth score 222 if theequipment 10 was operational but encountered one or more events that resulted in degraded operation, for example. - The
status data panel 206 may also include anactivity history 226 on thegraphical user interface 200 that summarizes a total number ofvisits 228, scheduledvisits 230,predictive maintenance events 232, andservice requests 234 for theequipment 10 at the one ormore equipment locations 216A-216D displayed on thegraphical user interface 200 for a predetermined period of time.Total visits 228 may be indicative of a total number of service visits by a mechanic in a predetermined period of time. Scheduledvisits 230 may be indicative of a total number of scheduled service visits (i.e., regularly scheduled maintenance appointments) by a mechanic in a predetermined period of time.Predictive visits 232 may be indicative of a total number of service visits made as a result of sensor data indicating a component had not yet failed but was in need of maintenance in a predetermined period of time. Service requests 234 may be indicative of a total number of service requests made by the customer/building owner in a predetermined period of time. Thepredictive maintenance events 232 can be flagged, for example, by one or more equipment controllers 26 (FIG. 1 ) or other diagnostic/prognostic systems of the equipment service system 20 (FIG. 1 ), for instance, using trending of sensor data for theequipment 10 and/or other techniques known in the art. The predetermined period of time for theactivity history 226 may differ from the predetermined period of time for thehealth score 222 and/or the uptime indicator 224 (e.g., twelve months versus thirty days). In some embodiments, the period of time for computing theactivity history 226 is configurable. Although a number of specific examples of status and summarized data are depicted in the example ofFIG. 2 , it will be understood that variations include other indicators or fewer indicators are contemplated. - In some embodiments, the
map image 204 is interactive and supports panning, zooming, rotation, and/or other actions through map controls 236 and/or through point/click actions, keyboard commands, or touchscreen gestures. As a field of view of themap image 204 is adjusted, the values of thestatus data panel 206 can be dynamically adjusted depending on whether one ormore structures 212 that includeequipment 10 ofFIG. 1 managed by theentity 208 are visible on themap image 204. For instance, user requested changes to the zoom level or viewable area of themap image 204 may result in the system 28 (FIG. 1 ) querying themapping system 54 for updates to themap image 204 and querying thedata repository 52 to retrieve an updated data set corresponding with anyequipment locations 216A-216D having positions that are within a viewable area of themap image 204. In some embodiments, thesystem 28 can buffer data for a larger area than is presently visible on themap image 204 to enable smoother panning or other display adjustments. -
FIG. 3 depicts an example of agraphical user interface 300 of the equipment servicegraphical interface 56 ofFIG. 1 that can be generated by thesystem 28 for themonitoring access systems 50 ofFIG. 1 . Thegraphical user interface 300 includes thesame information bar 202,status data panel 206,entity 208,entity location 210, one ormore structures 212 that includeequipment 10 ofFIG. 1 managed by theentity 208,equipment locations 216A-216D, unitspecific information 218,status summary bar 220,health score 222,uptime indicator 224, andactivity history 226 as previously described with respect toFIG. 2 . Amap image 304 ofFIG. 3 is a zoomed-in view of themap image 204 ofFIG. 2 (e.g., as selected through the map controls 236). Themap image 304 also depicts a pop-upsummary 305 of one or more equipment status details associated with a specific instance of theequipment 10 at theentity location 210. In the example ofFIG. 3 , the pop-upsummary 305 is associated with the unit 25 (FIG. 1 ) atequipment location 216C. The pop-upsummary 305 can include information such as a unit identifier number, a unit name, a number of floors/landings (e.g., when embodied as an elevator system), a unit-specific health score, a unit-specific uptime, and/or other data. Thesystem 28 can output the pop-upsummary 305 based on a detected user input action, such as a hovering action over at least one of the one or more icons on themap image 304. -
FIG. 4 depicts an example of agraphical user interface 400 of the equipment servicegraphical interface 56 ofFIG. 1 that can be generated by thesystem 28 for themonitoring access systems 50 ofFIG. 1 . Thegraphical user interface 400 is an example of updating thegraphical user interface 300 ofFIG. 3 with a plurality of unit status details based on detecting a unit selection from the plurality of units 25 (FIG. 1 ). Thegraphical user interface 400 includes thesame information bar 202,entity 208, andentity location 210 as inFIGS. 2 and3 ; however, other unit-specific details are displayed. For example, an action or gesture associated with theunit 25 atequipment location 216C ofFIGS. 2-3 , which was summarized by the pop-upsummary 305 ofFIG. 3 , may trigger a more detailed view of theunit 25. For instance, thesystem 28 may replace themap image 304 on thegraphical user interface 300 ofFIG. 3 with aschematic view 404 of a plurality ofcomponents 403 of anelevator system 401 comprising the unit selection ingraphical user interface 400.Components 403 can include names, operational summaries, and approximate placement information with respect to a specific model of theelevator system 401 at the selected location. In the context of elevators, thecomponents 403 may include a machine, a car guide, a door operator, a door detection device, a microprocessor board, a drive, belts, a monitoring system, and/or other elements. Thesystem 28 may also display the unit status details 406, such as ahealth score 422 anduptime 424 for the unit selected, anactivity history 426 for the unit selected, and one or more time history plots 425 for the unit selected. -
FIG. 5 depicts an example of agraphical user interface 500 of the equipment servicegraphical interface 56 ofFIG. 1 that can be generated by thesystem 28 for themonitoring access systems 50 ofFIG. 1 . Thegraphical user interface 500 includes thesame information bar 202,status data panel 206,entity 208,entity location 210, one ormore structures 212 that includeequipment 10 ofFIG. 1 managed by theentity 208,equipment locations 216A-216D, unitspecific information 218,status summary bar 220,health score 222,uptime indicator 224, andactivity history 226 as previously described with respect toFIG. 2 . Amap image 504 ofFIG. 5 is similar to themap image 204 ofFIG. 2 ; however, themap image 504 also depicts a pop-upsummary 505 of one or more equipment status details associated with a specific instance of theequipment 10 at theentity location 210. In the example ofFIG. 5 , the pop-upsummary 505 is associated with the unit 25 (FIG. 1 ) atequipment location 216A. The pop-upsummary 505 can include information such as a unit identifier number, a unit name, a number of floors/landings (e.g., when embodied as an elevator system), a unit-specific health score, a unit-specific uptime, and/or other data. Thesystem 28 can output the pop-upsummary 505 based on a detected user input action, such as a hovering action over at least one of the one or more icons on themap image 504. Notably, the pop-upsummary 505 is an example for aunit 25 in an unhealthy/shutdown state. -
FIG. 6 depicts an example of agraphical user interface 600 of the equipment servicegraphical interface 56 ofFIG. 1 that can be generated by thesystem 28 for themonitoring access systems 50 ofFIG. 1 . Thegraphical user interface 600 is an example of updating thegraphical user interface 500 ofFIG. 5 with a plurality of unit status details based on detecting a unit selection from the plurality of units 25 (FIG. 1 ). Thegraphical user interface 600 includes thesame information bar 202,entity 208, andentity location 210 as inFIGS. 2-5 ; however, other unit-specific details are displayed. For example, an action or gesture associated with theunit 25 atequipment location 216A ofFIG. 5 , which was summarized by the pop-upsummary 505 ofFIG. 5 , may trigger a more detailed view of theunit 25. For instance, thesystem 28 may replace themap image 504 on thegraphical user interface 500 ofFIG. 5 with aschematic view 604 of a plurality ofcomponents 603 of anelevator system 601 comprising the unit selection ingraphical user interface 600. Notably the configuration of theelevator system 601 differs from the configuration of theelevator system 401 ofFIG. 4 .Components 603 can include names, operational summaries, and approximate placement information with respect to a specific model of theelevator system 601 at the selected location. In the context of elevators, thecomponents 603 may include hoist ropes, a door operator, a counterweight, a controller, a machine/motor, a governor, and/or other elements. Thesystem 28 may also display the unit status details 606, such as ahealth score 622 anduptime 624 for the unit selected, anactivity history 626 for the unit selected, and one or more time history plots 625 for the unit selected. -
FIG. 7 depicts an example of agraphical user interface 700 of the equipment servicegraphical interface 56 ofFIG. 1 that can be generated by thesystem 28 for themonitoring access systems 50 ofFIG. 1 . Thegraphical user interface 700 includes thesame information bar 202, andentity 208 ofFIG. 2 after using the map controls 236 to perform a zoom-out operation resulting in a change in map area covered in amap image 704 as compared to themap image 204 ofFIG. 2 . Themap image 704 covers a plurality ofentity locations 710, which may be in different towns/states/provinces/countries as graphically depicted as icons or pins. Astatus data panel 706 of thegraphical user interface 700 can includefinancial information 718, astatus summary bar 720, ahealth score 722, anuptime indicator 724, anactivity history 726, and other such information associated with theequipment 10 at theentity locations 710 depicted in themap image 704. In the example ofFIG. 7 , themap image 704 also depicts a pop-upsummary 705 of one or more equipment status details associated with theequipment 10 at a selected instance of anentity location 710. The pop-upsummary 705 can include, for example, an entity name, a building name, a contract number, a number of units at the building, a number of open service requests, a number of shutdown units, a number of in-service units, a number of trending sick units, a number of units needing attention and/or other values. -
FIG. 8 depicts an example of agraphical user interface 800 of the equipment servicegraphical interface 56 ofFIG. 1 that can be generated by thesystem 28 for themonitoring access systems 50 ofFIG. 1 . Thegraphical user interface 800 includes a similar format as previously described with respect to thegraphical user interface 200 ofFIG. 2 , such as theinformation bar 202,status data panel 206,entity 208,entity location 810, one ormore structures 812 that includeequipment 10 ofFIG. 1 managed by theentity 208,equipment locations 816A-816D, unitspecific information 218,status summary bar 220,health score 222,uptime indicator 224, andactivity history 226. Amap image 804 ofFIG. 8 depicts a different physical location, where the one ormore structures 812 are at different geographic locations than the one ormore structures 212 ofFIG. 2 . In the example ofFIG. 8 , units 25 (FIG. 1 ) atequipment locations units 25 atequipment locations -
FIG. 9 depicts an example of agraphical user interface 900 of the equipment servicegraphical interface 56 ofFIG. 1 that can be generated by thesystem 28 for themonitoring access systems 50 ofFIG. 1 . Thegraphical user interface 900 includes a similar format as previously described with respect to thegraphical user interface 800 ofFIG. 8 , such as theinformation bar 202,status data panel 206,entity 208,entity location 810, one ormore structures 812 that includeequipment 10 ofFIG. 1 managed by theentity 208,equipment locations 816A-816D, unitspecific information 218,status summary bar 220,health score 222,uptime indicator 224, andactivity history 226. Amap image 904 thegraphical user interface 900 ofFIG. 9 also depicts a pop-up summary 905 of one or more equipment status details associated with a specific instance of theequipment 10 at theentity location 810. In the example ofFIG. 9 , the pop-up summary 905 is associated with the unit 25 (FIG. 1 ) atequipment location 816C. The pop-up summary 905 can include information such as a unit identifier number, a unit name, a number of floors/landings (e.g., when embodied as an elevator system), a unit-specific health score, a unit-specific uptime, and/or other data. Thesystem 28 can output the pop-up summary 905 based on a detected user input action, such as a hovering action over at least one of the one or more icons on themap image 904. -
FIG. 10 depicts an example of agraphical user interface 1000 of the equipment servicegraphical interface 56 ofFIG. 1 that can be generated by thesystem 28 for themonitoring access systems 50 ofFIG. 1 . Thegraphical user interface 1000 is an example of updating thegraphical user interface 900 ofFIG. 9 with a plurality of unit status details based on detecting a unit selection from the plurality of units 25 (FIG. 1 ). Thegraphical user interface 1000 includes thesame information bar 202,entity 208, andentity location 810 as inFIGS. 8-9 ; however, other unit-specific details are displayed. For example, an action or gesture associated with theunit 25 atequipment location 816C ofFIG. 9 , which was summarized by the pop-up summary 905 ofFIG. 9 , may trigger a more detailed view of theunit 25. For instance, thesystem 28 may replace themap image 904 on thegraphical user interface 900 ofFIG. 9 with aschematic view 1004 of a plurality ofcomponents 1003 of anelevator system 1001 comprising the unit selection ingraphical user interface 1000. Notably the configuration of theelevator system 1001 may differ from the configuration of theelevator system 401 ofFIG. 4 , for example.Components 1003 can include names, operational summaries, and approximate placement information with respect to a specific model of theelevator system 1001 at the selected location. In the context of elevators, thecomponents 1003 may include hoist ropes, a door operator, a counterweight, a controller, a machine/motor, a governor, and/or other elements. Thesystem 28 may also display the unit status details 1006, such as ahealth score 1022 anduptime 1024 for the unit selected, anactivity history 1026 for the unit selected, and one or more time history plots 1025 for the unit selected. -
FIG. 11 depicts aprocess 1100 that can be performed by thesystem 28 ofFIG. 1 as shown and described herein and/or by variations thereon. Various aspects of theprocess 1100 can be carried out using one or more sensors, one or more processors, and/or one or more machines and/or controllers. For example, some aspects of the flow process involve sensors (e.g., accelerometers, speed sensors, position sensors, temperature sensors, strain gauges, torque sensors, cameras, etc.), as described above, in communication with a processor or other control device and transmission of detected information thereto. Theprocess 1100 is described in reference toFIGS. 1-11 . Theprocess 1100 can be invoked through one or moremonitoring access systems 50 using, for example, the equipment servicegraphical interface 56 ofFIG. 1 . For purposes of explanation, theprocess 1100 is primarily described with respect to the examples ofFIGS. 1-3 but is applicable to the examples ofFIGS. 4-10 and other embodiments as well. - At
block 1102, thesystem 28 identifies anentity 208 and anentity location 210 of a plurality ofequipment 10. Atblock 1104, thesystem 28 accesses adata repository 52 including a plurality of equipment servicing data associated with theequipment 10 at theentity location 210. - At
block 1106, thesystem 28 outputs amap image 204 on thegraphical user interface 200 including one or more icons indicating one ormore equipment locations 216A-216D and status of theequipment 10 based on the equipment servicing data from thedata repository 52. One or more display characteristics of the one or more icons can vary based on the status of theequipment 10 indicative of one or more differences in operational conditions of theequipment 10. Differences in display characteristics can include variations in color, shape, flashing, animation, and/or other distinguishing properties. - At
block 1108, thesystem 28 can selectively display one or more equipment status details on thegraphical user interface 200 responsive to a detected user input action. The detected user input action can include a hovering action over at least one of the one or more icons. The one or more equipment status details can be associated with a specific instance of theequipment 10 at the entity location depicted on themap image 204, such as displaying the pop-upsummary 305. - In some embodiments, the
system 28 can output ahealth score 222 on thegraphical user interface 200 that summarizes a plurality of conditions of theequipment 10 at the one ormore equipment locations 216A-216D displayed on thegraphical user interface 200. Thesystem 28 can output anuptime indicator 224 on thegraphical user interface 200 that summarizes a performance history of theequipment 10 at the one ormore equipment locations 216A-216D displayed on thegraphical user interface 200 for a first predetermined period of time. Thesystem 28 can output anactivity history 226 on thegraphical user interface 200 that summarizes a total number ofvisits 228, scheduledvisits 230,predictive maintenance events 232, andservice requests 234 for theequipment 10 at the one ormore equipment locations 216A-216D displayed on thegraphical user interface 200 for a second predetermined period of time. Thesystem 28 can output a unit summary (e.g., unitspecific information 218 and/or status summary bar 220) on thegraphical user interface 200 of a plurality ofunits 25 of theequipment 10 at the one ormore equipment locations 216A-216D displayed on thegraphical user interface 200, where each of theunits 25 may be an elevator or escalator system. - The
system 28 can update thegraphical user interface 200 with a plurality of unit status details 406 based on detecting a unit selection from the plurality ofunits 25. For example, thesystem 28 can replace themap image 204 on thegraphical user interface 200 with aschematic view 404 of a plurality ofcomponents 403 of anelevator system 401 comprising the unit selection. The unit status details 406 may include ahealth score 422 for the unit selected, an uptime for the unit selected, theactivity history 426 for the unit selected, and/or one or more time history plots 425 for the unit selected. - In some embodiments, the
system 28 can detect a change in a zoom level of themap image 204 on thegraphical user interface 200, for example, through the map controls 236. Thesystem 28 can identify a plurality ofentity locations 710 of theentity 208 within a geographic area displayed on themap image 704. Thesystem 28 may retrieve the equipment servicing data associated with theequipment 10 at the plurality ofentity locations 710 from thedata repository 52. Thesystem 28 can update themap image 704 on thegraphical user interface 700 with a plurality of icons indicative of the status of theequipment 10 at the plurality ofentity locations 710. Thesystem 28 can determine an update to a plurality of summary data associated with theequipment 10 at the plurality ofentity locations 710. Thesystem 28 may update one or more values displayed on thegraphical user interface 700 with the update to the summary data. - Although described with a particular sequence of steps, it will be understood that the
process 1100 ofFIG. 11 can be performed in an alternate order and include a greater or fewer number of steps. - The various functions described above may be implemented or supported by a computer program that is formed from computer readable program codes and that is embodied in a computer readable medium. Computer readable program codes may include source codes, object codes, executable codes, and others. Computer readable mediums may be any type of media capable of being accessed by a computer, and may include Read Only Memory (ROM), Random Access Memory (RAM), a hard disk drive, a compact disc (CD), a digital video disc (DVD), or other forms.
- Terms used herein such as component, module, system, and the like are intended to refer to a computer-related entity, either hardware, a combination of hardware and software, or software execution. By way of example, a component may be, but is not limited to, a process running on a processor, a processor, an object, an executable, a thread of execution, a program, and/or a computer. It is understood that an application running on a server and the server may be a component. One or more components may reside within a process and/or thread of execution and a component may be localized on one computer and/or distributed between two or more computers.
- The present invention is thus not limited to the particular examples disclosed herein, but includes all embodiments falling within the scope of the appended claims.
Claims (10)
- A method (1100) comprising:identifying an entity (208) and an entity location (34, 36; 210; 710; 810) of a plurality of equipment (10);accessing a data repository (52) comprising a plurality of equipment servicing data associated with the equipment (10; 210) at the entity location (34, 36; 210; 710; 810); andoutputting a map image (204; 304; 504; 704; 804; 904) on a graphical user interface (200; 300; 400; 500; 600; 700; 800; 900; 1000);wherein the map image (204; 304; 504; 704; 804; 904) comprising one or more icons indicating one or more equipment locations (216A, 216B, 216C, 216D) and status of the equipment based on the equipment servicing data from the data repository;characterised in that the method further comprises: selectively displaying one or more equipment status details on the graphical user interface (200; 300; 400; 500; 600; 700; 800; 900; 1000) responsive to a detected user input action;outputting a health score (222; 422; 622; 722; 1022) on the graphical user interface (200; 300; 400; 500; 600; 700; 800; 900; 1000) that summarizes a plurality of conditions of the equipment (10) at the one or more equipment locations (216A, 216B, 216C, 216D) displayed on the graphical user interface (200; 300; 400; 500; 600; 700; 800; 900; 1000); and/oroutputting an uptime indicator (224) on the graphical user interface (200; 300; 400; 500; 600; 700; 800; 900; 1000) that summarizes a performance history of the equipment (10) at the one or more equipment locations (216A, 216B, 216C, 216D) displayed on the graphical user interface (200; 300; 400; 500; 600; 700; 800; 900; 1000) for a first predetermined period of time.
- The method (1100) of claim 1, wherein the detected user input action comprises a hovering action over at least one of the one or more icons, and the one or more equipment status details are associated with a specific instance of the equipment (10) at the entity location (34, 36; 210; 710; 810) depicted on the map image (204; 304; 504; 704; 804; 904).
- The method (1100) of any preceding claim, wherein one or more display characteristics of the one or more icons vary based on the status of the equipment (10) indicative of one or more differences in operational conditions of the equipment (10).
- The method (1100) of any preceding claim, further comprising:outputting an activity history (226; 426; 626; 726; 1026) on the graphical user interface (200; 300; 400; 500; 600; 700; 800; 900; 1000) that summarizes a total number of visits (228), scheduled visits (230), predictive maintenance events (232), and service requests (234) for the equipment at the one or more equipment locations displayed on the graphical user interface (200; 300; 400; 500; 600; 700; 800; 900; 1000) for a second predetermined period of time;and/or outputting a unit summary (218, 220) on the graphical user interface (200; 300; 400; 500; 600; 700; 800; 900; 1000) of a plurality of units (25) of the equipment (10) at the one or more equipment locations (216A, 216B, 216C, 216D) displayed on the graphical user interface (200; 300; 400; 500; 600; 700; 800; 900; 1000), wherein each of the units (25) comprises an elevator system (401; 601; 1001);and/or updating the graphical user interface (200; 300; 400; 500; 600; 700; 800; 900; 1000) with a plurality of unit status details (406; 606; 1006) based on detecting a unit selection from the plurality of units (25); andreplacing the map image (204; 304; 504; 704; 804; 904) on the graphical user interface (200; 300; 400; 500; 600; 700; 800; 900; 1000) with a schematic view (404) of a plurality of components (403; 603; 1003) of the elevator system (401; 601; 1001) comprising the unit selection;and/or wherein the unit status details (406; 606; 1006) comprise the health score (222; 422; 622; 722; 1022) for the unit selected, the activity history (226; 426; 626; 726; 1026) for the unit selected, and one or more time history plots (425; 625; 1025) for the unit selected.
- The method (1100) of any preceding claim, further comprising:detecting a change in a zoom level of the map image (204; 304; 504; 704; 804; 904) on the graphical user interface (200; 300; 400; 500; 600; 700; 800; 900; 1000);identifying a plurality of entity locations (34, 36; 210; 710; 810) of the entity within a geographic area displayed on the map image (204; 304; 504; 704; 804; 904);retrieving the equipment servicing data associated with the equipment at the plurality of entity locations (34, 36; 210; 710; 810) from the data repository (52);updating the map image (204; 304; 504; 704; 804; 904) on the graphical user interface (200; 300; 400; 500; 600; 700; 800; 900; 1000) with a plurality of icons indicative of the status of the equipment at the plurality of entity locations (34, 36; 210; 710; 810);determining an update to a plurality of summary data associated with the equipment at the plurality of entity locations (34, 36; 210; 710; 810); andupdating one or more values displayed on the graphical user interface (200; 300; 400; 500; 600; 700; 800; 900; 1000) with the update to the summary data.
- A system (28) comprising:a processing system (40);a user interface driver (44) operable to output a graphical user interface (200; 300; 400; 500; 600; 700; 800; 900; 1000) and receive input through the graphical user interface (200; 300; 400; 500; 600; 700; 800; 900; 1000); anda memory system (46) having a plurality of instructions stored thereon that, when executed by the processing system (40), cause the system to:identify an entity (208) and an entity location (34, 36; 210; 710; 810) of a plurality of equipment (10);access a data repository (52) comprising a plurality of equipment servicing data associated with the equipment (10) at the entity location (34, 36; 210; 710; 810);output a map image (204; 304; 504; 704; 804; 904) on the graphical user interface (200; 300; 400; 500; 600; 700; 800; 900; 1000) comprising one or more icons indicating one or more equipment locations (216A, 216B, 216C, 216D) and status of the equipment based on the equipment servicing data from the data repository (52); and characterised in that the plurality of instructions, when executed by the processing system (40), further causes the system to:selectively display one or more equipment status details on the graphical user interface (200; 300; 400; 500; 600; 700; 800; 900; 1000) responsive to a detected user input action;output a health score (222; 422; 622; 722; 1022) on the graphical user interface (200; 300; 400; 500; 600; 700; 800; 900; 1000) that summarizes a plurality of conditions of the equipment at the one or more equipment locations displayed on the graphical user interface (200; 300; 400; 500; 600; 700; 800; 900; 1000);and/or output an uptime indicator on the graphical user interface (200; 300; 400; 500; 600; 700; 800; 900; 1000) that summarizes a performance history of the equipment at the one or more equipment locations displayed on the graphical user interface (200; 300; 400; 500; 600; 700; 800; 900; 1000) for a first predetermined period of time.
- The system (28) of claim 6, wherein the detected user input action comprises a hovering action over at least one of the one or more icons, and the one or more equipment status details are associated with a specific instance of the equipment at the entity location (34, 36; 210; 710; 810) depicted on the map image (204; 304; 504; 704; 804; 904).
- The system (28) of claim 6 or 7, wherein one or more display characteristics of the one or more icons vary based on the status of the equipment (10) indicative of one or more differences in operational conditions of the equipment (10).
- The system (28) of any of claims 6-8, wherein the instructions when executed by the processing system (40) cause the system to:output an activity history (226; 426; 626; 726; 1026) on the graphical user interface (200; 300; 400; 500; 600; 700; 800; 900; 1000) that summarizes a total number of visits, scheduled visits, predictive maintenance events, and service requests for the equipment at the one or more equipment locations displayed on the graphical user interface (200; 300; 400; 500; 600; 700; 800; 900; 1000) for a second predetermined period of time;and/or output a unit summary on the graphical user interface (200; 300; 400; 500; 600; 700; 800; 900; 1000) of a plurality of units (25) of the equipment (10) at the one or more equipment locations (216A, 216B, 216C, 216D) displayed on the graphical user interface (200; 300; 400; 500; 600; 700; 800; 900; 1000), wherein each of the units comprises an elevator system (401; 601; 1001);and/or update the graphical user interface (200; 300; 400; 500; 600; 700; 800; 900; 1000) with a plurality of unit status details (406; 606; 1006) based on detecting a unit selection from the plurality of units (25); andreplace the map image (204; 304; 504; 704; 804; 904) on the graphical user interface (200; 300; 400; 500; 600; 700; 800; 900; 1000) with a schematic view of a plurality of components (403; 603; 1003) of the elevator system (401; 601; 1001) comprising the unit selection;and/or wherein the unit status details (406; 606; 1006) comprise the health score (222; 422; 622; 722; 1022) for the unit selected, the activity history (226; 426; 626; 726; 1026) for the unit selected, and one or more time history plots (425; 625; 1025) for the unit selected.
- The system (28) of any of claims 6-9, wherein the instructions when executed by the processing system cause the system to:detect a change in a zoom level of the map image (204; 304; 504; 704; 804; 904) on the graphical user interface (200; 300; 400; 500; 600; 700; 800; 900; 1000);identify a plurality of entity locations (34, 36; 210; 710; 810) of the entity (208) within a geographic area displayed on the map image (204; 304; 504; 704; 804; 904);retrieve the equipment servicing data associated with the equipment (10) at the plurality of entity locations (34, 36; 210; 710; 810) from the data repository (52) ;update the map image (204; 304; 504; 704; 804; 904) on the graphical user interface (200; 300; 400; 500; 600; 700; 800; 900; 1000) with a plurality of icons indicative of the status of the equipment at the plurality of entity locations (34, 36; 210; 710; 810);determine an update to a plurality of summary data associated with the equipment at the plurality of entity locations (34, 36; 210; 710; 810); andupdate one or more values displayed on the graphical user interface (200; 300; 400; 500; 600; 700; 800; 900; 1000) with the update to the summary data.
Priority Applications (1)
| Application Number | Priority Date | Filing Date | Title |
|---|---|---|---|
| EP23165949.1A EP4219374B1 (en) | 2018-05-07 | 2019-05-07 | Equipment service graphical interface |
Applications Claiming Priority (2)
| Application Number | Priority Date | Filing Date | Title |
|---|---|---|---|
| US201862668026P | 2018-05-07 | 2018-05-07 | |
| US15/992,714 US11029810B2 (en) | 2018-05-07 | 2018-05-30 | Equipment service graphical interface |
Related Child Applications (2)
| Application Number | Title | Priority Date | Filing Date |
|---|---|---|---|
| EP23165949.1A Division EP4219374B1 (en) | 2018-05-07 | 2019-05-07 | Equipment service graphical interface |
| EP23165949.1A Division-Into EP4219374B1 (en) | 2018-05-07 | 2019-05-07 | Equipment service graphical interface |
Publications (2)
| Publication Number | Publication Date |
|---|---|
| EP3566992A1 EP3566992A1 (en) | 2019-11-13 |
| EP3566992B1 true EP3566992B1 (en) | 2023-09-27 |
Family
ID=66668676
Family Applications (2)
| Application Number | Title | Priority Date | Filing Date |
|---|---|---|---|
| EP23165949.1A Active EP4219374B1 (en) | 2018-05-07 | 2019-05-07 | Equipment service graphical interface |
| EP19173157.9A Active EP3566992B1 (en) | 2018-05-07 | 2019-05-07 | Equipment service graphical interface |
Family Applications Before (1)
| Application Number | Title | Priority Date | Filing Date |
|---|---|---|---|
| EP23165949.1A Active EP4219374B1 (en) | 2018-05-07 | 2019-05-07 | Equipment service graphical interface |
Country Status (4)
| Country | Link |
|---|---|
| US (1) | US11029810B2 (en) |
| EP (2) | EP4219374B1 (en) |
| CN (1) | CN110457094A (en) |
| ES (2) | ES2964003T3 (en) |
Families Citing this family (11)
| Publication number | Priority date | Publication date | Assignee | Title |
|---|---|---|---|---|
| USD889479S1 (en) | 2018-05-07 | 2020-07-07 | Otis Elevator Company | Display screen or portion thereof with graphical user interface |
| JP1652613S (en) * | 2019-08-28 | 2020-02-10 | ||
| JP1652614S (en) * | 2019-08-28 | 2020-02-10 | ||
| US11769099B2 (en) * | 2020-01-20 | 2023-09-26 | Honeywell International Inc. | Apparatuses, computer-implemented methods, and computer program products for improved monitored building environment monitoring and scoring |
| WO2021178815A1 (en) * | 2020-03-06 | 2021-09-10 | Oshkosh Corporation | Systems and methods for augmented reality application |
| US11765109B2 (en) * | 2020-06-09 | 2023-09-19 | Jpmorgan Chase Bank, N.A. | Method and system for providing resiliency in interaction servicing across data centers |
| CN115715270A (en) * | 2020-06-24 | 2023-02-24 | 通力股份公司 | Elevator and escalator control network management |
| CN112560986B (en) * | 2020-12-25 | 2022-01-04 | 上海商汤智能科技有限公司 | Image detection method and device, electronic device and storage medium |
| US11784680B2 (en) * | 2021-08-01 | 2023-10-10 | Johnson Controls Tyco IP Holdings LLP | Controller network with break warning features |
| JP7588353B2 (en) * | 2022-12-23 | 2024-11-22 | パナソニックIpマネジメント株式会社 | Personality analysis system, personality analysis method, and personality analysis program |
| CN118684095B (en) * | 2024-08-28 | 2024-11-01 | 浙江新再灵科技股份有限公司 | Elevator monitoring image response method and system based on elevator running state |
Citations (2)
| Publication number | Priority date | Publication date | Assignee | Title |
|---|---|---|---|---|
| JP2010006576A (en) | 2008-06-30 | 2010-01-14 | Toshiba Elevator Co Ltd | Remote monitoring system for lifting machine |
| JP2014002624A (en) | 2012-06-20 | 2014-01-09 | Hitachi Building Systems Co Ltd | Maintenance business support system for elevator |
Family Cites Families (75)
| Publication number | Priority date | Publication date | Assignee | Title |
|---|---|---|---|---|
| US4930604A (en) * | 1988-10-31 | 1990-06-05 | United Technologies Corporation | Elevator diagnostic monitoring apparatus |
| FI111620B (en) * | 1995-12-21 | 2003-08-29 | Kone Corp | Method and apparatus for displaying the elevator operations |
| JP3877492B2 (en) * | 1999-08-31 | 2007-02-07 | 株式会社日立製作所 | Remote order design system and elevator remote order design method |
| US7447509B2 (en) * | 1999-12-22 | 2008-11-04 | Celeritasworks, Llc | Geographic management system |
| US20020099460A1 (en) * | 2001-01-24 | 2002-07-25 | Bowler Christopher Alen | System for facilitating elevator design |
| JP4045074B2 (en) | 2001-01-31 | 2008-02-13 | 株式会社日立製作所 | Elevator maintenance contract support system |
| US7002462B2 (en) | 2001-02-20 | 2006-02-21 | Gannett Fleming | System and method for remote monitoring and maintenance management of vertical transportation equipment |
| US7194415B2 (en) * | 2001-03-09 | 2007-03-20 | Hitachi, Ltd. | Support system for maintenance contract of elevator |
| JP2003067877A (en) | 2001-08-30 | 2003-03-07 | Toshiba Elevator Co Ltd | System, method and program for maintenance and monitoring |
| JP4005328B2 (en) * | 2001-09-26 | 2007-11-07 | 株式会社日立製作所 | Building equipment and elevator management equipment |
| CN100337895C (en) | 2001-09-28 | 2007-09-19 | 东芝电梯株式会社 | Elevator remote monitoring device |
| US6907375B2 (en) * | 2002-11-06 | 2005-06-14 | Varco I/P, Inc. | Method and apparatus for dynamic checking and reporting system health |
| ZA200307740B (en) | 2002-10-29 | 2004-07-02 | Inventio Ag | Device and method for remote maintenance of a lift. |
| US6882307B1 (en) | 2003-05-09 | 2005-04-19 | Concentrax, Inc. | Interactive system for monitoring and inventory of emergency vehicles and equipment and associated methods |
| WO2005038613A2 (en) | 2003-10-17 | 2005-04-28 | Hydralift Amclyde, Inc. | Equipment component monitoring and replacement management system |
| WO2005113400A1 (en) | 2004-05-21 | 2005-12-01 | Mitsubishi Denki Kabushiki Kaisha | Remote monitor control system for lifting machine |
| US20050288959A1 (en) | 2004-06-16 | 2005-12-29 | David Eraker | Map-based search for real estate service providers |
| US7793762B2 (en) * | 2004-11-30 | 2010-09-14 | Otis Elevator Company | Destination entry passenger interface with multiple functions |
| US20060197781A1 (en) | 2005-03-03 | 2006-09-07 | Arutunian Ethan B | System and method utilizing enhanced imagery and associated overlays |
| US7965178B1 (en) | 2005-09-26 | 2011-06-21 | Schmutter Bruce E | System and method for integrated facility and fireground management |
| US7697850B2 (en) * | 2005-10-31 | 2010-04-13 | Infoprint Solutions Company, Llc | Image-based printer system monitoring |
| JP2007131408A (en) | 2005-11-10 | 2007-05-31 | Toshiba Elevator Co Ltd | Remote monitoring system of elevator |
| US7567844B2 (en) * | 2006-03-17 | 2009-07-28 | Honeywell International Inc. | Building management system |
| US20070268300A1 (en) | 2006-05-22 | 2007-11-22 | Honeywell International Inc. | Information map system |
| AU2007348326B2 (en) | 2006-05-31 | 2012-03-08 | Trx Systems, Inc. | Method and system for locating and monitoring first responders |
| US9057554B2 (en) * | 2006-12-28 | 2015-06-16 | Whirlpool Corporation | Service and maintenance guide for appliance |
| SG183690A1 (en) | 2007-08-06 | 2012-09-27 | Trx Systems Inc | Locating, tracking, and/or monitoring personnel and/or assets both indoors and outdoors |
| US20090216438A1 (en) | 2008-02-21 | 2009-08-27 | Microsoft Corporation | Facility map framework |
| WO2009137654A1 (en) | 2008-05-07 | 2009-11-12 | Power House Dynamics, Llc. | System and method to monitor and manage performance of appliances |
| US8618935B2 (en) | 2009-11-03 | 2013-12-31 | Verizon Patent And Licensing Inc. | Systems and methods for enhancing a user visit to a site premises |
| US9497092B2 (en) * | 2009-12-08 | 2016-11-15 | Hand Held Products, Inc. | Remote device management interface |
| ES2601585T3 (en) | 2009-12-18 | 2017-02-15 | Thyssenkrupp Elevator Ag | Procedure for the telediagnosis of an elevator installation and elevator installation for the procedure |
| US20110190952A1 (en) | 2010-02-04 | 2011-08-04 | Boris Goldstein | Method and System for an Integrated Intelligent Building |
| US20160335731A1 (en) * | 2010-05-05 | 2016-11-17 | Site 10.01, Inc. | System and method for monitoring and managing information |
| US9818072B2 (en) * | 2010-05-18 | 2017-11-14 | United States Postal Service | Systems and methods for facility optimization |
| US8957920B2 (en) * | 2010-06-25 | 2015-02-17 | Microsoft Corporation | Alternative semantics for zoom operations in a zoomable scene |
| EP2625594A4 (en) * | 2010-10-05 | 2014-06-11 | Eyal Weinstein | Computer program, system, method and device for displaying and searching units in a multi-level structure |
| US9365392B2 (en) * | 2011-01-19 | 2016-06-14 | Smart Lifts, Llc | System having multiple cabs in an elevator shaft and control method thereof |
| US20120320058A1 (en) | 2011-06-14 | 2012-12-20 | Robert Stephen Consulting LLC | Facilities management system and method |
| WO2013044069A1 (en) | 2011-09-22 | 2013-03-28 | Aethon, Inc. | Monitoring, diagnostic and tracking tool for autonomous mobile robots |
| US8560600B2 (en) * | 2011-09-26 | 2013-10-15 | Google Inc. | Managing map elements using aggregate feature identifiers |
| US8933930B2 (en) * | 2011-09-30 | 2015-01-13 | Siemens Schweiz Ag | Navigation and filtering with layers and depths for building automation graphics |
| US9318078B2 (en) * | 2011-10-31 | 2016-04-19 | Invensys Systems, Inc. | Intelligent memory management system and method for visualization of information |
| US8358903B1 (en) * | 2011-10-31 | 2013-01-22 | iQuest, Inc. | Systems and methods for recording information on a mobile computing device |
| WO2013076864A1 (en) * | 2011-11-25 | 2013-05-30 | 三菱電機株式会社 | Elevator information display device |
| US20130290899A1 (en) * | 2012-04-30 | 2013-10-31 | Asaf AMRAN | Obtaining status data |
| US9525976B2 (en) * | 2012-05-10 | 2016-12-20 | Honeywell International Inc. | BIM-aware location based application |
| US9425978B2 (en) * | 2012-06-27 | 2016-08-23 | Ubiquiti Networks, Inc. | Method and apparatus for configuring and controlling interfacing devices |
| WO2014055070A1 (en) * | 2012-10-03 | 2014-04-10 | Otis Elevator Company | Elevator demand entering device |
| US10359294B2 (en) * | 2012-10-29 | 2019-07-23 | Google Llc | Interactive digital map on a portable device |
| US20140142895A1 (en) * | 2012-11-16 | 2014-05-22 | Qualcomm Incorporated | Extracting and inferring map metadata from architectural diagrams |
| US10346560B2 (en) * | 2013-02-14 | 2019-07-09 | Plangrid, Inc. | Electronic blueprint system and method |
| US9383890B2 (en) * | 2013-03-14 | 2016-07-05 | General Electric Company | Semantic zoom of graphical visualizations in industrial HMI systems |
| US20150019625A1 (en) | 2013-07-09 | 2015-01-15 | Google Inc. | Providing indoor map data to a client computing device |
| US9342223B2 (en) * | 2013-08-16 | 2016-05-17 | Honeywell International Inc. | System and method for virtual region based access control operations using BIM |
| US20150284214A1 (en) * | 2014-04-07 | 2015-10-08 | Thyssenkrupp Elevator Ag | Elevator health check |
| US9571986B2 (en) * | 2014-05-07 | 2017-02-14 | Johnson Controls Technology Company | Systems and methods for detecting and using equipment location in a building management system |
| CN106465050B (en) * | 2014-05-23 | 2020-07-10 | 因温特奥股份公司 | Configure End Devices |
| JP6025267B2 (en) | 2014-06-20 | 2016-11-16 | 見治 西石垣 | Survey type navigation system |
| US10112801B2 (en) | 2014-08-05 | 2018-10-30 | Richard Laszlo Madarasz | Elevator inspection apparatus with separate computing device and sensors |
| WO2016026080A1 (en) * | 2014-08-19 | 2016-02-25 | Honeywell International Inc. | Building data consolidation methods and systems |
| US10222767B2 (en) * | 2014-09-10 | 2019-03-05 | Honeywell International Inc. | HVAC information display system |
| US9747585B2 (en) * | 2014-10-14 | 2017-08-29 | Xicore Inc. | Method of retrieving and uniformalizing elevator maintenance and callback data and code events |
| US9767441B2 (en) | 2014-10-14 | 2017-09-19 | Xicore Inc. | System for monitoring elevators and maintaining elevators |
| US20180150806A1 (en) * | 2014-10-14 | 2018-05-31 | Xicore Inc. | Systems for Actively Monitoring Lift Devices and Maintaining Lift Devices, and Related Methods |
| US10048077B2 (en) * | 2014-11-24 | 2018-08-14 | Pornchai Direkwut | Method and system of generating an indoor floor plan |
| US10139792B2 (en) * | 2015-09-30 | 2018-11-27 | Johnson Controls Technology Company | Building management system with heuristics for configuring building spaces |
| US20170201428A1 (en) * | 2016-01-13 | 2017-07-13 | Ca, Inc. | Interactive Graphical User Interface (GUI) for Managing Sites |
| US20170315696A1 (en) * | 2016-04-27 | 2017-11-02 | Crestron Electronics, Inc. | Three-dimensional building management system visualization |
| US10294069B2 (en) * | 2016-04-28 | 2019-05-21 | Thyssenkrupp Elevator Ag | Multimodal user interface for destination call request of elevator systems using route and car selection methods |
| USD858548S1 (en) * | 2017-04-13 | 2019-09-03 | Inventio Ag | Display screen with graphical user interface |
| WO2018222510A2 (en) * | 2017-06-02 | 2018-12-06 | Apple Inc. | Venues map application and system |
| EP3409630B1 (en) | 2017-06-02 | 2020-11-11 | Otis Elevator Company | Passenger conveyor performance rating system |
| CN107187982A (en) | 2017-06-26 | 2017-09-22 | 成都烽火源信息技术有限公司 | A kind of elevator maintenance monitoring and managing method and system |
| US10896234B2 (en) * | 2018-03-29 | 2021-01-19 | Palantir Technologies Inc. | Interactive geographical map |
-
2018
- 2018-05-30 US US15/992,714 patent/US11029810B2/en active Active
-
2019
- 2019-05-06 CN CN201910373815.7A patent/CN110457094A/en active Pending
- 2019-05-07 ES ES19173157T patent/ES2964003T3/en active Active
- 2019-05-07 EP EP23165949.1A patent/EP4219374B1/en active Active
- 2019-05-07 ES ES23165949T patent/ES3034441T3/en active Active
- 2019-05-07 EP EP19173157.9A patent/EP3566992B1/en active Active
Patent Citations (2)
| Publication number | Priority date | Publication date | Assignee | Title |
|---|---|---|---|---|
| JP2010006576A (en) | 2008-06-30 | 2010-01-14 | Toshiba Elevator Co Ltd | Remote monitoring system for lifting machine |
| JP2014002624A (en) | 2012-06-20 | 2014-01-09 | Hitachi Building Systems Co Ltd | Maintenance business support system for elevator |
Non-Patent Citations (7)
| Title |
|---|
| "Beginning Google Maps API 3", 1 January 2010, APRESS®, ISBN: 978-1-4302-2803-5, article SVENNERBERG GABRIEL: "CHAPTER 5 IX MARKS THE SPOT", pages: 79 - 80, XP093195100 |
| ANONYMOUS: "Gerätetreiber", WIKIPEDIA, 27 April 2018 (2018-04-27), XP093195102, Retrieved from the Internet <URL:https://de.wikipedia.org/w/index.php?title=Ger%25C3%25A4tetreiber&oldid=176914073> |
| ANONYMOUS: "Mouseover", WIKIPEDIA, 10 December 2016 (2016-12-10), XP093195105, Retrieved from the Internet <URL:https://en.wikipedia.org/w/index.php?title=Mouseover&oldid=753995213> |
| SCHINDLER DEUTSCHLAND: "Das Beste: Schindler Ahead auf der Hannover Messe 2018", YOU TUBE, 2 May 2018 (2018-05-02), XP093195110, Retrieved from the Internet <URL:https://youtu.be/iH_4CY6xrqo?feature=shared> |
| SCHINDLER DEUTSCHLAND: "Das Beste: Schindler Ahead auf der Hannover Messe 2018", YOUTUBE, 2 May 2018 (2018-05-02), XP093195116, Retrieved from the Internet <URL:https://youtu.be/iH_4CY6xrqo?feature=shared> |
| SCHINDLER ELEVATOR N.A.: "Schindler Ahead", YOUTUBE, 11 August 2017 (2017-08-11), XP093195108, Retrieved from the Internet <URL:https://youtu.be/6tQXLP6BK00?feature=shared> |
| YOUTUBE: "Schindler Ahead"", 11 August 2017 (2017-08-11), XP93195114, Retrieved from the Internet <URL:https://youtu.be/6tQXLP6BK00?feature=shared> [retrieved on 20240625] |
Also Published As
| Publication number | Publication date |
|---|---|
| ES2964003T3 (en) | 2024-04-03 |
| EP4219374B1 (en) | 2025-06-25 |
| US20190339841A1 (en) | 2019-11-07 |
| US11029810B2 (en) | 2021-06-08 |
| EP4219374A1 (en) | 2023-08-02 |
| ES3034441T3 (en) | 2025-08-18 |
| CN110457094A (en) | 2019-11-15 |
| EP3566992A1 (en) | 2019-11-13 |
Similar Documents
| Publication | Publication Date | Title |
|---|---|---|
| EP3566992B1 (en) | Equipment service graphical interface | |
| US9124488B2 (en) | Method and apparatus for visualizing the health of datacenter objects | |
| US10802679B2 (en) | Methods and apparatus for configuring a data analyzer | |
| US11351682B2 (en) | Environment monitoring and associated monitoring device | |
| EP3508445B1 (en) | Elevator auto-positioning for validating maintenance | |
| EP3095013B1 (en) | Method and system for use in connection with an industrial control system | |
| EP3587326A1 (en) | Maintenance scheduling based on remote monitoring data and service data analytics | |
| EP3617117B1 (en) | Model development framework for remote monitoring condition-based maintenance | |
| JP7463076B2 (en) | Information display system and information display method | |
| WO2019220913A1 (en) | Management device, management method, and management program | |
| JPWO2016190434A1 (en) | Excavator support device | |
| CN118605470B (en) | Vehicle diagnostic methods, devices, equipment, storage media, and program products | |
| US20140188428A1 (en) | Methods and apparatus for defining a probe configuration using a probe configuration tool | |
| WO2024080359A1 (en) | Management device, management method, and management program | |
| WO2023199524A1 (en) | Monitoring system, monitoring method, and monitoring program | |
| JP7572934B2 (en) | Defect Analysis Equipment | |
| CN114495316A (en) | Data monitoring method and device for precision motion platform | |
| JP2005011169A (en) | How to display process event occurrence history | |
| US12462623B2 (en) | Systems and methods for fleet level mapping of fault code locations | |
| CN115994070B (en) | System availability detection method and device, electronic equipment and readable storage medium | |
| JP7780728B2 (en) | Information analysis system, information analysis method and program | |
| EP4501833A1 (en) | Maintenance system for passenger transport equipment | |
| WO2024191559A1 (en) | Systems and methods for fleet level mapping of fault code locations | |
| KR20250137236A (en) | Smart process safety management system | |
| JP2025081097A (en) | Elevator monitoring device and monitoring method |
Legal Events
| Date | Code | Title | Description |
|---|---|---|---|
| PUAI | Public reference made under article 153(3) epc to a published international application that has entered the european phase |
Free format text: ORIGINAL CODE: 0009012 |
|
| STAA | Information on the status of an ep patent application or granted ep patent |
Free format text: STATUS: THE APPLICATION HAS BEEN PUBLISHED |
|
| AK | Designated contracting states |
Kind code of ref document: A1 Designated state(s): AL AT BE BG CH CY CZ DE DK EE ES FI FR GB GR HR HU IE IS IT LI LT LU LV MC MK MT NL NO PL PT RO RS SE SI SK SM TR |
|
| AX | Request for extension of the european patent |
Extension state: BA ME |
|
| STAA | Information on the status of an ep patent application or granted ep patent |
Free format text: STATUS: REQUEST FOR EXAMINATION WAS MADE |
|
| 17P | Request for examination filed |
Effective date: 20200513 |
|
| RBV | Designated contracting states (corrected) |
Designated state(s): AL AT BE BG CH CY CZ DE DK EE ES FI FR GB GR HR HU IE IS IT LI LT LU LV MC MK MT NL NO PL PT RO RS SE SI SK SM TR |
|
| STAA | Information on the status of an ep patent application or granted ep patent |
Free format text: STATUS: EXAMINATION IS IN PROGRESS |
|
| 17Q | First examination report despatched |
Effective date: 20211020 |
|
| GRAP | Despatch of communication of intention to grant a patent |
Free format text: ORIGINAL CODE: EPIDOSNIGR1 |
|
| STAA | Information on the status of an ep patent application or granted ep patent |
Free format text: STATUS: GRANT OF PATENT IS INTENDED |
|
| INTG | Intention to grant announced |
Effective date: 20221110 |
|
| GRAJ | Information related to disapproval of communication of intention to grant by the applicant or resumption of examination proceedings by the epo deleted |
Free format text: ORIGINAL CODE: EPIDOSDIGR1 |
|
| STAA | Information on the status of an ep patent application or granted ep patent |
Free format text: STATUS: EXAMINATION IS IN PROGRESS |
|
| GRAP | Despatch of communication of intention to grant a patent |
Free format text: ORIGINAL CODE: EPIDOSNIGR1 |
|
| STAA | Information on the status of an ep patent application or granted ep patent |
Free format text: STATUS: GRANT OF PATENT IS INTENDED |
|
| INTC | Intention to grant announced (deleted) | ||
| INTG | Intention to grant announced |
Effective date: 20230412 |
|
| GRAS | Grant fee paid |
Free format text: ORIGINAL CODE: EPIDOSNIGR3 |
|
| GRAA | (expected) grant |
Free format text: ORIGINAL CODE: 0009210 |
|
| STAA | Information on the status of an ep patent application or granted ep patent |
Free format text: STATUS: THE PATENT HAS BEEN GRANTED |
|
| AK | Designated contracting states |
Kind code of ref document: B1 Designated state(s): AL AT BE BG CH CY CZ DE DK EE ES FI FR GB GR HR HU IE IS IT LI LT LU LV MC MK MT NL NO PL PT RO RS SE SI SK SM TR |
|
| REG | Reference to a national code |
Ref country code: GB Ref legal event code: FG4D |
|
| REG | Reference to a national code |
Ref country code: CH Ref legal event code: EP |
|
| REG | Reference to a national code |
Ref country code: DE Ref legal event code: R096 Ref document number: 602019038054 Country of ref document: DE |
|
| REG | Reference to a national code |
Ref country code: IE Ref legal event code: FG4D |
|
| REG | Reference to a national code |
Ref country code: LT Ref legal event code: MG9D |
|
| PG25 | Lapsed in a contracting state [announced via postgrant information from national office to epo] |
Ref country code: GR Free format text: LAPSE BECAUSE OF FAILURE TO SUBMIT A TRANSLATION OF THE DESCRIPTION OR TO PAY THE FEE WITHIN THE PRESCRIBED TIME-LIMIT Effective date: 20231228 |
|
| PG25 | Lapsed in a contracting state [announced via postgrant information from national office to epo] |
Ref country code: SE Free format text: LAPSE BECAUSE OF FAILURE TO SUBMIT A TRANSLATION OF THE DESCRIPTION OR TO PAY THE FEE WITHIN THE PRESCRIBED TIME-LIMIT Effective date: 20230927 Ref country code: RS Free format text: LAPSE BECAUSE OF FAILURE TO SUBMIT A TRANSLATION OF THE DESCRIPTION OR TO PAY THE FEE WITHIN THE PRESCRIBED TIME-LIMIT Effective date: 20230927 Ref country code: NO Free format text: LAPSE BECAUSE OF FAILURE TO SUBMIT A TRANSLATION OF THE DESCRIPTION OR TO PAY THE FEE WITHIN THE PRESCRIBED TIME-LIMIT Effective date: 20231227 Ref country code: LV Free format text: LAPSE BECAUSE OF FAILURE TO SUBMIT A TRANSLATION OF THE DESCRIPTION OR TO PAY THE FEE WITHIN THE PRESCRIBED TIME-LIMIT Effective date: 20230927 Ref country code: LT Free format text: LAPSE BECAUSE OF FAILURE TO SUBMIT A TRANSLATION OF THE DESCRIPTION OR TO PAY THE FEE WITHIN THE PRESCRIBED TIME-LIMIT Effective date: 20230927 Ref country code: HR Free format text: LAPSE BECAUSE OF FAILURE TO SUBMIT A TRANSLATION OF THE DESCRIPTION OR TO PAY THE FEE WITHIN THE PRESCRIBED TIME-LIMIT Effective date: 20230927 Ref country code: GR Free format text: LAPSE BECAUSE OF FAILURE TO SUBMIT A TRANSLATION OF THE DESCRIPTION OR TO PAY THE FEE WITHIN THE PRESCRIBED TIME-LIMIT Effective date: 20231228 Ref country code: FI Free format text: LAPSE BECAUSE OF FAILURE TO SUBMIT A TRANSLATION OF THE DESCRIPTION OR TO PAY THE FEE WITHIN THE PRESCRIBED TIME-LIMIT Effective date: 20230927 |
|
| REG | Reference to a national code |
Ref country code: NL Ref legal event code: MP Effective date: 20230927 |
|
| REG | Reference to a national code |
Ref country code: AT Ref legal event code: MK05 Ref document number: 1615266 Country of ref document: AT Kind code of ref document: T Effective date: 20230927 |
|
| PG25 | Lapsed in a contracting state [announced via postgrant information from national office to epo] |
Ref country code: NL Free format text: LAPSE BECAUSE OF FAILURE TO SUBMIT A TRANSLATION OF THE DESCRIPTION OR TO PAY THE FEE WITHIN THE PRESCRIBED TIME-LIMIT Effective date: 20230927 |
|
| REG | Reference to a national code |
Ref country code: ES Ref legal event code: FG2A Ref document number: 2964003 Country of ref document: ES Kind code of ref document: T3 Effective date: 20240403 |
|
| PG25 | Lapsed in a contracting state [announced via postgrant information from national office to epo] |
Ref country code: IS Free format text: LAPSE BECAUSE OF FAILURE TO SUBMIT A TRANSLATION OF THE DESCRIPTION OR TO PAY THE FEE WITHIN THE PRESCRIBED TIME-LIMIT Effective date: 20240127 |
|
| PG25 | Lapsed in a contracting state [announced via postgrant information from national office to epo] |
Ref country code: AT Free format text: LAPSE BECAUSE OF FAILURE TO SUBMIT A TRANSLATION OF THE DESCRIPTION OR TO PAY THE FEE WITHIN THE PRESCRIBED TIME-LIMIT Effective date: 20230927 |
|
| PG25 | Lapsed in a contracting state [announced via postgrant information from national office to epo] |
Ref country code: SM Free format text: LAPSE BECAUSE OF FAILURE TO SUBMIT A TRANSLATION OF THE DESCRIPTION OR TO PAY THE FEE WITHIN THE PRESCRIBED TIME-LIMIT Effective date: 20230927 Ref country code: RO Free format text: LAPSE BECAUSE OF FAILURE TO SUBMIT A TRANSLATION OF THE DESCRIPTION OR TO PAY THE FEE WITHIN THE PRESCRIBED TIME-LIMIT Effective date: 20230927 Ref country code: IS Free format text: LAPSE BECAUSE OF FAILURE TO SUBMIT A TRANSLATION OF THE DESCRIPTION OR TO PAY THE FEE WITHIN THE PRESCRIBED TIME-LIMIT Effective date: 20240127 Ref country code: EE Free format text: LAPSE BECAUSE OF FAILURE TO SUBMIT A TRANSLATION OF THE DESCRIPTION OR TO PAY THE FEE WITHIN THE PRESCRIBED TIME-LIMIT Effective date: 20230927 Ref country code: CZ Free format text: LAPSE BECAUSE OF FAILURE TO SUBMIT A TRANSLATION OF THE DESCRIPTION OR TO PAY THE FEE WITHIN THE PRESCRIBED TIME-LIMIT Effective date: 20230927 Ref country code: AT Free format text: LAPSE BECAUSE OF FAILURE TO SUBMIT A TRANSLATION OF THE DESCRIPTION OR TO PAY THE FEE WITHIN THE PRESCRIBED TIME-LIMIT Effective date: 20230927 Ref country code: PT Free format text: LAPSE BECAUSE OF FAILURE TO SUBMIT A TRANSLATION OF THE DESCRIPTION OR TO PAY THE FEE WITHIN THE PRESCRIBED TIME-LIMIT Effective date: 20240129 Ref country code: SK Free format text: LAPSE BECAUSE OF FAILURE TO SUBMIT A TRANSLATION OF THE DESCRIPTION OR TO PAY THE FEE WITHIN THE PRESCRIBED TIME-LIMIT Effective date: 20230927 |
|
| PG25 | Lapsed in a contracting state [announced via postgrant information from national office to epo] |
Ref country code: PL Free format text: LAPSE BECAUSE OF FAILURE TO SUBMIT A TRANSLATION OF THE DESCRIPTION OR TO PAY THE FEE WITHIN THE PRESCRIBED TIME-LIMIT Effective date: 20230927 Ref country code: IT Free format text: LAPSE BECAUSE OF FAILURE TO SUBMIT A TRANSLATION OF THE DESCRIPTION OR TO PAY THE FEE WITHIN THE PRESCRIBED TIME-LIMIT Effective date: 20230927 |
|
| REG | Reference to a national code |
Ref country code: DE Ref legal event code: R026 Ref document number: 602019038054 Country of ref document: DE |
|
| PLBI | Opposition filed |
Free format text: ORIGINAL CODE: 0009260 |
|
| PLAX | Notice of opposition and request to file observation + time limit sent |
Free format text: ORIGINAL CODE: EPIDOSNOBS2 |
|
| PG25 | Lapsed in a contracting state [announced via postgrant information from national office to epo] |
Ref country code: DK Free format text: LAPSE BECAUSE OF FAILURE TO SUBMIT A TRANSLATION OF THE DESCRIPTION OR TO PAY THE FEE WITHIN THE PRESCRIBED TIME-LIMIT Effective date: 20230927 |
|
| PG25 | Lapsed in a contracting state [announced via postgrant information from national office to epo] |
Ref country code: DK Free format text: LAPSE BECAUSE OF FAILURE TO SUBMIT A TRANSLATION OF THE DESCRIPTION OR TO PAY THE FEE WITHIN THE PRESCRIBED TIME-LIMIT Effective date: 20230927 |
|
| 26 | Opposition filed |
Opponent name: INVENTIO AG Effective date: 20240626 |
|
| PG25 | Lapsed in a contracting state [announced via postgrant information from national office to epo] |
Ref country code: SI Free format text: LAPSE BECAUSE OF FAILURE TO SUBMIT A TRANSLATION OF THE DESCRIPTION OR TO PAY THE FEE WITHIN THE PRESCRIBED TIME-LIMIT Effective date: 20230927 |
|
| PG25 | Lapsed in a contracting state [announced via postgrant information from national office to epo] |
Ref country code: SI Free format text: LAPSE BECAUSE OF FAILURE TO SUBMIT A TRANSLATION OF THE DESCRIPTION OR TO PAY THE FEE WITHIN THE PRESCRIBED TIME-LIMIT Effective date: 20230927 |
|
| PLBB | Reply of patent proprietor to notice(s) of opposition received |
Free format text: ORIGINAL CODE: EPIDOSNOBS3 |
|
| PG25 | Lapsed in a contracting state [announced via postgrant information from national office to epo] |
Ref country code: BG Free format text: LAPSE BECAUSE OF FAILURE TO SUBMIT A TRANSLATION OF THE DESCRIPTION OR TO PAY THE FEE WITHIN THE PRESCRIBED TIME-LIMIT Effective date: 20230927 |
|
| PG25 | Lapsed in a contracting state [announced via postgrant information from national office to epo] |
Ref country code: BG Free format text: LAPSE BECAUSE OF FAILURE TO SUBMIT A TRANSLATION OF THE DESCRIPTION OR TO PAY THE FEE WITHIN THE PRESCRIBED TIME-LIMIT Effective date: 20230927 |
|
| REG | Reference to a national code |
Ref country code: CH Ref legal event code: PL |
|
| PG25 | Lapsed in a contracting state [announced via postgrant information from national office to epo] |
Ref country code: MC Free format text: LAPSE BECAUSE OF FAILURE TO SUBMIT A TRANSLATION OF THE DESCRIPTION OR TO PAY THE FEE WITHIN THE PRESCRIBED TIME-LIMIT Effective date: 20230927 |
|
| PG25 | Lapsed in a contracting state [announced via postgrant information from national office to epo] |
Ref country code: LU Free format text: LAPSE BECAUSE OF NON-PAYMENT OF DUE FEES Effective date: 20240507 |
|
| PG25 | Lapsed in a contracting state [announced via postgrant information from national office to epo] |
Ref country code: MC Free format text: LAPSE BECAUSE OF FAILURE TO SUBMIT A TRANSLATION OF THE DESCRIPTION OR TO PAY THE FEE WITHIN THE PRESCRIBED TIME-LIMIT Effective date: 20230927 Ref country code: LU Free format text: LAPSE BECAUSE OF NON-PAYMENT OF DUE FEES Effective date: 20240507 Ref country code: CH Free format text: LAPSE BECAUSE OF NON-PAYMENT OF DUE FEES Effective date: 20240531 |
|
| REG | Reference to a national code |
Ref country code: BE Ref legal event code: MM Effective date: 20240531 |
|
| PG25 | Lapsed in a contracting state [announced via postgrant information from national office to epo] |
Ref country code: IE Free format text: LAPSE BECAUSE OF NON-PAYMENT OF DUE FEES Effective date: 20240507 |
|
| PG25 | Lapsed in a contracting state [announced via postgrant information from national office to epo] |
Ref country code: BE Free format text: LAPSE BECAUSE OF NON-PAYMENT OF DUE FEES Effective date: 20240531 |
|
| PGFP | Annual fee paid to national office [announced via postgrant information from national office to epo] |
Ref country code: DE Payment date: 20250423 Year of fee payment: 7 |
|
| PGFP | Annual fee paid to national office [announced via postgrant information from national office to epo] |
Ref country code: ES Payment date: 20250602 Year of fee payment: 7 Ref country code: GB Payment date: 20250423 Year of fee payment: 7 |
|
| PGFP | Annual fee paid to national office [announced via postgrant information from national office to epo] |
Ref country code: FR Payment date: 20250424 Year of fee payment: 7 |
|
| PG25 | Lapsed in a contracting state [announced via postgrant information from national office to epo] |
Ref country code: CY Free format text: LAPSE BECAUSE OF FAILURE TO SUBMIT A TRANSLATION OF THE DESCRIPTION OR TO PAY THE FEE WITHIN THE PRESCRIBED TIME-LIMIT; INVALID AB INITIO Effective date: 20190507 |
|
| PG25 | Lapsed in a contracting state [announced via postgrant information from national office to epo] |
Ref country code: HU Free format text: LAPSE BECAUSE OF FAILURE TO SUBMIT A TRANSLATION OF THE DESCRIPTION OR TO PAY THE FEE WITHIN THE PRESCRIBED TIME-LIMIT; INVALID AB INITIO Effective date: 20190507 |
|
| RDAF | Communication despatched that patent is revoked |
Free format text: ORIGINAL CODE: EPIDOSNREV1 |