EP3559902B1 - Notation informatique basée sur des images primaires de coloration et d'immunohistochimie - Google Patents
Notation informatique basée sur des images primaires de coloration et d'immunohistochimie Download PDFInfo
- Publication number
- EP3559902B1 EP3559902B1 EP17826220.0A EP17826220A EP3559902B1 EP 3559902 B1 EP3559902 B1 EP 3559902B1 EP 17826220 A EP17826220 A EP 17826220A EP 3559902 B1 EP3559902 B1 EP 3559902B1
- Authority
- EP
- European Patent Office
- Prior art keywords
- image
- features
- computer
- tissue
- nuclei
- Prior art date
- Legal status (The legal status is an assumption and is not a legal conclusion. Google has not performed a legal analysis and makes no representation as to the accuracy of the status listed.)
- Active
Links
Images


Classifications
-
- G—PHYSICS
- G06—COMPUTING OR CALCULATING; COUNTING
- G06T—IMAGE DATA PROCESSING OR GENERATION, IN GENERAL
- G06T7/00—Image analysis
- G06T7/0002—Inspection of images, e.g. flaw detection
- G06T7/0012—Biomedical image inspection
-
- G—PHYSICS
- G06—COMPUTING OR CALCULATING; COUNTING
- G06V—IMAGE OR VIDEO RECOGNITION OR UNDERSTANDING
- G06V20/00—Scenes; Scene-specific elements
- G06V20/60—Type of objects
- G06V20/69—Microscopic objects, e.g. biological cells or cellular parts
- G06V20/695—Preprocessing, e.g. image segmentation
-
- G—PHYSICS
- G06—COMPUTING OR CALCULATING; COUNTING
- G06V—IMAGE OR VIDEO RECOGNITION OR UNDERSTANDING
- G06V20/00—Scenes; Scene-specific elements
- G06V20/60—Type of objects
- G06V20/69—Microscopic objects, e.g. biological cells or cellular parts
- G06V20/698—Matching; Classification
-
- G—PHYSICS
- G06—COMPUTING OR CALCULATING; COUNTING
- G06T—IMAGE DATA PROCESSING OR GENERATION, IN GENERAL
- G06T2207/00—Indexing scheme for image analysis or image enhancement
- G06T2207/10—Image acquisition modality
- G06T2207/10056—Microscopic image
-
- G—PHYSICS
- G06—COMPUTING OR CALCULATING; COUNTING
- G06T—IMAGE DATA PROCESSING OR GENERATION, IN GENERAL
- G06T2207/00—Indexing scheme for image analysis or image enhancement
- G06T2207/30—Subject of image; Context of image processing
- G06T2207/30004—Biomedical image processing
-
- G—PHYSICS
- G06—COMPUTING OR CALCULATING; COUNTING
- G06T—IMAGE DATA PROCESSING OR GENERATION, IN GENERAL
- G06T2207/00—Indexing scheme for image analysis or image enhancement
- G06T2207/30—Subject of image; Context of image processing
- G06T2207/30004—Biomedical image processing
- G06T2207/30024—Cell structures in vitro; Tissue sections in vitro
-
- G—PHYSICS
- G06—COMPUTING OR CALCULATING; COUNTING
- G06T—IMAGE DATA PROCESSING OR GENERATION, IN GENERAL
- G06T2207/00—Indexing scheme for image analysis or image enhancement
- G06T2207/30—Subject of image; Context of image processing
- G06T2207/30004—Biomedical image processing
- G06T2207/30096—Tumor; Lesion
Definitions
- the specimens are often stained with one or more combinations of stains or assays, and the stained biological specimen is viewed or imaged for further analysis. Observing the assay enables a variety of processes, including diagnosis of disease, assessment of response to treatment, and development of new drugs to fight disease.
- Immunohistochemical (IHC) slide staining can be utilized to identify proteins in cells of a tissue section and hence is widely used in the study of different types of cells, such as cancerous cells and immune cells in biological tissue.
- the immunological data indicates the type, density, and location of the immune cells within tumor samples and this data is of particular interest to pathologists in determining a patient survival prediction.
- IHC staining may be used in research to understand the distribution and localization of the differentially expressed biomarkers of immune cells (such as T-cells or B-cells) in a cancerous tissue for an immune response study.
- tumors often contain infiltrates of immune cells, which may prevent the development of tumors or favor the outgrowth of tumors.
- the expert reader selects the representative fields of view (FOVs) or regions of interest (ROIs) manually, as the initial step, by reviewing the slide under a microscope or reading an image of a slide, which has been scanned / digitized, on a display.
- FOVs fields of view
- ROIs regions of interest
- the tissue slide is scanned, the scanned image is viewed by independent readers and the FOVs or ROIs are manually marked based on the readers' personal preferences.
- a pathologist/reader manually counts the immune cells within the selected FOVs or ROIs.
- Manual selection of the FOVs or ROIs and counting is highly subjective and biased to the readers, as different readers may select different FOVs or ROIs to count.
- WO 2015/124777 A1 describes medical analysis for identifying biomarker-positive tumour cells.
- WO 2015/052128 A1 describes systems and methods for comprehensive multi-assay tissue analysis.
- WO 2016/087592 A1 describes systems and methods for early stage cancer prognosis.
- WO 2015/124777 A1 describes a medical image analysis method for identifying biomarker-positive tumor cells, the method comprising reading a first digital image and a second digital image into memory, the first and second digital image depicting the same area of a first slide, the first slide comprising multiple tumor cells having being stained with a first stain and with a second stain, the first stain selectively staining nuclei and the second stain selectively staining a particular biomarker, the presence and/or amount of the biomarker in a tumor cell being indicative of a tumor cell belonging to a particular cancer-subtype, identifying a plurality of nuclei and positional information of said nuclei by analyzing the light intensities in the first digital image, identifying cell membranes which comprise the biomarker by analyzing the light intensities in the second digital image and by analyzing the positional information of the identified nuclei, identifying biomarker-positive tumor cells in said area, wherein a biomarker- positive tumor cell is a combination of one identified nucleus and
- WO 2015/052128 A1 describes systems and methods for receiving a plurality of assay information along with a query for one or more features of interest, and projecting anatomical information from an anatomical assay onto a staining assay, for example an immunohistochemical (IHC) assay that is commonly registered with the anatomical assay, to locate or determine features appropriate for analysis.
- a staining assay for example an immunohistochemical (IHC) assay that is commonly registered with the anatomical assay, to locate or determine features appropriate for analysis.
- IHC immunohistochemical
- WO 2016/087592 A1 describes systems and computer-implemented methods for providing reliable risk stratification for early-stage cancer patients by predicting a recurrence risk of the patient and to categorize the patient into a high or low risk group.
- the present invention provides a computer-implemented method as set out in claim 1.
- the biomarker image comprises signals corresponding to a presence of at least one of an estrogen receptor (ER) marker, a progesterone receptor (PR) marker, a Ki-67 marker, or a HER2 marker. In some embodiments, the biomarker image comprises signals corresponding to a presence of a PD-L1 marker, CD3 marker or CD8 marker. In some embodiments, the computer-implemented method further comprises the step of scoring the classified nuclei.
- the image in which the nuclei are classified is the image having signals corresponding to markers (e.g. a biomarker image).
- the probability features are computed by (i) generating a probability map from one of the first image or the registered image; and (ii) deriving features from the generated probability map.
- a whole tumor region is mapped from the first image to the second image to form the registered biomarker image.
- the method further comprises the step of detecting nuclei in the registered image and wherein the features derived from the registered image are computed based on the detected nuclei.
- the method further comprises the step of generating a probability map images based on the at least one of the segmented tissue structures or the detected and classified cell types.
- the probability features are derived from the generated probability map images.
- the performing of the analysis of the second image comprises at least one (i) segmenting tissue structures; or (ii) detecting and classifying cell types.
- the method further comprises the step of detecting nuclei in the registered image and wherein the features derived from the first image are computed based on the detected nuclei.
- the features from the first and/or second images include pyramid histogram features.
- an H&E tissue slide is used for the initial primary diagnosis to detect, grade and stage cancer type for a particular tissue indication (breast, prostate, lung cancer etc.).
- IHC tissue slides are typically used for cancer subtyping for prognostic and predictive purposes.
- the tissue morphology i.e. tumorous glandular regions, cells and lymphocytes and lymphatic regions and stromal regions and cells are easily distinguishable in H&E tissue slide.
- DAB simplex or multiplex IHC chromogenic assay
- pathologists In the manual process to review and interpret IHC slides either under a microscope or on a digital read of a whole slide capture on a computer monitor, pathologists typically also review the corresponding regions in H&E tissue slide images for a better visual understanding of the tissue morphology and disambiguate tissue structures, that may be similar looking in the chromogenic IHC tissue slide. For example, in a IHC tissue slide counter stained tumor nuclei and lymphocytes have a similar chromogenic appearance making it visually difficult to differentiate whereas it is easier to disambiguate tumor cells and lymphocytes in an H&E tissue slide as compared a IHC tissue slide. Thus, typically, pathologist integrate information from H&E and IHC tissue slides for better tissue slide interpretation and scoring.
- H&E information at the same region of interest is used to confirm the locations of tumor and stromal regions; H&E information at the same region of interest is used to confirm existence of immune cells within tumor region; and an H&E slide is used to identify and confirm the regions not to score.
- Applicants have developed a method for the automated use of H&E tissue slide information in the image analysis and scoring of IHC tissue slides. Based on the regions that are selected by the pathologist to score IHC slides, Applicants have developed an automated method of "mapping back" those selected regions to corresponding regions in the H&E whole slide image using an intermarker registration algorithm and analyzing those regions using H&E image analysis algorithms to detect various tissue structures and morphology. Applicants have also developed an automated method of using the H&E image analysis results to derive relevant information and metrics for effective and combined use in the image analysis of the corresponding region in the IHC tissue slide.
- the present disclosure provides digital pathology systems and workflows which utilize information from an H&E whole slide image in the analysis and interpretation of IHC and/or ISH whole slide images (collectively referred to herein as "biomarker images").
- biomarker images collectively referred to herein as "biomarker images”
- a "blob” or "pixel blob” as used herein is a region or a spatially connected collection of pixels in a digital image that differs in properties, such as brightness or color, compared to surrounding regions.
- a blob may be a set of adjacent pixels having a particular intensity value range.
- Some of the blobs may be classified as "object candidates". Blobs may be detected, for example, by differential methods, which are based on derivatives of the function with respect to position, and methods based on local extrema, which are based on finding the local maxima and minima of the function.
- a method involving steps a, b, and c means that the method includes at least steps a, b, and c.
- steps and processes may be outlined herein in a particular order, the skilled artisan will recognize that the ordering steps and processes may vary.
- immunohistochemistry refers to a method of determining the presence or distribution of an antigen in a sample by detecting interaction of the antigen with a specific binding agent, such as an antibody.
- a sample is contacted with an antibody under conditions permitting antibody-antigen binding.
- Antibody-antigen binding can be detected by means of a detectable label conjugated to the antibody (direct detection) or by means of a detectable label conjugated to a secondary antibody, which binds specifically to the primary antibody (indirect detection).
- a “marker” or “biomarker” is a measurable indicator of some biological state or condition.
- a biomarker may be a protein or peptide, e.g. a surface protein, that can be specifically stained and which is indicative of a biological feature of the cell, e.g. the cell type or the physiological state of the cell.
- An immune cell marker is a biomarker that is selectively indicative of a feature that relates to an immune response of a mammal.
- a “mask” as used herein is a derivative of a digital image wherein each pixel in the mask is represented as a binary value, e.g. "1" or "0" (or “true” or “false”).
- a mask can be generated from an original digital image by assigning all pixels of the original image with an intensity value above a threshold to true and otherwise false, thereby creating a mask that will filter out all pixels overlaid by a "false” masked pixel.
- nucleus blob or “nuclear blob” is a group of connected pixels around an identified nucleus center/seed, which represents the nucleus.
- tissue sample refers to any biological sample that is obtained from a human or animal body for anatomic pathology.
- a tissue sample may be derived from breast tissue, lung tissue, prostate tissue, etc. and may comprise samples derived from tumors, suspected tumors, or from healthy tissue.
- Other examples of tissue samples and specimens are their preparation are disclosed herein.
- the tissue sample may be treated in an assay with one or more stains to assist in the identification of structures (e.g. vessels, cells, etc.) within the sample.
- At least some embodiments of the present disclosure relate to computer systems and methods for analyzing digital images captured from biological samples, including tissue samples, stained with one or more primary stains (e.g. hematoxylin and eosin) and one or more detection probes (e.g. probes containing a specific binding entity which facilitates the labeling of targets within the sample).
- primary stains e.g. hematoxylin and eosin
- detection probes e.g. probes containing a specific binding entity which facilitates the labeling of targets within the sample.
- biomarker images selected regions in an IHC or ISH slide image (hereinafter "biomarker images") of a tissue sample and “mapping back" those selected regions to corresponding regions in an H&E image of the tissue sample, where the results from the H&E image analysis are used to aid in the automated analysis of the IHC image.
- the computer-based specimen analyzer 10 may comprise an imaging apparatus 12 and a computer 14, whereby the imaging apparatus 12 and computer may be communicatively coupled together (e.g. directly, or indirectly over a network 20).
- the skilled artisan will appreciate that other computer devices or systems may be utilized and that the computer systems described herein may be communicatively coupled to additional components, e.g. specimen analyzers, scanners or imaging systems, automated slide preparation equipment, etc. Some of these additional components and the various computers that may be utilized are described further herein.
- the imaging apparatus 12 can include, without limitation, one or more image capture devices.
- Image capture devices can include, without limitation, a camera (e.g., an analog camera, a digital camera, etc.), optics (e.g., one or more lenses, sensor focus lens groups, microscope objectives, etc.), imaging sensors (e.g., a charge-coupled device (CCD), a complimentary metal-oxide semiconductor (CMOS) image sensor, or the like), photographic film, or the like.
- the image capture device can include a plurality of lenses that cooperate to prove on-the-fly focusing.
- An image sensor for example, a CCD sensor can capture a digital image of the specimen.
- the imaging apparatus 12 is a brightfield imaging system, a multispectral imaging (MSI) system or a fluorescent microscopy system.
- the digitized tissue data may be generated, for example, by an iScan HT scanner or a DP 200 scanner by VENTANA MEDICAL SYSTEMS of Arlington, Ariz. or other suitable imaging equipment. Additional imaging devices and systems are described further herein.
- the computer system 14 can include a desktop computer, a laptop computer, a tablet, or the like, digital electronic circuitry, firmware, hardware, memory 210, a computer storage medium 210, a computer program (e.g. where the program is stored within the memory or storage medium), a processor 220 (including a programmed processor), and/or the like.
- the computing system 14 illustrated in FIG. 1 may a computer with a display device 16 and an enclosure 18.
- the computer system can store digital images in binary form (locally, on a server, or another network connected device).
- the digital images can also be divided into a matrix of pixels.
- the pixels can include a digital value of one or more bits, defined by the bit depth.
- the network 20 in some embodiments, interconnects the imaging apparatus 12 and the computer system 14.
- the network 20 may include, without limitation, one or more gateways, routers, bridges, combinations thereof, or the like.
- the network 20 may include one or more servers and one or more websites that are accessible to users and can be used to send and receive information that the computer system 14 can utilize.
- a server may include, without limitation, one or more associated databases for storing information (e.g., digital images, algorithms, staining protocols, cutoff values for comparative evaluations, or the like).
- the network 20 may include, but is not limited to, data networks using the Transmission Control Protocol (TCP), User Datagram Protocol (UDP), Internet Protocol (IP) and other data protocols.
- TCP Transmission Control Protocol
- UDP User Datagram Protocol
- IP Internet Protocol
- the computer device or system further comprises a display output or other means of providing data/output to a user, operator, or downstream instrument or process.
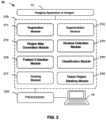
- FIG. 2 provides an overview of the various modules utilized within the presently disclosed workflows.
- the computer device 14 or computer-implemented method comprises one or more processors 220 and at least one memory 210, the at least one memory 210 storing non-transitory computer-readable instructions for execution by the one or more processors to cause the one or more processors to execute instructions in one or more modules (e.g. modules 211 through 218).
- the instructions may be stored in a non-transitory computer-readable medium (210) or computer-usable medium.
- a non-transitory computer-readable media may comprise all computer-readable media except for a transitory, propagating signal.
- the present disclosure provides a computer-implemented comprising the steps of: (a) running an imaging module (12) to provide first and second images; (b) running an image registration module (211) to register at least a portion of the first image to the second image to form a registered image; (c) running a nucleus detection module (214) and/or a feature extraction module (215) to derive features from the first image; (d) running the nucleus detection module (214) and/or the feature extraction module (215) to derive features from the registered image; (e) running a segmentation module (212) to identify tissues types and/or cell types from one of the first image or the registered image; (f) running a region map generation module (213) on the identified tissue types and/or cell types such that a probability features map be generated; (g) running a feature extraction module (215) to derive probability features from the probability features map; (h) running a classification module (216) to classify nuclei in one of the first image or the registered image based on
- the method further comprises (i) running a scoring module (217) to score the classified nuclei. In some embodiments, the method further comprises running a tissue region masking module (218).
- a scoring module (217) to score the classified nuclei.
- the method further comprises running a tissue region masking module (218).
- steps of the workflows illustrated in FIGs. 3B and 3C may utilize multiple modules at any particular step of the workflow (e.g. the step of H&E image analysis at step 322 of the workflow depicted in FIG. 3B may utilize the segmentation module 212, the nucleus detection module 214, and the feature extraction module 215).
- the workflows illustrated in FIGs. 3B and 3C may utilize certain modules at more than one step of the workflow (e.g. the steps of H&E image analysis (step 316) and IHC image analysis (step 312) of the workflow depicted in FIG. 3C both utilize at least the nucleus detection module 214 and the feature extraction module 215).
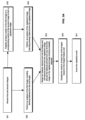
- FIG 3A sets forth a flowchart which provides a general overview of the methods of the presently disclosed workflow.
- the method includes receiving at least first and second images as input (step 301); registering at least a portion of the first image to the second image to form a registered image (step 303); independently performing an analysis of the first image (step 302) and the registered image (step 304), wherein the analysis of the first image and registered image includes deriving features from both the first image and the registered image, and wherein at least some of the derived features include probability features; merging the features derived from the first image, the registered image, including the probability features derived from one of the first image or the registered image (step 305); classifying the nuclei within at least one of the first or second images based on the merged feature set (step 306); and scoring the classified nuclei (step 307).
- the at least one of the first or second images in which the nuclei are classified at step 306 is the image corresponding to the biomarker image.
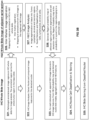
- FIGs. 3B and 3C further illustrate the workflows of the present disclosure.
- FIG. 3B illustrates the embodiment where the first image is a biomarker image (e.g. an IHC image), and where the second image is an H&E image.
- FIG. 3B further illustrates the steps of generating a probability map from the registered H&E image following analysis of the registered H&E image, such that probability features may ultimately be computed from the registered H&E image.
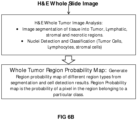
- FIG. 3C illustrates the embodiment where the first image is an H&E image and where the second image is a biomarker image.
- FIG. 3C further illustrates the steps of generating a probability map from the H&E image (first image) following analysis of the H&E image, such that probability features may be computed from the H&E image.
- the computer system receives at least two images as input (step 301).
- the images received as input are derived from serial tissue sections, i.e. serial sections derived from the same xenograft tissue block.
- the input images are optionally masked with a tissue masking module 218 as described herein.
- the at least two images received as input each comprise signals corresponding to a stain (including chromogens, fluorophores, quantum dots, etc.).
- a stain including chromogens, fluorophores, quantum dots, etc.
- one of the images has been stained with at least one primary stain (hematoxylin or eosin), while another one of the images has been stained in at least one of an IHC assay or ISH assay for the identification of a specific biomarker (referred to herein as a "biomarker" image).
- one of the images has been stained with both hematoxylin and eosin (referred to herein as an "H&E image"), while another one of the images has been stained in at least one of an IHC assay or ISH assay for the identification of a specific biomarker.
- the input images may be multiplex images, i.e. stained for multiple, different markers in a multiplex assay according to methods known to those of ordinary skill in the art.
- tissue sample may be stained for different types of nuclei and/or cell membrane biomarkers.
- Methods for staining tissue structures and guidance in the choice of stains appropriate for various purposes are discussed, for example, in “ Sambrook et al., Molecular Cloning: A Laboratory Manual, Cold Spring Harbor Laboratory Press (1989 )” and “ Ausubel et al., Current Protocols in Molecular Biology, Greene Publishing Associates and Wiley-Intersciences (1987 ),”.
- the tissue sample is stained in an IHC assay for the presence of one or biomarkers including an estrogen receptor marker, a progesterone receptor marker, a Ki-67 marker, or a HER2 marker.
- the biomarker image used as an input is an IHC image which comprises signals corresponding to a presence of at least one of an estrogen receptor (ER) marker, a progesterone receptor (PR) marker, a Ki-67 marker, or a HER2 marker.
- the tissue sample is stained in an IHC assay for the presence of one or biomarkers including a PD-L1 biomarker.
- the biomarker image used as an input is an IHC image which comprises signals corresponding to a presence of a PD-L1 marker, CD3 marker and CD8 marker.
- the computer-implemented method further comprises the step of scoring the classified nuclei.
- the input images are masked such that only tissue regions are present in the images.
- the input images are provided to a tissue region masking module 218.
- a tissue region mask is generated to mask non-tissue regions from tissue regions.
- the tissue masking module may also mask other areas of interest as needed, such as a portion of a tissue identified as belonging to a certain tissue type or belonging to a suspected tumor region.
- a segmentation technique is used to generate the tissue region masked images by masking tissue regions from non-tissue regions in the input images.
- Suitable segmentation techniques are as such known from the prior art, (cf. Digital Image Processing, Third Edition, Rafael C. Gonzalez, Richard E. Woods, chapter 10, page 689 and Handbook of Medical Imaging, Processing and Analysis, Isaac N. Bankman Academic Press, 2000, chapter 2 ).
- an image segmentation technique is utilized to distinguish between the digitized tissue data and the slide in the image, the tissue corresponding to the foreground and the slide corresponding to the background.
- the component computes the Area of Interest (AoI) in a whole slide image in order to detect all tissue regions in the AoI while limiting the amount of background non-tissue area that is analyzed.
- a wide range of image segmentation techniques e.g., HSV color-based image segmentation, Lab image segmentation, mean-shift color image segmentation, region growing, level set methods, fast marching methods, etc.
- image segmentation techniques can be used to determine, for example, boundaries of the tissue data and non-tissue or background data.
- the component can also generate a tissue foreground mask that can be used to identify those portions of the digitized slide data that correspond to the tissue data.
- the component can generate a background mask used to identify those portions of the digitized slide date that do not correspond to the tissue data.
- the generation of the tissue region masked image comprises one or more of the following non-limiting operations: computing the luminance (337) of a low resolution input single marker channel image (336), producing a luminance image (338) from the single marker channel image, applying a standard deviation filter to the produced luminance image (339), computing a filtered luminance image (340) from the produced luminance image, and applying a threshold to filtered luminance image (341), such that pixels with a luminance above a given threshold are set to one, and pixels below the threshold are set to zero, producing the tissue region mask (342).
- input images are annotated by a user, a medical professional, or a pathologist to facilitate intermarker registration and image analysis (see, steps 321 and 310 of FIGs. 3B and 3C , respectively).
- a user, medical professional, or pathologist identifies portions (e.g. sub-regions) of a biomarker image (e.g. an IHC whole image) suitable for further analysis (step 321), and those identified portions are subsequently transferred from the biomarker image to corresponding portions in an H&E image (step 326) as set forth herein.
- the identified portions are representative of over-expressive tumorous regions of a specific biomarker, e.g. a specific IHC marker.
- a user, medical professional, or pathologist annotates a whole tumor region on an H&E image (step 310), and those identified portions are subsequently transferred from the H&E image to corresponding portions in the biomarker image (step 311) as set forth herein.
- annotated representative fields may be selected by a pathologist to reflect the biomarker expression that the pathologist would use for overall slide interpretation.
- Annotations may be drawn using an annotation tool provided in a viewer application (e.g. VIRTUOSO/VERSO (TM) or like software) and the annotations may be drawn at any magnification or resolution.
- image analysis operations may be used to automatically detect tumor regions or other regions using automated image-analysis operations such as segmenting, thresholding, edge detection, etc., and FOVs automatically generated based on the detected regions.
- an intermarker registration module 211 is used to map at least one portion of a first image (e.g. a biomarker image) to a corresponding portion of a second image (e.g. an H&E image). In doing so, the first and second images become mapped to a common coordinate system.
- the portions of the first image are those identified in an upstream process as comprising features suitable for further analysis (e.g. annotated by a pathologist or via an automated FOV selection process, as noted above).
- intermarker registration is accomplished using the registration module 211.
- intermarker registration comprises selecting one input image, or a portion thereof, to serve as a reference image, and computing a transformation of each other input image to the coordinate frame of the reference image. Accordingly, all the input images may be aligned to the same coordinate system (e.g. the reference coordinate can be the slide section in the middle of the tissue block in the case of serial tissue sections or the slide with a specific marker) using image registration. Each image may therefore be aligned from its old coordinate system to the new reference coordinate system.
- Intermarker registration is the process of transforming different sets of data, here images, or markers within images, into one coordinate system. More specifically, intermarker registration is the process of aligning two or more images and, in general, involves designating one image as the reference (also called the reference image or the fixed image), and applying geometric transformations to the other images so that they align with the reference. A geometric transformation maps locations in one image to new locations in another image. The step of determining the correct geometric transformation parameters is key to the image registration process.
- the methods for computing a transformation of each image to a reference image are well known to those skilled in the art. For example, an image registration algorithm is described, for example, in " 11th International Symposium on Biomedical Imaging (ISBI), 2014 IEEE, April 29 2014- May 2 2014 ). A detailed method of image registration is outlined below.
- Intermarker registration processes are well known in the art and any of the known methods may be applied to the present disclosure.
- the intermarker or image registration is performed using the methods described in WO/2015/049233, entitled “Line-Based Image Registration and Cross-Image Annotation Devices, Systems and Methods," filed on September 30, 2014 , WO/2015/049233 describes a registration process comprising a coarse registration process used alone or in combination with a fine registration process.
- the coarse registration process may involve selecting digital images for alignment, generating a foreground image mask from each of the selected digital images, and matching tissue structure between the resultant foreground images.
- generating a foreground image mask involves generating a soft-weighted foreground image from the whole slide image of a stained tissue section and applying OTSU thresholding to the soft-weighted foreground image to produce a binary soft-weighted image mask.
- generating a foreground image mask involves generating a binary soft-weighted image mask from a whole slide image of a stained tissue section, separately generating a gradient magnitude image mask from the same whole slide image, applying OTSU thresholding to the gradient image mask to produce a binary gradient magnitude image mask, and combining the binary soft-weighted image and the binary gradient magnitude image mask using a binary OR operation to generate the foreground image mask.
- a “gradient” as used herein is, for example, the intensity gradient of pixels calculated for a particular pixel by taking into consideration an intensity value gradient of a set of pixels surrounding said particular pixel.
- Each gradient may have a particular "orientation” relative to a coordinate system whose x- and y- axis are defined by two orthogonal edges of the digital image.
- a “gradient orientation feature” may be a data value that indicates the orientation of the gradient within said coordinate system.
- matching tissue structure involves computing line-based features from the boundary of each of the resultant foreground image masks, computing global transformation parameters between a first set of line-features on a first foreground image mask and a second set of line-features on a second foreground image mask, and globally aligning the first and second image based on the transformation parameters.
- the coarse registration process includes mapping the selected digital images based on the global transformation parameters to a common grid, which grid may encompass the selected digital images.
- the fine registration process may involve identifying a first sub-region of a first digital image in the set of aligned digital images; identifying a second sub-region on a second digital image in the set of aligned digital images, wherein the second sub-region is larger than the first sub-region and the first sub-region is located substantially within the second sub-region on common grid; and, computing an optimized location for the first sub-region in the second sub-region.
- a set of image data or digital images is acquired (e.g. scanned or selected from the database) for manipulation.
- Each set of image data includes image data corresponding to, for example, a tissue section from a set of adjacent tissue sections of a single patient.
- the process proceeds directly to block 610. If more than a single pair of images is selected, then the set of selected images is grouped into pairs at block 608 prior to proceeding to block 610. In some embodiments, image pairs are selected as adjacent pairs.
- the set of selected images includes 10 parallel, adjacent slices (LI ....LI 0), then LI and L2 are grouped as a pair, L3 and L4 are grouped as a pair, etc.
- images are grouped according to their distance apart, (e.g., inter-edge or inter-image distance corresponding to the chamfer distance between the edge-maps of the various images), pairing together images which are closest to one another.
- an inter-edge/inter-image distance is utilized to pair of images.
- edge-based Chamfer distance may be used to compute the inter-image/inter-edge distance.
- the process advances to block 614. Otherwise, at block 612 a coarse registration process is performed on the selected image pairs. The coarse registration process is described in further detail below.
- the selected, and now registered (aligned), images are displayed on a common grid, with the images overlaid in a single image, displayed as separate images, or both, on a single monitor or spread across several monitors.
- the client user may select one of the images from a pair of images as the source image. If the source image has already been annotated as desired, the process proceeds to block 622. Otherwise, the client user annotates the source image as desired at block 620.
- the annotation is mapped to the other image in the pair (the target image) and graphically reproduced on the target image.
- the annotation may be mapped from the source image to the target image at substantially the same time as the pair of images is registered (aligned).
- the user may choose to whether or not to engage in a fine registration process. If the user chooses to directly display the results without performing fine registration, the process proceeds to block 626.
- a fine registration process is performed on the selected image pairs, for example to optimize the location of the mapped annotations and/or alignment of the images.
- the fine registration process is discussed in further detail below.
- the annotated image pair is displayed with the results of the fine registration process (or the annotated image pair may be displayed only with the results of the coarse registration process if fine registration is not used). The method then ends at the final block 628.
- the first image and the registered images are both analyzed (steps 302 and 304), such that features or metrics are derived from each image.
- the features that are derived include (i) H&E image features, (ii) biomarker image features, and (iii) probability features derived from a probability map images computed from identified tissues and/or cells within the H&E image.
- the H&E image features, the biomarker image features, and the probability features are merged together (step 305) such that cell nuclei present in at least one of the input images may be classified (step 306) and/or scored (step 307).
- the steps necessary for carrying out image analysis are described herein.
- the biomarker image features and H&E image features include nuclear features which are derived from the biomarker image.
- the derivation of features from the biomarker image and/or H&E image include detecting nuclei within the image and then extracting features from the detected nuclei or from image patches surrounding the detected nuclei (see, for example, step 312 of FIG, 3C ). These methods are described herein.
- the probability features while ultimately derived from an H&E image, first requires identifying either different tissues and/ or cell types within the H&E image (i.e. segmenting tissues and/or detecting and classifying cell types); followed by generating a probability map based on either the differently identified tissues and/ or cell types; and then deriving probability features from the probability map.
- the derivation of features from the biomarker image and/or H&E image includes detecting nuclei within the image and then extracting features from the detected nuclei or from image patches surrounding the detected nuclei.
- nuclei are detected in each of the input IHC images, such as with a nuclear detection module 214. Once the nuclei are detected, features may be derived from the identified nuclei or from image patches surrounding the nuclei, such as with a feature extraction module 215.
- the images received as input are processed such as to detect nucleus centers (seeds) and/or to segment the nuclei.
- instructions may be provided to detect nucleus centers based on radial-symmetry voting using techniques commonly known to those of ordinary skill in the art (see Parvin, Bahram, et al. "Iterative voting for inference of structural saliency and characterization of subcellular events.” Image Processing, IEEE Transactions on 16.3 (2007): 615-623 ,).
- a nucleus detection module 214 identifies nuclei using radial symmetry to detect centers of nuclei and then classifies the nuclei based on the intensity of stains around the cell centers.
- an image magnitude is computed from the channel, and one or more votes at each pixel are accumulated by adding the summation of the magnitude within a selected region.
- Mean shift clustering may be used to find the local centers in the region, with the local centers representing actual nuclear locations.
- Nuclei detection based on radial symmetry voting is executed on color image intensity data and makes explicit use of the a priori domain knowledge that the nuclei are elliptical shaped blobs with varying sizes and eccentricities.
- image gradient information is also used in radial symmetry voting and combined with an adaptive segmentation process to precisely detect and localize the cell nuclei.
- a "gradient" as used herein is, for example, the intensity gradient of pixels calculated for a particular pixel by taking into consideration an intensity value gradient of a set of pixels surrounding said particular pixel. Each gradient may have a particular "orientation" relative to a coordinate system whose x- and y- axis are defined by two orthogonal edges of the digital image.
- nuclei seed detection involves defining a seed as a point which is assumed to lie inside a cell nucleus and serve as the starting point for localizing the cell nuclei.
- the first step is to detect seed points associated with each cell nuclei using a highly robust approach based on the radial symmetry to detect elliptical-shaped blobs, structures resembling cell nuclei.
- the radial symmetry approach operates on the gradient image using a kernel based voting procedure.
- a voting response matrix is created by processing each pixel that accumulates a vote through a voting kernel.
- the kernel is based on the gradient direction computed at that particular pixel and an expected range of minimum and maximum nucleus size and a voting kernel angle (typically in the range [ ⁇ /4, ⁇ /8]).
- a voting kernel angle typically in the range [ ⁇ /4, ⁇ /8].
- Nuclei may be identified using other techniques known to those of ordinary skill in the art. For example, an image magnitude may be computed from a particular image channel of one of the H&E or IHC images, and each pixel around a specified magnitude may be assigned a number of votes that is based on a summation of the magnitude within a region around the pixel. Alternatively, a mean shift clustering operation may be performed to find the local centers within a voting image, which represents the actual location of the nucleus. In other embodiments, nuclear segmentation may be used to segment the entire nucleus based on the now-known centers of the nuclei via morphological operations and local thresholding. In yet other embodiments, model based segmentation may be utilized to detect nuclei (i.e. learning the shape model of the nuclei from a training data set and using that as the prior knowledge to segment the nuclei in the testing image).
- the nuclei are then subsequently segmented using thresholds individually computed for each nucleus.
- Otsu's method may be used for segmentation in a region around an identified nucleus since it is believed that the pixel intensity in the nuclear regions varies.
- Otsu's method is used to determine an optimal threshold by minimizing the intra-class variance and is known to those of skill in the art. More specifically, Otsu's method is used to automatically perform clustering-based image thresholding or, the reduction of a gray level image to a binary image. The algorithm assumes that the image contains two classes of pixels following a bi-modal histogram (foreground pixels and background pixels). It then calculates the optimum threshold separating the two classes such that their combined spread (intra-class variance) is minimal, or equivalent (because the sum of pairwise squared distances is constant), so that their inter-class variance is maximal.
- a locally adaptive thresholding method may be used, and blobs around the detected centers are created.
- other methods may also be incorporated, such as marker based watershed algorithms can also be used to identify the nuclei blobs around the detected nuclei centers.
- features are derived, such as with a feature extraction module 215.
- the feature extraction module 215 receives image data, derives certain metrics based on the received image data, and outputs those derived metrics for combination with the separately computed probability features (step 305).
- separate metrics are computed from the biomarker image and from the H&E image.
- metrics may be derived from features of the identified nuclei or from within a patch surrounding an identified nucleus in both the H&E and biomarker images.
- a feature metric can be a numerical data value being indicative of quantitative properties of a particular feature, a histogram, a distribution, or the like.
- feature metrics are computed for each nucleus based on their visual properties and descriptors, e.g. morphology features, appearance features, background features, etc.
- features are computed from within an image patch surrounding an identified nucleus.
- the various feature metrics derived from the detected nuclei of the H&E and biomarker images are supplied as vectors of metrics and, together with metrics derived from the generated probability map (step 304 or 317), are supplied to the classification module 216 for classification (step 307 or 314).
- tissue samples may reveal different biological features (e.g. Ki67 stains for a nuclear marker; immune cells expressing different cluster of differential markers, etc.).
- different metrics may be derived based on the different morphologic features to assist in overall analysis, classification, and scoring.
- lymphocytes can be identified based on their typical morphology, i.e. small, round and homogeneously basophilic nuclei which differentiates them from other leukocytes, such as neutrophils with more elongated and segmented nuclei.
- lymphocytes can be differentiated in general from cancer cells, which have larger and more pleomorphic nuclei.
- metrics e.g. area, compactness, etc.
- a "morphology feature” as used herein is, for example, a feature being indicative of the shape or dimensions of a nucleus. Without wishing to be bound by any particular theory, it is believed that morphological features provide some vital information about the size and shape of a cell or its nucleus. For example, a morphology feature may be computed by applying various image analysis algorithms on pixels contained in or surrounding a nuclear blob or seed. In some embodiments, the morphology features include area, minor, and major axis lengths, perimeter, radius, solidity, etc.
- the size of the nuclear blob in terms of the number of pixels, may be used as a feature.
- Area total number of pixels in the nucleus region;
- Scalar specifying the length (in pixels) of the minor/major axis of the ellipse that has the same normalized second central moments as the region.
- a blob shape may be approximated by an ellipse.
- the minor axis of the ellipse is used as a feature along with the eccentricity parameter (computed as the ratio of minor axis to major axis);
- Scalar specifying the proportion of the pixels in the convex hull that are also in the region (Computed as Area/ConvexArea)].
- a "blob density” feature is expected to be highly discriminatory for lymphocytes versus stromal.
- the cells are more closely packed than for stromal cells.
- an average blob size may lower than for certain nuclei that stain negative for certain biomarkers.
- a density based feature is used which accounts for both the packing density of the nearby seeds and the distribution of the neighborhood blob sizes.
- the features are computed using a window of size (2*radius + 1 ) x (2*radius + 1 ) around a given seed for multiple values of radii, e.g. ranging from 5 urn to 25 urn. For each radius value, the following features are computed: Blob Pixel density, Blob Seed Density, Normalized pixel density (normalized with average size of the nucleus blob), Normalized Seed density feature.
- an "appearance feature” as used herein is, for example, a feature having been computed for a particular nucleus by comparing pixel intensity values of pixels contained in or surrounding a nuclear blob or seed used for identifying the nucleus, whereby the compared pixel intensities are derived from different image channels (e.g. a background channel, a channel for the staining of a biomarker, etc.).
- the metrics derived from appearance features are computed from percentile values (e.g. the 10th, 50th, and 95th percentile values) of pixel intensities and of gradient magnitudes computed from different image channels.
- Computing appearance feature metrics may be advantageous since the derived metrics may describe the properties of the nuclear regions (e.g., and in the context of staining for the PDL1 biomarker dark brown nuclei, dark blue nuclei, light blue nuclei, etc.) as well as describe the membrane region (again, in the context of staining for the PDL1 biomarker) (the ribbon region) around the nuclei, e.g., if the membrane stain are light brown, dark brown or no staining at all, etc.
- a "background feature” is, for example, a feature being indicative of the appearance and/or stain presence in cytoplasm and cell membrane features of the cell comprising the nucleus for which the background feature was extracted from the image.
- a background feature and a corresponding metrics can be computed for a nucleus and a corresponding cell depicted in a digital image e.g. by identifying a nuclear blob or seed representing the nucleus; analyzing a pixel area (e.g. a ribbon of 20 pixels - about 9 microns - thickness around the nuclear blob boundary) directly adjacent to the identified set of cells are computed in, therefore capturing appearance and stain presence in cytoplasm and membrane of the cell with this nucleus together with areas directly adjacent to the cell.
- a pixel area e.g. a ribbon of 20 pixels - about 9 microns - thickness around the nuclear blob boundary
- the nuclear appearance features are similar to the nuclear appearance features, but are computed in a ribbon of about 20 pixels (about 9 microns) thickness around each nucleus boundary, therefore capturing the appearance and stain presence in the cytoplasm and membrane of the cell having the identified nucleus together with areas directly adjacent to the cell.
- the ribbon size is selected because it is believed that it captures a sufficient amount of background tissue area around the nuclei that can be used to provide useful information for nuclei discrimination.
- these features may be used to determine whether the surrounding tissue is stroma or epithelium (such as in H&E stained tissue samples). Without wishing to be bound by any particular theory, it is believed that these background features also capture membrane staining patterns, which are useful when the tissue samples are stained with appropriate membrane staining agents (e.g. PDL1). Again, in the context of PDL1, since the PD-L1 biomarker mostly stains the cell membrane the staining creates a brown ribbon, brown spots, or both along the outside of the nucleus boundaries.
- membrane staining agents e.g. PDL1
- metrics derived from color include color ratios, R/(R+G+B). or color principal components. In other embodiments, metrics derived from color include local statistics of each of the colors (mean/median/variance/std dev) and/or color intensity correlations in a local image window.
- the group of adjacent cells with certain specific property values is set up between the dark and the white shades of grey colored cells represented in a histopathological slide image.
- the correlation of the color feature defines an instance of the size class, thus this way the intensity of these colored cells determines the affected cell from its surrounding cluster of dark cells.
- a context-texture method is used to compute a set of textural features from an image patch centered at a nucleus of interest (NoI). More specifically, the context-texture method allows the textual pattern in a region around each NoI to be captured and this information is used to assist in the identification of the local type of tissue in which the NoI may be lying (e.g. regions around any NoI may include solid tumor, aggregates of lymphocytes (immune cells), stroma, and/or overall staining responses). For example, stroma is characterized by a fiber-like texture, while the presence of multiple "blobs" of varying size is characteristic of a tumor region.
- the information could assist in classifying any cell or cell nucleus in the region as belonging to stroma, as opposed to tumor tissue, or vice-versa.
- Procedures for deriving context-texture features and image patches images surrounding a NoI are described in a co-pending application published as WO/2017/075096 , entitled Classifying Nuclei in Histology Images.
- the context-texture method is performed by capturing images patches centered at each NoI.
- a patch size having a size S x S is selected which captures a reasonably large tissue area that provides rich contextual information about the nucleus.
- the patch size ranges from between about 50 pixels to about 200 pixels in any S x S dimension.
- a patch size of about 150 pixels (about 70 microns) is used.
- patches are created only for a specific tissue type. For example, patches may be created only for regions positive for a particular biomarker.
- textural features are computed within each patch.
- the textural features computed include features such as histogram of intensities, histogram of gradient magnitude and gradient orientation, Gabor features, and Haralick features.
- “Gabor feature” is, for example, a feature of a digital image having been extracted from the digital image by applying one or more Gabor filters on the digital image.
- the one or more Gabor filters may have different frequencies and/or orientations.
- a Gabor filter is, for example, a linear filter that can be used for detecting patterns in images, e.g. for detecting edges.
- Frequency and orientation representations of Gabor filters are similar to those of the human visual system, and they have been found to be particularly appropriate for texture representation and discrimination.
- Gabor filters are linear filters often used in image analysis, e.g. for edge detection.
- a Gabor filter can be a Gaussian kernel function modulated by a sinusoidal plane wave.
- Gabor filters have the ability to model the frequency and orientation sensitivity characteristic of the human visual system.
- the Gabor filter convolves the image with log-Gabor filters in a plurality of different orientations and at different scales and then averages the responses of the different orientations at the same scale to obtain rotation-invariant features.
- a response of a Gabor filter is the result of applying a Gabor filter on intensity values of a set of image pixels.
- a response calculated for pixels of an image patch comprising a NoI may be used as contextual information metrics of the NoI.
- the Gabor filter is used to calculate the average, standard deviation, minimum-to-maximum ratio on the average responses, which may be used as contextual information metrics.
- Haralick features are believed to capture information about the patterns that emerge in patterns of texture.
- the Haralick texture values are computed with a co-occurrence matrix. This matrix is a function of both the angular relationship and distance between two pixels (that may be separated from each other by some distance) and shows the number of occurrences of the relationship between two specified pixels.
- a "Haralick texture feature” or “Haralick feature” is, for example, a feature of a digital image having been extracted from a co-occurrence matrix, which contains information about how image intensities in pixels of the digital image with a certain position in relation to each other occur together.
- the co-occurrence matrix can, for example, be normalized by basing the intensity levels of the matrix on the maximum and minimum intensity observed within each object identified in the digital image.
- Haralick, Shanmugan, and Dinstein (1973) refer to this as a "gray-tone spatial-dependence matrix.”
- Their implementation that is used in embodiments of the disclosure considers four directions (0°, 45°, 90°, and 135°) between pixels that are separated by some distance, d. (See Haralick, R., Shanmugan, K., and Dinstein, I. "Textural Features for Image Classification.” IEEE Transactions on Systems, Man, and Cybernetics 3, no. 6 (1973): 610-621 ).
- a co-occurrence matrix (i.e., a spatial dependency co-occurrence matrix) is computed for pixels in the patch centered at the NoI.
- a co-occurrence matrix is computed for each of a plurality of predefined directions (or "angles"), e.g. for the four directions 0°, 45°, 90°, and 135°.
- a plurality of features may be calculated including autocorrelation, contrast, correlation, dissimilarity, energy, entropy, homogeneity, maximum probability, variance, sum average, sum variance, Sum entropy, difference variance, difference entropy, two information measures of correlation, inverse difference, normalized inverse difference, and inverse moment.
- Each of the parameters may represent a relation between different data entries in the co-occurrence matrix, e.g. the correlation of the feature "high intensity value in the brown color channel” and a particular bin value for grey value gradient size. Extracting these values from each channel under consideration and taking the mean, standard deviation, and mode of each feature image yields a significant number of co-occurrence features. Any of these features may be used as contextual information metrics.
- the co-occurrence matrix may indicate biological information that may be an indicator of a particular cell type or tissue type.
- the co-occurring matrix and contextual information metrics derived therefrom may describe how often a blue pixel (pixels within the nuclei) is close to (within a distance d) a brown pixel (pixel of the membrane staining).
- the gray-level co-occurrence matrix (“GLCM”) is computed for each image channel individually and the respective Haralick texture values are derived from each image channel separately.
- the inter-channel or color co-occurrence matrix (“CCM”) may be used.
- the co-occurrence is computed of the pixel intensity at location (x;y) in Ci and the pixel intensity at location (x+dx; y+dy) in Cj. It is believed that the CCM offers that advantage of capturing the spatial relationship between different tissue structures (highlighted in different channels), without the need of explicitly segmenting them.
- the intensity values of the signals in the two different channels will correlate (with a predefined offset), because inner-membrane proteins and outer-membrane proteins will always or predominantly generate signals in close spatial proximity to each other. Said spatial proximity may be captured in a CCM matrix in the form of pixel intensity correlations in different channels.
- Haralick features are computed from the GLCMs of all the channels under consideration. Again, any of the features computed from the CCM may be used as contextual information metrics.
- the inter-channel matrix is computed, according to embodiments, in the same or similar manner as the GLCM matrix. Multiple different angles and distances may be considered. The only difference is that the pair of pixels are picked from the two different channels, e.g., pixel p1 belong to image channel 1 and p2 belong to image channel 2, while these 2 pixels are considered to be in the same coordinate systems (so that the distance and angles between them can be computed). These features may likewise be supplied to the classification module.
- a “texton” is, for example, a set of one or more attributes of a pixel blob or a set of pixels lying less than a maximum distance apart from a reference pixel, whereby said attributes have been observed or are expected to be repetitive within an image.
- a texton can be a frequently co-occurring combination of oriented linear filter outputs.
- the pixel blob can be, for example, a nuclear blob or a pixel area identified as lying within a cell comprising a nucleus.
- the reference pixel can be, for example, a nuclear center or cell center or cell membrane.
- a "texton” may be considered as a "visual word", e.g. an ellipse of a particular size or dimension, a circle of a particular average intensity value, a pixel blob having a particular intensity distribution or pattern, or the like.
- the context-texton method computes a histogram of a texton map from an image patch centered at each NoI.
- Malik, Jitendra et al. "Textons, Contours and Regions: Cue Integration in Image Segmentation.” s.i.: IEEE Computer Society, 1999, Proceedings of the International Conference on Computer Vision, Corfu, Greece ).
- Procedures for deriving context-texton features are also described in a co-pending application published as WO/2017/075096 .
- the goal of this method is also to capture the textural pattern in a region around each NoI.
- a bank of maximum response filters is applied on the image of the tissue sample (or to a channel image thereof) to obtain a list of filter response images.
- Each filter response image is a digital image comprising one or more filter responses.
- a "filter response” may be a filter response as defined in [0018].
- the filter response images derived from the training images and the filter responses contained therein are collected and clustered into a plurality of K clusters that are referred to as "textons" (step 331).
- each of the filter responses obtained by applying a plurality of maximum response filters on the image of the tissue sample may be a vector having some property values like diameter, intensity or the like.
- the clustering of said filter responses may provide a set of K clusters, whereby a cluster center is iteratively computed for each cluster as a vector of mean values of all filter responses belonging to said cluster.
- Each cluster center may thus be a "mean" filter response vector (whose values are mean values of respective feature vectors of filter responses assigned to said cluster center) or other form of "prototype” filter response vector derived from the filter responses assigned to said cluster center.
- Said “derivative" filter response vector representing the cluster center of a cluster is used as a "texton.”
- each cluster center represents a set of projections of each filter onto a particular image patch.
- Said K “cluster center textons”, which may be iteratively refined, can be provided as output of the K-means clustering algorithm.
- the criterion for the clustering algorithm is to find K “centers” such that after assigning each filter response vector to the nearest center, the sum of the squared distance from the centers is minimized.
- a texton vocabulary of K textons is automatically extracted.
- a texton map may be computed from the textons constituting the cluster centers.
- each pixel of the image of the tissue sample is assigned into one of the K textons. For example, the assignment may be performed such that each pixel in the image (or at least each pixel in the image patch centered around the NoI), is assigned to the one of the textons which is characteristic for the filter output generated for a set of pixels comprising said pixel to be mapped. Since each pixel is mapped to exactly one of the textons, the image is partitioned into regions assigned to different textons. Said “partitioned image” may be referred to as the "texton map":
- a texton histogram is then computed from all the pixels in an image patch having a size S x S centered at the NoI (step 333).
- the patch size ranges from between about 50 pixels to about 200 pixels in any S x S dimension.
- a patch size of about 150 pixels (about 70 microns) is used. It has been observed that said patch size ranges are particularly suited for accurately identifying cell types for which texture related context information is a predictive parameter.
- a "texton histogram feature" is, for example, a distribution of occurrence frequencies of textons ("visual words") identified in the image or in a particular image channel.
- a texton histogram can be represented as a graph showing the number of textons of a particular type.
- the texton histogram feature may be a histogram being indicative that texton "ellypsoid1" was found 79 times, texton "ellipsoid2" was found 1.124 times in the image and that "circle1" was found 34 times in the image.
- the context-CRF method employs the conditional random field (CRF) model to enhance the homogeneity of a classification result, (see J. Lafferty et al., Conditional Random Fields: Probabilistic Models for Segmenting and Labeling Sequence Data. ICML, pp. 282-289, 2001 ).
- the CRF model like the BoW model herein, utilizes the pre-computed nuclear features/metrics and labels from the neighboring nuclei as contextual information, thereby allowing the incorporation of contextual information with no additional feature extraction (as compared with the context texture method and the context texton method). It is believed that the CRF model provides a natural way to incorporate pair-wise constraints, enforcing adjacent regions belonging to the same class.
- the context-CRF method is also described in a co-pending application published as WO/2017/075096 .
- Bag-of-words is a simple yet powerful representation technique based on frequency of basic blocks (words).
- Bag-of-words (BoW), a widely-used feature encoding method, assumes that the local features extracted from images are independent of each other, and only counts the frequency of each visual "word” appearing in each image.
- the "word” is a nuclear feature vector.
- the context-BoW method is also described in a co-pending application published as WO/2017/075096 .
- spatial features include a local density of cells; average distance between two adjacent detected cells; and/or distance from a cell to a segmented region
- a corresponding nucleus seed location is first identified in the corresponding H&E image and a larger H&E patch around the nucleus obtain.
- the stromal and tumor cell distributions with are then estimated in the patch.
- the distributions can be computed using a pyramid histogram (see, e.g. FIG. 7 ).
- Pyramid histogram features are further described by S. Lazebnik et al. "Beyond Bags of Features: Spatial Pyramid Matching for Recognizing Natural Scene Categories," VPR '06 Proceedings of the 2006 IEEE Computer Society Conference on Computer Vision and Pattern Recognition - Volume 2, Pages 2169-2178, June 17 - 22, 2006 .
- the H&E features can be computed from the mapped center and region in the H&E image and/or the H&E probability images.
- Some examples of the image features that can be used are:
- the derived metrics are provided to the classification module 216 as a vector of features or metrics.
- the derivation of probability features first requires identifying either different tissues and/ or cell types within the H&E image; followed by generating a probability map based on either the differently identified tissues and/ or cell types; and then deriving probability features from the probability map.
- tissue types and/or cell types may be identified in the H&E image (collectively referred to herein as “segmentation” or “H&E image segmentation”).
- the H&E image is segmented into different types of regions, including tumor regions, lymphatic regions, stromal regions, and necrotic regions.
- cells within the H&E image are detected and classified as being tumor, lymphocytes or stromal cells.
- a probability map is generated based on the identified tissue types and/or cell types.
- different image channels present in any of the input images must first be separated such as by color deconvolution (also referred to as "unmixing") to decompose the original RGB image into separate image channels.
- color deconvolution also referred to as "unmixing”
- an unmixing module is utilized to separate the individual color channels and is based on the method described in Ruifrok, A. and Johnston, D., "Quantification of histochemical staining by color deconvolution," Analyt. Quant. Cytol. Histol. 23, 291 -299 (2001 ).
- the multiplex images are unmixed using liner unmixing.
- cell detection and classification can be done directly on the input RGB image or some other derived images (like HSV, CIELab) from the RGB image.
- unmixing is accomplished using the methods described in WO2015/124772 , entitled “Group Sparsity Model for Image Unmixing,” filed on February 23, 215.
- unmixing is accomplished using the methods described in WO2014/195193, entitled “Image Adaptive Physiologically Plausible Color Separation,” filed on May 28, 2014 .
- WO2014/195193 describes a method of unmixing by separating component signals of the input image using iteratively optimized reference vectors.
- image data from an assay is correlated with expected or ideal results specific to the characteristics of the assay to determine a quality metric.
- the H&E image is unmixed into separate channels representing the local amounts of Hematoxylin, the local amount of Eosin.
- a luminance channel (the L component of the Lab color space) may be generated by the unmixing module for the H&E image.
- these channels highlight different tissue structures in the tissue image, thus, they may be referred to as structural image channels. More precisely, the Hematoxylin channel highlights nuclei regions, the eosin channel highlights eosinophilic structures, while the luminance channel highlights fatty structures, lumen and spaces. Therefore, features extracted from these channels are useful in describing the different biological structures present within any image of a tissue.
- structural image channels can include the counterstain channel, one or more immunohistochemistry-stained channels, hue, and luminance, where each channel facilitates identification of different tissues and/or structures within the IHC image.
- H&E image segmentation and tissue type identification is performed according to the methods described in PCT/EP2015/051302, filed January 23, 2015 and entitled “Adaptive Classification for Whole Slide Tissue Segmentation” (published as WO2015/113895 ).
- WO2015/113895 describes segmenting tumor regions from other regions in an image via operations related to classification of the regions that include identifying grid points in the tissue image, classifying the grid points as one of a plurality of tissue types, and generating classified grid points based on a database of known characteristics of tissue types, assigning the classified grid points at least one of a high confidence score and a low confidence score, modifying a database of known characteristics of tissue types based on the grid points that were assigned a high confidence score, and generating a modified database, and reclassifying the grid points that were assigned a low confidence score based on the modified database, to segment the tissue (e.g., identify tissue regions in an image).
- different types of cells are detected in the H&E images using a radial symmetry based cell detection method; followed by the computation of multiple image features (morphometric, intensity); and subsequent training a supervised classifier to categorize cells into different cell types.
- H&E image segmentation is performed according to the methods described by Veta et al. "Automatic Nuclei Segmentation in H&E Stained Breast Cancer Histopathology Images," PLoS One. 2013; 8(7): e70221 .
- image segmentation can be divided into four main steps: 1) pre-processing, 2) marker-controlled watershed segmentation, 3) post-processing, and 4) merging of the results from multiple scales.
- the aim of the pre-processing is to remove irrelevant content while preserving the boundaries of the nuclei.
- the pre-processing starts with color unmixing for separation of the hematoxylin stain from the RGB image.
- the grayscale version of the hematoxylin image is then processed with a series of morphological operations in order to remove irrelevant structures.
- the core part of the procedure is the marker-controlled watershed segmentation.
- Two types of nuclear markers are used: markers extracted using an image transform that highlights structures of high radial symmetry regional minima of the pre-processed image.
- regions unlikely to represent nuclei are removed and the contours of the remaining regions are parameterized as ellipses.
- the segmentation procedure can be tuned to look for nuclei at different scales, allowing multiscale analysis.
- the segmentation results from the multiple scales and two marker types are then merged by resolving concurrent regions to give the final segmentation.
- H&E segmentation is performed according to the methods described by Gurcan et al. "Histopathological Image Analysis: A Review,” IEEE Rev Biomed Eng. 2009; 2: 147-171 .
- H&E segmentation is performed according to the methods described by Bautista et al. "Improving the visualization and detection of tissue folds in whole slide images through color enhancement," J Pathol Inform 2010, 1:25 .
- segmentation may be accomplished using thresholding techniques known to those of ordinary skill in the art.
- Other methods of segmentation include a multi-scale approach, such as described in Kriete, A et al., Automated quantification of quantum-dot-labeled epidermal growth factor receptor internalization via multiscale image segmentation, Journal of Microscopy, v. 222(1) 22-27 (April 2006 ); an active contour (snake) approach, described in Kass, A. Witkin, and D. Terzopoulos. Snakes: Active contour models. International, Journal of Computer Vision, 1:321-332, 1988 ; a level set approach, described in J. A.
- a probability map is generated and may be based only on the identified tissue types, only on the identified cell types, or both the identified tissue types and identified cell types.
- the probability map is a vector of images, same-sized as the number of categorized classes. At each pixel location in the probability map a vector of class probabilities (vector size is equal to the number of regions) is generated.
- the class probability for a class gives the probability of a pixel belonging to that particular class.
- the classes can be (tumor, non-tumor, lymphatic, stromal, necrotic region).
- the classes can be background and different types of cellular structures (tumor, lymphocytes, stromal cells, connected tissue, background etc.).
- the probability map results can be generated in two different ways, as set forth in FIGs. 6A and 6B .
- a probability map will also be generated (see FIG. 6B ). Indeed, for each annotated and analyzed sub-image region, a probability map image vector is provided as output.
- a probability map image vector is computed from the image analysis result image.
- the image analysis result image is assumed to be an image where each pixel is assigned a classification label and from which multiple binary image masks, one for each region type, are generated.
- a smoothening filter (11 x11 Gaussian filter for example) is applied to the image to generate a smoothened version.
- a probability image vector is generated by normalizing at each pixel. (i.e. at any given pixel, pixel value in a specific probability image is given as the smoothened Gaussian value normalized by the sum of the smoothened values from all the region types).
- the features extracted from the H&E probability map images may be used as an additional image features to analyze the IHC image slide (e.g. an H&E image corresponds to a deformed version of the tissue section with respect to the adjacent serial tissue section of the IHC image, so a pixel-to-pixel or even cell-to-cell correspondence of the IHC and H&E image is not possible).
- the generated region map has a tensor representation, where each pixel in the region map corresponds to a k-dimensional vector indicating the probability that the pixel belongs to a particular region (e.g. a tissue region).
- H&E image features, biomarker image features, and probability image features are derived, they are merged together and used to classifying nuclei within at least one of the input images.
- the classifier is trained and then used to distinguish different cell nuclei or staining responses.
- example cells are presented together with a ground truth identification provided by an expert observer according to procedures known to those of ordinary skill in the art.
- the classification module is a Support Vector Machine ("SVM").
- SVM Support Vector Machine
- a SVM is a classification technique, which is based on statistical learning theory where a nonlinear input data set is converted into a high dimensional linear feature space via kernels for the non-linear case.
- support vector machines project a set of training data, E, that represents two different classes into a high-dimensional space by means of a kernel function, K.
- K In this transformed data space, nonlinear data are transformed so that a flat line can be generated (a discriminating hyperplane) to separate the classes so as to maximize the class separation.
- Testing data are then projected into the high-dimensional space via K, and the test data are classified on the basis of where they fall with respect to the hyperplane.
- the kernel function K defines the method in which data are projected into the high-dimensional space.
- classification is performed using an AdaBoost algorithm.
- the AdaBoost is an adaptive algorithm which combines a number of weak classifiers to generate a strong classifier.
- Image pixels identified by a pathologist during the training stage e.g. those having a particular stain or belonging to a particular tissue type
- classification is performed using a Bootstrap aggregating technique.
- Bootstrap aggregating (bagging) is a machine learning ensemble meta-algorithm, designed to improve the stability and accuracy of machine learning used in statistical classification and regression. It also reduces variance and helps to avoid overfitting.
- TC Tumor Cell Staining Assessment
- a computer based PD-L1 scoring algorithm that combines both H&E and IHC information is presented.
- Serial sectional H&E and IHC slides can be used as input.
- Image registration algorithm can be used to align the two images.
- Image segmentation can then be performed on both images to obtain different regions such as tumor, stromal, necrotic and vascular regions.
- segmentation results can be combined from both slides to generate a region map.
- the region map can be obtained by a plurality of methods such as morphological operations, or weighted average of the probabilities from the segmentation results.
- both H&E and IHC slides can be used to help each other in the segmentation.
- the nucleus detection method can be used to obtain seeds in both H&E and IHC slides.
- a plurality of features can be extracted around the seeds including but not limited to the following:
- classification algorithms such as Adaboost, SVM, Random Forest, KNN, Bagging, Boosting tree etc. can be used to classify the feature vectors.
- ensemble learning can be used at this step. Weak learners can be chosen from simple bootstrapping to complex classification algorithms such as listed above.
- the computer system of the present disclosure may be tied to a specimen processing apparatus that can perform one or more preparation processes on the tissue specimen.
- the preparation process can include, without limitation, deparaffinizing a specimen, conditioning a specimen (e.g., cell conditioning), staining a specimen, performing antigen retrieval, performing immunohistochemistry staining (including labeling) or other reactions, and/or performing in situ hybridization (e.g., SISH, FISH, etc.) staining (including labeling) or other reactions, as well as other processes for preparing specimens for microscopy, microanalyses, mass spectrometric methods, or other analytical methods.
- a specimen can include a tissue sample.
- the sample of tissue can be any liquid, semi-solid or solid substance (or material) in or on which a target can be present.
- a tissue sample can be a biological sample or a tissue sample obtained from a biological tissue.
- the tissue can be a collection of interconnected cells that perform a similar function within an organism.
- the biological sample is obtained from an animal subject, such as a human subject.
- a biological sample can be any solid or fluid sample obtained from, excreted by or secreted by any living organism, including without limitation, single celled organisms, such as bacteria, yeast, protozoans, and amoebas among others, multicellular organisms (such as plants or animals, including samples from a healthy or apparently healthy human subject or a human patient affected by a condition or disease to be diagnosed or investigated, such as cancer).
- single celled organisms such as bacteria, yeast, protozoans, and amoebas among others
- multicellular organisms such as plants or animals, including samples from a healthy or apparently healthy human subject or a human patient affected by a condition or disease to be diagnosed or investigated, such as cancer).
- a biological sample can be a biological fluid obtained from, for example, blood, plasma, serum, urine, bile, ascites, saliva, cerebrospinal fluid, aqueous or vitreous humor, or any bodily secretion, a transudate, an exudate (for example, fluid obtained from an abscess or any other site of infection or inflammation), or fluid obtained from a joint (for example, a normal joint or a joint affected by disease).
- a biological sample can also be a sample obtained from any organ or tissue (including a biopsy or autopsy specimen, such as a tumor biopsy) or can include a cell (whether a primary cell or cultured cell) or medium conditioned by any cell, tissue or organ.
- a biological sample is a nuclear extract.
- a sample is a quality control sample, such as one of the disclosed cell pellet section samples.
- a sample is a test sample.
- a test sample is a cell, a tissue or cell pellet section prepared from a biological sample obtained from a subject.
- the subject is one that is at risk or has acquired a particular condition or disease.
- the specimen is breast tissue.
- the processing apparatus can apply fixatives to the specimen.
- Fixatives can include cross-linking agents (such as aldehydes, e.g., formaldehyde, paraformaldehyde, and glutaraldehyde, as well as non-aldehyde cross-linking agents), oxidizing agents (e.g., metallic ions and complexes, such as osmium tetroxide and chromic acid), protein-denaturing agents (e.g., acetic acid, methanol, and ethanol), fixatives of unknown mechanism (e.g., mercuric chloride, acetone, and picric acid), combination reagents (e.g., Camoy's fixative, methacam, Bouin's fluid, B5 fixative, Rossman's fluid, and Gendre's fluid), microwaves, and miscellaneous fixatives (e.g., excluded volume fixation and vapor fixation).
- cross-linking agents such as alde
- the sample can be deparaffinized using appropriate deparaffinizing fluid(s).
- appropriate deparaffinizing fluid(s) any number of substances can be successively applied to the specimen.
- the substances can be for pretreatment (e.g., protein-crosslinking, expose nucleic acids, etc.), denaturation, hybridization, washing (e.g., stringency wash), detection (e.g., link a visual or marker molecule to a probe), amplifying (e.g., amplifying proteins, genes, etc.), counterstaining, coverslipping, or the like.
- the specimen processing apparatus can apply a wide range of substances to the specimen.
- the substances include, without limitation, stains, probes, reagents, rinses, and/or conditioners.
- the substances can be fluids (e.g., gases, liquids, or gas/liquid mixtures), or the like.
- the fluids can be solvents (e.g., polar solvents, non-polar solvents, etc.), solutions (e.g., aqueous solutions or other types of solutions), or the like.
- Reagents can include, without limitation, stains, wetting agents, antibodies (e.g., monoclonal antibodies, polyclonal antibodies, etc.), antigen recovering fluids (e.g., aqueous- or non-aqueous-based antigen retrieval solutions, antigen recovering buffers, etc.), or the like.
- Probes can be an isolated nucleic acid or an isolated synthetic oligonucleotide, attached to a detectable label or reporter molecule. Labels can include radioactive isotopes, enzyme substrates, co-factors, ligands, chemiluminescent or fluorescent agents, haptens, and enzymes.
- the specimen processing apparatus can be an automated apparatus, such as the BENCHMARK XT instrument and SYMPHONY instrument sold by Ventana Medical Systems, Inc. Ventana Medical Systems, Inc. is the assignee of a number of United States patents disclosing systems and methods for performing automated analyses, including U.S. Pat. Nos. 5,650,327 , 5,654,200 , 6,296,809 , 6,352,861 , 6,827,901 and 6,943,029 , and U.S. Published Patent Application Nos. 20030211630 and 20040052685 ,
- specimens can be manually processed.
- the imaging apparatus used here is a brightfield imager slide scanner.
- One brightfield imager is the iScan HT brightfield scanner sold by Ventana Medical Systems, Inc.
- the imaging apparatus is a digital pathology device as disclosed in International Patent Application No.: PCT/US2010/002772 (Patent Publication No.: WO/2011/049608 ) entitled IMAGING SYSTEM AND TECHNIQUES or disclosed in U.S. Patent Application No. 61/533,114, filed on Sep. 9, 2011 , entitled IMAGING SYSTEMS, CASSETTES, AND METHODS OF USING THE SAME.
- International Patent Application No. PCT/US2010/002772 and U.S. Patent Application No. 61/533,114 the imaging apparatus includes a digital camera coupled to a microscope.
- the imaging system or apparatus may be a multispectral imaging (MSI) system or a fluorescent microscopy system.
- the imaging system used here is an MSI.
- MSI generally, equips the analysis of pathology specimens with computerized microscope-based imaging systems by providing access to spectral distribution of an image at a pixel level. While there exists a variety of multispectral imaging systems, an operational aspect that is common to all of these systems is a capability to form a multispectral image.
- a multispectral image is one that captures image data at specific wavelengths or at specific spectral bandwidths across the electromagnetic spectrum. These wavelengths may be singled out by optical filters or by the use of other instruments capable of selecting a pre-determined spectral component including electromagnetic radiation at wavelengths beyond the range of visible light range, such as, for example, infrared (IR).
- IR infrared
- An MSI may include an optical imaging system, a portion of which contains a spectrally-selective system that is tunable to define a pre-determined number N of discrete optical bands.
- the optical system may be adapted to image a tissue sample, illuminated in transmission with a broadband light source onto an optical detector.
- the optical imaging system which in one embodiment may include a magnifying system such as, for example, a microscope, has a single optical axis generally spatially aligned with a single optical output of the optical system.
- the system forms a sequence of images of the tissue as the spectrally selective system is being adjusted or tuned (for example with a computer processor) such as to assure that images are acquired in different discrete spectral bands.
- the apparatus may additionally contain a display in which appears at least one visually perceivable image of the tissue from the sequence of acquired images.
- the spectrally-selective system may include an optically-dispersive element such as a diffractive grating, a collection of optical filters such as thin-film interference filters or any other system adapted to select, in response to either a user input or a command of the pre-programmed processor, a particular pass-band from the spectrum of light transmitted from the light source through the sample towards the detector.
- a spectrally selective system defines several optical outputs corresponding to N discrete spectral bands. This type of system intakes the transmitted light output from the optical system and spatially redirects at least a portion of this light output along N spatially different optical paths in such a way as to image the sample in an identified spectral band onto a detector system along an optical path corresponding to this identified spectral band.
- Embodiments of the subject matter and the operations described in this specification can be implemented in digital electronic circuitry, or in computer software, firmware, or hardware, including the structures disclosed in this specification and their structural equivalents, or in combinations of one or more of them.
- Embodiments of the subject matter described in this specification can be implemented as one or more computer programs, i.e., one or more modules of computer program instructions, encoded on computer storage medium for execution by, or to control the operation of, data processing apparatus. Any of the modules described herein may include logic that is executed by the processor(s).
- Logic refers to any information having the form of instruction signals and/or data that may be applied to affect the operation of a processor.
- Software is an example of logic.
- a computer storage medium can be, or can be included in, a computer-readable storage device, a computer-readable storage substrate, a random or serial access memory array or device, or a combination of one or more of them.
- a computer storage medium is not a propagated signal, a computer storage medium can be a source or destination of computer program instructions encoded in an artificially generated propagated signal.
- the computer storage medium can also be, or can be included in, one or more separate physical components or media (e.g., multiple CDs, disks, or other storage devices).
- the operations described in this specification can be implemented as operations performed by a data processing apparatus on data stored on one or more computer-readable storage devices or received from other sources.
- the term "programmed processor” encompasses all kinds of apparatus, devices, and machines for processing data, including by way of example a programmable microprocessor, a computer, a system on a chip, or multiple ones, or combinations, of the foregoing.
- the apparatus can include special purpose logic circuitry, e.g., an FPGA (field programmable gate array) or an ASIC (application-specific integrated circuit).
- the apparatus also can include, in addition to hardware, code that creates an execution environment for the computer program in question, e.g., code that constitutes processor firmware, a protocol stack, a database management system, an operating system, a cross-platform runtime environment, a virtual machine, or a combination of one or more of them.
- the apparatus and execution environment can realize various different computing model infrastructures, such as web services, distributed computing and grid computing infrastructures.
- a computer program (also known as a program, software, software application, script, or code) can be written in any form of programming language, including compiled or interpreted languages, declarative or procedural languages, and it can be deployed in any form, including as a stand-alone program or as a module, component, subroutine, object, or other unit suitable for use in a computing environment.
- a computer program may, but need not, correspond to a file in a file system.
- a program can be stored in a portion of a file that holds other programs or data (e.g., one or more scripts stored in a markup language document), in a single file dedicated to the program in question, or in multiple coordinated files (e.g., files that store one or more modules, subprograms, or portions of code).
- a computer program can be deployed to be executed on one computer or on multiple computers that are located at one site or distributed across multiple sites and interconnected by a communication network.
- the processes and logic flows described in this specification can be performed by one or more programmable processors executing one or more computer programs to perform actions by operating on input data and generating output.
- the processes and logic flows can also be performed by, and apparatus can also be implemented as, special purpose logic circuitry, e.g., an FPGA (field programmable gate array) or an ASIC (application-specific integrated circuit).
- processors suitable for the execution of a computer program include, by way of example, both general and special purpose microprocessors, and any one or more processors of any kind of digital computer.
- a processor will receive instructions and data from a read-only memory or a random access memory or both.
- the essential elements of a computer are a processor for performing actions in accordance with instructions and one or more memory devices for storing instructions and data.
- a computer will also include, or be operatively coupled to receive data from or transfer data to, or both, one or more mass storage devices for storing data, e.g., magnetic, magneto-optical disks, or optical disks.
- mass storage devices for storing data, e.g., magnetic, magneto-optical disks, or optical disks.
- a computer need not have such devices.
- a computer can be embedded in another device, e.g., a mobile telephone, a personal digital assistant (PDA), a mobile audio or video player, a game console, a Global Positioning System (GPS) receiver, or a portable storage device (e.g., a universal serial bus (USB) flash drive), to name just a few.
- Devices suitable for storing computer program instructions and data include all forms of non-volatile memory, media and memory devices, including by way of example semiconductor memory devices, e.g., EPROM, EEPROM, and flash memory devices; magnetic disks, e.g., internal hard disks or removable disks; magneto-optical disks; and CD-ROM and DVD-ROM disks.
- the processor and the memory can be supplemented by, or incorporated in, special purpose logic circuitry.
- embodiments of the subject matter described in this specification can be implemented on a computer having a display device, e.g., an LCD (liquid crystal display), LED (light emitting diode) display, or OLED (organic light emitting diode) display, for displaying information to the user and a keyboard and a pointing device, e.g., a mouse or a trackball, by which the user can provide input to the computer.
- a display device e.g., an LCD (liquid crystal display), LED (light emitting diode) display, or OLED (organic light emitting diode) display
- a keyboard and a pointing device e.g., a mouse or a trackball
- a touch screen can be used to display information and receive input from a user.
- a computer can interact with a user by sending documents to and receiving documents from a device that is used by the user; for example, by sending web pages to a web browser on a user's client device in response to requests received from the web browser.
- Embodiments of the subject matter described in this specification can be implemented in a computing system that includes a back-end component, e.g., as a data server, or that includes a middleware component, e.g., an application server, or that includes a front-end component, e.g., a client computer having a graphical user interface or a Web browser through which a user can interact with an implementation of the subject matter described in this specification, or any combination of one or more such back-end, middleware, or front-end components.
- the components of the system can be interconnected by any form or medium of digital data communication, e.g., a communication network.
- Examples of communication networks include a local area network (“LAN”) and a wide area network (“WAN”), an inter-network (e.g., the Internet), and peer-to-peer networks (e.g., ad hoc peer-to-peer networks).
- LAN local area network
- WAN wide area network
- inter-network e.g., the Internet
- peer-to-peer networks e.g., ad hoc peer-to-peer networks.
- the network 20 of FIG. 1 can include one or more local area networks.
- the computing system can include any number of clients and servers.
- a client and server are generally remote from each other and typically interact through a communication network. The relationship of client and server arises by virtue of computer programs running on the respective computers and having a client-server relationship to each other.
- a server transmits data (e.g., an HTML page) to a client device (e.g., for purposes of displaying data to and receiving user input from a user interacting with the client device).
- client device e.g., for purposes of displaying data to and receiving user input from a user interacting with the client device.
- Data generated at the client device e.g., a result of the user interaction
Landscapes
- Engineering & Computer Science (AREA)
- Physics & Mathematics (AREA)
- General Health & Medical Sciences (AREA)
- Theoretical Computer Science (AREA)
- Health & Medical Sciences (AREA)
- General Physics & Mathematics (AREA)
- Nuclear Medicine, Radiotherapy & Molecular Imaging (AREA)
- Computer Vision & Pattern Recognition (AREA)
- Quality & Reliability (AREA)
- Radiology & Medical Imaging (AREA)
- Medical Informatics (AREA)
- Life Sciences & Earth Sciences (AREA)
- Biomedical Technology (AREA)
- Molecular Biology (AREA)
- Multimedia (AREA)
- Investigating Or Analysing Biological Materials (AREA)
- Image Analysis (AREA)
Claims (12)
- Procédé mis en œuvre par ordinateur pour l'analyse d'un échantillon de tissu, le procédé comprenant les étapes consistant à :recevoir une première image et une seconde image, dans lequel la première image est une image de biomarqueur et la seconde image est une image H&E ;effectuer une analyse de la première image, y compris déduire des caractéristiques à partir de la première image ;recevoir une entrée qui identifie au moins une partie de la première image ;enregistrer au moins la partie de la première image sur la seconde image pour former une image enregistrée, l'image enregistrée comprenant une partie de la seconde image correspondant à la partie enregistrée de la première image ;effectuer une analyse de l'image enregistrée, y compris déduire des caractéristiques à partir de l'image enregistrée ;fusionner les caractéristiques déduites de la première image et les caractéristiques déduites de l'image enregistrée, dans lequel les caractéristiques incluent des caractéristiques de probabilité déduites de l'image enregistrée ; etclasser des noyaux dans la première image sur la base des caractéristiques fusionnées.
- Procédé mis en œuvre par ordinateur selon la revendication 1, dans lequel les caractéristiques de probabilité sont calculées en (i) générant une carte de probabilités à partir de l'image enregistrée ; et (ii) dérivant des caractéristiques à partir des images de carte de probabilités générées.
- Procédé mis en œuvre par ordinateur selon la revendication 1, dans lequel l'image de biomarqueur comprend des signaux correspondant à une présence d'au moins un parmi un marqueur de récepteur d'oestrogène, un marqueur de récepteur de progestérone, un marqueur Ki-67 ou un marqueur HER2.
- Procédé mis en œuvre par ordinateur selon la revendication 1, dans lequel l'image de biomarqueur comprend des signaux correspondant à une présence d'un marqueur PD-L1, d'un marqueur CD3 ou d'un marqueur CD8.
- Procédé exécuté par ordinateur selon la revendication 1, dans lequel une région tumorale entière est cartographiée de la première image à la seconde image pour former l'image enregistrée.
- Procédé mis en œuvre par ordinateur selon la revendication 5, comprenant en outre l'étape consistant à détecter des noyaux dans l'image enregistrée, et dans lequel les caractéristiques déduites de l'image enregistrée sont calculées sur la base des noyaux détectés.
- Procédé mis en œuvre par ordinateur selon la revendication 1, dans lequel la réalisation de l'analyse de l'image enregistrée comprend au moins (i) une segmentation de structures tissulaires dans la première image ; ou (ii) une détection et une classification de types de cellules dans la première image.
- Procédé mis en œuvre par ordinateur selon la revendication 7, comprenant en outre l'étape consistant à générer une carte de probabilités sur la base du au moins un des structures tissulaires segmentées ou des types de cellules détectés et classés.
- Procédé mis en œuvre par ordinateur selon la revendication 8, dans lequel les caractéristiques de probabilité sont déduites à partir de la carte de probabilités générée.
- Procédé mis en œuvre par ordinateur selon la revendication 1, comprenant en outre l'étape consistant à noter les noyaux classés.
- Dispositif informatique comprenant un ou plusieurs processeurs et au moins une mémoire, la au moins une mémoire stockant des instructions lisibles par ordinateur non transitoires qui, lorsqu'elles sont exécutées par les un ou plusieurs processeurs, amène le dispositif informatique à exécuter le procédé selon l'une quelconque des revendications 1 à 10.
- Support de stockage lisible par ordinateur non transitoire comprenant des instructions exécutables par ordinateur, qui, lorsqu'elles sont exécutées par un ou plusieurs processeurs d'un dispositif informatique, amènent le dispositif informatique à exécuter le procédé de l'une quelconque des revendications 1 à 10.
Priority Applications (1)
| Application Number | Priority Date | Filing Date | Title |
|---|---|---|---|
| EP24216693.2A EP4567728A1 (fr) | 2016-12-22 | 2017-12-20 | Notation informatique basée sur des images primaires de coloration et d'immunohistochimie |
Applications Claiming Priority (2)
| Application Number | Priority Date | Filing Date | Title |
|---|---|---|---|
| US201662438354P | 2016-12-22 | 2016-12-22 | |
| PCT/EP2017/083702 WO2018115055A1 (fr) | 2016-12-22 | 2017-12-20 | Notation informatique basée sur des images primaires de coloration et d'immunohistochimie |
Related Child Applications (2)
| Application Number | Title | Priority Date | Filing Date |
|---|---|---|---|
| EP24216693.2A Division EP4567728A1 (fr) | 2016-12-22 | 2017-12-20 | Notation informatique basée sur des images primaires de coloration et d'immunohistochimie |
| EP24216693.2A Division-Into EP4567728A1 (fr) | 2016-12-22 | 2017-12-20 | Notation informatique basée sur des images primaires de coloration et d'immunohistochimie |
Publications (2)
| Publication Number | Publication Date |
|---|---|
| EP3559902A1 EP3559902A1 (fr) | 2019-10-30 |
| EP3559902B1 true EP3559902B1 (fr) | 2025-01-29 |
Family
ID=60942997
Family Applications (2)
| Application Number | Title | Priority Date | Filing Date |
|---|---|---|---|
| EP17826220.0A Active EP3559902B1 (fr) | 2016-12-22 | 2017-12-20 | Notation informatique basée sur des images primaires de coloration et d'immunohistochimie |
| EP24216693.2A Pending EP4567728A1 (fr) | 2016-12-22 | 2017-12-20 | Notation informatique basée sur des images primaires de coloration et d'immunohistochimie |
Family Applications After (1)
| Application Number | Title | Priority Date | Filing Date |
|---|---|---|---|
| EP24216693.2A Pending EP4567728A1 (fr) | 2016-12-22 | 2017-12-20 | Notation informatique basée sur des images primaires de coloration et d'immunohistochimie |
Country Status (5)
| Country | Link |
|---|---|
| US (2) | US10977791B2 (fr) |
| EP (2) | EP3559902B1 (fr) |
| JP (2) | JP6968177B2 (fr) |
| CN (1) | CN110088804B (fr) |
| WO (1) | WO2018115055A1 (fr) |
Families Citing this family (67)
| Publication number | Priority date | Publication date | Assignee | Title |
|---|---|---|---|---|
| AU2014331153A1 (en) | 2013-10-01 | 2016-02-25 | Ventana Medical Systems, Inc. | Line-based image registration and cross-image annotation devices, systems and methods |
| JP6968177B2 (ja) | 2016-12-22 | 2021-11-17 | ベンタナ メディカル システムズ, インコーポレイテッド | 一次染色および免疫組織化学画像に基づくコンピュータ採点 |
| US10573003B2 (en) * | 2017-02-13 | 2020-02-25 | Amit Sethi | Systems and methods for computational pathology using points-of-interest |
| WO2018165103A1 (fr) * | 2017-03-06 | 2018-09-13 | University Of Southern California | Apprentissage machine pour pathologie numérique |
| EP3639191B2 (fr) * | 2017-06-15 | 2024-07-17 | Visiopharm A/S | Procédé d'étiquetage d'images histopathologiques |
| US11443426B2 (en) * | 2018-01-18 | 2022-09-13 | Nantomics, Llc | Real-time whole slide pathology image cell counting |
| US11515009B2 (en) * | 2018-03-19 | 2022-11-29 | International Business Machines Corporation | Biomarker quantification in a tissue sample |
| US12020493B2 (en) | 2018-07-27 | 2024-06-25 | Ventana Medical Systems, Inc. | Systems for automated in situ hybridization analysis |
| WO2020046986A1 (fr) | 2018-08-30 | 2020-03-05 | Applied Materials, Inc. | Système pour la détection et la classification automatiques de tumeurs |
| JP7329587B2 (ja) | 2018-09-07 | 2023-08-18 | ベンタナ メディカル システムズ, インコーポレイテッド | 生体画像データをキャッシュするためのシステムおよび方法 |
| EP3867869A1 (fr) * | 2018-10-18 | 2021-08-25 | Verily Life Sciences LLC | Systèmes et procédés d'utilisation d'un traitement d'images pour générer des inférences de biomarqueur pour l'immunothérapie |
| US11633146B2 (en) | 2019-01-04 | 2023-04-25 | Regents Of The University Of Minnesota | Automated co-registration of prostate MRI data |
| US11631171B2 (en) * | 2019-01-10 | 2023-04-18 | Regents Of The University Of Minnesota | Automated detection and annotation of prostate cancer on histopathology slides |
| EP3924722B1 (fr) | 2019-02-13 | 2025-09-17 | Ventana Medical Systems, Inc. | Systèmes et méthodes de calcul des contributions de l'autofluorescence dans les images multicanales |
| US11210554B2 (en) | 2019-03-21 | 2021-12-28 | Illumina, Inc. | Artificial intelligence-based generation of sequencing metadata |
| US11347965B2 (en) | 2019-03-21 | 2022-05-31 | Illumina, Inc. | Training data generation for artificial intelligence-based sequencing |
| US11972621B2 (en) | 2019-04-24 | 2024-04-30 | Icahn School Of Medicine At Mount Sinai | Systems and methods to label structures of interest in tissue slide images |
| US11423306B2 (en) | 2019-05-16 | 2022-08-23 | Illumina, Inc. | Systems and devices for characterization and performance analysis of pixel-based sequencing |
| US11593649B2 (en) | 2019-05-16 | 2023-02-28 | Illumina, Inc. | Base calling using convolutions |
| CN110569882B (zh) * | 2019-08-15 | 2023-05-09 | 杨春立 | 一种图像信息分类方法及装置 |
| JP7644750B2 (ja) * | 2019-08-28 | 2025-03-12 | ベンタナ メディカル システムズ, インコーポレイテッド | 振動分光法による抗原回収および標的回収進行量の評価 |
| CN110633758A (zh) * | 2019-09-20 | 2019-12-31 | 四川长虹电器股份有限公司 | 针对小样本或样本不平衡的癌症区域检测定位的方法 |
| JP7544338B2 (ja) * | 2019-09-27 | 2024-09-04 | 国立大学法人 東京大学 | 情報処理装置、情報処理システム、情報処理方法及びプログラム |
| ES3015712T3 (en) * | 2019-11-04 | 2025-05-07 | Ummon Healthtech | Method of, and computerized system for labeling an image of cells of a patient |
| KR102347442B1 (ko) * | 2019-11-08 | 2022-01-05 | 한국광기술원 | 중적외선을 이용한 암종 컬러검출장치 및 방법 |
| CN110853022B (zh) * | 2019-11-14 | 2020-11-06 | 腾讯科技(深圳)有限公司 | 病理切片图像的处理方法、装置、系统及存储介质 |
| EP4078151A4 (fr) * | 2019-12-17 | 2024-01-03 | Applied Materials, Inc. | Système et procédé d'acquisition et de traitement d'images d'hybridation in-situ de fluorescence multiplexées |
| CN114945941B (zh) | 2020-01-19 | 2025-11-28 | 文塔纳医疗系统公司 | 用于支持肿瘤检测和分析的非肿瘤分割 |
| US20230081232A1 (en) * | 2020-02-17 | 2023-03-16 | 10X Genomics, Inc. | Systems and methods for machine learning features in biological samples |
| US12354008B2 (en) | 2020-02-20 | 2025-07-08 | Illumina, Inc. | Knowledge distillation and gradient pruning-based compression of artificial intelligence-based base caller |
| IL295587A (en) | 2020-02-20 | 2022-10-01 | Illumina Inc | A bus network for a base reader based on artificial intelligence |
| EP4693300A2 (fr) | 2020-02-20 | 2026-02-11 | Illumina, Inc. | Appel de base de type multi-del à base d'intelligence artificielle |
| US11947270B2 (en) * | 2020-02-26 | 2024-04-02 | Fei Company | Metrology of semiconductor devices in electron micrographs using fast marching level sets |
| US12014488B2 (en) * | 2020-03-04 | 2024-06-18 | Case Western Reserve University | Distinguishing colon cancer stages based on computationally derived morphological features of cancer nuclei |
| EP4121888A1 (fr) * | 2020-03-18 | 2023-01-25 | Sanofi | Systèmes et procédés de prédiction de niveaux d'expression |
| WO2022035943A1 (fr) * | 2020-08-13 | 2022-02-17 | Ventana Medical Systems, Inc. | Identification automatisée de régions nécrotiques dans des images numériques de tissu marqué par immunofluorescence multiplex |
| CN112233123B (zh) * | 2020-09-21 | 2024-05-14 | 广州金域医学检验中心有限公司 | 病理图片中肿瘤间质分类方法、装置、计算机设备及存储介质 |
| CN112508860B (zh) * | 2020-11-19 | 2022-09-30 | 湖南兰茜生物科技有限公司 | 一种免疫组化图像核阳性的人工智能判读方法及系统 |
| CN112270683B (zh) * | 2020-12-23 | 2021-04-02 | 宁波兰茜生物科技有限公司 | 一种ihc数字预览图识别和组织前景分割方法及系统 |
| CN112270684B (zh) * | 2020-12-25 | 2021-04-06 | 宁波兰茜生物科技有限公司 | 一种显微图像免疫组化虚拟多重标记及分析方法及系统 |
| DE102021100444A1 (de) * | 2021-01-12 | 2022-07-14 | Carl Zeiss Microscopy Gmbh | Mikroskopiesystem und verfahren zum bewerten von bildverarbeitungsergebnissen |
| US12488893B2 (en) | 2021-02-18 | 2025-12-02 | Lunit Inc. | Method and system for training machine learning model for detecting abnormal region in pathological slide image |
| KR102580419B1 (ko) * | 2021-02-18 | 2023-09-19 | 주식회사 루닛 | 병리 슬라이드 이미지 내의 관심 영역을 검출하기 위한 방법 및 시스템 |
| US20220301657A1 (en) | 2021-03-16 | 2022-09-22 | Illumina, Inc. | Tile location and/or cycle based weight set selection for base calling |
| EP4288975A1 (fr) * | 2021-03-18 | 2023-12-13 | Leica Biosystems Imaging, Inc. | Appareil et procédé pour entraîner des modèles d'apprentissage machine faisant appel à des données d'image annotées destinés à l'imagerie pathologique |
| JP7711764B2 (ja) * | 2021-03-24 | 2025-07-23 | 日本電気株式会社 | 画像処理の方法及び画像処理装置 |
| US12217829B2 (en) | 2021-04-15 | 2025-02-04 | Illumina, Inc. | Artificial intelligence-based analysis of protein three-dimensional (3D) structures |
| US20220336057A1 (en) | 2021-04-15 | 2022-10-20 | Illumina, Inc. | Efficient voxelization for deep learning |
| CN113706450A (zh) * | 2021-05-18 | 2021-11-26 | 腾讯科技(深圳)有限公司 | 图像配准方法、装置、设备及可读存储介质 |
| CN113469939B (zh) * | 2021-05-26 | 2022-05-03 | 透彻影像(北京)科技有限公司 | 一种基于特性曲线的her-2免疫组化自动判读系统 |
| US12530882B2 (en) | 2021-07-01 | 2026-01-20 | Illumina, Inc. | Efficient artificial intelligence-based base calling of index sequences |
| US12231802B2 (en) | 2021-08-04 | 2025-02-18 | Theia Scientific, LLC | System and method for multi-modal microscopy |
| US20230051081A1 (en) * | 2021-08-11 | 2023-02-16 | Mim Software Inc. | Registration chaining with information transfer |
| CN114022472B (zh) * | 2021-11-17 | 2022-05-20 | 深圳裕策生物科技有限公司 | 一种肿瘤浸润淋巴细胞分析方法、装置和存储介质 |
| US20260002210A1 (en) * | 2021-12-20 | 2026-01-01 | Countable Labs, Inc. | Detection and digital quantitation of multiple targets |
| TWI809682B (zh) * | 2022-01-25 | 2023-07-21 | 國立成功大學 | 免疫組織化學染色影像的分析方法與電腦程式產品 |
| CN116642940B (zh) * | 2022-02-11 | 2026-01-23 | 苏州帕诺米克生物医药科技有限公司 | 空间质谱图的噪声识别方法、装置及电子设备 |
| CN114596298B (zh) * | 2022-03-16 | 2022-11-15 | 华东师范大学 | 基于高光谱成像的精标注数字病理数据集自动生成方法 |
| EP4246525A1 (fr) * | 2022-03-18 | 2023-09-20 | Lunit Inc. | Procédé et dispositif de traitement d'image de lame pathologique |
| CN114708457B (zh) * | 2022-03-31 | 2024-10-29 | 南京林业大学 | 用于抗紫边识别的高光谱深度学习识别方法 |
| EP4590709A1 (fr) | 2022-09-22 | 2025-07-30 | Agilent Technologies, Inc. | Anticorps anti-icos humains destinés à être utilisés dans des protocoles d'immunohistochimie (ihc) et pour diagnostiquer un cancer |
| WO2024148067A1 (fr) * | 2023-01-03 | 2024-07-11 | Trustees Of Tufts College | Localisation de parties d'images responsables d'une classification dans des problèmes faiblement supervisés |
| CN117115182A (zh) * | 2023-08-31 | 2023-11-24 | 西南石油大学 | 基于多智能体深度强化学习的病理图像分割方法 |
| US12023817B1 (en) | 2023-11-14 | 2024-07-02 | Pramana, Inc. | System and method for a slide marking technique for target tissue extraction and downstream application |
| CN118096757B (zh) * | 2024-04-26 | 2024-07-09 | 天津市肿瘤医院(天津医科大学肿瘤医院) | 基于双染数字病理图像的图像标注方法和图像标注设备 |
| CN118918150B (zh) * | 2024-06-03 | 2026-02-03 | 首都医科大学附属北京世纪坛医院 | 一种利用多重免疫荧光对h&e病理图像进行自动细胞标注的方法 |
| US12499991B1 (en) * | 2025-05-16 | 2025-12-16 | Pramana, Inc. | Apparatus and method for generating a modified composite view as a function of a plurality of whole slide images and a reconstruction model |
Family Cites Families (22)
| Publication number | Priority date | Publication date | Assignee | Title |
|---|---|---|---|---|
| US5595707A (en) | 1990-03-02 | 1997-01-21 | Ventana Medical Systems, Inc. | Automated biological reaction apparatus |
| US20030211630A1 (en) | 1998-02-27 | 2003-11-13 | Ventana Medical Systems, Inc. | Automated molecular pathology apparatus having independent slide heaters |
| US6582962B1 (en) | 1998-02-27 | 2003-06-24 | Ventana Medical Systems, Inc. | Automated molecular pathology apparatus having independent slide heaters |
| CA2321836C (fr) | 1998-02-27 | 2004-09-28 | Ventana Medical Systems, Inc. | Appareil automatise d'anatomie pathologique moleculaire avec rechauffeurs independants de microplaquettes |
| US8131476B2 (en) * | 2006-08-07 | 2012-03-06 | General Electric Company | System and method for co-registering multi-channel images of a tissue micro array |
| US8269827B2 (en) * | 2009-09-29 | 2012-09-18 | General Electric Company | System and methods for mapping fluorescent images into a bright field color space |
| SG187479A1 (en) | 2009-10-19 | 2013-02-28 | Ventana Med Syst Inc | Imaging system and techniques |
| EP2779089B1 (fr) * | 2010-07-30 | 2018-11-14 | Fundação D. Anna Sommer Champalimaud E Dr. Carlos Montez Champalimaud | Systèmes et procédés pour la segmentation et le traitement d'images de tissus et d'extraction de caractéristiques à partir de celles-ci pour traiter, diagnostiquer ou prédire des conditions médicales |
| US9779283B2 (en) * | 2011-01-05 | 2017-10-03 | The Board Of Trustees Of The University Of Illinois | Automated prostate tissue referencing for cancer detection and diagnosis |
| JP6192747B2 (ja) * | 2013-03-15 | 2017-09-06 | ベンタナ メディカル システムズ, インコーポレイテッド | デジタル・ホール・スライドの自動採点のための組織物体に基づく機械学習システム |
| EP3005293B1 (fr) | 2013-06-03 | 2018-10-03 | Ventana Medical Systems, Inc. | Separation de couleurs physiologiquement plausibles adaptative d'image |
| AU2014331153A1 (en) | 2013-10-01 | 2016-02-25 | Ventana Medical Systems, Inc. | Line-based image registration and cross-image annotation devices, systems and methods |
| WO2015052128A1 (fr) * | 2013-10-07 | 2015-04-16 | Ventana Medical Systems, Inc. | Systèmes et méthodes d'analyse tissulaire multiple et exhaustive |
| CA2932892C (fr) | 2014-01-28 | 2020-09-22 | Ventana Medical Systems, Inc. | Classification adaptative pour la segmentation de tissus dans l'ensemble d'une lame |
| WO2015124777A1 (fr) * | 2014-02-21 | 2015-08-27 | Ventana Medical Systems, Inc. | Analyse d'images médicales pour l'identification de cellules tumorales positives aux marqueurs biologiques |
| EP3550514B1 (fr) | 2014-02-21 | 2020-11-25 | Ventana Medical Systems, Inc. | Modèle de sparsity de groupe pour unmixing d'image |
| JP6763781B2 (ja) | 2014-05-30 | 2020-09-30 | ベンタナ メディカル システムズ, インコーポレイテッド | 複数の染色で染色されている生物組織サンプルから取得されるマルチチャネル画像を分析するための画像処理方法及びシステム |
| AU2015345199A1 (en) | 2014-11-10 | 2017-04-27 | Ventana Medical Systems, Inc. | Classifying nuclei in histology images |
| WO2016087592A1 (fr) * | 2014-12-03 | 2016-06-09 | Ventana Medical Systems, Inc. | Systèmes et méthodes de pronostic de cancer à un stade précoce |
| WO2016120442A1 (fr) | 2015-01-30 | 2016-08-04 | Ventana Medical Systems, Inc. | Segmentation d'avant-plan et classement des noyaux pour établir un score de classement d'images à double ish |
| CN107209092A (zh) * | 2015-01-31 | 2017-09-26 | 豪夫迈·罗氏有限公司 | 用于中间解剖的系统和方法 |
| JP6968177B2 (ja) | 2016-12-22 | 2021-11-17 | ベンタナ メディカル システムズ, インコーポレイテッド | 一次染色および免疫組織化学画像に基づくコンピュータ採点 |
-
2017
- 2017-12-20 JP JP2019534350A patent/JP6968177B2/ja active Active
- 2017-12-20 WO PCT/EP2017/083702 patent/WO2018115055A1/fr not_active Ceased
- 2017-12-20 EP EP17826220.0A patent/EP3559902B1/fr active Active
- 2017-12-20 EP EP24216693.2A patent/EP4567728A1/fr active Pending
- 2017-12-20 CN CN201780078305.6A patent/CN110088804B/zh active Active
-
2019
- 2019-06-21 US US16/448,826 patent/US10977791B2/en active Active
-
2021
- 2021-03-16 US US17/202,546 patent/US11657503B2/en active Active
- 2021-10-26 JP JP2021174267A patent/JP7233506B2/ja active Active
Also Published As
| Publication number | Publication date |
|---|---|
| EP4567728A1 (fr) | 2025-06-11 |
| JP2020502534A (ja) | 2020-01-23 |
| JP6968177B2 (ja) | 2021-11-17 |
| US10977791B2 (en) | 2021-04-13 |
| CN110088804A (zh) | 2019-08-02 |
| US11657503B2 (en) | 2023-05-23 |
| WO2018115055A1 (fr) | 2018-06-28 |
| JP2022023912A (ja) | 2022-02-08 |
| EP3559902A1 (fr) | 2019-10-30 |
| US20210201485A1 (en) | 2021-07-01 |
| US20190392578A1 (en) | 2019-12-26 |
| CN110088804B (zh) | 2023-06-27 |
| JP7233506B2 (ja) | 2023-03-06 |
Similar Documents
| Publication | Publication Date | Title |
|---|---|---|
| US11657503B2 (en) | Computer scoring based on primary stain and immunohistochemistry images related application data | |
| US11682192B2 (en) | Deep-learning systems and methods for joint cell and region classification in biological images | |
| US11526984B2 (en) | Method of computing tumor spatial and inter-marker heterogeneity | |
| JP7558242B2 (ja) | デジタル病理学分析結果の格納および読み出し方法 | |
| US10628658B2 (en) | Classifying nuclei in histology images | |
| US11959848B2 (en) | Method of storing and retrieving digital pathology analysis results | |
| EP4091135A1 (fr) | Segmentation non tumorale pour prendre en charge une détection et une analyse de tumeur | |
| WO2019197509A1 (fr) | Systèmes d'estimation de forme de cellule |
Legal Events
| Date | Code | Title | Description |
|---|---|---|---|
| STAA | Information on the status of an ep patent application or granted ep patent |
Free format text: STATUS: UNKNOWN |
|
| STAA | Information on the status of an ep patent application or granted ep patent |
Free format text: STATUS: THE INTERNATIONAL PUBLICATION HAS BEEN MADE |
|
| PUAI | Public reference made under article 153(3) epc to a published international application that has entered the european phase |
Free format text: ORIGINAL CODE: 0009012 |
|
| STAA | Information on the status of an ep patent application or granted ep patent |
Free format text: STATUS: REQUEST FOR EXAMINATION WAS MADE |
|
| 17P | Request for examination filed |
Effective date: 20190722 |
|
| AK | Designated contracting states |
Kind code of ref document: A1 Designated state(s): AL AT BE BG CH CY CZ DE DK EE ES FI FR GB GR HR HU IE IS IT LI LT LU LV MC MK MT NL NO PL PT RO RS SE SI SK SM TR |
|
| AX | Request for extension of the european patent |
Extension state: BA ME |
|
| DAV | Request for validation of the european patent (deleted) | ||
| DAX | Request for extension of the european patent (deleted) | ||
| STAA | Information on the status of an ep patent application or granted ep patent |
Free format text: STATUS: EXAMINATION IS IN PROGRESS |
|
| 17Q | First examination report despatched |
Effective date: 20210202 |
|
| GRAP | Despatch of communication of intention to grant a patent |
Free format text: ORIGINAL CODE: EPIDOSNIGR1 |
|
| STAA | Information on the status of an ep patent application or granted ep patent |
Free format text: STATUS: GRANT OF PATENT IS INTENDED |
|
| INTG | Intention to grant announced |
Effective date: 20240806 |
|
| GRAS | Grant fee paid |
Free format text: ORIGINAL CODE: EPIDOSNIGR3 |
|
| GRAA | (expected) grant |
Free format text: ORIGINAL CODE: 0009210 |
|
| STAA | Information on the status of an ep patent application or granted ep patent |
Free format text: STATUS: THE PATENT HAS BEEN GRANTED |
|
| AK | Designated contracting states |
Kind code of ref document: B1 Designated state(s): AL AT BE BG CH CY CZ DE DK EE ES FI FR GB GR HR HU IE IS IT LI LT LU LV MC MK MT NL NO PL PT RO RS SE SI SK SM TR |
|
| REG | Reference to a national code |
Ref country code: GB Ref legal event code: FG4D |
|
| REG | Reference to a national code |
Ref country code: CH Ref legal event code: EP |
|
| REG | Reference to a national code |
Ref country code: DE Ref legal event code: R096 Ref document number: 602017087577 Country of ref document: DE |
|
| REG | Reference to a national code |
Ref country code: IE Ref legal event code: FG4D |
|
| REG | Reference to a national code |
Ref country code: NL Ref legal event code: MP Effective date: 20250129 |
|
| PG25 | Lapsed in a contracting state [announced via postgrant information from national office to epo] |
Ref country code: NL Free format text: LAPSE BECAUSE OF FAILURE TO SUBMIT A TRANSLATION OF THE DESCRIPTION OR TO PAY THE FEE WITHIN THE PRESCRIBED TIME-LIMIT Effective date: 20250129 |
|
| PG25 | Lapsed in a contracting state [announced via postgrant information from national office to epo] |
Ref country code: RS Free format text: LAPSE BECAUSE OF FAILURE TO SUBMIT A TRANSLATION OF THE DESCRIPTION OR TO PAY THE FEE WITHIN THE PRESCRIBED TIME-LIMIT Effective date: 20250429 |
|
| PG25 | Lapsed in a contracting state [announced via postgrant information from national office to epo] |
Ref country code: FI Free format text: LAPSE BECAUSE OF FAILURE TO SUBMIT A TRANSLATION OF THE DESCRIPTION OR TO PAY THE FEE WITHIN THE PRESCRIBED TIME-LIMIT Effective date: 20250129 |
|
| PG25 | Lapsed in a contracting state [announced via postgrant information from national office to epo] |
Ref country code: PL Free format text: LAPSE BECAUSE OF FAILURE TO SUBMIT A TRANSLATION OF THE DESCRIPTION OR TO PAY THE FEE WITHIN THE PRESCRIBED TIME-LIMIT Effective date: 20250129 |
|
| PG25 | Lapsed in a contracting state [announced via postgrant information from national office to epo] |
Ref country code: ES Free format text: LAPSE BECAUSE OF FAILURE TO SUBMIT A TRANSLATION OF THE DESCRIPTION OR TO PAY THE FEE WITHIN THE PRESCRIBED TIME-LIMIT Effective date: 20250129 |
|
| REG | Reference to a national code |
Ref country code: LT Ref legal event code: MG9D |
|
| PG25 | Lapsed in a contracting state [announced via postgrant information from national office to epo] |
Ref country code: NO Free format text: LAPSE BECAUSE OF FAILURE TO SUBMIT A TRANSLATION OF THE DESCRIPTION OR TO PAY THE FEE WITHIN THE PRESCRIBED TIME-LIMIT Effective date: 20250429 Ref country code: IS Free format text: LAPSE BECAUSE OF FAILURE TO SUBMIT A TRANSLATION OF THE DESCRIPTION OR TO PAY THE FEE WITHIN THE PRESCRIBED TIME-LIMIT Effective date: 20250529 |
|
| REG | Reference to a national code |
Ref country code: AT Ref legal event code: MK05 Ref document number: 1764205 Country of ref document: AT Kind code of ref document: T Effective date: 20250129 |
|
| PG25 | Lapsed in a contracting state [announced via postgrant information from national office to epo] |
Ref country code: HR Free format text: LAPSE BECAUSE OF FAILURE TO SUBMIT A TRANSLATION OF THE DESCRIPTION OR TO PAY THE FEE WITHIN THE PRESCRIBED TIME-LIMIT Effective date: 20250129 |
|
| PG25 | Lapsed in a contracting state [announced via postgrant information from national office to epo] |
Ref country code: LV Free format text: LAPSE BECAUSE OF FAILURE TO SUBMIT A TRANSLATION OF THE DESCRIPTION OR TO PAY THE FEE WITHIN THE PRESCRIBED TIME-LIMIT Effective date: 20250129 Ref country code: PT Free format text: LAPSE BECAUSE OF FAILURE TO SUBMIT A TRANSLATION OF THE DESCRIPTION OR TO PAY THE FEE WITHIN THE PRESCRIBED TIME-LIMIT Effective date: 20250529 |
|
| PG25 | Lapsed in a contracting state [announced via postgrant information from national office to epo] |
Ref country code: BG Free format text: LAPSE BECAUSE OF FAILURE TO SUBMIT A TRANSLATION OF THE DESCRIPTION OR TO PAY THE FEE WITHIN THE PRESCRIBED TIME-LIMIT Effective date: 20250129 Ref country code: GR Free format text: LAPSE BECAUSE OF FAILURE TO SUBMIT A TRANSLATION OF THE DESCRIPTION OR TO PAY THE FEE WITHIN THE PRESCRIBED TIME-LIMIT Effective date: 20250430 |
|
| PG25 | Lapsed in a contracting state [announced via postgrant information from national office to epo] |
Ref country code: AT Free format text: LAPSE BECAUSE OF FAILURE TO SUBMIT A TRANSLATION OF THE DESCRIPTION OR TO PAY THE FEE WITHIN THE PRESCRIBED TIME-LIMIT Effective date: 20250129 |
|
| PG25 | Lapsed in a contracting state [announced via postgrant information from national office to epo] |
Ref country code: SE Free format text: LAPSE BECAUSE OF FAILURE TO SUBMIT A TRANSLATION OF THE DESCRIPTION OR TO PAY THE FEE WITHIN THE PRESCRIBED TIME-LIMIT Effective date: 20250129 |
|
| PG25 | Lapsed in a contracting state [announced via postgrant information from national office to epo] |
Ref country code: SM Free format text: LAPSE BECAUSE OF FAILURE TO SUBMIT A TRANSLATION OF THE DESCRIPTION OR TO PAY THE FEE WITHIN THE PRESCRIBED TIME-LIMIT Effective date: 20250129 |
|
| PG25 | Lapsed in a contracting state [announced via postgrant information from national office to epo] |
Ref country code: DK Free format text: LAPSE BECAUSE OF FAILURE TO SUBMIT A TRANSLATION OF THE DESCRIPTION OR TO PAY THE FEE WITHIN THE PRESCRIBED TIME-LIMIT Effective date: 20250129 |
|
| PG25 | Lapsed in a contracting state [announced via postgrant information from national office to epo] |
Ref country code: IT Free format text: LAPSE BECAUSE OF FAILURE TO SUBMIT A TRANSLATION OF THE DESCRIPTION OR TO PAY THE FEE WITHIN THE PRESCRIBED TIME-LIMIT Effective date: 20250129 |
|
| PG25 | Lapsed in a contracting state [announced via postgrant information from national office to epo] |
Ref country code: EE Free format text: LAPSE BECAUSE OF FAILURE TO SUBMIT A TRANSLATION OF THE DESCRIPTION OR TO PAY THE FEE WITHIN THE PRESCRIBED TIME-LIMIT Effective date: 20250129 Ref country code: CZ Free format text: LAPSE BECAUSE OF FAILURE TO SUBMIT A TRANSLATION OF THE DESCRIPTION OR TO PAY THE FEE WITHIN THE PRESCRIBED TIME-LIMIT Effective date: 20250129 |
|
| PG25 | Lapsed in a contracting state [announced via postgrant information from national office to epo] |
Ref country code: RO Free format text: LAPSE BECAUSE OF FAILURE TO SUBMIT A TRANSLATION OF THE DESCRIPTION OR TO PAY THE FEE WITHIN THE PRESCRIBED TIME-LIMIT Effective date: 20250129 |
|
| PG25 | Lapsed in a contracting state [announced via postgrant information from national office to epo] |
Ref country code: SK Free format text: LAPSE BECAUSE OF FAILURE TO SUBMIT A TRANSLATION OF THE DESCRIPTION OR TO PAY THE FEE WITHIN THE PRESCRIBED TIME-LIMIT Effective date: 20250129 |
|
| REG | Reference to a national code |
Ref country code: DE Ref legal event code: R097 Ref document number: 602017087577 Country of ref document: DE |
|
| PLBE | No opposition filed within time limit |
Free format text: ORIGINAL CODE: 0009261 |
|
| STAA | Information on the status of an ep patent application or granted ep patent |
Free format text: STATUS: NO OPPOSITION FILED WITHIN TIME LIMIT |
|
| 26N | No opposition filed |
Effective date: 20251030 |