EP3556013B1 - Sound management method and system - Google Patents
Sound management method and system Download PDFInfo
- Publication number
- EP3556013B1 EP3556013B1 EP17881345.7A EP17881345A EP3556013B1 EP 3556013 B1 EP3556013 B1 EP 3556013B1 EP 17881345 A EP17881345 A EP 17881345A EP 3556013 B1 EP3556013 B1 EP 3556013B1
- Authority
- EP
- European Patent Office
- Prior art keywords
- volume
- speaker
- speakers
- qbit
- sound
- Prior art date
- Legal status (The legal status is an assumption and is not a legal conclusion. Google has not performed a legal analysis and makes no representation as to the accuracy of the status listed.)
- Active
Links
Images





Classifications
-
- H—ELECTRICITY
- H03—ELECTRONIC CIRCUITRY
- H03G—CONTROL OF AMPLIFICATION
- H03G3/00—Gain control in amplifiers or frequency changers
- H03G3/20—Automatic control
- H03G3/30—Automatic control in amplifiers having semiconductor devices
- H03G3/32—Automatic control in amplifiers having semiconductor devices the control being dependent upon ambient noise level or sound level
-
- H—ELECTRICITY
- H03—ELECTRONIC CIRCUITRY
- H03G—CONTROL OF AMPLIFICATION
- H03G3/00—Gain control in amplifiers or frequency changers
- H03G3/20—Automatic control
- H03G3/30—Automatic control in amplifiers having semiconductor devices
- H03G3/3005—Automatic control in amplifiers having semiconductor devices in amplifiers suitable for low-frequencies, e.g. audio amplifiers
-
- H—ELECTRICITY
- H03—ELECTRONIC CIRCUITRY
- H03G—CONTROL OF AMPLIFICATION
- H03G5/00—Tone control or bandwidth control in amplifiers
- H03G5/16—Automatic control
- H03G5/165—Equalizers; Volume or gain control in limited frequency bands
-
- H—ELECTRICITY
- H04—ELECTRIC COMMUNICATION TECHNIQUE
- H04R—LOUDSPEAKERS, MICROPHONES, GRAMOPHONE PICK-UPS OR LIKE ACOUSTIC ELECTROMECHANICAL TRANSDUCERS; ELECTRIC HEARING AIDS; PUBLIC ADDRESS SYSTEMS
- H04R27/00—Public address systems
-
- H—ELECTRICITY
- H04—ELECTRIC COMMUNICATION TECHNIQUE
- H04R—LOUDSPEAKERS, MICROPHONES, GRAMOPHONE PICK-UPS OR LIKE ACOUSTIC ELECTROMECHANICAL TRANSDUCERS; ELECTRIC HEARING AIDS; PUBLIC ADDRESS SYSTEMS
- H04R3/00—Circuits for transducers
- H04R3/12—Circuits for transducers for distributing signals to two or more loudspeakers
-
- H—ELECTRICITY
- H04—ELECTRIC COMMUNICATION TECHNIQUE
- H04R—LOUDSPEAKERS, MICROPHONES, GRAMOPHONE PICK-UPS OR LIKE ACOUSTIC ELECTROMECHANICAL TRANSDUCERS; ELECTRIC HEARING AIDS; PUBLIC ADDRESS SYSTEMS
- H04R29/00—Monitoring arrangements; Testing arrangements
-
- H—ELECTRICITY
- H04—ELECTRIC COMMUNICATION TECHNIQUE
- H04S—STEREOPHONIC SYSTEMS
- H04S7/00—Indicating arrangements; Control arrangements, e.g. balance control
- H04S7/30—Control circuits for electronic adaptation of the sound field
- H04S7/301—Automatic calibration of stereophonic sound system, e.g. with test microphone
Definitions
- AVA Autonomous Volume Adjustment', or 'AVA' has been developed to ameliorate the problems of the prior art.
- AVA is an always on, autonomous algorithm which monitors noise levels inside a given area and makes multiple adjustments or sends notifications to speakers, IoT devices, digital services, APIs and other connected devices.
- AVA matches the listening conditions in store/venue with the appropriate playback settings (volume, treble, bass, frequency and other settings/filters) in near real time.
- AVA also assists in making content selection adjustments and may send/receive other notifications based on audio input device (such as a microphone) measurements which it has linked to in store behaviours/patterns over time.
- the Qsic API is used to refer to an Application Programming Interface housed on one or more computing devices which are in communication with the controller.
- the Qsic API is remote and may for example be accessed via the internet or another network or communications link.
- the invention is applicable to a wide range of implementations and it is to be appreciated that other constructions and arrangements are also considered as falling within the scope of the invention.
- Various modifications, alterations, variations and or additions to the construction and arrangements described herein are also considered as falling within the ambit and scope of the present invention.
- AVA is an improvement over simple flat level decibel based volume adjustments on groups of speakers.
- AVA uses multiple microphones to identify the location of noise and the levels of noise at those locations, then algorithmically adjusts the individual speakers based on each speaker's proximity to the microphone and the speakers ideal volume against an aggregated input value. This is all done in real-time and on a one to one basis for each individual speaker and the origin of the noise.
- AVA uses network/internet enabled speakers, this means that far more than just volume may be being controlled.
- Other levels of adjustment might for example include, but are not limited to: perceived loudness (individual frequencies) when listening at low volumes, sound morphing, speech clarity, Bass, Treble, Balance and anything else a speaker (preferably an intelligent speaker) can be used to control.
- the system of the invention may adjust one or more characteristics of queued or live content to fit the environment and circumstances at hand.
- the system may for example tailor content to the current audience by normalising or setting levels in content prior to playing.
- This may for example be done when the content is loaded into the system of the invention so that it is ready for any future use, or a set time before it is scheduled to be played, or at any other suitable time.
- Such tailoring of content may in some comparative, not claimed examples be temporary - for example only for the purpose of playing at that venue at that time, or it may be more longstanding, for example for a particular venue or audience, etc irrespective of when it is played.
- the system and method of the invention also comprises a learning algorithm.
- AVA utilising the Qsic API and infrastructure, will learn how different store/venue purchasing conditions sound and can make adjustments based on that. This includes, but not limited to; content adjustment, triggering in-store promotions, notifying in real time other digital services about upcoming changes in the in-store/venue environment and sentiment analysis.
- An important element of the invention is the sensing of information in the managed environment and feedback of that information to a processor which makes adjustments accordingly.
- this comprises a microphone.
- a configuration algorithm may be run, which for example may assess and set minimum and maximum parameters (for example volume level) the speakers can be set to. Preferably such configuration is undertaken under specific room conditions.
- Figure 7 is a schematic showing one example configuration algorithm.
- the system can adjust the speakers (which may be intelligent speakers) so that the music is always at an audible level. By doing this the sound reading that is recorded by the microphone will for example increase with increasing background noise.
- each speaker's volume (measured as a 0-100 percentage) is recorded against a specific microphone reading which represents an ambient level in the space, which might be for example a venue room.
- speakers volumes may not be recorded as a percentage, but some other measure, for example the unit relative to the speaker manufactures specification. This serves as the basis for the equation of the speaker that will be used to find its ideal volume at any point in time. Multiple readings are preferably carried out as there is a high point and a low point in the ambient noise. The more of such recordings that are undertaken, the more information the controller will have in order to create the equation needed to adjust each speaker's volume levels.
- the system can algorithmically create an equation to describe the relationship and create a graph of each speaker's volume vs the overall microphone reading. This allows the speakers to be adjusted by a controller such as the Qbit in response to varying noise levels as detected by the sensor (such as a microphone).
- the way each speaker is controlled is tied to the application on a device comprising a processor on a network, for example a Local Area Network (LAN), which is preferably located within the venue to provide as 'real-time' adjustments as possible.
- LAN Local Area Network
- the formula that has been prepared according to the process set out above allows the system to monitor each speaker to run the equation every x seconds which determines how often each speaker is updated with a new volume.
- x is a number in the range of 1 and 10, but it may also be larger or smaller as practically required for each implementation. For systems that need speakers to be updated more often a lower number should be favoured.
- the formula that is generated for each speaker may for example be dependant on the power output (for example, peak data input, decibel level, RMS values) vs the volume of the speaker.
- another characteristic is measured and used to adjust operation of a speaker.
- "perceived loudness” may be used, for example by applying an approximate logarithmic relationship filter to the raw data to modify the Power.
- Other characteristics which may be measured for the purpose of determining the relationship to use to adjust operation of a speaker might for example comprise equal loudness contours or decibels.
- RMS RMS-related data frames
- data frames is a section of data streamed into the Qbit from the microphone, which are passed into the rms formula which can generally be expressed as. This gives us the average 'power' of the data stream over a period of time.
- x rms 1 n x 1 2 + x 2 2 + ⁇ + x n 2 .
- RMS values are a way of referring to a speaker's power which is averaged over time. Since the power of an alternating current waveform supplying a speaker varies over time, audio power is typically measured as an average over time. An approximation of this can be obtained by making the assumption that it is a purely resistive load and using the root mean square (RMS) values of the voltage and current waveforms.
- RMS root mean square
- a computing device such as a Qbit, creates a formula for that speaker. It first receives an array of pre recorded RMS and Volumes which are used to create a vector of coefficients and least squares polynomial fit.
- Curve Fitting is used to create a polynomial which gives the ability to evaluate the a volume when an RMS value is passed in.
- Volume x ⁇ 2 + 2x +b, where x is RMS.
- Weights to apply to the y-coordinates of the sample points For gaussian uncertainties, use 1/sigma (not 1/sigma**2). cov : bool, optional
- V ndarray, shape (M,M) or (M,M,K)
- the coefficient matrix of the coefficients p is a Vandermonde matrix.
- a speaker will have an ideal volume vs a specific RMS value.
- the algorithm will make an adjustment to a speaker's volume to attempt to get it closer to its ideal value.
- This adjustment has parameters such as the maximum increase amount (to stop large sudden jumps in volume), maximum and minimum volume levels (which determine the speakers working range), how often each reading should be taken and how often each adjustment should be made.
- the Qbit will obtain an RMS value for a period of time, x seconds (wherein x seconds is as defined above) from the microphone and will hold that value until it gets the next one.
- the process controlling each speaker on the Qbit will request or be sent that value from the process managing the microphone input at separate intervals allowing it to make its own adjustments accordingly.
- x seconds wherein x seconds is as defined above
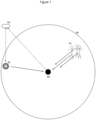
- FIG 1 is a schematic representation of a single point of Noise origin to a single speaker.
- a Microphone M1 which can detect sound within the region of radius from M1 denoted by circumference R1, receives sound input from speaker S1 and noise origin A1.
- the combined volume of the sound emanating from A1 and S1 will decrease as it travels to M1 where it is converted to an electrical signal and sent to the Qbit Q1 which receives the signal, recognises it as associated with microphone M1 and therefore speaker S1 and runs an algorithm associated with speaker S1, generating an output and sends a signal to speaker S1 to adjust the speaker volume S1.
- FIG. 2 is a schematic representation of a single point of noise origin to multiple speakers.
- Microphone M1 which can detect sound within the region of radius from M1 within circumference R1, receives a combined sound input from speakers S1 and S2 along with ambient sound from A1.
- the combined volume of the sound emanating from A1 as well as S1 & S2 will decrease as it travels to M1 where it is then converted to an electrical signal and sent to the Qbit Q1 which recognises the signal as associated with microphone M1 and therefore speakers S1 and S2, runs one or more algorithms associated with one or more of speakers S1 and S2, generating one or more outputs and sends a signal to one or both of speakers S1 and S2 to adjust operation of speakers S1 & S2 accordingly.
- FIG. 3 is a representation of multiple points of noise to multiple speakers.
- Microphone M1 which can detect sound within the region of radius denoted by circumferences R1, receives a combined sound input from speakers S1 and S2 along with ambient sound from A1, A2, A3 and A4.
- the combined volume of the sound emanating from A1, A2, A3 & A4 as well as S1 & S2 will decrease as it travels to M1 where it is then converted to an electrical signal and sent to the Qbit Q1 which recognises the signal as associated with microphone M1 and therefore speakers S1 and S2, runs one or more algorithms associated with one or more of speakers S1 and S2, generating one or more outputs and sends signal to one or both of speakers S1 and S2 to adjust operation of speakers S1 & S2 accordingly.
- Figure 4 is a representation of multiple points of noise with multiple speakers split across multiple microphones M1 & M2.
- M1 which can detect sound within the region of radius denoted by circumferences R1 and will receive a combined sound input from speakers S1 and S2 along with ambient sound from A1, A2, A3 and A4.
- the combined volume of the sound emanating from A1, A2, A3 and A4 as well as S1 and S2 will decrease as it travels to M1 where it is then converted to an electrical signal and sent to the Qbit Q1 which recognises the signal as associated with microphone M1 and therefore speakers S1 and S2.
- the Qbit then runs one or more algorithms associated with one or more of speakers S1 and S2, generating one or more outputs and sends signal to one or both of speakers S1 and S2 to adjust operation of speakers S1 and S2 accordingly.
- M2 which can detect sound within the region of radius denoted by circumferences R2 will receive a combined sound input from speakers S3 and S4 along with ambient sound from A2 and A5.
- the combined volume of the sound emanating from A2 and A5 as well as S3 and S4 will decrease as it travels to M2 where it is then converted to an electrical signal and sent to the Qbit Q1 which recognises the signal as associated with microphone M2 and therefore speakers S4 and S5.
- the Qbit then runs one or more algorithms associated with one or more of speakers S4 and S5, generating one or more outputs and sends signal to one or both of speakers S4 and S5 to adjust operation of speakers S4 and S5 accordingly.
- A2 sound would be contributed to both Microphones as it impacts on both regions as defined by R1 and R2.
- M1 and M2 make no distinction between A2 and treat it as their own source as it falls in both M1 and M2 's radius.
- FIG. 5a shows Microphone M1 which can detect sound from speakers S1, S2 as well as ambient sounds from A1.
- M1 sends microphone signal to Qbit Q1 which adjusts the volumes of S1 & S2 based on the combined ambient noise of the environment.
- the combined volume of the sound emanating from A1 as well as S1 & S2 will decrease as it travels to M1 where it is then converted to an electrical signal and sent to the Qbit Q1 which recognises the signal as associated with microphone M1 and therefore speakers S1 and S2, runs one or more algorithms associated with one or more of speakers S1 and S2, generating one or more outputs and sends a signal to one or both of speakers S1 and S2 to adjust operation of speakers S1 & S2 accordingly.
- Figure 5b is a representation of how speakers react to ambient noise decreases.
- Figure 5b shows Microphone M1 which can detect sound from speakers S1, S2 as well as ambient sounds from A1, sends input to a Qbit Q1 which modifies the volumes of S1 & S2 based on the combined ambient noise of the environment. In this instance A1 has been reduced to show S1 & S2 with lower volumes.
- FIG 6 Is a schematic describing the way speakers are updated via the algorithm on a control device (Qbit).
- the Qbit detects and registers 601 one or more input devices (audio input, such as a microphone) which may be a peripheral device or embedded/built into the Qbit device and sends a request to the Qsic API (Application Programming Interface) 602 to get the configuration for the particular audio device that has been added to the system.
- the API returns the configuration for the input device and loads the configuration.
- the Qbit searches the local network for speakers that have been previously configured 603 using the calibration method described in Figure 7 and sends further requests to the Qsic API 602 to retrieve the calibration details for each speaker. This calibration will contain enough information to describe the relevant relationship and so make up the graph or equation described in Figure 8 .
- the Qbit will load the configuration and setup each speaker to be controlled via the identified algorithm 604.
- the system is set up when a room or venue has its lowest sound ambience - depending on the levels of outside noise, this may have to be in the middle of the night or another appropriate time.
- All speakers linked to the input device to be at their ideal volume 701 for when a room has little ambient sound, all speakers linked to the input device will have their minimum working range set to this volume. This minimum working range will mean the speaker cannot go below this volume, as seen in Figure 10 - 1011.
- the microphone records the ambient sound in the room 702 for x seconds, and the input stream 703 is averaged to then work out the RMS over the set timeframe 704.
- the number x can be any suitable value, typically it is in the range of 1 and 10. It determines how often each speaker is updated with a new volume.
- the Qbit saves the RMS against the volume of the speaker 706.
- the ambient sound level is then increased for example by either waiting for more people to enter a venue or by simulating increasing ambience 706.
- an increase in ambient sound is machine generated as part of a pre-programed calibration sequence. Once the ambience has increased the process flow can start again from 701. This process can repeat until a maximum ambience is reached, it has been found that in general it is preferable that a minimum of 4 data points are gathered to make a prediction using the polynomial equation described above. The more data points recorded the more accurate the prediction will be.
- Figure 8 Is a graph showing an example resulting polynomial from the process described in Figure 7 . This shows how the new volume (y-axis) 802 is selected against the inputs average power output as Root Mean Square (RMS) (x-axis) 801 and volume.
- RMS Root Mean Square
- the Qbit uses that value to figure out what volume it should attempt to get for a particular speaker. For example referring to Figure 8 , if the RMS of the input device was 750 then S2 would attempt to get as close to 26 as possible. S1 would try to get to 41.
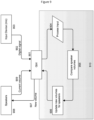
- Figure 9 shows the Qbit 901 as the control device receiving a digital signal 902 from an input device (such as a microphone or decibel reader) 903.
- the signal may optionally be continuous or it may be periodic, for example set at a particular frequency.
- the Qbit 901 stores this digital signal and after x seconds, (where x may be any suitable number but is preferably a number in the range of 1 and 10), which determines how often each speaker is updated with a new volume.
- the Qbit 901 processes the digital signal 904 to produce a power variable, for example an averaged RMS over the period of time.
- the Qbit 901 after receiving the current volumes 909 of the speakers starts the process of comparing the power variable (here an averaged RMS) to the corresponding volume for each speaker 905 which has been configured using the process described in Figure 7 . Once a new volume has been found for a speaker 906 based on the input, a volume adjustment 907 is sent to the speaker 908.
- the power variable here an averaged RMS
- the process has now been initialised and the sub-process controlling the speaker on the Qbit is now receiving an RMS value 1005 from the sub-process controlling the microphone input every x seconds, where x is a number in the range of 1 and 10, which determines how often each speaker is updated with a new volume. For systems that need speakers to be updated more often a lower number should be favoured.
- the Qbit looks up the ideal volume for each speaker based on the RMS input 1005 using the equation that was set in 1004 and obtains the speaker's current volume 1007.
- the Qbit now has 3 variables stored for each speaker. An ideal volume, the current volume and the current RMS.
- the Qbit will process the speaker's current volume and ideal volume to identify whether any difference is larger than a preset maximum increment setting 1008. If it is larger, the Qbit saves the new volume as the current volume plus or minus (depending on if the new volume is higher or lower than the current volume) the maximum allowed increment for that speaker 1009. If the change is not larger than the maximum increment the Qbit either adds or subtracts the change from the current volume (depending on if the new volume is higher or lower than the current volume) to get the new volume for the speaker 1010.
- the maximum increment may be set in any suitable manner. In some implementations, it is done manually by a user, for example based on the venue characteristics, and for example after or during the calibration process. In some comparative, not claimed examples, the maximum increment is computationally arrived at based on data processed at the venue/location of interest - for example data collected during a calibration process such as the one described herein.
- the Qbit For each speaker the Qbit holds a range that the speaker should operate in, which is defined by the maximum and minimum volume for each speaker during the configuration as per Figure 7 . This is to stop the volume getting too loud or too soft.
- the Qbit checks to see if the new volume for the speaker is higher or lower than the configured minimum or maximum volume 1011. If the new ideal volume is higher or lower than the configured maximum/minimum then the Qbit sets the ideal volume to be equal to the configured maximum/minimum of the speaker 1012. If the new volume is not higher or lower than the speakers maximum/minimum configured volume then the Qbit sets the ideal volume to be the passed in ideal value 1013. The Qbit then sends the new ideal volume to the speaker to set its own volume 1014.
- a speaker has a minimum allowed volume of 28 and a maximum allowed volume of 40, its current volume was set to 35, the maximum increment is 3 and its ideal volume after running the RMS lookup 1006 is 37: 1008 would return No as the new volume is not larger than the maximum increment allowed. 1010 would return would return 37 since the change in volume would only be is 2. 1011 would return No since the new volume (37) is lower maximum allowed volume (40). 1013 would pass 37 to 1014 and the speaker would set its new volume to be 37.
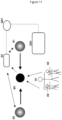
- Figure 11 is a representation of a Microphone detecting a tonal/pitch change in the ambient noise and altering content on a digital service or screen.
- Figure 11 shows a group of children A2, becoming the source of the majority of noise raising the tone/pitch/frequency input to microphone M1.
- M1 sends a digital signal to the Qbit Q1 which determines more children have entered the venue by analysing the attributes such as frequency, tone and pitch of the digital signal from M1.
- Q1 send this notification to the Qsic API QA1.
- the controller (such as a Qbit) is on site at the venue and can process such information without the need to communicate with the Qsic API.
- the Qbit may identify one or more preset outputs based on the identified changes in attributes, such as frequency, tone and pitch, etc.
- Such an output may for example comprise a signal to a content controller to alter content which is played through one or more speakers, or displayed on one or more screens to match one or more characteristics of the altered audience A2.
- the Qbit may further comprise a controller to control such content.
- Figure 12 is a flowchart showing the flow/feedback loop for when AVA detects differences in attributes from the ambient noise, passing this detection to the Qsic API and onto subscribed services.
- Figure 12 shows ambient sound 1201 being sent as a digital signal 1202 to the Qbit 1203 which records the microphone input for x seconds 1204.
- the number 'x' may be of any suitable value, preferably it is a number in the range of 5 and 60 and determines the length of the sample of audio to analyse. A larger number will give a greater likelihood of detecting change, but will be less responsive, while a smaller number may pick up too many changes. This number will preferably be tested on a venue by venue basis before being implemented.
- the recording is saved 1205 and an analysis is run on the recording 1206 of x seconds to determine features of the audio clip from the tone/frequency/pitch etc. These features/attributes are compared to the previous recordings attribute's 1207 if a large enough difference is not found in the attribute changes the process continues from 1204. If a large enough change in features/attributes for example 1208, the average frequency has gone up and we have detected more children in the analysed sound, the change is sent to the Qsic API 1209 which alerts other digital services of this change. These could be Qsic internal services, 1210 for example shows new content being queued and then sent to play in the store 1211. Where 1212 shows an external service being notified and in turn changing the digital advertising in the store 1213. Again, in some comparative, not claimed examples, the Qbit may itself undertake these steps without the need to communicate with the Qsic API.
- Figure 13 is a schematic showing the flow of AVA's learning from historic data to predict/recognise events.
- Figure 13 shows ambient noise 1301 being sent as a digital signal 1302 to the Qbit 1303 which records the microphone input for x seconds 1304.
- the number 'x' may be of any suitable value, preferably it is a number in the range of 5 and 60 and determines the length of the sample of audio to analyse. A larger number will give a greater likelihood of detecting change, but will be less responsive, while a smaller number may pick up too many changes. This number will preferably be tested on a venue by venue basis before being implemented.
- the recording is saved 1305 and an analysis is run on the recording 1306 of x seconds to determine features of the audio clip from the tone/frequency/pitch etc.
- These features/attributes are compared to previous recordings attribute's 1307 if no similar attributes are found the process continues from 1304. If a set of features/attributes for example 1308, the same features/attributes as the same time yesterday, the change is sent to the Qsic API 1309 which alerts other digital services of this change. These could be Qsic internal services, 1310 for example shows new content being queued and then sent to play in the store 1311. Where 1312 shows an external service being notified and in turn changing the digital advertising in the store 1313.
- Figure 14 is a representation of a microphone M1 detecting the direction of multiple points of noise with multiple speakers split across it to equally distribute volume to the audience in the room.
- M1 is responsible for collecting relevant noise and the noise's direction within the area defined by the radius encircled by circumference R1 which in turn controls the volumes of S1, S2 & S3.
- Noise collected from within R1 is processed as sound with a direction.
- M1 detects that more noise is coming from the direction of A3. And in turn raises the value of S2 with a higher intensity value to compensate for the greater amount of noise compared to S1 & S3.
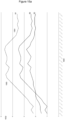
- Figure 15a and Figure 15b show 3 speakers S1, S2 & S3 adjusting their volumes 1502 over time 1501.
- a new RMS value 1506 is recorded and sent to each speaker S1, S2 & S3, which adjust their volumes accordingly.
- Figure 15b shows the RMS value passed to each speaker over time 1505.
- Figure 15b shows the ambient noise getting louder over time 1507 and then leveling out towards the end of the time period 1508.
- FIG 15a shows each speaker reacting to this change in ambience by raising its volume 1503 and decreasing it as the RMS values decrease 1504.
Landscapes
- Engineering & Computer Science (AREA)
- Physics & Mathematics (AREA)
- Acoustics & Sound (AREA)
- Signal Processing (AREA)
- Health & Medical Sciences (AREA)
- General Health & Medical Sciences (AREA)
- Otolaryngology (AREA)
- Multimedia (AREA)
- Circuit For Audible Band Transducer (AREA)
- Stereophonic System (AREA)
Description
- Many commercial sectors use sound equipment for example to play music throughout a space occupied by customers - for example a shop floor, a restaurant or a bar. The retail and hospitality sectors have long suffered from incorrect sound volume levels throughout trading periods. A major cause of this is that a large number of customers can come and go very quickly so that the number of people in a given space and the associated level of background noise can vary considerably. When this happens, staff need to recognise the change in conditions and adjust the sound volume accordingly. As staff are focused on servicing customers, this means that the volume is regularly set either too high or too low. Both scenarios are terrible for customer experience and can impact various parts of the sales process or dining experience.
- A major disadvantage felt by these markets, is that optimum performance of an audio solution requires high levels of staff monitoring and interaction, which is rarely possible or practical. Therefore, audio solutions in general deliver poor results when left to their own devices.
- Systems for managing sound emitting devices are known form patent documents
US 7 110 558 B1 ,US 5 666 426 A ,US 2015/281864 A1 ,US 6 584 201 B1 ,US 2016/309277 A1 ,WO 2016/079513 A1 ,US 2016/149547 A1 . The customization of audio content based on demographic criteria is known fromUS 2012/135684 A1 . - The reference to any prior art in this specification is not, and should not be taken as, an acknowledgement or any form of suggestion that the prior art forms part of the common general knowledge.
- The system and method of the invention, also referred to herein as `Autonomous Volume Adjustment', or 'AVA' has been developed to ameliorate the problems of the prior art. AVA is an always on, autonomous algorithm which monitors noise levels inside a given area and makes multiple adjustments or sends notifications to speakers, IoT devices, digital services, APIs and other connected devices. AVA matches the listening conditions in store/venue with the appropriate playback settings (volume, treble, bass, frequency and other settings/filters) in near real time. AVA also assists in making content selection adjustments and may send/receive other notifications based on audio input device (such as a microphone) measurements which it has linked to in store behaviours/patterns over time.
- The scope of the invention is set out in
claim 1. - Throughout this specification (including any claims which follow), unless the context requires otherwise, the word 'comprise', and variations such as 'comprises' and 'comprising', will be understood to imply the inclusion of a stated integer or step or group of integers or steps but not the exclusion of any other integer or step or group of integers or steps.
-
-
Figure 1 is a schematic representation of a speaker and ambient noise point sending sound to a Microphone and Qbit which controls the speakers volumes. -
Figure 2 is a schematic representation of multiple speakers and ambient noise point sending sound to a Microphone and Qbit which controls the speakers volumes. -
Figure 3 is a schematic representation of multiple speakers and multiple ambient noise points sending sound to a Microphone and Qbit which controls the speakers volumes. -
Figure 4 is a schematic representation of multiple speakers and multiple ambient noise points sending sound to multiple Microphones and single Qbit. -
Figure 5a is a schematic representation of how speakers react to ambient noise increases. -
Figure 5b is a representation of how speakers react to ambient noise decreases. - Figure 5c is a representation of how speakers react to ambient noise increases when ambient noise is closer to the Decibel Reader.
-
Figure 6 : is a schematic describing the way speakers are updated via the algorithm on a control device. -
Figure 7 : is a schematic describing one method for system calibration. -
Figure 8 : is a graph showing how the ideal speaker volume is plotted against the Microphones input values as Root Mean Square (RMS) and volume . -
Figure 9 : is a schematic showing an example control device (referred to herein as Qbit) as the point of control. -
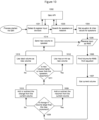
Figure 10 : is a schematic showing the overall process and decision flow from initialisation through to looping through the algorithm that determines the speakers new volume. -
Figure 11 : is a representation of how AVA detects differences in pitch/tone from ambient noise and other sound factors and then alerts other digital services, IoT devices, etc. -
Figure 12 : is a schematic showing the flow/feedback loop for when AVA detects differences in pitch/tone etc, from ambient noise and passing this data to services, IoT devices, etc. in accordance with the invention. -
Figure 13 : is a schematic showing the flow of AVA's learning from historic data to predict/recognise events in accordance with the invention. -
Figure 14 is a schematic representation of multiple speakers and multiple ambient noise points sending sound to a Microphone and Qbit which controls the speakers volumes based on the direction of sound into the Microphone. -
Figure 15a : is a graph showing the volumes of 3 speakers changing over time in response to the RMS values of the recorded ambient noise as shown byFigure 15b . - It is convenient to describe the invention herein in relation to particularly preferred embodiments referred to in at least partially as AVA as an example implementation by Qsic and incorporating an example controller referred to herein from time to time as the Qbit. In these example embodiments, the Qsic API is used to refer to an Application Programming Interface housed on one or more computing devices which are in communication with the controller. In some preferred embodiments, the Qsic API is remote and may for example be accessed via the internet or another network or communications link. However, the invention is applicable to a wide range of implementations and it is to be appreciated that other constructions and arrangements are also considered as falling within the scope of the invention. Various modifications, alterations, variations and or additions to the construction and arrangements described herein are also considered as falling within the ambit and scope of the present invention.
- AVA is an improvement over simple flat level decibel based volume adjustments on groups of speakers. In some implementations AVA uses multiple microphones to identify the location of noise and the levels of noise at those locations, then algorithmically adjusts the individual speakers based on each speaker's proximity to the microphone and the speakers ideal volume against an aggregated input value. This is all done in real-time and on a one to one basis for each individual speaker and the origin of the noise.
- In some implementations, AVA uses network/internet enabled speakers, this means that far more than just volume may be being controlled. Other levels of adjustment might for example include, but are not limited to: perceived loudness (individual frequencies) when listening at low volumes, sound morphing, speech clarity, Bass, Treble, Balance and anything else a speaker (preferably an intelligent speaker) can be used to control. In some comparative, not claimed examples the system of the invention may adjust one or more characteristics of queued or live content to fit the environment and circumstances at hand. In some comparative, not claimed examples, the system may for example tailor content to the current audience by normalising or setting levels in content prior to playing. This may for example be done when the content is loaded into the system of the invention so that it is ready for any future use, or a set time before it is scheduled to be played, or at any other suitable time. Such tailoring of content may in some comparative, not claimed examples be temporary - for example only for the purpose of playing at that venue at that time, or it may be more longstanding, for example for a particular venue or audience, etc irrespective of when it is played.
- In some comparative, not claimed examples, the system and method of the invention also comprises a learning algorithm. In such implementations, over time AVA, utilising the Qsic API and infrastructure, will learn how different store/venue purchasing conditions sound and can make adjustments based on that. This includes, but not limited to; content adjustment, triggering in-store promotions, notifying in real time other digital services about upcoming changes in the in-store/venue environment and sentiment analysis.
- An important element of the invention is the sensing of information in the managed environment and feedback of that information to a processor which makes adjustments accordingly. In the embodiment, this comprises a microphone. In some comparative, not claimed examples, a configuration algorithm may be run, which for example may assess and set minimum and maximum parameters (for example volume level) the speakers can be set to. Preferably such configuration is undertaken under specific room conditions.
Figure 7 is a schematic showing one example configuration algorithm. - As the room becomes louder (for example, through more people entering, talking more loudly, machines being switched on) the system can adjust the speakers (which may be intelligent speakers) so that the music is always at an audible level. By doing this the sound reading that is recorded by the microphone will for example increase with increasing background noise.
- When calibrating a system, each speaker's volume (measured as a 0-100 percentage) is recorded against a specific microphone reading which represents an ambient level in the space, which might be for example a venue room. In some comparative, not claimed examples, speakers volumes may not be recorded as a percentage, but some other measure, for example the unit relative to the speaker manufactures specification. This serves as the basis for the equation of the speaker that will be used to find its ideal volume at any point in time. Multiple readings are preferably carried out as there is a high point and a low point in the ambient noise. The more of such recordings that are undertaken, the more information the controller will have in order to create the equation needed to adjust each speaker's volume levels.
- Once sufficient data points have been obtained, the system can algorithmically create an equation to describe the relationship and create a graph of each speaker's volume vs the overall microphone reading. This allows the speakers to be adjusted by a controller such as the Qbit in response to varying noise levels as detected by the sensor (such as a microphone).
- In some comparative, not claimed examples, the way each speaker is controlled is tied to the application on a device comprising a processor on a network, for example a Local Area Network (LAN), which is preferably located within the venue to provide as 'real-time' adjustments as possible.
- In one example algorithm, the formula that has been prepared according to the process set out above allows the system to monitor each speaker to run the equation every x seconds which determines how often each speaker is updated with a new volume. In some comparative, not claimed examples, x is a number in the range of 1 and 10, but it may also be larger or smaller as practically required for each implementation. For systems that need speakers to be updated more often a lower number should be favoured. The formula that is generated for each speaker may for example be dependant on the power output (for example, peak data input, decibel level, RMS values) vs the volume of the speaker.
- In other example implementations, another characteristic is measured and used to adjust operation of a speaker. For example, "perceived loudness", may be used, for example by applying an approximate logarithmic relationship filter to the raw data to modify the Power. Other characteristics which may be measured for the purpose of determining the relationship to use to adjust operation of a speaker, might for example comprise equal loudness contours or decibels.
- An example of RMS is a set of "data frames", where data frames is a section of data streamed into the Qbit from the microphone, which are passed into the rms formula which can generally be expressed as. This gives us the average 'power' of the data stream over a period of time.

- RMS values are a way of referring to a speaker's power which is averaged over time. Since the power of an alternating current waveform supplying a speaker varies over time, audio power is typically measured as an average over time. An approximation of this can be obtained by making the assumption that it is a purely resistive load and using the root mean square (RMS) values of the voltage and current waveforms. An example formula according to this method is:

- Where P = power, V = voltage and I = current.
- In order to identify a new, adjusted speaker volume, a computing device, such as a Qbit, creates a formula for that speaker. It first receives an array of pre recorded RMS and Volumes which are used to create a vector of coefficients and least squares polynomial fit.
- As a general example Curve Fitting is used to create a polynomial which gives the ability to evaluate the a volume when an RMS value is passed in. As a basic example Volume = x^2 + 2x +b, where x is RMS.
- As a further example, using Python, to fit a polynomial p(x) = p[0] * x**deg + ... + p[deg] of degree deg to points (x, y). The following returns a vector of coefficients p that minimises the squared error.
-
- x : array_like, shape (M,)
- x-coordinates of the M sample points (x[i], y[i]).
- y : array_like, shape (M,) or (M, K)
- y-coordinates of the sample points. Several data sets of sample points sharing the same x-coordinates can be fitted at once by passing in a 2D-array that contains one dataset per column.
- deg : int
- Degree of the fitting polynomial
- rcond : float, optional
- Relative condition number of the fit. Singular values smaller than this relative to the largest singular value will be ignored. The default value is len(x)*eps, where eps is the relative precision of the float type, about 2e-16 in most cases.
full : bool, optional - Switch determining nature of return value. When it is False (the default) just the coefficients are returned, when True diagnostic information from the singular value decomposition is also returned.
w : array_like, shape (M,), optional - Weights to apply to the y-coordinates of the sample points. For gaussian uncertainties,
use 1/sigma (not 1/sigma**2).
cov : bool, optional - Return the estimate and the covariance matrix of the estimate If full is True, then cov is not returned.
- Polynomial coefficients, highest power first. If y was 2-D, the coefficients for k-th data set are in p[:,k].
- Present only if full = True. Residuals of the least-squares fit, the effective rank of the scaled Vandermonde coefficient matrix, its singular values, and the specified value of rcond. For more details, see linalg.lstsq.
- Present only if full = False and cov'=True. The covariance matrix of the polynomial coefficient estimates. The diagonal of this matrix are the variance estimates for each coefficient. If y is a 2-D array, then the covariance matrix for the 'k-th data set are in V[:,:,k]
- The solution minimizes the squared error


- The coefficient matrix of the coefficients p is a Vandermonde matrix.
- This can then be used to identify (for example from a lookup table) a speaker's new volume to match any RMS value.
- In layman's terms, a speaker will have an ideal volume vs a specific RMS value. The algorithm will make an adjustment to a speaker's volume to attempt to get it closer to its ideal value. This adjustment has parameters such as the maximum increase amount (to stop large sudden jumps in volume), maximum and minimum volume levels (which determine the speakers working range), how often each reading should be taken and how often each adjustment should be made.
- In practice, in some comparative, not claimed examples, the Qbit will obtain an RMS value for a period of time, x seconds (wherein x seconds is as defined above) from the microphone and will hold that value until it gets the next one. The process controlling each speaker on the Qbit will request or be sent that value from the process managing the microphone input at separate intervals allowing it to make its own adjustments accordingly. Thus creating the autonomous volume adjustment.
- The following key explains the various components used in each figure.
- M : Microphone. Input
- R : Radius of the Microphone (M) circumference of input
- S: Speaker.
- A : Ambient Noise origin
- Q: Qbit device
- API: Qsic API. (Application Programming Interface)
- DS: Digital Service.
-
Figure 1 is a schematic representation of a single point of Noise origin to a single speaker. InFigure 1 a Microphone M1 which can detect sound within the region of radius from M1 denoted by circumference R1, receives sound input from speaker S1 and noise origin A1. The combined volume of the sound emanating from A1 and S1 will decrease as it travels to M1 where it is converted to an electrical signal and sent to the Qbit Q1 which receives the signal, recognises it as associated with microphone M1 and therefore speaker S1 and runs an algorithm associated with speaker S1, generating an output and sends a signal to speaker S1 to adjust the speaker volume S1. -
Figure 2 is a schematic representation of a single point of noise origin to multiple speakers. Microphone M1 which can detect sound within the region of radius from M1 within circumference R1, receives a combined sound input from speakers S1 and S2 along with ambient sound from A1. The combined volume of the sound emanating from A1 as well as S1 & S2 will decrease as it travels to M1 where it is then converted to an electrical signal and sent to the Qbit Q1 which recognises the signal as associated with microphone M1 and therefore speakers S1 and S2, runs one or more algorithms associated with one or more of speakers S1 and S2, generating one or more outputs and sends a signal to one or both of speakers S1 and S2 to adjust operation of speakers S1 & S2 accordingly. -
Figure 3 is a representation of multiple points of noise to multiple speakers. Microphone M1 which can detect sound within the region of radius denoted by circumferences R1, receives a combined sound input from speakers S1 and S2 along with ambient sound from A1, A2, A3 and A4. The combined volume of the sound emanating from A1, A2, A3 & A4 as well as S1 & S2 will decrease as it travels to M1 where it is then converted to an electrical signal and sent to the Qbit Q1 which recognises the signal as associated with microphone M1 and therefore speakers S1 and S2, runs one or more algorithms associated with one or more of speakers S1 and S2, generating one or more outputs and sends signal to one or both of speakers S1 and S2 to adjust operation of speakers S1 & S2 accordingly. -
Figure 4 is a representation of multiple points of noise with multiple speakers split across multiple microphones M1 & M2. M1 which can detect sound within the region of radius denoted by circumferences R1 and will receive a combined sound input from speakers S1 and S2 along with ambient sound from A1, A2, A3 and A4. The combined volume of the sound emanating from A1, A2, A3 and A4 as well as S1 and S2 will decrease as it travels to M1 where it is then converted to an electrical signal and sent to the Qbit Q1 which recognises the signal as associated with microphone M1 and therefore speakers S1 and S2. The Qbit then runs one or more algorithms associated with one or more of speakers S1 and S2, generating one or more outputs and sends signal to one or both of speakers S1 and S2 to adjust operation of speakers S1 and S2 accordingly. - Staying with
Figure 4 , M2 which can detect sound within the region of radius denoted by circumferences R2 will receive a combined sound input from speakers S3 and S4 along with ambient sound from A2 and A5. The combined volume of the sound emanating from A2 and A5 as well as S3 and S4 will decrease as it travels to M2 where it is then converted to an electrical signal and sent to the Qbit Q1 which recognises the signal as associated with microphone M2 and therefore speakers S4 and S5. The Qbit then runs one or more algorithms associated with one or more of speakers S4 and S5, generating one or more outputs and sends signal to one or both of speakers S4 and S5 to adjust operation of speakers S4 and S5 accordingly. In the case of A2, sound would be contributed to both Microphones as it impacts on both regions as defined by R1 and R2. M1 and M2 make no distinction between A2 and treat it as their own source as it falls in both M1 and M2's radius. -
Figure 5a shows Microphone M1 which can detect sound from speakers S1, S2 as well as ambient sounds from A1. On detecting sound, M1 sends microphone signal to Qbit Q1 which adjusts the volumes of S1 & S2 based on the combined ambient noise of the environment. The combined volume of the sound emanating from A1 as well as S1 & S2 will decrease as it travels to M1 where it is then converted to an electrical signal and sent to the Qbit Q1 which recognises the signal as associated with microphone M1 and therefore speakers S1 and S2, runs one or more algorithms associated with one or more of speakers S1 and S2, generating one or more outputs and sends a signal to one or both of speakers S1 and S2 to adjust operation of speakers S1 & S2 accordingly. -
Figure 5b is a representation of how speakers react to ambient noise decreases.Figure 5b shows Microphone M1 which can detect sound from speakers S1, S2 as well as ambient sounds from A1, sends input to a Qbit Q1 which modifies the volumes of S1 & S2 based on the combined ambient noise of the environment. In this instance A1 has been reduced to show S1 & S2 with lower volumes. -
Figure 6 : Is a schematic describing the way speakers are updated via the algorithm on a control device (Qbit). The Qbit detects and registers 601 one or more input devices (audio input, such as a microphone) which may be a peripheral device or embedded/built into the Qbit device and sends a request to the Qsic API (Application Programming Interface) 602 to get the configuration for the particular audio device that has been added to the system. The API returns the configuration for the input device and loads the configuration. The Qbit searches the local network for speakers that have been previously configured 603 using the calibration method described inFigure 7 and sends further requests to theQsic API 602 to retrieve the calibration details for each speaker. This calibration will contain enough information to describe the relevant relationship and so make up the graph or equation described inFigure 8 . The Qbit will load the configuration and setup each speaker to be controlled via the identifiedalgorithm 604. - Staying on
Figure 6 , the process has now been initialised and the microphone is now actively sending aDigital Signal 605 to the Qbit which processes the digital signal as a stream of data 606 and saves it every x seconds, (where x may be any suitable number but is preferably a number in the range of 1 and 10), which determines how often each speaker is updated with a new volume. For systems that need speakers to be updated more often a lower number should be favoured. 607 so it can take a recording of the signal over time (x) 608 and create an average which can then be converted to anRMS value 609. With the RMS value the Qbit sends this to each sub-process 609 that is monitoring a speaker (such as a smart speaker) which in turn sends the volume adjustment instruction to the speaker to make an adjustment to its volume. As used herein, sub-process refers to a computer implemented task or routine or method which operates within a broader one. So in this example, it refers to a computer implemented method which monitors a predefined speaker by waiting for data relevant to the speaker to be transferred to it and responding accordingly (in this example, by sending an instruction relating to a volume adjustment to the speaker).Figure 7 : is a schematic describing one example method for system calibration. Starting at 700 the system is set up when a room or venue has its lowest sound ambience - depending on the levels of outside noise, this may have to be in the middle of the night or another appropriate time. All speakers linked to the input device to be at theirideal volume 701 for when a room has little ambient sound, all speakers linked to the input device will have their minimum working range set to this volume. This minimum working range will mean the speaker cannot go below this volume, as seen inFigure 10 - 1011. The microphone records the ambient sound in theroom 702 for x seconds, and theinput stream 703 is averaged to then work out the RMS over theset timeframe 704. The number x can be any suitable value, typically it is in the range of 1 and 10. It determines how often each speaker is updated with a new volume. For systems that need speakers to be updated more often a lower number should be favoured. For each speaker the Qbit saves the RMS against the volume of the speaker 706. The ambient sound level is then increased for example by either waiting for more people to enter a venue or by simulating increasing ambience 706. In some comparative, not claimed examples, an increase in ambient sound (for example in a series of steps) is machine generated as part of a pre-programed calibration sequence. Once the ambience has increased the process flow can start again from 701. This process can repeat until a maximum ambience is reached, it has been found that in general it is preferable that a minimum of 4 data points are gathered to make a prediction using the polynomial equation described above. The more data points recorded the more accurate the prediction will be. Once a maximum ambience is reached all speakers linked to the input device will have their maximum working range set to this volume. This maximum working range will mean the speaker cannot go above this volume, as seen inFigure 10 - 1011. With the minimum and maximum volumes configured we have a working range of figures for each speaker. -
Figure 8 : Is a graph showing an example resulting polynomial from the process described inFigure 7 . This shows how the new volume (y-axis) 802 is selected against the inputs average power output as Root Mean Square (RMS) (x-axis) 801 and volume. InFigure 8 we can see how 2 speakers S1 & S2 have been calibrated by thepoints 803 on the graph to make up a polynomial formula which describes a curve which fits the data values from the previous explained calibration procedure inFigure 7 . - When a new RMS value is calculated on the Qbit, the Qbit uses that value to figure out what volume it should attempt to get for a particular speaker. For example referring to
Figure 8 , if the RMS of the input device was 750 then S2 would attempt to get as close to 26 as possible. S1 would try to get to 41. -
Figure 9 : Is a schematic showing an example control device (referred to herein as Qbit) as the point of control. In this schematic F.910 represents the internal workings/algorithm on the Qbit while outside this box represents physical hardware and communications / connections with it. -
Figure 9 shows theQbit 901 as the control device receiving adigital signal 902 from an input device (such as a microphone or decibel reader) 903. The signal may optionally be continuous or it may be periodic, for example set at a particular frequency. TheQbit 901, stores this digital signal and after x seconds, (where x may be any suitable number but is preferably a number in the range of 1 and 10), which determines how often each speaker is updated with a new volume. TheQbit 901 processes thedigital signal 904 to produce a power variable, for example an averaged RMS over the period of time. TheQbit 901 after receiving the current volumes 909 of the speakers starts the process of comparing the power variable (here an averaged RMS) to the corresponding volume for each speaker 905 which has been configured using the process described inFigure 7 . Once a new volume has been found for aspeaker 906 based on the input, avolume adjustment 907 is sent to thespeaker 908. -
Figure 10 is an overview of an example process from the most top level and includes a flow of the decisions used to make adjustments to the speakers.Figure 10 shows, starting at 1001 the Qbit detects andregisters 1001 one or more input devices (such as a microphone) which may be a peripheral device or embedded/built into the Qbit and sends a request to the Qsic API (Application Programming Interface) 1002 to obtain the configuration for the particular audio device that is attached, the API returns the configuration for the input device and the configuration is loaded onto the Qbit. The Qbit searches the local network for speakers (such as smart or intelligent speakers) that have been previously configured 1003 using the calibration method described inFigure 7 and sends further requests to theQsic API 1002 to retrieve the calibration details for each speaker. This calibration will contain enough information to identify the relevant relationship and make up the graph or equation described inFigure 8 . The Qbit will load the configuration and setup each speaker to be controlled via the AVA algorithm 1004. - The process has now been initialised and the sub-process controlling the speaker on the Qbit is now receiving an
RMS value 1005 from the sub-process controlling the microphone input every x seconds, where x is a number in the range of 1 and 10, which determines how often each speaker is updated with a new volume. For systems that need speakers to be updated more often a lower number should be favoured. - The Qbit looks up the ideal volume for each speaker based on the
RMS input 1005 using the equation that was set in 1004 and obtains the speaker'scurrent volume 1007. - The Qbit now has 3 variables stored for each speaker. An ideal volume, the current volume and the current RMS. The Qbit will process the speaker's current volume and ideal volume to identify whether any difference is larger than a preset
maximum increment setting 1008. If it is larger, the Qbit saves the new volume as the current volume plus or minus (depending on if the new volume is higher or lower than the current volume) the maximum allowed increment for that speaker 1009. If the change is not larger than the maximum increment the Qbit either adds or subtracts the change from the current volume (depending on if the new volume is higher or lower than the current volume) to get the new volume for the speaker 1010. - The maximum increment may be set in any suitable manner. In some implementations, it is done manually by a user, for example based on the venue characteristics, and for example after or during the calibration process. In some comparative, not claimed examples, the maximum increment is computationally arrived at based on data processed at the venue/location of interest - for example data collected during a calibration process such as the one described herein.
- For each speaker the Qbit holds a range that the speaker should operate in, which is defined by the maximum and minimum volume for each speaker during the configuration as per
Figure 7 . This is to stop the volume getting too loud or too soft. The Qbit checks to see if the new volume for the speaker is higher or lower than the configured minimum ormaximum volume 1011. If the new ideal volume is higher or lower than the configured maximum/minimum then the Qbit sets the ideal volume to be equal to the configured maximum/minimum of thespeaker 1012. If the new volume is not higher or lower than the speakers maximum/minimum configured volume then the Qbit sets the ideal volume to be the passed inideal value 1013. The Qbit then sends the new ideal volume to the speaker to set itsown volume 1014. - For example if a speaker had a minimum allowed volume of 32 and maximum allowed volume of 66, its current volume was set to 50 the maximum increment was 3 and its ideal volume after running the
RMS lookup 1006 was 56: 1008 would return Yes as the new volume is larger than the maximum increment allowed. 1009 would return 53 since the maximum increment is 3 and the current volume is set at 50. 1011 would return No since 53 is less than the speakers maximum allowed volume of 66. 1012 would pass 53 to 1014 and the speaker would set its new volume to be 53. - As a second example, if a speaker has a minimum allowed volume of 28 and a maximum allowed volume of 40, its current volume was set to 35, the maximum increment is 3 and its ideal volume after running the
RMS lookup 1006 is 37: 1008 would return No as the new volume is not larger than the maximum increment allowed. 1010 would return would return 37 since the change in volume would only be is 2. 1011 would return No since the new volume (37) is lower maximum allowed volume (40). 1013 would pass 37 to 1014 and the speaker would set its new volume to be 37. -
Figure 11 is a representation of a Microphone detecting a tonal/pitch change in the ambient noise and altering content on a digital service or screen.Figure 11 shows a group of children A2, becoming the source of the majority of noise raising the tone/pitch/frequency input to microphone M1. M1 sends a digital signal to the Qbit Q1 which determines more children have entered the venue by analysing the attributes such as frequency, tone and pitch of the digital signal from M1. Q1 send this notification to the Qsic API QA1. Which notifies other digital services DS1 such as advertising, digital signage, etc. In some comparative, not claimed examples, the controller (such as a Qbit) is on site at the venue and can process such information without the need to communicate with the Qsic API. For example, the Qbit may identify one or more preset outputs based on the identified changes in attributes, such as frequency, tone and pitch, etc. Such an output may for example comprise a signal to a content controller to alter content which is played through one or more speakers, or displayed on one or more screens to match one or more characteristics of the altered audience A2. In some comparative, not claimed examples, the Qbit may further comprise a controller to control such content. -
Figure 12 : is a flowchart showing the flow/feedback loop for when AVA detects differences in attributes from the ambient noise, passing this detection to the Qsic API and onto subscribed services.Figure 12 showsambient sound 1201 being sent as a digital signal 1202 to theQbit 1203 which records the microphone input forx seconds 1204. The number 'x' may be of any suitable value, preferably it is a number in the range of 5 and 60 and determines the length of the sample of audio to analyse. A larger number will give a greater likelihood of detecting change, but will be less responsive, while a smaller number may pick up too many changes. This number will preferably be tested on a venue by venue basis before being implemented. The recording is saved 1205 and an analysis is run on therecording 1206 of x seconds to determine features of the audio clip from the tone/frequency/pitch etc. These features/attributes are compared to the previous recordings attribute's 1207 if a large enough difference is not found in the attribute changes the process continues from 1204. If a large enough change in features/attributes for example 1208, the average frequency has gone up and we have detected more children in the analysed sound, the change is sent to theQsic API 1209 which alerts other digital services of this change. These could be Qsic internal services, 1210 for example shows new content being queued and then sent to play in the store 1211. Where 1212 shows an external service being notified and in turn changing the digital advertising in thestore 1213. Again, in some comparative, not claimed examples, the Qbit may itself undertake these steps without the need to communicate with the Qsic API. -
Figure 13 : is a schematic showing the flow of AVA's learning from historic data to predict/recognise events.Figure 13 showsambient noise 1301 being sent as adigital signal 1302 to theQbit 1303 which records the microphone input forx seconds 1304. The number 'x' may be of any suitable value, preferably it is a number in the range of 5 and 60 and determines the length of the sample of audio to analyse. A larger number will give a greater likelihood of detecting change, but will be less responsive, while a smaller number may pick up too many changes. This number will preferably be tested on a venue by venue basis before being implemented. The recording is saved 1305 and an analysis is run on therecording 1306 of x seconds to determine features of the audio clip from the tone/frequency/pitch etc. These features/attributes are compared to previous recordings attribute's 1307 if no similar attributes are found the process continues from 1304. If a set of features/attributes for example 1308, the same features/attributes as the same time yesterday, the change is sent to theQsic API 1309 which alerts other digital services of this change. These could be Qsic internal services, 1310 for example shows new content being queued and then sent to play in thestore 1311. Where 1312 shows an external service being notified and in turn changing the digital advertising in thestore 1313. -
Figure 14 is a representation of a microphone M1 detecting the direction of multiple points of noise with multiple speakers split across it to equally distribute volume to the audience in the room. M1 is responsible for collecting relevant noise and the noise's direction within the area defined by the radius encircled by circumference R1 which in turn controls the volumes of S1, S2 & S3. Noise collected from within R1 is processed as sound with a direction. In this example, M1, detects that more noise is coming from the direction of A3. And in turn raises the value of S2 with a higher intensity value to compensate for the greater amount of noise compared to S1 & S3. -
Figure 15a andFigure 15b show 3 speakers S1, S2 & S3 adjusting theirvolumes 1502 overtime 1501. As seen inFigure 15b anew RMS value 1506 is recorded and sent to each speaker S1, S2 & S3, which adjust their volumes accordingly.Figure 15b shows the RMS value passed to each speaker overtime 1505.Figure 15b shows the ambient noise getting louder overtime 1507 and then leveling out towards the end of thetime period 1508. In response to thisFigure 15a shows each speaker reacting to this change in ambience by raising itsvolume 1503 and decreasing it as the RMS values decrease 1504.
Claims (3)
- A method of managing a sound emitting device adapted to play an audio content comprisingdetecting ambient sound at a microphone;converting the ambient sound to a digital signal;recording the digital signal for a period which is optionally 5 to 60 seconds;storing data associated with the digital signal recorded during said period in a data store;analysing the stored data to determine an average frequency of the ambient sound during said period;comparing the determined average frequency to average frequency determined from a previous set of stored data to identify a difference;identifying an input adjustment correlated with the identified difference; andcommunicating the input adjustment to the sound emitting device to adjust audio content by replacing queued tracks with targeted demographic based content, in response to an overall increase or decrease in average frequency of the ambient sound during the period.
- A method as claimed in claim 1, wherein the demographic basis of the content is gender.
- A method as claimed in claim 1, wherein the demographic basis of the content is age.
Applications Claiming Priority (2)
| Application Number | Priority Date | Filing Date | Title |
|---|---|---|---|
| AU2016905143A AU2016905143A0 (en) | 2016-12-13 | Autonomous Volume Adjustment | |
| PCT/AU2017/051378 WO2018107223A1 (en) | 2016-12-13 | 2017-12-13 | Sound management method and system |
Publications (3)
| Publication Number | Publication Date |
|---|---|
| EP3556013A1 EP3556013A1 (en) | 2019-10-23 |
| EP3556013A4 EP3556013A4 (en) | 2020-03-25 |
| EP3556013B1 true EP3556013B1 (en) | 2024-09-11 |
Family
ID=62557673
Family Applications (1)
| Application Number | Title | Priority Date | Filing Date |
|---|---|---|---|
| EP17881345.7A Active EP3556013B1 (en) | 2016-12-13 | 2017-12-13 | Sound management method and system |
Country Status (7)
| Country | Link |
|---|---|
| US (2) | US11388533B2 (en) |
| EP (1) | EP3556013B1 (en) |
| JP (1) | JP7252893B2 (en) |
| AU (2) | AU2017377656B2 (en) |
| CA (1) | CA3044079C (en) |
| SG (1) | SG10202106125YA (en) |
| WO (1) | WO2018107223A1 (en) |
Families Citing this family (3)
| Publication number | Priority date | Publication date | Assignee | Title |
|---|---|---|---|---|
| US11409495B2 (en) | 2020-01-03 | 2022-08-09 | Sonos, Inc. | Audio conflict resolution |
| US11930328B2 (en) * | 2021-03-08 | 2024-03-12 | Sonos, Inc. | Operation modes, audio layering, and dedicated controls for targeted audio experiences |
| US12587799B2 (en) | 2023-09-26 | 2026-03-24 | International Business Machines Corporation | Smart noise pollution reduction of Bluetooth based devices |
Citations (1)
| Publication number | Priority date | Publication date | Assignee | Title |
|---|---|---|---|---|
| US20120135684A1 (en) * | 2010-11-30 | 2012-05-31 | Cox Communications, Inc. | Systems and methods for customizing broadband content based upon passive presence detection of users |
Family Cites Families (41)
| Publication number | Priority date | Publication date | Assignee | Title |
|---|---|---|---|---|
| US5664020A (en) | 1994-01-18 | 1997-09-02 | Bsg Laboratories | Compact full-range loudspeaker system |
| US5666426A (en) * | 1996-10-17 | 1997-09-09 | Advanced Micro Devices, Inc. | Automatic volume control to compensate for ambient noise variations |
| JPH10170928A (en) | 1996-12-13 | 1998-06-26 | Sekisui Chem Co Ltd | Manufacturing method of liquid crystal display element |
| US6088461A (en) | 1997-09-26 | 2000-07-11 | Crystal Semiconductor Corporation | Dynamic volume control system |
| US6389139B1 (en) | 1997-11-18 | 2002-05-14 | Dana Innovations | Powered volume control for distributed audio system |
| JP2000010571A (en) | 1998-06-18 | 2000-01-14 | Ricoh Co Ltd | Performance device management system and performance device |
| US6584201B1 (en) | 1998-07-07 | 2003-06-24 | Lucent Technologies Inc. | Remote automatic volume control apparatus |
| HK1049927B (en) | 1999-03-30 | 2005-05-13 | 高通股份有限公司 | Method and apparatus for automatically adjusting speaker and microphone gains within a mobile telephone |
| US6360187B1 (en) * | 1999-06-28 | 2002-03-19 | Ford Global Technologies, Inc. | Ambient adjusted volume control for in-vehicles messages |
| US6520282B1 (en) | 2000-10-24 | 2003-02-18 | Nysora, Inc. | Sound enhancement mechanism for speaker sound system |
| US7110558B1 (en) * | 2000-10-30 | 2006-09-19 | Verizon Corporate Services Group Inc. | Systems and methods for automatically adjusting the volume of an audio source |
| EP1251355B1 (en) | 2001-04-18 | 2007-12-05 | Gennum Corporation | Digital quasi-rms detector |
| US7853341B2 (en) | 2002-01-25 | 2010-12-14 | Ksc Industries, Inc. | Wired, wireless, infrared, and powerline audio entertainment systems |
| JP2003264888A (en) | 2002-03-07 | 2003-09-19 | Pioneer Electronic Corp | Speaker controller and speaker system |
| US7333618B2 (en) * | 2003-09-24 | 2008-02-19 | Harman International Industries, Incorporated | Ambient noise sound level compensation |
| CA2581810C (en) * | 2004-10-26 | 2013-12-17 | Dolby Laboratories Licensing Corporation | Calculating and adjusting the perceived loudness and/or the perceived spectral balance of an audio signal |
| US7210633B2 (en) | 2004-11-19 | 2007-05-01 | Intermec Ip Corp. | Self-compensating speaker volume control system for data collection terminal |
| KR100703703B1 (en) | 2005-08-12 | 2007-04-06 | 삼성전자주식회사 | Sound input / output expansion method and device |
| MY151910A (en) | 2006-05-22 | 2014-07-31 | Audio Pixels Holdings Ltd | Volume and tone control in direct digital speakers |
| US20070274531A1 (en) | 2006-05-24 | 2007-11-29 | Sony Ericsson Mobile Communications Ab | Sound pressure monitor |
| US7742746B2 (en) | 2007-04-30 | 2010-06-22 | Qualcomm Incorporated | Automatic volume and dynamic range adjustment for mobile audio devices |
| JP5003419B2 (en) | 2007-11-09 | 2012-08-15 | ヤマハ株式会社 | Sound processing apparatus and program |
| US20090123004A1 (en) | 2007-11-14 | 2009-05-14 | Jonathan Otto | Method and system for automated volume adjustments for a marketing system |
| WO2009086174A1 (en) * | 2007-12-21 | 2009-07-09 | Srs Labs, Inc. | System for adjusting perceived loudness of audio signals |
| JP5203774B2 (en) | 2008-03-31 | 2013-06-05 | 株式会社第一興商 | Karaoke microphone usage status notification system |
| US8682002B2 (en) * | 2009-07-02 | 2014-03-25 | Conexant Systems, Inc. | Systems and methods for transducer calibration and tuning |
| JP5437129B2 (en) | 2010-03-21 | 2014-03-12 | スタンレー電気株式会社 | Light source device and lighting device |
| US8457321B2 (en) | 2010-06-10 | 2013-06-04 | Nxp B.V. | Adaptive audio output |
| US10496714B2 (en) * | 2010-08-06 | 2019-12-03 | Google Llc | State-dependent query response |
| US20130028443A1 (en) * | 2011-07-28 | 2013-01-31 | Apple Inc. | Devices with enhanced audio |
| JP2013062609A (en) | 2011-09-12 | 2013-04-04 | Yawata Electric Industrial Co Ltd | Broadcast sound volume controller and sound volume control method of the same |
| US9431980B2 (en) * | 2012-01-30 | 2016-08-30 | Echostar Ukraine Llc | Apparatus, systems and methods for adjusting output audio volume based on user location |
| US9685921B2 (en) * | 2012-07-12 | 2017-06-20 | Dts, Inc. | Loudness control with noise detection and loudness drop detection |
| JP2014093204A (en) | 2012-11-05 | 2014-05-19 | Sony Corp | Acoustic illumination device and program |
| US9319019B2 (en) * | 2013-02-11 | 2016-04-19 | Symphonic Audio Technologies Corp. | Method for augmenting a listening experience |
| US9615185B2 (en) * | 2014-03-25 | 2017-04-04 | Bose Corporation | Dynamic sound adjustment |
| US9462381B2 (en) | 2014-05-28 | 2016-10-04 | Apple Inc. | Intelligent dynamics processing |
| EP3220821B1 (en) * | 2014-11-18 | 2021-11-03 | Limitear Limited | Portable programmable device, system, method and computer program product |
| US20160149547A1 (en) | 2014-11-20 | 2016-05-26 | Intel Corporation | Automated audio adjustment |
| US20160309277A1 (en) * | 2015-04-14 | 2016-10-20 | Qualcomm Technologies International, Ltd. | Speaker alignment |
| JP6625383B2 (en) * | 2015-09-18 | 2019-12-25 | 株式会社ディーアンドエムホールディングス | Computer readable program, audio controller, and wireless audio system |
-
2017
- 2017-12-13 US US16/468,155 patent/US11388533B2/en active Active
- 2017-12-13 CA CA3044079A patent/CA3044079C/en active Active
- 2017-12-13 WO PCT/AU2017/051378 patent/WO2018107223A1/en not_active Ceased
- 2017-12-13 JP JP2019529178A patent/JP7252893B2/en active Active
- 2017-12-13 EP EP17881345.7A patent/EP3556013B1/en active Active
- 2017-12-13 AU AU2017377656A patent/AU2017377656B2/en active Active
- 2017-12-13 SG SG10202106125YA patent/SG10202106125YA/en unknown
-
2022
- 2022-06-17 US US17/807,682 patent/US11743664B2/en active Active
- 2022-09-09 AU AU2022228169A patent/AU2022228169B2/en active Active
Patent Citations (1)
| Publication number | Priority date | Publication date | Assignee | Title |
|---|---|---|---|---|
| US20120135684A1 (en) * | 2010-11-30 | 2012-05-31 | Cox Communications, Inc. | Systems and methods for customizing broadband content based upon passive presence detection of users |
Also Published As
| Publication number | Publication date |
|---|---|
| CA3044079A1 (en) | 2018-06-21 |
| AU2022228169A1 (en) | 2022-10-06 |
| US11743664B2 (en) | 2023-08-29 |
| SG10202106125YA (en) | 2021-07-29 |
| JP2020502897A (en) | 2020-01-23 |
| EP3556013A1 (en) | 2019-10-23 |
| US20220386051A1 (en) | 2022-12-01 |
| NZ753440A (en) | 2024-09-27 |
| AU2022228169B2 (en) | 2023-11-23 |
| WO2018107223A1 (en) | 2018-06-21 |
| US20210021943A1 (en) | 2021-01-21 |
| AU2017377656B2 (en) | 2022-07-07 |
| US11388533B2 (en) | 2022-07-12 |
| JP7252893B2 (en) | 2023-04-05 |
| CA3044079C (en) | 2023-07-11 |
| EP3556013A4 (en) | 2020-03-25 |
| AU2017377656A1 (en) | 2019-05-30 |
Similar Documents
| Publication | Publication Date | Title |
|---|---|---|
| AU2022228169B2 (en) | Sound management method and system | |
| US12418270B2 (en) | Methods and systems for automatically equalizing audio output based on room position | |
| CN115803804B (en) | Managing features of active noise reduction | |
| CN106465025B (en) | Crowdsourcing for hearing-aid device is recommended | |
| US8059833B2 (en) | Method of compensating audio frequency response characteristics in real-time and a sound system using the same | |
| US6988068B2 (en) | Compensating for ambient noise levels in text-to-speech applications | |
| JP5830672B2 (en) | Hearing aid fitting device | |
| US12041424B2 (en) | Real-time adaptation of audio playback | |
| EP2453670A1 (en) | Control of a loudspeaker output | |
| US20200329330A1 (en) | Improvements in sound reproduction | |
| EP3468227B1 (en) | A system with a computing program and a server for hearing device service requests | |
| CN112832996B (en) | Method for controlling a water supply system | |
| CN105142067B (en) | Audio signal loudness control | |
| US20210275060A1 (en) | Systems and methods for user-dependent conditioning of stimuli in tests using a method of continuous adjustment | |
| JP6787957B2 (en) | Utterance control device, utterance control method, and utterance control program | |
| CN120877687A (en) | Audio playing method and system |
Legal Events
| Date | Code | Title | Description |
|---|---|---|---|
| STAA | Information on the status of an ep patent application or granted ep patent |
Free format text: STATUS: THE INTERNATIONAL PUBLICATION HAS BEEN MADE |
|
| PUAI | Public reference made under article 153(3) epc to a published international application that has entered the european phase |
Free format text: ORIGINAL CODE: 0009012 |
|
| STAA | Information on the status of an ep patent application or granted ep patent |
Free format text: STATUS: REQUEST FOR EXAMINATION WAS MADE |
|
| 17P | Request for examination filed |
Effective date: 20190515 |
|
| AK | Designated contracting states |
Kind code of ref document: A1 Designated state(s): AL AT BE BG CH CY CZ DE DK EE ES FI FR GB GR HR HU IE IS IT LI LT LU LV MC MK MT NL NO PL PT RO RS SE SI SK SM TR |
|
| AX | Request for extension of the european patent |
Extension state: BA ME |
|
| RIC1 | Information provided on ipc code assigned before grant |
Ipc: H04R 27/00 20060101ALI20191125BHEP Ipc: H03G 3/30 20060101ALI20191125BHEP Ipc: G10L 21/0364 20130101ALI20191125BHEP Ipc: H03G 5/16 20060101ALI20191125BHEP Ipc: H04R 3/12 20060101ALI20191125BHEP Ipc: H03G 3/32 20060101AFI20191125BHEP |
|
| DAV | Request for validation of the european patent (deleted) | ||
| DAX | Request for extension of the european patent (deleted) | ||
| A4 | Supplementary search report drawn up and despatched |
Effective date: 20200226 |
|
| RIC1 | Information provided on ipc code assigned before grant |
Ipc: H04R 3/12 20060101ALI20200220BHEP Ipc: H03G 3/32 20060101AFI20200220BHEP Ipc: G10L 21/0364 20130101ALI20200220BHEP Ipc: H03G 5/16 20060101ALI20200220BHEP Ipc: H04R 27/00 20060101ALI20200220BHEP Ipc: H04R 29/00 20060101ALN20200220BHEP Ipc: H04S 7/00 20060101ALN20200220BHEP Ipc: H03G 3/30 20060101ALI20200220BHEP |
|
| GRAP | Despatch of communication of intention to grant a patent |
Free format text: ORIGINAL CODE: EPIDOSNIGR1 |
|
| STAA | Information on the status of an ep patent application or granted ep patent |
Free format text: STATUS: GRANT OF PATENT IS INTENDED |
|
| INTG | Intention to grant announced |
Effective date: 20220913 |
|
| GRAJ | Information related to disapproval of communication of intention to grant by the applicant or resumption of examination proceedings by the epo deleted |
Free format text: ORIGINAL CODE: EPIDOSDIGR1 |
|
| STAA | Information on the status of an ep patent application or granted ep patent |
Free format text: STATUS: REQUEST FOR EXAMINATION WAS MADE |
|
| STAA | Information on the status of an ep patent application or granted ep patent |
Free format text: STATUS: EXAMINATION IS IN PROGRESS |
|
| 17Q | First examination report despatched |
Effective date: 20230123 |
|
| INTC | Intention to grant announced (deleted) | ||
| GRAP | Despatch of communication of intention to grant a patent |
Free format text: ORIGINAL CODE: EPIDOSNIGR1 |
|
| STAA | Information on the status of an ep patent application or granted ep patent |
Free format text: STATUS: GRANT OF PATENT IS INTENDED |
|
| INTG | Intention to grant announced |
Effective date: 20240409 |
|
| GRAS | Grant fee paid |
Free format text: ORIGINAL CODE: EPIDOSNIGR3 |
|
| GRAA | (expected) grant |
Free format text: ORIGINAL CODE: 0009210 |
|
| STAA | Information on the status of an ep patent application or granted ep patent |
Free format text: STATUS: THE PATENT HAS BEEN GRANTED |
|
| AK | Designated contracting states |
Kind code of ref document: B1 Designated state(s): AL AT BE BG CH CY CZ DE DK EE ES FI FR GB GR HR HU IE IS IT LI LT LU LV MC MK MT NL NO PL PT RO RS SE SI SK SM TR |
|
| REG | Reference to a national code |
Ref country code: GB Ref legal event code: FG4D |
|
| REG | Reference to a national code |
Ref country code: CH Ref legal event code: EP |
|
| REG | Reference to a national code |
Ref country code: DE Ref legal event code: R096 Ref document number: 602017084846 Country of ref document: DE |
|
| REG | Reference to a national code |
Ref country code: IE Ref legal event code: FG4D |
|
| REG | Reference to a national code |
Ref country code: LT Ref legal event code: MG9D |
|
| PG25 | Lapsed in a contracting state [announced via postgrant information from national office to epo] |
Ref country code: NO Free format text: LAPSE BECAUSE OF FAILURE TO SUBMIT A TRANSLATION OF THE DESCRIPTION OR TO PAY THE FEE WITHIN THE PRESCRIBED TIME-LIMIT Effective date: 20241211 |
|
| REG | Reference to a national code |
Ref country code: NL Ref legal event code: MP Effective date: 20240911 |
|
| PG25 | Lapsed in a contracting state [announced via postgrant information from national office to epo] |
Ref country code: GR Free format text: LAPSE BECAUSE OF FAILURE TO SUBMIT A TRANSLATION OF THE DESCRIPTION OR TO PAY THE FEE WITHIN THE PRESCRIBED TIME-LIMIT Effective date: 20241212 Ref country code: FI Free format text: LAPSE BECAUSE OF FAILURE TO SUBMIT A TRANSLATION OF THE DESCRIPTION OR TO PAY THE FEE WITHIN THE PRESCRIBED TIME-LIMIT Effective date: 20240911 |
|
| PG25 | Lapsed in a contracting state [announced via postgrant information from national office to epo] |
Ref country code: BG Free format text: LAPSE BECAUSE OF FAILURE TO SUBMIT A TRANSLATION OF THE DESCRIPTION OR TO PAY THE FEE WITHIN THE PRESCRIBED TIME-LIMIT Effective date: 20240911 |
|
| PG25 | Lapsed in a contracting state [announced via postgrant information from national office to epo] |
Ref country code: LV Free format text: LAPSE BECAUSE OF FAILURE TO SUBMIT A TRANSLATION OF THE DESCRIPTION OR TO PAY THE FEE WITHIN THE PRESCRIBED TIME-LIMIT Effective date: 20240911 |
|
| PG25 | Lapsed in a contracting state [announced via postgrant information from national office to epo] |
Ref country code: HR Free format text: LAPSE BECAUSE OF FAILURE TO SUBMIT A TRANSLATION OF THE DESCRIPTION OR TO PAY THE FEE WITHIN THE PRESCRIBED TIME-LIMIT Effective date: 20240911 |
|
| PG25 | Lapsed in a contracting state [announced via postgrant information from national office to epo] |
Ref country code: ES Free format text: LAPSE BECAUSE OF FAILURE TO SUBMIT A TRANSLATION OF THE DESCRIPTION OR TO PAY THE FEE WITHIN THE PRESCRIBED TIME-LIMIT Effective date: 20240911 Ref country code: RS Free format text: LAPSE BECAUSE OF FAILURE TO SUBMIT A TRANSLATION OF THE DESCRIPTION OR TO PAY THE FEE WITHIN THE PRESCRIBED TIME-LIMIT Effective date: 20241211 |
|
| PG25 | Lapsed in a contracting state [announced via postgrant information from national office to epo] |
Ref country code: RS Free format text: LAPSE BECAUSE OF FAILURE TO SUBMIT A TRANSLATION OF THE DESCRIPTION OR TO PAY THE FEE WITHIN THE PRESCRIBED TIME-LIMIT Effective date: 20241211 Ref country code: NO Free format text: LAPSE BECAUSE OF FAILURE TO SUBMIT A TRANSLATION OF THE DESCRIPTION OR TO PAY THE FEE WITHIN THE PRESCRIBED TIME-LIMIT Effective date: 20241211 Ref country code: LV Free format text: LAPSE BECAUSE OF FAILURE TO SUBMIT A TRANSLATION OF THE DESCRIPTION OR TO PAY THE FEE WITHIN THE PRESCRIBED TIME-LIMIT Effective date: 20240911 Ref country code: HR Free format text: LAPSE BECAUSE OF FAILURE TO SUBMIT A TRANSLATION OF THE DESCRIPTION OR TO PAY THE FEE WITHIN THE PRESCRIBED TIME-LIMIT Effective date: 20240911 Ref country code: GR Free format text: LAPSE BECAUSE OF FAILURE TO SUBMIT A TRANSLATION OF THE DESCRIPTION OR TO PAY THE FEE WITHIN THE PRESCRIBED TIME-LIMIT Effective date: 20241212 Ref country code: FI Free format text: LAPSE BECAUSE OF FAILURE TO SUBMIT A TRANSLATION OF THE DESCRIPTION OR TO PAY THE FEE WITHIN THE PRESCRIBED TIME-LIMIT Effective date: 20240911 Ref country code: ES Free format text: LAPSE BECAUSE OF FAILURE TO SUBMIT A TRANSLATION OF THE DESCRIPTION OR TO PAY THE FEE WITHIN THE PRESCRIBED TIME-LIMIT Effective date: 20240911 Ref country code: BG Free format text: LAPSE BECAUSE OF FAILURE TO SUBMIT A TRANSLATION OF THE DESCRIPTION OR TO PAY THE FEE WITHIN THE PRESCRIBED TIME-LIMIT Effective date: 20240911 |
|
| REG | Reference to a national code |
Ref country code: AT Ref legal event code: MK05 Ref document number: 1723582 Country of ref document: AT Kind code of ref document: T Effective date: 20240911 |
|
| PG25 | Lapsed in a contracting state [announced via postgrant information from national office to epo] |
Ref country code: NL Free format text: LAPSE BECAUSE OF FAILURE TO SUBMIT A TRANSLATION OF THE DESCRIPTION OR TO PAY THE FEE WITHIN THE PRESCRIBED TIME-LIMIT Effective date: 20240911 |
|
| PG25 | Lapsed in a contracting state [announced via postgrant information from national office to epo] |
Ref country code: PT Free format text: LAPSE BECAUSE OF FAILURE TO SUBMIT A TRANSLATION OF THE DESCRIPTION OR TO PAY THE FEE WITHIN THE PRESCRIBED TIME-LIMIT Effective date: 20250113 Ref country code: IS Free format text: LAPSE BECAUSE OF FAILURE TO SUBMIT A TRANSLATION OF THE DESCRIPTION OR TO PAY THE FEE WITHIN THE PRESCRIBED TIME-LIMIT Effective date: 20250111 |
|
| PG25 | Lapsed in a contracting state [announced via postgrant information from national office to epo] |
Ref country code: SM Free format text: LAPSE BECAUSE OF FAILURE TO SUBMIT A TRANSLATION OF THE DESCRIPTION OR TO PAY THE FEE WITHIN THE PRESCRIBED TIME-LIMIT Effective date: 20240911 Ref country code: RO Free format text: LAPSE BECAUSE OF FAILURE TO SUBMIT A TRANSLATION OF THE DESCRIPTION OR TO PAY THE FEE WITHIN THE PRESCRIBED TIME-LIMIT Effective date: 20240911 |
|
| PG25 | Lapsed in a contracting state [announced via postgrant information from national office to epo] |
Ref country code: AT Free format text: LAPSE BECAUSE OF FAILURE TO SUBMIT A TRANSLATION OF THE DESCRIPTION OR TO PAY THE FEE WITHIN THE PRESCRIBED TIME-LIMIT Effective date: 20240911 Ref country code: EE Free format text: LAPSE BECAUSE OF FAILURE TO SUBMIT A TRANSLATION OF THE DESCRIPTION OR TO PAY THE FEE WITHIN THE PRESCRIBED TIME-LIMIT Effective date: 20240911 |
|
| PG25 | Lapsed in a contracting state [announced via postgrant information from national office to epo] |
Ref country code: CZ Free format text: LAPSE BECAUSE OF FAILURE TO SUBMIT A TRANSLATION OF THE DESCRIPTION OR TO PAY THE FEE WITHIN THE PRESCRIBED TIME-LIMIT Effective date: 20240911 Ref country code: PL Free format text: LAPSE BECAUSE OF FAILURE TO SUBMIT A TRANSLATION OF THE DESCRIPTION OR TO PAY THE FEE WITHIN THE PRESCRIBED TIME-LIMIT Effective date: 20240911 |
|
| PG25 | Lapsed in a contracting state [announced via postgrant information from national office to epo] |
Ref country code: SK Free format text: LAPSE BECAUSE OF FAILURE TO SUBMIT A TRANSLATION OF THE DESCRIPTION OR TO PAY THE FEE WITHIN THE PRESCRIBED TIME-LIMIT Effective date: 20240911 Ref country code: IT Free format text: LAPSE BECAUSE OF FAILURE TO SUBMIT A TRANSLATION OF THE DESCRIPTION OR TO PAY THE FEE WITHIN THE PRESCRIBED TIME-LIMIT Effective date: 20240911 |
|
| REG | Reference to a national code |
Ref country code: DE Ref legal event code: R097 Ref document number: 602017084846 Country of ref document: DE |
|
| PG25 | Lapsed in a contracting state [announced via postgrant information from national office to epo] |
Ref country code: MC Free format text: LAPSE BECAUSE OF FAILURE TO SUBMIT A TRANSLATION OF THE DESCRIPTION OR TO PAY THE FEE WITHIN THE PRESCRIBED TIME-LIMIT Effective date: 20240911 |
|
| PG25 | Lapsed in a contracting state [announced via postgrant information from national office to epo] |
Ref country code: DK Free format text: LAPSE BECAUSE OF FAILURE TO SUBMIT A TRANSLATION OF THE DESCRIPTION OR TO PAY THE FEE WITHIN THE PRESCRIBED TIME-LIMIT Effective date: 20240911 |
|
| PLBE | No opposition filed within time limit |
Free format text: ORIGINAL CODE: 0009261 |
|
| STAA | Information on the status of an ep patent application or granted ep patent |
Free format text: STATUS: NO OPPOSITION FILED WITHIN TIME LIMIT |
|
| REG | Reference to a national code |
Ref country code: CH Ref legal event code: PL |
|
| PG25 | Lapsed in a contracting state [announced via postgrant information from national office to epo] |
Ref country code: LU Free format text: LAPSE BECAUSE OF NON-PAYMENT OF DUE FEES Effective date: 20241213 |
|
| 26N | No opposition filed |
Effective date: 20250612 |
|
| PG25 | Lapsed in a contracting state [announced via postgrant information from national office to epo] |
Ref country code: SE Free format text: LAPSE BECAUSE OF FAILURE TO SUBMIT A TRANSLATION OF THE DESCRIPTION OR TO PAY THE FEE WITHIN THE PRESCRIBED TIME-LIMIT Effective date: 20240911 |
|
| REG | Reference to a national code |
Ref country code: BE Ref legal event code: MM Effective date: 20241231 |
|
| PG25 | Lapsed in a contracting state [announced via postgrant information from national office to epo] |
Ref country code: BE Free format text: LAPSE BECAUSE OF NON-PAYMENT OF DUE FEES Effective date: 20241231 |
|
| PG25 | Lapsed in a contracting state [announced via postgrant information from national office to epo] |
Ref country code: FR Free format text: LAPSE BECAUSE OF NON-PAYMENT OF DUE FEES Effective date: 20241231 |
|
| PG25 | Lapsed in a contracting state [announced via postgrant information from national office to epo] |
Ref country code: CH Free format text: LAPSE BECAUSE OF NON-PAYMENT OF DUE FEES Effective date: 20241231 |
|
| PG25 | Lapsed in a contracting state [announced via postgrant information from national office to epo] |
Ref country code: IE Free format text: LAPSE BECAUSE OF NON-PAYMENT OF DUE FEES Effective date: 20241213 |
|
| PGFP | Annual fee paid to national office [announced via postgrant information from national office to epo] |
Ref country code: GB Payment date: 20251229 Year of fee payment: 9 |
|
| PGFP | Annual fee paid to national office [announced via postgrant information from national office to epo] |
Ref country code: DE Payment date: 20251230 Year of fee payment: 9 |