EP3495850A1 - Data processing method and data processing apparatus - Google Patents
Data processing method and data processing apparatus Download PDFInfo
- Publication number
- EP3495850A1 EP3495850A1 EP17836147.3A EP17836147A EP3495850A1 EP 3495850 A1 EP3495850 A1 EP 3495850A1 EP 17836147 A EP17836147 A EP 17836147A EP 3495850 A1 EP3495850 A1 EP 3495850A1
- Authority
- EP
- European Patent Office
- Prior art keywords
- detector
- energy
- photons
- spectrum data
- counts
- Prior art date
- Legal status (The legal status is an assumption and is not a legal conclusion. Google has not performed a legal analysis and makes no representation as to the accuracy of the status listed.)
- Granted
Links
Images





Classifications
-
- G—PHYSICS
- G01—MEASURING; TESTING
- G01T—MEASUREMENT OF NUCLEAR OR X-RADIATION
- G01T7/00—Details of radiation-measuring instruments
- G01T7/005—Details of radiation-measuring instruments calibration techniques
-
- G—PHYSICS
- G01—MEASURING; TESTING
- G01T—MEASUREMENT OF NUCLEAR OR X-RADIATION
- G01T1/00—Measuring X-radiation, gamma radiation, corpuscular radiation, or cosmic radiation
- G01T1/16—Measuring radiation intensity
-
- G—PHYSICS
- G01—MEASURING; TESTING
- G01T—MEASUREMENT OF NUCLEAR OR X-RADIATION
- G01T1/00—Measuring X-radiation, gamma radiation, corpuscular radiation, or cosmic radiation
- G01T1/36—Measuring spectral distribution of X-rays or of nuclear radiation spectrometry
Definitions
- the present disclosure relates to a technical field of data processing, and more particularly to a data processing method and device.
- a photon counting detector is a detector that can distinguish energy of incident photons by the mode of photon counting, and can obtain number of photons in different energy regions in one scan.
- the mode of photon counting is affected by a detector response.
- the detector response varies depending on crystal material of the detector, and generally includes K-shell electron escaping, charge sharing, and pulse stacking.
- K-shell electron escaping In order to take advantage of the photon counting detector, it is necessary to model and calibrate the detector response. There is no mature method at present.
- An embodiment of the present disclosure provides a data processing method, comprising steps of: performing detector response calibration based on a detector response obtained by an incidence of rays with known energy into a detector to obtain a detector response model; obtaining a photon counting model of the detector between incident energy spectrum data of the detector and detected energy spectrum data of the detector based on the detector response model; and performing a deconvolution operation on counts of photons in respective energy regions in the detected energy spectrum data of the detector based on the photon counting model of the detector, to obtain real counts of photons in respective energy regions in the incident energy spectrum data of the detector.
- the deconvolution operation is performed on the counts of photons in respective energy regions in the detected energy spectrum data of the detector for each detector unit and each incident angle based on the photon counting model of the detector, to obtain real counts of photons in respective energy regions in the incident energy spectrum data of the detector for each detector unit and each incident angle, wherein all sets of the obtained data are combined to achieve multiple-energy region reconstruction of attenuation coefficient of a substance under inspection detected by the detector.
- the deconvolution operation is performed on the counts of photons in respective energy regions in the detected energy spectrum data of the detector by a method of direct solution and adding a constraint term, to obtain the real counts of photons in respective energy regions in the incident energy spectrum data of the detector.
- the deconvolution operation is performed on the counts of photons in respective energy regions in the detected energy spectrum data of the detector by an EM solution method, to obtain the real counts of photons in respective energy regions in the incident energy spectrum data of the detector.
- the step of performing the detector response calibration comprises a step of simulating an energy deposition process in a photon detector of the rays with known energy according to metal fluorescence data.
- the embodiments of the present disclosure provides a data processing device comprising: a calibrating module, configured for performing detector response calibration based on a detector response obtained by an incidence of rays with known energy into a detector to obtain a detector response model; a photon counting model obtaining module, configured for obtaining a photon counting model of the detector between incident energy spectrum data of the detector and detected energy spectrum data of the detector based on the detector response model; and a count of photons obtaining module, configured for performing a deconvolution operation on counts of photons in respective energy regions in the detected energy spectrum data of the detector based on the photon counting model of the detector, to obtain real counts of photons in respective energy regions in the incident energy spectrum data of the detector.
- the device further comprises a multiple-energy region reconstruction module configured for performing the deconvolution operation on the counts of photons in respective energy regions in the detected energy spectrum data of the detector for each detector unit and each incident angle based on the photon counting model of the detector, to obtain real counts of photons in respective energy regions in the incident energy spectrum data of the detector for each detector unit and each incident angle, and combining all sets of the obtained data to achieve multiple-energy region reconstruction of attenuation coefficient of a substance under inspection detected by the detector.
- a multiple-energy region reconstruction module configured for performing the deconvolution operation on the counts of photons in respective energy regions in the detected energy spectrum data of the detector for each detector unit and each incident angle based on the photon counting model of the detector, to obtain real counts of photons in respective energy regions in the incident energy spectrum data of the detector for each detector unit and each incident angle, and combining all sets of the obtained data to achieve multiple-energy region reconstruction of attenuation coefficient of a substance under inspection detected by the detector.
- the count of photons obtaining module of the device is further configured for performing the deconvolution operation on the counts of photons in respective energy regions in the detected energy spectrum data of the detector by a method of direct solution and adding a constraint term, to obtain the real counts of photons in respective energy regions in the incident energy spectrum data of the detector.
- the count of photons obtaining module of the device is further configured for performing the deconvolution operation on the counts of photons in respective energy regions in the detected energy spectrum data of the detector by an EM solution method, to obtain the real counts of photons in respective energy regions in the incident energy spectrum data of the detector.
- the calibrating module of the device is configured for performing the detector response calibration by simulating an energy deposition process in a photon detector of the rays with known energy according to metal fluorescence data.
- the embodiments of the present disclosure provides a data processing device, comprising: a memory; and a processor coupled to the memory, wherein the processor is configured for: performing detector response calibration based on a detector response obtained by an incidence of rays with known energy into a detector to obtain a detector response model; obtaining a photon counting model of the detector between incident energy spectrum data of the detector and detected energy spectrum data of the detector based on the detector response model; and performing a deconvolution operation on counts of photons in respective energy regions in the detected energy spectrum data of the detector based on the photon counting model of the detector, to obtain real counts of photons in respective energy regions in the incident energy spectrum data of the detector.
- a deconvolution operation is performed on detected energy spectrum data of the detector by establishing a detector response model to obtain a real count of photons in an energy region in the energy spectrum data, thereby eliminating the effect of the photon counting detector response on the count of photons and obtaining true attenuation coefficient of each substance.
- Fig. 1 is a schematic view showing an application scenario of a data processing method according to some embodiments of the present disclosure.
- a ray source such as an X-ray machine
- a detector array are disposed on opposite sides of an object under inspection.
- the detector array receives an X-ray spectrum after attenuation by the object under inspection. Due to a detector response, there is a certain error between an energy spectrum detected by the detector array and an energy spectrum actually after attenuation by the object under inspection.
- the energy spectrum here actually after attenuation by the object under inspection can also be referred to as an incident energy spectrum of the detector.
- Fig. 2 is a flow chart of detecting object projection performed by the X-ray machine in the application scenario of the data processing method shown in Fig. 1 , according to some embodiments of the present disclosure.
- the X-ray machine emits a continuous spectrum of a light source, of which an energy spectrum after attenuation is obtained by attenuation via the object.
- the energy spectrum after attenuation is incident on the detector, and is converted into an electrical signal by interaction of detector crystal with incident photons, which is then read by subsequent electronic components, thereby obtaining a detected energy spectrum of the detector.
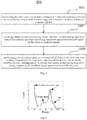
- the data processing method 300 includes the following steps: at step S301, performing a detector response calibration based on a detector response obtained by an incidence of rays with known energy into a detector, to obtain a detector response model; at step S302, obtaining a photon counting model of the detector between incident energy spectrum data of the detector and detected energy spectrum data of the detector, based on the detector response model; at step S303, performing a deconvolution operation on counts of photons in respective energy regions in the detected energy spectrum data of the detector based on the photon counting model of the detector, to obtain real counts of photons in respective energy regions in the incident energy spectrum data of the detector.
- the detector response calibration can be understood as determining a relationship between an input and an output of the detector.
- the detector response calibration is used to obtain the detector response model, which is a basis for subsequent deconvolution on the count of photons in the energy region. It should be understood that an energy deposition process in the detector can be simulated by the incidence of the rays with known energy into the detector, so as to perform the detector response calibration.
- the detector response calibration may be performed by, for example, using metal fluorescence.
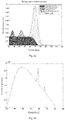
- the detector response calibration may also be performed by using other forms of rays with known energy, such as a synchrotron radiation light source, a radiation source. Please also refer to Fig. 4 , which shows a schematic view of a spectrum obtained by a detector when detecting a fluorescence spectrum of a metal according to the embodiment.
- a combination of Monte Carlo simulation and metal fluorescence data can be utilized for a detector modeling to construct the detector response model.
- metal fluorescence refers to characteristic rays emitted from a substance when it is irradiated by X-rays and electrons in an outer shell is de-excited to an inner shell. This characteristic rays are used to approximate incident monochromatic rays of the detector, and then the detector response calibration is performed. As shown in Fig.
- Fluorescence refers to a process of characteristic X-ray release of a substance under X-ray irradiation, where a series of X-rays with a certain energy is released. Both k ⁇ and k ⁇ are characteristic X-rays released by the lead during exposure, and a proportion of k ⁇ ray is very low.
- the energies of the characteristic X-rays are known and can be used to calibrate the detector response. It can be seen from Fig.
- the count of photons is highest in the energy region of 0-20, which is the response of electronic noise, and a peak of photons appears in the energy region of 20-40, which is caused by electron escape.
- the fluorescence spectra of some commonly used materials with characteristic X-rays of different energy are given in Table 1.
- the Monte Carlo simulation can include an entire process from an electron beam impinging a target to the energy deposition of the photons in the detector.
- a Monte Carlo simulation can be carried out with C++ and GEANT4, and the entire process can be divided into three sub-processes and thus includes three sub-steps: a step of electron beam impinging the target and generation of energy spectrum; a step of simulation of photon transport process and establishment of a transport matrix under isotropic conditions; and a step of energy deposition of monochromatic rays in a photon counting detector, thereby obtaining an energy spectrum of the incident photons of the detector.
- the detector model mainly aims to determine the detector response for the incident monochromatic spectrum, denoted as ⁇ (E 0 ) (which can be understood as the detector response for the incident monochromatic rays with an energy E 0 ), and may include establishment of a mapping relationship between threshold of the detector and energy of incident photons, and determination of parameters of spectrum broadening.
- the incident energy spectrum S in (E) of the detector can be obtained by the Monte Carlo simulation, and then real detected energy spectrum S det (E) of the detector can be used to determine the specific parameters p s 1 , p s 2 , p 1 and p 2 in the detector response model.
- Fig. 5 illustrates a comparison between data actually detected by incidence of rays with known energy into a detector and data obtained by simulation using the detector response model, according to some embodiments of the present disclosure.
- La, Ce, Nd and Gd are taken as examples, the Monte Carlo and the detector response model with optimized parameters are used to perform the simulation, and wherein an abscissa indicates photon energy in keV; and an ordinate indicates count of photons. Hollow points represent the detected data, and curves represent results of simulations by use of the Monte Carlo and the detector response model with the optimized parameters.
- the detector response model constructed in the step S302 can be described by h (E;E'), which is a concept similar to a probability distribution and can be understood as a probability that a photon with energy E' is recorded as energy E.
- S in (E') the energy spectrum after attenuation
- S det (E) the detected photon
- Energy spectrum deconvolution has a very ill-posed problem, especially in energy spectrum CT which has a small number of energy regions. It should be understood that, a larger number of energy regions means a narrower width of the energy region, and it means a smaller count of photons in each energy region under the same scanning conditions, which will be affected by noise in a greater extent. For the method of deconvolution on counts of photons in limited number of energy regions to obtain the entire spectrum data, the data is very unstable. Here, the deconvolution is performed on a wide-energy region to obtain count of photons in the energy region instead of count of photons in the energy spectrum.
- the method 300 may perform the deconvolution operation on the counts of photons in respective energy regions in the detected energy spectrum data for each detector unit and each incident angle of the detector, based on the photon counting model of the detector, to obtain real counts of photons in respective energy regions in the incident energy spectrum data of the detector for each detector unit and each incident angle. All sets of the obtained data may be combined to achieve a multiple-energy region reconstruction of an attenuation coefficient of the material under inspection detected by the detector. It can be understood that the deconvolution may be performed on the counts of photons in respective energy regions for each detector unit and each incident angle obtained during scanning of the detector to remove detector response, by which a real spectrum after attenuation of the spectrum penetrating through the material can be substantially obtained.
- the photon counting detector can simultaneously obtain counts of photons in many energy regions, and energy data in different energy regions, for example, the counts of a particular pixel in sonograms which indicate the relationships between the incident angle, detector unit and photon counts, form an energy spectrum.
- the deconvolution operation can be performed on each detector unit one by one to obtain a sinogram sequence after deconvolution, which can be directly used for the multiple-energy region reconstruction of the detector to obtain quantitative CT.
- the step S303 of the method may perform deconvolution operation on the counts of photons in respective energy regions in the detected energy spectrum data of the detector by iterative update, to obtain the real counts of photons in respective energy regions in the incident energy spectrum data of the detector.
- the detector response of energy region should be an average of all the monochromatic detector responses contained in the energy region.
- H k E ⁇ i ⁇ ⁇ k ⁇ i h E E i
- N k the number of energy elements contained in the kth energy region
- Each column of A represents the detector response of the corresponding energy region, and y still represents the detected counts of photons in respective energy regions.
- the iterative update method may use, for example, an EM algorithm (also referred to as an Expectation Maximization Algorithm).
- the EM algorithm is selected to perform the deconvolution on wide-energy region to obtain count of photons in the energy region instead of that in the energy spectrum.
- the EM algorithm itself is an algorithm that is relatively robust to noise, and thus stability of the data processing method can be improved.
- the deconvolution operation is performed with EM algorithm on the counts of photons in respective energy regions for each detector unit and each angle obtained by the detector during scanning process to remove the detector response, and relative standard deviation of total counts of photons with different widths of energy regions obtained by tests is given in Table 2.
- the deconvolution operation on the photon counting model by use of other methods can only grantee data after process to be relatively stable under the width of energy region of at most 4 keV.
- the deviation of the total count is 0.11% under the width of energy region of 10 keV, which achieves a data processing effect by use of the other methods under the width of energy region of 4 keV.
- the spectrum after attenuation that is, the incident spectrum data of the detector containing real attenuation information of material can be obtained by performing the deconvolution operation on the photon counting model by use of the EM solution method, and the data result is very stable.
- Fig. 6a is a schematic view showing a distribution ratio of photons in respective energy regions detected by a detector in a simulation of a data processing method according to an embodiment of the present disclosure.
- Fig. 6b is a schematic view showing an energy spectrum actually input to a detector in a simulation of a data processing method according to an embodiment of the present disclosure.
- Fig. 6c is a schematic view showing a response matrix of a detector in a simulation of a data processing method according to an embodiment of the present disclosure.
- Fig. 6d is a schematic view showing an incident energy spectrum of a detector obtained in a simulation of a data processing method according to an embodiment of the present disclosure. As shown in Fig.
- a distribution ratio of photons in respective energy regions with an incident energy E' of 70 keV is simulated, wherein an abscissa represents photon energy in keV and an ordinate represents a distribution ratio of collected photons in each energy region, and an effect of deconvolution can be seen very clearly.
- Fig. 6b represents an incident energy spectrum of the detector
- Fig. 6c is a detector response matrix A, each column of which is shaped as the detector response function of Fig. 6a . As shown in Fig.
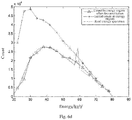
- a star line represents energy spectrum actually detected by the detector
- a triangle line represents an incident energy spectrum obtained by deconvolution using EM algorithm. It can be seen from Fig. 6d that the deconvolution operation substantially restores real appearance of the incident energy spectrum.
- the deconvolution operation may be performed on the counts of photons in respective energy regions in the detected energy spectrum data of the detector by a direct solution method, to obtain the real counts of photons in respective energy regions in the incident energy spectrum data of the detector.
- equation (10) k 1 x 1 ⁇ x 2 2 + k 2 x 2 ⁇ x 3 2 + ⁇ + k n ⁇ 1 x n ⁇ 1 ⁇ x n 2
- equation (11)
- the method is simple in solving, ensures continuity and meanwhile ensures a value of small error.
- the real spectrum after attenuation of a spectrum penetrating through the substance can be substantially obtained by this method.
- a series of sinograms after deconvolution can be obtained by performing deconvolution on sinograms of respective energy regions for one detector unit after another, according to the data processing method according to an embodiment of the present disclosure.
- the sinograms shown in Fig. 7 show counts of photons with the detector response removed and containing real attenuation information.
- the sinograms after deconvolution can be used for CT reconstruction, which herein can be understood as a multiple-energy region reconstruction on the attenuation coefficient of the material under inspection detected by the detector.
- the CT reconstruction may be performed using an analytical reconstruction method, such as the FDK method, or using an iterative reconstruction method, such as the ART method.
- plastic bottled water is selected as an object under inspection to be projected and verify the data processing effect of the data processing method.
- a model of the plastic bottled water is established by the detected energy spectrum data via a multiple-energy region reconstruction performed by the method.
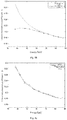
- an abscissa represents photon energy in keV, and an ordinate represents attenuation coefficient of rays in respective energy regions
- the attenuation coefficient of water is obtained by directly reconstructing on the sinogram of each energy region without performing the deconvolution operation on the detected energy spectrum data of the detector for respective energy regions
- the detected curve data deviates from the value of theoretical real curve data, because of the presence of the detector response.
- the detected data is substantially coincident with the value of the theoretical real curve data.
- Fig. 9 is a schematic view showing a structure of a data processing device 900 according to other embodiments of the present disclosure.
- the data processing device 900 includes a calibrating module 901, a photon counting model obtaining module 902, a count of photons obtaining module 903, and an incident energy spectrum data obtaining module 904.
- the calibrating module 901 is configured to perform a detector response calibration based on a detector response obtained by an incidence of rays with known energy into a detector, to obtain a detector response model.
- the photon counting model obtaining module 902 is configured to obtain a photon counting model of the detector between incident energy spectrum data of the detector and detected energy spectrum data of the detector based on the detector response model.
- the count of photons obtaining module 903 is configured to perform a deconvolution operation on counts of photons in respective energy regions in the detected energy spectrum data of the detector based on the photon counting model of the detector, to obtain real counts of photons in respective energy regions in the incident energy spectrum data of the detector.
- the device further includes a multiple-energy region reconstruction module configured for performing the deconvolution operation on the counts of photons in respective energy regions in the detected energy spectrum data of the detector for each detector unit and each incident angle based on the photon counting model of the detector, to obtain real counts of photons in respective energy regions in the incident energy spectrum data of the detector for each detector unit and each incident angle, and combining all sets of the obtained data to achieve multiple-energy region reconstruction of attenuation coefficient of a substance under inspection detected by the detector.
- a multiple-energy region reconstruction module configured for performing the deconvolution operation on the counts of photons in respective energy regions in the detected energy spectrum data of the detector for each detector unit and each incident angle based on the photon counting model of the detector, to obtain real counts of photons in respective energy regions in the incident energy spectrum data of the detector for each detector unit and each incident angle, and combining all sets of the obtained data to achieve multiple-energy region reconstruction of attenuation coefficient of a substance under inspection detected by the detector.
- the count of photons obtaining module 903 of the device may perform the deconvolution operation on the counts of photons in respective energy regions in the detected energy spectrum data of the detector by a method of direct solution and adding a constraint term, to obtain the real counts of photons in respective energy regions in the incident energy spectrum data of the detector.
- the count of photons obtaining module 903 of the device may perform the deconvolution operation on the counts of photons in respective energy regions in the detected energy spectrum data of the detector by an EM solution method, to obtain the real counts of photons in respective energy regions in the incident energy spectrum data of the detector.
- the calibrating module 901 of the device may perform the detector response calibration by simulating an energy deposition process in a photon detector of the rays with known energy according to metal fluorescence data.
- Fig. 10 is a schematic view showing a structure of a data processing device according to some embodiments of the present disclosure.
- the device can employ a general purpose computer system, which can be, in particular, a processor based computer.
- the data processing device can include an input and output I/O interface 1001, a memory 1002, at least one processor 1003, and at least one communication interface 1004.
- the input/output I/O interface 1001, the memory 1002, the at least one processor 1003, and the at least one communication interface 1004 are connected by a communication bus 1005.
- the I/O interface 1001 is configured to receive text data from a user apparatus and transmit the text data to the processor 1003, wherein the text data is represented in a form of a structured query language SQL.
- the processor 1003 may be a general purpose central processing unit (CPU), a microprocessor, an application-specific integrated circuit (ASIC), or one or more integrated circuits for controlling execution of programs of the present disclosure.
- the communication bus 1005 can include a path for communicating information between the components described above.
- the communication interface 1004 uses devices, such as any transceiver, for communicating with other devices or communication networks, such as Ethernet, Radio Access Network (RAN), and Wireless Local Area Networks (WLAN).
- the computer system includes one or more memories 1002, which may be, but is not limited to, read-only memory (ROM) or other types of static storage apparatuses that can store static information and instructions, random access memory (RAM) or other types of dynamic storage apparatuses that can store information and instructions, or Electrically Erasable Programmable Read-Only Memory (EEPROM), CD-ROM (Compact Disc Read-Only Memory, CD-ROM)) or other disc storage, optical disc storage (including compact discs, laser discs, optical discs, digital versatile discs, Blu-ray discs, etc.), disk storage media or other magnetic storage devices, or any other medium capable of carrying or storing desired program code in a form of instructions or data structures and can be accessed by a computer.
- ROM read-only memory
- RAM random access memory
- EEPROM Electrically Erasable Programmable Read-Only Memory
- CD-ROM Compact Disc Read-Only Memory
- CD-ROM Compact Disc Read-Only Memory
- optical disc storage including compact discs, laser discs, optical
- the memories 1002 are coupled to the processor 1003 via the communication bus 1005.
- the memory 1002 is used to store application code for executing the solution of the present disclosure.
- the application code of the solution of the present disclosure is stored in a memory and controlled by the processor 1003 for execution.
- the processor 1003 is configured to perform the following steps including: performing detector response calibration based on a detector response obtained by an incidence of rays with known energy into a detector to obtain a detector response model; obtaining a photon counting model of the detector between incident energy spectrum data of the detector and detected energy spectrum data of the detector based on the detector response model; and performing a deconvolution operation on counts of photons in respective energy regions in the detected energy spectrum data of the detector based on the photon counting model of the detector, to obtain real counts of photons in respective energy regions in the incident energy spectrum data of the detector.
Landscapes
- Physics & Mathematics (AREA)
- Spectroscopy & Molecular Physics (AREA)
- Health & Medical Sciences (AREA)
- Life Sciences & Earth Sciences (AREA)
- General Physics & Mathematics (AREA)
- High Energy & Nuclear Physics (AREA)
- Molecular Biology (AREA)
- Measurement Of Radiation (AREA)
- Analysing Materials By The Use Of Radiation (AREA)
Abstract
Description
- The present disclosure is based upon and claims priority to Chinese Patent Application No.
201610630202.3 - The present disclosure relates to a technical field of data processing, and more particularly to a data processing method and device.
- A photon counting detector is a detector that can distinguish energy of incident photons by the mode of photon counting, and can obtain number of photons in different energy regions in one scan.
- However, the mode of photon counting is affected by a detector response. The detector response varies depending on crystal material of the detector, and generally includes K-shell electron escaping, charge sharing, and pulse stacking. In order to take advantage of the photon counting detector, it is necessary to model and calibrate the detector response. There is no mature method at present.
- An embodiment of the present disclosure provides a data processing method, comprising steps of: performing detector response calibration based on a detector response obtained by an incidence of rays with known energy into a detector to obtain a detector response model; obtaining a photon counting model of the detector between incident energy spectrum data of the detector and detected energy spectrum data of the detector based on the detector response model; and performing a deconvolution operation on counts of photons in respective energy regions in the detected energy spectrum data of the detector based on the photon counting model of the detector, to obtain real counts of photons in respective energy regions in the incident energy spectrum data of the detector.
- In some embodiments, wherein the deconvolution operation is performed on the counts of photons in respective energy regions in the detected energy spectrum data of the detector for each detector unit and each incident angle based on the photon counting model of the detector, to obtain real counts of photons in respective energy regions in the incident energy spectrum data of the detector for each detector unit and each incident angle, wherein all sets of the obtained data are combined to achieve multiple-energy region reconstruction of attenuation coefficient of a substance under inspection detected by the detector.
- In some embodiments, wherein the deconvolution operation is performed on the counts of photons in respective energy regions in the detected energy spectrum data of the detector by a method of direct solution and adding a constraint term, to obtain the real counts of photons in respective energy regions in the incident energy spectrum data of the detector.
- In some embodiments, wherein the deconvolution operation is performed on the counts of photons in respective energy regions in the detected energy spectrum data of the detector by an EM solution method, to obtain the real counts of photons in respective energy regions in the incident energy spectrum data of the detector.
- In some embodiments, wherein the step of performing the detector response calibration comprises a step of simulating an energy deposition process in a photon detector of the rays with known energy according to metal fluorescence data.
- In another aspect, the embodiments of the present disclosure provides a data processing device comprising: a calibrating module, configured for performing detector response calibration based on a detector response obtained by an incidence of rays with known energy into a detector to obtain a detector response model; a photon counting model obtaining module, configured for obtaining a photon counting model of the detector between incident energy spectrum data of the detector and detected energy spectrum data of the detector based on the detector response model; and a count of photons obtaining module, configured for performing a deconvolution operation on counts of photons in respective energy regions in the detected energy spectrum data of the detector based on the photon counting model of the detector, to obtain real counts of photons in respective energy regions in the incident energy spectrum data of the detector.
- In some embodiments, the device further comprises a multiple-energy region reconstruction module configured for performing the deconvolution operation on the counts of photons in respective energy regions in the detected energy spectrum data of the detector for each detector unit and each incident angle based on the photon counting model of the detector, to obtain real counts of photons in respective energy regions in the incident energy spectrum data of the detector for each detector unit and each incident angle, and combining all sets of the obtained data to achieve multiple-energy region reconstruction of attenuation coefficient of a substance under inspection detected by the detector.
- In some embodiments, the count of photons obtaining module of the device is further configured for performing the deconvolution operation on the counts of photons in respective energy regions in the detected energy spectrum data of the detector by a method of direct solution and adding a constraint term, to obtain the real counts of photons in respective energy regions in the incident energy spectrum data of the detector.
- In some embodiments, the count of photons obtaining module of the device is further configured for performing the deconvolution operation on the counts of photons in respective energy regions in the detected energy spectrum data of the detector by an EM solution method, to obtain the real counts of photons in respective energy regions in the incident energy spectrum data of the detector.
- In some embodiments, the calibrating module of the device is configured for performing the detector response calibration by simulating an energy deposition process in a photon detector of the rays with known energy according to metal fluorescence data.
- In another aspect, the embodiments of the present disclosure provides a data processing device, comprising: a memory; and a processor coupled to the memory, wherein the processor is configured for: performing detector response calibration based on a detector response obtained by an incidence of rays with known energy into a detector to obtain a detector response model; obtaining a photon counting model of the detector between incident energy spectrum data of the detector and detected energy spectrum data of the detector based on the detector response model; and performing a deconvolution operation on counts of photons in respective energy regions in the detected energy spectrum data of the detector based on the photon counting model of the detector, to obtain real counts of photons in respective energy regions in the incident energy spectrum data of the detector.
- According to an embodiment of the present disclosure, a deconvolution operation is performed on detected energy spectrum data of the detector by establishing a detector response model to obtain a real count of photons in an energy region in the energy spectrum data, thereby eliminating the effect of the photon counting detector response on the count of photons and obtaining true attenuation coefficient of each substance.
- Features and advantages of the present disclosure will be more clearly understood from the description of the accompanying drawings, in the drawings:
-
Fig. 1 is a schematic view showing an application scenario of a data processing method according to some embodiments of the present disclosure; -
Fig. 2 is a flow chart of detecting object projection performed by the X-ray machine in the application scenario of the data processing method shown inFig. 1 according to some embodiments of the present disclosure; -
Fig. 3 is a flow chart of a data processing method according to some embodiments of the present disclosure; -
Fig. 4 is a schematic view showing a spectrum obtained by a detector when detecting a fluorescence spectrum of a metal according to some embodiments of the present disclosure; -
Fig. 5 illustrates a comparison between data actually detected by incidence of rays with known energy into a detector and data obtained by simulation by using detector response model according to some embodiments of the present disclosure; -
Fig. 6a is a schematic view showing a distribution ratio of photons in respective energy regions detected by a detector in a simulation of a data processing method according to some embodiments of the present disclosure; -
Fig. 6b is a schematic view showing an energy spectrum actually input into a detector in a simulation of a data processing method according to some embodiments of the present disclosure; -
Fig. 6c is a schematic view showing a response matrix of a detector in a simulation of a data processing method according to some embodiments of the present disclosure; -
Fig. 6d is a schematic view showing an incident energy spectrum of a detector obtained in a simulation of a data processing method according to some embodiments of the present disclosure; -
Fig. 7 is a schematic view showing a data processing method according to some embodiments of the present disclosure; -
Fig. 8a is a schematic view showing a distribution of a substance under inspection based on a data processing method according to some embodiments of the present disclosure; -
Fig. 8b illustrates a plot of an attenuation coefficient of material prior to be processed detected by a detector tested according to a data processing method according to some embodiments of the present disclosure; -
Fig. 8c illustrates a plot of an attenuation coefficient of material after processed obtained and tested according to a data processing method according to some embodiments of the present disclosure; -
Fig. 9 is a schematic view showing a structure of a data processing device according to some further embodiments of the present disclosure; -
Fig. 10 is a schematic view showing a structure of a data processing device according to some other further embodiments of the present disclosure. - Features and exemplary embodiments of various aspects of a data processing method and device provided by the present disclosure are described in detail below. In the following detailed description, numerous specific details are set forth to provide a thorough understanding of the present disclosure. It will be apparent to those skilled in the art, however, that the present disclosure may be practiced without some of these details. The following description of the embodiments is merely to provide a better understanding of the present disclosure by way of example. The present disclosure is in no way limited to any of specific arrangements and methods disclosed herein, but covers any modifications, substitutions and improvements of elements, components and algorithms without departing from the spirit of the present disclosure. In the drawings and the following description, well-known structures and techniques are not shown in order to avoid unnecessarily obscuring the present disclosure.
- A data processing method and a data processing device according to an embodiment of the present disclosure will be described in detail below with reference to the accompanying drawings.
-
Fig. 1 is a schematic view showing an application scenario of a data processing method according to some embodiments of the present disclosure. As shown inFig. 1 , a ray source, such as an X-ray machine, and a detector array are disposed on opposite sides of an object under inspection. After the X-ray machine projects the object under inspection, the detector array receives an X-ray spectrum after attenuation by the object under inspection. Due to a detector response, there is a certain error between an energy spectrum detected by the detector array and an energy spectrum actually after attenuation by the object under inspection. The energy spectrum here actually after attenuation by the object under inspection can also be referred to as an incident energy spectrum of the detector. -
Fig. 2 is a flow chart of detecting object projection performed by the X-ray machine in the application scenario of the data processing method shown inFig. 1 , according to some embodiments of the present disclosure. Referring toFig. 2 , the X-ray machine emits a continuous spectrum of a light source, of which an energy spectrum after attenuation is obtained by attenuation via the object. The energy spectrum after attenuation is incident on the detector, and is converted into an electrical signal by interaction of detector crystal with incident photons, which is then read by subsequent electronic components, thereby obtaining a detected energy spectrum of the detector. - Referring to
Fig. 3 , some embodiments of the present disclosure provides a flow chart of a data processing method. Thedata processing method 300 includes the following steps: at step S301, performing a detector response calibration based on a detector response obtained by an incidence of rays with known energy into a detector, to obtain a detector response model; at step S302, obtaining a photon counting model of the detector between incident energy spectrum data of the detector and detected energy spectrum data of the detector, based on the detector response model; at step S303, performing a deconvolution operation on counts of photons in respective energy regions in the detected energy spectrum data of the detector based on the photon counting model of the detector, to obtain real counts of photons in respective energy regions in the incident energy spectrum data of the detector. - At step S301, the detector response calibration can be understood as determining a relationship between an input and an output of the detector. The detector response calibration is used to obtain the detector response model, which is a basis for subsequent deconvolution on the count of photons in the energy region. It should be understood that an energy deposition process in the detector can be simulated by the incidence of the rays with known energy into the detector, so as to perform the detector response calibration. In some exemplary embodiments, the detector response calibration may be performed by, for example, using metal fluorescence. In some exemplary embodiments, the detector response calibration may also be performed by using other forms of rays with known energy, such as a synchrotron radiation light source, a radiation source. Please also refer to
Fig. 4 , which shows a schematic view of a spectrum obtained by a detector when detecting a fluorescence spectrum of a metal according to the embodiment. - At step S302, for example, a combination of Monte Carlo simulation and metal fluorescence data can be utilized for a detector modeling to construct the detector response model. In a process of utilizing the combination of Monte Carlo simulation and metal fluorescence data for the detector modeling, metal fluorescence refers to characteristic rays emitted from a substance when it is irradiated by X-rays and electrons in an outer shell is de-excited to an inner shell. This characteristic rays are used to approximate incident monochromatic rays of the detector, and then the detector response calibration is performed. As shown in
Fig. 4 , which is a response of a typical CdTe to the fluorescence spectrum of lead, where an abscissa indicates photon energy in 1000 eV, expressed in keV; and an ordinate indicates count of photons. Fluorescence refers to a process of characteristic X-ray release of a substance under X-ray irradiation, where a series of X-rays with a certain energy is released. Both kα and kβ are characteristic X-rays released by the lead during exposure, and a proportion of kβ ray is very low. The energies of the characteristic X-rays are known and can be used to calibrate the detector response. It can be seen fromFig. 4 that in detected data of the detector, the count of photons is highest in the energy region of 0-20, which is the response of electronic noise, and a peak of photons appears in the energy region of 20-40, which is caused by electron escape. The fluorescence spectra of some commonly used materials with characteristic X-rays of different energy are given in Table 1.Table 1 element Kα1/keV Kα2/keV Kβ1/keV Kβ2/keV La 33.440 33.033 37.799 38.728 Ce 34.717 34.276 39.255 40.231 Nd 37.359 36.845 42.269 43.298 Gd 42.983 42.280 48.718 49.961 Er 49.099 48.205 55.690 57.088 W 59.310 57.973 67.233 69.090 Pt 66.820 65.111 75.236 77.866 Pb 74.957 72.794 84.922 84.343 - The Monte Carlo simulation can include an entire process from an electron beam impinging a target to the energy deposition of the photons in the detector. For example, a Monte Carlo simulation can be carried out with C++ and GEANT4, and the entire process can be divided into three sub-processes and thus includes three sub-steps: a step of electron beam impinging the target and generation of energy spectrum; a step of simulation of photon transport process and establishment of a transport matrix under isotropic conditions; and a step of energy deposition of monochromatic rays in a photon counting detector, thereby obtaining an energy spectrum of the incident photons of the detector. It can be understood that an energy distribution of the X-rays generated at a certain voltage is a continuous band, and the monochromatic rays have one band and one central value. The detector model mainly aims to determine the detector response for the incident monochromatic spectrum, denoted as δ (E0) (which can be understood as the detector response for the incident monochromatic rays with an energy E0), and may include establishment of a mapping relationship between threshold of the detector and energy of incident photons, and determination of parameters of spectrum broadening. For example, a Gaussian diffusion model can be used to simulate a diffusion of electron-hole pairs, as shown in equation (1),


Fig. 5 illustrates a comparison between data actually detected by incidence of rays with known energy into a detector and data obtained by simulation using the detector response model, according to some embodiments of the present disclosure. As shown inFig. 5 , La, Ce, Nd and Gd are taken as examples, the Monte Carlo and the detector response model with optimized parameters are used to perform the simulation, and wherein an abscissa indicates photon energy in keV; and an ordinate indicates count of photons. Hollow points represent the detected data, and curves represent results of simulations by use of the Monte Carlo and the detector response model with the optimized parameters. - At the step S303, the detector response model constructed in the step S302 can be described by h(E;E'), which is a concept similar to a probability distribution and can be understood as a probability that a photon with energy E' is recorded as energy E. Since the energy spectrum after attenuation, that is, the incident energy spectrum of the detector is denoted as S in (E'), and the detected photon is denoted as S det(E), the detector response photon counting model can be expressed as follows:

- In an embodiment, the
method 300 may perform the deconvolution operation on the counts of photons in respective energy regions in the detected energy spectrum data for each detector unit and each incident angle of the detector, based on the photon counting model of the detector, to obtain real counts of photons in respective energy regions in the incident energy spectrum data of the detector for each detector unit and each incident angle. All sets of the obtained data may be combined to achieve a multiple-energy region reconstruction of an attenuation coefficient of the material under inspection detected by the detector. It can be understood that the deconvolution may be performed on the counts of photons in respective energy regions for each detector unit and each incident angle obtained during scanning of the detector to remove detector response, by which a real spectrum after attenuation of the spectrum penetrating through the material can be substantially obtained. - In an example, the photon counting detector can simultaneously obtain counts of photons in many energy regions, and energy data in different energy regions, for example, the counts of a particular pixel in sonograms which indicate the relationships between the incident angle, detector unit and photon counts, form an energy spectrum. The deconvolution operation can be performed on each detector unit one by one to obtain a sinogram sequence after deconvolution, which can be directly used for the multiple-energy region reconstruction of the detector to obtain quantitative CT.
- In an embodiment, the step S303 of the method may perform deconvolution operation on the counts of photons in respective energy regions in the detected energy spectrum data of the detector by iterative update, to obtain the real counts of photons in respective energy regions in the incident energy spectrum data of the detector. Here, since it is necessary to continue to obtain the detector response of energy region based on the calibrated monochromatic detector response, the detector response of energy region should be an average of all the monochromatic detector responses contained in the energy region. For example, it can be expressed by equation (5),
 represents a set of single energy points contained in the kth energy region, the number of energy elements contained in the kth energy region is denoted as Nk , and


- In order to improve the stability of the algorithm, and for counting characteristics of the photon counting detector and specific application scenarios, the EM algorithm is selected to perform the deconvolution on wide-energy region to obtain count of photons in the energy region instead of that in the energy spectrum. The EM algorithm itself is an algorithm that is relatively robust to noise, and thus stability of the data processing method can be improved. The deconvolution operation is performed with EM algorithm on the counts of photons in respective energy regions for each detector unit and each angle obtained by the detector during scanning process to remove the detector response, and relative standard deviation of total counts of photons with different widths of energy regions obtained by tests is given in Table 2.
Table 2 Width of Energy Window 5keV 7keV 10keV Relative Standard Deviation 0.11% 0.096% 0.11% - Referring to Table 2, the deconvolution operation on the photon counting model by use of other methods, can only grantee data after process to be relatively stable under the width of energy region of at most 4 keV. With the deconvolution operation on the photon counting model by use of the EM solution method, the deviation of the total count is 0.11% under the width of energy region of 10 keV, which achieves a data processing effect by use of the other methods under the width of energy region of 4 keV. It can be seen that, the spectrum after attenuation, that is, the incident spectrum data of the detector containing real attenuation information of material can be obtained by performing the deconvolution operation on the photon counting model by use of the EM solution method, and the data result is very stable.
-
Fig. 6a is a schematic view showing a distribution ratio of photons in respective energy regions detected by a detector in a simulation of a data processing method according to an embodiment of the present disclosure.Fig. 6b is a schematic view showing an energy spectrum actually input to a detector in a simulation of a data processing method according to an embodiment of the present disclosure.Fig. 6c is a schematic view showing a response matrix of a detector in a simulation of a data processing method according to an embodiment of the present disclosure.Fig. 6d is a schematic view showing an incident energy spectrum of a detector obtained in a simulation of a data processing method according to an embodiment of the present disclosure. As shown inFig. 6a , in one test, a distribution ratio of photons in respective energy regions with an incident energy E' of 70 keV is simulated, wherein an abscissa represents photon energy in keV and an ordinate represents a distribution ratio of collected photons in each energy region, and an effect of deconvolution can be seen very clearly.Fig. 6b represents an incident energy spectrum of the detector, andFig. 6c is a detector response matrix A, each column of which is shaped as the detector response function ofFig. 6a . As shown inFig. 6a , electrons generated by photons in the detector crystal boundary might spread to several detector crystal units, and thus each detector crystal unit receives only a part of electrons, resulting in the electronic sharing, due to which, a ratio of the detector response in the energy region of 20-70 is 0.02; a ratio of the detector response recorded by the detector unit in the energy region of 20-30 of photon energy caused by fluorescence of other detector crystal units is between 0.03-0.04; and a ratio of the detector response recorded in the energy region of 20-30 of the photon energy caused by electron escape is between 0.03-0.04. A thin solid line inFig. 6d is exactly the same as that inFig. 6b which represents a real incident energy spectrum, a star line represents energy spectrum actually detected by the detector, and a triangle line represents an incident energy spectrum obtained by deconvolution using EM algorithm. It can be seen fromFig. 6d that the deconvolution operation substantially restores real appearance of the incident energy spectrum. - In an embodiment, at the step S303 of the method, the deconvolution operation may be performed on the counts of photons in respective energy regions in the detected energy spectrum data of the detector by a direct solution method, to obtain the real counts of photons in respective energy regions in the incident energy spectrum data of the detector. It should be understood that the direct solution method is a method for solving an inverse matrix, and for example, the least squares method can be used to solve a real energy spectrum vector x as shown in equation (8):


- Thereby, the real counts of photons in respective energy regions in the incident energy spectrum data of the detector can be obtained. The method is simple in solving, ensures continuity and meanwhile ensures a value of small error. The real spectrum after attenuation of a spectrum penetrating through the substance can be substantially obtained by this method.
- Referring to
Fig. 7 , a series of sinograms after deconvolution can be obtained by performing deconvolution on sinograms of respective energy regions for one detector unit after another, according to the data processing method according to an embodiment of the present disclosure. The sinograms shown inFig. 7 show counts of photons with the detector response removed and containing real attenuation information. After obtaining the sinograms after deconvolution, the sinograms after deconvolution can be used for CT reconstruction, which herein can be understood as a multiple-energy region reconstruction on the attenuation coefficient of the material under inspection detected by the detector. The CT reconstruction may be performed using an analytical reconstruction method, such as the FDK method, or using an iterative reconstruction method, such as the ART method. - As an example, plastic bottled water is selected as an object under inspection to be projected and verify the data processing effect of the data processing method. As shown in
Fig. 8a , in one test, a model of the plastic bottled water is established by the detected energy spectrum data via a multiple-energy region reconstruction performed by the method. As shown inFig. 8b (wherein an abscissa represents photon energy in keV, and an ordinate represents attenuation coefficient of rays in respective energy regions), if the attenuation coefficient of water is obtained by directly reconstructing on the sinogram of each energy region without performing the deconvolution operation on the detected energy spectrum data of the detector for respective energy regions, the detected curve data deviates from the value of theoretical real curve data, because of the presence of the detector response. However, as shown inFig. 8c , for the attenuation coefficient in respective energy regions reconstructed after the deconvolution operation, the detected data is substantially coincident with the value of the theoretical real curve data. -
Fig. 9 is a schematic view showing a structure of adata processing device 900 according to other embodiments of the present disclosure. As shown inFig. 9 , thedata processing device 900 includes acalibrating module 901, a photon countingmodel obtaining module 902, a count ofphotons obtaining module 903, and an incident energy spectrumdata obtaining module 904. Thecalibrating module 901 is configured to perform a detector response calibration based on a detector response obtained by an incidence of rays with known energy into a detector, to obtain a detector response model. The photon countingmodel obtaining module 902 is configured to obtain a photon counting model of the detector between incident energy spectrum data of the detector and detected energy spectrum data of the detector based on the detector response model. The count ofphotons obtaining module 903 is configured to perform a deconvolution operation on counts of photons in respective energy regions in the detected energy spectrum data of the detector based on the photon counting model of the detector, to obtain real counts of photons in respective energy regions in the incident energy spectrum data of the detector. - In an embodiment, the device further includes a multiple-energy region reconstruction module configured for performing the deconvolution operation on the counts of photons in respective energy regions in the detected energy spectrum data of the detector for each detector unit and each incident angle based on the photon counting model of the detector, to obtain real counts of photons in respective energy regions in the incident energy spectrum data of the detector for each detector unit and each incident angle, and combining all sets of the obtained data to achieve multiple-energy region reconstruction of attenuation coefficient of a substance under inspection detected by the detector.
- In an embodiment, the count of
photons obtaining module 903 of the device may perform the deconvolution operation on the counts of photons in respective energy regions in the detected energy spectrum data of the detector by a method of direct solution and adding a constraint term, to obtain the real counts of photons in respective energy regions in the incident energy spectrum data of the detector. - In an embodiment, the count of
photons obtaining module 903 of the device may perform the deconvolution operation on the counts of photons in respective energy regions in the detected energy spectrum data of the detector by an EM solution method, to obtain the real counts of photons in respective energy regions in the incident energy spectrum data of the detector. - In an embodiment, the calibrating
module 901 of the device may perform the detector response calibration by simulating an energy deposition process in a photon detector of the rays with known energy according to metal fluorescence data. - Please refer to
Fig. 10 , which is a schematic view showing a structure of a data processing device according to some embodiments of the present disclosure. The device can employ a general purpose computer system, which can be, in particular, a processor based computer. The data processing device can include an input and output I/O interface 1001, amemory 1002, at least oneprocessor 1003, and at least onecommunication interface 1004. The input/output I/O interface 1001, thememory 1002, the at least oneprocessor 1003, and the at least onecommunication interface 1004 are connected by acommunication bus 1005. The I/O interface 1001 is configured to receive text data from a user apparatus and transmit the text data to theprocessor 1003, wherein the text data is represented in a form of a structured query language SQL. Theprocessor 1003 may be a general purpose central processing unit (CPU), a microprocessor, an application-specific integrated circuit (ASIC), or one or more integrated circuits for controlling execution of programs of the present disclosure. Thecommunication bus 1005 can include a path for communicating information between the components described above. Thecommunication interface 1004 uses devices, such as any transceiver, for communicating with other devices or communication networks, such as Ethernet, Radio Access Network (RAN), and Wireless Local Area Networks (WLAN). The computer system includes one ormore memories 1002, which may be, but is not limited to, read-only memory (ROM) or other types of static storage apparatuses that can store static information and instructions, random access memory (RAM) or other types of dynamic storage apparatuses that can store information and instructions, or Electrically Erasable Programmable Read-Only Memory (EEPROM), CD-ROM (Compact Disc Read-Only Memory, CD-ROM)) or other disc storage, optical disc storage (including compact discs, laser discs, optical discs, digital versatile discs, Blu-ray discs, etc.), disk storage media or other magnetic storage devices, or any other medium capable of carrying or storing desired program code in a form of instructions or data structures and can be accessed by a computer. Thesememories 1002 are coupled to theprocessor 1003 via thecommunication bus 1005. Thememory 1002 is used to store application code for executing the solution of the present disclosure. The application code of the solution of the present disclosure is stored in a memory and controlled by theprocessor 1003 for execution. Theprocessor 1003 is configured to perform the following steps including: performing detector response calibration based on a detector response obtained by an incidence of rays with known energy into a detector to obtain a detector response model; obtaining a photon counting model of the detector between incident energy spectrum data of the detector and detected energy spectrum data of the detector based on the detector response model; and performing a deconvolution operation on counts of photons in respective energy regions in the detected energy spectrum data of the detector based on the photon counting model of the detector, to obtain real counts of photons in respective energy regions in the incident energy spectrum data of the detector. - It should be noted that the term "comprising" or "including" does not exclude an element or component that is not listed in the claims. The article "a" or "an" in front of an element or component does not exclude a case where there are multiple such elements or components.
- In addition, it should be noted that the language used in the specification has been selected for the purpose of readability and teaching, and is not intended to be construed as limiting the subject of the present disclosure. Therefore, many modifications and variations will be apparent to the person skilled in the art without departing from the scope of the present disclosure. The descriptions of the present disclosure are illustrative, and not restrictive, and the scope of the present disclosure is defined by the appended claims.
Claims (11)
- A data processing method, comprising steps of:performing detector response calibration based on a detector response obtained by an incidence of rays with known energy into a detector to obtain a detector response model;obtaining a photon counting model of the detector between incident energy spectrum data of the detector and detected energy spectrum data of the detector based on the detector response model; andperforming a deconvolution operation on counts of photons in respective energy regions in the detected energy spectrum data of the detector based on the photon counting model of the detector, to obtain real counts of photons in respective energy regions in the incident energy spectrum data of the detector.
- The data processing method of claim 1, wherein the deconvolution operation is performed on the counts of photons in respective energy regions in the detected energy spectrum data of the detector for each detector unit and each incident angle based on the photon counting model of the detector, to obtain real counts of photons in respective energy regions in the incident energy spectrum data of the detector for each detector unit and each incident angle, wherein all sets of the obtained data are combined to achieve multiple-energy region reconstruction of attenuation coefficient of a substance under inspection detected by the detector.
- The data processing method of claim 1 or 2, wherein the deconvolution operation is performed on the counts of photons in respective energy regions in the detected energy spectrum data of the detector by a method of direct solution and adding a constraint term, to obtain the real counts of photons in respective energy regions in the incident energy spectrum data of the detector.
- The data processing method of claim 1 or 2, wherein the deconvolution operation is performed on the counts of photons in respective energy regions in the detected energy spectrum data of the detector by an EM solution method, to obtain the real counts of photons in respective energy regions in the incident energy spectrum data of the detector.
- The data processing method of claim 1, wherein the step of performing the detector response calibration comprises a step of simulating an energy deposition process in a photon detector of the rays with known energy according to metal fluorescence data.
- A data processing device comprising:a calibrating module, configured for performing detector response calibration based on a detector response obtained by an incidence of rays with known energy into a detector to obtain a detector response model;a photon counting model obtaining module, configured for obtaining a photon counting model of the detector between incident energy spectrum data of the detector and detected energy spectrum data of the detector based on the detector response model; anda count of photons obtaining module, configured for performing a deconvolution operation on counts of photons in respective energy regions in the detected energy spectrum data of the detector based on the photon counting model of the detector, to obtain real counts of photons in respective energy regions in the incident energy spectrum data of the detector.
- The data processing device of claim 6, further comprising a multiple-energy region reconstruction module configured for performing the deconvolution operation on the counts of photons in respective energy regions in the detected energy spectrum data of the detector for each detector unit and each incident angle based on the photon counting model of the detector, to obtain real counts of photons in respective energy regions in the incident energy spectrum data of the detector for each detector unit and each incident angle, and combining all sets of the obtained data to achieve multiple-energy region reconstruction of attenuation coefficient of a substance under inspection detected by the detector.
- The data processing device of claim 6 or 7, wherein the count of photons obtaining module is further configured for performing the deconvolution operation on the counts of photons in respective energy regions in the detected energy spectrum data of the detector by a method of direct solution and adding a constraint term, to obtain the real counts of photons in respective energy regions in the incident energy spectrum data of the detector.
- The data processing device of claim 6 or 7, wherein the count of photons obtaining module is further configured for performing the deconvolution operation on the counts of photons in respective energy regions in the detected energy spectrum data of the detector by an EM solution method, to obtain the real counts of photons in respective energy regions in the incident energy spectrum data of the detector.
- The data processing device of claim 6, wherein the calibrating module is configured for performing the detector response calibration by simulating an energy deposition process in a photon detector of the rays with known energy according to metal fluorescence data.
- A data processing device, comprising:a memory; anda processor coupled to the memory,wherein the processor is configured for: performing detector responsivity calibration based on a detector responsivity obtained by an incidence of rays with known energy into a detector to obtain a detector responsivity model; obtaining a photon counting model of the detector between incident energy spectrum data of the detector and detected energy spectrum data of the detector based on the detector responsivity model; and performing a deconvolution process on counts of photons in respective energy regions in the detected energy spectrum data of the detector based on the photon counting model of the detector, to obtain real counts of photons in respective energy regions in the incident energy spectrum data of the detector.
Applications Claiming Priority (2)
| Application Number | Priority Date | Filing Date | Title |
|---|---|---|---|
| CN201610630202.3A CN107688194B (en) | 2016-08-03 | 2016-08-03 | Data processing method and data processing device |
| PCT/CN2017/073206 WO2018023960A1 (en) | 2016-08-03 | 2017-02-10 | Data processing method and data processing apparatus |
Publications (3)
| Publication Number | Publication Date |
|---|---|
| EP3495850A1 true EP3495850A1 (en) | 2019-06-12 |
| EP3495850A4 EP3495850A4 (en) | 2020-04-29 |
| EP3495850B1 EP3495850B1 (en) | 2025-03-12 |
Family
ID=61072917
Family Applications (1)
| Application Number | Title | Priority Date | Filing Date |
|---|---|---|---|
| EP17836147.3A Active EP3495850B1 (en) | 2016-08-03 | 2017-02-10 | Data processing method and data processing apparatus |
Country Status (6)
| Country | Link |
|---|---|
| US (1) | US10955572B2 (en) |
| EP (1) | EP3495850B1 (en) |
| CN (1) | CN107688194B (en) |
| AU (1) | AU2017306969A1 (en) |
| SG (1) | SG11201810412WA (en) |
| WO (1) | WO2018023960A1 (en) |
Families Citing this family (7)
| Publication number | Priority date | Publication date | Assignee | Title |
|---|---|---|---|---|
| CN108663708B (en) * | 2018-05-10 | 2020-06-09 | 天津华放科技有限责任公司 | Design method for optimizing energy spectrum resolution |
| CN111525960B (en) | 2019-02-01 | 2022-01-14 | 华为技术有限公司 | Quantum communication method, device and system |
| CN111494813B (en) * | 2020-04-21 | 2022-11-08 | 上海联影医疗科技股份有限公司 | Modeling method, verification method, device, equipment and storage medium |
| CN112288033B (en) * | 2020-11-19 | 2023-04-14 | 武汉生之源生物科技股份有限公司 | A fully automatic fluorescence immunoassay data processing method, system and device |
| CN113517925B (en) * | 2021-05-31 | 2022-05-10 | 中国人民解放军陆军工程大学 | Optical signal detection method and receiving device for wireless optical communication based on photon counting |
| CN115808430A (en) * | 2021-09-14 | 2023-03-17 | 中国科学院高能物理研究所 | X-ray transmittance measuring method, device, apparatus, and medium |
| CN116070419A (en) * | 2022-12-26 | 2023-05-05 | 中南兰信(南京)辐射技术研究院有限公司 | A Comprehensive Analysis Method Based on Deconvolution Calculation of CdZnTe Detector |
Family Cites Families (21)
| Publication number | Priority date | Publication date | Assignee | Title |
|---|---|---|---|---|
| US6740883B1 (en) * | 1998-08-14 | 2004-05-25 | Robert Z. Stodilka | Application of scatter and attenuation correction to emission tomography images using inferred anatomy from atlas |
| US6791090B2 (en) * | 2000-05-17 | 2004-09-14 | Koninklijke Philips Electronics N.V. | Compton deconvolution camera |
| CN101210971A (en) | 2006-12-31 | 2008-07-02 | 同方威视技术股份有限公司 | A radioactive material ray energy range identification method and ray energy range detection system |
| FR2972812B1 (en) | 2011-03-14 | 2014-02-07 | Franco Belge Combustibles | PHOTONIC SPECTROMETRY DEVICE, CORRESPONDING METHOD AND USE OF THE DEVICE |
| CN102279408A (en) * | 2011-03-28 | 2011-12-14 | 核工业西南物理研究院 | Processing method of multichannel energy spectrometry and apparatus thereof |
| EP2866663B1 (en) * | 2012-06-29 | 2016-03-16 | Koninklijke Philips N.V. | Dynamic modeling of imperfections for photon counting detectors |
| US9020092B2 (en) * | 2013-02-19 | 2015-04-28 | Kabushiki Kaisha Toshiba | Apparatus and method for angular response calibration of photon-counting detectors in sparse spectral computed tomography imaging |
| CN103163548B (en) * | 2013-03-07 | 2016-01-20 | 北京永新医疗设备有限公司 | Based on the radioactive substance detection of gamma camera and device thereof and system |
| WO2014176328A1 (en) * | 2013-04-23 | 2014-10-30 | Virginia Tech Intellectual Properties, Inc. | Hybrid detector modules and dynamic thresholding for spectral ct |
| GB201318995D0 (en) * | 2013-10-28 | 2013-12-11 | Kromek Ltd | Method of spectral data detection and manipulation |
| EP2871478B1 (en) | 2013-11-08 | 2020-04-29 | Services Petroliers Schlumberger SA | Method for analyzing fluid and multiphase flow meter |
| US9155515B2 (en) * | 2014-02-26 | 2015-10-13 | Kabushiki Kaisha Toshiba | Registration of 4th generation detectors relative to the 3rd generation CT system coordinates using 4th generation sinogram data |
| CN103853929B (en) * | 2014-03-17 | 2016-06-15 | 东华理工大学 | A kind of based on the low resolution gamma spectrum inversion analysis system and method covering card response matrix |
| US10145968B2 (en) | 2014-05-12 | 2018-12-04 | Purdue Research Foundation | Linear fitting of multi-threshold counting data |
| US10117628B2 (en) * | 2014-10-01 | 2018-11-06 | Toshiba Medical Systems Corporation | Photon counting apparatus |
| WO2016076767A1 (en) * | 2014-11-10 | 2016-05-19 | Prismatic Sensors Ab | X-ray imaging based on image data from a photon-counting multi bin x-ray detector |
| US9872661B2 (en) * | 2014-11-19 | 2018-01-23 | Toshiba Medical Systems Corporation | X-ray CT apparatus, and image processing apparatus |
| US9476993B2 (en) * | 2015-01-07 | 2016-10-25 | Toshiba Medical Systems Corporation | Apparatus and method for computing detector response of a photon-counting detector |
| US9687207B2 (en) * | 2015-04-01 | 2017-06-27 | Toshiba Medical Systems Corporation | Pre-reconstruction calibration, data correction, and material decomposition method and apparatus for photon-counting spectrally-resolving X-ray detectors and X-ray imaging |
| CN104898159B (en) * | 2015-05-13 | 2017-11-03 | 中国科学院苏州生物医学工程技术研究所 | A kind of calibration method of energy resolution CT detectors |
| CN105759304B (en) * | 2016-04-22 | 2018-08-14 | 西北核技术研究所 | A kind of X-ray energy spectrum measurement method based on optical flat diffraction imaging |
-
2016
- 2016-08-03 CN CN201610630202.3A patent/CN107688194B/en active Active
-
2017
- 2017-02-10 EP EP17836147.3A patent/EP3495850B1/en active Active
- 2017-02-10 AU AU2017306969A patent/AU2017306969A1/en not_active Abandoned
- 2017-02-10 SG SG11201810412WA patent/SG11201810412WA/en unknown
- 2017-02-10 WO PCT/CN2017/073206 patent/WO2018023960A1/en not_active Ceased
-
2018
- 2018-09-21 US US16/137,547 patent/US10955572B2/en active Active
Also Published As
| Publication number | Publication date |
|---|---|
| AU2017306969A1 (en) | 2018-12-06 |
| EP3495850B1 (en) | 2025-03-12 |
| CN107688194B (en) | 2020-12-29 |
| US10955572B2 (en) | 2021-03-23 |
| US20190025447A1 (en) | 2019-01-24 |
| SG11201810412WA (en) | 2018-12-28 |
| EP3495850A4 (en) | 2020-04-29 |
| WO2018023960A1 (en) | 2018-02-08 |
| CN107688194A (en) | 2018-02-13 |
Similar Documents
| Publication | Publication Date | Title |
|---|---|---|
| US10955572B2 (en) | Data processing method and device | |
| Wang et al. | Acuros CTS: A fast, linear Boltzmann transport equation solver for computed tomography scatter–Part II: System modeling, scatter correction, and optimization | |
| Taguchi et al. | An analytical model of the effects of pulse pileup on the energy spectrum recorded by energy resolved photon counting x‐ray detectors | |
| Solevi et al. | Performance of MACACO Compton telescope for ion-beam therapy monitoring: first test with proton beams | |
| Lin et al. | A novel technique for measuring the low-dose envelope of pencil-beam scanning spot profiles | |
| Muñoz et al. | Study and comparison of different sensitivity models for a two-plane Compton camera | |
| Ding et al. | Image‐based spectral distortion correction for photon‐counting x‐ray detectors | |
| Yao et al. | Compton-based prompt gamma imaging using ordered origin ensemble algorithm with resolution recovery in proton therapy | |
| Haj-Heidari et al. | Method for developing HPGe detector model in Monte Carlo simulation codes | |
| Granton et al. | A combined dose calculation and verification method for a small animal precision irradiator based on onboard imaging | |
| Hilaire et al. | Proton therapy monitoring by Compton imaging: influence of the large energy spectrum of the prompt-γ radiation | |
| Kohlhase et al. | Capability of MLEM and OE to detect range shifts with a Compton camera in particle therapy | |
| Monk et al. | The HBOM method for unfolding detector effects | |
| US20160135774A1 (en) | X-ray ct apparatus, and image processing apparatus | |
| O'Connell et al. | fastCAT: Fast cone beam CT (CBCT) simulation | |
| CN107688195A (en) | The method and apparatus for rebuilding the power spectrum that detector is detected | |
| Maltz et al. | Focused beam‐stop array for the measurement of scatter in megavoltage portal and cone beam CT imaging | |
| Smith et al. | Small-scale structure in the interstellar medium: time-varying interstellar absorption towards κ Velorum | |
| Duisterwinkel et al. | Spectra of clinical CT scanners using a portable Compton spectrometer | |
| Borwankar et al. | Estimation of expected performance for the MACE γ-ray telescope in low zenith angle range | |
| Rodesch et al. | Comparison of threshold energy calibrations of a photon-counting detector and impact on CT reconstruction | |
| Cajgfinger et al. | Fixed forced detection for fast SPECT Monte-Carlo simulation | |
| Sharma et al. | A framework to model charge sharing and pulse pileup for virtual imaging trials of photon-counting CT | |
| De Beenhouwer et al. | Acceleration of GATE SPECT simulations | |
| Metzner et al. | Energy painting: helium-beam radiography with thin detectors and multiple beam energies |
Legal Events
| Date | Code | Title | Description |
|---|---|---|---|
| STAA | Information on the status of an ep patent application or granted ep patent |
Free format text: STATUS: THE INTERNATIONAL PUBLICATION HAS BEEN MADE |
|
| PUAI | Public reference made under article 153(3) epc to a published international application that has entered the european phase |
Free format text: ORIGINAL CODE: 0009012 |
|
| STAA | Information on the status of an ep patent application or granted ep patent |
Free format text: STATUS: REQUEST FOR EXAMINATION WAS MADE |
|
| 17P | Request for examination filed |
Effective date: 20181115 |
|
| AK | Designated contracting states |
Kind code of ref document: A1 Designated state(s): AL AT BE BG CH CY CZ DE DK EE ES FI FR GB GR HR HU IE IS IT LI LT LU LV MC MK MT NL NO PL PT RO RS SE SI SK SM TR |
|
| AX | Request for extension of the european patent |
Extension state: BA ME |
|
| DAV | Request for validation of the european patent (deleted) | ||
| DAX | Request for extension of the european patent (deleted) | ||
| A4 | Supplementary search report drawn up and despatched |
Effective date: 20200327 |
|
| RIC1 | Information provided on ipc code assigned before grant |
Ipc: G01T 1/36 20060101AFI20200324BHEP Ipc: G01T 7/00 20060101ALI20200324BHEP |
|
| STAA | Information on the status of an ep patent application or granted ep patent |
Free format text: STATUS: EXAMINATION IS IN PROGRESS |
|
| 17Q | First examination report despatched |
Effective date: 20211201 |
|
| GRAP | Despatch of communication of intention to grant a patent |
Free format text: ORIGINAL CODE: EPIDOSNIGR1 |
|
| STAA | Information on the status of an ep patent application or granted ep patent |
Free format text: STATUS: GRANT OF PATENT IS INTENDED |
|
| INTG | Intention to grant announced |
Effective date: 20240911 |
|
| GRAS | Grant fee paid |
Free format text: ORIGINAL CODE: EPIDOSNIGR3 |
|
| GRAA | (expected) grant |
Free format text: ORIGINAL CODE: 0009210 |
|
| STAA | Information on the status of an ep patent application or granted ep patent |
Free format text: STATUS: THE PATENT HAS BEEN GRANTED |
|
| AK | Designated contracting states |
Kind code of ref document: B1 Designated state(s): AL AT BE BG CH CY CZ DE DK EE ES FI FR GB GR HR HU IE IS IT LI LT LU LV MC MK MT NL NO PL PT RO RS SE SI SK SM TR |
|
| REG | Reference to a national code |
Ref country code: GB Ref legal event code: FG4D |
|
| REG | Reference to a national code |
Ref country code: CH Ref legal event code: EP |
|
| REG | Reference to a national code |
Ref country code: DE Ref legal event code: R096 Ref document number: 602017088326 Country of ref document: DE |
|
| REG | Reference to a national code |
Ref country code: IE Ref legal event code: FG4D |
|
| PG25 | Lapsed in a contracting state [announced via postgrant information from national office to epo] |
Ref country code: RS Free format text: LAPSE BECAUSE OF FAILURE TO SUBMIT A TRANSLATION OF THE DESCRIPTION OR TO PAY THE FEE WITHIN THE PRESCRIBED TIME-LIMIT Effective date: 20250612 |
|
| PG25 | Lapsed in a contracting state [announced via postgrant information from national office to epo] |
Ref country code: FI Free format text: LAPSE BECAUSE OF FAILURE TO SUBMIT A TRANSLATION OF THE DESCRIPTION OR TO PAY THE FEE WITHIN THE PRESCRIBED TIME-LIMIT Effective date: 20250312 |
|
| PG25 | Lapsed in a contracting state [announced via postgrant information from national office to epo] |
Ref country code: ES Free format text: LAPSE BECAUSE OF FAILURE TO SUBMIT A TRANSLATION OF THE DESCRIPTION OR TO PAY THE FEE WITHIN THE PRESCRIBED TIME-LIMIT Effective date: 20250312 |
|
| REG | Reference to a national code |
Ref country code: LT Ref legal event code: MG9D |
|
| PG25 | Lapsed in a contracting state [announced via postgrant information from national office to epo] |
Ref country code: NO Free format text: LAPSE BECAUSE OF FAILURE TO SUBMIT A TRANSLATION OF THE DESCRIPTION OR TO PAY THE FEE WITHIN THE PRESCRIBED TIME-LIMIT Effective date: 20250612 |
|
| PG25 | Lapsed in a contracting state [announced via postgrant information from national office to epo] |
Ref country code: HR Free format text: LAPSE BECAUSE OF FAILURE TO SUBMIT A TRANSLATION OF THE DESCRIPTION OR TO PAY THE FEE WITHIN THE PRESCRIBED TIME-LIMIT Effective date: 20250312 |
|
| REG | Reference to a national code |
Ref country code: NL Ref legal event code: MP Effective date: 20250312 |
|
| PG25 | Lapsed in a contracting state [announced via postgrant information from national office to epo] |
Ref country code: LV Free format text: LAPSE BECAUSE OF FAILURE TO SUBMIT A TRANSLATION OF THE DESCRIPTION OR TO PAY THE FEE WITHIN THE PRESCRIBED TIME-LIMIT Effective date: 20250312 |
|
| PG25 | Lapsed in a contracting state [announced via postgrant information from national office to epo] |
Ref country code: GR Free format text: LAPSE BECAUSE OF FAILURE TO SUBMIT A TRANSLATION OF THE DESCRIPTION OR TO PAY THE FEE WITHIN THE PRESCRIBED TIME-LIMIT Effective date: 20250613 Ref country code: BG Free format text: LAPSE BECAUSE OF FAILURE TO SUBMIT A TRANSLATION OF THE DESCRIPTION OR TO PAY THE FEE WITHIN THE PRESCRIBED TIME-LIMIT Effective date: 20250312 |
|
| REG | Reference to a national code |
Ref country code: AT Ref legal event code: MK05 Ref document number: 1775442 Country of ref document: AT Kind code of ref document: T Effective date: 20250312 |
|
| PG25 | Lapsed in a contracting state [announced via postgrant information from national office to epo] |
Ref country code: NL Free format text: LAPSE BECAUSE OF FAILURE TO SUBMIT A TRANSLATION OF THE DESCRIPTION OR TO PAY THE FEE WITHIN THE PRESCRIBED TIME-LIMIT Effective date: 20250312 |
|
| PG25 | Lapsed in a contracting state [announced via postgrant information from national office to epo] |
Ref country code: SE Free format text: LAPSE BECAUSE OF FAILURE TO SUBMIT A TRANSLATION OF THE DESCRIPTION OR TO PAY THE FEE WITHIN THE PRESCRIBED TIME-LIMIT Effective date: 20250312 |
|
| PG25 | Lapsed in a contracting state [announced via postgrant information from national office to epo] |
Ref country code: SM Free format text: LAPSE BECAUSE OF FAILURE TO SUBMIT A TRANSLATION OF THE DESCRIPTION OR TO PAY THE FEE WITHIN THE PRESCRIBED TIME-LIMIT Effective date: 20250312 |
|
| PG25 | Lapsed in a contracting state [announced via postgrant information from national office to epo] |
Ref country code: PT Free format text: LAPSE BECAUSE OF FAILURE TO SUBMIT A TRANSLATION OF THE DESCRIPTION OR TO PAY THE FEE WITHIN THE PRESCRIBED TIME-LIMIT Effective date: 20250714 |
|
| PG25 | Lapsed in a contracting state [announced via postgrant information from national office to epo] |
Ref country code: PL Free format text: LAPSE BECAUSE OF FAILURE TO SUBMIT A TRANSLATION OF THE DESCRIPTION OR TO PAY THE FEE WITHIN THE PRESCRIBED TIME-LIMIT Effective date: 20250312 Ref country code: IT Free format text: LAPSE BECAUSE OF FAILURE TO SUBMIT A TRANSLATION OF THE DESCRIPTION OR TO PAY THE FEE WITHIN THE PRESCRIBED TIME-LIMIT Effective date: 20250312 |
|
| PG25 | Lapsed in a contracting state [announced via postgrant information from national office to epo] |
Ref country code: AT Free format text: LAPSE BECAUSE OF FAILURE TO SUBMIT A TRANSLATION OF THE DESCRIPTION OR TO PAY THE FEE WITHIN THE PRESCRIBED TIME-LIMIT Effective date: 20250312 |
|
| PG25 | Lapsed in a contracting state [announced via postgrant information from national office to epo] |
Ref country code: CZ Free format text: LAPSE BECAUSE OF FAILURE TO SUBMIT A TRANSLATION OF THE DESCRIPTION OR TO PAY THE FEE WITHIN THE PRESCRIBED TIME-LIMIT Effective date: 20250312 Ref country code: EE Free format text: LAPSE BECAUSE OF FAILURE TO SUBMIT A TRANSLATION OF THE DESCRIPTION OR TO PAY THE FEE WITHIN THE PRESCRIBED TIME-LIMIT Effective date: 20250312 |
|
| PG25 | Lapsed in a contracting state [announced via postgrant information from national office to epo] |
Ref country code: RO Free format text: LAPSE BECAUSE OF FAILURE TO SUBMIT A TRANSLATION OF THE DESCRIPTION OR TO PAY THE FEE WITHIN THE PRESCRIBED TIME-LIMIT Effective date: 20250312 |
|
| PG25 | Lapsed in a contracting state [announced via postgrant information from national office to epo] |
Ref country code: SK Free format text: LAPSE BECAUSE OF FAILURE TO SUBMIT A TRANSLATION OF THE DESCRIPTION OR TO PAY THE FEE WITHIN THE PRESCRIBED TIME-LIMIT Effective date: 20250312 |
|
| PG25 | Lapsed in a contracting state [announced via postgrant information from national office to epo] |
Ref country code: IS Free format text: LAPSE BECAUSE OF FAILURE TO SUBMIT A TRANSLATION OF THE DESCRIPTION OR TO PAY THE FEE WITHIN THE PRESCRIBED TIME-LIMIT Effective date: 20250712 |
|
| REG | Reference to a national code |
Ref country code: DE Ref legal event code: R097 Ref document number: 602017088326 Country of ref document: DE |
|
| PG25 | Lapsed in a contracting state [announced via postgrant information from national office to epo] |
Ref country code: DK Free format text: LAPSE BECAUSE OF FAILURE TO SUBMIT A TRANSLATION OF THE DESCRIPTION OR TO PAY THE FEE WITHIN THE PRESCRIBED TIME-LIMIT Effective date: 20250312 |
|
| PLBE | No opposition filed within time limit |
Free format text: ORIGINAL CODE: 0009261 |
|
| STAA | Information on the status of an ep patent application or granted ep patent |
Free format text: STATUS: NO OPPOSITION FILED WITHIN TIME LIMIT |
|
| REG | Reference to a national code |
Ref country code: CH Ref legal event code: L10 Free format text: ST27 STATUS EVENT CODE: U-0-0-L10-L00 (AS PROVIDED BY THE NATIONAL OFFICE) Effective date: 20260121 |
|
| 26N | No opposition filed |
Effective date: 20251215 |
|
| PGFP | Annual fee paid to national office [announced via postgrant information from national office to epo] |
Ref country code: GB Payment date: 20260203 Year of fee payment: 10 |
|
| PGFP | Annual fee paid to national office [announced via postgrant information from national office to epo] |
Ref country code: DE Payment date: 20260217 Year of fee payment: 10 |