EP3484369B1 - Spectral computed tomography fingerprinting - Google Patents
Spectral computed tomography fingerprinting Download PDFInfo
- Publication number
- EP3484369B1 EP3484369B1 EP17737825.4A EP17737825A EP3484369B1 EP 3484369 B1 EP3484369 B1 EP 3484369B1 EP 17737825 A EP17737825 A EP 17737825A EP 3484369 B1 EP3484369 B1 EP 3484369B1
- Authority
- EP
- European Patent Office
- Prior art keywords
- dimensional histogram
- projection data
- cluster
- spectral
- image
- Prior art date
- Legal status (The legal status is an assumption and is not a legal conclusion. Google has not performed a legal analysis and makes no representation as to the accuracy of the status listed.)
- Active
Links
- 230000003595 spectral effect Effects 0.000 title claims description 88
- 238000002591 computed tomography Methods 0.000 title description 37
- 239000000463 material Substances 0.000 claims description 64
- 230000005856 abnormality Effects 0.000 claims description 28
- 238000000034 method Methods 0.000 claims description 28
- 238000003384 imaging method Methods 0.000 claims description 20
- 230000002159 abnormal effect Effects 0.000 claims description 13
- 210000001519 tissue Anatomy 0.000 description 50
- 230000005855 radiation Effects 0.000 description 19
- 230000000694 effects Effects 0.000 description 12
- 210000004072 lung Anatomy 0.000 description 8
- 230000004044 response Effects 0.000 description 7
- 238000000354 decomposition reaction Methods 0.000 description 6
- 210000000577 adipose tissue Anatomy 0.000 description 5
- 230000009977 dual effect Effects 0.000 description 5
- XUIMIQQOPSSXEZ-UHFFFAOYSA-N Silicon Chemical compound [Si] XUIMIQQOPSSXEZ-UHFFFAOYSA-N 0.000 description 4
- 210000005228 liver tissue Anatomy 0.000 description 4
- 229910052710 silicon Inorganic materials 0.000 description 4
- 239000010703 silicon Substances 0.000 description 4
- ZCYVEMRRCGMTRW-UHFFFAOYSA-N 7553-56-2 Chemical compound [I] ZCYVEMRRCGMTRW-UHFFFAOYSA-N 0.000 description 3
- 210000000988 bone and bone Anatomy 0.000 description 3
- 229910052740 iodine Inorganic materials 0.000 description 3
- 239000011630 iodine Substances 0.000 description 3
- 230000004048 modification Effects 0.000 description 3
- 238000012986 modification Methods 0.000 description 3
- 238000001228 spectrum Methods 0.000 description 3
- OYPRJOBELJOOCE-UHFFFAOYSA-N Calcium Chemical compound [Ca] OYPRJOBELJOOCE-UHFFFAOYSA-N 0.000 description 2
- 206010028980 Neoplasm Diseases 0.000 description 2
- 230000004075 alteration Effects 0.000 description 2
- 210000003484 anatomy Anatomy 0.000 description 2
- 229910052791 calcium Inorganic materials 0.000 description 2
- 239000011575 calcium Substances 0.000 description 2
- 210000000845 cartilage Anatomy 0.000 description 2
- 238000004891 communication Methods 0.000 description 2
- 238000013170 computed tomography imaging Methods 0.000 description 2
- 230000001419 dependent effect Effects 0.000 description 2
- 239000007943 implant Substances 0.000 description 2
- 210000004185 liver Anatomy 0.000 description 2
- 210000004872 soft tissue Anatomy 0.000 description 2
- 206010011732 Cyst Diseases 0.000 description 1
- 238000010521 absorption reaction Methods 0.000 description 1
- 230000006399 behavior Effects 0.000 description 1
- 210000000481 breast Anatomy 0.000 description 1
- 238000000701 chemical imaging Methods 0.000 description 1
- 239000002872 contrast media Substances 0.000 description 1
- 208000031513 cyst Diseases 0.000 description 1
- 230000006870 function Effects 0.000 description 1
- 230000003902 lesion Effects 0.000 description 1
- 229910052751 metal Inorganic materials 0.000 description 1
- 239000002184 metal Substances 0.000 description 1
- 239000000203 mixture Substances 0.000 description 1
- 210000000056 organ Anatomy 0.000 description 1
- 229920001296 polysiloxane Polymers 0.000 description 1
- 230000008569 process Effects 0.000 description 1
- 238000012545 processing Methods 0.000 description 1
- 238000000275 quality assurance Methods 0.000 description 1
- 210000000614 rib Anatomy 0.000 description 1
- 230000000007 visual effect Effects 0.000 description 1
- 238000012800 visualization Methods 0.000 description 1
- XLYOFNOQVPJJNP-UHFFFAOYSA-N water Substances O XLYOFNOQVPJJNP-UHFFFAOYSA-N 0.000 description 1
Images


Classifications
-
- A—HUMAN NECESSITIES
- A61—MEDICAL OR VETERINARY SCIENCE; HYGIENE
- A61B—DIAGNOSIS; SURGERY; IDENTIFICATION
- A61B6/00—Apparatus for radiation diagnosis, e.g. combined with radiation therapy equipment
- A61B6/02—Devices for diagnosis sequentially in different planes; Stereoscopic radiation diagnosis
- A61B6/03—Computerised tomographs
- A61B6/032—Transmission computed tomography [CT]
-
- A—HUMAN NECESSITIES
- A61—MEDICAL OR VETERINARY SCIENCE; HYGIENE
- A61B—DIAGNOSIS; SURGERY; IDENTIFICATION
- A61B6/00—Apparatus for radiation diagnosis, e.g. combined with radiation therapy equipment
- A61B6/42—Apparatus for radiation diagnosis, e.g. combined with radiation therapy equipment with arrangements for detecting radiation specially adapted for radiation diagnosis
- A61B6/4208—Apparatus for radiation diagnosis, e.g. combined with radiation therapy equipment with arrangements for detecting radiation specially adapted for radiation diagnosis characterised by using a particular type of detector
- A61B6/4241—Apparatus for radiation diagnosis, e.g. combined with radiation therapy equipment with arrangements for detecting radiation specially adapted for radiation diagnosis characterised by using a particular type of detector using energy resolving detectors, e.g. photon counting
-
- A—HUMAN NECESSITIES
- A61—MEDICAL OR VETERINARY SCIENCE; HYGIENE
- A61B—DIAGNOSIS; SURGERY; IDENTIFICATION
- A61B6/00—Apparatus for radiation diagnosis, e.g. combined with radiation therapy equipment
- A61B6/46—Apparatus for radiation diagnosis, e.g. combined with radiation therapy equipment with special arrangements for interfacing with the operator or the patient
- A61B6/467—Apparatus for radiation diagnosis, e.g. combined with radiation therapy equipment with special arrangements for interfacing with the operator or the patient characterised by special input means
- A61B6/469—Apparatus for radiation diagnosis, e.g. combined with radiation therapy equipment with special arrangements for interfacing with the operator or the patient characterised by special input means for selecting a region of interest [ROI]
-
- A—HUMAN NECESSITIES
- A61—MEDICAL OR VETERINARY SCIENCE; HYGIENE
- A61B—DIAGNOSIS; SURGERY; IDENTIFICATION
- A61B6/00—Apparatus for radiation diagnosis, e.g. combined with radiation therapy equipment
- A61B6/48—Diagnostic techniques
- A61B6/482—Diagnostic techniques involving multiple energy imaging
-
- G—PHYSICS
- G06—COMPUTING; CALCULATING OR COUNTING
- G06T—IMAGE DATA PROCESSING OR GENERATION, IN GENERAL
- G06T7/00—Image analysis
- G06T7/0002—Inspection of images, e.g. flaw detection
- G06T7/0012—Biomedical image inspection
-
- G—PHYSICS
- G16—INFORMATION AND COMMUNICATION TECHNOLOGY [ICT] SPECIALLY ADAPTED FOR SPECIFIC APPLICATION FIELDS
- G16H—HEALTHCARE INFORMATICS, i.e. INFORMATION AND COMMUNICATION TECHNOLOGY [ICT] SPECIALLY ADAPTED FOR THE HANDLING OR PROCESSING OF MEDICAL OR HEALTHCARE DATA
- G16H50/00—ICT specially adapted for medical diagnosis, medical simulation or medical data mining; ICT specially adapted for detecting, monitoring or modelling epidemics or pandemics
- G16H50/20—ICT specially adapted for medical diagnosis, medical simulation or medical data mining; ICT specially adapted for detecting, monitoring or modelling epidemics or pandemics for computer-aided diagnosis, e.g. based on medical expert systems
-
- A—HUMAN NECESSITIES
- A61—MEDICAL OR VETERINARY SCIENCE; HYGIENE
- A61B—DIAGNOSIS; SURGERY; IDENTIFICATION
- A61B6/00—Apparatus for radiation diagnosis, e.g. combined with radiation therapy equipment
- A61B6/46—Apparatus for radiation diagnosis, e.g. combined with radiation therapy equipment with special arrangements for interfacing with the operator or the patient
- A61B6/461—Displaying means of special interest
- A61B6/463—Displaying means of special interest characterised by displaying multiple images or images and diagnostic data on one display
-
- A—HUMAN NECESSITIES
- A61—MEDICAL OR VETERINARY SCIENCE; HYGIENE
- A61B—DIAGNOSIS; SURGERY; IDENTIFICATION
- A61B6/00—Apparatus for radiation diagnosis, e.g. combined with radiation therapy equipment
- A61B6/52—Devices using data or image processing specially adapted for radiation diagnosis
- A61B6/5211—Devices using data or image processing specially adapted for radiation diagnosis involving processing of medical diagnostic data
-
- G—PHYSICS
- G06—COMPUTING; CALCULATING OR COUNTING
- G06T—IMAGE DATA PROCESSING OR GENERATION, IN GENERAL
- G06T2207/00—Indexing scheme for image analysis or image enhancement
- G06T2207/10—Image acquisition modality
- G06T2207/10072—Tomographic images
- G06T2207/10081—Computed x-ray tomography [CT]
Definitions
- the following generally relates to spectral imaging and more particularly to spectral computed tomography (CT) fingerprinting.
- CT computed tomography
- a CT scanner generally includes an x-ray tube mounted on a rotatable gantry opposite one or more integrating detectors.
- the x-ray tube rotates around an examination region located between the x-ray tube and the one or more detectors and emits radiation that traverses the examination region and a subject and/or object disposed in the examination region.
- the one or more detectors detect radiation that traverses the examination region and generate a signal or projection data indicative of the examination region and the subject and/or object disposed therein.
- the projection data is reconstructed to generate volumetric image data, which can be used to generate one or more images.
- the resulting image(s) includes pixels that are represented in terms of gray scale values corresponding to relative radiodensity.
- Such information reflects the attenuation characteristics of the scanned subject and/or object, and generally shows structure such as anatomical structures within a patient, physical structures within an inanimate object, and the like. These images are highly dependent on the X-ray source and properties of the photon detectors.
- the detected radiation also includes spectral information since the absorption of the radiation by the subject and/or object is dependent on the energy of the photons traversing there through.
- spectral information provides additional information such as information indicative of elemental or material composition (e.g., atomic number) of tissue and/or a material of the subject and/or object.
- elemental or material composition e.g., atomic number
- the projection data does not reflect the spectral characteristics as the data it represents is proportional to the energy fluence integrated over the energy spectrum.
- a CT scanner configured for spectral (multi-energy) imaging leverages the spectral characteristics. For example, with a dual energy system, basis images reflecting intrinsic properties of a material being imaged (e.g., the photoelectric effect (PE) and Compton scattering (CS) behavior of each component of the tissue) can be generated. Although such images allow discrimination of materials based on energy attenuation characteristics, they are not well-suited to identify a presence or absence of a particular type of material such as identifying normal and/or diseased tissue of a particular type of tissue.
- PE photoelectric effect
- CS Compton scattering
- US2010/128844 discloses presenting a CT image and a corresponding scatter plot to a viewer.
- the viewer may identify materials (i.e., bone, tissue, etc.) within the image and the scatter plot is updated to identify the points corresponding to the identified materials.
- the image presented to the viewer could present the materials for the different portions of a selected volume, allowing the viewer to more accurately diagnose the presence of a cyst and/or tumor that was initially suspected as being potentially located in the selected volume.
- JP2011/110245 discloses generating a scatter plot that corresponds to a portion of a region of interest within a CT scan and indentify materials in the scatter plot.
- a method in one aspect, includes generating spectral projection data of a subject, including at least first spectral projection data corresponding to a first energy range and second spectral projection data corresponding to a second energy range, wherein the first and the second energy range are different.
- the method further includes constructing an image from a combination of the spectral projection data, and constructing a set of basis images for the energy ranges and from the spectral projection data.
- the method further includes constructing a multi-dimensional histogram from the set of basis images, wherein the multi-dimensional histogram includes at least two axes, a first corresponding to a first basis component and a second corresponding to a second basis component, and the multi-dimensional histogram includes a set of clusters, including one cluster for each material represented in the spectral projection data.
- the method further includes visually presenting, concurrently, the image and the multi-dimensional histogram.
- the method further includes comparing the displayed multi-dimensional histogram with a multi-dimensional histogram for known normal tissue and/or with a multi-dimensional histogram for known abnormal tissue, and depending on the comparison result identifying a presence of an abnormality in the displayed multi-dimensional histogram.
- a system in another aspect, includes a memory storing instructions, including a spectral CT fingerprint module and a processor configured to execute at least instructions corresponding to the spectral CT fingerprint module.
- the instructions cause the processor to: generate spectral projection data of a subject, including at least first spectral projection data corresponding to a first energy range and second spectral projection data corresponding to a second energy range, wherein the first and the second energy range are different, construct an image from a combination of the spectral projection data, construct a set of basis images for the energy ranges and from the spectral projection data, construct a multi-dimensional histogram from the set of basis images, wherein the multi-dimensional histogram includes at least two axes, a first corresponding to a first basis component and a second corresponding to a second basis component, and the multi-dimensional histogram includes a set of clusters, including one cluster for each material represented in the spectral projection data, visually present, concurrently, the image and the multi-dimensional histogram, and compare the
- a computer readable medium is encoded with computer executable instructions, which, when executed by a processor of a computer, cause the processor to: generate spectral projection data of a subject, including at least first spectral projection data corresponding to a first energy range and second spectral projection data corresponding to a second energy range, wherein the first and the second energy range are different, construct an image from a combination of the spectral projection data, construct a set of basis images for the energy ranges and from the spectral projection data, construct a multi-dimensional histogram from the set of basis images, wherein the multi-dimensional histogram includes at least two axes, a first corresponding to a first basis component and a second corresponding to a second basis component, and the multi-dimensional histogram includes a set of clusters, including one cluster for each material represented in the spectral projection data, visually present, concurrently, the image and the multi-dimensional histogram, and compare the displayed multi-dimensional histogram with a multi-dimensional histogram for known
- the invention may take form in various components and arrangements of components, and in various steps and arrangements of steps.
- the drawings are only for purposes of illustrating the preferred embodiments and are not to be construed as limiting the invention.
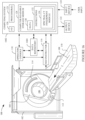
- FIGURE 1 schematically illustrates an imaging system 100 such as a computed tomography (CT) scanner configured for spectral (multi-energy) imaging.
- the imaging system 100 includes a generally stationary gantry 102 and a rotating gantry 104.
- the rotating gantry 104 is rotatably supported by the stationary gantry 102 and rotates around an examination region 106 about a longitudinal or z-axis 108.
- a subject support 110 such as a couch, supports an object or subject in the examination region.
- the subject support 110 is movable in coordination with performing an imaging procedure so as to guide the subject or object with respect to the examination region 106 for loading, scanning, and/or unloading the subject or object.
- a radiation source 112 such as an x-ray tube, is rotatably supported by the rotating gantry 104.
- the radiation source 112 rotates with the rotating gantry 104 and emits poly-chromatic radiation that traverses the examination region 106.
- the radiation source 112 is a (standard) single x-ray tube configured to emit radiation for a single selected peak emission voltage (kVp) of interest (i.e. the energy spectrum at that kVp).
- the radiation source 112 is configured to switch between at least two different emission voltages (e.g., 80 kVp, 140 kVp, etc.) during scanning.
- the radiation source 112 includes two or more x-ray tubes angular offset on the rotating gantry 104 with each configured to emit radiation with a different mean energy spectrum.
- US 8,442,184 B2 to Koninklijke Philips Electronics N.V describes systems with kVp switching and multiple x-ray tubes.
- a radiation sensitive detector array 114 subtends an angular arc opposite the radiation source 112 across the examination region 106.
- the detector array 114 includes one or more rows of detectors that arranged with respect to each other along the z-axis 108 direction and detects radiation traversing the examination region 106.
- the detector array 114 includes an energy-resolving detector such as a multi-layer scintillator/photo-sensor detector.
- US 8,442,184 B2 and US 7,968,853 B2 both to Koninklijke Philips Electronics N.V, describe a multi-layer detector.
- the radiation source 112 includes the standard, the kVp switching and/or the multiple X-ray tube radiation source 112.
- the detector array 114 includes a non-energy-resolving detector, and the radiation source 112 includes the kVp switching and/or the multiple X-ray tube radiation source 112.
- the detector array 114 generates and outputs a signal (projection data) indicative of each of N different energies, where N is an integer equal or greater than two.
- a reconstructor 116 reconstructs the signals (projection data) output by the detector array 114.
- FIGURE 2 schematically illustrates an example of the reconstructor 116.
- the reconstructor 116 receives projection data for each of the N different energies (N energy projection data).
- a spectral decomposer 202 decomposes the N different energies into different basis projection data
- a projection data combiner 204 combines the N different energies into different basis projection data.
- N dual energy
- the spectral decomposer 202 decomposes the first and second energy projection data into photo-electric effect basis projection data and Compton scatter basis projection data.
- the projection data combiner 204 combines the first and second energy projection data to produce combined data equivalent to non-spectral image data.
- a reconstruction processor 206 reconstructs the basis projection data and/or the combined projection data based on reconstruction algorithms from algorithm memory 208. This may include reconstructing one or more basis images (e.g., a first basis image, a second basis image, ..., and an Nth basis image). For example, for the dual energy example, the reconstruction processor 206 can generate a photo-electric effect image, a Compton scatter image, and/or a combination photo-electric effect / Compton scatter image. This may additionally include reconstructing a conventional (non-spectral) image from the combined projection image.
- basis images e.g., a first basis image, a second basis image, ..., and an Nth basis image.
- the reconstruction processor 206 can generate a photo-electric effect image, a Compton scatter image, and/or a combination photo-electric effect / Compton scatter image. This may additionally include reconstructing a conventional (non-spectral) image from the combined projection image.
- image(s) which can be generated from this data include, but are not limited to, low and high energy images, a mono-energetic or monochrome image (e.g., 140 kVp), a virtual non-contrast (or unenhanced) image, an effective Z (atomic number) image, an iodine map, etc.
- the reconstructor 116 outputs the reconstructed images.
- an operator console 118 (computing system) allows an operator to control an operation of the system 100. This includes selecting an imaging acquisition protocol (e.g., multi-energy), selecting a reconstruction algorithm (e.g., multi-energy), invoking scanning, invoking a visualization software application, interacting with an executing visualization software application, etc.
- the operator console 118 includes input/output (I/O) 120 that facilitates communication with at least an output device(s) 122 such as a display monitor, a filmer, etc., an input device(s) 124 such as a mouse, keyboard, etc.
- the operator console 118 further includes at least one processor 125 (e.g., a central processing unit or CPU, a microprocessor, a controller, or the like) and a computer readable storage medium 126 (which excludes transitory medium), such as physical memory and/or other non-transitory memory.
- the computer readable storage medium 128 stores computer readable instructions 132 and data 130.
- the processor 125 executes the instructions 132.
- the illustrated computer readable instructions 130 include at least a spectral CT fingerprint module 134.
- the spectral CT fingerprint module 134 includes instructions for creating a material attenuation decomposition (MAD) plot (or histogram), which serves as a spectral CT fingerprint.
- the spectral CT fingerprint module 128 includes instructions for employing such a MAD plot.
- a spectral CT fingerprint maps spectral CT data indicative of a particular type of tissue/material to that type of tissue/material. As such, the spectral CT fingerprint can be used to construct an image that visually emphasizes a particular type of tissue/material of interest.
- the spectral CT fingerprint can also be used to determine a presence or an absence of a particular type of tissue/material in an image.
- the spectral CT fingerprint can also be used to identify an unknown tissue/material in an image.
- the spectral CT fingerprint is system and energy invariant, and can be used with any CT imaging system. As such, it can also be used to confirm a CT imaging system is properly calibrated.
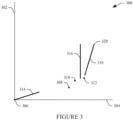
- FIGURE 3 illustrates a theoretical MAD plot 300 for dual energy.
- a first (or y-) axis 302 represents a first basis and a second (or x-) axis represents a second basis.
- the first axis 302 represents photo-electric effect attenuation coefficients and the second axis represents Compton scatter attenuation coefficients.
- the coefficient values are dimensionless or have other units such as Hounsfield (HU).
- the photo-electric effect and Compton scatter attenuation coefficients can be obtained from basis images generated by the reconstructor 116.
- the materials represented in the MAD plot 300 are for explanatory purposes and are not limiting. Other materials, including fewer or more, similar or different, etc. may be represented in other MAD plots. Examples include two mono-energetic images, a low and high energy image pair, etc.
- Each basis in the MAD plot represents another dimension.
- an origin 306 represents air.
- a first cluster 308 provides a spectral CT fingerprint for adipose tissue (fat).
- a second cluster 310 provides a spectral CT fingerprint for water.
- a third cluster 312 provides a spectral CT fingerprint for soft tissue.
- a fourth cluster 314 provides a spectral CT fingerprint for lung tissue. The fourth cluster 314 is spread over a range, e.g., due at least to partial volume effects with air and lung tissue.
- the fifth cluster 316 provides a spectral CT fingerprint for lung iodine.
- the fifth cluster 316 is spread over a range, e.g., as a function of a level of iodine concentration, with higher levels represented by high attenuation coefficient values on the first axis 302.
- the sixth cluster 318 provides a spectral CT fingerprint for calcium.
- the sixth cluster 318 is spread over a range, e.g., due at least to partial volume effects with bone and soft tissue. Pure calcium is represented in this range at 320.
- MAD plots can be generated for any number of tissues/materials. This includes generating a MAD plot for known normal tissue of a particular type and known abnormal tissue of a particular type. For example, a MAD plot can be generated from image data for a population of patients known to have a healthy liver (or other tissue), and another MAD plot can be generated from image data for a population of patients known to have a particular liver (or other tissue) tumor or lesion. The MAD plot can be for the entire body, a particular body part, and/or a particular organ.
- a MAD plot can be generated from image data from scanning a "phantom" constructed with a particular material (e.g., bone) and/or a known distribution of a particular material (e.g., a contrast agent).
- MAD plots can be stored locally (e.g., in the memory 128) and/or remotely (e.g., within a healthcare entity, on a server, in the "cloud,” etc.).
- FIGURES 4-7 illustrate example visualization and use of MAD plots described herein. All of FIGURES 4-7 concurrently show an image and a MAD plot in a graphical user interface (GUI) of a display monitor of the output device 124.
- GUI graphical user interface
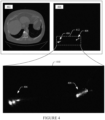
- FIGURE 4 shows a 2-D image 402 and a corresponding MAD plot 404.
- the MAD plot 404 is created based on an entirety of the pixels or voxels of the 2-D image 402. Similar to the MAD plot 300 in FIGURE 3 , the MAD plot 404 is a photo-electric effect vs Compton scatter attenuation coefficient 2-D histogram plot. In this example, the MAD plot 404 is displayed using a predetermined level and window attenuation value settings to visually emphasize details for particular tissue of interest.
- a clusters 406 represent air-like material and clusters 408 represents tissue/fat-like material.
- a magnified view 410 is shown for the region 412.
- regions of interest (ROI's) 502, 504 and 506 are indentified on the 2-D image 402.
- the ROI 502 includes lung tissue
- the ROI 504 includes subqutaneous adipose tissue
- the RIO 506 includes liver tissue.
- These ROI's can be automatically identified (with user approval, rejection or modification), semi- automatically identified through system and user operations, or manually by the user, e.g., via software and an input device 124 such as a mouse.
- the illustrated shapes are not limiting. Other shapes, including predetermined shapes like a square, rectangle, circle, etc. are also contemplated herein.
- the MAP plot 404 is updated to visually emphasive portions of the clusters 406 and 408 which correspond to the ROI's 502, 504 and 506.
- the emphasis can be through color, gray level, outlide, highlight, etc.
- FIGURE 5 the emphasis is shown through the magnified view 410 through gray level, with first highlighting 508 corresponding to the ROI 502 (lung tissue), second highlighting 510 corresponding to the ROI 504 (adipose tissue), and third highlighting 512 corresponding to the ROI 506 (liver tissue).
- the ROI 508 is smeared due to partial volume effects with air and lung tissue.
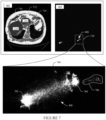
- ROI's 602, 604 and 606 are indentified on the MAD plot 404.
- the ROI's 602, 604 and 606 can be, semi-automatically or manually identified.
- one or more of the ROI's 602, 604 and 606 may correspond to known tissue that is to be visuallized in the image 402.
- the ROI's corrspond to unknown tissue.
- a magnified view 608 of the clusters 406 ( FIGURE 4 ) for the air-like material is for a region 610.
- the region 610 can be identified in the MAD plot 404 by comparing the MAD plot 404 with a MAD plot for the tissue of interest. Since a MAD plot provides a fingerprint for the tissue, a region in the MAD plot 404 matching a region in a MAD plot for tissue identifies the region in the MAD plot 404 for that tissue. An ROI can then be placed on the matching region. Where there is no matching MAD plot or the user wants to see what anatomy corresponds to a particular region of the MAD plot, an ROI can be placed on the region. In FIGURE 6 , the ROI's 602, 604 and 606 correspond to air, bedfoam and lungs.
- the 2-D image 402 is updated to visually emphasize portions of the 2-D image 402 which correspond to the ROI's 602, 604 and 606.
- the emphasis can be through color, gray level, outlide, highlight, etc.
- the emphasis is shown through gray level, with first highlighting 612 corresponding to the ROI 602 (air), second highlighting 614 corresponding to the ROI 604 (bedfoam), and third highlighting 616 corresponding to the ROI 606 (lung).
- a suitable material decomposition can be created for that material, and the reconstructor 116 can process the received N energy projection data using that material decomposition.
- a MAD plot may be used to identify pixels or voxels corresponding to a silicon breast implant by identifying a cluster for silicon in a MAD plot. The cluster can be identified, and then a silicon basis image can be generated, silicon in a conventional non-spectral image can be highlighted, etc.
- ROI's 702, 704 and 706 are indentified on the MAD plot 404.
- the ROI's 702, 704 and 706 can be semi-automatically or manually identified.
- one or more of the ROI's 702, 704 and 706 may correspond to known tissue that is to be visuallized in the image 402.
- a magnified view 708 of the clusters 408 ( FIGURE 4 ) for the tissue/fat-like material is for a region 710.
- the region 710 can be identified in the MAD plot 404 by comparing the MAD plot 404 with a MAD plot for the tissue of interest.
- the ROI's 702, 704 and 706 correspond to adipose tissue, liver tissue and rib cartilage.
- the 2-D image 402 is updated with the first highlighting 712 corresponding to the ROI 702 (adipose tissue), second highlighting 714 corresponding to the ROI 704 (liver tissue), and third highlighting 716 corresponding to the ROI 706 (rib cartilage).
- the emphasis can be through color, gray level, outlide, highlight, etc.
- the locations of pixels in the MAD plots depend on known properties (i.e., the coefficients of attenuation for the photoelectric effect and Compton scattering) of tissues and elements within the human body. These locations occupy a small fraction of the entire MAD plot. Any pixels outside of these ranges arise either from foreign objects or materials within the body (i.e., metal appliances or silicone implants) or from artifacts due to errors in signal acquisition or image reconstruction. The precise patterns and/or the positions of these artifacts can provide clues regarding their origin and nature. Thus MAD plots could provide a tool for both assessing and improving scanner performance.
- FIGURES 8-14 present various methods in connection with a MAD plot described herein. It is to be appreciated that the ordering of the acts in the method is not limiting. As such, other orderings are contemplated herein. In addition, one or more acts may be omitted and/or one or more additional acts may be included.
- FIGURE 8 illustrates an example method for creating a spectral CT fingerprint in connection with a multi-energy projection data.
- a spectral scan of a subject or object including a material of interest (MOI) is performed, creating multi-energy projection data, each set of projection data corresponding to a different energy.
- MOI material of interest
- a plurality of basis images is generated with the multi-energy projection data, each basis image corresponding to a different energy.
- a MAD plot is created from the plurality of basis images.
- a cluster in the MAD plot corresponding to the material of interest is identified in the MAD plot. This can be achieved using known photo-electric effect and Compton scatter attenuation coefficients from the literature and/or otherwise, data from previous scans with and without the material interest, and/or otherwise.
- the cluster is labeled to associate the cluster with the material of interest.
- the MAD plot is saved, e.g., to computer memory for use.
- FIGURE 9 illustrates another example method for creating a spectral CT fingerprint in connection with a multi-energy projection data.
- a spectral scan of a subject or object including a material of interest in addition to the material of interest in FIGURE 8 is performed, creating multi-energy projection data.
- a plurality of basis images is generated with the multi-energy projection data as described herein.
- a MAD plot is created from the plurality of basis images.
- a cluster in the MAD plot corresponding to the different material of interest is located in the MAD plot by comparing the MAD plot with the stored MAD plot from FIGURE 8 to locate a cluster in the MAD plot that is not in the stored MAD plot.
- the cluster is labeled to associate the cluster with the different material of interest.
- FIGURE 10 illustrates another example method for creating a spectral CT fingerprint in connection with a multi-energy projection data.
- a first spectral scan of a first subject or object including without a material of interest is performed, creating first projection data.
- a second spectral scan of a second subject or object including with the material of interest is performed, creating second projection data.
- the projection data of acts 1002 and 1004 can be newly acquired projection data and/or projection data mined from previous examinations. Furthermore, act 1004 can be before act 1002.
- a first plurality of basis images is generated with the first projection data.
- a second plurality of basis images is generated with the second projection data.
- a first MAD plot is created from the first plurality of basis images.
- a second MAD plot is created from the second plurality of basis images.
- a cluster in the first MAD plot corresponding to the material of interest is located by comparing the first and second MAD plots to locate a cluster in the first MAD plot that is absent from the second MAD plot.
- the cluster is labeled to associate the cluster with the material of interest.
- the first MAD plot is saved.
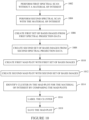
- FIGURE 11 illustrates example method for identifying a presence and/or a type of abnormality in connection with a multi-energy projection data.
- a spectral scan of a subject is performed, creating projection data.
- a plurality of basis images is generated with the projection data.
- a MAD plot is created from the plurality of basis images.
- the MAD plot is compared with a MAD plot for normal tissue.
- the subject has an abnormality in response to the MAD plot including a cluster that is absent from the MAD plot for the normal tissue.
- the MAD plot is compared with a MAD plot for an abnormality.
- the subject has the abnormality in response to the MAD plot including a cluster that matches a cluster representing the abnormality in the MAD plot for the abnormality.
- acts 1108 and 1110 are omitted and the MAD plot is compared only with the MAD plot for the abnormality.
- acts 1112 and 1114 are omitted and the MAD plot is compared only with the MAD plot for the normal tissue.
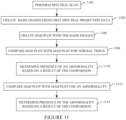
- FIGURE 12 illustrates example method for identifying an absence of an abnormality in connection with a multi-energy projection data.
- a spectral scan of a subject is performed, creating projection data.
- a plurality of basis images is generated with the projection data.
- a MAD plot is created from the plurality of basis images.
- the MAD plot is compared with a MAD plot for the normal tissue.
- the subject does not have an abnormality in response to the MAD plot matching the MAD plot for the normal tissue.
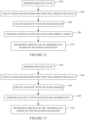
- FIGURE 13 illustrates example method for identifying an absence of an abnormality in connection with a multi-energy projection data.
- a spectral scan of a subject is performed, creating projection data.
- a plurality of basis images is generated with the projection data.
- a MAD plot is created from the plurality of basis images.
- the MAD plot is compared with a MAD plot for an abnormality.
- the subject does not have the abnormality in response to the MAD plot including a cluster that matches a cluster representing the abnormality in the MAD plot for the abnormality.
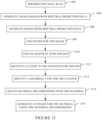
- FIGURE 14 illustrates example method for visualizing tissue of interest in an image in connection with a multi-energy projection data.
- a spectral scan of a subject is performed, creating projection data.
- a plurality of basis images is generated with the projection data.
- a MAD plot is created from the plurality of basis images.
- a cluster of the MAD plot corresponding to the tissue of interest is identified. This can be achieved by comparing the MAD plot with a MAD plot for the tissue of interest and/or otherwise.
- a ROI is created for the cluster.
- an image is generated with the projection data.
- pixels or voxels corresponding to the tissue of interest are highlighted in the image for the material represented by the cluster.
- FIGURE 15 illustrates example method for identifying tissue of interest in an image in connection with a multi-energy projection data.
- a spectral scan of a subject is performed, creating projection data.
- a plurality of basis images is generated with the projection data.
- an image is generated with the projection data.
- an ROI is created in the image.
- a MAD plot is created for the ROI.
- a cluster of the MAD plot corresponding to the ROI is identified.
- a type material in the ROI is identified by the cluster. This can be achieved by comparing the MAD plot with MAD plots for different types of materials and/or otherwise.
- a material decomposition is created with the identified material.
- a spectral image for the material is generated using the material decomposition.
- the acts herein may be implemented by way of computer readable instructions, encoded or embedded on computer readable storage medium, which, when executed by a computer processor(s), cause the processor(s) to carry out the described acts. Additionally, or alternatively, at least one of the computer readable instructions is carried by a signal, carrier wave or other transitory medium.
- FIGURE 16 schematically illustrates a variation of FIGURE 1 in which the components of the operator console 118 related to the spectral CT fingerprint module 132 are part of a computing system 1602, which is a separate apparatus from the imaging system 100.
- the operator console 118 includes a human readable output device such as a monitor or display and an input device such as a keyboard and mouse, and software resident on the console 118 allows the operator to interact with the scanner 100.
- the instructions 130 include a reconstructor to reconstruct volumetric image data.
- the computing system 160 can receive projection from the imaging system 100 (the console 118 and/or the reconstructor 116), a data repository 1604, another imaging system, and/or other device.
- An example of suitable data repository 1604 is a picture archiving and communication system (PACS), a radiology information system (RIS), a hospital information system (HIS), an electronic medical record (EMR), a database, a server, an imaging system, and/or other data repository.
- PACS picture archiving and communication system
- RIS radiology information system
- HIS hospital information system
- EMR electronic medical record
- database a server, an imaging system, and/or other data repository.
- the MAD plot discussed herein can also be used for quality assurance. For example, since a MAD plot for a particular material is independent of the X-ray source and the detector array, a plurality of imaging system can be tested by scanning a phantom including a particular material, generating a MAD plot for each imaging system for that material, and comparing the MAD plots with a known valid reference MAD plot(s) for that material. If a MAD plot for an imaging system deviates from the reference MAD plot(s), the imaging system, e.g., can be re-calibrated.
Description
- The following generally relates to spectral imaging and more particularly to spectral computed tomography (CT) fingerprinting.
- A CT scanner generally includes an x-ray tube mounted on a rotatable gantry opposite one or more integrating detectors. The x-ray tube rotates around an examination region located between the x-ray tube and the one or more detectors and emits radiation that traverses the examination region and a subject and/or object disposed in the examination region. The one or more detectors detect radiation that traverses the examination region and generate a signal or projection data indicative of the examination region and the subject and/or object disposed therein.
- The projection data is reconstructed to generate volumetric image data, which can be used to generate one or more images. The resulting image(s) includes pixels that are represented in terms of gray scale values corresponding to relative radiodensity. Such information reflects the attenuation characteristics of the scanned subject and/or object, and generally shows structure such as anatomical structures within a patient, physical structures within an inanimate object, and the like. These images are highly dependent on the X-ray source and properties of the photon detectors.
- The detected radiation also includes spectral information since the absorption of the radiation by the subject and/or object is dependent on the energy of the photons traversing there through. Such spectral information provides additional information such as information indicative of elemental or material composition (e.g., atomic number) of tissue and/or a material of the subject and/or object. However, with conventional CT, the projection data does not reflect the spectral characteristics as the data it represents is proportional to the energy fluence integrated over the energy spectrum.
- A CT scanner configured for spectral (multi-energy) imaging leverages the spectral characteristics. For example, with a dual energy system, basis images reflecting intrinsic properties of a material being imaged (e.g., the photoelectric effect (PE) and Compton scattering (CS) behavior of each component of the tissue) can be generated. Although such images allow discrimination of materials based on energy attenuation characteristics, they are not well-suited to identify a presence or absence of a particular type of material such as identifying normal and/or diseased tissue of a particular type of tissue.
-
US2010/128844 discloses presenting a CT image and a corresponding scatter plot to a viewer. The viewer may identify materials (i.e., bone, tissue, etc.) within the image and the scatter plot is updated to identify the points corresponding to the identified materials. The image presented to the viewer could present the materials for the different portions of a selected volume, allowing the viewer to more accurately diagnose the presence of a cyst and/or tumor that was initially suspected as being potentially located in the selected volume. -
JP2011/110245 - Aspects described herein address the above-referenced problems and others.
- In one aspect, a method includes generating spectral projection data of a subject, including at least first spectral projection data corresponding to a first energy range and second spectral projection data corresponding to a second energy range, wherein the first and the second energy range are different. The method further includes constructing an image from a combination of the spectral projection data, and constructing a set of basis images for the energy ranges and from the spectral projection data. The method further includes constructing a multi-dimensional histogram from the set of basis images, wherein the multi-dimensional histogram includes at least two axes, a first corresponding to a first basis component and a second corresponding to a second basis component, and the multi-dimensional histogram includes a set of clusters, including one cluster for each material represented in the spectral projection data. The method further includes visually presenting, concurrently, the image and the multi-dimensional histogram. The method further includes comparing the displayed multi-dimensional histogram with a multi-dimensional histogram for known normal tissue and/or with a multi-dimensional histogram for known abnormal tissue, and depending on the comparison result identifying a presence of an abnormality in the displayed multi-dimensional histogram.
- In another aspect, a system includes a memory storing instructions, including a spectral CT fingerprint module and a processor configured to execute at least instructions corresponding to the spectral CT fingerprint module. The instructions cause the processor to: generate spectral projection data of a subject, including at least first spectral projection data corresponding to a first energy range and second spectral projection data corresponding to a second energy range, wherein the first and the second energy range are different, construct an image from a combination of the spectral projection data, construct a set of basis images for the energy ranges and from the spectral projection data, construct a multi-dimensional histogram from the set of basis images, wherein the multi-dimensional histogram includes at least two axes, a first corresponding to a first basis component and a second corresponding to a second basis component, and the multi-dimensional histogram includes a set of clusters, including one cluster for each material represented in the spectral projection data, visually present, concurrently, the image and the multi-dimensional histogram, and compare the displayed multi-dimensional histogram with a multi-dimensional histogram for known normal tissue and/or with a multi-dimensional histogram for known abnormal tissue, and depending on the comparison result identify a presence of an abnormality in the displayed multi-dimensional histogram.
- In another aspect, a computer readable medium is encoded with computer executable instructions, which, when executed by a processor of a computer, cause the processor to: generate spectral projection data of a subject, including at least first spectral projection data corresponding to a first energy range and second spectral projection data corresponding to a second energy range, wherein the first and the second energy range are different, construct an image from a combination of the spectral projection data, construct a set of basis images for the energy ranges and from the spectral projection data, construct a multi-dimensional histogram from the set of basis images, wherein the multi-dimensional histogram includes at least two axes, a first corresponding to a first basis component and a second corresponding to a second basis component, and the multi-dimensional histogram includes a set of clusters, including one cluster for each material represented in the spectral projection data, visually present, concurrently, the image and the multi-dimensional histogram, and compare the displayed multi-dimensional histogram with a multi-dimensional histogram for known normal tissue and/or with a multi-dimensional histogram for known abnormal tissue, and depending on the comparison result identify a presence of an abnormality in the displayed multi-dimensional histogram.
- The invention may take form in various components and arrangements of components, and in various steps and arrangements of steps. The drawings are only for purposes of illustrating the preferred embodiments and are not to be construed as limiting the invention.
-
FIGURE 1 schematically illustrates an imaging system including a console with a spectral CT fingerprint module. -
FIGURE 2 schematically illustrates an example of a reconstructor of the imaging system. -
FIGURE 3 graphically illustrates a theoretical material attenuation decomposition (MAD) plot for dual energy projection data. -
FIGURE 4 depicts visual display of a 2-D image and a corresponding MAD plot. -
FIGURE 5 depicts the 2-D image ofFIGURE 4 with ROI's identified therein and an updated MAD plot highlighting clusters corresponding to the materials in the ROI's. -
FIGURE 6 depicts the MAD plot ofFIGURE 4 with ROI's identified therein for a first region and an updated 2-D image highlighting pixels or voxels corresponding to the materials represented in the ROI's. -
FIGURE 7 depicts the MAD plot ofFIGURE 4 with ROI's identified therein for a second different region and an updated 2-D image highlighting pixels or voxels corresponding to the materials represented in the ROI's. -
FIGURE 8 illustrates an example method for creating a spectral CT fingerprint in connection with multi-energy projection data. -
FIGURE 9 illustrates another example method for creating a spectral CT fingerprint in connection with multi-energy projection data. -
FIGURE 10 illustrates yet another example method for creating a spectral CT fingerprint in connection with multi-energy projection data. -
FIGURE 11 illustrates example method for identifying a presence and/or a type of abnormality in connection with multi-energy projection data. -
FIGURE 12 illustrates example method for identifying an absence of an abnormality in connection with multi-energy projection data. -
FIGURE 13 illustrates another example method for identifying an absence of an abnormality in connection with multi-energy projection data. -
FIGURE 14 illustrate example method for visualizing tissue of interest in an image in connection with multi-energy projection data. -
FIGURE 15 illustrate example method for identifying tissue of interest in an image in connection with multi-energy projection data. -
FIGURE 16 schematically illustrates a variation ofFIGURE 1 in which the spectral CT fingerprint module is part of a system remote from the imaging system. -
FIGURE 1 schematically illustrates animaging system 100 such as a computed tomography (CT) scanner configured for spectral (multi-energy) imaging. Theimaging system 100 includes a generallystationary gantry 102 and a rotatinggantry 104. The rotatinggantry 104 is rotatably supported by thestationary gantry 102 and rotates around anexamination region 106 about a longitudinal or z-axis 108. Asubject support 110, such as a couch, supports an object or subject in the examination region. Thesubject support 110 is movable in coordination with performing an imaging procedure so as to guide the subject or object with respect to theexamination region 106 for loading, scanning, and/or unloading the subject or object. - A
radiation source 112, such as an x-ray tube, is rotatably supported by the rotatinggantry 104. Theradiation source 112 rotates with the rotatinggantry 104 and emits poly-chromatic radiation that traverses theexamination region 106. In the illustrated embodiment, theradiation source 112 is a (standard) single x-ray tube configured to emit radiation for a single selected peak emission voltage (kVp) of interest (i.e. the energy spectrum at that kVp). In another instance, theradiation source 112 is configured to switch between at least two different emission voltages (e.g., 80 kVp, 140 kVp, etc.) during scanning. In yet another instance, theradiation source 112 includes two or more x-ray tubes angular offset on the rotatinggantry 104 with each configured to emit radiation with a different mean energy spectrum.US 8,442,184 B2 to Koninklijke Philips Electronics N.V describes systems with kVp switching and multiple x-ray tubes. - A radiation
sensitive detector array 114 subtends an angular arc opposite theradiation source 112 across theexamination region 106. Thedetector array 114 includes one or more rows of detectors that arranged with respect to each other along the z-axis 108 direction and detects radiation traversing theexamination region 106. In the illustrated embodiment, thedetector array 114 includes an energy-resolving detector such as a multi-layer scintillator/photo-sensor detector.US 8,442,184 B2 andUS 7,968,853 B2 , both to Koninklijke Philips Electronics N.V, describe a multi-layer detector. With an energy-resolving detector, theradiation source 112 includes the standard, the kVp switching and/or the multiple X-raytube radiation source 112. In another instance, thedetector array 114 includes a non-energy-resolving detector, and theradiation source 112 includes the kVp switching and/or the multiple X-raytube radiation source 112. Thedetector array 114 generates and outputs a signal (projection data) indicative of each of N different energies, where N is an integer equal or greater than two. - A
reconstructor 116 reconstructs the signals (projection data) output by thedetector array 114.FIGURE 2 schematically illustrates an example of thereconstructor 116. In this example, thereconstructor 116 receives projection data for each of the N different energies (N energy projection data). Aspectral decomposer 202 decomposes the N different energies into different basis projection data, and aprojection data combiner 204 combines the N different energies into different basis projection data. For example, for a dual energy (N=2), such as first (higher) and second (lower) energy, configuration, thespectral decomposer 202 decomposes the first and second energy projection data into photo-electric effect basis projection data and Compton scatter basis projection data. For this same case, theprojection data combiner 204 combines the first and second energy projection data to produce combined data equivalent to non-spectral image data. - A
reconstruction processor 206 reconstructs the basis projection data and/or the combined projection data based on reconstruction algorithms fromalgorithm memory 208. This may include reconstructing one or more basis images (e.g., a first basis image, a second basis image, ..., and an Nth basis image). For example, for the dual energy example, thereconstruction processor 206 can generate a photo-electric effect image, a Compton scatter image, and/or a combination photo-electric effect / Compton scatter image. This may additionally include reconstructing a conventional (non-spectral) image from the combined projection image. Other image(s) which can be generated from this data include, but are not limited to, low and high energy images, a mono-energetic or monochrome image (e.g., 140 kVp), a virtual non-contrast (or unenhanced) image, an effective Z (atomic number) image, an iodine map, etc. Thereconstructor 116 outputs the reconstructed images. - Returning to
FIGURE 1 , an operator console 118 (computing system) allows an operator to control an operation of thesystem 100. This includes selecting an imaging acquisition protocol (e.g., multi-energy), selecting a reconstruction algorithm (e.g., multi-energy), invoking scanning, invoking a visualization software application, interacting with an executing visualization software application, etc. Theoperator console 118 includes input/output (I/O) 120 that facilitates communication with at least an output device(s) 122 such as a display monitor, a filmer, etc., an input device(s) 124 such as a mouse, keyboard, etc. Theoperator console 118 further includes at least one processor 125 (e.g., a central processing unit or CPU, a microprocessor, a controller, or the like) and a computer readable storage medium 126 (which excludes transitory medium), such as physical memory and/or other non-transitory memory. The computerreadable storage medium 128 stores computerreadable instructions 132 anddata 130. Theprocessor 125 executes theinstructions 132. - The illustrated computer
readable instructions 130 include at least a spectralCT fingerprint module 134. In one instance, the spectralCT fingerprint module 134 includes instructions for creating a material attenuation decomposition (MAD) plot (or histogram), which serves as a spectral CT fingerprint. Additionally, or alternatively, the spectralCT fingerprint module 128 includes instructions for employing such a MAD plot. A spectral CT fingerprint, as utilized herein, maps spectral CT data indicative of a particular type of tissue/material to that type of tissue/material. As such, the spectral CT fingerprint can be used to construct an image that visually emphasizes a particular type of tissue/material of interest. The spectral CT fingerprint can also be used to determine a presence or an absence of a particular type of tissue/material in an image. The spectral CT fingerprint can also be used to identify an unknown tissue/material in an image. The spectral CT fingerprint is system and energy invariant, and can be used with any CT imaging system. As such, it can also be used to confirm a CT imaging system is properly calibrated. -
FIGURE 3 illustrates atheoretical MAD plot 300 for dual energy. A first (or y-)axis 302 represents a first basis and a second (or x-) axis represents a second basis. In the illustrated embodiment, thefirst axis 302 represents photo-electric effect attenuation coefficients and the second axis represents Compton scatter attenuation coefficients. In a variation, the coefficient values are dimensionless or have other units such as Hounsfield (HU). The photo-electric effect and Compton scatter attenuation coefficients can be obtained from basis images generated by thereconstructor 116. The materials represented in theMAD plot 300 are for explanatory purposes and are not limiting. Other materials, including fewer or more, similar or different, etc. may be represented in other MAD plots. Examples include two mono-energetic images, a low and high energy image pair, etc. Each basis in the MAD plot represents another dimension. - In the
MAD plot 300, anorigin 306 represents air. Afirst cluster 308 provides a spectral CT fingerprint for adipose tissue (fat). Asecond cluster 310 provides a spectral CT fingerprint for water. Athird cluster 312 provides a spectral CT fingerprint for soft tissue. Afourth cluster 314 provides a spectral CT fingerprint for lung tissue. Thefourth cluster 314 is spread over a range, e.g., due at least to partial volume effects with air and lung tissue. Thefifth cluster 316 provides a spectral CT fingerprint for lung iodine. Thefifth cluster 316 is spread over a range, e.g., as a function of a level of iodine concentration, with higher levels represented by high attenuation coefficient values on thefirst axis 302. Thesixth cluster 318 provides a spectral CT fingerprint for calcium. Thesixth cluster 318 is spread over a range, e.g., due at least to partial volume effects with bone and soft tissue. Pure calcium is represented in this range at 320. - Returning to
FIGURE 1 , MAD plots can be generated for any number of tissues/materials. This includes generating a MAD plot for known normal tissue of a particular type and known abnormal tissue of a particular type. For example, a MAD plot can be generated from image data for a population of patients known to have a healthy liver (or other tissue), and another MAD plot can be generated from image data for a population of patients known to have a particular liver (or other tissue) tumor or lesion. The MAD plot can be for the entire body, a particular body part, and/or a particular organ. In another example, a MAD plot can be generated from image data from scanning a "phantom" constructed with a particular material (e.g., bone) and/or a known distribution of a particular material (e.g., a contrast agent). MAD plots can be stored locally (e.g., in the memory 128) and/or remotely (e.g., within a healthcare entity, on a server, in the "cloud," etc.). - MAD plots can be visually displayed, via a display monitor of the
output device 124, concurrently with an image, individually, and/or alternately with an image.FIGURES 4-7 illustrate example visualization and use of MAD plots described herein. All ofFIGURES 4-7 concurrently show an image and a MAD plot in a graphical user interface (GUI) of a display monitor of theoutput device 124. -
FIGURE 4 shows a 2-D image 402 and acorresponding MAD plot 404. TheMAD plot 404 is created based on an entirety of the pixels or voxels of the 2-D image 402. Similar to theMAD plot 300 inFIGURE 3 , theMAD plot 404 is a photo-electric effect vs Compton scatter attenuation coefficient 2-D histogram plot. In this example, theMAD plot 404 is displayed using a predetermined level and window attenuation value settings to visually emphasize details for particular tissue of interest. Aclusters 406 represent air-like material andclusters 408 represents tissue/fat-like material. A magnifiedview 410 is shown for theregion 412. - In
FIGURE 5 , regions of interest (ROI's) 502, 504 and 506 are indentified on the 2-D image 402. TheROI 502 includes lung tissue, theROI 504 includes subqutaneous adipose tissue, and theRIO 506 includes liver tissue. These ROI's can be automatically identified (with user approval, rejection or modification), semi- automatically identified through system and user operations, or manually by the user, e.g., via software and aninput device 124 such as a mouse. The illustrated shapes are not limiting. Other shapes, including predetermined shapes like a square, rectangle, circle, etc. are also contemplated herein. - In response to the identification of the ROI's 502, 504 and 506 on the 2-
D image 402, theMAP plot 404 is updated to visually emphasive portions of theclusters FIGURE 5 , the emphasis is shown through the magnifiedview 410 through gray level, with first highlighting 508 corresponding to the ROI 502 (lung tissue), second highlighting 510 corresponding to the ROI 504 (adipose tissue), and third highlighting 512 corresponding to the ROI 506 (liver tissue). TheROI 508 is smeared due to partial volume effects with air and lung tissue. - In
FIGURE 6 , ROI's 602, 604 and 606 are indentified on theMAD plot 404. Likewise, the ROI's 602, 604 and 606 can be, semi-automatically or manually identified. In one instance, one or more of the ROI's 602, 604 and 606 may correspond to known tissue that is to be visuallized in theimage 402. In another instance, the ROI's corrspond to unknown tissue. A magnifiedview 608 of the clusters 406 (FIGURE 4 ) for the air-like material is for aregion 610. - The
region 610 can be identified in theMAD plot 404 by comparing theMAD plot 404 with a MAD plot for the tissue of interest. Since a MAD plot provides a fingerprint for the tissue, a region in theMAD plot 404 matching a region in a MAD plot for tissue identifies the region in theMAD plot 404 for that tissue. An ROI can then be placed on the matching region. Where there is no matching MAD plot or the user wants to see what anatomy corresponds to a particular region of the MAD plot, an ROI can be placed on the region. InFIGURE 6 , the ROI's 602, 604 and 606 correspond to air, bedfoam and lungs. - In response to the identification of the ROI's 602, 604 and 606 on the
MAD plot 404, the 2-D image 402 is updated to visually emphasize portions of the 2-D image 402 which correspond to the ROI's 602, 604 and 606. Likewise, the emphasis can be through color, gray level, outlide, highlight, etc. InFIGURE 6 , the emphasis is shown through gray level, with first highlighting 612 corresponding to the ROI 602 (air), second highlighting 614 corresponding to the ROI 604 (bedfoam), and third highlighting 616 corresponding to the ROI 606 (lung). - If the user desires to see an image specific to a material corresponding to a ROI in the
MAD plot 404, a suitable material decomposition can be created for that material, and thereconstructor 116 can process the received N energy projection data using that material decomposition. For example, a MAD plot may be used to identify pixels or voxels corresponding to a silicon breast implant by identifying a cluster for silicon in a MAD plot. The cluster can be identified, and then a silicon basis image can be generated, silicon in a conventional non-spectral image can be highlighted, etc. - In
FIGURE 7 , ROI's 702, 704 and 706 are indentified on theMAD plot 404. Likewise, the ROI's 702, 704 and 706 can be semi-automatically or manually identified. In one instance, one or more of the ROI's 702, 704 and 706 may correspond to known tissue that is to be visuallized in theimage 402. A magnifiedview 708 of the clusters 408 (FIGURE 4 ) for the tissue/fat-like material is for aregion 710. Theregion 710 can be identified in theMAD plot 404 by comparing theMAD plot 404 with a MAD plot for the tissue of interest. - In
FIGURE 7 , the ROI's 702, 704 and 706 correspond to adipose tissue, liver tissue and rib cartilage. In response to the identification of the ROI's 702, 704 and 706 on theMAD plot 404, the 2-D image 402 is updated with the first highlighting 712 corresponding to the ROI 702 (adipose tissue), second highlighting 714 corresponding to the ROI 704 (liver tissue), and third highlighting 716 corresponding to the ROI 706 (rib cartilage). Likewise, the emphasis can be through color, gray level, outlide, highlight, etc. - As shown in
Figures 4-7 , and described herein, the locations of pixels in the MAD plots depend on known properties (i.e., the coefficients of attenuation for the photoelectric effect and Compton scattering) of tissues and elements within the human body. These locations occupy a small fraction of the entire MAD plot. Any pixels outside of these ranges arise either from foreign objects or materials within the body (i.e., metal appliances or silicone implants) or from artifacts due to errors in signal acquisition or image reconstruction. The precise patterns and/or the positions of these artifacts can provide clues regarding their origin and nature. Thus MAD plots could provide a tool for both assessing and improving scanner performance. -
FIGURES 8-14 present various methods in connection with a MAD plot described herein. It is to be appreciated that the ordering of the acts in the method is not limiting. As such, other orderings are contemplated herein. In addition, one or more acts may be omitted and/or one or more additional acts may be included. -
FIGURE 8 illustrates an example method for creating a spectral CT fingerprint in connection with a multi-energy projection data. - At 802, a spectral scan of a subject or object including a material of interest (MOI) is performed, creating multi-energy projection data, each set of projection data corresponding to a different energy.
- At 804, a plurality of basis images is generated with the multi-energy projection data, each basis image corresponding to a different energy.
- At 806, a MAD plot is created from the plurality of basis images.
- At 808, a cluster in the MAD plot corresponding to the material of interest is identified in the MAD plot. This can be achieved using known photo-electric effect and Compton scatter attenuation coefficients from the literature and/or otherwise, data from previous scans with and without the material interest, and/or otherwise.
- At 810, the cluster is labeled to associate the cluster with the material of interest.
- At 812, the MAD plot is saved, e.g., to computer memory for use.
-
FIGURE 9 illustrates another example method for creating a spectral CT fingerprint in connection with a multi-energy projection data. - At 902, a spectral scan of a subject or object including a material of interest in addition to the material of interest in
FIGURE 8 is performed, creating multi-energy projection data. - At 904, a plurality of basis images is generated with the multi-energy projection data as described herein.
- At 906, a MAD plot is created from the plurality of basis images.
- At 908, a cluster in the MAD plot corresponding to the different material of interest is located in the MAD plot by comparing the MAD plot with the stored MAD plot from
FIGURE 8 to locate a cluster in the MAD plot that is not in the stored MAD plot. - At 910, the cluster is labeled to associate the cluster with the different material of interest.
- At 912, the MAD plot is saved.
-
FIGURE 10 illustrates another example method for creating a spectral CT fingerprint in connection with a multi-energy projection data. - At 1002, a first spectral scan of a first subject or object including without a material of interest is performed, creating first projection data.
- At 1004, a second spectral scan of a second subject or object including with the material of interest is performed, creating second projection data.
- The projection data of
acts act 1004 can be beforeact 1002. - At 1006, a first plurality of basis images is generated with the first projection data.
- At 1008, a second plurality of basis images is generated with the second projection data.
- At 1010, a first MAD plot is created from the first plurality of basis images.
- At 1012, a second MAD plot is created from the second plurality of basis images.
- At 1014, a cluster in the first MAD plot corresponding to the material of interest is located by comparing the first and second MAD plots to locate a cluster in the first MAD plot that is absent from the second MAD plot.
- At 1016, the cluster is labeled to associate the cluster with the material of interest.
- At 1018, the first MAD plot is saved.
-
FIGURE 11 illustrates example method for identifying a presence and/or a type of abnormality in connection with a multi-energy projection data. - At 1102, a spectral scan of a subject is performed, creating projection data.
- At 1104, a plurality of basis images is generated with the projection data.
- At 1106, a MAD plot is created from the plurality of basis images.
- At 1108, the MAD plot is compared with a MAD plot for normal tissue.
- At 1110, it is determined the subject has an abnormality in response to the MAD plot including a cluster that is absent from the MAD plot for the normal tissue.
- At 1112, the MAD plot is compared with a MAD plot for an abnormality.
- At 1114, it is determined the subject has the abnormality in response to the MAD plot including a cluster that matches a cluster representing the abnormality in the MAD plot for the abnormality.
- In a variation, acts 1108 and 1110 are omitted and the MAD plot is compared only with the MAD plot for the abnormality. In another variation, acts 1112 and 1114 are omitted and the MAD plot is compared only with the MAD plot for the normal tissue.
-
FIGURE 12 illustrates example method for identifying an absence of an abnormality in connection with a multi-energy projection data. - At 1202, a spectral scan of a subject is performed, creating projection data.
- At 1204, a plurality of basis images is generated with the projection data.
- At 1206, a MAD plot is created from the plurality of basis images.
- At 1208, the MAD plot is compared with a MAD plot for the normal tissue.
- At 1210, it is determined the subject does not have an abnormality in response to the MAD plot matching the MAD plot for the normal tissue.
-
FIGURE 13 illustrates example method for identifying an absence of an abnormality in connection with a multi-energy projection data. - At 1302, a spectral scan of a subject is performed, creating projection data.
- At 1304, a plurality of basis images is generated with the projection data.
- At 1306, a MAD plot is created from the plurality of basis images.
- At 1308, the MAD plot is compared with a MAD plot for an abnormality.
- At 1310, it is determined the subject does not have the abnormality in response to the MAD plot including a cluster that matches a cluster representing the abnormality in the MAD plot for the abnormality.
-
FIGURE 14 illustrates example method for visualizing tissue of interest in an image in connection with a multi-energy projection data. - At 1402, a spectral scan of a subject is performed, creating projection data.
- At 1404, a plurality of basis images is generated with the projection data.
- At 1406, a MAD plot is created from the plurality of basis images.
- At 1408, a cluster of the MAD plot corresponding to the tissue of interest is identified. This can be achieved by comparing the MAD plot with a MAD plot for the tissue of interest and/or otherwise.
- At 1410, a ROI is created for the cluster.
- At 1412, an image is generated with the projection data.
- At 1414, pixels or voxels corresponding to the tissue of interest are highlighted in the image for the material represented by the cluster.
-
FIGURE 15 illustrates example method for identifying tissue of interest in an image in connection with a multi-energy projection data. - At 1502, a spectral scan of a subject is performed, creating projection data.
- At 1504, a plurality of basis images is generated with the projection data.
- At 1506, an image is generated with the projection data.
- At 1508, an ROI is created in the image.
- At 1510, a MAD plot is created for the ROI.
- At 1512, a cluster of the MAD plot corresponding to the ROI is identified.
- At 1514, a type material in the ROI is identified by the cluster. This can be achieved by comparing the MAD plot with MAD plots for different types of materials and/or otherwise.
- At 1516, a material decomposition is created with the identified material.
- At 1518, a spectral image for the material is generated using the material decomposition.
- The acts herein may be implemented by way of computer readable instructions, encoded or embedded on computer readable storage medium, which, when executed by a computer processor(s), cause the processor(s) to carry out the described acts. Additionally, or alternatively, at least one of the computer readable instructions is carried by a signal, carrier wave or other transitory medium.
-
FIGURE 16 schematically illustrates a variation ofFIGURE 1 in which the components of theoperator console 118 related to the spectralCT fingerprint module 132 are part of acomputing system 1602, which is a separate apparatus from theimaging system 100. Theoperator console 118 includes a human readable output device such as a monitor or display and an input device such as a keyboard and mouse, and software resident on theconsole 118 allows the operator to interact with thescanner 100. Theinstructions 130 include a reconstructor to reconstruct volumetric image data. - The computing system 160 can receive projection from the imaging system 100 (the
console 118 and/or the reconstructor 116), adata repository 1604, another imaging system, and/or other device. An example ofsuitable data repository 1604 is a picture archiving and communication system (PACS), a radiology information system (RIS), a hospital information system (HIS), an electronic medical record (EMR), a database, a server, an imaging system, and/or other data repository. - The MAD plot discussed herein can also be used for quality assurance. For example, since a MAD plot for a particular material is independent of the X-ray source and the detector array, a plurality of imaging system can be tested by scanning a phantom including a particular material, generating a MAD plot for each imaging system for that material, and comparing the MAD plots with a known valid reference MAD plot(s) for that material. If a MAD plot for an imaging system deviates from the reference MAD plot(s), the imaging system, e.g., can be re-calibrated.
- The invention has been described with reference to the preferred embodiments. Modifications and alterations may occur to others upon reading and understanding the preceding detailed description. It is intended that the invention be constructed as including all such modifications and alterations insofar as they come within the scope of the appended claims.
Claims (7)
- A computer-implemented method, comprising:generating (1102, 1202, 1302), with an imaging system (100), spectral projection data of a subject, including at least first spectral projection data corresponding to a first energy range and second spectral projection data corresponding to a second energyrange, wherein the first and the second energy range are different;constructing an image from a combination of the spectral projection data;constructing (1104, 1204, 1304) a set of basis images for the energy ranges and from the spectral projection data;constructing (1106, 1206, 1306) a multi-dimensional histogram from the set ofbasis images, wherein the multi-dimensional histogram includes at least two axes, a first corresponding to a first basis component and a second corresponding to a second basis component, and the multi-dimensional histogram includes a set of clusters, including one cluster for each material represented in the spectral projection data;visually displaying, concurrently, the image and the multi-dimensional histogram; andcomparing (1108, 1112, 1208, 1308) the displayed multi-dimensional histogram with a multi-dimensional histogram for known normal tissue and/or with a multi-dimensional histogram for known abnormal tissue, and:determining (1110, 1210, 1310) a presence of an abnormality in the displayed multi-dimensional histogram based on a cluster in the displayed multi-dimensional histogram being absent in the multi-dimensional histogram for known normal tissue; and/ordetermining (1110, 1210, 1310) a presence of the abnormality in the displayed multi-dimensional histogram based on a cluster in the displayed multi-dimensional histogram present in the multi-dimensional histogram for the known abnormal tissue.
- The method of claim 1, further comprising:receiving an input identifying a region of interest for a cluster in the multi-dimensional histogram; andupdating the displayed image to highlight a group of pixels or voxels of the image corresponding to a material in the identified region of interest in the multi-dimensional histogram.
- The method of claim 1 or 2, further comprising:receiving an input identifying a region of interest in the image; andupdating the displayed multi-dimensional histogram to highlight a cluster of the set of clusters corresponding to a material in the identified region of interest in the image.
- A system (100), comprising:a memory (128) storing instructions (132), including instructions corresponding a spectral CT fingerprint module (134); anda processor configured to execute at least instructions corresponding to the spectral CT fingerprint module, which causes the processor to:generate (1102, 1202, 1302) by using an imaging system spectral projection data of a subject, including at least first spectral projection data corresponding to a first energy range and second spectral projection data corresponding to a second energy range, wherein the first and the second energy range are different;construct an image from a combination of the spectral projection data;construct (1104, 1204, 1304) a set of basis images for the energy ranges and from the spectral projection data;construct (1106, 1206, 1306) a multi-dimensional histogram from the set of basis images, wherein the multi-dimensional histogram includes at least two axes, a first corresponding to a first basis component and a second corresponding to a second basis component, and the multi-dimensional histogram includes a set of clusters, including one cluster for each material represented in the spectral projection data; andvisually display, concurrently, the image and the multi-dimensional histogram; andcompare (1108, 1112, 1208, 1308) the displayed multi-dimensional histogram with a multi-dimensional histogram for known normal tissue and/or with a multi-dimensional histogram for known abnormal tissue, and:determine (1110, 1210, 1310) a presence of an abnormality in the displayed multi-dimensional histogram based on a cluster in the displayed multi-dimensional histogram being absent in the multi-dimensional histogram for known normal tissue; and/ordetermine (1110, 1210, 1310) a presence of the abnormality in the displayed multi-dimensional histogram based on a cluster in the displayed multi-dimensional histogram being present in the multi-dimensional histogram for known abnormal tissue.
- The system of claim 4, wherein the processor determines a presence of an abnormality in the displayed multi-dimensional histogram by identifying a cluster in the displayed multi-dimensional histogram as known abnormal tissue when the cluster is absent in the multi-dimensional histogram for known normal tissue.
- The system of claim 4 or 5, wherein the processor determines a presence of an abnormality in the displayed multi-dimensional histogram by identifying a cluster as known abnormal tissue when the cluster corresponds to a cluster of the multi-dimensional histogram for known abnormal tissue.
- A computer readable medium encoded with computer executable instructions, which, when executed by a processor of a computer, cause the processor to:generate (1102, 1202, 1302) by using an imaging system spectral projection data of a subject, including at least first spectral projection data corresponding to a first energy range and second spectral projection data corresponding to a second energy range, wherein the first and the second energy range are different;construct an image from a combination of the spectral projection data;construct (1104, 1204, 1304) a set of basis images for the energy ranges and from the spectral projection data;construct (1106, 1206, 1306) a multi-dimensional histogram from the set of basis images, wherein the multi-dimensional histogram includes at least two axes, a first corresponding to a first basis component and a second corresponding to a second basis component, and the multi-dimensional histogram includes a set of clusters, including one cluster for each material represented in the spectral projection data;visually display, concurrently, the image and the multi-dimensional histogram; andcompare (1108, 1112, 1208, 1308) the displayed multi-dimensional histogram with a multi-dimensional histogram for known normal tissue and/or with a multi-dimensional histogram for known abnormal tissue, and:determine (1110, 1210, 1310) a presence of an abnormality in the displayed multi-dimensional histogram based on a cluster in the displayed multi-dimensional histogram being absent in the multi-dimensional histogram for known normal tissue; and/ordetermine (1110, 1210, 1310) a presence of the abnormality in the displayed multi-dimensional histogram based on a cluster in the displayed multi-dimensional histogram present in the multi-dimensional histogram for the known abnormal tissue.
Applications Claiming Priority (2)
| Application Number | Priority Date | Filing Date | Title |
|---|---|---|---|
| US201662361702P | 2016-07-13 | 2016-07-13 | |
| PCT/EP2017/067644 WO2018011321A1 (en) | 2016-07-13 | 2017-07-12 | Spectral computed tomography fingerprinting |
Publications (2)
| Publication Number | Publication Date |
|---|---|
| EP3484369A1 EP3484369A1 (en) | 2019-05-22 |
| EP3484369B1 true EP3484369B1 (en) | 2023-05-31 |
Family
ID=59315651
Family Applications (1)
| Application Number | Title | Priority Date | Filing Date |
|---|---|---|---|
| EP17737825.4A Active EP3484369B1 (en) | 2016-07-13 | 2017-07-12 | Spectral computed tomography fingerprinting |
Country Status (5)
| Country | Link |
|---|---|
| US (1) | US10820865B2 (en) |
| EP (1) | EP3484369B1 (en) |
| JP (1) | JP7258744B2 (en) |
| CN (1) | CN109688931B (en) |
| WO (1) | WO2018011321A1 (en) |
Families Citing this family (2)
| Publication number | Priority date | Publication date | Assignee | Title |
|---|---|---|---|---|
| CN111340127B (en) * | 2020-03-04 | 2023-01-10 | 清华大学 | Energy spectrum CT iterative material decomposition method and device based on material clustering |
| US11786201B1 (en) * | 2022-06-14 | 2023-10-17 | Curvebeam Ai Limited | Method and system for material decomposition in dual- or multiple-energy x-ray based imaging |
Family Cites Families (12)
| Publication number | Priority date | Publication date | Assignee | Title |
|---|---|---|---|---|
| US7599465B2 (en) | 2004-11-19 | 2009-10-06 | General Electric Company | Detection of thrombi in CT using energy discrimination |
| WO2006114716A2 (en) | 2005-04-26 | 2006-11-02 | Koninklijke Philips Electronics, N.V. | Double decker detector for spectral ct |
| CN101495039B (en) * | 2005-09-22 | 2012-05-30 | 皇家飞利浦电子股份有限公司 | Quantitative material decomposition for spectral CT |
| EP2296551B1 (en) | 2008-06-30 | 2016-04-20 | Koninklijke Philips N.V. | Spectral ct |
| US7983382B2 (en) * | 2008-11-26 | 2011-07-19 | General Electric Company | System and method for material segmentation utilizing computed tomography scans |
| US8294717B2 (en) * | 2009-06-26 | 2012-10-23 | Kabushiki Kaisha Toshiba | Advanced clustering method for material separation in dual energy CT |
| JP5631580B2 (en) | 2009-11-27 | 2014-11-26 | ジーイー・メディカル・システムズ・グローバル・テクノロジー・カンパニー・エルエルシー | Image display apparatus, X-ray CT apparatus, and program |
| US8588494B2 (en) * | 2010-10-29 | 2013-11-19 | General Electric Company | System and method for material decomposition optimization in image domain |
| CN104700389B (en) * | 2013-12-09 | 2019-08-13 | 通用电气公司 | Object identifying method in dual intensity CT scan image |
| CN104700390B (en) * | 2013-12-09 | 2019-07-23 | 通用电气公司 | Calcification part recognition methods in dual intensity CT contrast enhanced scans image |
| EP3207524B1 (en) | 2014-10-13 | 2019-10-02 | Koninklijke Philips N.V. | Noise reduction for spectral imaging |
| US9964499B2 (en) * | 2014-11-04 | 2018-05-08 | Toshiba Medical Systems Corporation | Method of, and apparatus for, material classification in multi-energy image data |
-
2017
- 2017-07-12 WO PCT/EP2017/067644 patent/WO2018011321A1/en unknown
- 2017-07-12 JP JP2019501433A patent/JP7258744B2/en active Active
- 2017-07-12 CN CN201780043267.0A patent/CN109688931B/en active Active
- 2017-07-12 US US16/316,735 patent/US10820865B2/en active Active
- 2017-07-12 EP EP17737825.4A patent/EP3484369B1/en active Active
Also Published As
| Publication number | Publication date |
|---|---|
| CN109688931A (en) | 2019-04-26 |
| EP3484369A1 (en) | 2019-05-22 |
| JP7258744B2 (en) | 2023-04-17 |
| CN109688931B (en) | 2024-01-12 |
| US10820865B2 (en) | 2020-11-03 |
| WO2018011321A1 (en) | 2018-01-18 |
| JP2019527885A (en) | 2019-10-03 |
| US20190290226A1 (en) | 2019-09-26 |
Similar Documents
| Publication | Publication Date | Title |
|---|---|---|
| US9498179B1 (en) | Methods and systems for metal artifact reduction in spectral CT imaging | |
| US9597041B2 (en) | Sequential image acquisition with updating method and system | |
| US20210056688A1 (en) | Using deep learning to reduce metal artifacts | |
| US20120093383A1 (en) | Sequential image acquisition method | |
| EP3324846B1 (en) | Computed tomography visualization adjustment | |
| US10143433B2 (en) | Computed tomography apparatus and method of reconstructing a computed tomography image by the computed tomography apparatus | |
| WO2019068689A1 (en) | Image feature annotation in diagnostic imaging | |
| EP3484369B1 (en) | Spectral computed tomography fingerprinting | |
| US20220101617A1 (en) | 3-d virtual endoscopy rendering | |
| US10383589B2 (en) | Direct monochromatic image generation for spectral computed tomography | |
| US20210158218A1 (en) | Medical information processing apparatus, medical information processing method, and non-transitory computer-readable storage medium | |
| WO2019110313A1 (en) | Apparatus for presentation of dark field x-ray image information | |
| US11935162B2 (en) | Protocol-dependent 2-D pre-scan projection image based on 3-D pre-scan volumetric image data | |
| EP3821811B1 (en) | Systems and methods for coherent scatter imaging using a segmented photon-counting detector for computed tomography | |
| US11361415B2 (en) | Material-selective adaptive blending of volumeiric image data | |
| EP4161389A1 (en) | Spectral dark-field imaging | |
| WO2016186746A1 (en) | Methods and systems for automatic segmentation | |
| US20200294653A1 (en) | Spectral (mulit-energy) imaging visualization | |
| US20220031273A1 (en) | Systems and methods for artifact detection for images | |
| WO2023170010A1 (en) | Optimal path finding based spinal center line extraction | |
| WO2021252751A1 (en) | Systems and methods for generating synthetic baseline x-ray images from computed tomography for longitudinal analysis |
Legal Events
| Date | Code | Title | Description |
|---|---|---|---|
| STAA | Information on the status of an ep patent application or granted ep patent |
Free format text: STATUS: UNKNOWN |
|
| STAA | Information on the status of an ep patent application or granted ep patent |
Free format text: STATUS: THE INTERNATIONAL PUBLICATION HAS BEEN MADE |
|
| PUAI | Public reference made under article 153(3) epc to a published international application that has entered the european phase |
Free format text: ORIGINAL CODE: 0009012 |
|
| STAA | Information on the status of an ep patent application or granted ep patent |
Free format text: STATUS: REQUEST FOR EXAMINATION WAS MADE |
|
| 17P | Request for examination filed |
Effective date: 20190213 |
|
| AK | Designated contracting states |
Kind code of ref document: A1 Designated state(s): AL AT BE BG CH CY CZ DE DK EE ES FI FR GB GR HR HU IE IS IT LI LT LU LV MC MK MT NL NO PL PT RO RS SE SI SK SM TR |
|
| AX | Request for extension of the european patent |
Extension state: BA ME |
|
| DAV | Request for validation of the european patent (deleted) | ||
| DAX | Request for extension of the european patent (deleted) | ||
| RAP1 | Party data changed (applicant data changed or rights of an application transferred) |
Owner name: KONINKLIJKE PHILIPS N.V. Owner name: BOARD OF REGENTS THE UNIVERSITY OF TEXAS SYSTEM |
|
| STAA | Information on the status of an ep patent application or granted ep patent |
Free format text: STATUS: EXAMINATION IS IN PROGRESS |
|
| 17Q | First examination report despatched |
Effective date: 20200616 |
|
| STAA | Information on the status of an ep patent application or granted ep patent |
Free format text: STATUS: EXAMINATION IS IN PROGRESS |
|
| GRAP | Despatch of communication of intention to grant a patent |
Free format text: ORIGINAL CODE: EPIDOSNIGR1 |
|
| STAA | Information on the status of an ep patent application or granted ep patent |
Free format text: STATUS: GRANT OF PATENT IS INTENDED |
|
| RIC1 | Information provided on ipc code assigned before grant |
Ipc: G16H 50/20 20180101ALI20221206BHEP Ipc: G06T 7/00 20170101ALI20221206BHEP Ipc: A61B 6/00 20060101ALI20221206BHEP Ipc: A61B 6/03 20060101AFI20221206BHEP |
|
| INTG | Intention to grant announced |
Effective date: 20230104 |
|
| GRAS | Grant fee paid |
Free format text: ORIGINAL CODE: EPIDOSNIGR3 |
|
| GRAA | (expected) grant |
Free format text: ORIGINAL CODE: 0009210 |
|
| STAA | Information on the status of an ep patent application or granted ep patent |
Free format text: STATUS: THE PATENT HAS BEEN GRANTED |
|
| AK | Designated contracting states |
Kind code of ref document: B1 Designated state(s): AL AT BE BG CH CY CZ DE DK EE ES FI FR GB GR HR HU IE IS IT LI LT LU LV MC MK MT NL NO PL PT RO RS SE SI SK SM TR |
|
| REG | Reference to a national code |
Ref country code: GB Ref legal event code: FG4D Ref country code: CH Ref legal event code: EP |
|
| REG | Reference to a national code |
Ref country code: AT Ref legal event code: REF Ref document number: 1570497 Country of ref document: AT Kind code of ref document: T Effective date: 20230615 Ref country code: DE Ref legal event code: R096 Ref document number: 602017069209 Country of ref document: DE |
|
| REG | Reference to a national code |
Ref country code: IE Ref legal event code: FG4D |
|
| REG | Reference to a national code |
Ref country code: LT Ref legal event code: MG9D |
|
| REG | Reference to a national code |
Ref country code: NL Ref legal event code: MP Effective date: 20230531 |
|
| REG | Reference to a national code |
Ref country code: AT Ref legal event code: MK05 Ref document number: 1570497 Country of ref document: AT Kind code of ref document: T Effective date: 20230531 |
|
| PG25 | Lapsed in a contracting state [announced via postgrant information from national office to epo] |
Ref country code: SE Free format text: LAPSE BECAUSE OF FAILURE TO SUBMIT A TRANSLATION OF THE DESCRIPTION OR TO PAY THE FEE WITHIN THE PRESCRIBED TIME-LIMIT Effective date: 20230531 Ref country code: NO Free format text: LAPSE BECAUSE OF FAILURE TO SUBMIT A TRANSLATION OF THE DESCRIPTION OR TO PAY THE FEE WITHIN THE PRESCRIBED TIME-LIMIT Effective date: 20230831 Ref country code: ES Free format text: LAPSE BECAUSE OF FAILURE TO SUBMIT A TRANSLATION OF THE DESCRIPTION OR TO PAY THE FEE WITHIN THE PRESCRIBED TIME-LIMIT Effective date: 20230531 Ref country code: AT Free format text: LAPSE BECAUSE OF FAILURE TO SUBMIT A TRANSLATION OF THE DESCRIPTION OR TO PAY THE FEE WITHIN THE PRESCRIBED TIME-LIMIT Effective date: 20230531 |
|
| PGFP | Annual fee paid to national office [announced via postgrant information from national office to epo] |
Ref country code: GB Payment date: 20230725 Year of fee payment: 7 |
|
| PG25 | Lapsed in a contracting state [announced via postgrant information from national office to epo] |
Ref country code: RS Free format text: LAPSE BECAUSE OF FAILURE TO SUBMIT A TRANSLATION OF THE DESCRIPTION OR TO PAY THE FEE WITHIN THE PRESCRIBED TIME-LIMIT Effective date: 20230531 Ref country code: PL Free format text: LAPSE BECAUSE OF FAILURE TO SUBMIT A TRANSLATION OF THE DESCRIPTION OR TO PAY THE FEE WITHIN THE PRESCRIBED TIME-LIMIT Effective date: 20230531 Ref country code: NL Free format text: LAPSE BECAUSE OF FAILURE TO SUBMIT A TRANSLATION OF THE DESCRIPTION OR TO PAY THE FEE WITHIN THE PRESCRIBED TIME-LIMIT Effective date: 20230531 Ref country code: LV Free format text: LAPSE BECAUSE OF FAILURE TO SUBMIT A TRANSLATION OF THE DESCRIPTION OR TO PAY THE FEE WITHIN THE PRESCRIBED TIME-LIMIT Effective date: 20230531 Ref country code: LT Free format text: LAPSE BECAUSE OF FAILURE TO SUBMIT A TRANSLATION OF THE DESCRIPTION OR TO PAY THE FEE WITHIN THE PRESCRIBED TIME-LIMIT Effective date: 20230531 Ref country code: IS Free format text: LAPSE BECAUSE OF FAILURE TO SUBMIT A TRANSLATION OF THE DESCRIPTION OR TO PAY THE FEE WITHIN THE PRESCRIBED TIME-LIMIT Effective date: 20230930 Ref country code: HR Free format text: LAPSE BECAUSE OF FAILURE TO SUBMIT A TRANSLATION OF THE DESCRIPTION OR TO PAY THE FEE WITHIN THE PRESCRIBED TIME-LIMIT Effective date: 20230531 Ref country code: GR Free format text: LAPSE BECAUSE OF FAILURE TO SUBMIT A TRANSLATION OF THE DESCRIPTION OR TO PAY THE FEE WITHIN THE PRESCRIBED TIME-LIMIT Effective date: 20230901 |
|
| PGFP | Annual fee paid to national office [announced via postgrant information from national office to epo] |
Ref country code: DE Payment date: 20230726 Year of fee payment: 7 |
|
| PG25 | Lapsed in a contracting state [announced via postgrant information from national office to epo] |
Ref country code: FI Free format text: LAPSE BECAUSE OF FAILURE TO SUBMIT A TRANSLATION OF THE DESCRIPTION OR TO PAY THE FEE WITHIN THE PRESCRIBED TIME-LIMIT Effective date: 20230531 |
|
| PG25 | Lapsed in a contracting state [announced via postgrant information from national office to epo] |
Ref country code: SK Free format text: LAPSE BECAUSE OF FAILURE TO SUBMIT A TRANSLATION OF THE DESCRIPTION OR TO PAY THE FEE WITHIN THE PRESCRIBED TIME-LIMIT Effective date: 20230531 |
|
| PG25 | Lapsed in a contracting state [announced via postgrant information from national office to epo] |
Ref country code: SM Free format text: LAPSE BECAUSE OF FAILURE TO SUBMIT A TRANSLATION OF THE DESCRIPTION OR TO PAY THE FEE WITHIN THE PRESCRIBED TIME-LIMIT Effective date: 20230531 Ref country code: SK Free format text: LAPSE BECAUSE OF FAILURE TO SUBMIT A TRANSLATION OF THE DESCRIPTION OR TO PAY THE FEE WITHIN THE PRESCRIBED TIME-LIMIT Effective date: 20230531 Ref country code: RO Free format text: LAPSE BECAUSE OF FAILURE TO SUBMIT A TRANSLATION OF THE DESCRIPTION OR TO PAY THE FEE WITHIN THE PRESCRIBED TIME-LIMIT Effective date: 20230531 Ref country code: PT Free format text: LAPSE BECAUSE OF FAILURE TO SUBMIT A TRANSLATION OF THE DESCRIPTION OR TO PAY THE FEE WITHIN THE PRESCRIBED TIME-LIMIT Effective date: 20231002 Ref country code: EE Free format text: LAPSE BECAUSE OF FAILURE TO SUBMIT A TRANSLATION OF THE DESCRIPTION OR TO PAY THE FEE WITHIN THE PRESCRIBED TIME-LIMIT Effective date: 20230531 Ref country code: DK Free format text: LAPSE BECAUSE OF FAILURE TO SUBMIT A TRANSLATION OF THE DESCRIPTION OR TO PAY THE FEE WITHIN THE PRESCRIBED TIME-LIMIT Effective date: 20230531 Ref country code: CZ Free format text: LAPSE BECAUSE OF FAILURE TO SUBMIT A TRANSLATION OF THE DESCRIPTION OR TO PAY THE FEE WITHIN THE PRESCRIBED TIME-LIMIT Effective date: 20230531 |
|
| PG25 | Lapsed in a contracting state [announced via postgrant information from national office to epo] |
Ref country code: MC Free format text: LAPSE BECAUSE OF FAILURE TO SUBMIT A TRANSLATION OF THE DESCRIPTION OR TO PAY THE FEE WITHIN THE PRESCRIBED TIME-LIMIT Effective date: 20230531 |
|
| PG25 | Lapsed in a contracting state [announced via postgrant information from national office to epo] |
Ref country code: MC Free format text: LAPSE BECAUSE OF FAILURE TO SUBMIT A TRANSLATION OF THE DESCRIPTION OR TO PAY THE FEE WITHIN THE PRESCRIBED TIME-LIMIT Effective date: 20230531 |
|
| REG | Reference to a national code |
Ref country code: CH Ref legal event code: PL |
|
| REG | Reference to a national code |
Ref country code: DE Ref legal event code: R097 Ref document number: 602017069209 Country of ref document: DE |
|
| PG25 | Lapsed in a contracting state [announced via postgrant information from national office to epo] |
Ref country code: LU Free format text: LAPSE BECAUSE OF NON-PAYMENT OF DUE FEES Effective date: 20230712 |
|
| REG | Reference to a national code |
Ref country code: DE Ref legal event code: R084 Ref document number: 602017069209 Country of ref document: DE |
|
| PG25 | Lapsed in a contracting state [announced via postgrant information from national office to epo] |
Ref country code: LU Free format text: LAPSE BECAUSE OF NON-PAYMENT OF DUE FEES Effective date: 20230712 |
|
| PLBE | No opposition filed within time limit |
Free format text: ORIGINAL CODE: 0009261 |
|
| STAA | Information on the status of an ep patent application or granted ep patent |
Free format text: STATUS: NO OPPOSITION FILED WITHIN TIME LIMIT |