EP3483821A1 - Information presentation device, information presentation system, and information presentation method - Google Patents
Information presentation device, information presentation system, and information presentation method Download PDFInfo
- Publication number
- EP3483821A1 EP3483821A1 EP17823914.1A EP17823914A EP3483821A1 EP 3483821 A1 EP3483821 A1 EP 3483821A1 EP 17823914 A EP17823914 A EP 17823914A EP 3483821 A1 EP3483821 A1 EP 3483821A1
- Authority
- EP
- European Patent Office
- Prior art keywords
- difference
- information
- passage rate
- sales amount
- periods
- Prior art date
- Legal status (The legal status is an assumption and is not a legal conclusion. Google has not performed a legal analysis and makes no representation as to the accuracy of the status listed.)
- Withdrawn
Links
Images



Classifications
-
- G—PHYSICS
- G06—COMPUTING OR CALCULATING; COUNTING
- G06Q—INFORMATION AND COMMUNICATION TECHNOLOGY [ICT] SPECIALLY ADAPTED FOR ADMINISTRATIVE, COMMERCIAL, FINANCIAL, MANAGERIAL OR SUPERVISORY PURPOSES; SYSTEMS OR METHODS SPECIALLY ADAPTED FOR ADMINISTRATIVE, COMMERCIAL, FINANCIAL, MANAGERIAL OR SUPERVISORY PURPOSES, NOT OTHERWISE PROVIDED FOR
- G06Q30/00—Commerce
- G06Q30/02—Marketing; Price estimation or determination; Fundraising
- G06Q30/0201—Market modelling; Market analysis; Collecting market data
- G06Q30/0204—Market segmentation
- G06Q30/0205—Market segmentation based on location or geographical consideration
-
- G—PHYSICS
- G06—COMPUTING OR CALCULATING; COUNTING
- G06Q—INFORMATION AND COMMUNICATION TECHNOLOGY [ICT] SPECIALLY ADAPTED FOR ADMINISTRATIVE, COMMERCIAL, FINANCIAL, MANAGERIAL OR SUPERVISORY PURPOSES; SYSTEMS OR METHODS SPECIALLY ADAPTED FOR ADMINISTRATIVE, COMMERCIAL, FINANCIAL, MANAGERIAL OR SUPERVISORY PURPOSES, NOT OTHERWISE PROVIDED FOR
- G06Q30/00—Commerce
- G06Q30/02—Marketing; Price estimation or determination; Fundraising
-
- G—PHYSICS
- G06—COMPUTING OR CALCULATING; COUNTING
- G06Q—INFORMATION AND COMMUNICATION TECHNOLOGY [ICT] SPECIALLY ADAPTED FOR ADMINISTRATIVE, COMMERCIAL, FINANCIAL, MANAGERIAL OR SUPERVISORY PURPOSES; SYSTEMS OR METHODS SPECIALLY ADAPTED FOR ADMINISTRATIVE, COMMERCIAL, FINANCIAL, MANAGERIAL OR SUPERVISORY PURPOSES, NOT OTHERWISE PROVIDED FOR
- G06Q30/00—Commerce
- G06Q30/02—Marketing; Price estimation or determination; Fundraising
- G06Q30/0201—Market modelling; Market analysis; Collecting market data
-
- G—PHYSICS
- G07—CHECKING-DEVICES
- G07G—REGISTERING THE RECEIPT OF CASH, VALUABLES, OR TOKENS
- G07G1/00—Cash registers
- G07G1/12—Cash registers electronically operated
-
- H—ELECTRICITY
- H04—ELECTRIC COMMUNICATION TECHNIQUE
- H04N—PICTORIAL COMMUNICATION, e.g. TELEVISION
- H04N7/00—Television systems
- H04N7/18—Closed-circuit television [CCTV] systems, i.e. systems in which the video signal is not broadcast
- H04N7/183—Closed-circuit television [CCTV] systems, i.e. systems in which the video signal is not broadcast for receiving images from a single remote source
Definitions
- Controller 20 includes flow line information generator 21 that generates, from the images output from monitoring camera 100, flow line information (people flow information) 31 indicating a flow of people moving in a store.
- Traffic line information generator 21 identifies a person shown in the images and generates flow line information 31 indicating a location of the person identified on a time-series basis. Note that, in FIG. 1 , flow line information generator 21 is included in controller 20 but may be configured separately from controller 20.
- the information presentation device includes: an input unit that inputs a setting value for setting two periods to be compared, an acquisition unit that acquires information on a passage rate indicating a proportion of people passing through each of a plurality of areas constituting an inside of the theme park and use information indicating a number of users who use an attraction in each of the areas; and a display unit that displays at least one of the differences in the passage rate and in the number of users between the two periods.
Landscapes
- Business, Economics & Management (AREA)
- Engineering & Computer Science (AREA)
- Accounting & Taxation (AREA)
- Development Economics (AREA)
- Finance (AREA)
- Strategic Management (AREA)
- Entrepreneurship & Innovation (AREA)
- Physics & Mathematics (AREA)
- General Physics & Mathematics (AREA)
- General Business, Economics & Management (AREA)
- Marketing (AREA)
- Economics (AREA)
- Game Theory and Decision Science (AREA)
- Theoretical Computer Science (AREA)
- Data Mining & Analysis (AREA)
- Multimedia (AREA)
- Signal Processing (AREA)
- Management, Administration, Business Operations System, And Electronic Commerce (AREA)
Abstract
An information presentation device includes an input unit that inputs a setting value for setting two periods to be compared, an acquisition unit that acquires information on a passage rate indicating a proportion of a number of people passing through each of a plurality of areas constituting an inside of a facility and sales information indicating a sales amount of an item in each of the areas, a difference calculator that calculates a difference in the passage rate between the two periods and a difference in the sales amount between the two periods, and a display unit that displays at least one of the difference in the passage rate and the difference in the sales amount.
Description
- The present disclosure relates to an information presentation device, an information presentation system, and an information presentation method that present sales and a passage rate of a facility such as a store.
-
PTL 1 discloses a salesroom integrated monitoring system that inputs information on an item such as details of the item, a position in a salesroom, a display state, and sales, and flow line information on a move of a visiting customer and the like and displays a list and a graph indicating a relationship between the sales of the item and a flow line of the visiting customer together with a salesroom floor map. - PTL 1: Unexamined Japanese Patent Publication No.
2004-118453 - The present disclosure provides an information presentation device, an information presentation system, and an information presentation method that effectively present sales and a passage rate of a facility such as a store.
- An information presentation device according to the present disclosure includes an input unit that inputs a setting value for setting two periods to be compared, an acquisition unit that acquires information on a passage rate indicating a proportion of a number of people passing through each of a plurality of areas constituting an inside of a facility and sales information indicating a sales amount of an item or of a service in each of the areas, a difference calculator that calculates a difference in the passage rate between the two periods and a difference in the sales amount between the two periods, and a display unit that displays at least one of the difference in the passage rate and the difference in the sales amount.
- An information presentation system according to the present disclosure includes a monitoring camera that outputs images resulting from imaging a facility including a plurality of areas, a purchase terminal device that generates and outputs purchase data indicating an item or a service purchased in the facility and a purchase amount, and the information presentation device that calculates a difference in a passage rate and a difference in a sales amount between two periods to be compared from area information indicating a position of each of the areas in the facility, people flow information indicating a flow of people in the facility, the people flow information being generated from the images output from the monitoring camera, purchase data of the facility output from the purchase terminal device, and position information indicating a position of an item or of a service placed in the facility and displays at least one of the difference in the passage rate and the difference in the sales amount.
- An information presentation method according to the present disclosure includes causing an input unit to input a setting value for setting two periods to be compared, causing an acquisition unit to acquire information on a passage rate indicating a proportion of a number of people passing through each of a plurality of areas constituting an inside of a facility and sales information indicating a sales amount of an item or of a service in each of the areas, causing a difference calculator to calculate a difference in the passage rate between the two periods and a difference in the sales amount between the two periods, and causing a display unit to display at least one of the difference in the passage rate and the difference in the sales amount.
- The information presentation device, the information presentation system, and the information presentation method of the present disclosure effectively present sales and a passage rate of a store.
-
-
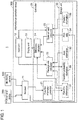
FIG. 1 is a block diagram showing a configuration of an information presentation system of a first exemplary embodiment. -
FIG. 2A is a table showing an example of flow line information. -
FIG. 2B is a table showing an example of area information. -
FIG. 2C is a table showing an example of transition probability information. -
FIG. 3A is a table showing an example of POS data. -
FIG. 3B is a table showing an example of position information. -
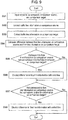
FIG. 4 is a flowchart for describing an operation of calculating a difference in a sales amount and a difference in a passage rate according to the first exemplary embodiment. -
FIG. 5A is a diagram showing a display example according to the first exemplary embodiment. -
FIG. 5B is a diagram showing a display example according to the first exemplary embodiment. -
FIG. 6 is a diagram showing a display example according to the first exemplary embodiment. -
FIG. 7 is a diagram showing a display example according to another exemplary embodiment. -
FIG. 8 is a diagram showing a display example of flow line information according to another exemplary embodiment. -
FIG. 9 is a flowchart for describing an operation of calculating a difference in flow line information according to another exemplary embodiment. -
FIG. 10 is a diagram showing a display example of flow line information on a plurality of people according to another exemplary embodiment. - Hereinafter, exemplary embodiments will be described in detail with reference to the drawings as appropriate. However, detailed description beyond necessity may be omitted. For example, a detailed description of a well-known matter and a duplicate description of substantially the same configuration may be omitted. Such omissions are intended to prevent the following description from being unnecessarily redundant and to help those skilled in the art to easily understand the following description. Note that the inventors provide the attached drawings and the following description to help those skilled in the art to fully understand the present disclosure, and the attached drawings and the following description are not intended to limit the subject matters of the claims.
- An information presentation system of the present disclosure displays differences in a passage rate and in a sales amount of a store between two periods to be compared. At this time, the information presentation system changes a display mode for difference based on degrees of both the differences in the passage rate and in the sales amount of the store between the two periods to be compared.
-
FIG. 1 shows a configuration of the information presentation system of a first exemplary embodiment.Information presentation system 1 includes at least onemonitoring camera 100 that outputs images resulting from imaging an inside of a store, at least one point-of-sale (POS)terminal device 200 that generates and outputsPOS data 34 indicating an item purchased in the store and a purchase amount, andinformation presentation device 300 that changes a display mode for difference based on degrees of both differences in a passage rate and in a sales amount of the store between two periods to be compared using the images output from monitoringcamera 100 andPOS data 34 output fromPOS terminal device 200 and displays the degrees of the differences. -
Monitoring camera 100 includes an imaging unit such as a charge-coupled device (CCD) image sensor, a complementary metal oxide semiconductor (CMOS) image sensor, or an N-channel metal oxide semiconductor (NMOS) image sensor, and captures images of the inside of the store.Monitoring camera 100 further includes an interface circuit used for communication with an external device based on a predetermined communication standard (for example, a local area network (LAN) or WiFi) and outputs the images of the inside of the store thus captured. -
POS terminal device 200 includes a barcode reader equipped with a scanner, a CCD, or a laser and generatesPOS data 34 indicating an item purchased by a person in the store and a purchase amount.POS terminal device 200 further includes an interface circuit used for communication with an external device based on a predetermined communication standard (for example, a LAN or WiFi) and outputsPOS data 34 thus generated. -
Information presentation device 300 includesreceiver 11 that receives the images output from monitoringcamera 100 andPOS data 34 output fromPOS terminal device 200,input unit 12 that receives an input from a user, anddisplay unit 13.Receiver 11 includes an interface circuit used for communication with an external device based on the predetermined communication standard (for example, a LAN or WiFi).Input unit 12 is, for example, a keyboard, a mouse, or a touch panel.Display unit 13 is, for example, a liquid crystal display. -
Information presentation device 300 further includescontroller 20 that controls a whole ofinformation presentation device 300, andstorage unit 30 that stores various pieces of information. -
Controller 20 includes flowline information generator 21 that generates, from the images output from monitoringcamera 100, flow line information (people flow information) 31 indicating a flow of people moving in a store. Trafficline information generator 21 identifies a person shown in the images and generatesflow line information 31 indicating a location of the person identified on a time-series basis. Note that, inFIG. 1 , flowline information generator 21 is included incontroller 20 but may be configured separately fromcontroller 20. -
Controller 20 further includespassage rate calculator 22 that calculates a passage rate of each of a plurality of areas constituting an inside of a store, andsales amount calculator 23 that calculates a sales amount of each of the areas in the store.Passage rate calculator 22 calculates a passage rate of each of the areas in the store (a proportion of people who pass through each of the areas) fromflow line information 31 andarea information 32.Area information 32 corresponds to information indicating a range of each of the plurality of areas constituting the inside of the store. Note thatpassage rate calculator 22 is also capable of generating, fromflow line information 31 andarea information 32,transition probability information 33 indicating a probability of a move of a person between adjacent areas in the store and calculating the passage rate based ontransition probability information 33.Sales amount calculator 23 calculates a sales amount of each of the areas based onposition information 35 andPOS data 34.Position information 35 corresponds to information indicating a position and a unit price of an item placed in the store.Passage rate calculator 22 andsales amount calculator 23 respectively calculate a passage rate and a sales amount in a period (a time, a date, a day of week, or the like) designated viainput unit 12. In the present exemplary embodiment, a user designates two periods to be compared (a comparison source period and a comparison target period) viainput unit 12. -
Controller 20 further includesdifference calculator 24 that calculates a difference in the passage rate between the comparison source period and the comparison target period, and a difference in the sales amount between the comparison source period and the comparison target period.Difference calculator 24 changes a display mode for difference based on degrees of the differences in the passage rate and in the sales amount thus calculated and causesdisplay unit 13 to display the degrees of the differences. -
Controller 20 can be configured with a semiconductor element or the like. A function ofcontroller 20 may be implemented only by hardware or may be implemented by a combination of hardware and software.Controller 20 can be configured with, for example, a microcomputer, a central processing unit (CPU), a micro processing unit (MPU), a digital signal processor (DSP), a field-programmable gate array (FPGA), or an application specific integrated circuit (ASIC). -
Storage unit 30 stores information received bycontroller 20 viareceiver 11 and information generated bycontroller 20. For example,storage unit 30 stores flowline information 31,area information 32,transition probability information 33,POS data 34, andposition information 35.Storage unit 30 can be configured with, for example, a random access memory (RAM), a dynamic random access memory (DRAM), a ferroelectric RAM, a flash memory, or a magnetic disk. Alternatively,storage unit 30 can be configured with any combination of a RAM, a DRAM, a ferroelectric RAM, a flash memory, and a magnetic disk. -
FIG. 2A shows an example offlow line information 31 generated by flowline information generator 21.Traffic line information 31 includes identification information (ID) on a person, and information on where the person is located (an X coordinate and a Y coordinate) and when the location of the person is extracted.FIG. 2B shows anexample area information 32.Area information 32 includes identification information (ID) on each of the areas in the store and information on a range (an X coordinate, a Y coordinate, a width, and a height) of each of the areas.FIG. 2C shows an example oftransition probability information 33 indicating a transition probability calculated based onflow line information 31 andarea information 32.Transition probability information 33 includes an ID of a move origin area, an ID of a move destination area, and a transition probability.Passage rate calculator 22 calculates a transition probability for each move destination allowable area from, for example, "transition probability = a number of people who move to the move destination allowable area adjacent to the move origin area/a number of people located in the move origin area" to generatetransition probability information 33. -
FIG. 3A shows an example ofPOS data 34 that is generated and output byPOS terminal device 200.POS data 34 includes identification information (ID) on an item purchased, a number of the items, a price of the item, and information on a date and time when the item is purchased.FIG. 3B shows an example ofposition information 35.Position information 35 includes identification information (ID) on an item, a name of the item, a unit price of the item, and information on where the item is placed (an ID of an area where the item is placed). -
FIG. 4 shows an operation ofcontroller 20 by which differences in the passage rate and in the sales amount are calculated. First, a user inputs two periods to be compared (the comparison source period and the comparison target period) and at least one of the plurality of areas in the store, which is desired by the user to compare, to inputunit 12. At this time, the user may designate each of the areas resulting from dividing the inside of the store as indicated byarea information 32 as a range of a comparison area. Alternatively, the user may designate some of the areas resulting from dividing the inside of the store as indicated byarea information 32 as a range of one comparison area.Controller 20 inputs, viainput unit 12, the comparison source period, the comparison target period, and the range of the comparison area designated by the user (step S1). -
Passage rate calculator 22 andsales amount calculator 23 each extract information on the comparison source period based on the user's input (step S2). Specifically,passage rate calculator 22 extracts information corresponding to the comparison source period fromflow line information 31, andsales amount calculator 23 extracts information corresponding to the comparison source period fromPOS data 34. - Sales amount
calculator 23 calculates a sales amount of each comparison area in the comparison source period designated by the user (step S3). Sales amountcalculator 23 calculates a total purchase amount (sales amount) of items placed in each area by, for example, extracting "price" of sales fromPOS data 34 based on "item ID" of an item placed in an area indicated by "position of item" ofposition information 35. -
Passage rate calculator 22 calculates a passage rate of each comparison area in the comparison source period designated by the user (step S4).Passage rate calculator 22 identifies an area through which a person passes based on, for example, a location of the person (an X coordinate and a Y coordinate) offlow line information 31 and a range of the area (an X coordinate, a Y coordinate, a width, and a height) ofarea information 32 and calculates the passage rate of each comparison area from "passage rate = a number of people passing through the area/a number of people located in the store". -
Passage rate calculator 22 andsales amount calculator 23 each extract information on the comparison target period based on the user's input (step S5). Specifically,passage rate calculator 22 extracts information corresponding to the comparison target period fromflow line information 31, andsales amount calculator 23 extracts information corresponding to the comparison target period fromPOS data 34. Sales amountcalculator 23 calculates a sales amount of each comparison area in the comparison target period designated by the user (step S6).Passage rate calculator 22 calculates a passage rate of each comparison area in the comparison target period designated by the user (step S7). -
Difference calculator 24 calculates a difference in the sales amount between the comparison source period and the comparison target period (step S8) and calculates a difference in the passage rate between the comparison source period and the comparison target period (step S9).Difference calculator 24 causes displayunit 13 to display respective values indicating the difference in the sales amount and the difference in the passage rate together with the areas on the screen, some or all of the areas being color-coded based on degrees of both the differences in the sales amount and in the passage rate (step S10). -
FIG. 5A shows a display example of a difference calculation result displayed bydisplay unit 13.FIG. 5A shows an example where ninecomparison areas FIG. 4 , January 28th is selected as the comparison source period, and February 3rd is selected as the comparison target period.Display unit 13 displays map 50 of an area for the comparison source period (January 28th) on an upper left side of the screen, displays map 60 of an area for the comparison target period (February 3rd) on a lower left side of the screen, and displays map 70 of an area for difference results on a right side of the screen.Display unit 13 displays respective values of the sales amount and the passage rate in each comparison area onmap 50 for the comparison source period (January 28th) and onmap 60 for the comparison target period (February 3rd) and displays respective values of differences in the sales amount and in the passage rate in each comparison area onmap 70 for difference results. - In addition,
display unit 13 displays each of the difference results in accordance with a display mode for difference result (a color in the present exemplary embodiment) that is changed in accordance with degrees of the differences as described in the following (a) to (e). -
- (a) An area where the passage rate increases by a first predetermined value (for example, 5%) or greater and the sales amount increases by a second predetermined value (for example, 50 yen) or greater is colored in green (refer to area 71).
- (b) An area where the passage rate decreases by a third predetermined value (for example, 5%) or greater and the sales amount increases by the second predetermined value or greater is colored in blue (refer to area 72).
- (c) An area where the passage rate increases by the first predetermined value or greater and the sales amount decreases by a fourth predetermined value (for example, 50 yen) or greater is colored in yellow (refer to area 73).
- (d) An area where the passage rate decreases by the third predetermined value or greater and the sales amount decreases by the fourth predetermined value or greater is colored in red (refer to area 74).
- (e) An area other than areas (a) to (d) is colored in white (refer to area 75).
-
FIG. 5B is a display example where another display element is added to the display ofFIG. 5A . InFIG. 5B , at an upper right, characters indicating "Both of the sales and the passage rate have been improved" and an arrow pointing in an upper right direction at angle of about 45° are displayed. These display elements are not displayed all the time but displayed, for example, whenarea 71 is selected with a cursor. This is because both differences in the sales and in the passage rate increase inarea 71, which indicates that the sales and the passage rate have been improved. - Similarly, when
area 72 is selected with the cursor, "The sales have been improved, but the passage rate has been worsened" is displayed, and whenarea 74 is selected, "Both the sales and the passage rate have been worsened" is displayed. Furthermore, in addition to these character displays, an arrow is displayed, a direction of the arrow being changed in accordance with a degree of improvement. For example, when both the sales and the passage rate are improved, an arrow having an angle of 45° is displayed, when either the sales or the passage rate is improved, an arrow having an angle of 30° is displayed, when neither the sales nor the passage rate is changed, an arrow having an angle of 0° (horizontal direction) is displayed, and when both the sales and the passage rate are worsened, an arrow having an angle of -45° is displayed. - Furthermore, the direction of the arrow is changed in accordance with a degree of improvement, and when there is a layout margin, the arrow may be displayed all the time in each area. When there is a layout margin, characters may also be displayed all the time in each area.
- As shown in
FIG. 6 ,display unit 13 displays map 50 for the comparison source period (January 28th),map 60 for the comparison target period (February 3rd), and map 70 for difference results with each of the maps superimposed onlayout image 80 representing a sales floor of a store. - According to
information presentation system 1 of the present exemplary embodiment, some or all of the comparison areas on the screen are color-coded based on degrees of the differences in the passage rate and in the sales amount of each of the comparison areas in the store, which makes it possible to easily recognize degrees of fluctuations in the passage rate and in the sales amount of each of the comparison areas only through a check of a color of each of the comparison areas. Accordingly, for example, fluctuations in the passage rate and in the sales amount between before and after a measure to improve a sales floor is taken can be easily recognized. -
Information presentation system 1 of the present disclosure can be configured with, for example, cooperation between a hardware resource such as a processor and a memory and a program. - Note that, in the present exemplary embodiment,
POS data 34 is output fromPOS terminal device 200. Alternatively, purchase data indicating an item or a service purchased and a purchase amount may be output from a different purchase terminal device. - The first exemplary embodiment has been described above as an illustration of the technique disclosed in the present application. However, the technique in the present disclosure is not limited to the exemplary embodiment and is applicable to exemplary embodiments in which changes, replacements, additions, omissions, or the like are made as appropriate. Furthermore, the components described in the first exemplary embodiment can be combined to form a new exemplary embodiment. Therefore, other exemplary embodiments will be illustrated below.
- In the first exemplary embodiment, a color indicating each comparison area is changed based on degrees of differences in the passage rate and in the sales amount. Alternatively, the degrees of differences may be represented by a method other than the color-coded display as long as the degrees of differences can be differentiated from each other. For example, instead of a color, a hatching pattern may be changed. Furthermore, as shown in
FIG. 7 , the degrees of differences in the passage rate and in the sales amount may be represented by a predetermined figure 76 (such as a polygon or a circle) in each comparison area, and a size, a color, or a shape of predetermined figure 76 may be changed in accordance with the degrees of differences in the passage rate and in the sales amount. - Furthermore, on
map 50 for the comparison source period and map 60 for the comparison target period, a value corresponding to the sales amount may be shown together with predetermined figure 52, 62 (such as a circle or a polygon), and a size, a color, or a shape of predetermined figure 52, 62 (such as a circle or a polygon) may be changed in accordance with how much the sales amount is. Moreover, a value corresponding to the passage rate may be shown together with predetermined figure 53, 63 (such as a circle or a polygon), and a size, a color, or a shape of predetermined figure 53, 63 (such as a circle or a polygon) may be changed in accordance with a degree of the passage rate. - Furthermore, in the first exemplary embodiment, the degrees of differences in the passage rate and in the sales amount are color-coded in five colors based on four thresholds, that is, the first predetermined value to the fourth predetermined value, but a number of options for changing the display mode is not limited to five. The number of options for changing the display mode for difference (for example, a color, hatching, a size, and a shape) may be optionally determined in accordance with degrees of differences in the passage rate and in the sales amount.
- In the first exemplary embodiment,
passage rate calculator 22 calculates the passage rate fromflow line information 31 andarea information 32. Alternatively,receiver 11 may acquire the passage rate information indicating the passage rate of each of the areas in the store from the outside. In this configuration,receiver 11 serves as an acquisition unit that acquires the passage rate information. Furthermore, the passage rate information acquired viareceiver 11 may be prestored intostorage unit 30. In this configuration,passage rate calculator 22 serves as an acquisition unit that acquires the passage rate information stored instorage unit 30. In the first exemplary embodiment,sales amount calculator 23 calculates the sales amount based onposition information 35 andPOS data 34. Alternatively,receiver 11 may acquire the sales information indicating the sales amount of each of the areas in the store from the outside. In this configuration,receiver 11 serves as an acquisition unit that acquires the sales information. Furthermore, the sales information acquired viareceiver 11 may be prestored intostorage unit 30. In this configuration,sales amount calculator 23 serves as an acquisition unit that acquires the sales information stored instorage unit 30. - In the first exemplary embodiment, the flow line information and the transition probability information are generated from the images output from monitoring
camera 100. Alternatively, the flow line information and the transition probability information may be input by a user, or a constant value, an average value, or the like may be used as the flow line information and the transition probability information. - In the first exemplary embodiment, the degrees of differences in the passage rate and in the sales amount of the store are displayed, but information to be displayed for the differences is not limited to the passage rate and the sales amount of the store. Furthermore, a number of pieces of information to be displayed for the differences is not limited to two. The method of the present disclosure is applicable to a case where the display mode is changed in accordance with degrees of differences in a plurality of pieces of information.
- For example,
flow line information 31 may be input intodifference calculator 24, and a difference inflow line information 31 may be displayed ondisplay unit 13. A detailed description will be given below of an example where the difference inflow line information 31 is displayed ondisplay unit 13. -
FIG. 8 shows a display example of the difference inflow line information 31 displayed bydisplay unit 13. For example, coordinates inflow line information 31 as shown inFIG. 2A are represented by black dots ofFIG. 8 , and a move from one coordinate to another coordinate is represented by a line (a flow line) that connects respective black dots.FIG. 8 shows flow line information on a person from which larger sales are obtained at a given date is represented byflow line 81, and flow line information on a person from which smaller sales are obtained is represented byflow line 82. Note thatflow lines -
FIG. 9 shows an operation ofcontroller 20 by which the difference in flow line information is calculated. First, the user inputs, intoinput unit 12, an object to be compared (herein, a flow line) and two levels for the object to be compared (a comparison source and a comparison target, for example, a person from which larger sales are obtained and a person from which smaller sales are obtained).Controller 20 inputs, viainput unit 12, the object to be compared, and the comparison source and the comparison target designated by the user (step S91).Difference calculator 24 extracts, based on the user's input, flow line information of the comparison source fromflow line information 31 in storage unit 30 (step S92) and flow line information of the comparison target (step S93). -
Difference calculator 24 calculates a difference in the flow line information between the comparison source and the comparison target (step S94). Accordingly, a different flow line (herein, a flow line included in only one of either the comparison source or the comparison target) can be extracted.Difference calculator 24 determines whether a flow line indicating the difference thus calculated corresponds to a flow line indicated by the flow line information of the comparison source or a flow line indicated by the flow line information of the comparison target and then changes a display mode for flow line (steps S95 to S98). Specifically,difference calculator 24 first determines whether the flow line indicating the difference calculated corresponds to the flow line indicated by the flow line information of the comparison source and does not correspond to the flow line indicated by the flow line information of the comparison target (step S95). In a case where the flow line corresponds to the flow line indicated by the flow line information of the comparison source and does not corresponds to the flow line indicated by the flow line information of the comparison target,difference calculator 24 displays, ondisplay unit 13, the difference in the flow line information with a solid line (step S96).Difference calculator 24 determines whether the flow line indicating the difference calculated does not correspond to the flow line indicated by the flow line information of the comparison source and corresponds to the flow line indicated by the flow line information of the comparison target (step S97). In a case where the flow line does not correspond to the flow line indicated by the flow line information of the comparison source and corresponds to the flow line indicated by the flow line information of the comparison target,difference calculator 24 displays, ondisplay unit 13, the difference in the flow line information with a dotted line (step S98). - The operation shown in
FIG. 9 causes display unit 13 to displaydifference flow line 83 anddifference flow line 84 that respectively indicate a difference in the flow line information of the comparison source and a difference in the flow line information of the comparison target as shown inFIG. 8 .Difference flow line 83 is a display example of the difference when the determination is made that the flow line corresponds to the flow line indicated by the flow line information of the comparison source and does not correspond to the flow line indicated by the flow line information of the comparison target in step S96, anddifference flow line 84 is a display example of the difference when the determination is made that the flow line does not correspond to the flow line indicated by the flow line information of the comparison source and corresponds to the flow line indicated by the flow line information of the comparison target in step S97. InFIG. 8 ,difference flow line 83 corresponds to a flow line of a person from which a larger sales amount is obtained, anddifference flow line 84 corresponds to a flow line of a person from which a smaller sales amount is obtained. Therefore, the user may propose, for example, a measure to lure people todifference flow line 83 such as providing a signage display atpoint 85 in order to increase the sales amount. Alternatively, the user may propose an arrangement of high-end items or better-selling items ondifference flow line 84. -
FIG. 8 shows a display example where a difference is shown between a single person from which larger sales are obtained and a single person from which smaller sales are obtained. Alternatively, a difference may be shown between a plurality of people from which larger sales are obtained and a plurality of people from which smaller sales are obtained.FIG. 10 shows a display example of differences in the flow line information on a plurality of people. In a case where flow lines of the plurality of people are displayed, a value indicating a number of people can be defined as a weight of a flow line. InFIG. 10 , a flow line corresponding to a number of people that is equal to or greater than a predetermined number is represented by a thick line that corresponds to a weight of "2", and a flow line corresponding to a number of people that is less than the predetermined number is represented by a thin line that corresponds to a weight of "1".Traffic line 101 andflow line 102 are represented by a combination of the thick line and the thin line. Note that the weight may be the number of people itself. Alternatively, for example, the weight may be a value calculated based on the number of people such as a proportion of the number of people or may be a value calculated from the transition probability or the passage rate. In this configuration, a difference between weight values is calculated as a difference betweenflow line 101 andflow line 102, and a weight resulting from the calculation may be shown. InFIG. 10 ,difference flow line 103 has a weight of 2 even after the difference calculation, which proves that a measure to lure people todifference flow line 103 atpoint 104 is more effective. - The components shown in the attached drawings and described in the detailed description may include, for the illustration of the above-described technique, not only components essential for the solution to the problem but also components not essential for the solution to the problem. Thus, it should not be immediately deemed that, merely based on the fact that the components that are not essential are shown in the attached drawings and described in the detailed description, the components that are not essential are essential.
- Furthermore, since the aforementioned exemplary embodiments are intended to illustrate the technique in the present disclosure, various changes, replacements, additions, omissions, or the like can be made within the scope of the claims and their equivalents.
- Note that, in the first exemplary embodiment, a description has been given on the assumption that things to be handled in the store are items. However, things for transaction with customers include not only items but also services. Of such stores, a barber shop or a game arcade does not sell items, but makes transaction with customers by providing the customers with opportunities of having haircuts or enjoying playing games. These activities are services, and implementing the content of the present disclosure also allows for presentation of information on sales gained through such services.
- Furthermore, examples of such a facility include not only a store but also a shopping mall (shopping area) where a plurality of stores are located together and a theme park where a plurality of various attractions are located together. The information presentation device according to the present disclosure can be used for such a shopping mall or a theme park.
- For example, in a case where the information presentation device according to the present disclosure is used for a shopping mall, the information presentation device includes: an input unit that inputs a setting value for setting two periods to be compared; an acquisition unit that acquires information on a passage rate indicating a proportion of people passing through each of a plurality of areas constituting an inside of the shopping mall and sales information indicating a sales amount of an item or a service in each of the areas; a difference calculator that calculates respective differences in the passage rate and in the sales amount between the two periods; and a display unit that displays at least one of the differences in the passage rate and in the sales amount.
- The use of such an information presentation device allows for presentation of information on sales in a shopping mall.
- In a case where the information presentation device according to the present disclosure is used for a theme park, the information presentation device includes: an input unit that inputs a setting value for setting two periods to be compared, an acquisition unit that acquires information on a passage rate indicating a proportion of people passing through each of a plurality of areas constituting an inside of the theme park and use information indicating a number of users who use an attraction in each of the areas; and a display unit that displays at least one of the differences in the passage rate and in the number of users between the two periods.
- The use of such an information presentation device allows for presentation of users of attractions in a theme park.
- Moreover, the content of the present disclosure can also be implemented for a case where transactions of items or services are made over the Internet. For example, the content of the present disclosure helps a conversion rate to increase in Internet transactions made with the help of an information technology (IT) (for example, a computer). Conversion refers to purchase of an item or of a service through, for example, Internet shopping. Further, the conversion rate refers to a proportion of a number of people who have actually purchased a certain item or service to a number of people who have visited a sales site for the certain item or service. The use of the information presentation system according to the present disclosure allows an increase in conversion rate. Note that, with a case where the item or service is not actually purchased but member registration or a request for a brochure is made at the site set as the conversion rate, the information presentation device according to the present disclosure can be used.
- The present disclosure is applicable to an information presentation device, an information presentation system, and an information presentation method that present sales and a passage rate of a facility such as a store.
-
- 1
- information presentation system
- 11
- receiver
- 12
- input unit
- 13
- display unit
- 20
- controller
- 21
- flow line information generator
- 22
- passage rate calculator
- 23
- sales amount calculator
- 24
- difference calculator
- 30
- storage unit
- 100
- monitoring camera
- 200
- POS terminal device
- 300
- information presentation device
Claims (13)
- An information presentation device comprising:an input unit that inputs a setting value for setting two periods to be compared;an acquisition unit that acquires information on a passage rate indicating a proportion of a number of people passing through each of a plurality of areas constituting an inside of a facility and sales information indicating a sales amount of an item or of a service in each of the areas;a difference calculator that calculates a difference in the passage rate between the two periods and a difference in the sales amount between the two periods; anda display unit that displays at least one of the difference in the passage rate and the difference in the sales amount.
- The information presentation device according to claim 1, wherein the display unit changes a display mode for difference based on degrees of both the differences in the passage rate and the sales amount.
- The information presentation device according to claim 2, wherein the display unit changes the display mode for difference in accordance with an increase or a decrease in the passage rate and an increase or a decrease in the sales amount when a comparison source and a comparison target in the two periods are compared.
- The information presentation device according to claim 2 or 3, wherein the change in the display mode for difference is a change in color indicating each of the areas, or a change in color or size of a figure indicating a degree of the difference.
- The information presentation device according to any one of claims 1 to 4, wherein
the acquisition unit includes:a passage rate calculator that calculates, based on area information indicating a position of each of the plurality of areas constituting the inside of the facility and people flow information indicating a flow of people moving in the facility, a proportion of a number of people passing through each of the areas to generate the information on the passage rate, anda sales amount calculator that calculates, based on position information indicating a position of an item or of a service placed in the facility and purchase data indicating a purchase amount of an item or of a service purchased in the facility, a sales amount of an item or of a service in each of the areas to generate the sales information. - The information presentation device according to claim 1, wherein the facility is a single store.
- The information presentation device according to claim 1, wherein the facility is a shopping mall where a plurality of stores are located together.
- The information presentation device according to claim 1, wherein the facility is a theme park where a plurality of attractions are located together.
- An information presentation device comprising:an input unit that inputs a setting value for setting two periods to be compared;an acquisition unit that acquires information on a passage rate indicating a proportion of a number of people passing through each of a plurality of areas constituting an inside of a shopping mall and sales information indicating a sales amount of an item or of a service in each of the areas;a difference calculator that calculates a difference in the passage rate between the two periods and a difference in the sales amount between the two periods; anda display unit that displays at least one of the difference in the passage rate and the difference in the sales amount.
- An information presentation device comprising:an input unit that inputs a setting value for setting two periods to be compared;an acquisition unit that acquires information on a passage rate indicating a proportion of a number of people passing through each of a plurality of areas constituting an inside of a theme park and use information indicating a number of users of an attraction in each of the areas;a difference calculator that calculates a difference in the passage rate between the two periods and a difference in the number of users between the two periods; anda display unit that displays at least one of the difference in the passage rate between the two periods and the difference in the number of users between the two periods.
- An information presentation system comprising:a monitoring camera that outputs images resulting from imaging a facility including a plurality of areas;a purchase terminal device that generates and outputs purchase data indicating an item or a service purchased in the facility and a purchase amount; andthe information presentation device according to claim 5 that calculates a difference in a passage rate and a difference in a sales amount between two periods to be compared from area information indicating a position of each of the areas in the facility, people flow information indicating a flow of people in the facility, the people flow information being generated from the images output from the monitoring camera, purchase data of the facility output from the purchase terminal device, and position information indicating a position of an item or of a service placed in the facility and displays at least one of the difference in the passage rate and the difference in the sales amount.
- An information presentation method comprising:causing an input unit to input a setting value for setting two periods to be compared;causing an acquisition unit to acquire information on a passage rate indicating a proportion of a number of people passing through each of a plurality of areas constituting an inside of a facility and sales information indicating a sales amount of an item or of a service in each of the areas;causing a difference calculator to calculate a difference in the passage rate between the two periods and a difference in the sales amount between the two periods; andcausing a display unit to display at least one of the difference in the passage rate and the difference in the sales amount.
- The information presentation method according to claim 12, wherein the causing the display unit to display changes a display mode for difference based on degrees of both the differences in the passage rate and the sales amount.
Applications Claiming Priority (2)
| Application Number | Priority Date | Filing Date | Title |
|---|---|---|---|
| JP2016133623 | 2016-07-05 | ||
| PCT/JP2017/020559 WO2018008307A1 (en) | 2016-07-05 | 2017-06-02 | Information presentation device, information presentation system, and information presentation method |
Publications (2)
| Publication Number | Publication Date |
|---|---|
| EP3483821A1 true EP3483821A1 (en) | 2019-05-15 |
| EP3483821A4 EP3483821A4 (en) | 2019-05-15 |
Family
ID=60912561
Family Applications (1)
| Application Number | Title | Priority Date | Filing Date |
|---|---|---|---|
| EP17823914.1A Withdrawn EP3483821A4 (en) | 2016-07-05 | 2017-06-02 | Information presentation device, information presentation system, and information presentation method |
Country Status (4)
| Country | Link |
|---|---|
| US (1) | US20190102785A1 (en) |
| EP (1) | EP3483821A4 (en) |
| JP (1) | JP6519833B2 (en) |
| WO (1) | WO2018008307A1 (en) |
Families Citing this family (2)
| Publication number | Priority date | Publication date | Assignee | Title |
|---|---|---|---|---|
| JP7065444B2 (en) * | 2019-03-14 | 2022-05-12 | パナソニックIpマネジメント株式会社 | Information processing equipment and information processing system |
| CN113569659B (en) * | 2021-07-05 | 2024-08-20 | 深圳智慧园区信息技术有限公司 | Passenger flow analysis method and system based on big data, intelligent terminal and storage medium |
Family Cites Families (12)
| Publication number | Priority date | Publication date | Assignee | Title |
|---|---|---|---|---|
| JP3487225B2 (en) * | 1999-07-16 | 2004-01-13 | 株式会社寺岡精工 | Shopping cart equipment |
| JP2001143184A (en) * | 1999-11-09 | 2001-05-25 | Katsuyoshi Hirano | A system that analyzes and summarizes the movement history of moving objects |
| JP2004118453A (en) | 2002-09-25 | 2004-04-15 | Toshiba Lighting & Technology Corp | Sales floor integrated monitoring system |
| JP2004178276A (en) * | 2002-11-27 | 2004-06-24 | Toshiba Lighting & Technology Corp | Sales floor planning support system |
| JP2005309951A (en) * | 2004-04-23 | 2005-11-04 | Oki Electric Ind Co Ltd | Sales promotion support system |
| JP4461486B2 (en) * | 2005-04-19 | 2010-05-12 | 株式会社デンソー | Group traveling navigation method, group traveling navigation system, navigation device, and information center |
| JP5046520B2 (en) * | 2006-01-10 | 2012-10-10 | Necインフロンティア株式会社 | Business day comparison report output method and system |
| JP4892609B2 (en) * | 2007-06-26 | 2012-03-07 | 東芝テック株式会社 | Customer behavior management device, method and program |
| JP2010002997A (en) * | 2008-06-18 | 2010-01-07 | Toshiba Tec Corp | Personal behavior analysis apparatus and personal behavior analysis program |
| JP2013210953A (en) * | 2012-03-30 | 2013-10-10 | Toshiba Tec Corp | Information terminal and program |
| JP6314987B2 (en) * | 2013-08-21 | 2018-04-25 | 日本電気株式会社 | In-store customer behavior analysis system, in-store customer behavior analysis method, and in-store customer behavior analysis program |
| JP6206804B2 (en) * | 2013-09-27 | 2017-10-04 | パナソニックIpマネジメント株式会社 | Mobile object tracking device, mobile object tracking system, and mobile object tracking method |
-
2017
- 2017-06-02 JP JP2018525978A patent/JP6519833B2/en active Active
- 2017-06-02 EP EP17823914.1A patent/EP3483821A4/en not_active Withdrawn
- 2017-06-02 WO PCT/JP2017/020559 patent/WO2018008307A1/en not_active Ceased
-
2018
- 2018-12-03 US US16/208,533 patent/US20190102785A1/en not_active Abandoned
Also Published As
| Publication number | Publication date |
|---|---|
| US20190102785A1 (en) | 2019-04-04 |
| WO2018008307A1 (en) | 2018-01-11 |
| EP3483821A4 (en) | 2019-05-15 |
| JPWO2018008307A1 (en) | 2018-11-15 |
| JP6519833B2 (en) | 2019-06-05 |
Similar Documents
| Publication | Publication Date | Title |
|---|---|---|
| US12079861B2 (en) | Imagery and annotations | |
| JP7586161B2 (en) | Information processing system, product recommendation method, and program | |
| CN110033298B (en) | Information processing equipment and control method, system and storage medium thereof | |
| US20160189431A1 (en) | Virtual try-on system, virtual try-on terminal, virtual try-on method, and computer program product | |
| JP2014170314A (en) | Information processing system, information processing method, and program | |
| US20190122233A1 (en) | Simulation device, simulation system, and simulation method | |
| JP7192942B2 (en) | Information processing device and control method | |
| US20190102785A1 (en) | Information presentation device, information presentation system, and information presentation method | |
| US12254458B2 (en) | Payment processing system, payment processing method, and recording medium | |
| JP7409483B2 (en) | Recommended devices, systems, methods and programs | |
| JP2023009062A (en) | Settlement support device, settlement support method and settlement support program | |
| US20190095934A1 (en) | Information presentation device, information presentation system, and information presentation method | |
| JP2016024601A (en) | Information processing apparatus, information processing system, information processing method, commodity recommendation method, and program | |
| JP7351410B2 (en) | Recommended devices, systems, methods and programs | |
| KR102737359B1 (en) | Platforms and systems that generate and trade personal preference data | |
| JP2020129228A (en) | Information processing program, information processing terminal, information processing method, and information processing apparatus | |
| JP7206806B2 (en) | Information processing device, analysis method, and program | |
| JP6755987B2 (en) | Information processing programs, information processing terminals, information processing methods, and information processing equipment | |
| JP2026014507A (en) | Sales data processing device and information processing program | |
| JP2025071691A (en) | Information processing device and program | |
| WO2022208720A1 (en) | Product-design generation support device, product-design generation support method, and program storage medium | |
| JP2020129230A (en) | Information processing program, information processing terminal, information processing method, and information processing device | |
| HK1257385A1 (en) | Image identification method and device, and electronic equipment |
Legal Events
| Date | Code | Title | Description |
|---|---|---|---|
| PUAI | Public reference made under article 153(3) epc to a published international application that has entered the european phase |
Free format text: ORIGINAL CODE: 0009012 |
|
| 17P | Request for examination filed |
Effective date: 20181129 |
|
| A4 | Supplementary search report drawn up and despatched |
Effective date: 20190404 |
|
| AK | Designated contracting states |
Kind code of ref document: A1 Designated state(s): AL AT BE BG CH CY CZ DE DK EE ES FI FR GB GR HR HU IE IS IT LI LT LU LV MC MK MT NL NO PL PT RO RS SE SI SK SM TR |
|
| AX | Request for extension of the european patent |
Extension state: BA ME |
|
| DAV | Request for validation of the european patent (deleted) | ||
| DAX | Request for extension of the european patent (deleted) | ||
| STAA | Information on the status of an ep patent application or granted ep patent |
Free format text: STATUS: THE APPLICATION IS DEEMED TO BE WITHDRAWN |
|
| 18D | Application deemed to be withdrawn |
Effective date: 20191106 |