EP3438276B2 - Microorganism identification method - Google Patents
Microorganism identification method Download PDFInfo
- Publication number
- EP3438276B2 EP3438276B2 EP16896960.8A EP16896960A EP3438276B2 EP 3438276 B2 EP3438276 B2 EP 3438276B2 EP 16896960 A EP16896960 A EP 16896960A EP 3438276 B2 EP3438276 B2 EP 3438276B2
- Authority
- EP
- European Patent Office
- Prior art keywords
- mass
- listeria
- dna
- charge ratio
- ribosomal proteins
- Prior art date
- Legal status (The legal status is an assumption and is not a legal conclusion. Google has not performed a legal analysis and makes no representation as to the accuracy of the status listed.)
- Active
Links
- 244000005700 microbiome Species 0.000 title claims description 113
- 238000000034 method Methods 0.000 title claims description 48
- 241000186779 Listeria monocytogenes Species 0.000 claims description 300
- 108010000605 Ribosomal Proteins Proteins 0.000 claims description 136
- 102000002278 Ribosomal Proteins Human genes 0.000 claims description 132
- 241000894007 species Species 0.000 claims description 84
- 108090000623 proteins and genes Proteins 0.000 claims description 68
- 102000004169 proteins and genes Human genes 0.000 claims description 66
- 241000186781 Listeria Species 0.000 claims description 64
- 102100032411 60S ribosomal protein L18 Human genes 0.000 claims description 60
- 241000186805 Listeria innocua Species 0.000 claims description 49
- 241000186780 Listeria ivanovii Species 0.000 claims description 49
- 239000003550 marker Substances 0.000 claims description 45
- 230000001580 bacterial effect Effects 0.000 claims description 41
- 241000186814 Listeria welshimeri Species 0.000 claims description 26
- 238000004949 mass spectrometry Methods 0.000 claims description 22
- 238000001819 mass spectrum Methods 0.000 claims description 22
- 238000007621 cluster analysis Methods 0.000 claims description 15
- 108090000930 ribosomal protein S11 Proteins 0.000 claims description 7
- 102000004413 ribosomal protein S11 Human genes 0.000 claims description 7
- 108090000343 Ribosomal protein L18 Proteins 0.000 claims description 6
- 102000003926 Ribosomal protein L18 Human genes 0.000 claims description 6
- 102100031571 40S ribosomal protein S16 Human genes 0.000 claims description 5
- 102000004282 Ribosomal protein S9 Human genes 0.000 claims description 5
- 108090000878 Ribosomal protein S9 Proteins 0.000 claims description 5
- 108010092955 ribosomal protein S16 Proteins 0.000 claims description 5
- 238000004590 computer program Methods 0.000 claims 1
- 108020004414 DNA Proteins 0.000 description 339
- 102100035322 60S ribosomal protein L24 Human genes 0.000 description 35
- 238000005259 measurement Methods 0.000 description 33
- 238000012360 testing method Methods 0.000 description 31
- 102100024406 60S ribosomal protein L15 Human genes 0.000 description 30
- 241000186807 Listeria seeligeri Species 0.000 description 24
- 239000000090 biomarker Substances 0.000 description 24
- 238000001840 matrix-assisted laser desorption--ionisation time-of-flight mass spectrometry Methods 0.000 description 23
- 241000186806 Listeria grayi Species 0.000 description 21
- 241001554615 Listeria rocourtiae Species 0.000 description 17
- 210000004027 cell Anatomy 0.000 description 14
- 238000010586 diagram Methods 0.000 description 10
- 241000894006 Bacteria Species 0.000 description 9
- 238000004458 analytical method Methods 0.000 description 9
- 238000012545 processing Methods 0.000 description 9
- 150000002500 ions Chemical class 0.000 description 8
- 238000001228 spectrum Methods 0.000 description 7
- 230000001717 pathogenic effect Effects 0.000 description 6
- 108091028043 Nucleic acid sequence Proteins 0.000 description 5
- 125000003275 alpha amino acid group Chemical group 0.000 description 5
- 230000000813 microbial effect Effects 0.000 description 5
- 238000003752 polymerase chain reaction Methods 0.000 description 5
- 238000001712 DNA sequencing Methods 0.000 description 4
- LFQSCWFLJHTTHZ-UHFFFAOYSA-N Ethanol Chemical compound CCO LFQSCWFLJHTTHZ-UHFFFAOYSA-N 0.000 description 4
- 239000000091 biomarker candidate Substances 0.000 description 4
- 238000001514 detection method Methods 0.000 description 4
- 239000000284 extract Substances 0.000 description 4
- 235000013305 food Nutrition 0.000 description 4
- 238000000752 ionisation method Methods 0.000 description 4
- 239000002609 medium Substances 0.000 description 4
- 239000000243 solution Substances 0.000 description 4
- WEVYAHXRMPXWCK-UHFFFAOYSA-N Acetonitrile Chemical compound CC#N WEVYAHXRMPXWCK-UHFFFAOYSA-N 0.000 description 3
- 206010016952 Food poisoning Diseases 0.000 description 3
- 208000019331 Foodborne disease Diseases 0.000 description 3
- 150000001413 amino acids Chemical class 0.000 description 3
- 238000005516 engineering process Methods 0.000 description 3
- 238000000816 matrix-assisted laser desorption--ionisation Methods 0.000 description 3
- 230000035772 mutation Effects 0.000 description 3
- 239000002773 nucleotide Substances 0.000 description 3
- 125000003729 nucleotide group Chemical group 0.000 description 3
- 238000011160 research Methods 0.000 description 3
- 229920001817 Agar Polymers 0.000 description 2
- 241001120504 Listeria marthii Species 0.000 description 2
- 206010024641 Listeriosis Diseases 0.000 description 2
- DTQVDTLACAAQTR-UHFFFAOYSA-N Trifluoroacetic acid Chemical compound OC(=O)C(F)(F)F DTQVDTLACAAQTR-UHFFFAOYSA-N 0.000 description 2
- 125000002777 acetyl group Chemical group [H]C([H])([H])C(*)=O 0.000 description 2
- 239000008272 agar Substances 0.000 description 2
- 210000004556 brain Anatomy 0.000 description 2
- 238000010276 construction Methods 0.000 description 2
- 238000012850 discrimination method Methods 0.000 description 2
- 230000000694 effects Effects 0.000 description 2
- 238000000605 extraction Methods 0.000 description 2
- 230000036039 immunity Effects 0.000 description 2
- 239000003978 infusion fluid Substances 0.000 description 2
- BDAGIHXWWSANSR-UHFFFAOYSA-N methanoic acid Natural products OC=O BDAGIHXWWSANSR-UHFFFAOYSA-N 0.000 description 2
- 125000001360 methionine group Chemical group N[C@@H](CCSC)C(=O)* 0.000 description 2
- 125000002496 methyl group Chemical group [H]C([H])([H])* 0.000 description 2
- 239000008188 pellet Substances 0.000 description 2
- 230000008569 process Effects 0.000 description 2
- 238000012163 sequencing technique Methods 0.000 description 2
- PCMORTLOPMLEFB-ONEGZZNKSA-N sinapic acid Chemical compound COC1=CC(\C=C\C(O)=O)=CC(OC)=C1O PCMORTLOPMLEFB-ONEGZZNKSA-N 0.000 description 2
- PCMORTLOPMLEFB-UHFFFAOYSA-N sinapinic acid Natural products COC1=CC(C=CC(O)=O)=CC(OC)=C1O PCMORTLOPMLEFB-UHFFFAOYSA-N 0.000 description 2
- 230000003595 spectral effect Effects 0.000 description 2
- 239000000126 substance Substances 0.000 description 2
- 239000000725 suspension Substances 0.000 description 2
- 108020004465 16S ribosomal RNA Proteins 0.000 description 1
- OSWFIVFLDKOXQC-UHFFFAOYSA-N 4-(3-methoxyphenyl)aniline Chemical compound COC1=CC=CC(C=2C=CC(N)=CC=2)=C1 OSWFIVFLDKOXQC-UHFFFAOYSA-N 0.000 description 1
- 208000030507 AIDS Diseases 0.000 description 1
- 108091035707 Consensus sequence Proteins 0.000 description 1
- 102000016928 DNA-directed DNA polymerase Human genes 0.000 description 1
- 108010014303 DNA-directed DNA polymerase Proteins 0.000 description 1
- 241000620209 Escherichia coli DH5[alpha] Species 0.000 description 1
- 235000008730 Ficus carica Nutrition 0.000 description 1
- 241000192125 Firmicutes Species 0.000 description 1
- 102100020773 Immunoglobulin kappa variable 1-12 Human genes 0.000 description 1
- 241001084338 Listeria sp. Species 0.000 description 1
- KDXKERNSBIXSRK-UHFFFAOYSA-N Lysine Natural products NCCCCC(N)C(O)=O KDXKERNSBIXSRK-UHFFFAOYSA-N 0.000 description 1
- 239000004472 Lysine Substances 0.000 description 1
- 201000009906 Meningitis Diseases 0.000 description 1
- 241001465754 Metazoa Species 0.000 description 1
- 206010028980 Neoplasm Diseases 0.000 description 1
- 241000589776 Pseudomonas putida Species 0.000 description 1
- 108090000983 Ribosomal protein L15 Proteins 0.000 description 1
- 102000004386 Ribosomal protein L15 Human genes 0.000 description 1
- 241000282849 Ruminantia Species 0.000 description 1
- 206010040047 Sepsis Diseases 0.000 description 1
- 238000012300 Sequence Analysis Methods 0.000 description 1
- 125000000539 amino acid group Chemical group 0.000 description 1
- 244000052616 bacterial pathogen Species 0.000 description 1
- 238000010876 biochemical test Methods 0.000 description 1
- 201000011510 cancer Diseases 0.000 description 1
- 239000006285 cell suspension Substances 0.000 description 1
- 230000001413 cellular effect Effects 0.000 description 1
- 239000003795 chemical substances by application Substances 0.000 description 1
- 238000003776 cleavage reaction Methods 0.000 description 1
- 239000000470 constituent Substances 0.000 description 1
- 238000007796 conventional method Methods 0.000 description 1
- 238000010168 coupling process Methods 0.000 description 1
- 235000013365 dairy product Nutrition 0.000 description 1
- 238000000354 decomposition reaction Methods 0.000 description 1
- 230000002950 deficient Effects 0.000 description 1
- 238000011161 development Methods 0.000 description 1
- 238000011156 evaluation Methods 0.000 description 1
- 238000002474 experimental method Methods 0.000 description 1
- 235000019253 formic acid Nutrition 0.000 description 1
- 230000006870 function Effects 0.000 description 1
- 230000014509 gene expression Effects 0.000 description 1
- 230000002068 genetic effect Effects 0.000 description 1
- 238000012268 genome sequencing Methods 0.000 description 1
- 239000001963 growth medium Substances 0.000 description 1
- 230000015784 hyperosmotic salinity response Effects 0.000 description 1
- 150000002605 large molecules Chemical class 0.000 description 1
- 239000004973 liquid crystal related substance Substances 0.000 description 1
- 238000007403 mPCR Methods 0.000 description 1
- 239000011159 matrix material Substances 0.000 description 1
- 235000013372 meat Nutrition 0.000 description 1
- 229930182817 methionine Natural products 0.000 description 1
- 238000002493 microarray Methods 0.000 description 1
- 239000011259 mixed solution Substances 0.000 description 1
- 210000000056 organ Anatomy 0.000 description 1
- 230000007918 pathogenicity Effects 0.000 description 1
- 230000004481 post-translational protein modification Effects 0.000 description 1
- 238000003906 pulsed field gel electrophoresis Methods 0.000 description 1
- 108700022487 rRNA Genes Proteins 0.000 description 1
- 235000021487 ready-to-eat food Nutrition 0.000 description 1
- 230000004044 response Effects 0.000 description 1
- 108010025463 ribosomal protein L24 Proteins 0.000 description 1
- 108090000892 ribosomal protein L6 Proteins 0.000 description 1
- 102000004291 ribosomal protein L6 Human genes 0.000 description 1
- 210000004708 ribosome subunit Anatomy 0.000 description 1
- 230000007017 scission Effects 0.000 description 1
- 238000010187 selection method Methods 0.000 description 1
- 238000000926 separation method Methods 0.000 description 1
- 210000002966 serum Anatomy 0.000 description 1
- 239000007787 solid Substances 0.000 description 1
- 230000007480 spreading Effects 0.000 description 1
- 238000011144 upstream manufacturing Methods 0.000 description 1
- 235000013311 vegetables Nutrition 0.000 description 1
Images


Classifications
-
- G—PHYSICS
- G01—MEASURING; TESTING
- G01N—INVESTIGATING OR ANALYSING MATERIALS BY DETERMINING THEIR CHEMICAL OR PHYSICAL PROPERTIES
- G01N33/00—Investigating or analysing materials by specific methods not covered by groups G01N1/00 - G01N31/00
- G01N33/48—Biological material, e.g. blood, urine; Haemocytometers
- G01N33/50—Chemical analysis of biological material, e.g. blood, urine; Testing involving biospecific ligand binding methods; Immunological testing
- G01N33/68—Chemical analysis of biological material, e.g. blood, urine; Testing involving biospecific ligand binding methods; Immunological testing involving proteins, peptides or amino acids
- G01N33/6803—General methods of protein analysis not limited to specific proteins or families of proteins
- G01N33/6848—Methods of protein analysis involving mass spectrometry
-
- G—PHYSICS
- G01—MEASURING; TESTING
- G01N—INVESTIGATING OR ANALYSING MATERIALS BY DETERMINING THEIR CHEMICAL OR PHYSICAL PROPERTIES
- G01N33/00—Investigating or analysing materials by specific methods not covered by groups G01N1/00 - G01N31/00
- G01N33/48—Biological material, e.g. blood, urine; Haemocytometers
- G01N33/50—Chemical analysis of biological material, e.g. blood, urine; Testing involving biospecific ligand binding methods; Immunological testing
- G01N33/53—Immunoassay; Biospecific binding assay; Materials therefor
- G01N33/569—Immunoassay; Biospecific binding assay; Materials therefor for microorganisms, e.g. protozoa, bacteria, viruses
- G01N33/56911—Bacteria
-
- C—CHEMISTRY; METALLURGY
- C12—BIOCHEMISTRY; BEER; SPIRITS; WINE; VINEGAR; MICROBIOLOGY; ENZYMOLOGY; MUTATION OR GENETIC ENGINEERING
- C12Q—MEASURING OR TESTING PROCESSES INVOLVING ENZYMES, NUCLEIC ACIDS OR MICROORGANISMS; COMPOSITIONS OR TEST PAPERS THEREFOR; PROCESSES OF PREPARING SUCH COMPOSITIONS; CONDITION-RESPONSIVE CONTROL IN MICROBIOLOGICAL OR ENZYMOLOGICAL PROCESSES
- C12Q1/00—Measuring or testing processes involving enzymes, nucleic acids or microorganisms; Compositions therefor; Processes of preparing such compositions
- C12Q1/02—Measuring or testing processes involving enzymes, nucleic acids or microorganisms; Compositions therefor; Processes of preparing such compositions involving viable microorganisms
- C12Q1/04—Determining presence or kind of microorganism; Use of selective media for testing antibiotics or bacteriocides; Compositions containing a chemical indicator therefor
-
- C—CHEMISTRY; METALLURGY
- C12—BIOCHEMISTRY; BEER; SPIRITS; WINE; VINEGAR; MICROBIOLOGY; ENZYMOLOGY; MUTATION OR GENETIC ENGINEERING
- C12N—MICROORGANISMS OR ENZYMES; COMPOSITIONS THEREOF; PROPAGATING, PRESERVING, OR MAINTAINING MICROORGANISMS; MUTATION OR GENETIC ENGINEERING; CULTURE MEDIA
- C12N15/00—Mutation or genetic engineering; DNA or RNA concerning genetic engineering, vectors, e.g. plasmids, or their isolation, preparation or purification; Use of hosts therefor
- C12N15/09—Recombinant DNA-technology
-
- G—PHYSICS
- G01—MEASURING; TESTING
- G01N—INVESTIGATING OR ANALYSING MATERIALS BY DETERMINING THEIR CHEMICAL OR PHYSICAL PROPERTIES
- G01N2333/00—Assays involving biological materials from specific organisms or of a specific nature
- G01N2333/195—Assays involving biological materials from specific organisms or of a specific nature from bacteria
-
- G—PHYSICS
- G01—MEASURING; TESTING
- G01N—INVESTIGATING OR ANALYSING MATERIALS BY DETERMINING THEIR CHEMICAL OR PHYSICAL PROPERTIES
- G01N2560/00—Chemical aspects of mass spectrometric analysis of biological material
Definitions
- the present invention relates to a method for discriminating a microorganism using mass spectrometry.
- DNA base sequences Homology analysis based on DNA base sequences has been known as one of methods for discriminating types of microorganisms and has been widely used for classification, identification or the like of microorganisms (see, for example, Patent Literature 1).
- DNA is first extracted from a test microorganism, and the DNA base sequence of a region, such as rRNA genes, existing in high conservation in all organisms is determined.
- a database involving a large number of DNA base sequence data of known microorganisms is searched and a base sequence showing high similarity to the DNA base sequence of the test microorganism is selected.
- the species from which the base sequence is derived is determined to be of the same species or closely related species to the test microorganism.
- a method of identifying a microorganism based on a mass spectrum pattern obtained by mass spectrometry of a test microorganism has been increasingly used.
- mass spectrometry analytical results can be obtained in a short time using a trace amount of a microorganism sample, and continuous analysis of multiple specimens is easily carried out, so that simple and quick microorganism identification is possible.
- a solution containing proteins extracted from a test microorganism, a suspension of a test microorganism or the like is analyzed by a mass spectrometer using a soft ionization method such as MALDI-MS (matrix assisted laser desorption ionization mass spectrometry).
- the "soft" ionization method is an ionization method that hardly causes decomposition of a high-molecular weight compound. Then, the test microorganism is identified by comparing the obtained mass spectrum pattern with mass spectrum patterns of known microorganisms that have been involved in advance in a database in large numbers. Such a method is called a fingerprint method because a mass spectrum pattern is used as information (that is, a fingerprint) specific to each microorganism.
- peaks with different mass-to-charge ratios differ depending on the classification level of microorganisms (family, genus, species, subspecies, pathogenic type, serotype, strain, etc.), for example, in order to perform discrimination reproducibly at the pathogenic type or strain level, it is necessary to select marker peaks that can be used for discrimination at the pathogenic type or strain level to be identified.
- ribosomal subunit proteins L5, L13, L14, L15, L18, L19, L20, L22, L23, L24, L28, L30, L35, L36, S7, S8, S10, S13, S14, S17, S19, S20, and S21 are available (Patent Literature 2).
- Listeria monocytogenes (hereinafter, “Listeria” is abbreviated as “L.”) is known as one causative bacterium for food poisoning.
- Listeria monocytogenes is a bacterium belonging to the genus Listeria of gram-positive bacteria and has characteristics such as growth ability at low temperature (4°C) and salt tolerance.
- Non Patent Literature 1 Listeria monocytogenes (L. monocytogenes), Listeria innocua (L. innocua), Listeria welshimeri (L. welshimeri), Listeria seeligeri (L. seeligeri), Listeria ivanovii (L. ivanovii), Listeria grayi (L. grayi), Listeria marthii (L. marthii), and Listeria rocourtiae (L. rocourtiae)) have been reported as conventional species (Non Patent Literatures 2 and 3).
- Listeria monocytogenes and Listeria ivanovii have pathogenicity to animals and, in particular, Listeria monocytogenes has been reported to infect humans frequently via familiar uncooked ready-to-eat foods such as meat, dairy products, vegetables, etc., causing outbreaks of food poisoning.
- Listeria monocytogenes has been reported to infect humans frequently via familiar uncooked ready-to-eat foods such as meat, dairy products, vegetables, etc., causing outbreaks of food poisoning.
- pregnant women, newborns, elderly persons, and immunity deficient persons such as patients suffering from AIDS or cancer, and organ transplant patients are infected with Listeria monocytogenes, severe symptomatic listeriosis such as sepsis or meningitis is caused, which may lead to death.
- examples have also been reported in which Listeria innocua infected patients develop listeriosis (Non Patent Literature 3).
- Listeria monocytogenes is known to have 13 serotypes (1/2a, 1/2b, 1/2c, 3a, 3b, 3c, 4a, 4ab, 4b, 4c, 4d, 4e, and 7), serotype 4b is the most common in epidemic outbreak cases, and serotype 1/2b and serotype 1/2a have been reported to be included (Non Patent Literature 4).
- Listeria monocytogenes can be genetically classified into four evolutionary lineages (lineages I, II, III, and IV) (Non Patent Literature 5).
- Serotypes frequently isolated from infected individuals belong to lineages I and II, and more specifically, serotypes 1/2b, 3b, 4b, 4d, and 4e belong to the lineage I and serotypes 1/2a, 1/2c, 3a, and 3c belong to the lineage II.
- serotypes 4a and 4c belong to the lineage III.
- the lineage IV is a recently proposed classification, and it has been reported that serotypes 4a, 4b, and 4c may belong to IV (Non Patent Literature 6).
- the lineages III and IV are less isolated from humans and are mainly detected from ruminants.
- Non Patent Literature 7 pulse field gel electrophoresis
- Non Patent Literatures 8 and 9 multi-locus sequence typing method
- microarray method Non Patent Literature 10
- microorganism identification technology using matrix-assisted laser desorption/ionization time-of-flight mass spectrometry has been rapidly spreading in recent years. This is a method of identifying a microorganism based on a mass spectrum pattern obtained using a trace amount of a microorganism sample, and an analysis result can be obtained in a short time. In addition, continuous analysis of multiple specimens is easily carried out, so that simple and quick microorganism identification is possible.
- Non Patent Literatures 11 to 14 reports that Listeria monocytogenes, Listeria innocua, Listeria welshimeri, Listeria ivanovii, and Listeria seeligeri have been discriminated by pattern matching of all detected mass peaks with existing databases and calculating their scores.
- serotype 4a and serotype 4c of Listeria monocytogenes are distinguished by the fact that specific mass peaks (mass-to-charge ratios [m/z] 5590 and 11179) are detected as indexes (biomarkers).
- Non Patent Literature 12 it is possible to identify species of Listeria grayi only, with 6 bacterial species of the genus Listeria being discriminated at the genus level.
- Non Patent Literature 14 it has been reported that Listeria monocytogenes is classified into groups of serotype 1/2a, serotype 1/2b, and serotype 4b by using peaks of five detection masses (m/z 5594.85, 6184.39, 11871.31, 5601.21, 11199.33) as biomarkers.
- the present invention has been made in view of the above points, and an object of the present invention is to select a marker protein capable of reproducibly and quickly discriminating a bacterial species of the genus Listeria and to provide a method for discriminating a microorganism using the marker protein.
- Listeria bacteria can be discriminated by using at least one of 17 ribosomal proteins L3, L4, L23, L2, L24, L6, L18, S5, L15, S13, S11, L10, L21, L13, S9, L31, S16 as a marker protein for discriminating Listeria bacteria contained in a sample by mass spectrometry, and that Listeria bacteria can be discriminated reproducibly and quickly in particular by using at least one of 8 ribosomal proteins L24, L6, L18, L15, S11, S9, L31, S16 among these 17 ribosomal proteins.
- the method for discriminating a microorganism is suitable as a method for discriminating one of Listeria monocytogenes (L. monocytogenes), Listeria innocua (L. innocua), Listeria welshimeri (L. welshimeri), ), Listeria ivanovii (L. ivanovii) as a bacterial species of the Listeria bacteria.
- Listeria monocytogenes L. monocytogenes
- Listeria innocua L. innocua
- Listeria welshimeri L. welshimeri
- Listeria ivanovii Listeria ivanovii
- the discrimination step discriminates whether or not Listeria monocytogenes is contained in the microorganism based on at least a mass-to-charge ratio m/z of a peak derived from each of the ribosomal proteins L15, S11, and S9, or a mass-to-charge ratio m/z of a peak derived from each of the ribosomal proteins L24, L6, L18, and S9, or a mass-to-charge ratio m/z of a peak derived from each of the ribosomal proteins S 11, S9, L31, and S 16, or a mass-to-charge ratio m/z of a peak derived from each of the ribosomal proteins L18, S9, L31, and S16, or a mass-to-charge ratios m/z of a peak derived from each of the ribosomal proteins L18, L15, and S9, or a mass-to-charge ratio m/z of a peak derived from each of
- the discrimination step discriminates whether or not Listeria innocua is contained in the microorganism based on at least a mass-to-charge ratio m/z of a peak derived from the ribosomal protein S16 or a mass-to-charge ratio m/z of a peak derived from each of the ribosomal proteins L15 and L31. Then, when the microorganism is discriminated as containing Listeria innocua, the discrimination step further determines a strain of Listeria innocua based on at least a mass-to-charge ratio m/z of a peak derived from the ribosomal protein L18.
- the discrimination step discriminates whether or not Listeria ivanovii is contained in the microorganism based on at least a mass-to-charge ratio m/z of a peak derived from the ribosomal proteins S9 and L31.
- the discrimination step discriminates whether or not Listeria ivanovii londiniensis (L. ivanovii londiniensis) as a subspecies of Listeria ivanovii is contained in the microorganism based on at least a mass-to-charge ratio m/z of a peak derived from each of the ribosomal proteins L18, S9, and L31, or a mass-to-charge ratio m/z of a peak derived from each of the ribosomal proteins L15, S11, and L31, or a mass-to-charge ratio m/z of a peak derived from each of the ribosomal proteins L15, S9, and L31, or a mass-to-charge ratio m/z of a peak derived from each of the ribosomal proteins L18, S11, and L31.
- the discrimination step discriminates whether or not Listeria welshimeri is contained in the microorganism based on at least a mass-to-charge ratio m/z of a peak derived from the ribosomal protein S11 or a mass-to-charge ratio m/z of a peak derived from each of the ribosomal proteins L18 and S9.
- the discrimination step may discriminate which bacterial species of Listeria bacteria the microorganism contained in the sample contains using a cluster analysis in which at least a mass-to-charge ratio m/z of a peak of each of the ribosomal proteins L24, L18, S9, and L31 and a mass-to-charge ratio m/z of a peak of one of the ribosomal proteins L6, L15, and S11, or a mass-to-charge ratio m/z of a peak of each of the ribosomal proteins L24, L18, S9, and S16 and a mass-to-charge ratio m/z of a peak of one of the ribosomal proteins L6, L15, and S11 are used as indexes, and in particular, if the cluster analysis in which all of the mass-to-charge ratios m/z of peaks derived from 8 marker proteins (L24, L18, S9, L31 and a mass-to-charge ratio m/z of a peak of one
- a ribosomal protein having a mutation peculiar to a bacterial species of the genus Listeria is used as a marker protein, and therefore, the bacterial species of the genus Listeria can be reproducibly and quickly discriminated.
- the bacteria of the genus Listeria contained in a plurality of samples can be collectively discriminated.
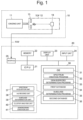
- FIG. 1 is an overall view of a microorganism discrimination system used by the method for discriminating a microorganism according to the present invention.
- the microorganism discrimination system is roughly made up of a mass spectrometry unit 10 and a microorganism determination unit 20.
- the mass spectrometry unit 10 includes an ionization unit 11 that ionizes molecules and atoms in a sample by a matrix-assisted laser desorption ionization (MALDI) method and a time-of-flight mass separator (TOF) 12 that separates various ions emitted from the ionization unit 11 in accordance with the mass-to-charge ratio.
- MALDI matrix-assisted laser desorption ionization
- TOF time-of-flight mass separator
- the TOF 12 includes an extraction electrode 13 that extracts ions from the ionization unit 11 to guide the ions into an ion flight space in the TOF 12 and a detector 14 that detects ions mass-separated in the ion flight space.
- the substance of the microorganism determination unit 20 is a computer such as a workstation or a personal computer, and a central processing unit (CPU) 21 as a central processing unit, a memory 22, a display unit 23 including a liquid crystal display (LCD), an input unit 24 including a keyboard, a mouse and the like, and a storage unit 30 including a mass storage device such as a hard disk and a solid state drive (SSD) are connected to each other.
- An operating system (OS) 31, a spectrum creation program 32, a genus/species determination program 33, and a subclass determination program 35 are stored in the storage unit 30 and also, a first database 34 and a second database 36 are stored.
- the microorganism determination unit 20 further includes an interface (I/F) 25 to control direct connection with an external device and connection via a network such as a Local Area Network (LAN) with an external device or the like and is connected to the mass spectrometry unit 10 from the interface 25 via a network cable NW (or wireless LAN).
- I/F interface
- NW wireless LAN
- a spectrum acquisition unit 37, an m/z reading unit 38, a subclass determination unit 39, a cluster analysis unit 40, and the dendrogram (lineage diagram) creation unit 41 are shown as relating to the subclass determination program 35.
- these units are functional means implemented by software by the subclass determination program 35 being executed by the CPU 21.
- the subclass determination program 35 is not necessarily a single program, but may be a function incorporated into a portion of a program for controlling the genus/species determination program 33 or the mass spectrometry unit 10 and its form is not particularly limited.
- the genus/species determination program 33 for example, a program for performing microorganism identification by a conventional fingerprint method or the like can be used.
- the spectrum creation program 32, the genus/species determination program 33, the subclass determination program 35, the first database 34, and the second database 36 are mounted on the terminal operated by the user, but at least a portion or all of these units may be provided in another device connected to the terminal via a computer network so that processing by a program and/or access to a database provided in the other device is performed according to instructions from the terminal.
- mass lists related to known microorganisms are registered in the first database 34 of the storage unit 30. These mass lists enumerate the mass-to-charge ratios of ions detected upon mass spectrometry of a certain microorganism cell and include, in addition to the information of the mass-to-charge ratios, at least information (classification information) of the classification group to which the microbial cell belongs (family, genus, species, etc.). Such mass lists are desirably created based on data (actual measurement data) obtained by actual mass spectrometry of various microbial cells in advance by the same ionization method and mass separation method as those by the mass spectrometry unit 10.
- a peak appearing in a predetermined mass-to-charge ratio range is first extracted from the mass spectrum acquired as the actual measurement data.
- the mass-to-charge ratio range is set to about 2,000 to 35,000.
- protein-derived peaks can be mainly extracted.
- undesirable peaks can be excluded. Since the ribosomal protein group is expressed in a large amount in the cell, most of the mass-to-charge ratios listed in the mass list can be derived from the ribosomal proteins by setting the threshold appropriately.
- the mass-to-charge ratios (m/z) of the peaks extracted in the above manner are listed for each cell and registered in the first database 34 after adding the classification information and the like.
- Information about marker proteins to discriminate known microorganisms at a level lower than the classification level discriminable by the genus/species determination program 33 is registered in the second database 36 of the storage unit 30. That is, information about marker proteins to discriminate the classification subordinate to the genus (species, subspecies, pathogenic type, serotype, strain, etc.) when the genus/species determination program 33 can discriminate the genus of a known microorganism and to discriminate the classification subordinate to the species (subspecies, pathogenic type, serotype, strain, etc.) when the species of a known microorganism can be discriminated is registered.
- Information about the marker protein includes at least information about the mass-to-charge ratio (m/z) of the marker protein in the known microorganism.
- m/z mass-to-charge ratio
- information about marker proteins to discriminate which of 4 species Listeria monocytogenes (L. monocytogenes), Listeria innocua (L. innocua), Listeria ivanovii (L. ivanovii), Listeria seeligeri (L. seeligeri), Listeria welshimeri (L.
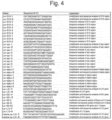
- the test microorganism is, mass-to-charge ratio values of at least 8 ribosomal proteins, the mass-to-charge ratio value of L24 (m/z 11180.22, 11194.25, 11254.35, 11558.65), the mass-to-charge ratio value of L6 (m/z 19270.04, 19256.01, 19097.81, 19371.01), the mass-to-charge ratio value of L18 (m/z 13096.86, 13110.89, 13082.84, 13066.84), the mass-to-charge ratio value of L15 (m/z 15782.02, 15797.08, 15811.1, 15743.01, 15601.77), the mass-to-charge ratio value of S11 (m/z 13655.65, 13674.66, 13683.67, 13591.66, 13591.67), the mass-to-charge ratio value of S9+Ac (m/z 14283.40, 14359.50,
- the above 8 ribosomal proteins can be used as marker proteins to discriminate the bacterial species of the genus Listeria alone or as a combination of a plurality of ribosomal proteins and therefore, the value of the mass-to-charge ratio is stored in the second database 36 together with information about the bacterial species.
- the lineage of Listeria monocytogenes can be discriminated.
- the ribosomal proteins S9, L24, and L6 can also be used as marker proteins to discriminate Listeria monocytogenes lineage (Lineage)
- the ribosomal proteins L24, L18, L15, S11, S9, and L31 can also be used as marker proteins to discriminate the serotype of Listeria monocytogenes. Therefore, the values of the mass-to-charge ratio of these ribosomal proteins are also stored in the second database 36 as information about the marker proteins for discriminating the lineage and serotype of Listeria monocytogenes.
- the strain of the innocua can be determined based on at least the mass-to-charge ratio m/z of a peak derived from the ribosomal protein L18.
- the values of the mass-to-charge ratios of these ribosomal proteins L18, S16, and L31 are also stored in the second database 36 as information about the marker proteins for discriminating the strain of Listeria innocua.
- the values of the mass-to-charge ratios of the ribosomal proteins L18, S9, L31, L15, and S11 are also stored in the second database 36 as information about the marker proteins for discriminating the subspecies of Listeria ivanovii.
- the fact that the 8 ribosomal proteins described above can be used for discrimination of bacterial species of the genus Listeria, discrimination of lineage and serotype of Listeria monocytogenes, determination of strains of Listeria innocua and grouping of strains, and discrimination of subspecies of Listeria ivanovii and the like is derived from the result of determining the mass-to-charge ratios of 8 ribosomal proteins for each bacterial species or each strain of the genus Listeria and attributing the mass-to-charge ratios of 8 ribosomal proteins of each bacterial species or each strain.
- ribosomal proteins useful for grouping the strains are selected by comparing the mass-to-charge ratios of 8 ribosomal proteins of Listeria innocua ATCC33090T (L. innocua ATCC33090T) as the type strain and the mass-to-charge ratios of 8 ribosomal proteins of Listeria innocua GTC02960 (L. innocua GTC02960), which is not the type strain (for details, refer to Examples to be described below, Fig. 8 showing the theoretical mass values of 8 ribosomal proteins, Fig. 12A showing the attribution results based on actual measurement values of 8 ribosomal proteins, and the like)).
- the value of the mass-to-charge ratio of the marker proteins stored in the second database 36 is desirably selected by comparing the calculated mass obtained by translating the base sequence of each marker protein into an amino acid sequence with the mass-to-charge ratio detected by actual measurement.
- the base sequence of the marker protein may be, in addition to determining by sequencing, acquired from a public database, for example, a database or the like of National Center for Biotechnology Information (NCBI) and used.
- NCBI National Center for Biotechnology Information
- the penultimate amino acid residue is Gly, Ala, Ser, Pro, Val, Thr, or Cys
- the theoretical value is calculated assuming that the N-terminal methionine is cleaved.
- molecules added with protons are actually observed by MALDI-TOF MS and thus, it is desirable to determine the calculated mass by factoring in protons (that is, the theoretical value of the mass-to-charge ratio of ions obtained when each protein is analyzed by MALDI-TOF MS).
- the user prepares a sample containing constituent components of a test microorganism and sets the sample to the mass spectrometry unit 10 to perform mass spectrometry.
- the mass spectrometry unit 10 to perform mass spectrometry.
- bacterial cells or a cell suspension may be used as it is.
- the spectrum creation program 32 acquires a detection signal obtained from the detector 14 of the mass spectrometry unit 10 via the interface 25 and creates a mass spectrum of the test microorganism based on the detection signal (step S101).
- the genus/species determination program 33 checks the mass spectrum of the test microorganism against a mass list of known microorganisms recorded in the first database 34 and extracts a mass list of known microorganisms having a mass-to-charge ratio pattern similar to the mass spectrum of the test microorganism, for example, a mass list including peaks that coincide with each peak in the mass spectrum of the test microorganism within a predetermined error range (step S102). Subsequently, the genus/species determination program 33 refers to the classification information stored in the first database 34 in association with the mass list extracted in step S102, thereby determining the classification (genus or species) of the known microorganism corresponding to the mass list (step S103).
- test microorganism is not bacteria belonging to the genus Listeria, or the test microorganism is a bacterium belonging to the genus Listeria and the bacterial species thereof is determined (No in step S104), the classification is output the display unit 23 as a classification of the test microorganism (step S112) before the discrimination processing is terminated.
- the processing proceeds to the discrimination processing by the subclass determination program 35. If it is determined in advance that the sample contains Listeria bacteria by other methods, the processing may proceed to the subclass determination program 35 without using the genus/species determination program using a mass spectrum.
- the subclass determination unit 39 reads the mass-to-charge ratio values of the 8 ribosomal proteins L24, L6, L18, L15, S11, S9+Ac, L31 type B, and S16 as marker proteins from the second database 36 (step S105). Subsequently, the spectrum acquisition unit 37 acquires the mass spectrum of the test microorganism created in step S101. Then, the m/z reading unit 38 selects peaks appearing in the mass-to-charge ratio range stored in the second database 36 in association with each of the marker proteins on the mass spectrum as peaks corresponding to each of the marker proteins and reads the mass-to-charge ratios thereof (step S106).
- the cluster analysis is performed using the read mass-to-charge ratio as an index. More specifically, the subclass determination unit 39 compares the mass-to-charge ratio with the value of the mass-to-charge ratio of each marker protein read out from the second database 36 and determines the attribution of the protein with respect to the read mass-to-charge ratio (Step S107). Then, the cluster analysis is performed based on the determined attribution to determine the species of the test microorganism (step S108), and the determined species is output to the display unit 23 as the discrimination result of the test microorganisms (step S109).
- the test microorganism belongs is determined and then, the serotype and lineage of Listeria monocytogenes are discriminated, but the determination and the discrimination may be performed simultaneously. Also, the discrimination of serotypes and lineage of bacterial species of Listeria monocytogenes may be omitted.
- the DNA sequence of the ribosomal protein encoded into the S10-spc-alpha operon and the ribosomal protein genes of biomarker candidates was sequenced by DNA sequencing with a primer designed based on the consensus sequence upstream and downstream of the target region of a genome sequencing strain. More specifically, the genomes were extracted from various strains of the genus Listeria shown in Fig. 3 by a conventional method, and the region of the ribosomal protein gene (up to 5 kbp) and the region of the biomarker proteins were amplified as a template thereof by the polymerase chain reaction (PCR) using KOD plus (Toyobo, Osaka, Japan) as high fidelity DNA polymerase.
- PCR polymerase chain reaction
- the obtained PCR product was purified and used as a template for DNA sequencing.
- DNA sequencing was performed using Big Dye ver. 3.1 Cycle Sequencing Kit (Applied Biosystems, Foster City, Calif.). The primers used for PCR and DNA sequencing are shown in Fig. 4 .
- a mass-to-charge ratio of the ribosomal protein was calculated from the amino acid sequence obtained by translating the DNA base sequence of the ribosomal protein gene determined as described above and the mass of each amino acid shown in Fig. 5 , and the mass-to-charge ratio was defined as the theoretical mass value.
- Bacterial cells were recovered from the Brain Heart Infusion liquid medium or agar medium, and about 3 colonies of bacterial cells were suspended in 0.5 mL of 70% ethanol. The suspension was centrifuged at 10,000 rpm for 2 minutes, and the obtained bacterial cell pellet was dried in a vacuum drier for 5 minutes to evaporate the ethanol. 10 ⁇ L of 35% formic acid was added to the dried pellet and stirred, which was obtained as an analysis sample.
- 1.5 ⁇ L of the analysis sample was added to 10 ⁇ L of a sinapinic acid matrix agent (solution containing 20 mg/mL sinapinic acid (Wako Pure Chemical Corporation, Osaka, Japan) in a solution of 50v/v% acetonitrile and 1v/v% trifluoroacetic acid) and sufficiently mixed. Then, 1.5 ⁇ L of the mixed solution was dropped on a sample plate and allowed to air dry.
- a sinapinic acid matrix agent solution containing 20 mg/mL sinapinic acid (Wako Pure Chemical Corporation, Osaka, Japan) in a solution of 50v/v% acetonitrile and 1v/v% trifluoroacetic acid
- a sinapinic acid matrix agent solution containing 20 mg/mL sinapinic acid (Wako Pure Chemical Corporation, Osaka, Japan) in a solution of 50v/v% acetonitrile and 1v/v% trifluoroacetic acid
- the theoretical mass value calculated by the above method was matched with the measured mass-to-charge ratio with a tolerance of 500 ppm and appropriately corrected.
- the Escherichia coli DH5 ⁇ strain was used for the calibration of the AXIMA microorganism identification system.
- the theoretical mass value of the ribosomal protein described above was checked against the peak chart obtained by MALDI-TOF MS measurement and regarding the ribosomal proteins that could be actually detected, it was confirmed that there was no difference between the theoretical mass value and the actual measurement value.
- the ribosomal proteins encoded into the S10-spc-alpha operon and other ribosomal proteins of the biomarker candidates were examined for the relationship between Listeria monocytogenes strain or serotype and the mass-to-charge ratio. The result is shown in Fig. 6 .
- Fig. 6 shows the theoretical mass values (mass-to-charge ratios (m/z)) of ribosomal proteins encoded into the S10-spc-alpha operon and other ribosomal proteins of the biomarker candidates for 14 strains of Listeria monocytogenes.
- Serotypes 1/2b, 3b, 4b, 4d, and 4e are classified into Lineage I
- serotypes 1/2a, 1/2c, 3a, and 3c are classified into Lineage II
- serotype 4a is classified into lineage III.
- ⁇ indicates that the peak was detected within the tolerance of 500 ppm from the theoretical mass value, and ⁇ indicates that the peak was not detected in some cases. Also, ⁇ indicates that the peak was detected, but the difference from the theoretical mass value of other strains or other serotypes was small or the difference from the peak of other ribosomal proteins was within 500 ppm.
- the ribosomal proteins L3, L4, L23, L2, L24, L6, L18, S5, L15, S13, and S11 encoded into the S10-spc-alpha operon and the ribosomal proteins L10, L21, L13, and S9+Ac other than the operon, a total of 15, were found to have different theoretical mass values from other strains in some strains of Listeria monocytogenes used for the measurement.
- these 15 ribosomal proteins are marker proteins that can be used to discriminate strains or serotypes of Listeria monocytogenes.
- the DNA base sequence in each strain of these 15 ribosomal proteins is shown in SEQ ID NO: 1 to 240 in the sequence listing. The outline of the sequence corresponding to each sequence number is as follows.
- the DNA base sequences of 14 strains of Listeria monocytogenes (ATCC 15313T, JCM 2873, JCM 7671, JCM 7672, JCM 7673, JCM 7674, JCM 7675, JCM 7676, JCM 7677, JCM 7678, JCM 7680, JCM 7683, ATCC 51772, and ATCC 19115) and two strains of Listeria seeligeri (JCM 7679 and JCM 7682) are as follows.
- L3, L4, L23, L2, L10, and L21 have one or more strains having a difference in theoretical mass value from other strains of 500 ppm or more and are considered as biomarker candidates to be used for discrimination of the strains, the peak shape was unclear or the peak intensity was insufficient and so it was not possible to detect the peak and therefore, these ribosomal proteins are considered to be inappropriate as stable biomarkers.
- ribosomal proteins S5 and L13 were able to detect peaks in MALDI-TOF MS measurement, the difference in theoretical mass value from other strains was 500 ppm or less, which makes the ribosomal proteins inappropriate as biomarkers. Further, S13 (m/z 13578.69 or 13552.65) overlaps with the peak of another ribosomal protein L20 (m/z 13552.08) and both peaks cannot be distinguished so S13 is still inappropriate as a biomarker.
- ribosomal proteins L24, L6, L18, L15, S11, and S9+Ac, were detected in a stable manner regardless of the strain and the difference in theoretical mass value from other strains was 500 ppm or more and so were considered to be useful as biomarkers. Therefore, in the present embodiment, these 6 ribosomal proteins were used as biomarkers for discriminating the serotype or strain (or lineage) of Listeria monocytogenes in MALDI-TOF MS measurement.
- the 6 biomarkers L24, L6, L18, L15, S11, and S9+Ac which have been shown to be useful for discriminating serotypes or strains of Listeria monocytogenes, were detected in a stable manner in all the strains of Listeria monocytogenes in MALDI-TOF MS measurement and thus, it was expected that the peaks of these proteins are likely to be detected in a stable manner in the same way even for samples of different species of the genus Listeria.
- these two ribosomal proteins are also considered to be biomarkers that can be used to discriminate species of the genus Listeria, and a table of theoretical mass values for discrimination of species of the genus Listeria with respect to 8 ribosomal proteins newly including L31 type B (m/z 9259.36, 9290.34, 9327.44, or 9271.3) and S16 (m/z 10234.94, 10252.97, 10230.88, or 10003.54), in addition to the above 6 ribosomal proteins (L24, L6, L18, L15, S11, and S9), was created ( Fig. 8 ). It is a matter of course that these 8 ribosomal proteins are biomarkers that can be used not only for discriminating species of the genus Listeria, but also for discriminating the serotype of Listeria monocytogenes.
- the 56th amino acid of the ribosomal protein S11 of Listeria grayi has been specifically changed to lysine and further, in the result of MALDI-TOF MS measurement, the mass peak was observed at the position where the mass of the methyl group (CH 3 ) was added. From the above, the theoretical mass value was calculated assuming that S11 of Listeria grayi was methylated. Also, since S11 of Listeria rocourtiae (L. rocourtiae was observed to have a peak at a position larger than the theoretical mass value by about 17 in m/z, 17 was added to the theoretical mass value.
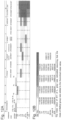
- the mass pattern of the protein was analyzed by the fingerprint method using SARAMIS (trademark, Spectral Archive and Microbial Identification System), and it was confirmed that all the strains were bacteria of the genus Listeria. Subsequently, profile data was created by evaluating those having the mass-to-charge ratio of the peak on the mass spectrum of each strain matching the mass-to-charge ratio of a biomarker protein without mutation as "1", those that did not match as "2" to "5" (2 to 5 indicate mutually different mass-to-charge ratios), and those in which no peak corresponding to the biomarker protein was present as "0". This data was imported into PAST software (Natural History Museum, University of Oslo, Norway) and cluster-analyzed by the proximity coupling method using the Kimura algorithm.
- a phylogenetic tree ( Fig. 13A ) was created using FigTree ver. 1.4.0 software.
- Fig. 13A 7 bacterial species of the genus Listeria were correctly classified and further, Listeria monocytogenes was correctly classified for each lineage.
- the above software was activated to register the theoretical mass value for each strain of the 6 ribosomal proteins L24, L6, L18, L15, S11, and S9+Ac (the value of the mass-to-charge ratio of the ribosomal protein L24 (m/z 11180.22, 11194.25, 11254.35), the value of the mass-to-charge ratio of the ribosomal protein L6 (m/z 19270.08(19270.80), 19256.01), the value of the mass-to-charge ratio of the ribosomal protein L18 (m/z 13096.86, 13110.89), the value of the mass-to-charge ratio of the ribosomal protein L15 (m/z 15782.02, 15797.08), the value of the mass-to-charge ratio of the ribosomal protein S11 (m/z 13655.65, 13674.66), and the value of the mass-to-charge ratio of the ribosomal protein S9+Ac (m
- Fig. 7A mass spectrum data obtained by MALDI-TOF MS measurement was analyzed for each strain to examine whether or not the peak corresponding to a biomarker was correctly attributed to the theoretical mass value of the registered biomarker.
- Fig. 7B shows the relationship between the mass-to-charge ratios of the 6 ribosomal proteins and the attribution numbers 1 to 3 shown in Fig. 7A . Attribution patterns were classified into groups A to D and checked against the serotypes of each strain and it turned out that strains of lineage II belong to group A, strains of lineage I belong to groups B, C, and strains of lineage III belong to group D.
- L24 (m/z 11180.22, 11194.25, 11254.35), L6 (m/z 19270.08, 19256.01), L18 (m/z 13096.86, 13110.89), L15 (m/z 15782.02, 15797.08, 15668.86), S11 (m/z 13655.65, 13674.66) and S9+Ac (m/z 14283.40, 14359.50, or 14302.45) are useful marker proteins for discrimination of the serotype and lineage of Listeria monocytogenes in MALDI-TOF MS measurement. In addition, accurate masses of these marker proteins were calculated from these genetic information and these marker proteins were also checked against actual measurement values and therefore, it became clear that a mass database with high reliability can be constructed.
- Fig. 9A is a chart of bacterial species or strains of groups A to E
- Fig. 9B is a chart of bacterial species or strains of groups F to M.
- Listeria rocourtiae was not identified as a species because the theoretical mass value corresponding to its mass peak was not stored in the database of SARAMIS. On the other hand, Listeria grayi was correctly identified up to the species level by SARAMIS. Because Listeria grayi is systematically distant from other Listeria bacteria, Listeria grayi is considered to have been identifiable by the existing fingerprint method.
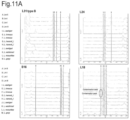
- Figs. 11A and 11B are enlarged views of the biomarker peak portions of the charts of Figs. 9A and 9B . As can be seen from Figs. 11A and 11B , the biomarker mass was shifted by the species of the genus Listeria and peaks could be distinguished.
- Fig. 12A is a table showing the correspondence relationship between the attribution number of the biomarker and the theoretical mass value in Fig. 12A .
- the numerals 1 to 5 shown on the charts in Figs. 11A and 11B represent the attribution number of each biomarker.
- a dendrogram (lineage diagram) showing the attribution result using the 8 ribosomal proteins shown in Fig. 12A and a dendrogram of the attribution result using five ribosomal proteins L24, S9, L6, L18, and S16 out of the 8 ribosomal proteins are shown in Figs. 13A and 13B .
- the species of the genus Listeria can be discriminated and the lineage of Listeria monocytogenes can be discriminated. From the above, it was found that the discrimination method of the genus Listeria using the ribosomal proteins found in the present embodiment as marker proteins is a very effective method.
- the second database 36 was caused to store the mass-to-charge ratios of 8 ribosomal proteins as marker proteins to discriminate which of the 7 bacterial species of the genus Listeria the test microorganism belongs to, but in the above embodiment, the second database 36 may also be caused to store the total of 17 ribosomal proteins, 15 ribosomal proteins (L3, L4, L23, L2, L24, L6, L18, S5, L15, S13, S11, L10, L21, L13, and S9) found in the process of constructing a protein mass database to discriminate Listeria monocytogenes and two ribosomal proteins (L31 (L31 type B), and S16) found in the process of constructing a protein mass database to discriminate the bacterial species other than Listeria monocytogenes, so that the subclass determination program 35 uses at least one of 17 ribosomal proteins to discriminate which of the bacterial species of the genus Listeria the test microorganism belongs to.
- 15 ribosomal proteins
- the lineage of Listeria monocytogenes is discriminated by cluster analysis, but the lineage may also be discriminated by comparing the actual measurement value of one or more ribosomal proteins with the theoretical mass value.
- the lineage may be discriminated from actual measurement values of mass peaks corresponding to the ribosomal proteins L24, L6, and S9.
- the ribosomal proteins L24 and L6 are useful as marker proteins to distinguish between a lineage I and other lineages, because a unique mass shift was observed in the lineage I of Listeria monocytogenes.
- ribosomal protein L18 may be used as a marker protein to discriminate Listeria seeligeri.
- the ribosomal protein S16 having a mass-to-charge ratio characteristic of L. innocua and while not encompassed by the claims the ribosomal protein S9 capable of discriminating a strain of Listeria seeligeri are useful as biomarkers to discriminate species of the genus Listeria.
- the ribosomal proteins L18, L15 become useful marker proteins to discriminate subspecies of Listeria ivanovii, and the ribosomal protein S11 becomes a useful marker protein to discriminate Listeria welshimeri.
Description
- The present invention relates to a method for discriminating a microorganism using mass spectrometry.
- Homology analysis based on DNA base sequences has been known as one of methods for discriminating types of microorganisms and has been widely used for classification, identification or the like of microorganisms (see, for example, Patent Literature 1). In this method, DNA is first extracted from a test microorganism, and the DNA base sequence of a region, such as rRNA genes, existing in high conservation in all organisms is determined. Next, using the DNA base sequence, a database involving a large number of DNA base sequence data of known microorganisms is searched and a base sequence showing high similarity to the DNA base sequence of the test microorganism is selected. Then, the species from which the base sequence is derived is determined to be of the same species or closely related species to the test microorganism.
- However, with such a method utilizing the DNA base sequence, it takes a relatively long time to extract DNA from a test microorganism and to determine a DNA base sequence, so that there is a problem that it is difficult to quickly identify the microorganisms.
- Therefore, in recent years, a method of identifying a microorganism based on a mass spectrum pattern obtained by mass spectrometry of a test microorganism has been increasingly used. According to the mass spectrometry, analytical results can be obtained in a short time using a trace amount of a microorganism sample, and continuous analysis of multiple specimens is easily carried out, so that simple and quick microorganism identification is possible. In this method, a solution containing proteins extracted from a test microorganism, a suspension of a test microorganism or the like is analyzed by a mass spectrometer using a soft ionization method such as MALDI-MS (matrix assisted laser desorption ionization mass spectrometry). Note that the "soft" ionization method is an ionization method that hardly causes decomposition of a high-molecular weight compound. Then, the test microorganism is identified by comparing the obtained mass spectrum pattern with mass spectrum patterns of known microorganisms that have been involved in advance in a database in large numbers. Such a method is called a fingerprint method because a mass spectrum pattern is used as information (that is, a fingerprint) specific to each microorganism.
- However, in the identification of microorganisms by the fingerprint method using mass spectrometry, it is possible to identify at the genus level or a relatively distant species level, but discrimination between closely related species and identification at the level of subspecies, pathogenic types, strains or the like as a classification level lower than the species are normally considered to be difficult. Further, in the fingerprint method, it is not determined from which protein each peak appearing on the mass spectra originates, leaving a problem of the theoretical basis of identification and reliability. Therefore, in order to solve the problem, utilizing the fact that about half of peaks obtained by mass spectrometry of microbial cells is derived from ribosomal proteins, a method of attributing the type of protein from which a peak is derived by associating a mass-to-charge ratio of the peak obtained by mass spectrometry with a calculated mass estimated from the amino acid sequence obtained by translating base sequence information of ribosomal protein genes have been developed (see
Patent Literatures 2 and 3). According to this method, it is possible to perform microorganism identification with high reliability based on the theoretical basis by using mass spectrometry. - However, since peaks with different mass-to-charge ratios differ depending on the classification level of microorganisms (family, genus, species, subspecies, pathogenic type, serotype, strain, etc.), for example, in order to perform discrimination reproducibly at the pathogenic type or strain level, it is necessary to select marker peaks that can be used for discrimination at the pathogenic type or strain level to be identified. For example, as marker proteins for identifying and discriminating Pseudomonas putida and its analogous cells, 23 ribosomal subunit proteins (L5, L13, L14, L15, L18, L19, L20, L22, L23, L24, L28, L30, L35, L36, S7, S8, S10, S13, S14, S17, S19, S20, and S21) are available (Patent Literature 2).
-
- Patent Literature 1:
JP 2006-191922 A - Patent Literature 2:
JP 2007-316063 A - Patent Literature 3:
JP 2013-085517 A -
- Non Patent Literature 1: List of prokaryotic names with standing in nomenclature, [searched on September 18, 2015], Internet <URL: http://www.bacterio.net/>
- Non Patent Literature 2: BMC Genomics 2010, 11, 688
- Non Patent Literature 3: JMM Case Reports, 2014, DOI 10.1099/jmmcr.0.003103
- Non Patent Literature 4: Microbes Infect 2007, 9, 1236-1243
- Non Patent Literature 5: Int J med Microbiol, 2011, 301, 79-96
- Non Patent Literature 6: Appl Environ Micribiol, 2008, 74, 7629-7642
- Non Patent Literature 7: Int J Food Microbiol 2001, 65:55-62
- Non Patent Literature 8: J Clin Microbiol 2003, 41:757-762
- Non Patent Literature 9: PLoS Pathog 2008, 4: e1000146
- Non Patent Literature 10: Vet Microbiol, 2003, 92, 351-362.
- Non Patent Literature 11: Appl Environ Micribiol, 2008, 74, 5402-5407
- Non Patent Literature 12: J Clin Microbiol. 2012, 50, 2702-2707
- Non Patent Literature 13: Int J Food Microbiol. 2015, 202, 1-9
- Non Patent Literature 14: J Clin Microbiol. 2014, 52, 2371-2379
- Non Patent Literature 15: J Clin Microbiol. 2004, 42, 3819-3822
- Incidentally, Listeria monocytogenes (hereinafter, "Listeria" is abbreviated as "L.") is known as one causative bacterium for food poisoning. Listeria monocytogenes is a bacterium belonging to the genus Listeria of gram-positive bacteria and has characteristics such as growth ability at low temperature (4°C) and salt tolerance.
- In the genus Listeria, 18 bacterial species have been discovered so far (Non Patent Literature 1) and numerous findings particularly about 8 species discovered in the 1960's and 1980's (Listeria monocytogenes (L. monocytogenes), Listeria innocua (L. innocua), Listeria welshimeri (L. welshimeri), Listeria seeligeri (L. seeligeri), Listeria ivanovii (L. ivanovii), Listeria grayi (L. grayi), Listeria marthii (L. marthii), and Listeria rocourtiae (L. rocourtiae)) have been reported as conventional species (
Non Patent Literatures 2 and 3). According to such findings, Listeria monocytogenes and Listeria ivanovii have pathogenicity to animals and, in particular, Listeria monocytogenes has been reported to infect humans frequently via familiar uncooked ready-to-eat foods such as meat, dairy products, vegetables, etc., causing outbreaks of food poisoning. In addition, when pregnant women, newborns, elderly persons, and immunity deficient persons such as patients suffering from AIDS or cancer, and organ transplant patients are infected with Listeria monocytogenes, severe symptomatic listeriosis such as sepsis or meningitis is caused, which may lead to death. Further, in recent years, examples have also been reported in which Listeria innocua infected patients develop listeriosis (Non Patent Literature 3). - Listeria monocytogenes is known to have 13 serotypes (1/2a, 1/2b, 1/2c, 3a, 3b, 3c, 4a, 4ab, 4b, 4c, 4d, 4e, and 7),
serotype 4b is the most common in epidemic outbreak cases, andserotype 1/2b andserotype 1/2a have been reported to be included (Non Patent Literature 4). In addition, Listeria monocytogenes can be genetically classified into four evolutionary lineages (lineages I, II, III, and IV) (Non Patent Literature 5). Serotypes frequently isolated from infected individuals belong to lineages I and II, and more specifically,serotypes 1/2b, 3b, 4b, 4d, and 4e belong to the lineage I andserotypes 1/2a, 1/2c, 3a, and 3c belong to the lineage II. On the other hand,serotypes serotypes - For this reason, among Listeria bacteria, Listeria monocytogenes need to be managed in the food field and the medical field as food poisoning bacteria harming humans, and development of a rapid detection method and an identification and discrimination technology has been desired.
- Heretofore, as a method for discriminating serotypes of the genus Listeria and Listeria monocytogenes, pulse field gel electrophoresis (Non Patent Literature 7), multi-locus sequence typing method (
Non Patent Literatures 8 and 9), microarray method (Non Patent Literature 10) and the like have been reported. However, each of these methods poses a problem that complicated operations are needed and a time is required. - Meanwhile, in the clinical field and the food field, a microorganism identification technology using matrix-assisted laser desorption/ionization time-of-flight mass spectrometry (MALDI-TOF MS) has been rapidly spreading in recent years. This is a method of identifying a microorganism based on a mass spectrum pattern obtained using a trace amount of a microorganism sample, and an analysis result can be obtained in a short time. In addition, continuous analysis of multiple specimens is easily carried out, so that simple and quick microorganism identification is possible.
- For this reason, it has been attempted to discriminate Listeria bacteria using MALDI-TOF MS by a plurality of research groups (
Non Patent Literatures 11 to 14). For example,Non Patent Literature 10 reports that Listeria monocytogenes, Listeria innocua, Listeria welshimeri, Listeria ivanovii, and Listeria seeligeri have been discriminated by pattern matching of all detected mass peaks with existing databases and calculating their scores. In addition,serotype 4a andserotype 4c of Listeria monocytogenes are distinguished by the fact that specific mass peaks (mass-to-charge ratios [m/z] 5590 and 11179) are detected as indexes (biomarkers). - On the other hand, according to Non
Patent Literature 12, it is possible to identify species of Listeria grayi only, with 6 bacterial species of the genus Listeria being discriminated at the genus level. InNon Patent Literature 14, it has been reported that Listeria monocytogenes is classified into groups ofserotype 1/2a,serotype 1/2b, andserotype 4b by using peaks of five detection masses (m/z 5594.85, 6184.39, 11871.31, 5601.21, 11199.33) as biomarkers. - As described above, although there are a plurality of reports on discrimination of bacterial species of Listeria bacteria and the serotype of Listeria monocytogenes by MALDI-TOF MS, from which protein each peak appearing on the mass spectra or each biomarker peak originates is not determined, lacking in the theoretical basis of identification and discrimination as well as reliability. In addition, the results of identification and discrimination are different from research group to research group, and unified views have not yet been obtained. In other words, a highly reliable marker protein that can be suitably used for discrimination of bacterial species and serotype of Listeria bacteria has not yet been established.
- The present invention has been made in view of the above points, and an object of the present invention is to select a marker protein capable of reproducibly and quickly discriminating a bacterial species of the genus Listeria and to provide a method for discriminating a microorganism using the marker protein.
- As a result of diligent discussion, the present inventors have found that Listeria bacteria can be discriminated by using at least one of 17 ribosomal proteins L3, L4, L23, L2, L24, L6, L18, S5, L15, S13, S11, L10, L21, L13, S9, L31, S16 as a marker protein for discriminating Listeria bacteria contained in a sample by mass spectrometry, and that Listeria bacteria can be discriminated reproducibly and quickly in particular by using at least one of 8 ribosomal proteins L24, L6, L18, L15, S11, S9, L31, S16 among these 17 ribosomal proteins.
- That is, a method for discriminating a microorganism according to the present invention, is set out in the appended set of claims.
- The method for discriminating a microorganism is suitable as a method for discriminating one of Listeria monocytogenes (L. monocytogenes), Listeria innocua (L. innocua), Listeria welshimeri (L. welshimeri), ), Listeria ivanovii (L. ivanovii) as a bacterial species of the Listeria bacteria.
- Specifically, the discrimination step discriminates whether or not Listeria monocytogenes is contained in the microorganism based on at least a mass-to-charge ratio m/z of a peak derived from each of the ribosomal proteins L15, S11, and S9, or a mass-to-charge ratio m/z of a peak derived from each of the ribosomal proteins L24, L6, L18, and S9, or a mass-to-charge ratio m/z of a peak derived from each of the
ribosomal proteins S 11, S9, L31, andS 16, or a mass-to-charge ratio m/z of a peak derived from each of the ribosomal proteins L18, S9, L31, and S16, or a mass-to-charge ratios m/z of a peak derived from each of the ribosomal proteins L18, L15, and S9, or a mass-to-charge ratio m/z of a peak derived from each of the ribosomal proteins L24, L6, S11, and S9. - The discrimination step discriminates whether or not Listeria innocua is contained in the microorganism based on at least a mass-to-charge ratio m/z of a peak derived from the ribosomal protein S16 or a mass-to-charge ratio m/z of a peak derived from each of the ribosomal proteins L15 and L31. Then, when the microorganism is discriminated as containing Listeria innocua, the discrimination step further determines a strain of Listeria innocua based on at least a mass-to-charge ratio m/z of a peak derived from the ribosomal protein L18.
- Also, the discrimination step discriminates whether or not Listeria ivanovii is contained in the microorganism based on at least a mass-to-charge ratio m/z of a peak derived from the ribosomal proteins S9 and L31.
- Also, the discrimination step discriminates whether or not Listeria ivanovii londiniensis (L. ivanovii londiniensis) as a subspecies of Listeria ivanovii is contained in the microorganism based on at least a mass-to-charge ratio m/z of a peak derived from each of the ribosomal proteins L18, S9, and L31, or a mass-to-charge ratio m/z of a peak derived from each of the ribosomal proteins L15, S11, and L31, or a mass-to-charge ratio m/z of a peak derived from each of the ribosomal proteins L15, S9, and L31, or a mass-to-charge ratio m/z of a peak derived from each of the ribosomal proteins L18, S11, and L31.
- Further, the discrimination step discriminates whether or not Listeria welshimeri is contained in the microorganism based on at least a mass-to-charge ratio m/z of a peak derived from the ribosomal protein S11 or a mass-to-charge ratio m/z of a peak derived from each of the ribosomal proteins L18 and S9.
- Also, in the above method for discriminating a microorganism according to the present invention, the discrimination step may discriminate which bacterial species of Listeria bacteria the microorganism contained in the sample contains using a cluster analysis in which at least a mass-to-charge ratio m/z of a peak of each of the ribosomal proteins L24, L18, S9, and L31 and a mass-to-charge ratio m/z of a peak of one of the ribosomal proteins L6, L15, and S11, or a mass-to-charge ratio m/z of a peak of each of the ribosomal proteins L24, L18, S9, and S16 and a mass-to-charge ratio m/z of a peak of one of the ribosomal proteins L6, L15, and S11 are used as indexes, and in particular, if the cluster analysis in which all of the mass-to-charge ratios m/z of peaks derived from 8 marker proteins (L24, L18, S9, L31, S16, L6, L15, S11) are used as indexes, it is possible to accurately discriminate which bacterial species of Listeria bacteria the microorganism contained in the sample is.
- In this case, it is preferable to further include a step of creating a dendrogram representing a discrimination result by the cluster analysis.
- In the method for discriminating a microorganism according to the present invention described above, a ribosomal protein having a mutation peculiar to a bacterial species of the genus Listeria is used as a marker protein, and therefore, the bacterial species of the genus Listeria can be reproducibly and quickly discriminated.
- By using a ribosomal protein having a mutation peculiar to a bacterial species of the genus Listeria as a marker protein and carrying out cluster analysis using a mass-to-charge ratio m/z of a peak derived from the marker protein on the mass spectra as an index, the bacteria of the genus Listeria contained in a plurality of samples can be collectively discriminated.
-
-
Fig. 1 is a block diagram showing principal units of a microorganism discrimination system used in a method for discriminating a microorganism according to the present invention. -
Fig. 2 is a flowchart showing an example of a procedure for the method for discriminating a microorganism according to the present invention. -
Fig. 3 is a diagram showing a list of bacterial species names and strain names of the genus Listeria used in Example. -
Fig. 4 is a diagram showing a list of primers used in Example. -
Fig. 5 is a diagram showing the mass of each amino acid. -
Fig. 6 is a diagram showing a list of theoretical mass values of respective proteins in a Listeria monocytogenes strain used in Example. -
Fig. 7A is a diagram showing a list of attribution of actual measurement values of respective ribosomal proteins in the strain used in Example. -
Fig. 7B is a diagram showing the relationship between the attribution number inFig. 7A and the theoretical mass value of each ribosomal protein. -
Fig. 8 is a diagram showing a list of theoretical mass values of respective proteins in a species of the genus Listeria used in Example. -
Fig. 9A is a chart obtained by MALDI-TOF MS measurement (part 1). -
Fig. 9B is a chart obtained by MALDI-TOF MS measurement (part 2). -
Fig. 10 is an analysis result based on SARAMIS. -
Fig. 11A is a peak chart obtained by MALDI-TOF MS measurement (part 1). -
Fig. 11B is a peak chart obtained by MALDI-TOF MS measurement (part 2). -
Fig. 12A is an attribution result by actual measurement values of 8 ribosomal proteins. -
Fig. 12B is a table showing the relationship between the attribution number shown inFIG. 12A and the theoretical mass value. -
Fig. 13A is a dendrogram created using 8 ribosomal proteins. -
Fig. 13B is a dendrogram created using 5 ribosomal proteins. - Hereinafter, a specific embodiment of a method for discriminating a microorganism according to the present invention will be described.
-
FIG. 1 is an overall view of a microorganism discrimination system used by the method for discriminating a microorganism according to the present invention. The microorganism discrimination system is roughly made up of amass spectrometry unit 10 and amicroorganism determination unit 20. Themass spectrometry unit 10 includes anionization unit 11 that ionizes molecules and atoms in a sample by a matrix-assisted laser desorption ionization (MALDI) method and a time-of-flight mass separator (TOF) 12 that separates various ions emitted from theionization unit 11 in accordance with the mass-to-charge ratio. - The
TOF 12 includes anextraction electrode 13 that extracts ions from theionization unit 11 to guide the ions into an ion flight space in theTOF 12 and adetector 14 that detects ions mass-separated in the ion flight space. - The substance of the
microorganism determination unit 20 is a computer such as a workstation or a personal computer, and a central processing unit (CPU) 21 as a central processing unit, amemory 22, adisplay unit 23 including a liquid crystal display (LCD), aninput unit 24 including a keyboard, a mouse and the like, and astorage unit 30 including a mass storage device such as a hard disk and a solid state drive (SSD) are connected to each other. An operating system (OS) 31, aspectrum creation program 32, a genus/species determination program 33, and a subclass determination program 35 (program according to the present invention) are stored in thestorage unit 30 and also, afirst database 34 and asecond database 36 are stored. Themicroorganism determination unit 20 further includes an interface (I/F) 25 to control direct connection with an external device and connection via a network such as a Local Area Network (LAN) with an external device or the like and is connected to themass spectrometry unit 10 from theinterface 25 via a network cable NW (or wireless LAN). - In
Fig. 1 , a spectrum acquisition unit 37, an m/z reading unit 38, asubclass determination unit 39, acluster analysis unit 40, and the dendrogram (lineage diagram)creation unit 41 are shown as relating to thesubclass determination program 35. Basically, these units are functional means implemented by software by thesubclass determination program 35 being executed by theCPU 21. Thesubclass determination program 35 is not necessarily a single program, but may be a function incorporated into a portion of a program for controlling the genus/species determination program 33 or themass spectrometry unit 10 and its form is not particularly limited. As the genus/species determination program 33, for example, a program for performing microorganism identification by a conventional fingerprint method or the like can be used. - Also, in
Fig. 1 , thespectrum creation program 32, the genus/species determination program 33, thesubclass determination program 35, thefirst database 34, and thesecond database 36 are mounted on the terminal operated by the user, but at least a portion or all of these units may be provided in another device connected to the terminal via a computer network so that processing by a program and/or access to a database provided in the other device is performed according to instructions from the terminal. - A large number of mass lists related to known microorganisms are registered in the
first database 34 of thestorage unit 30. These mass lists enumerate the mass-to-charge ratios of ions detected upon mass spectrometry of a certain microorganism cell and include, in addition to the information of the mass-to-charge ratios, at least information (classification information) of the classification group to which the microbial cell belongs (family, genus, species, etc.). Such mass lists are desirably created based on data (actual measurement data) obtained by actual mass spectrometry of various microbial cells in advance by the same ionization method and mass separation method as those by themass spectrometry unit 10. - When creating a mass list from the actual measurement data, a peak appearing in a predetermined mass-to-charge ratio range is first extracted from the mass spectrum acquired as the actual measurement data. At this point, by setting the mass-to-charge ratio range to about 2,000 to 35,000, protein-derived peaks can be mainly extracted. Also, by extracting only peaks whose peak height (relative intensity) is equal to or greater than a predetermined threshold, undesirable peaks (noise) can be excluded. Since the ribosomal protein group is expressed in a large amount in the cell, most of the mass-to-charge ratios listed in the mass list can be derived from the ribosomal proteins by setting the threshold appropriately. Then, the mass-to-charge ratios (m/z) of the peaks extracted in the above manner are listed for each cell and registered in the
first database 34 after adding the classification information and the like. In order to suppress variations in gene expression due to culture conditions, it is desirable to standardize culture conditions in advance for each microbial cell used for collecting actual measurement data. - Information about marker proteins to discriminate known microorganisms at a level lower than the classification level discriminable by the genus/
species determination program 33 is registered in thesecond database 36 of thestorage unit 30. That is, information about marker proteins to discriminate the classification subordinate to the genus (species, subspecies, pathogenic type, serotype, strain, etc.) when the genus/species determination program 33 can discriminate the genus of a known microorganism and to discriminate the classification subordinate to the species (subspecies, pathogenic type, serotype, strain, etc.) when the species of a known microorganism can be discriminated is registered. Information about the marker protein includes at least information about the mass-to-charge ratio (m/z) of the marker protein in the known microorganism. In the second database 36 according to the present embodiment, as information about marker proteins to discriminate which of 4 species (Listeria monocytogenes (L. monocytogenes), Listeria innocua (L. innocua), Listeria ivanovii (L. ivanovii), Listeria seeligeri (L. seeligeri), Listeria welshimeri (L. welshimeri), of the genus Listeria the test microorganism is, mass-to-charge ratio values of at least 8 ribosomal proteins, the mass-to-charge ratio value of L24 (m/z 11180.22, 11194.25, 11254.35, 11558.65), the mass-to-charge ratio value of L6 (m/z 19270.04, 19256.01, 19097.81, 19371.01), the mass-to-charge ratio value of L18 (m/z 13096.86, 13110.89, 13082.84, 13066.84), the mass-to-charge ratio value of L15 (m/z 15782.02, 15797.08, 15811.1, 15743.01, 15601.77), the mass-to-charge ratio value of S11 (m/z 13655.65, 13674.66, 13683.67, 13591.66, 13591.67), the mass-to-charge ratio value of S9+Ac (m/z 14283.40, 14359.50, 14302.45, 14372.55, 14330.55), the mass-to-charge ratio value of L31 type B (m/z 9259.36, 9290.34, 9271.3, 9327.44), and the mass-to-charge ratio value of S16 (m/z 10234.94, 10252.97, 10003.54, 10230.88) are stored. Thesubclass determination program 35 uses at least one of these 8 ribosomal proteins to discriminate which of the 4 bacterial species of Listeria genus is the test microorganism. - Specifically, based on at least the mass-to-charge ratio m/z of a peak derived from each of the ribosomal proteins L15, S11, and S9, or the mass-to-charge ratio m/z of a peak derived from each of the ribosomal proteins L24, L6, L18, and S9, or the mass-to-charge ratio m/z of a peak derived from each of the ribosomal proteins S11, S9, L31, and S16, or the mass-to-charge ratio m/z of a peak derived from each of the ribosomal proteins L18, S9, L31, and S16, or the mass-to-charge ratio m/z of a peak derived from each of the ribosomal proteins L18, L15, and S9, or the mass-to-charge ratio m/z of a peak derived from each of the ribosomal proteins L24, L6, S11, and S9, whether or not Listeria monocytogenes is contained in the test microorganism is discriminated.
- Also, based on at least the mass-to-charge ratio m/z of a peak derived from the ribosomal protein S16 or the mass-to-charge ratio m/z of a peak derived from each of the ribosomal proteins L15 and L31, whether or not Listeria innocua is contained in the test microorganism is discriminated.
- Further, based on the mass-to-charge ratio m/z of a peak derived from the ribosomal proteins S9 and L31, whether or not Listeria ivanovii is contained in the test microorganism is discriminated.
- Further, based on at least the mass-to-charge ratio m/z of a peak derived from the ribosomal protein S11 or the mass-to-charge ratios m/z of a peak derived from each of the ribosomal proteins L18 and S9, whether or not Listeria welshimeri is contained in the test microorganism is discriminated.
- As described above, the above 8 ribosomal proteins can be used as marker proteins to discriminate the bacterial species of the genus Listeria alone or as a combination of a plurality of ribosomal proteins and therefore, the value of the mass-to-charge ratio is stored in the
second database 36 together with information about the bacterial species. - When discriminated that Listeria monocytogenes is contained in the test microorganism, based on the mass-to-charge ratio m/z of a peak derived from the ribosomal protein S9 and the mass-to-charge ratio m/z of a peak derived from at least one of the ribosomal proteins L24 and L6, the lineage of Listeria monocytogenes can be discriminated. Thus, the ribosomal proteins S9, L24, and L6 can also be used as marker proteins to discriminate Listeria monocytogenes lineage (Lineage), and the ribosomal proteins L24, L18, L15, S11, S9, and L31 can also be used as marker proteins to discriminate the serotype of Listeria monocytogenes. Therefore, the values of the mass-to-charge ratio of these ribosomal proteins are also stored in the
second database 36 as information about the marker proteins for discriminating the lineage and serotype of Listeria monocytogenes. - In addition, when discriminated that Listeria innocua is contained in the test microorganism, the strain of the innocua can be determined based on at least the mass-to-charge ratio m/z of a peak derived from the ribosomal protein L18.
- Therefore, the values of the mass-to-charge ratios of these ribosomal proteins L18, S16, and L31 are also stored in the
second database 36 as information about the marker proteins for discriminating the strain of Listeria innocua. - Further, based on at least the mass-to-charge ratio m/z of a peak derived from each of the ribosomal proteins L18, S9, and L31, or the mass-to-charge ratio m/z of a peak derived from each of the ribosomal proteins L15, S11, and L31, or the mass-to-charge ratio m/z of a peak derived from each of the ribosomal proteins L15, S9, and L31, or the mass-to-charge ratio m/z of a peak derived from each of the ribosomal proteins L18, S11, and L31, whether or not Listeria ivanovii londiniensis (L.ivanovii londiniensis) as a subspecies of Listeria ivanovii is contained in the test microorganism can be discriminated.
- Therefore, the values of the mass-to-charge ratios of the ribosomal proteins L18, S9, L31, L15, and S11 are also stored in the
second database 36 as information about the marker proteins for discriminating the subspecies of Listeria ivanovii. - The fact that the 8 ribosomal proteins described above can be used for discrimination of bacterial species of the genus Listeria, discrimination of lineage and serotype of Listeria monocytogenes, determination of strains of Listeria innocua and grouping of strains, and discrimination of subspecies of Listeria ivanovii and the like is derived from the result of determining the mass-to-charge ratios of 8 ribosomal proteins for each bacterial species or each strain of the genus Listeria and attributing the mass-to-charge ratios of 8 ribosomal proteins of each bacterial species or each strain. For example, with respect to Listeria innocua, ribosomal proteins useful for grouping the strains are selected by comparing the mass-to-charge ratios of 8 ribosomal proteins of Listeria innocua ATCC33090T (L. innocua ATCC33090T) as the type strain and the mass-to-charge ratios of 8 ribosomal proteins of Listeria innocua GTC02960 (L. innocua GTC02960), which is not the type strain (for details, refer to Examples to be described below,
Fig. 8 showing the theoretical mass values of 8 ribosomal proteins,Fig. 12A showing the attribution results based on actual measurement values of 8 ribosomal proteins, and the like)). - The value of the mass-to-charge ratio of the marker proteins stored in the
second database 36 is desirably selected by comparing the calculated mass obtained by translating the base sequence of each marker protein into an amino acid sequence with the mass-to-charge ratio detected by actual measurement. The base sequence of the marker protein may be, in addition to determining by sequencing, acquired from a public database, for example, a database or the like of National Center for Biotechnology Information (NCBI) and used. When calculating the calculated mass from the amino acid sequence, it is desirable to consider cleavage of the N-terminal methionine residue as a post-translational modification. More specifically, when the penultimate amino acid residue is Gly, Ala, Ser, Pro, Val, Thr, or Cys, the theoretical value is calculated assuming that the N-terminal methionine is cleaved. In addition, molecules added with protons are actually observed by MALDI-TOF MS and thus, it is desirable to determine the calculated mass by factoring in protons (that is, the theoretical value of the mass-to-charge ratio of ions obtained when each protein is analyzed by MALDI-TOF MS). - Note that a portion or all of the information about the marker proteins stored in the
second database 36 may also be stored in thefirst database 34. - The discrimination procedure of bacterial species of the genus Listeria using a microorganism discrimination system according to the present embodiment will be described with reference to the flowchart shown in
Fig. 2 . - First, the user prepares a sample containing constituent components of a test microorganism and sets the sample to the
mass spectrometry unit 10 to perform mass spectrometry. At this point, in addition to a cell extract or a cellular component such as a ribosomal protein purified from a cell extract, bacterial cells or a cell suspension may be used as it is. - The
spectrum creation program 32 acquires a detection signal obtained from thedetector 14 of themass spectrometry unit 10 via theinterface 25 and creates a mass spectrum of the test microorganism based on the detection signal (step S101). - Next, the genus/
species determination program 33 checks the mass spectrum of the test microorganism against a mass list of known microorganisms recorded in thefirst database 34 and extracts a mass list of known microorganisms having a mass-to-charge ratio pattern similar to the mass spectrum of the test microorganism, for example, a mass list including peaks that coincide with each peak in the mass spectrum of the test microorganism within a predetermined error range (step S102). Subsequently, the genus/species determination program 33 refers to the classification information stored in thefirst database 34 in association with the mass list extracted in step S102, thereby determining the classification (genus or species) of the known microorganism corresponding to the mass list (step S103). If the test microorganism is not bacteria belonging to the genus Listeria, or the test microorganism is a bacterium belonging to the genus Listeria and the bacterial species thereof is determined (No in step S104), the classification is output thedisplay unit 23 as a classification of the test microorganism (step S112) before the discrimination processing is terminated. On the other hand, if the species is a bacterium belonging to the genus Listeria and the bacterial species thereof is unknown (Yes in step S104), then the processing proceeds to the discrimination processing by thesubclass determination program 35. If it is determined in advance that the sample contains Listeria bacteria by other methods, the processing may proceed to thesubclass determination program 35 without using the genus/species determination program using a mass spectrum. - In the
subclass determination program 35, first thesubclass determination unit 39 reads the mass-to-charge ratio values of the 8 ribosomal proteins L24, L6, L18, L15, S11, S9+Ac, L31 type B, and S16 as marker proteins from the second database 36 (step S105). Subsequently, the spectrum acquisition unit 37 acquires the mass spectrum of the test microorganism created in step S101. Then, the m/z reading unit 38 selects peaks appearing in the mass-to-charge ratio range stored in thesecond database 36 in association with each of the marker proteins on the mass spectrum as peaks corresponding to each of the marker proteins and reads the mass-to-charge ratios thereof (step S106). Then, the cluster analysis is performed using the read mass-to-charge ratio as an index. More specifically, thesubclass determination unit 39 compares the mass-to-charge ratio with the value of the mass-to-charge ratio of each marker protein read out from thesecond database 36 and determines the attribution of the protein with respect to the read mass-to-charge ratio (Step S107). Then, the cluster analysis is performed based on the determined attribution to determine the species of the test microorganism (step S108), and the determined species is output to thedisplay unit 23 as the discrimination result of the test microorganisms (step S109). - In the foregoing, an embodiment to carry out the present invention has been described above with reference to the drawings, but the present invention is not limited to the above embodiment.
- For example, in the above embodiment, for convenience of description, to which species of the genus Listeria the test microorganism belongs is determined and then, the serotype and lineage of Listeria monocytogenes are discriminated, but the determination and the discrimination may be performed simultaneously. Also, the discrimination of serotypes and lineage of bacterial species of Listeria monocytogenes may be omitted.
- Hereinafter, an experiment conducted to demonstrate the selection procedure of marker proteins in the present invention and the effect of the present invention will be described.
- In order to construct a protein mass database, 14 strains of Listeria monocytogenes, two strains of Listeria innocua, two strains of Listeria ivanovii, three strains of Listeria seeligeri, one strain of each of Listeria welshimeri, Listeria grayi (L. grayi, and Listeria rocourtiae, and so 24 strains in total were used (
Fig. 3 ). These strains were obtained from National Bioresource Project (NBRP, Pathogenic Bacteria Department, Gifu University, Gifu city, Japan), American Type Culture Collection (ATCC, Rockville, Maryland, USA), Japan Collection of Microorganisms (JCM, RIKEN BioResource Center, Tsukuba City, Japan), National Institute of Technology and Evaluation, Biological Resource Center (NBRC, Kisarazu City, Japan). For the cultivation, a Brain Heart Infusion liquid medium (Nippon Becton Dickinson Company, Ltd., Tokyo, Japan) or an agar medium was used. In addition, the serotype of Listeria monocytogenes shown inFig. 3 was determined by the multiplex polymerase chain reaction (PCR) method (see Non Patent Literature 15) using the Listeria type immunity serum "Listeria Antisera" (DENKA SEIKEN Co., Ltd., Tokyo, Japan). - The DNA sequence of the ribosomal protein encoded into the S10-spc-alpha operon and the ribosomal protein genes of biomarker candidates was sequenced by DNA sequencing with a primer designed based on the consensus sequence upstream and downstream of the target region of a genome sequencing strain. More specifically, the genomes were extracted from various strains of the genus Listeria shown in
Fig. 3 by a conventional method, and the region of the ribosomal protein gene (up to 5 kbp) and the region of the biomarker proteins were amplified as a template thereof by the polymerase chain reaction (PCR) using KOD plus (Toyobo, Osaka, Japan) as high fidelity DNA polymerase. The obtained PCR product was purified and used as a template for DNA sequencing. DNA sequencing was performed using Big Dye ver. 3.1 Cycle Sequencing Kit (Applied Biosystems, Foster City, Calif.). The primers used for PCR and DNA sequencing are shown inFig. 4 . - Further, a mass-to-charge ratio of the ribosomal protein was calculated from the amino acid sequence obtained by translating the DNA base sequence of the ribosomal protein gene determined as described above and the mass of each amino acid shown in
Fig. 5 , and the mass-to-charge ratio was defined as the theoretical mass value. - Bacterial cells were recovered from the Brain Heart Infusion liquid medium or agar medium, and about 3 colonies of bacterial cells were suspended in 0.5 mL of 70% ethanol. The suspension was centrifuged at 10,000 rpm for 2 minutes, and the obtained bacterial cell pellet was dried in a vacuum drier for 5 minutes to evaporate the ethanol. 10 µL of 35% formic acid was added to the dried pellet and stirred, which was obtained as an analysis sample. 1.5 µL of the analysis sample was added to 10 µL of a sinapinic acid matrix agent (solution containing 20 mg/mL sinapinic acid (Wako Pure Chemical Corporation, Osaka, Japan) in a solution of 50v/v% acetonitrile and 1v/v% trifluoroacetic acid) and sufficiently mixed. Then, 1.5 µL of the mixed solution was dropped on a sample plate and allowed to air dry. For the MALDI-TOF MS measurement, an AXIMA microorganism identification system (Shimadzu Corporation, Kyoto City, Japan) was used and the sample was measured in the positive linear mode and in the spectral range of 2000 m/z to 35000 m/z. The theoretical mass value calculated by the above method was matched with the measured mass-to-charge ratio with a tolerance of 500 ppm and appropriately corrected. For the calibration of the AXIMA microorganism identification system, the Escherichia coli DH5α strain was used.
- With respect to the above 14 strains of Listeria monocytogenes, the theoretical mass value of the ribosomal protein described above was checked against the peak chart obtained by MALDI-TOF MS measurement and regarding the ribosomal proteins that could be actually detected, it was confirmed that there was no difference between the theoretical mass value and the actual measurement value. Next, the ribosomal proteins encoded into the S10-spc-alpha operon and other ribosomal proteins of the biomarker candidates were examined for the relationship between Listeria monocytogenes strain or serotype and the mass-to-charge ratio. The result is shown in
Fig. 6 . Because the acetyl group (COCH3) was found to be modified in the ribosomal protein S9, the mass value of (S9+Ac) to which the acetyl group was added to the mass value calculated from the DNA sequence of the gene was defined as the theoretical mass value. -
Fig. 6 shows the theoretical mass values (mass-to-charge ratios (m/z)) of ribosomal proteins encoded into the S10-spc-alpha operon and other ribosomal proteins of the biomarker candidates for 14 strains of Listeria monocytogenes.Serotypes 1/2b, 3b, 4b, 4d, and 4e are classified into Lineage I, serotypes 1/2a, 1/2c, 3a, and 3c are classified into Lineage II, andserotype 4a is classified into lineage III. In addition, ○, ×, and Δ shown inFig. 6 each indicate the results of peak processing under the default processing conditions (threshold offset: 0.015 mV, threshold response: 1.200) of the AXIMA microorganism identification system. That is, ○ indicates that the peak was detected within the tolerance of 500 ppm from the theoretical mass value, and × indicates that the peak was not detected in some cases. Also, Δ indicates that the peak was detected, but the difference from the theoretical mass value of other strains or other serotypes was small or the difference from the peak of other ribosomal proteins was within 500 ppm. - As can be seen from
Fig. 6 , the ribosomal proteins L3, L4, L23, L2, L24, L6, L18, S5, L15, S13, and S11 encoded into the S10-spc-alpha operon and the ribosomal proteins L10, L21, L13, and S9+Ac other than the operon, a total of 15, were found to have different theoretical mass values from other strains in some strains of Listeria monocytogenes used for the measurement. This suggested that these 15 ribosomal proteins are marker proteins that can be used to discriminate strains or serotypes of Listeria monocytogenes. The DNA base sequence in each strain of these 15 ribosomal proteins is shown in SEQ ID NO: 1 to 240 in the sequence listing. The outline of the sequence corresponding to each sequence number is as follows. - The DNA base sequences of 14 strains of Listeria monocytogenes (ATCC 15313T, JCM 2873, JCM 7671, JCM 7672, JCM 7673, JCM 7674, JCM 7675, JCM 7676, JCM 7677, JCM 7678, JCM 7680, JCM 7683, ATCC 51772, and ATCC 19115) and two strains of Listeria seeligeri (JCM 7679 and JCM 7682) are as follows.
- SEQ ID NOs: 1 to 16: DNA base sequence of L3 in the above 16 strains.
- SEQ ID NOs: 17 to 32: DNA base sequence of L4 in the above 16 strains.
- SEQ ID NOs: 33 to 48: DNA base sequence of L23 in the above 16 strains.
- SEQ ID NOs: 49 to 64: DNA base sequence of L2 in the above 16 strains.
- SEQ ID NOs: 65 to 80: DNA base sequence of L24 in the above 16 strains.
- SEQ ID NOs: 81 to 96: DNA sequence of L6 in the above 16 strains.
- SEQ ID NOs: 97 to 112: DNA nucleotide sequence of L18 in the above 16 strains.
- SEQ ID NOs: 113 to 128: the DNA nucleotide sequence of S5 in the above 16 strains.
- SEQ ID NOs: 129 to 144: DNA base sequence of L15 in the above 16 strains.
- SEQ ID NOs: 145 to 160: DNA base sequence of S13 in the above 16 strains.
- SEQ ID NOs: 161 to 176: DNA base sequence of S11 in the above 16 strains.
- SEQ ID NOs: 177 to 192: DNA base sequence of L10 in the above 16 strains.
- SEQ ID NOs: 193 to 208: DNA base sequence of L21 in the above 16 strains.
- SEQ ID NOs: 209 to 224: DNA nucleotide sequence of L13 in the above 16 strains.
- SEQ ID NOs: 225 to 240: DNA sequence of S9 in the above 16 strains.
- However, among the above 15 ribosomal proteins, L3, L4, L23, L2, L10, and L21 have one or more strains having a difference in theoretical mass value from other strains of 500 ppm or more and are considered as biomarker candidates to be used for discrimination of the strains, the peak shape was unclear or the peak intensity was insufficient and so it was not possible to detect the peak and therefore, these ribosomal proteins are considered to be inappropriate as stable biomarkers.
- In addition, though ribosomal proteins S5 and L13 were able to detect peaks in MALDI-TOF MS measurement, the difference in theoretical mass value from other strains was 500 ppm or less, which makes the ribosomal proteins inappropriate as biomarkers. Further, S13 (m/z 13578.69 or 13552.65) overlaps with the peak of another ribosomal protein L20 (m/z 13552.08) and both peaks cannot be distinguished so S13 is still inappropriate as a biomarker.
- On the other hand, 6 ribosomal proteins, L24, L6, L18, L15, S11, and S9+Ac, were detected in a stable manner regardless of the strain and the difference in theoretical mass value from other strains was 500 ppm or more and so were considered to be useful as biomarkers. Therefore, in the present embodiment, these 6 ribosomal proteins were used as biomarkers for discriminating the serotype or strain (or lineage) of Listeria monocytogenes in MALDI-TOF MS measurement.
- The 6 biomarkers L24, L6, L18, L15, S11, and S9+Ac, which have been shown to be useful for discriminating serotypes or strains of Listeria monocytogenes, were detected in a stable manner in all the strains of Listeria monocytogenes in MALDI-TOF MS measurement and thus, it was expected that the peaks of these proteins are likely to be detected in a stable manner in the same way even for samples of different species of the genus Listeria.
- Thus, with respect to 10 strains of 6 species of Listeria grayi, Listeria innocua, Listeria ivanovii, Listeria rocourtiae, Listeria seeligeri, and Listeria welshimeri that were available from public distributors of the genus Listeria, the theoretical mass values of the 6 marker proteins were calculated by the method described above. As a result of MALDI-TOF MS measurement on these 10 strains, the peaks of the above 6 proteins were detected in a stable manner. In addition to the above 6 biomarkers, it was found that the ribosomal proteins L31 type B and S16 detected as distinct mass peaks showed characteristic peak masses depending on the species of the genus Listeria. Therefore, these two ribosomal proteins are also considered to be biomarkers that can be used to discriminate species of the genus Listeria, and a table of theoretical mass values for discrimination of species of the genus Listeria with respect to 8 ribosomal proteins newly including L31 type B (m/z 9259.36, 9290.34, 9327.44, or 9271.3) and S16 (m/z 10234.94, 10252.97, 10230.88, or 10003.54), in addition to the above 6 ribosomal proteins (L24, L6, L18, L15, S11, and S9), was created (
Fig. 8 ). It is a matter of course that these 8 ribosomal proteins are biomarkers that can be used not only for discriminating species of the genus Listeria, but also for discriminating the serotype of Listeria monocytogenes. - The 56th amino acid of the ribosomal protein S11 of Listeria grayi has been specifically changed to lysine and further, in the result of MALDI-TOF MS measurement, the mass peak was observed at the position where the mass of the methyl group (CH3) was added. From the above, the theoretical mass value was calculated assuming that S11 of Listeria grayi was methylated. Also, since S11 of Listeria rocourtiae (L. rocourtiae was observed to have a peak at a position larger than the theoretical mass value by about 17 in m/z, 17 was added to the theoretical mass value. Further, with respect to S16, theoretical values were calculated from the sequence information of genome-sequenced strains, and it was confirmed that the theoretical values are not different from the measured values of the strains actually measured this time. In addition, two patterns of DNA sequences were registered in S16 of Listeria monocytogenes, but the amino acid sequences matched.
- The DNA base sequences of the above 8 ribosomal proteins determined in the above manner in 8 strains of 6 species are shown in SEQ ID NOs: 241 to 304 in the sequence listing. The outline of the sequence corresponding to each sequence number is as follows.
- SEQ ID NOs: 241 to 248: DNA bae sequence of L24, L6, L18, L15, S11, S9+Ac, L31 type B, and S16 in the
strain ATCC 33090T of Listeria innocua. Thestrain ATCC 33090T is the type strain (standard strain) of Listeria innocua. - SEQ ID NOs: 249 to 256: DNA base sequence of L24, L6, L18, L15, S11, S9+Ac, L31 type B, and S16 in the strain GTC02960 of Listeria innocua.
- SEQ ID NOs: 257 to 264: DNA base sequence of L24, L6, L18, L15, S11, S9+Ac, L31 type B, and S16 in the strain JCM7681 of Listeria ivanovii ivanovii.
- SEQ ID NOs: 265 to 272: DNA base sequence of L24, L6, L18, L15, S11, S9+Ac, L31 type B, and S16 in the strain ATCC44954 of Listeria ivanovii londiniensis.
- SEQ ID NOs: 273 to 280: DNA base sequence of L24, L6, L18, L15, S11, S9+Ac, L31 type B, and S16 in the strain ATCC35967T of Listeria seeligeri.
- SEQ ID NOs: 281 to 288: DNA base sequence of L24, L6, L18, L15, S11, S9+Ac, L31 type B, and S16 in the strain GTC02963 of Listeria welshimeri.
- SEQ ID NOs: 289 to 296: DNA base sequence of L24, L6, L18, L15, S11, S9+Ac, L31 type B, and S16 in the strain GTC16429T of Listeria rocourtiae.
- SEQ ID NOs: 297 to 304: DNA base sequence of L24, L6, L18, L15, S11, S9+Ac, L31 type B, and S16 in the strain ATCC19120T of Listeria grayi.
- The mass pattern of the protein was analyzed by the fingerprint method using SARAMIS (trademark, Spectral Archive and Microbial Identification System), and it was confirmed that all the strains were bacteria of the genus Listeria. Subsequently, profile data was created by evaluating those having the mass-to-charge ratio of the peak on the mass spectrum of each strain matching the mass-to-charge ratio of a biomarker protein without mutation as "1", those that did not match as "2" to "5" (2 to 5 indicate mutually different mass-to-charge ratios), and those in which no peak corresponding to the biomarker protein was present as "0". This data was imported into PAST software (Natural History Museum, University of Oslo, Norway) and cluster-analyzed by the proximity coupling method using the Kimura algorithm. In addition, a phylogenetic tree (
Fig. 13A ) was created using FigTree ver. 1.4.0 software. As a result, as is clear fromFig. 13A ,7 bacterial species of the genus Listeria were correctly classified and further, Listeria monocytogenes was correctly classified for each lineage. - By associating the mass-to-charge ratio of a peak obtained by MALDI-TOF MS measurement with the theoretical mass values of the above 6 ribosomal proteins, the attribution of the type of protein from which the peak was derived was analyzed to identify the strain of Listeria monocytogenes. For the analysis of attribution of protein types, software for discriminating bacteria was developed and used based on S10-GERMS (S10-spc-alpha operon Gene Encoded Ribosomal protein Mass Spectrum) method (see Patent Literature 3).
- First, the above software was activated to register the theoretical mass value for each strain of the 6 ribosomal proteins L24, L6, L18, L15, S11, and S9+Ac (the value of the mass-to-charge ratio of the ribosomal protein L24 (m/z 11180.22, 11194.25, 11254.35), the value of the mass-to-charge ratio of the ribosomal protein L6 (m/z 19270.08(19270.80), 19256.01), the value of the mass-to-charge ratio of the ribosomal protein L18 (m/z 13096.86, 13110.89), the value of the mass-to-charge ratio of the ribosomal protein L15 (m/z 15782.02, 15797.08), the value of the mass-to-charge ratio of the ribosomal protein S11 (m/z 13655.65, 13674.66), and the value of the mass-to-charge ratio of the ribosomal protein S9+Ac (m/z 14283.40, 14359.50, 14302.45)). Two theoretical mass values m/z 19270.08 and 19270.04 of L6 having a mass difference of 500 ppm or less were deemed not to be distinguishable from each other and so were registered as m/z 19270.08.
- Next, mass spectrum data obtained by MALDI-TOF MS measurement was analyzed for each strain to examine whether or not the peak corresponding to a biomarker was correctly attributed to the theoretical mass value of the registered biomarker. As a result, as shown in
Fig. 7A , for all strains, peaks corresponding to all biomarkers were attributed to the theoretical mass values of the registered biomarkers.Fig. 7B shows the relationship between the mass-to-charge ratios of the 6 ribosomal proteins and theattribution numbers 1 to 3 shown inFig. 7A . Attribution patterns were classified into groups A to D and checked against the serotypes of each strain and it turned out that strains of lineage II belong to group A, strains of lineage I belong to groups B, C, and strains of lineage III belong to group D. - From the above, it is verified that L24 (m/z 11180.22, 11194.25, 11254.35), L6 (m/z 19270.08, 19256.01), L18 (m/z 13096.86, 13110.89), L15 (m/z 15782.02, 15797.08, 15668.86), S11 (m/z 13655.65, 13674.66) and S9+Ac (m/z 14283.40, 14359.50, or 14302.45) are useful marker proteins for discrimination of the serotype and lineage of Listeria monocytogenes in MALDI-TOF MS measurement. In addition, accurate masses of these marker proteins were calculated from these genetic information and these marker proteins were also checked against actual measurement values and therefore, it became clear that a mass database with high reliability can be constructed.
- The species of the genus Listeria was discriminated using SARAMIS and the species of the genus Listeria was discriminated by cluster analysis using the theoretical mass values of 8 ribosomal proteins shown in
Fig. 8 as an index and the results were compared.Figs. 9A and 9B show charts obtained by MALDI-TOF MS measurements.Fig. 9A is a chart of bacterial species or strains of groups A to E, andFig. 9B is a chart of bacterial species or strains of groups F to M. When these charts were analyzed using SARAMIS, the discrimination result shown inFig. 10 was obtained. As can be seen fromFig. 10 , two strains of Listeria innocua, one strain of Listeria ivanovii, Listeria seeligeri ATCC 35967, and Listeria welshimeri were all discriminated as "Listeria sp." and their species could not be identified. The Listeria ivanovii JCM7681 strain and Listeria seeligeri JCM7679 and JCM7682 strains were misidentified as L. monocytogenes. For Listeria seeligeri JCM7679 and JCM7682 strains, a biochemical test and sequence analysis of 16S RNA were carried out so that Listeria seeligeri could be identified. Listeria rocourtiae was not identified as a species because the theoretical mass value corresponding to its mass peak was not stored in the database of SARAMIS. On the other hand, Listeria grayi was correctly identified up to the species level by SARAMIS. Because Listeria grayi is systematically distant from other Listeria bacteria, Listeria grayi is considered to have been identifiable by the existing fingerprint method. - Next, based on the database of theoretical mass values shown in
Fig. 8 , attempts were made to discriminate the species of the genus Listeria. For m/z 15797.08, 15797.03, and 15796.09 of L15 with a small difference in mass value, these mass-to-charge ratios are considered to be not discriminable by actual measurements and so were all attributed by regarding as having the theoretical mass value m/z 15797.08.Figs. 11A and11B are enlarged views of the biomarker peak portions of the charts ofFigs. 9A and 9B . As can be seen fromFigs. 11A and11B , the biomarker mass was shifted by the species of the genus Listeria and peaks could be distinguished. - When the actual measurement values of 8 ribosomal proteins were compared with the theoretical values and attributed, the results shown in
Fig. 12A were obtained.Fig. 12B is a table showing the correspondence relationship between the attribution number of the biomarker and the theoretical mass value inFig. 12A . Incidentally, thenumerals 1 to 5 shown on the charts inFigs. 11A and11B represent the attribution number of each biomarker. - As can be seen from
Figs. 8 and12A , for Listeria rocourtiae and Listeria grayi, a difference between the theoretical value and the actual measurement value was found in some ribosomal proteins, but for other bacterial species of the genus Listeria, a difference in mass value of the ribosomal proteins could be discriminated. - A dendrogram (lineage diagram) showing the attribution result using the 8 ribosomal proteins shown in
Fig. 12A and a dendrogram of the attribution result using five ribosomal proteins L24, S9, L6, L18, and S16 out of the 8 ribosomal proteins are shown inFigs. 13A and 13B . In both cases, it is clear that the species of the genus Listeria can be discriminated and the lineage of Listeria monocytogenes can be discriminated. From the above, it was found that the discrimination method of the genus Listeria using the ribosomal proteins found in the present embodiment as marker proteins is a very effective method. - In the above embodiment, the
second database 36 was caused to store the mass-to-charge ratios of 8 ribosomal proteins as marker proteins to discriminate which of the 7 bacterial species of the genus Listeria the test microorganism belongs to, but in the above embodiment, thesecond database 36 may also be caused to store the total of 17 ribosomal proteins, 15 ribosomal proteins (L3, L4, L23, L2, L24, L6, L18, S5, L15, S13, S11, L10, L21, L13, and S9) found in the process of constructing a protein mass database to discriminate Listeria monocytogenes and two ribosomal proteins (L31 (L31 type B), and S16) found in the process of constructing a protein mass database to discriminate the bacterial species other than Listeria monocytogenes, so that thesubclass determination program 35 uses at least one of 17 ribosomal proteins to discriminate which of the bacterial species of the genus Listeria the test microorganism belongs to. - Further, in the above embodiment, the lineage of Listeria monocytogenes is discriminated by cluster analysis, but the lineage may also be discriminated by comparing the actual measurement value of one or more ribosomal proteins with the theoretical mass value. For example, the lineage may be discriminated from actual measurement values of mass peaks corresponding to the ribosomal proteins L24, L6, and S9. In particular, the ribosomal proteins L24 and L6 are useful as marker proteins to distinguish between a lineage I and other lineages, because a unique mass shift was observed in the lineage I of Listeria monocytogenes.
- Further, distinct peaks could be detected in MALDI-TOF MS measurements of the ribosomal protein L18 and a unique mass shift was observed in Listeria seeligeri. Therefore, while not encompassed by the claims the ribosomal protein L18 may be used as a marker protein to discriminate Listeria seeligeri.
- Also, the ribosomal protein S16 having a mass-to-charge ratio characteristic of L. innocua and while not encompassed by the claims the ribosomal protein S9 capable of discriminating a strain of Listeria seeligeri are useful as biomarkers to discriminate species of the genus Listeria. In addition, the ribosomal proteins L18, L15 become useful marker proteins to discriminate subspecies of Listeria ivanovii, and the ribosomal protein S11 becomes a useful marker protein to discriminate Listeria welshimeri.
-
- 10
- Mass spectrometry unit
- 11
- Ionization unit
- 12
- TOF
- 13
- Extraction electrode
- 14
- Detector
- 20
- Microorganism determination unit
- 21
- CPU
- 22
- Memory
- 23
- Display unit
- 24
- Input unit
- 25
- I/F
- 30
- Storage unit
- 31
- OS
- 32
- Spectrum creation program
- 33
- Genus/species determination program
- 34
- First database
- 35
- Subclass determination program
- 36
- Second database
- 37
- Spectrum acquisition unit
- 38
- m/z reading unit
- 39
- Subclass determination unit
- 40
- Cluster analysis unit
- 41
- Dendrogram creation unit
-
- <110> Shimadzu Corporation
Meijo University
Aichi Science & Technology Foundation - <120> Discrimination method of microorganism
- <130> G116076WO
- <160> 304
- <170> PatentIn version 3.5
- <210> 1
<211> 630
<212> DNA
<213> Listeria monocytogenes - <400> 1

- <210> 2
<211> 630
<212> DNA
<213> Listeria monocytogenes - <400> 2

- <210> 3
<211> 630
<212> DNA
<213> Listeria monocytogenes - <400> 3

- <210> 4
<211> 630
<212> DNA
<213> Listeria monocytogenes - <400> 4

- <210> 5
<211> 630
<212> DNA
<213> Listeria monocytogenes - <400> 5

- <210> 6
<211> 630
<212> DNA
<213> Listeria monocytogenes - <400> 6

- <210> 7
<211> 630
<212> DNA
<213> Listeria monocytogenes - <400> 7

- <210> 8
<211> 630
<212> DNA
<213> Listeria monocytogenes - <400> 8

- <210> 9
<211> 630
<212> DNA
<213> Listeria monocytogenes - <400> 9

- <210> 10
<211> 630
<212> DNA
<213> Listeria monocytogenes - <400> 10
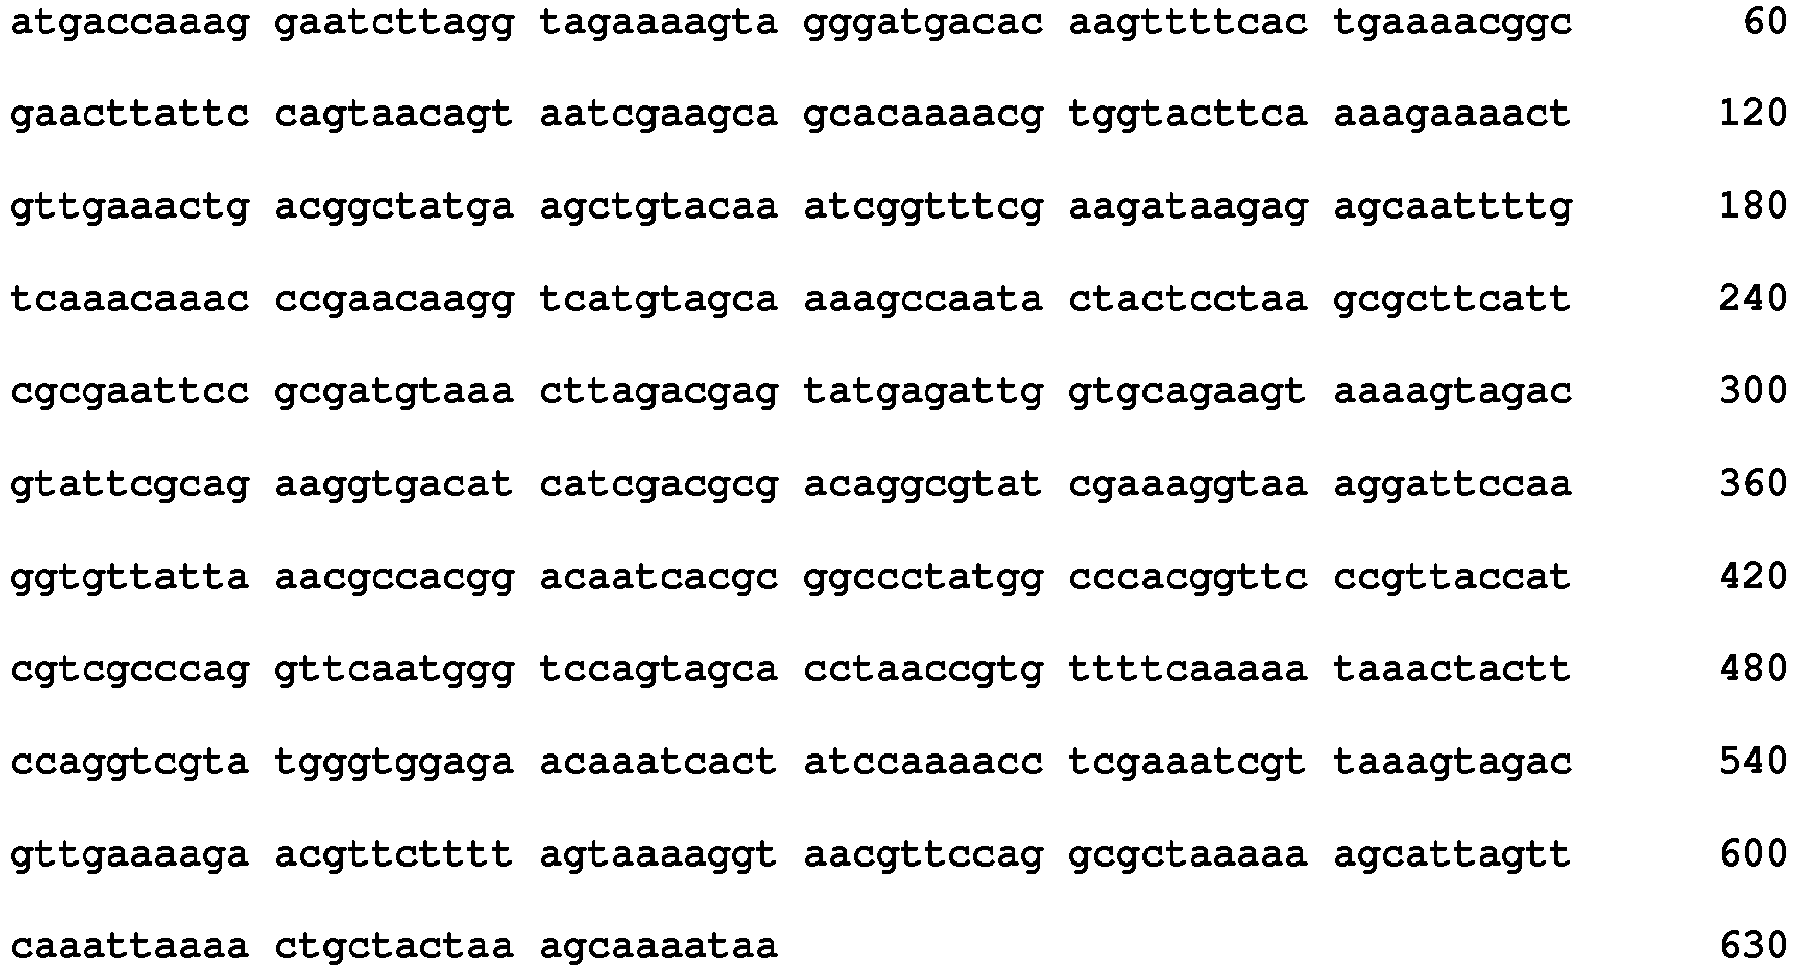
- <210> 11
<211> 630
<212> DNA
<213> Listeria monocytogenes - <400> 11

- <210> 12
<211> 630
<212> DNA
<213> Listeria monocytogenes - <400> 12

- <210> 13
<211> 630
<212> DNA
<213> Listeria monocytogenes - <400> 13

- <210> 14
<211> 630
<212> DNA
<213> Listeria monocytogenes - <400> 14

- <210> 15
<211> 630
<212> DNA
<213> Listeria monocytogenes - <400> 15

- <210> 16
<211> 630
<212> DNA
<213> Listeria monocytogenes - <400> 16
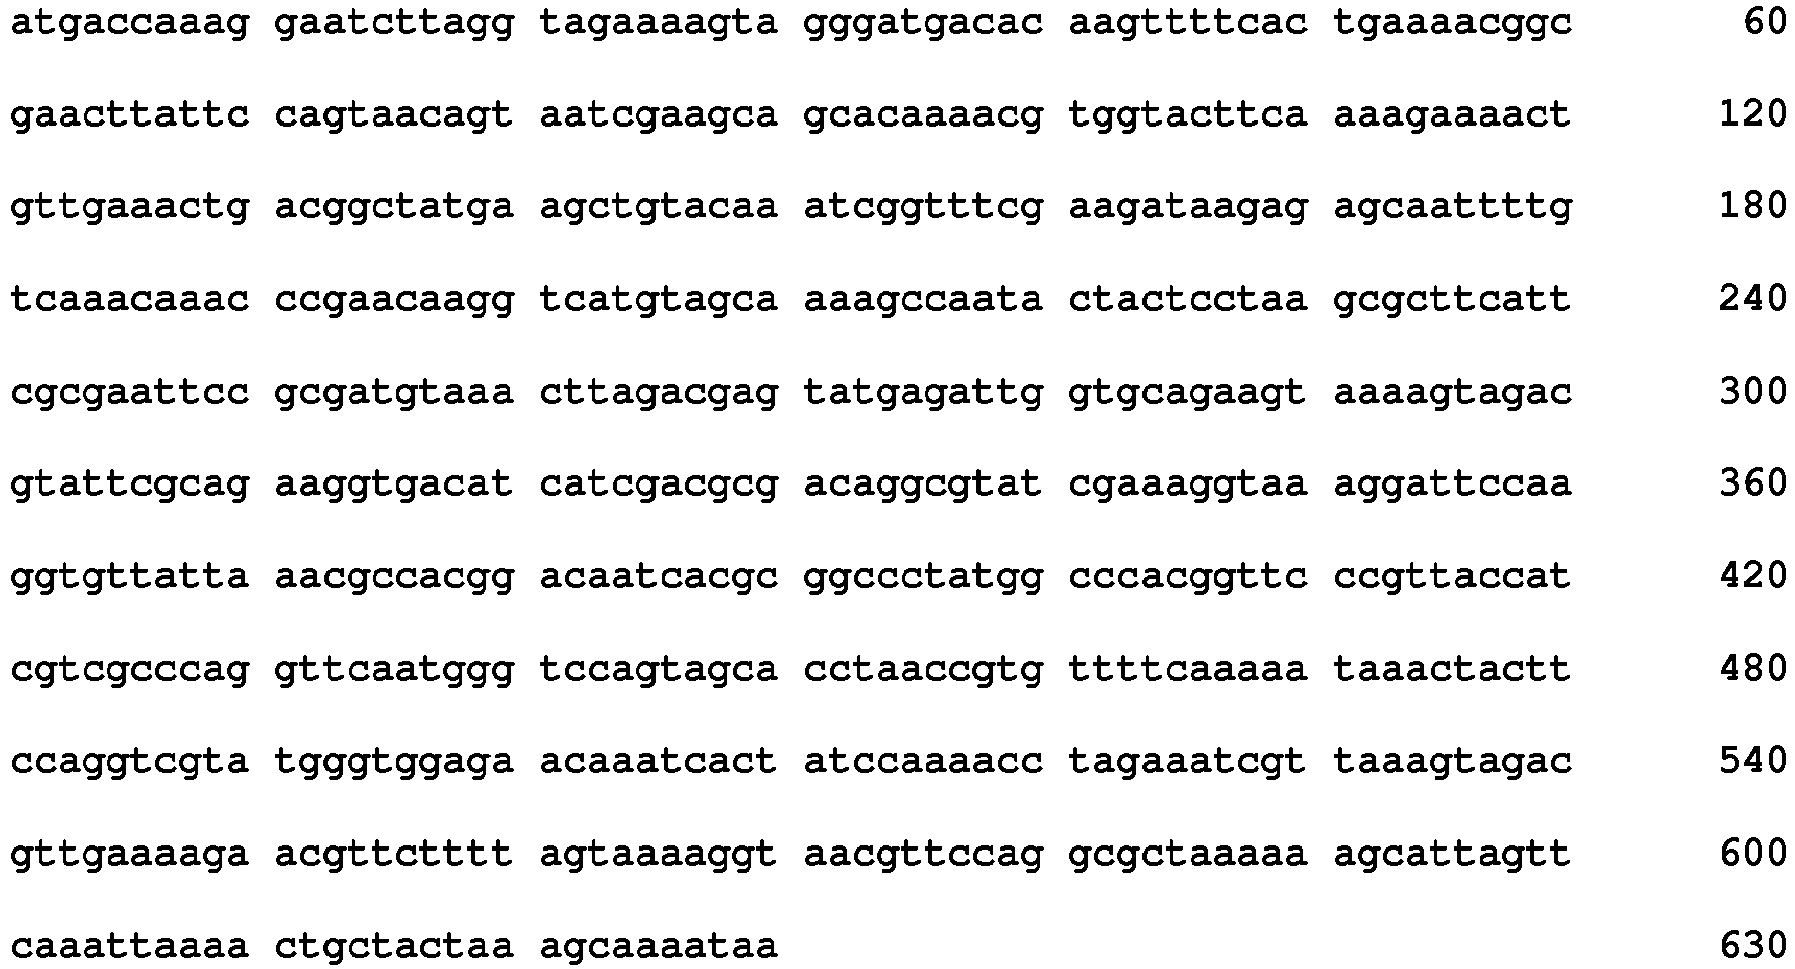
- <210> 17
<211> 624
<212> DNA
<213> Listeria monocytogenes - <400> 17
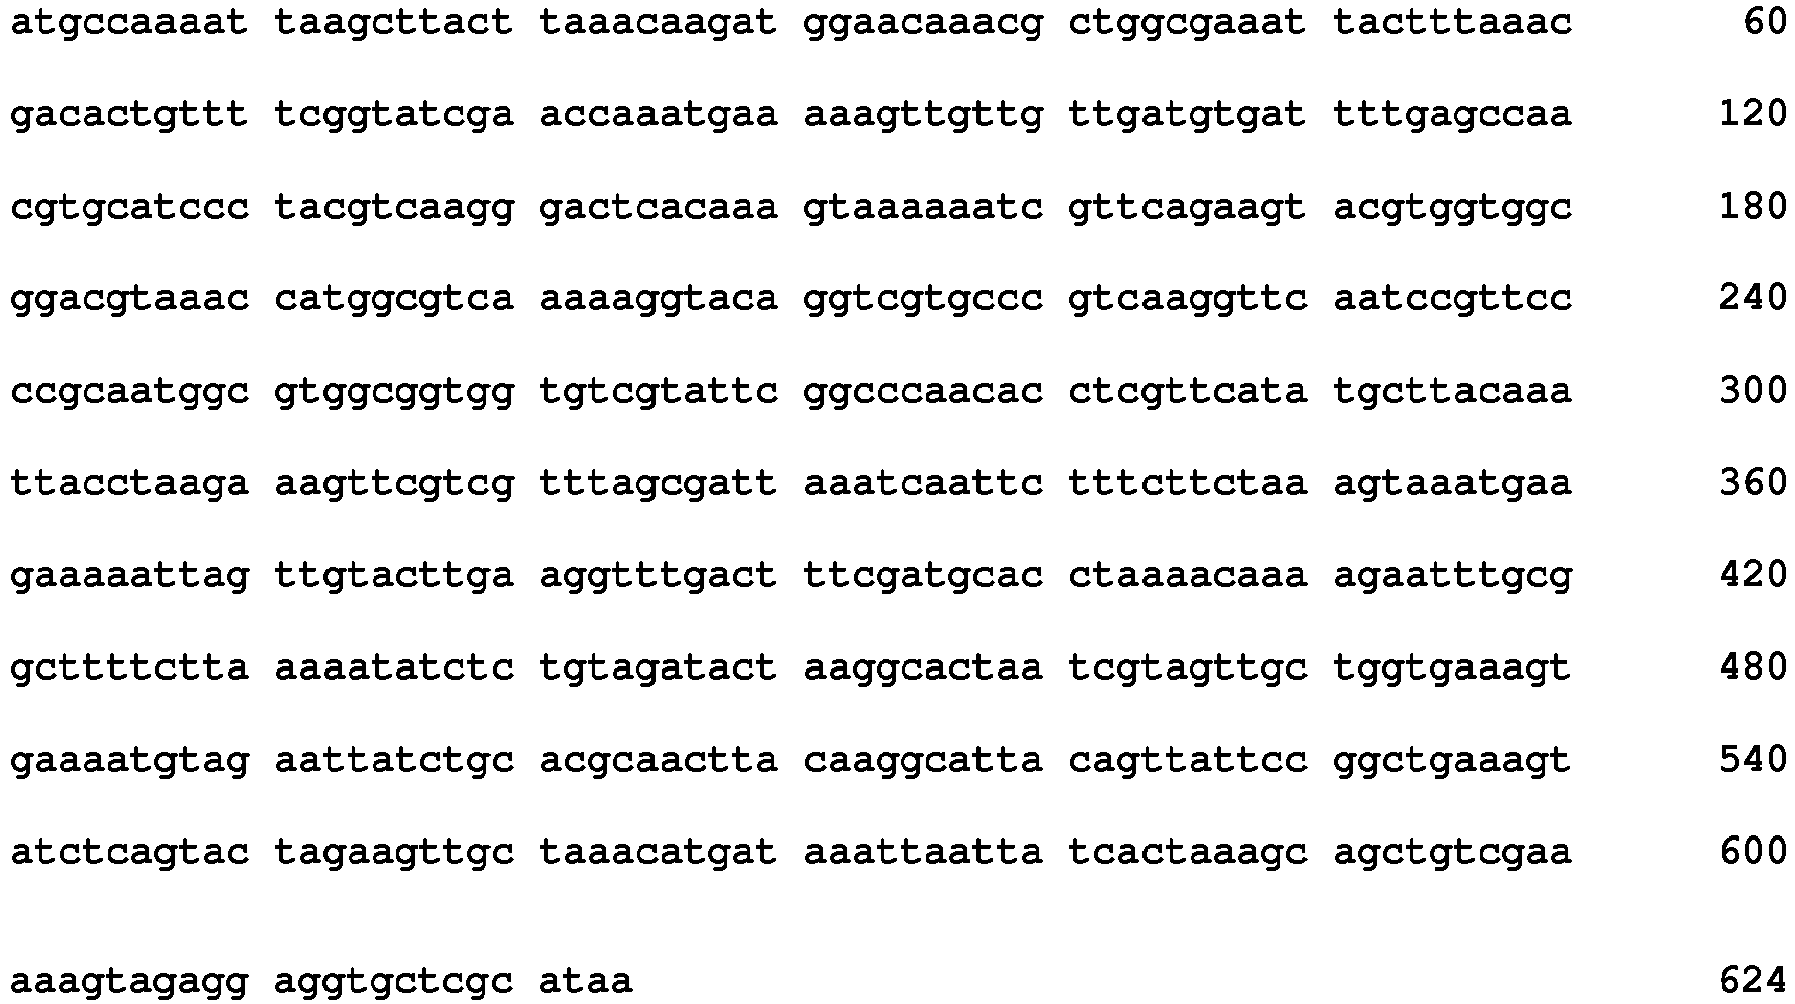
- <210> 18
<211> 624
<212> DNA
<213> Listeria monocytogenes - <400> 18

- <210> 19
<211> 624
<212> DNA
<213> Listeria monocytogenes - <400> 19

- <210> 20
<211> 624
<212> DNA
<213> Listeria monocytogenes - <400> 20

- <210> 21
<211> 624
<212> DNA
<213> Listeria monocytogenes - <400> 21

- <210> 22
<211> 624
<212> DNA
<213> Listeria monocytogenes - <400> 22

- <210> 23
<211> 624
<212> DNA
<213> Listeria monocytogenes - <400> 23

- <210> 24
<211> 624
<212> DNA
<213> Listeria monocytogenes - <400> 24

- <210> 25
<211> 624
<212> DNA
<213> Listeria monocytogenes - <400> 25
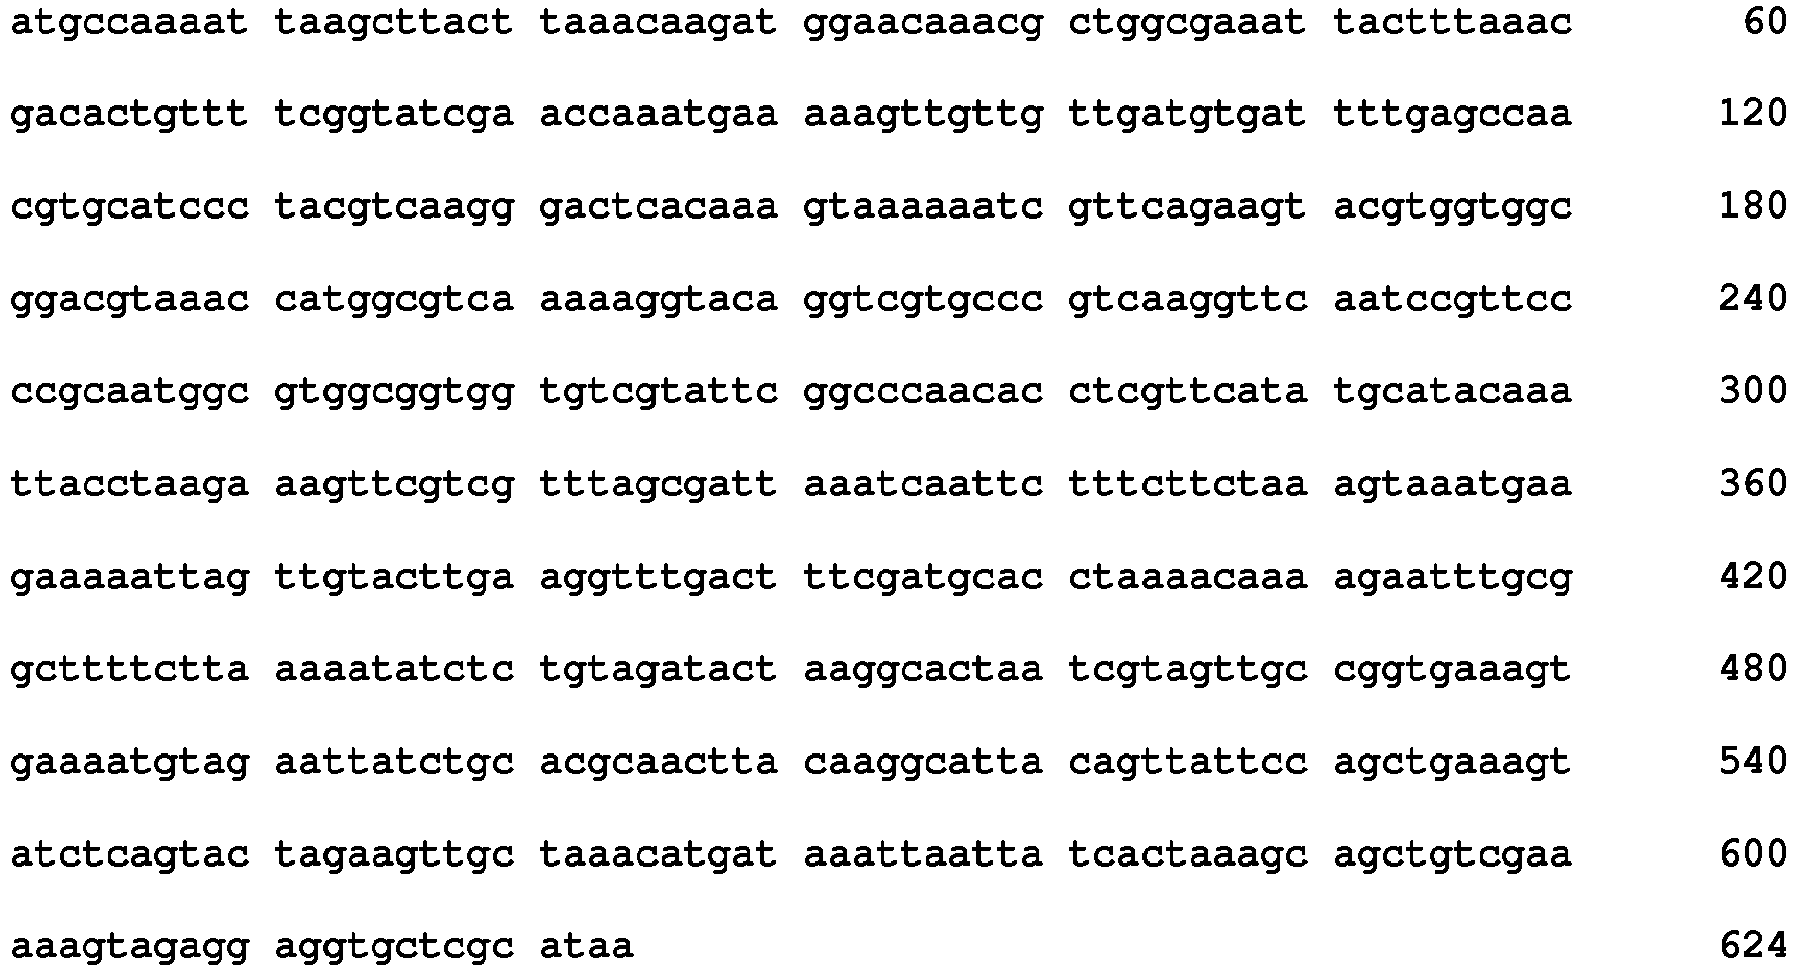
- <210> 26
<211> 624
<212> DNA
<213> Listeria monocytogenes - <400> 26

- <210> 27
<211> 624
<212> DNA
<213> Listeria monocytogenes - <400> 27

- <210> 28
<211> 624
<212> DNA
<213> Listeria monocytogenes - <400> 28

- <210> 29
<211> 624
<212> DNA
<213> Listeria monocytogenes - <400> 29

- <210> 30
<211> 624
<212> DNA
<213> Listeria monocytogenes - <400> 30

- <210> 31
<211> 624
<212> DNA
<213> Listeria monocytogenes - <400> 31
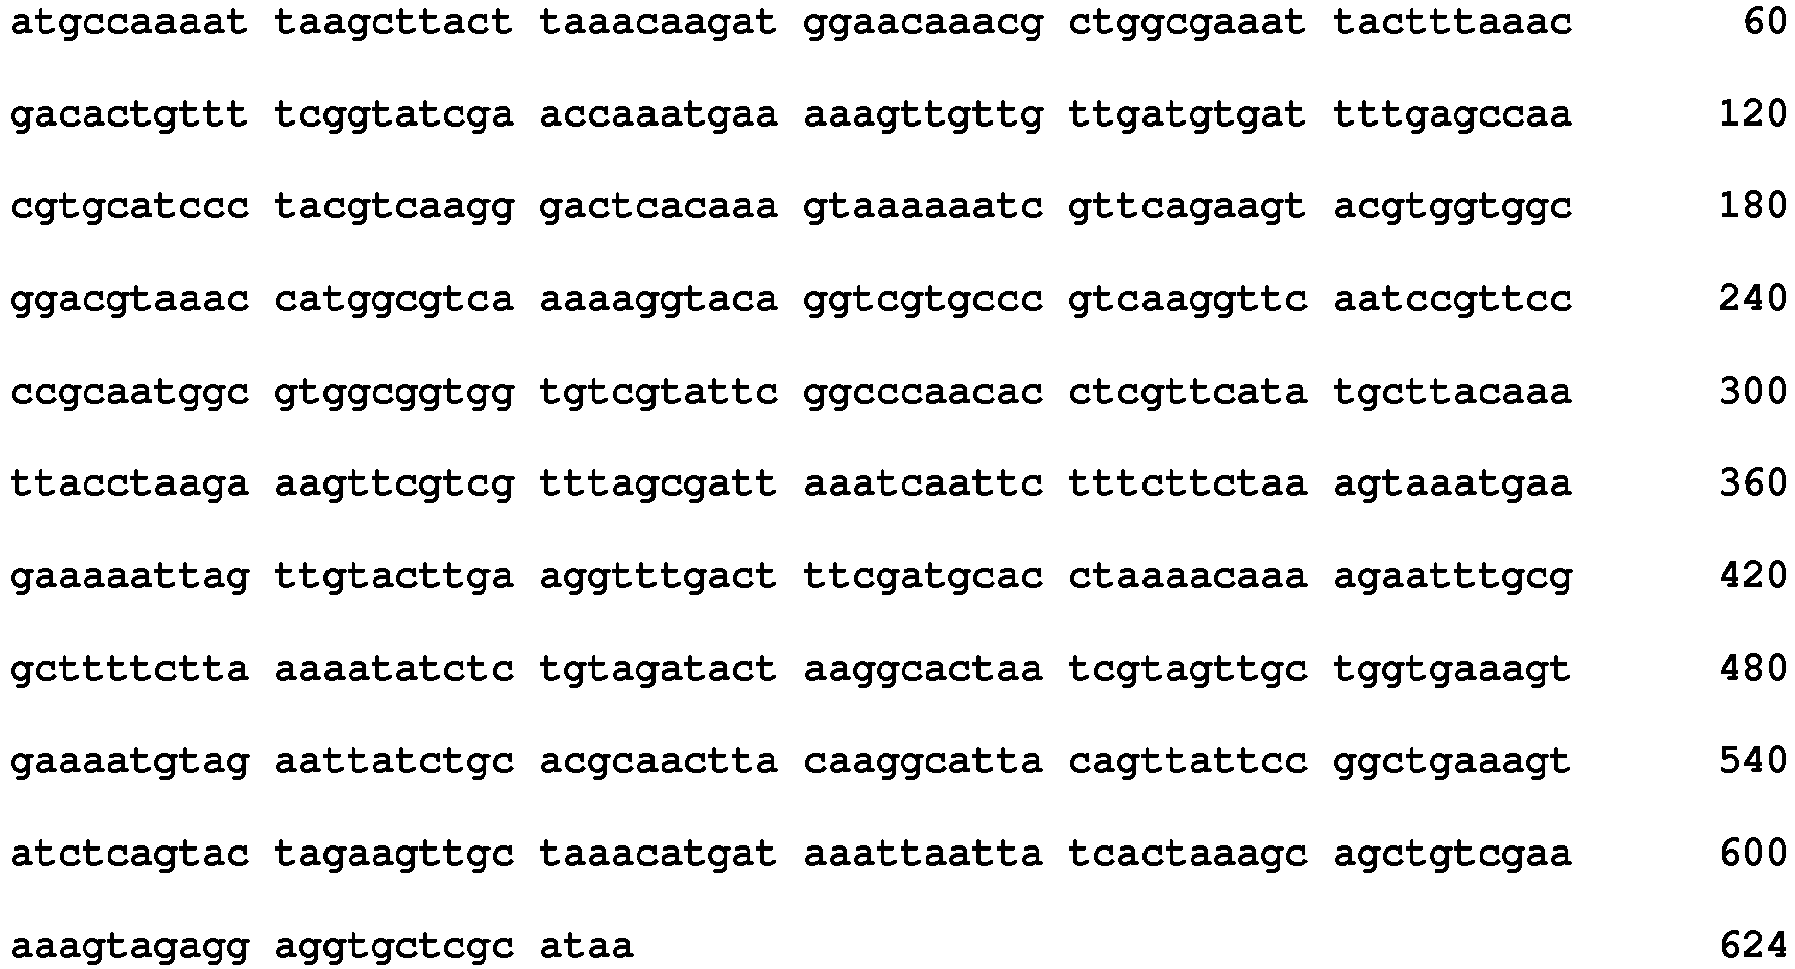
- <210> 32
<211> 624
<212> DNA
<213> Listeria monocytogenes - <400> 32

- <210> 33
<211> 285
<212> DNA
<213> Listeria monocytogenes - <400> 33

- <210> 34
<211> 285
<212> DNA
<213> Listeria monocytogenes - <400> 34

- <210> 35
<211> 285
<212> DNA
<213> Listeria monocytogenes - <400> 35

- <210> 36
<211> 285
<212> DNA
<213> Listeria monocytogenes - <400> 36

- <210> 37
<211> 285
<212> DNA
<213> Listeria monocytogenes - <400> 37

- <210> 38
<211> 285
<212> DNA
<213> Listeria monocytogenes - <400> 38

- <210> 39
<211> 285
<212> DNA
<213> Listeria monocytogenes - <400> 39

- <210> 40
<211> 285
<212> DNA
<213> Listeria monocytogenes - <400> 40

- <210> 41
<211> 285
<212> DNA
<213> Listeria monocytogenes - <400> 41

- <210> 42
<211> 285
<212> DNA
<213> Listeria monocytogenes - <400> 42

- <210> 43
<211> 285
<212> DNA
<213> Listeria monocytogenes - <400> 43

- <210> 44
<211> 285
<212> DNA
<213> Listeria monocytogenes - <400> 44

- <210> 45
<211> 285
<212> DNA
<213> Listeria monocytogenes - <400> 45
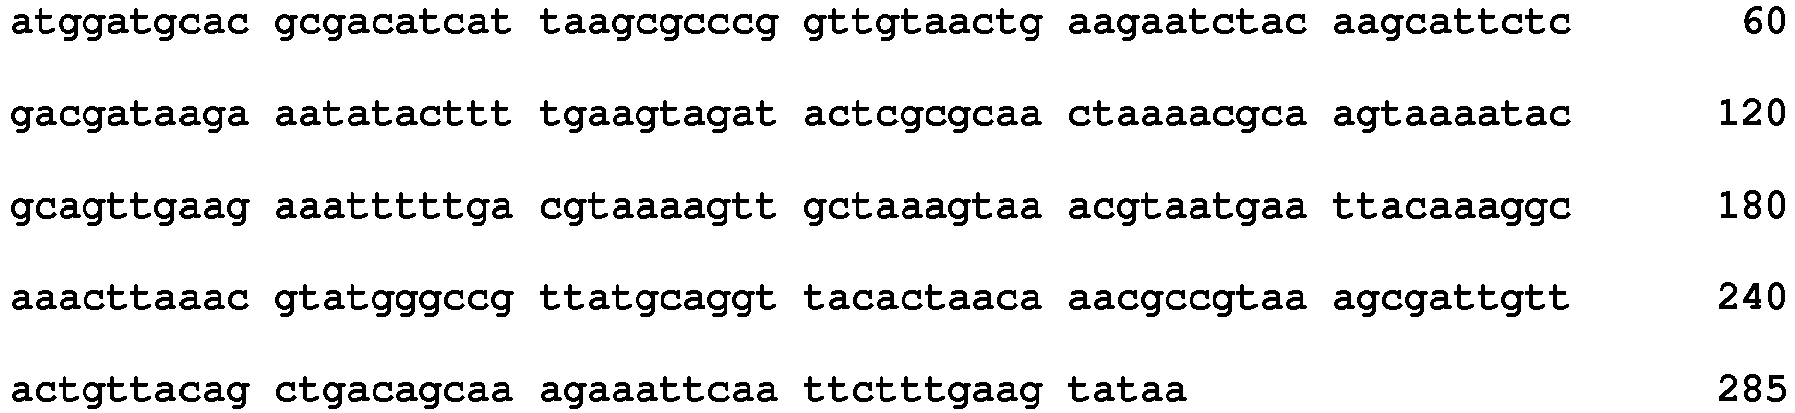
- <210> 46
<211> 285
<212> DNA
<213> Listeria monocytogenes - <400> 46
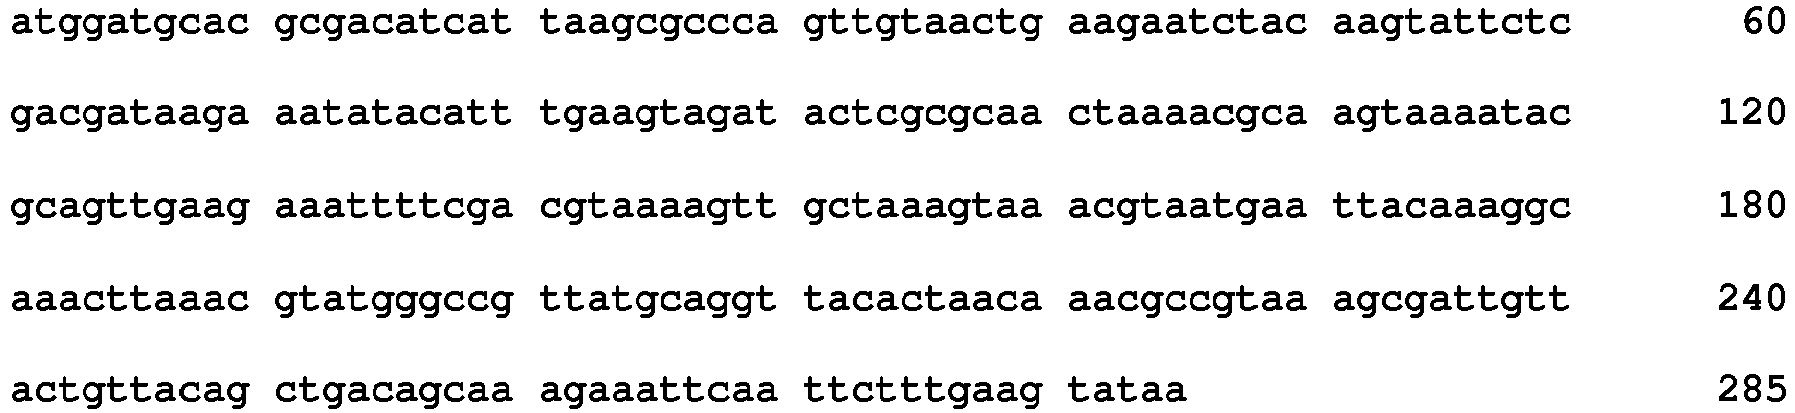
- <210> 47
<211> 285
<212> DNA
<213> Listeria monocytogenes - <400> 47

- <210> 48
<211> 285
<212> DNA
<213> Listeria monocytogenes - <400> 48

- <210> 49
<211> 834
<212> DNA
<213> Listeria monocytogenes - <400> 49

- <210> 50
<211> 834
<212> DNA
<213> Listeria monocytogenes - <400> 50
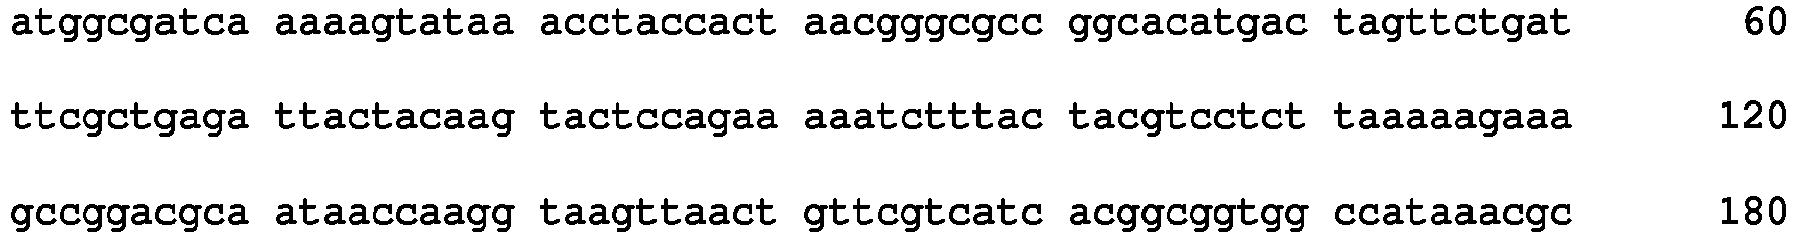

- <210> 51
<211> 834
<212> DNA
<213> Listeria monocytogenes - <400> 51

- <210> 52
<211> 834
<212> DNA
<213> Listeria monocytogenes - <400> 52
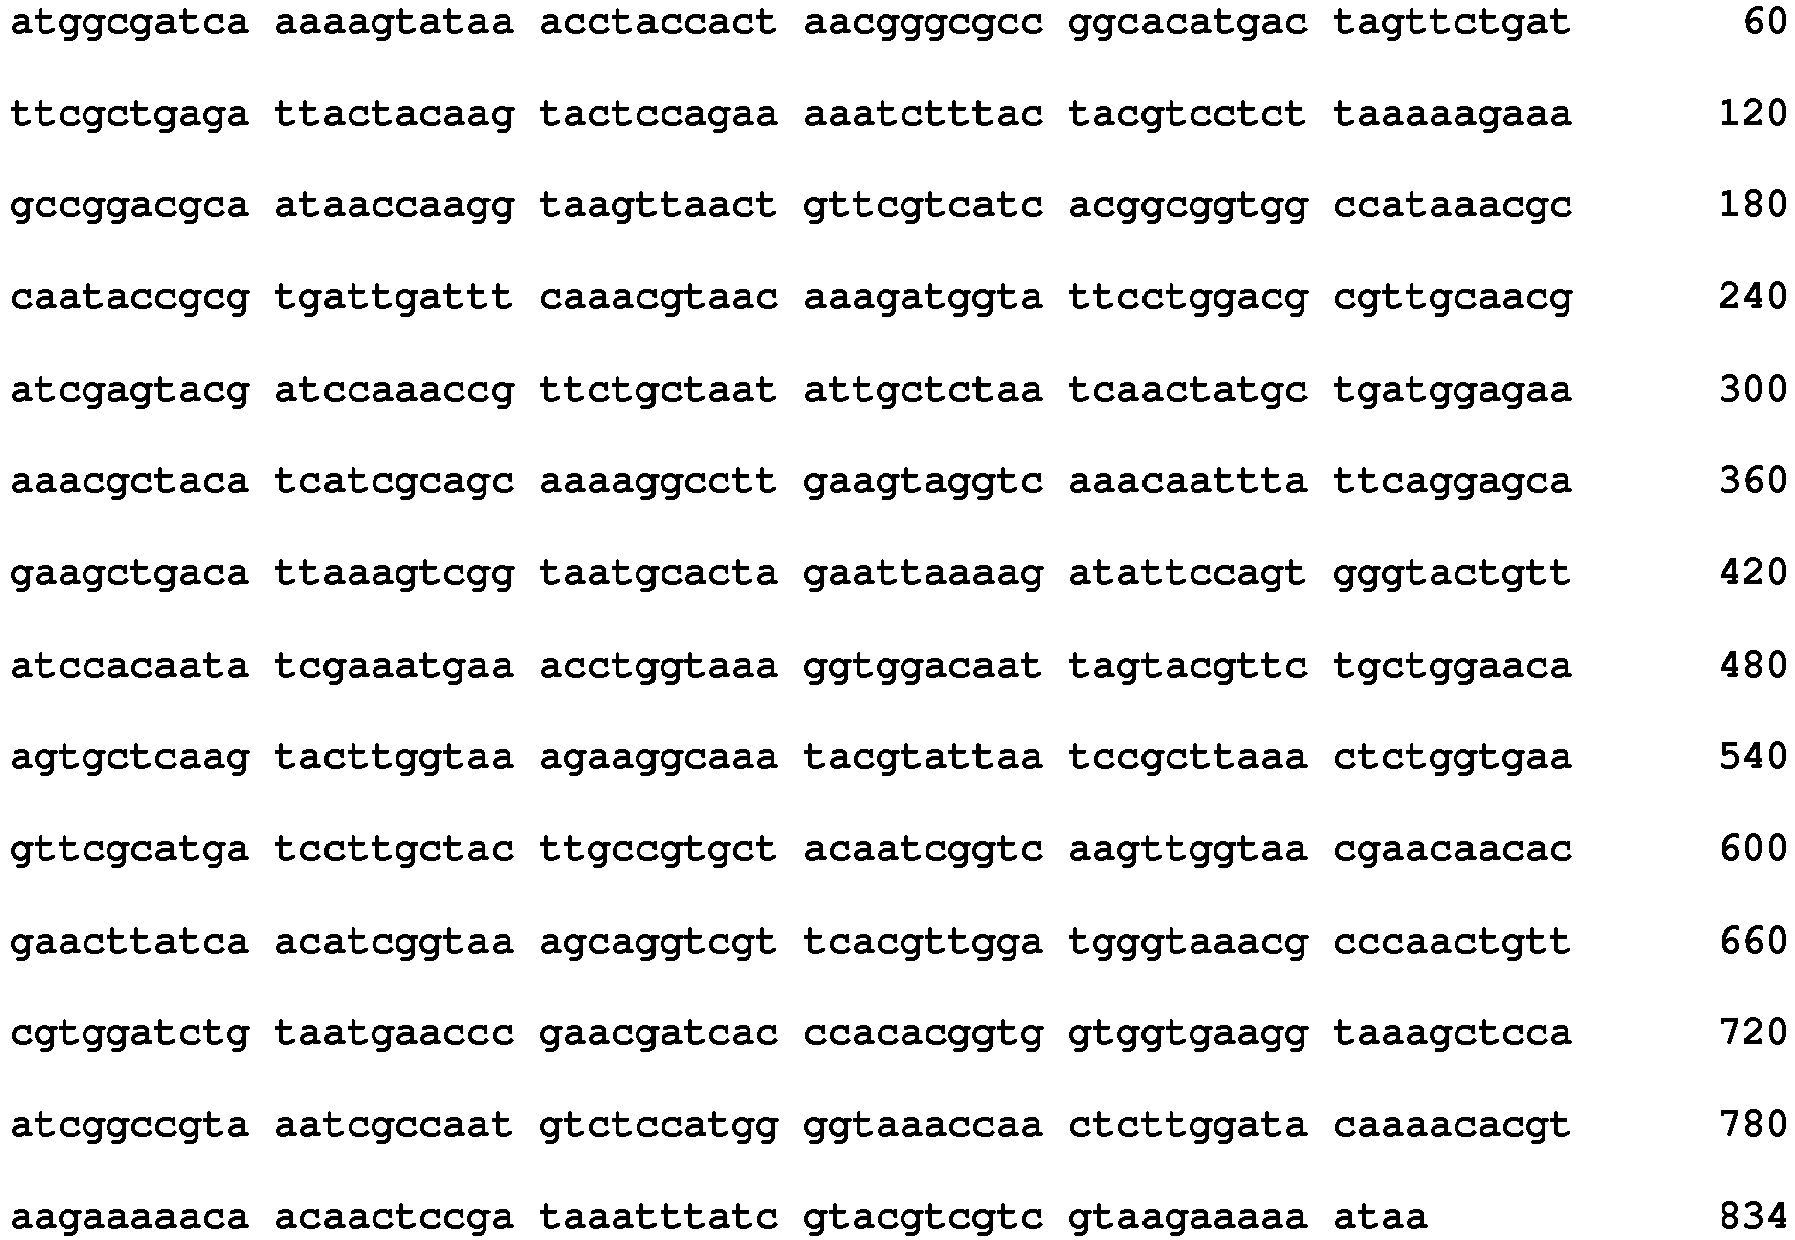
- <210> 53
<211> 834
<212> DNA
<213> Listeria monocytogenes - <400> 53
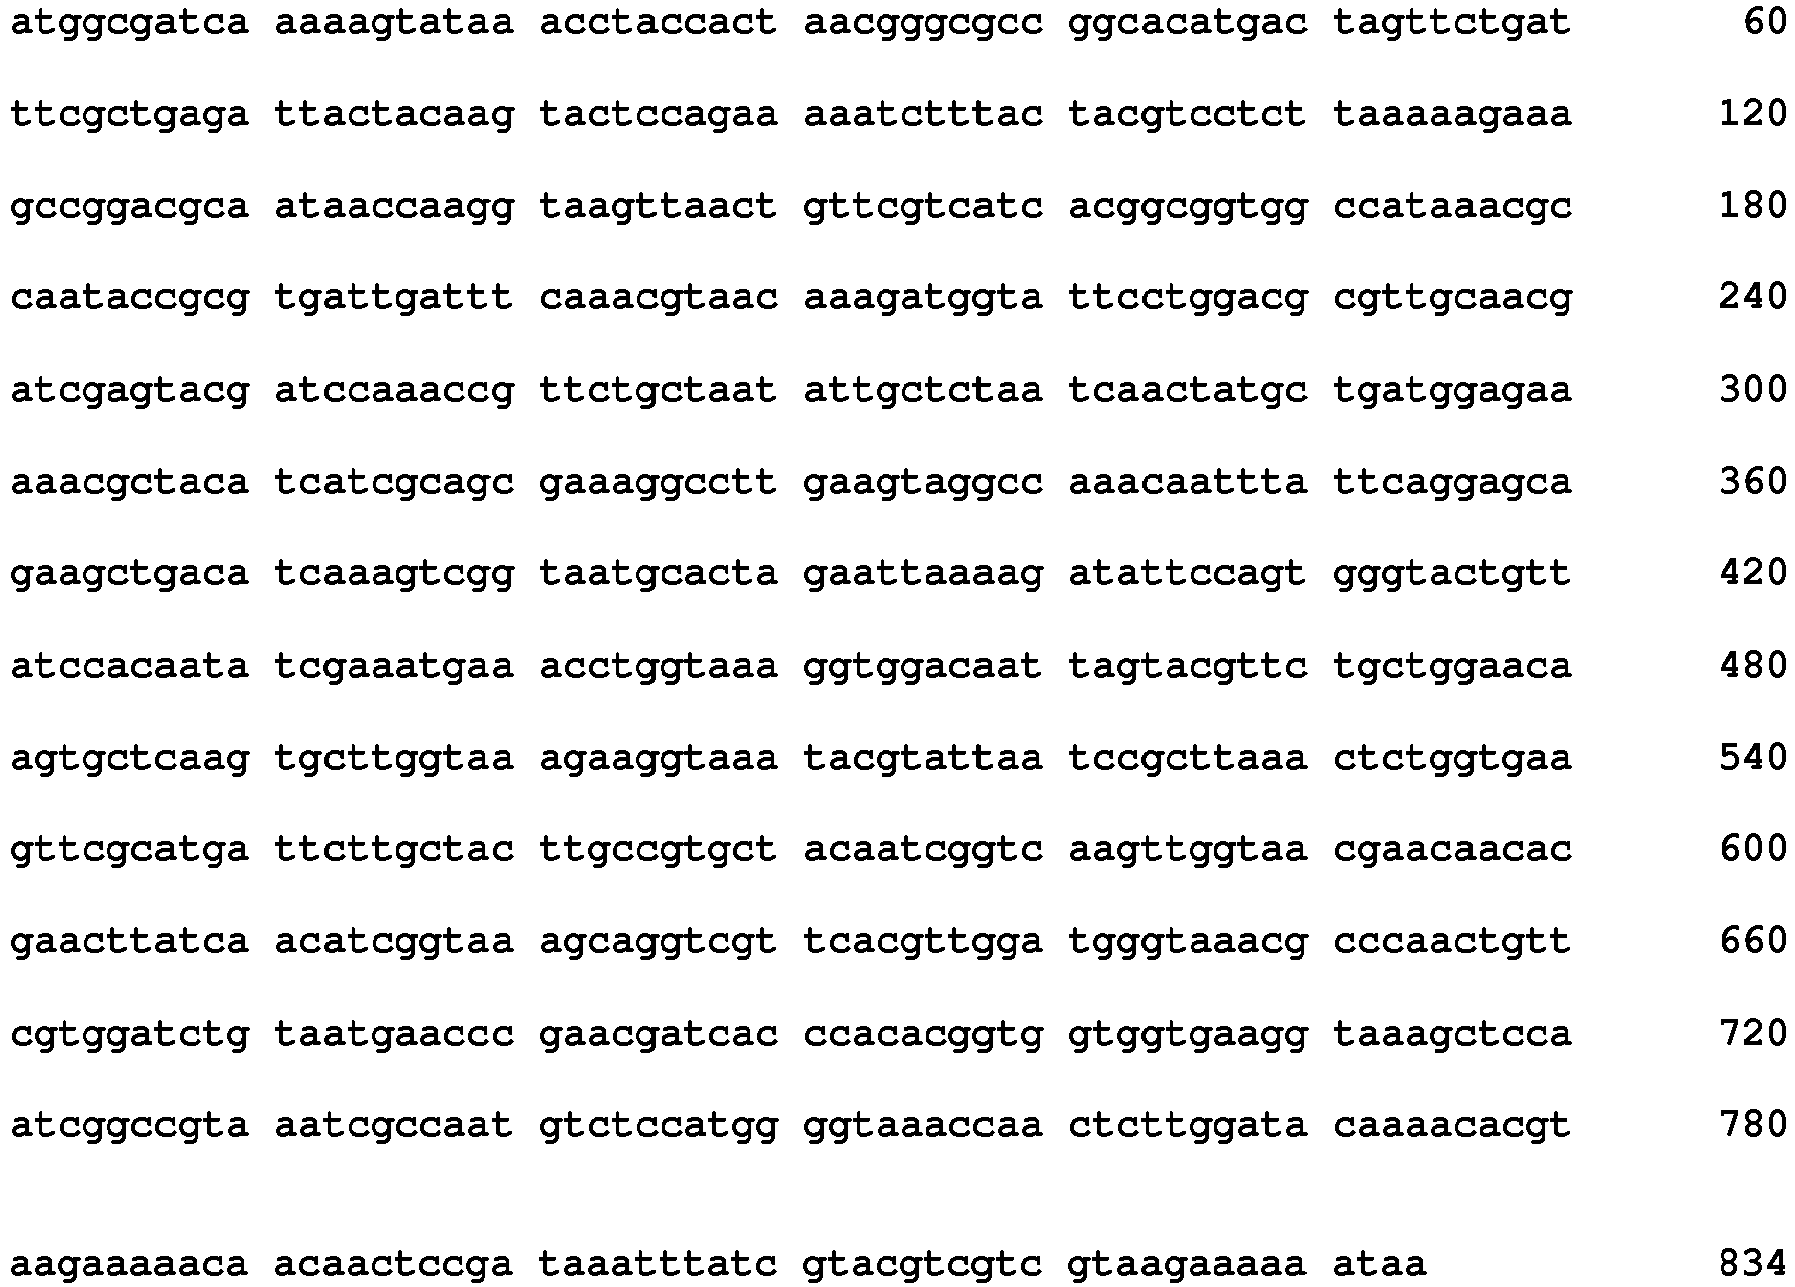
- <210> 54
<211> 834
<212> DNA
<213> Listeria monocytogenes - <400> 54

- <210> 55
<211> 834
<212> DNA
<213> Listeria monocytogenes - <400> 55

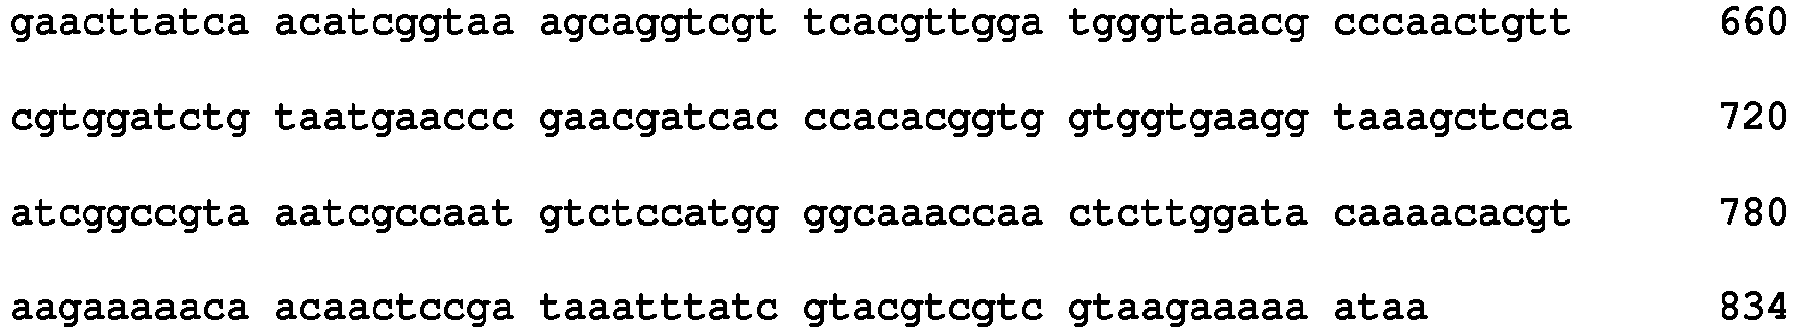
- <210> 56
<211> 834
<212> DNA
<213> Listeria monocytogenes - <400> 56

- <210> 57
<211> 834
<212> DNA
<213> Listeria monocytogenes - <400> 57

- <210> 58
<211> 834
<212> DNA
<213> Listeria monocytogenes - <400> 58
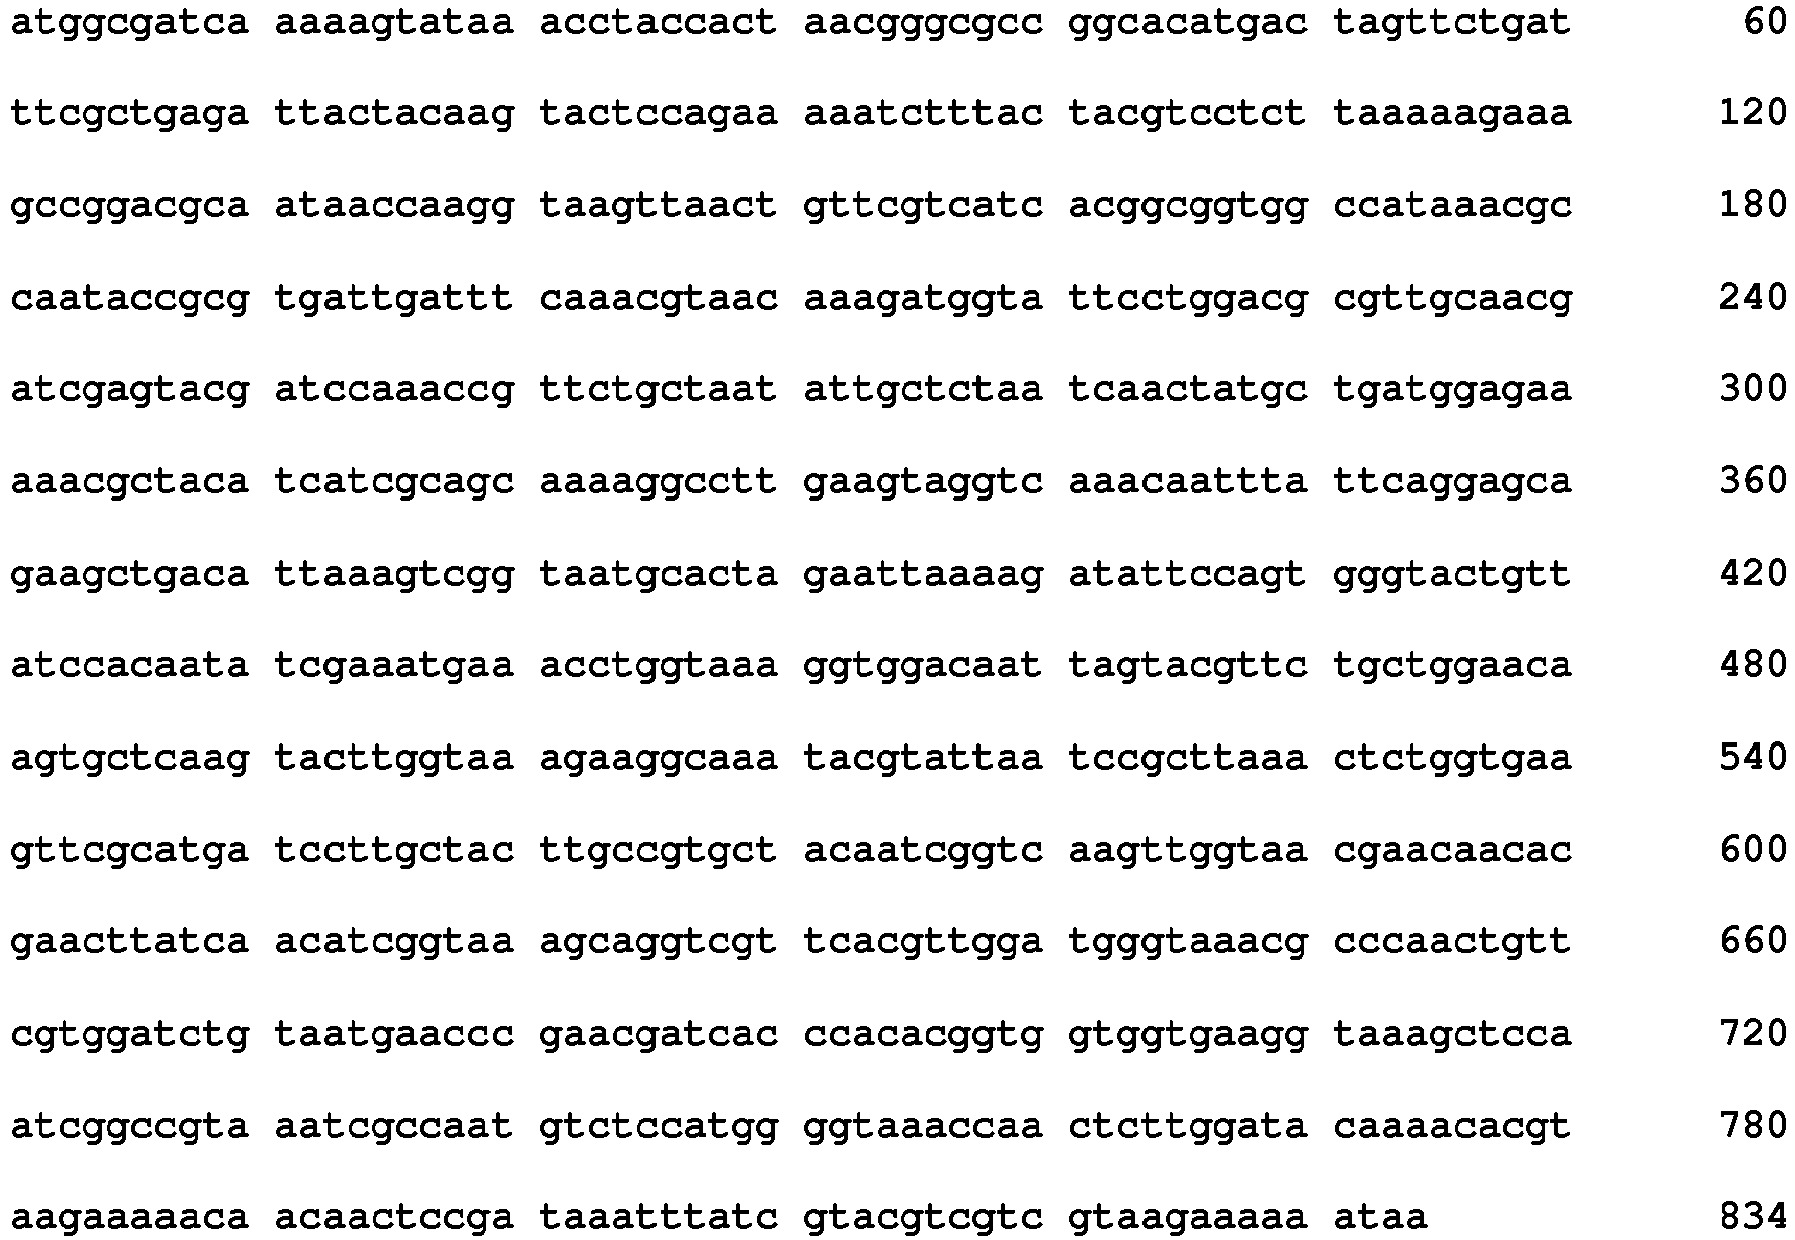
- <210> 59
<211> 834
<212> DNA
<213> Listeria monocytogenes - <400> 59

- <210> 60
<211> 834
<212> DNA
<213> Listeria monocytogenes - <400> 60

- <210> 61
<211> 834
<212> DNA
<213> Listeria monocytogenes - <400> 61
- <210> 62
<211> 834
<212> DNA
<213> Listeria monocytogenes - <400> 62

- <210> 63
<211> 834
<212> DNA
<213> Listeria monocytogenes - <400> 63

- <210> 64
<211> 834
<212> DNA
<213> Listeria monocytogenes - <400> 64

- <210> 65
<211> 312
<212> DNA
<213> Listeria monocytogenes - <400> 65
- <210> 66
<211> 312
<212> DNA
<213> Listeria monocytogenes - <400> 66

- <210> 67
<211> 312
<212> DNA
<213> Listeria monocytogenes - <400> 67

- <210> 68
<211> 312
<212> DNA
<213> Listeria monocytogenes - <400> 68

- <210> 69
<211> 312
<212> DNA
<213> Listeria monocytogenes - <400> 69

- <210> 70
<211> 312
<212> DNA
<213> Listeria monocytogenes - <400> 70

- <210> 71
<211> 312
<212> DNA
<213> Listeria monocytogenes - <400> 71
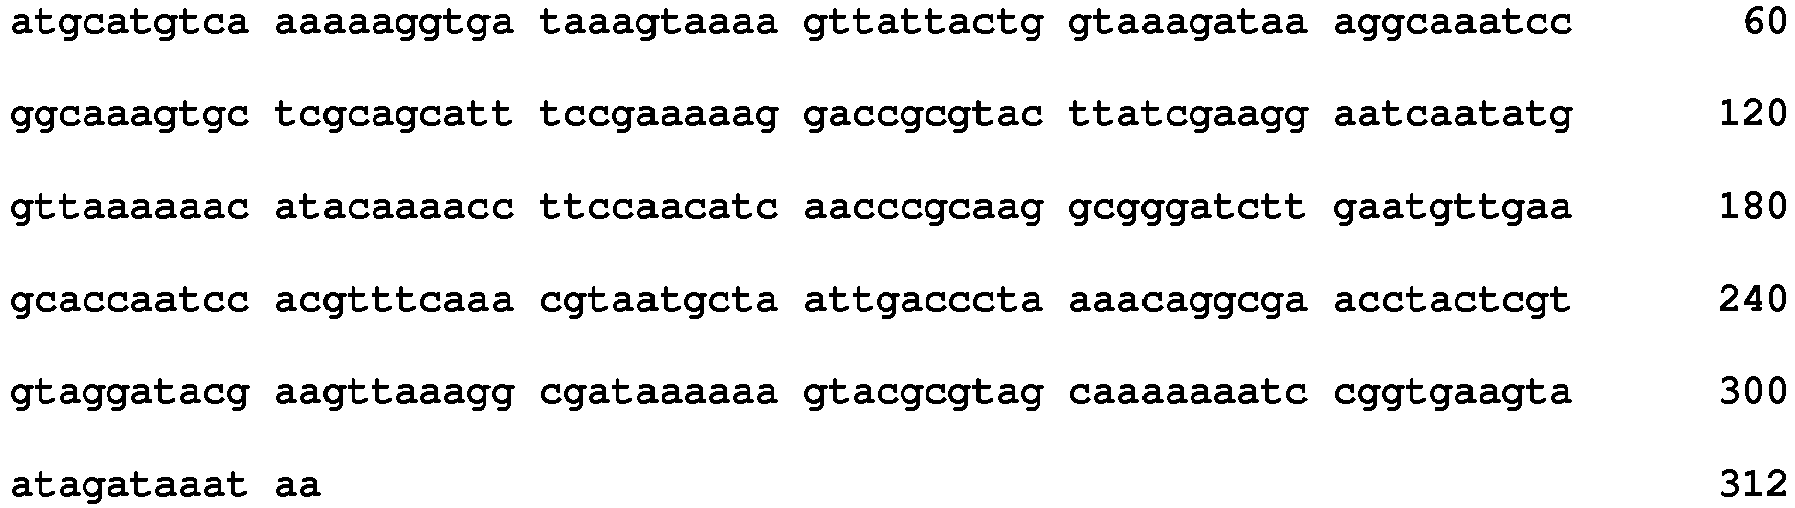
- <210> 72
<211> 312
<212> DNA
<213> Listeria monocytogenes - <400> 72

- <210> 73
<211> 312
<212> DNA
<213> Listeria monocytogenes - <400> 73

- <210> 74
<211> 312
<212> DNA
<213> Listeria monocytogenes - <400> 74

- <210> 75
<211> 312
<212> DNA
<213> Listeria monocytogenes - <400> 75

- <210> 76
<211> 312
<212> DNA
<213> Listeria monocytogenes - <400> 76

- <210> 77
<211> 312
<212> DNA
<213> Listeria monocytogenes - <400> 77
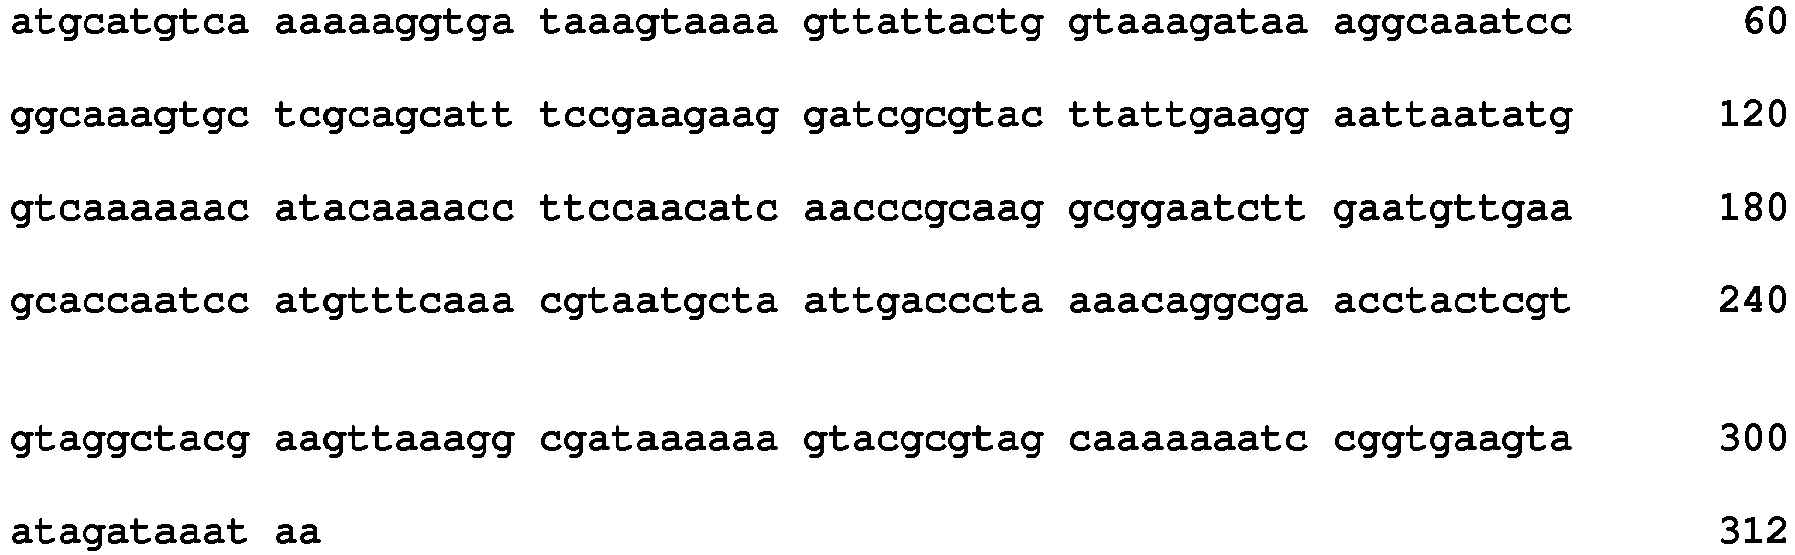
- <210> 78
<211> 312
<212> DNA
<213> Listeria monocytogenes - <400> 78
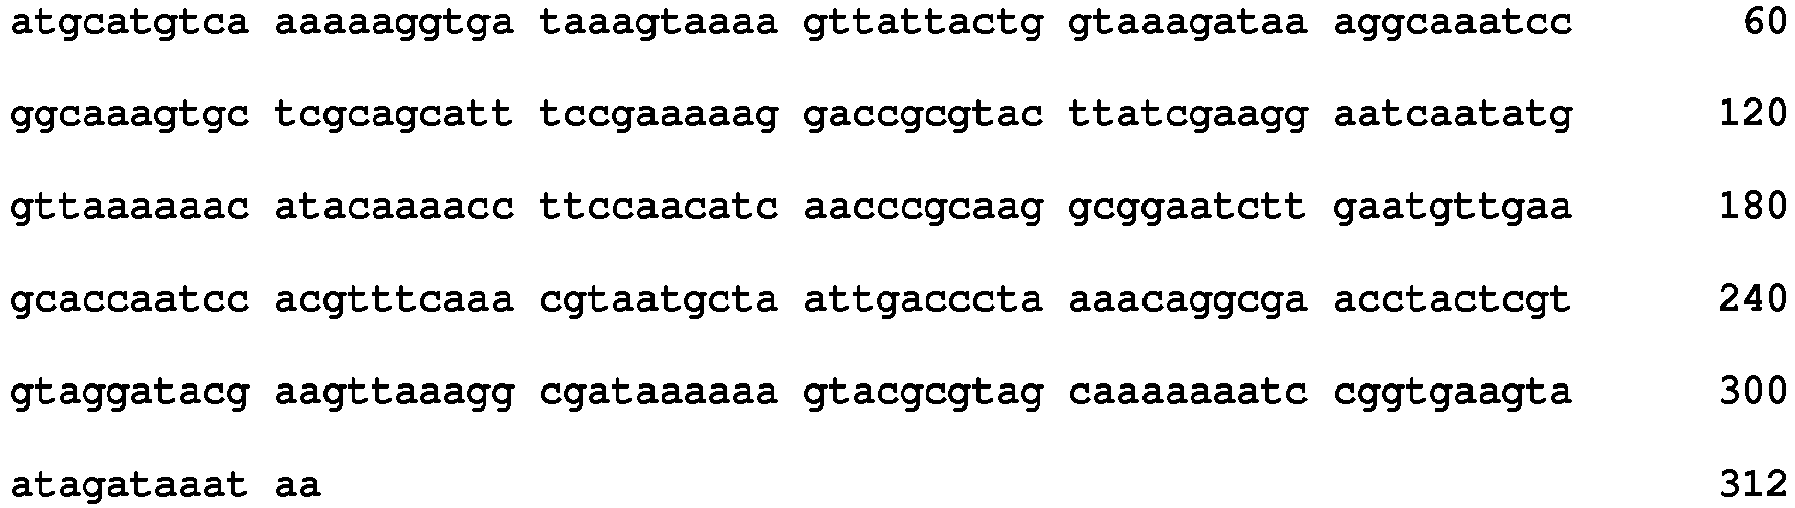
- <210> 79
<211> 312
<212> DNA
<213> Listeria monocytogenes - <400> 79

- <210> 80
<211> 312
<212> DNA
<213> Listeria monocytogenes - <400> 80

- <210> 81
<211> 537
<212> DNA
<213> Listeria monocytogenes - <400> 81

- <210> 82
<211> 537
<212> DNA
<213> Listeria monocytogenes - <400> 82

- <210> 83
<211> 537
<212> DNA
<213> Listeria monocytogenes - <400> 83
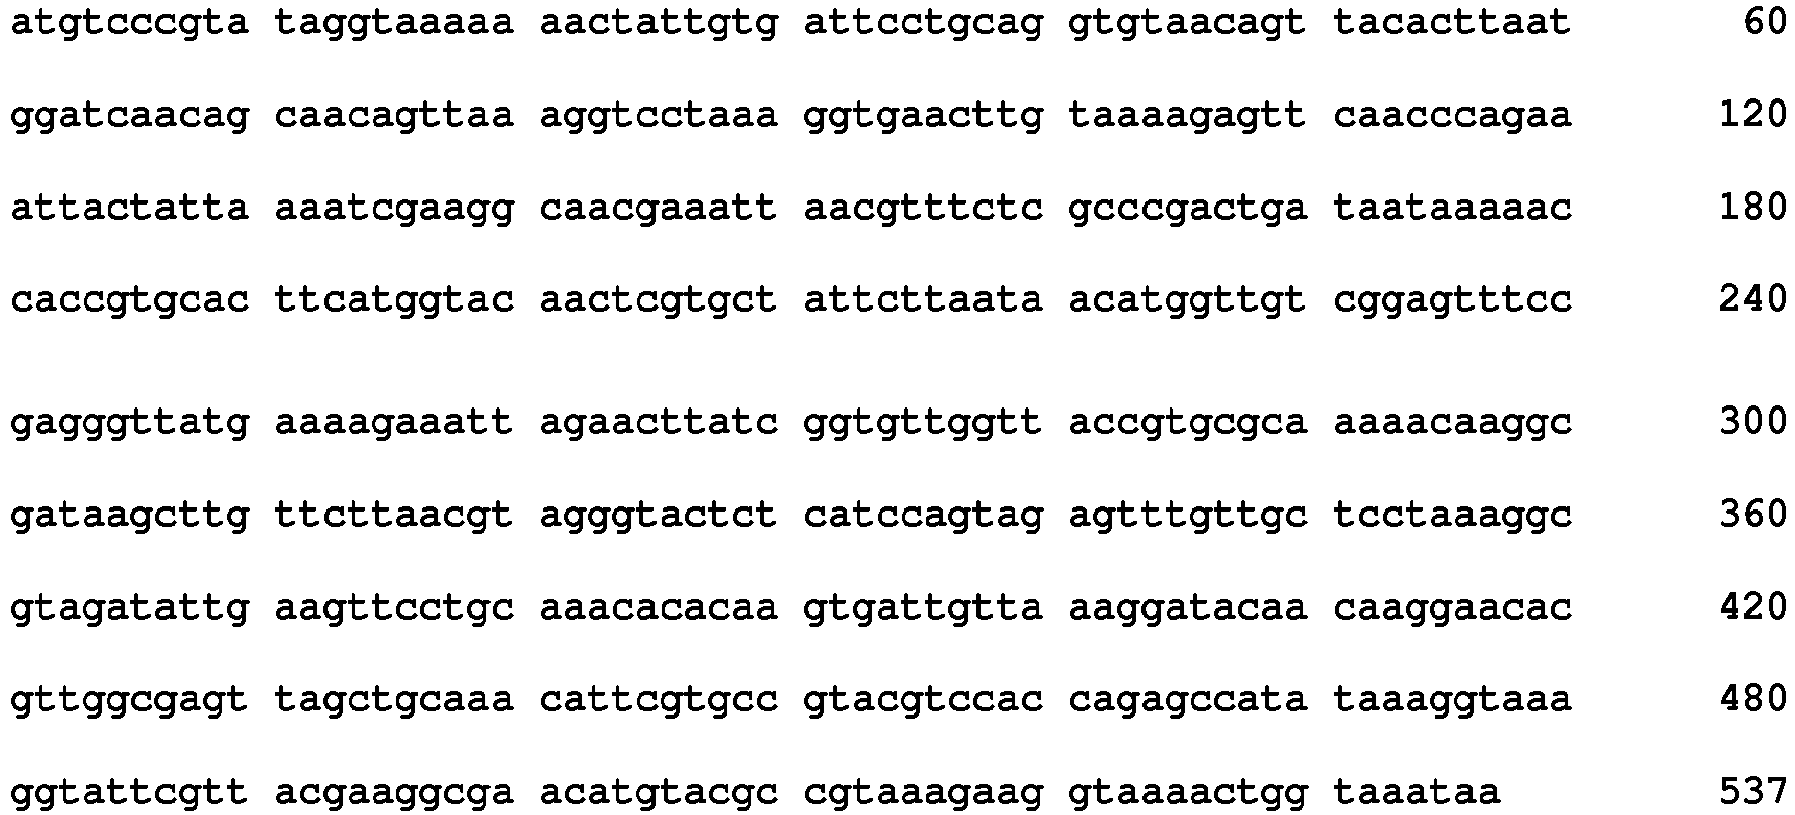
- <210> 84
<211> 537
<212> DNA
<213> Listeria monocytogenes - <400> 84

- <210> 85
<211> 537
<212> DNA
<213> Listeria monocytogenes - <400> 85

- <210> 86
<211> 537
<212> DNA
<213> Listeria monocytogenes - <400> 86

- <210> 87
<211> 537
<212> DNA
<213> Listeria monocytogenes - <400> 87
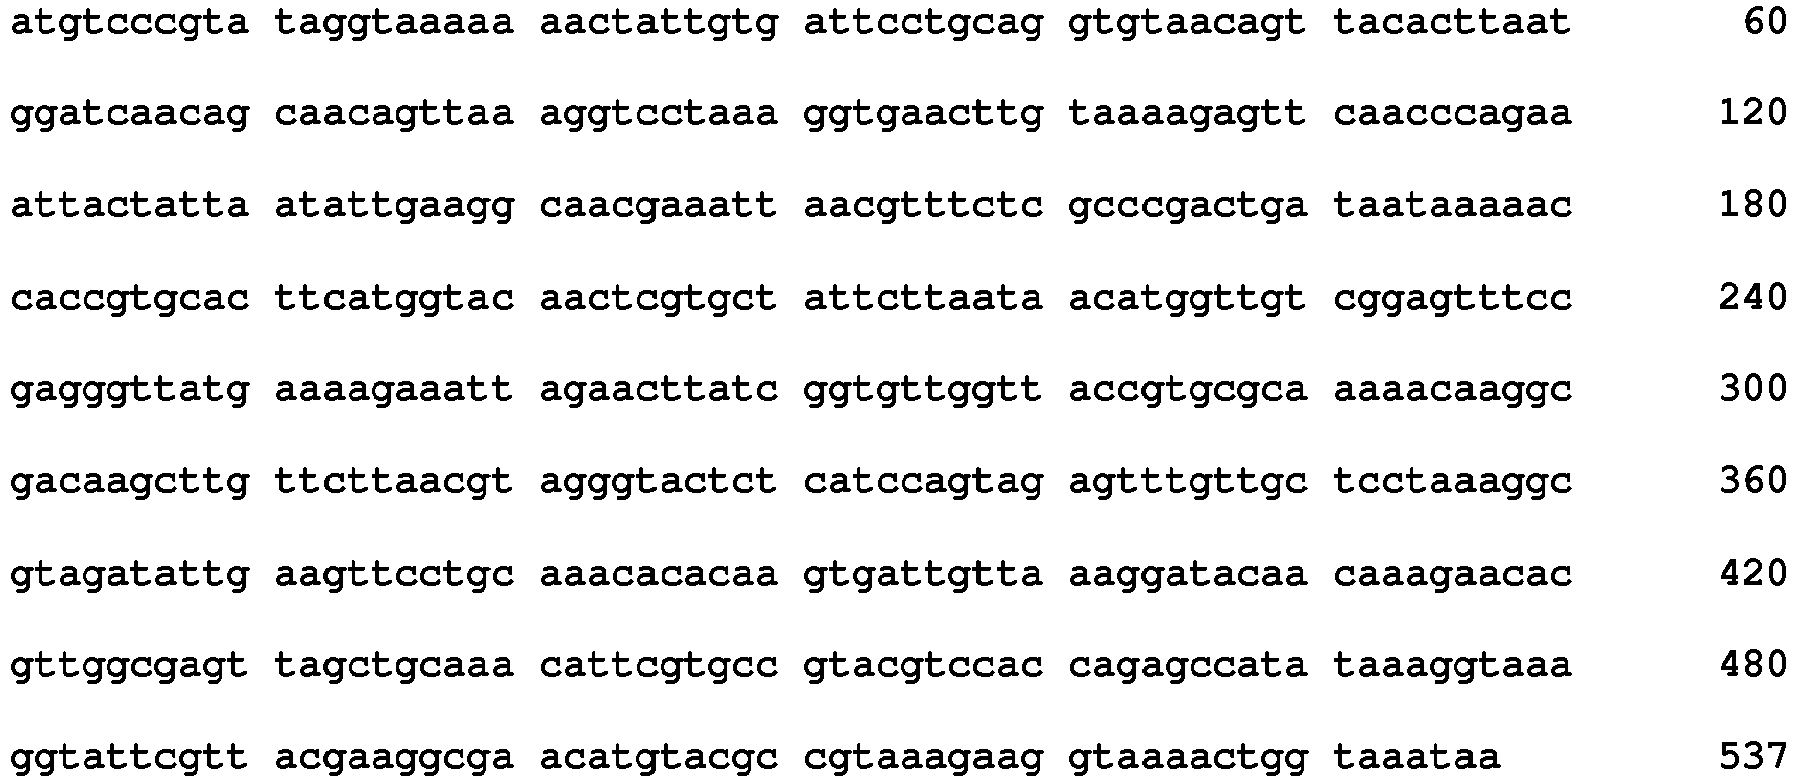
- <210> 88
<211> 537
<212> DNA
<213> Listeria monocytogenes - <400> 88

- <210> 89
<211> 537
<212> DNA
<213> Listeria monocytogenes - <400> 89

- <210> 90
<211> 537
<212> DNA
<213> Listeria monocytogenes - <400> 90

- <210> 91
<211> 537
<212> DNA
<213> Listeria monocytogenes - <400> 91

- <210> 92
<211> 537
<212> DNA
<213> Listeria monocytogenes - <400> 92

- <210> 93
<211> 537
<212> DNA
<213> Listeria monocytogenes - <400> 93

- <210> 94
<211> 537
<212> DNA
<213> Listeria monocytogenes - <400> 94

- <210> 95
<211> 537
<212> DNA
<213> Listeria monocytogenes - <400> 95

- <210> 96
<211> 537
<212> DNA
<213> Listeria monocytogenes - <400> 96

- <210> 97
<211> 360
<212> DNA
<213> Listeria monocytogenes - <400> 97

- <210> 98
<211> 360
<212> DNA
<213> Listeria monocytogenes - <400> 98

- <210> 99
<211> 360
<212> DNA
<213> Listeria monocytogenes - <400> 99

- <210> 100
<211> 360
<212> DNA
<213> Listeria monocytogenes - <400> 100

- <210> 101
<211> 360
<212> DNA
<213> Listeria monocytogenes - <400> 101

- <210> 102
<211> 360
<212> DNA
<213> Listeria monocytogenes - <400> 102

- <210> 103
<211> 360
<212> DNA
<213> Listeria monocytogenes - <400> 103
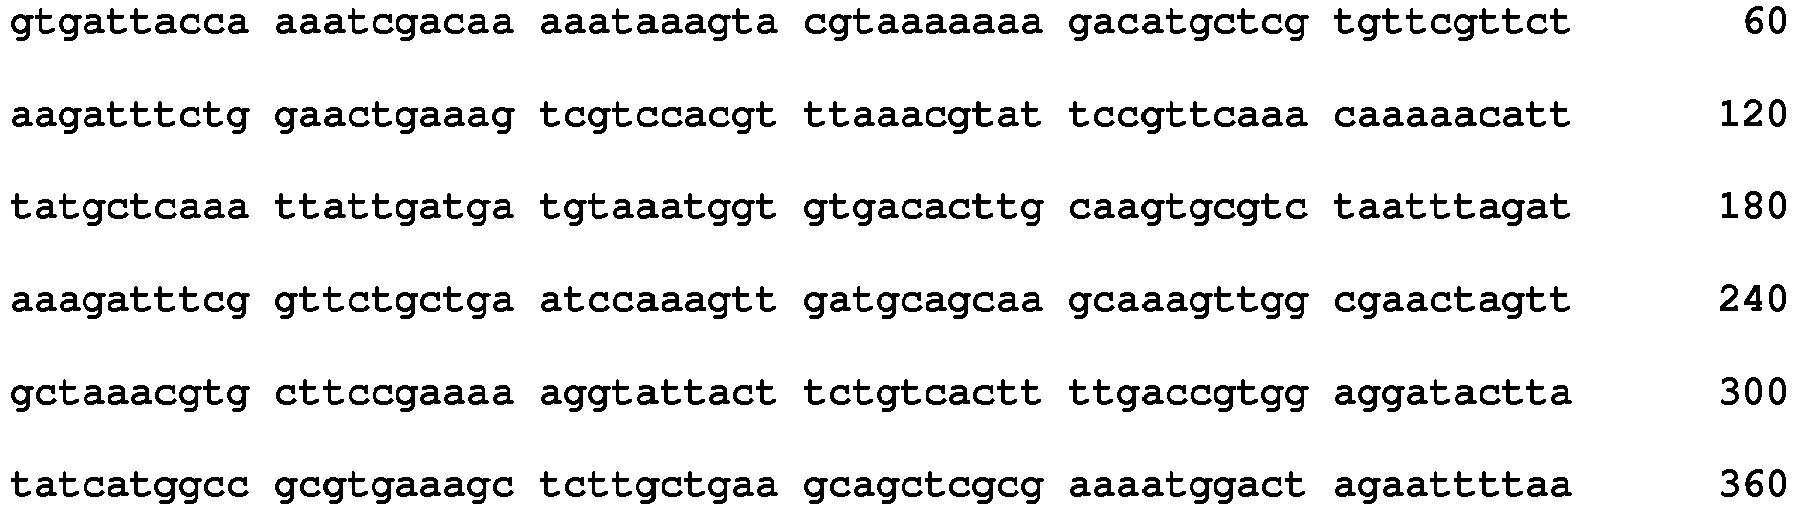
- <210> 104
<211> 360
<212> DNA
<213> Listeria monocytogenes - <400> 104

- <210> 105
<211> 360
<212> DNA
<213> Listeria monocytogenes - <400> 105

- <210> 106
<211> 360
<212> DNA
<213> Listeria monocytogenes - <400> 106

- <210> 107
<211> 360
<212> DNA
<213> Listeria monocytogenes - <400> 107

- <210> 108
<211> 360
<212> DNA
<213> Listeria monocytogenes - <400> 108

- <210> 109
<211> 360
<212> DNA
<213> Listeria monocytogenes - <400> 109

- <210> 110
<211> 360
<212> DNA
<213> Listeria monocytogenes - <400> 110

- <210> 111
<211> 360
<212> DNA
<213> Listeria monocytogenes - <400> 111

- <210> 112
<211> 360
<212> DNA
<213> Listeria monocytogenes - <400> 112
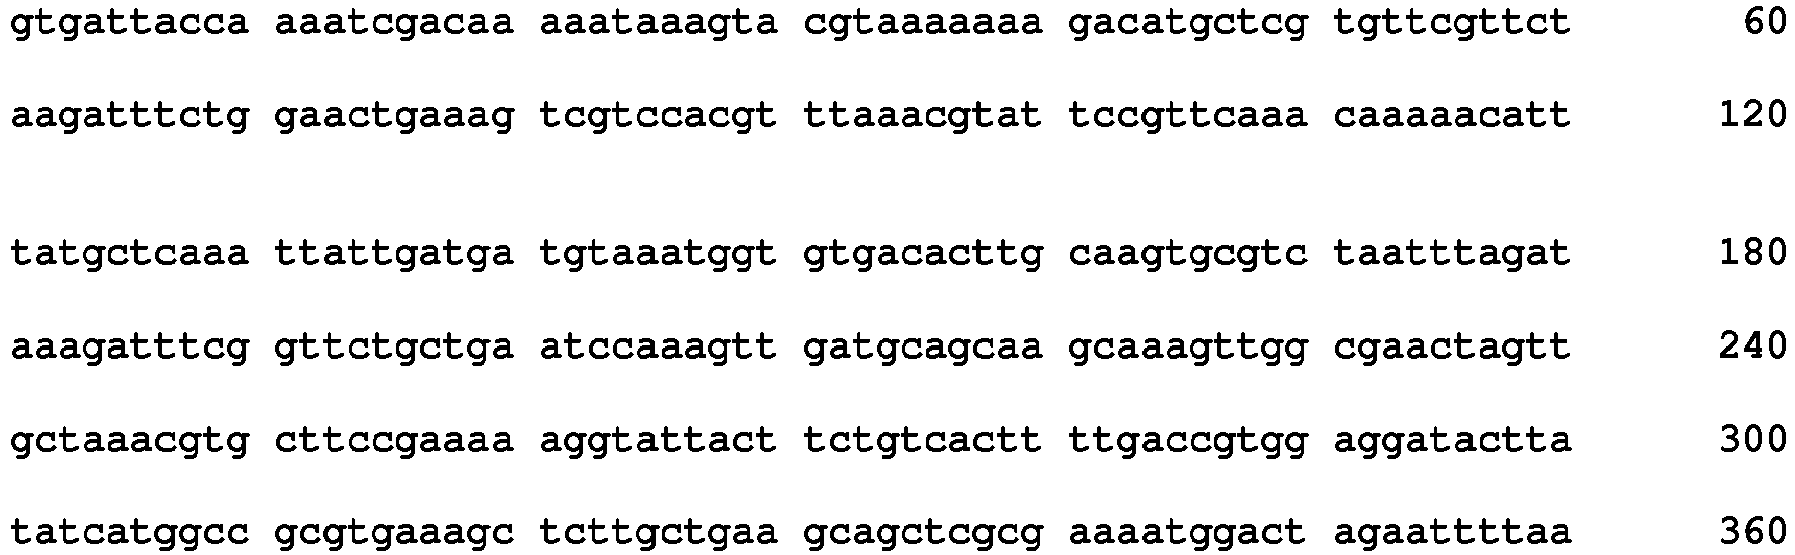
- <210> 113
<211> 504
<212> DNA
<213> Listeria monocytogenes - <400> 113

- <210> 114
<211> 504
<212> DNA
<213> Listeria monocytogenes - <400> 114

- <210> 115
<211> 504
<212> DNA
<213> Listeria monocytogenes - <400> 115

- <210> 116
<211> 504
<212> DNA
<213> Listeria monocytogenes - <400> 116

- <210> 117
<211> 504
<212> DNA
<213> Listeria monocytogenes - <400> 117
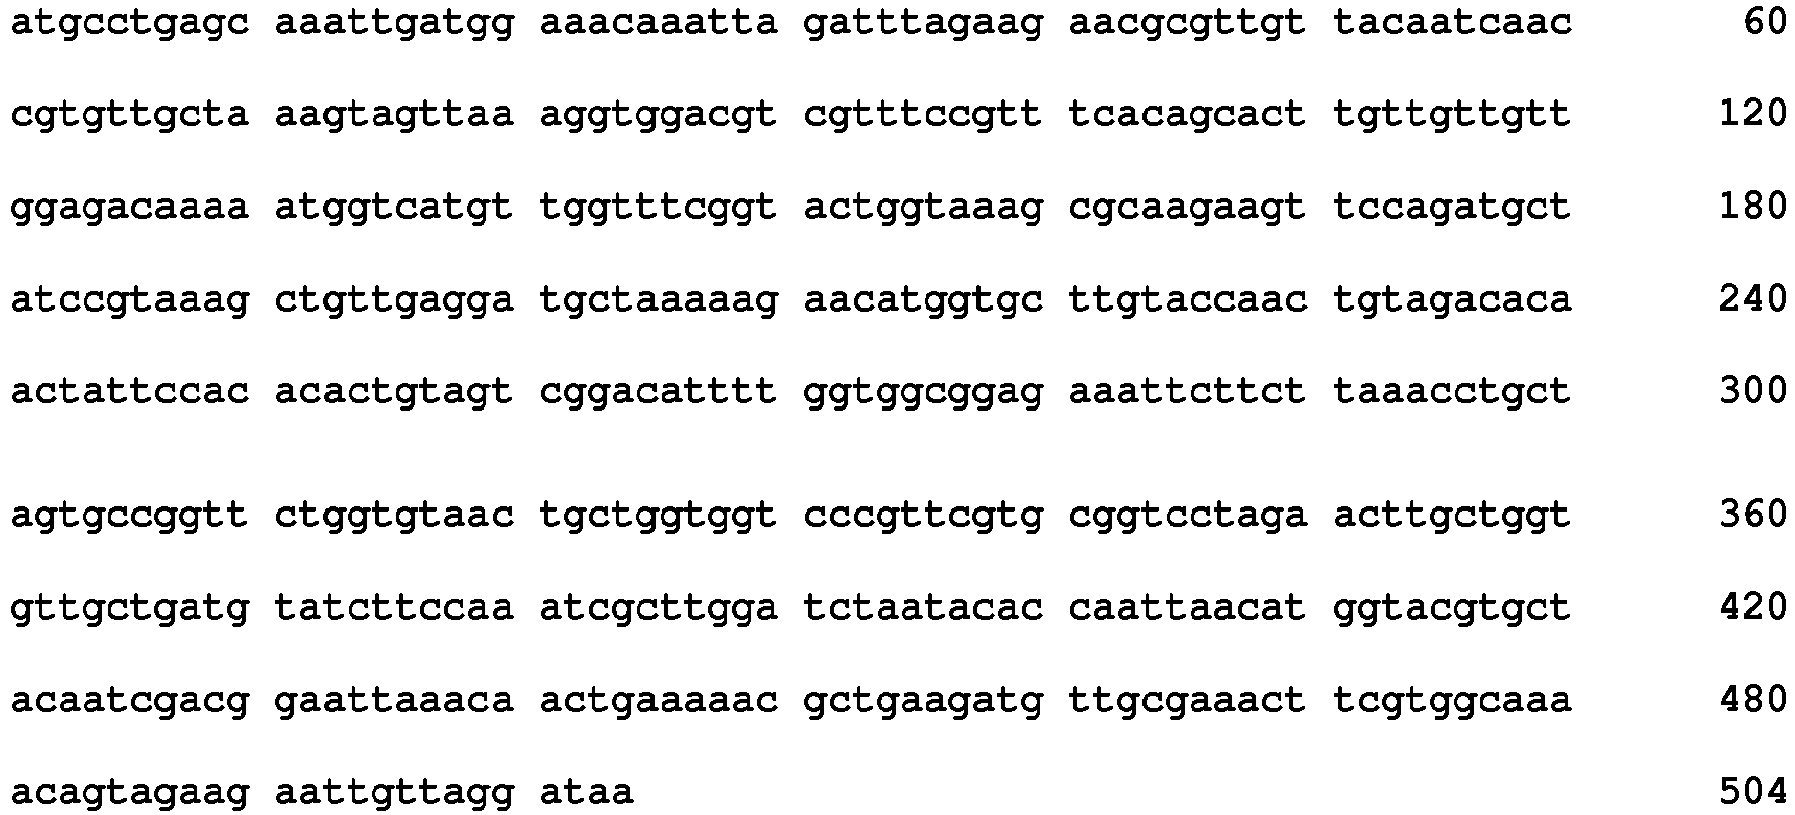
- <210> 118
<211> 504
<212> DNA
<213> Listeria monocytogenes - <400> 118

- <210> 119
<211> 504
<212> DNA
<213> Listeria monocytogenes - <400> 119

- <210> 120
<211> 504
<212> DNA
<213> Listeria monocytogenes - <400> 120
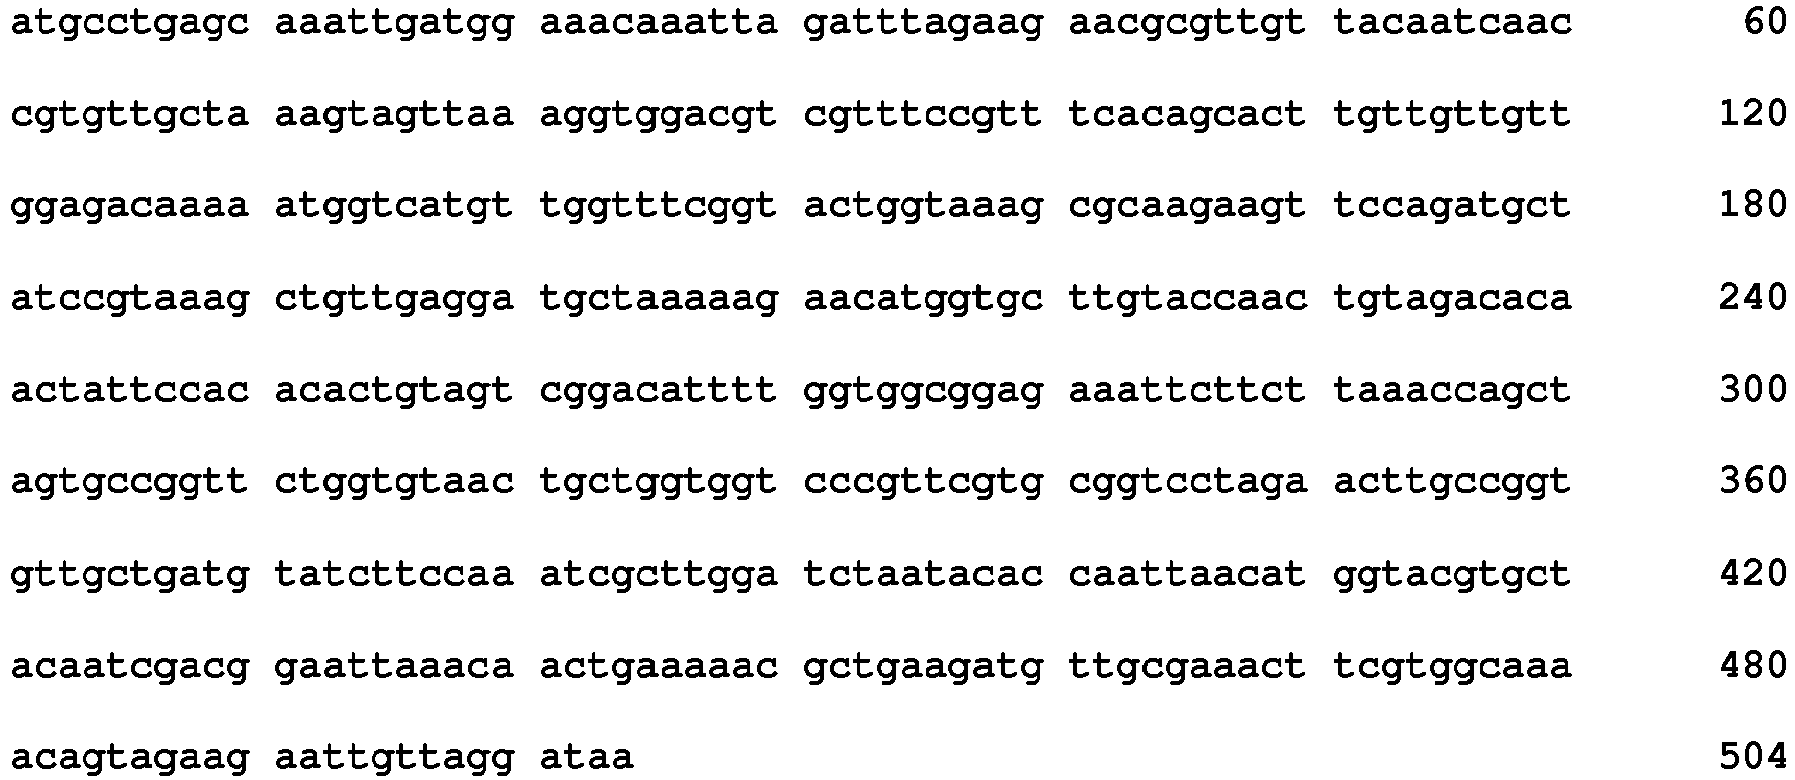
- <210> 121
<211> 504
<212> DNA
<213> Listeria monocytogenes - <400> 121

- <210> 122
<211> 504
<212> DNA
<213> Listeria monocytogenes - <400> 122

- <210> 123
<211> 504
<212> DNA
<213> Listeria monocytogenes - <400> 123

- <210> 124
<211> 504
<212> DNA
<213> Listeria monocytogenes - <400> 124

- <210> 125
<211> 504
<212> DNA
<213> Listeria monocytogenes - <400> 125

- <210> 126
<211> 504
<212> DNA
<213> Listeria monocytogenes - <400> 126

- <210> 127
<211> 504
<212> DNA
<213> Listeria monocytogenes - <400> 127

- <210> 128
<211> 504
<212> DNA
<213> Listeria monocytogenes - <400> 128

- <210> 129
<211> 441
<212> DNA
<213> Listeria monocytogenes - <400> 129

- <210> 130
<211> 441
<212> DNA
<213> Listeria monocytogenes - <400> 130


- <210> 131
<211> 441
<212> DNA
<213> Listeria monocytogenes - <400> 131

- <210> 132
<211> 441
<212> DNA
<213> Listeria monocytogenes - <400> 132

- <210> 133
<211> 441
<212> DNA
<213> Listeria monocytogenes - <400> 133

- <210> 134
<211> 441
<212> DNA
<213> Listeria monocytogenes - <400> 134

- <210> 135
<211> 441
<212> DNA
<213> Listeria monocytogenes - <400> 135
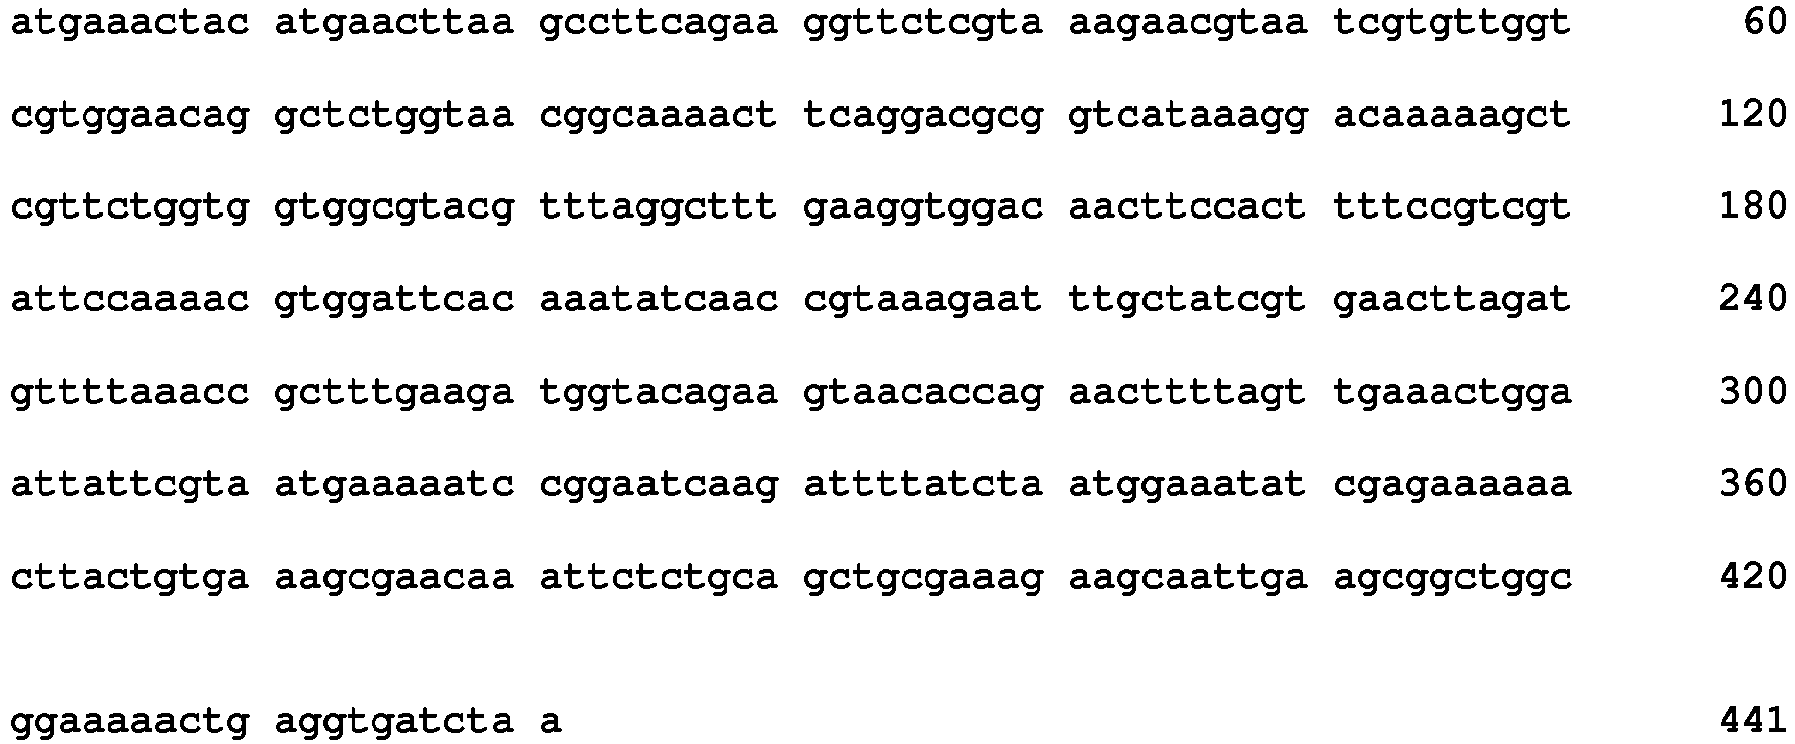
- <210> 136
<211> 441
<212> DNA
<213> Listeria monocytogenes - <400> 136

- <210> 137
<211> 441
<212> DNA
<213> Listeria monocytogenes - <400> 137

- <210> 138
<211> 441
<212> DNA
<213> Listeria monocytogenes - <400> 138


- <210> 139
<211> 441
<212> DNA
<213> Listeria monocytogenes - <400> 139

- <210> 140
<211> 441
<212> DNA
<213> Listeria monocytogenes - <400> 140

- <210> 141
<211> 441
<212> DNA
<213> Listeria monocytogenes - <400> 141
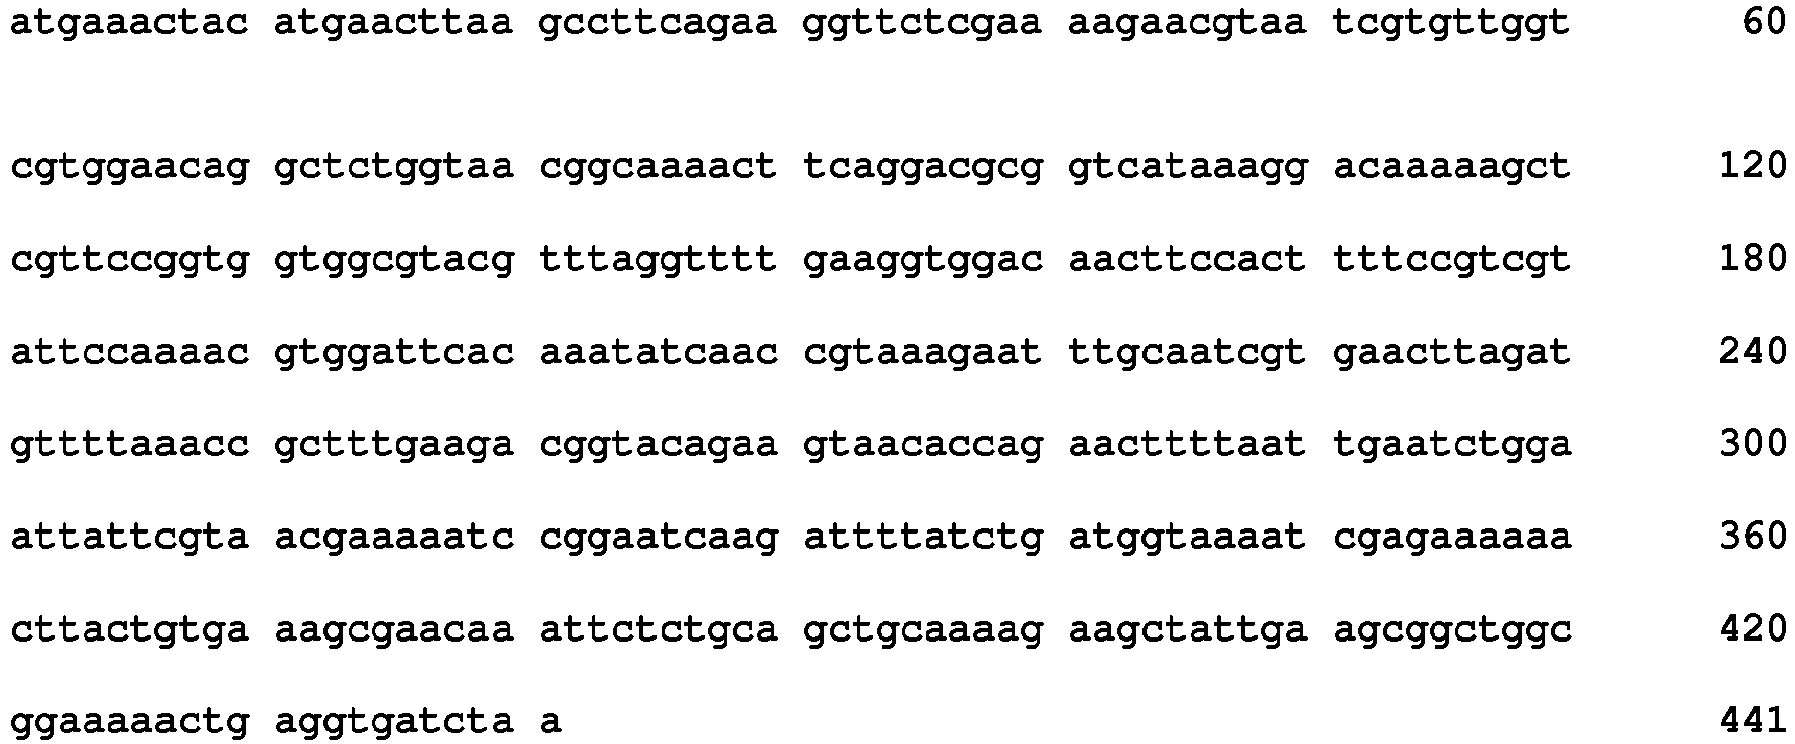
- <210> 142
<211> 441
<212> DNA
<213> Listeria monocytogenes - <400> 142

- <210> 143
<211> 441
<212> DNA
<213> Listeria monocytogenes - <400> 143
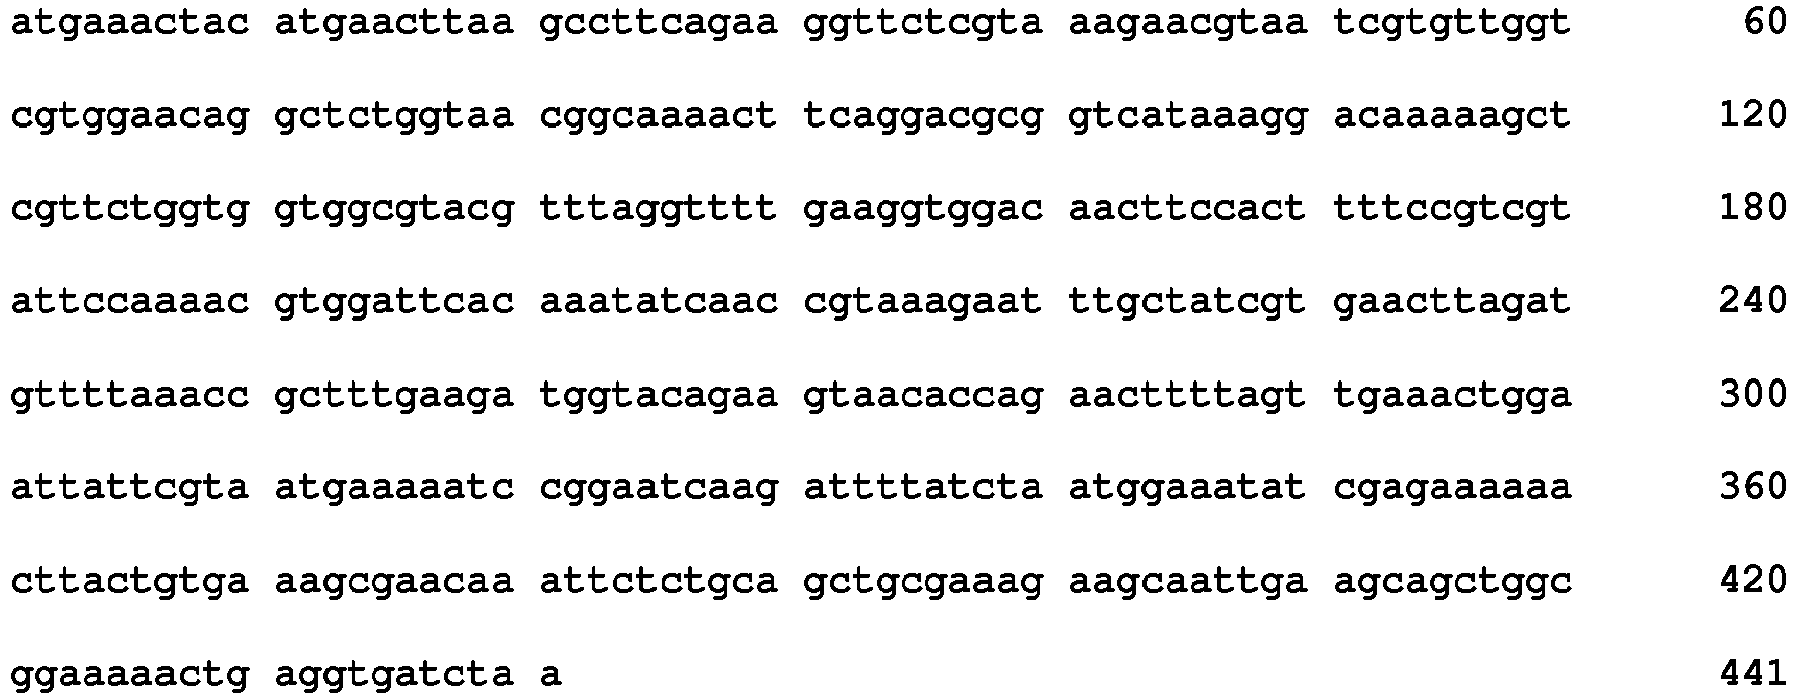
- <210> 144
<211> 441
<212> DNA
<213> Listeria monocytogenes - <400> 144

- <210> 145
<211> 366
<212> DNA
<213> Listeria monocytogenes - <400> 145

- <210> 146
<211> 366
<212> DNA
<213> Listeria monocytogenes - <400> 146

- <210> 147
<211> 366
<212> DNA
<213> Listeria monocytogenes - <400> 147
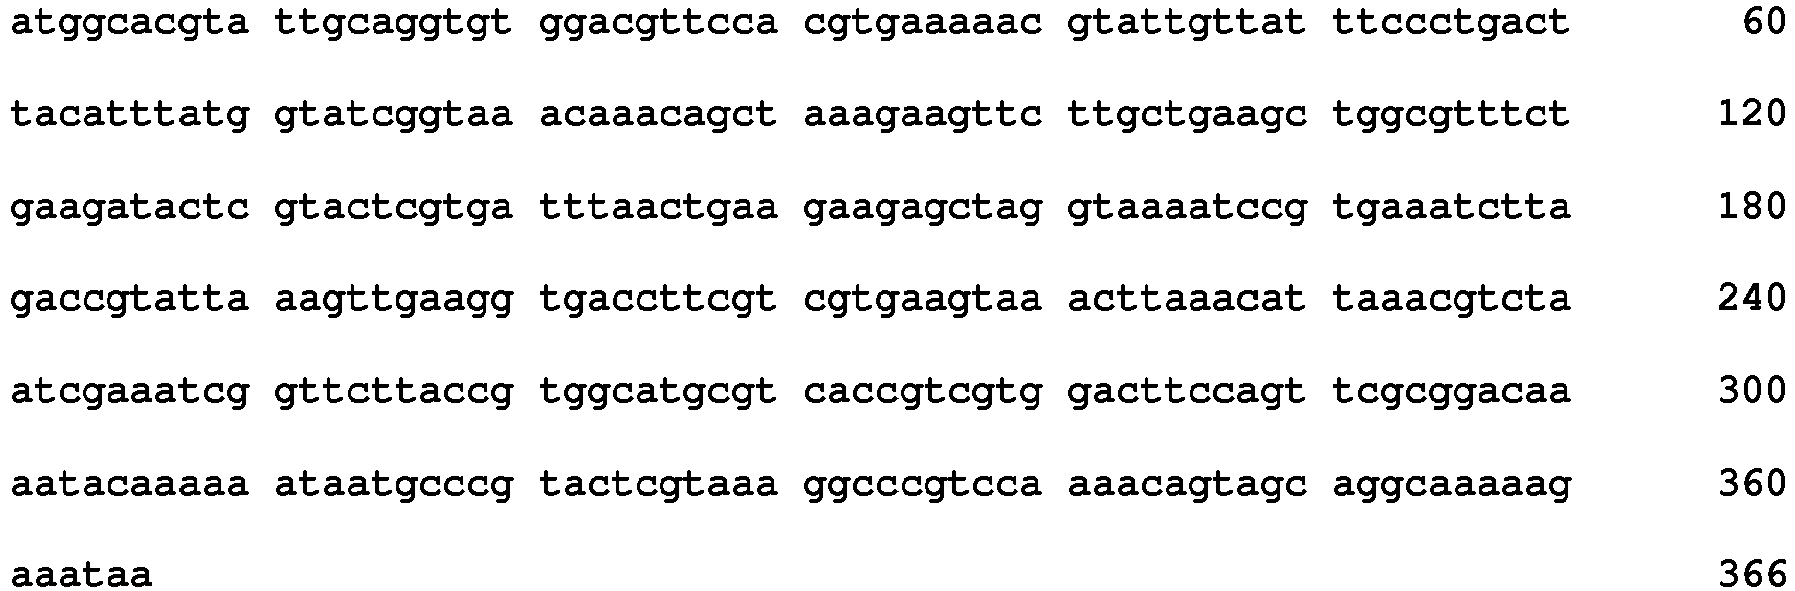
- <210> 148
<211> 366
<212> DNA
<213> Listeria monocytogenes - <400> 148

- <210> 149
<211> 366
<212> DNA
<213> Listeria monocytogenes - <400> 149

- <210> 150
<211> 366
<212> DNA
<213> Listeria monocytogenes - <400> 150

- <210> 151
<211> 366
<212> DNA
<213> Listeria monocytogenes - <400> 151

- <210> 152
<211> 366
<212> DNA
<213> Listeria monocytogenes - <400> 152

- <210> 153
<211> 366
<212> DNA
<213> Listeria monocytogenes - <400> 153

- <210> 154
<211> 366
<212> DNA
<213> Listeria monocytogenes - <400> 154

- <210> 155
<211> 366
<212> DNA
<213> Listeria monocytogenes - <400> 155

- <210> 156
<211> 366
<212> DNA
<213> Listeria monocytogenes - <400> 156

- <210> 157
<211> 366
<212> DNA
<213> Listeria monocytogenes - <400> 157

- <210> 158
<211> 366
<212> DNA
<213> Listeria monocytogenes - <400> 158

- <210> 159
<211> 366
<212> DNA
<213> Listeria monocytogenes - <400> 159

- <210> 160
<211> 366
<212> DNA
<213> Listeria monocytogenes - <400> 160

- <210> 161
<211> 390
<212> DNA
<213> Listeria monocytogenes - <400> 161

- <210> 162
<211> 390
<212> DNA
<213> Listeria monocytogenes - <400> 162
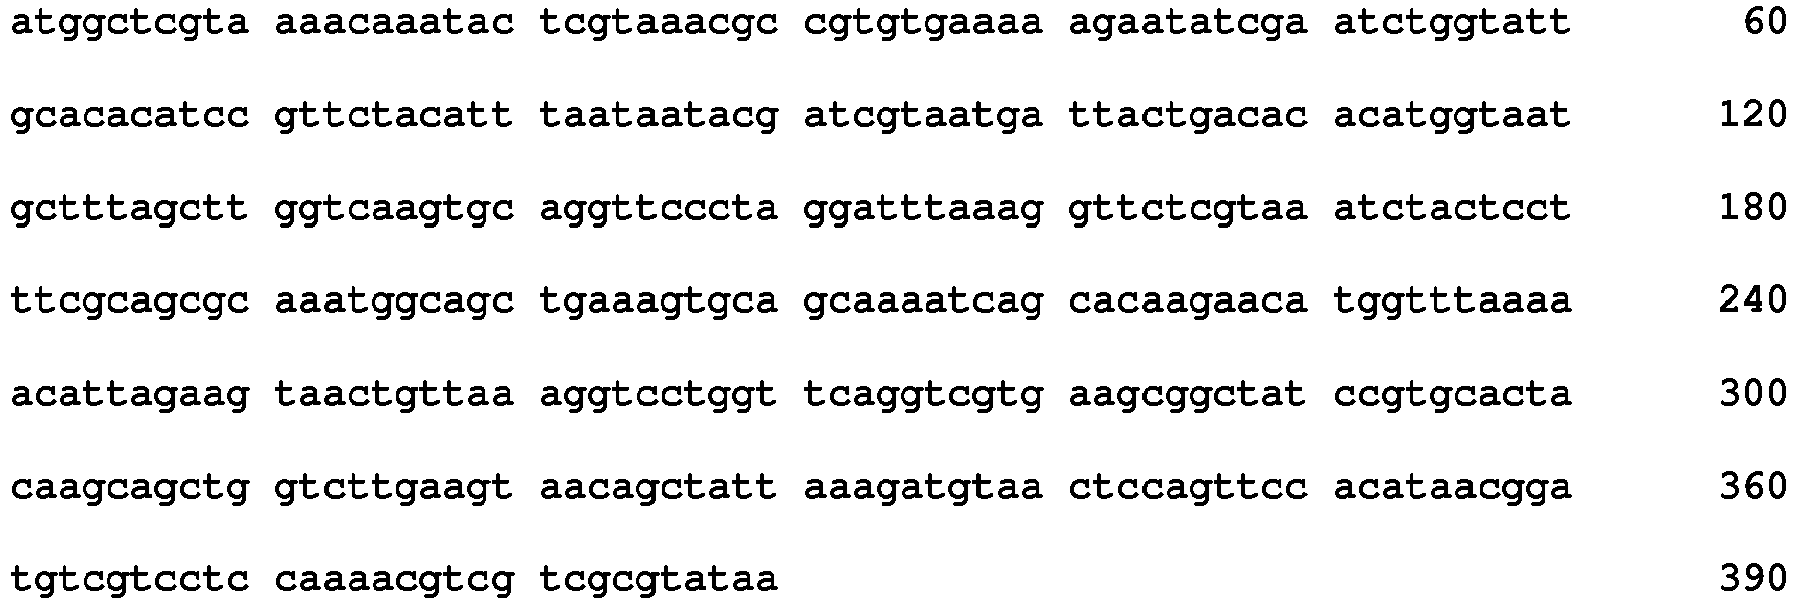
- <210> 163
<211> 390
<212> DNA
<213> Listeria monocytogenes - <400> 163

- <210> 164
<211> 390
<212> DNA
<213> Listeria monocytogenes - <400> 164

- <210> 165
<211> 390
<212> DNA
<213> Listeria monocytogenes - <400> 165

- <210> 166
<211> 390
<212> DNA
<213> Listeria monocytogenes - <400> 166

- <210> 167
<211> 390
<212> DNA
<213> Listeria monocytogenes - <400> 167

- <210> 168
<211> 390
<212> DNA
<213> Listeria monocytogenes - <400> 168

- <210> 169
<211> 390
<212> DNA
<213> Listeria monocytogenes - <400> 169

- <210> 170
<211> 390
<212> DNA
<213> Listeria monocytogenes - <400> 170

- <210> 171
<211> 390
<212> DNA
<213> Listeria monocytogenes - <400> 171

- <210> 172
<211> 390
<212> DNA
<213> Listeria monocytogenes - <400> 172

- <210> 173
<211> 390
<212> DNA
<213> Listeria monocytogenes - <400> 173

- <210> 174
<211> 390
<212> DNA
<213> Listeria monocytogenes - <400> 174

- <210> 175
<211> 390
<212> DNA
<213> Listeria monocytogenes - <400> 175

- <210> 176
<211> 390
<212> DNA
<213> Listeria monocytogenes - <400> 176

- <210> 177
<211> 390
<212> DNA
<213> Listeria monocytogenes - <400> 177

- <210> 178
<211> 501
<212> DNA
<213> Listeria monocytogenes - <400> 178
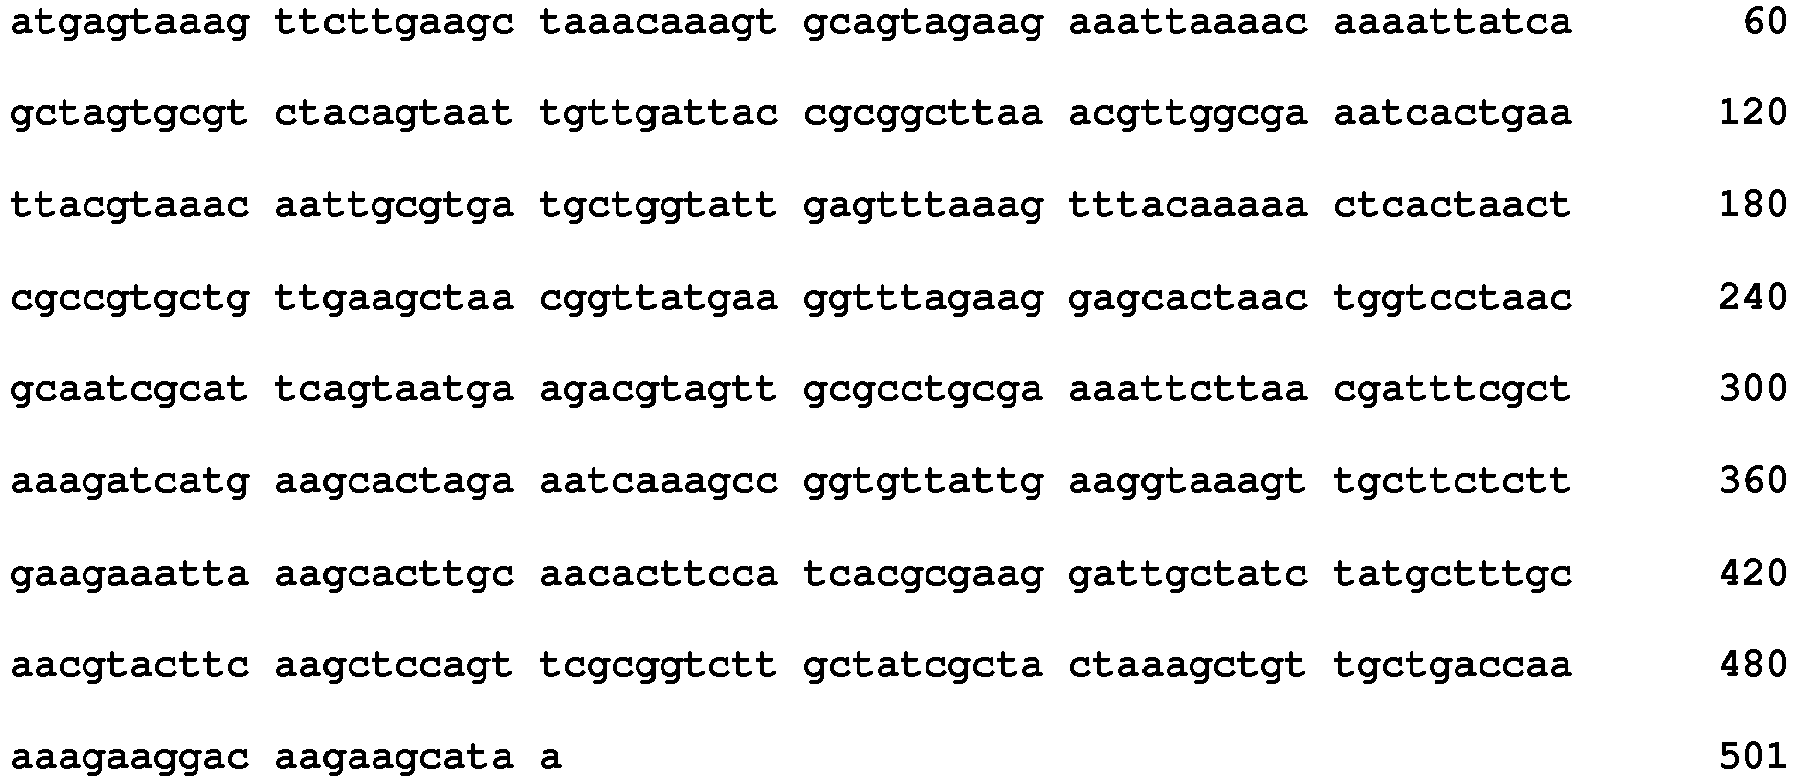
- <210> 179
<211> 501
<212> DNA
<213> Listeria monocytogenes - <400> 179

- <210> 180
<211> 501
<212> DNA
<213> Listeria monocytogenes - <400> 180

- <210> 181
<211> 501
<212> DNA
<213> Listeria monocytogenes - <400> 181

- <210> 182
<211> 501
<212> DNA
<213> Listeria monocytogenes - <400> 182

- <210> 183
<211> 501
<212> DNA
<213> Listeria monocytogenes - <400> 183

- <210> 184
<211> 501
<212> DNA
<213> Listeria monocytogenes - <400> 184

- <210> 185
<211> 501
<212> DNA
<213> Listeria monocytogenes - <400> 185

- <210> 186
<211> 501
<212> DNA
<213> Listeria monocytogenes - <400> 186

- <210> 187
<211> 501
<212> DNA
<213> Listeria monocytogenes - <400> 187

- <210> 188
<211> 501
<212> DNA
<213> Listeria monocytogenes - <400> 188

- <210> 189
<211> 501
<212> DNA
<213> Listeria monocytogenes - <400> 189
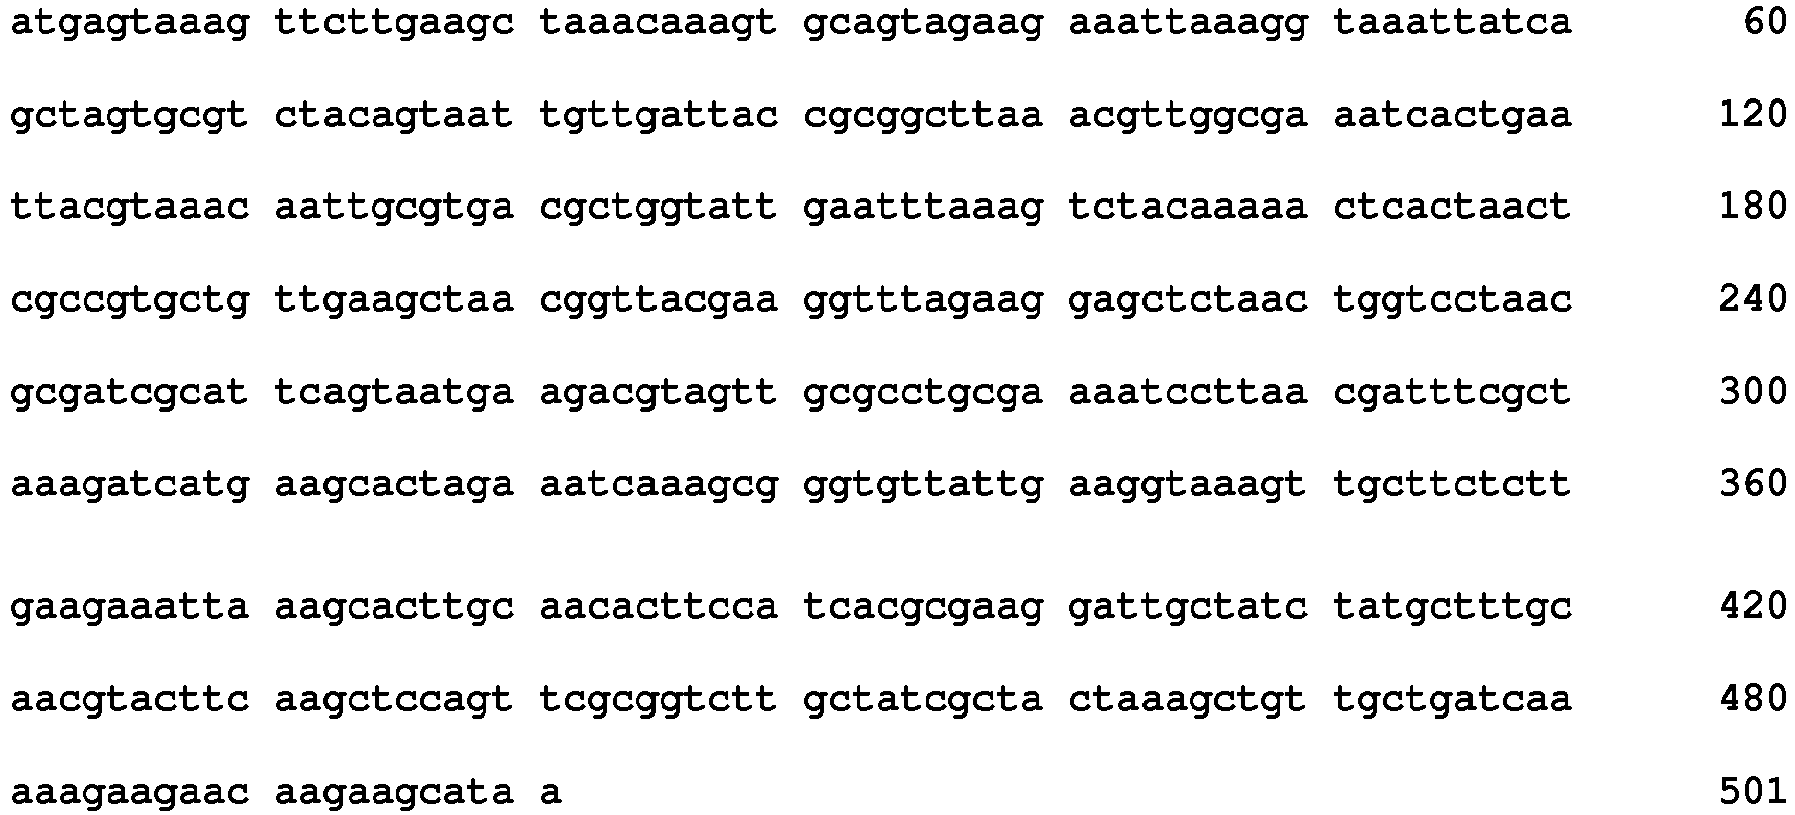
- <210> 190
<211> 501
<212> DNA
<213> Listeria monocytogenes - <400> 190

- <210> 191
<211> 501
<212> DNA
<213> Listeria monocytogenes - <400> 191

- <210> 192
<211> 501
<212> DNA
<213> Listeria monocytogenes - <400> 192

- <210> 193
<211> 309
<212> DNA
<213> Listeria monocytogenes - <400> 193

- <210> 194
<211> 309
<212> DNA
<213> Listeria monocytogenes - <400> 194

- <210> 195
<211> 309
<212> DNA
<213> Listeria monocytogenes - <400> 195

- <210> 196
<211> 309
<212> DNA
<213> Listeria monocytogenes - <400> 196

- <210> 197
<211> 309
<212> DNA
<213> Listeria monocytogenes - <400> 197

- <210> 198
<211> 309
<212> DNA
<213> Listeria monocytogenes - <400> 198

- <210> 199
<211> 309
<212> DNA
<213> Listeria monocytogenes - <400> 199

- <210> 200
<211> 309
<212> DNA
<213> Listeria monocytogenes - <400> 200

- <210> 201
<211> 309
<212> DNA
<213> Listeria monocytogenes - <400> 201

- <210> 202
<211> 309
<212> DNA
<213> Listeria monocytogenes - <400> 202

- <210> 203
<211> 309
<212> DNA
<213> Listeria monocytogenes - <400> 203

- <210> 204
<211> 309
<212> DNA
<213> Listeria monocytogenes - <400> 204

- <210> 205
<211> 309
<212> DNA
<213> Listeria monocytogenes - <400> 205

- <210> 206
<211> 309
<212> DNA
<213> Listeria monocytogenes - <400> 206
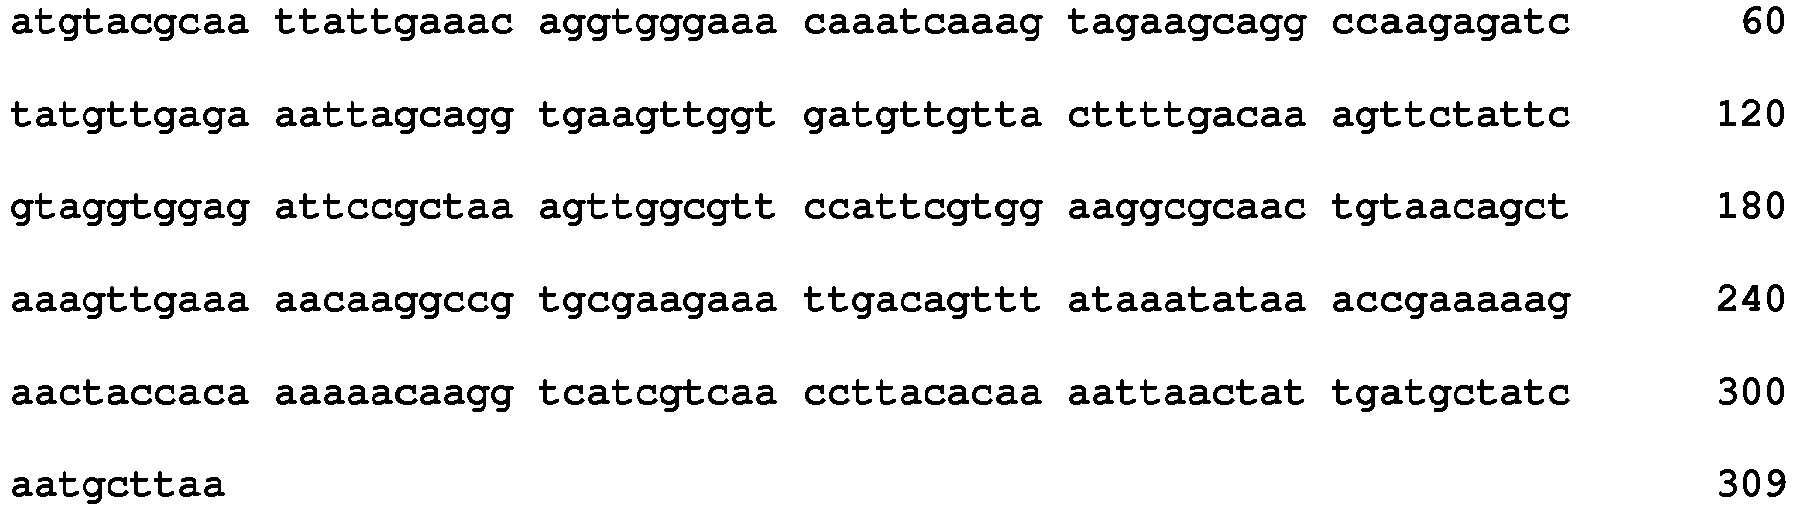
- <210> 207
<211> 309
<212> DNA
<213> Listeria monocytogenes - <400> 207

- <210> 208
<211> 309
<212> DNA
<213> Listeria monocytogenes - <400> 208

- <210> 209
<211> 438
<212> DNA
<213> Listeria monocytogenes - <400> 209

- <210> 210
<211> 438
<212> DNA
<213> Listeria monocytogenes - <400> 210

- <210> 211
<211> 438
<212> DNA
<213> Listeria monocytogenes - <400> 211
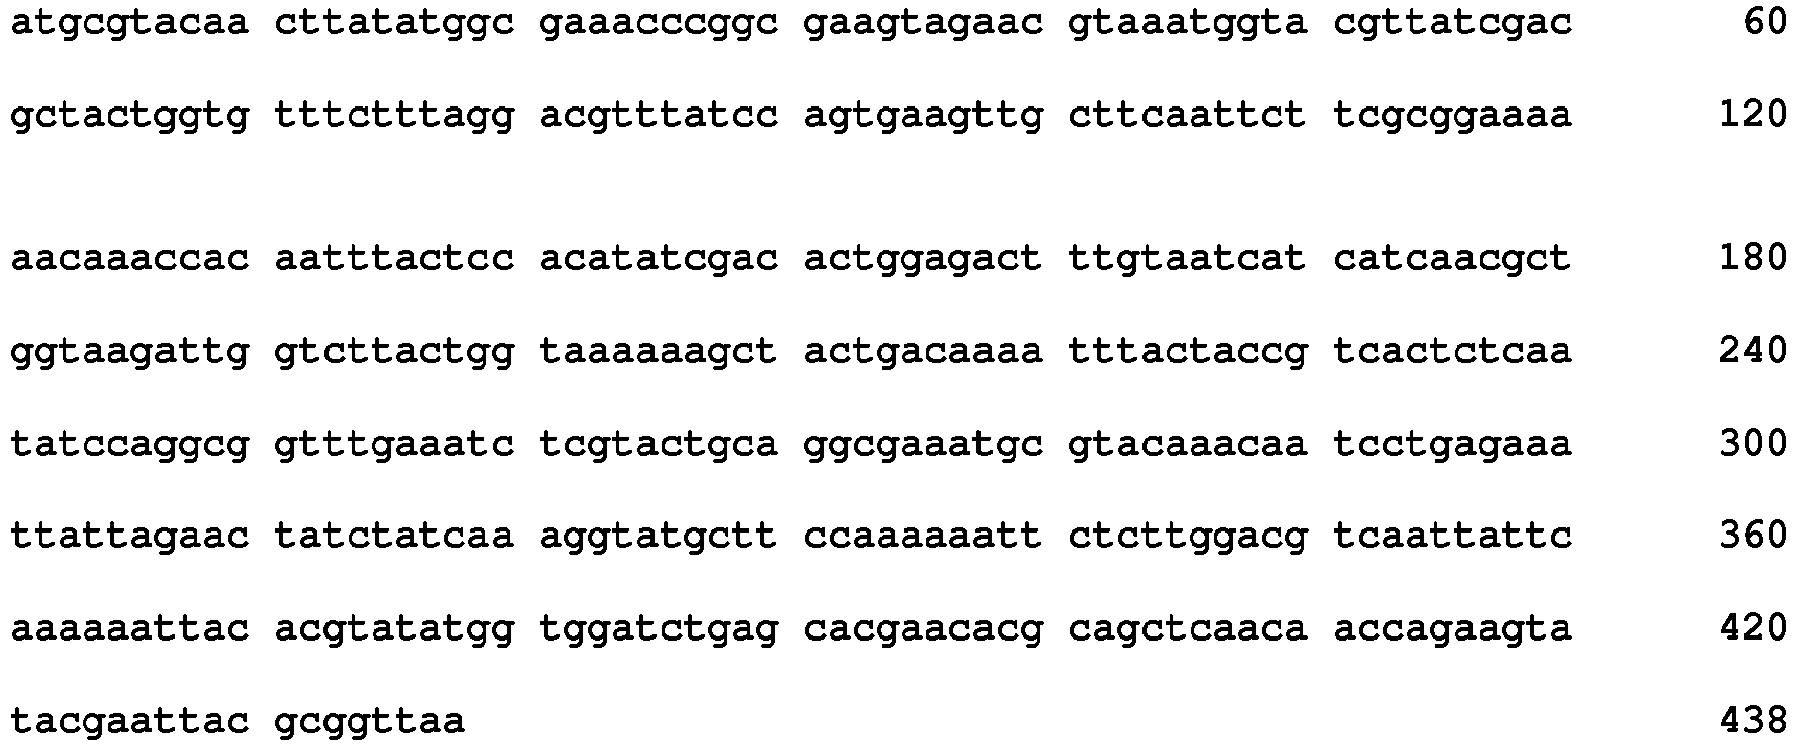
- <210> 212
<211> 438
<212> DNA
<213> Listeria monocytogenes - <400> 212

- <210> 213
<211> 438
<212> DNA
<213> Listeria monocytogenes - <400> 213

- <210> 214
<211> 438
<212> DNA
<213> Listeria monocytogenes - <400> 214

- <210> 215
<211> 438
<212> DNA
<213> Listeria monocytogenes - <400> 215

- <210> 216
<211> 438
<212> DNA
<213> Listeria monocytogenes - <400> 216

- <210> 217
<211> 438
<212> DNA
<213> Listeria monocytogenes - <400> 217
- <210> 218
<211> 438
<212> DNA
<213> Listeria monocytogenes - <400> 218

- <210> 219
<211> 438
<212> DNA
<213> Listeria monocytogenes - <400> 219

- <210> 220
<211> 438
<212> DNA
<213> Listeria monocytogenes - <400> 220

- <210> 221
<211> 438
<212> DNA
<213> Listeria monocytogenes - <400> 221

- <210> 222
<211> 438
<212> DNA
<213> Listeria monocytogenes - <400> 222


- <210> 223
<211> 438
<212> DNA
<213> Listeria monocytogenes - <400> 223

- <210> 224
<211> 438
<212> DNA
<213> Listeria monocytogenes - <400> 224

- <210> 225
<211> 393
<212> DNA
<213> Listeria monocytogenes - <400> 225

- <210> 226
<211> 393
<212> DNA
<213> Listeria monocytogenes - <400> 226

- <210> 227
<211> 393
<212> DNA
<213> Listeria monocytogenes - <400> 227

- <210> 228
<211> 393
<212> DNA
<213> Listeria monocytogenes - <400> 228

- <210> 229
<211> 393
<212> DNA
<213> Listeria monocytogenes - <400> 229

- <210> 230
<211> 393
<212> DNA
<213> Listeria monocytogenes - <400> 230
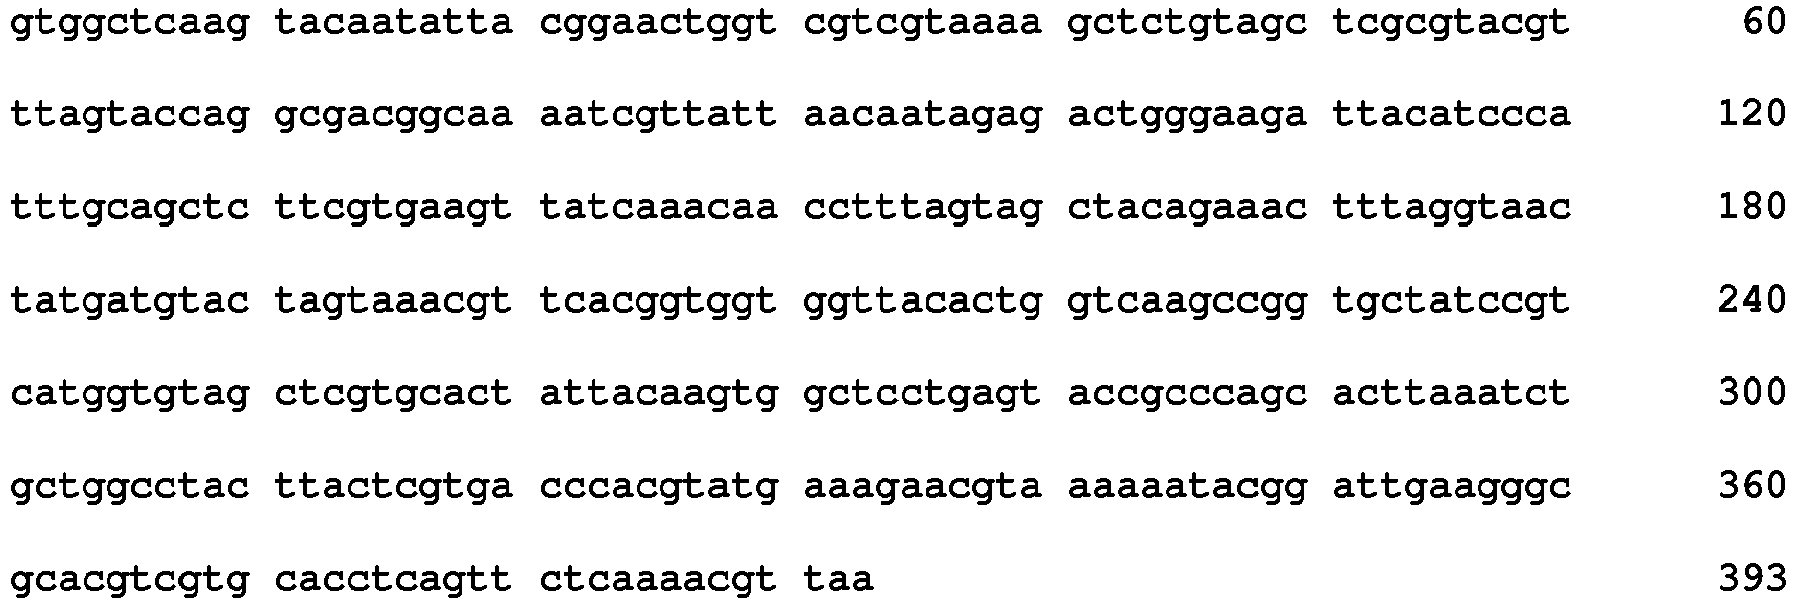
- <210> 231
<211> 393
<212> DNA
<213> Listeria monocytogenes - <400> 231

- <210> 232
<211> 393
<212> DNA
<213> Listeria monocytogenes - <400> 232

- <210> 233
<211> 393
<212> DNA
<213> Listeria monocytogenes - <400> 233

- <210> 234
<211> 393
<212> DNA
<213> Listeria monocytogenes - <400> 234

- <210> 235
<211> 393
<212> DNA
<213> Listeria monocytogenes - <400> 235

- <210> 236
<211> 393
<212> DNA
<213> Listeria monocytogenes - <400> 236

- <210> 237
<211> 393
<212> DNA
<213> Listeria monocytogenes - <400> 237

- <210> 238
<211> 393
<212> DNA
<213> Listeria monocytogenes - <400> 238

- <210> 239
<211> 393
<212> DNA
<213> Listeria monocytogenes - <400> 239

- <210> 240
<211> 393
<212> DNA
<213> Listeria monocytogenes - <400> 240

- <210> 241
<211> 312
<212> DNA
<213> Listeria innocua - <400> 241

- <210> 242
<211> 537
<212> DNA
<213> Listeria innocua - <400> 242

- <210> 243
<211> 360
<212> DNA
<213> Listeria innocua - <400> 243

- <210> 244
<211> 441
<212> DNA
<213> Listeria innocua - <400> 244

- <210> 245
<211> 390
<212> DNA
<213> Listeria innocua - <400> 245

- <210> 246
<211> 393
<212> DNA
<213> Listeria innocua - <400> 246

- <210> 247
<211> 246
<212> DNA
<213> Listeria innocua - <400> 247
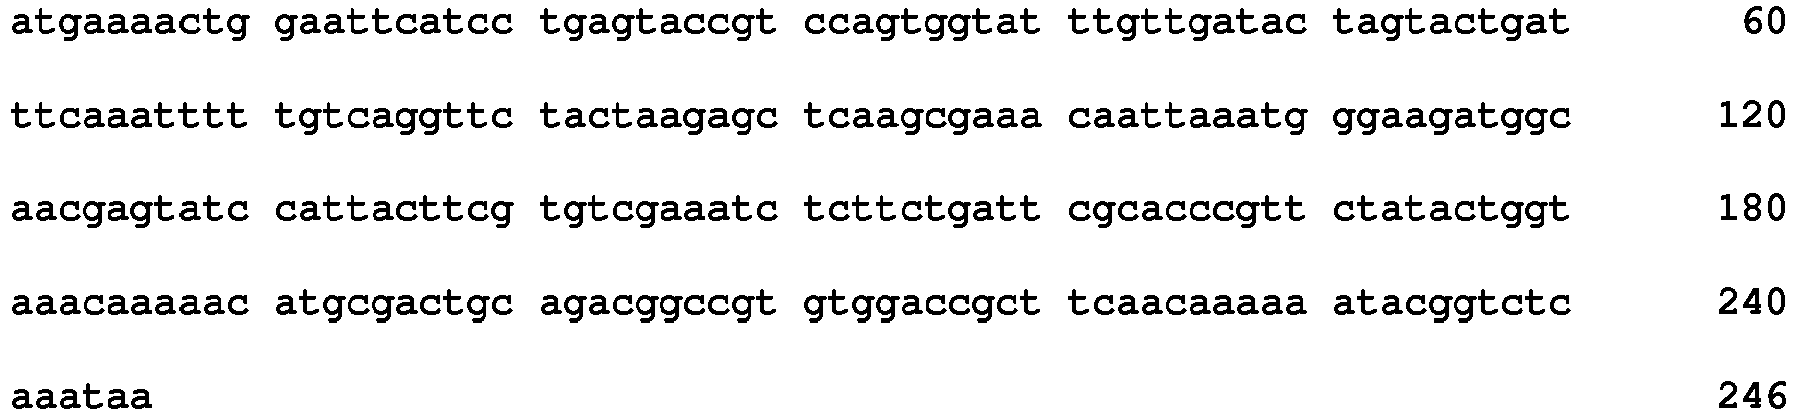
- <210> 248
<211> 273
<212> DNA
<213> Listeria innocua - <400> 248

- <210> 249
<211> 312
<212> DNA
<213> Listeria innocua - <400> 249
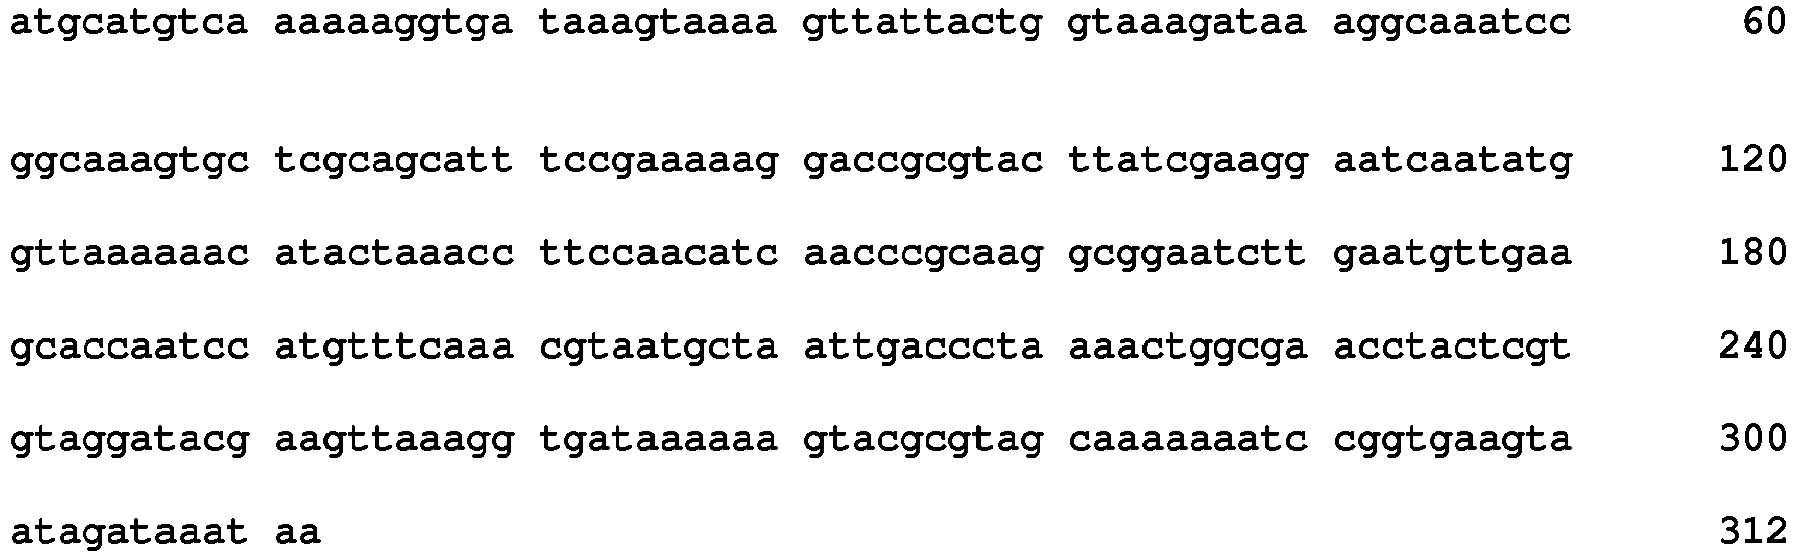
- <210> 250
<211> 537
<212> DNA
<213> Listeria innocua - <400> 250

- <210> 251
<211> 360
<212> DNA
<213> Listeria innocua - <400> 251

- <210> 252
<211> 441
<212> DNA
<213> Listeria innocua - <400> 252


- <210> 253
<211> 390
<212> DNA
<213> Listeria innocua - <400> 253

- <210> 254
<211> 393
<212> DNA
<213> Listeria innocua - <400> 254
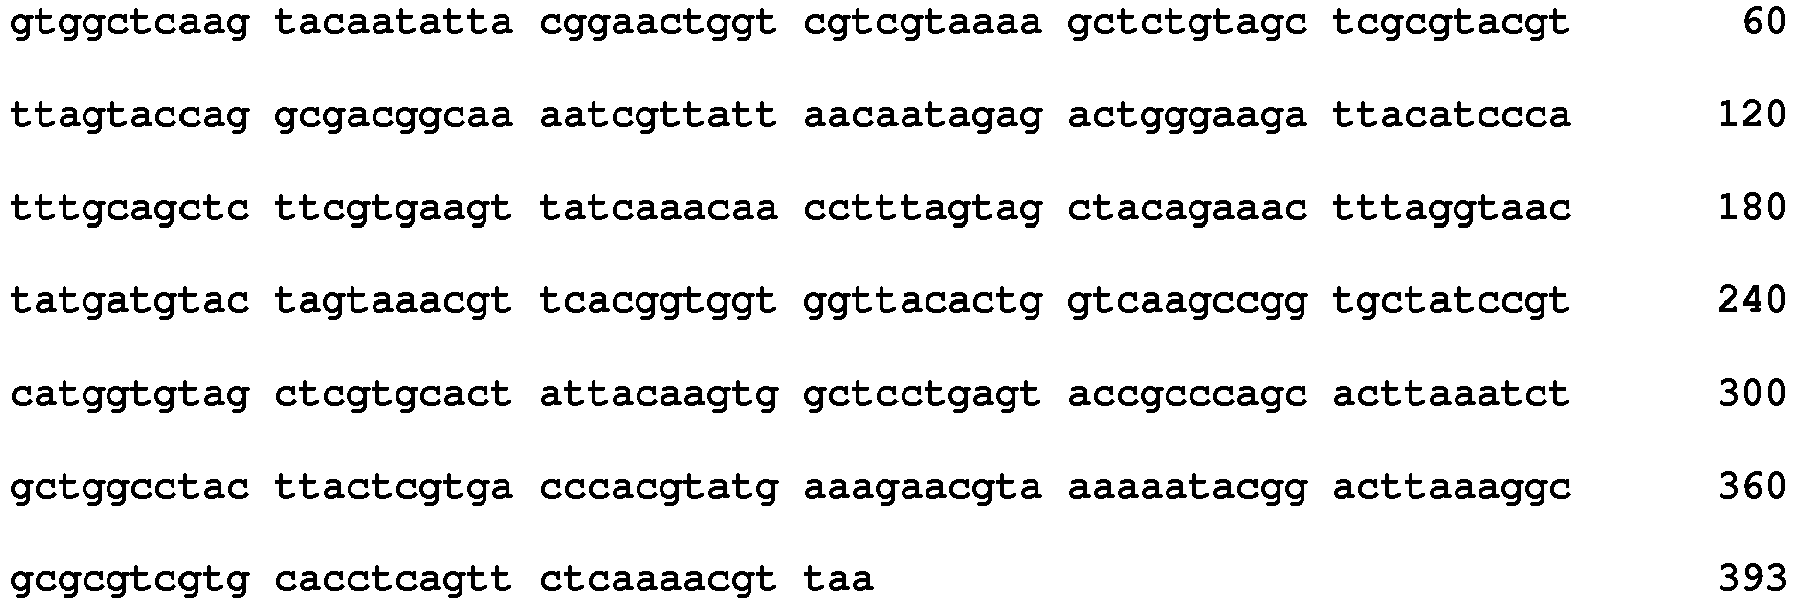
- <210> 255
<211> 246
<212> DNA
<213> Listeria innocua - <400> 255

- <210> 256
<211> 273
<212> DNA
<213> Listeria innocua - <400> 256

- <210> 257
<211> 312
<212> DNA
<213> Listeria ivanovii - <400> 257

- <210> 258
<211> 537
<212> DNA
<213> Listeria ivanovii - <400> 258

- <210> 259
<211> 360
<212> DNA
<213> Listeria ivanovii - <400> 259

- <210> 260
<211> 441
<212> DNA
<213> Listeria ivanovii - <400> 260

- <210> 261
<211> 390
<212> DNA
<213> Listeria ivanovii - <400> 261

- <210> 262
<211> 393
<212> DNA
<213> Listeria ivanovii - <400> 262

- <210> 263
<211> 246
<212> DNA
<213> Listeria ivanovii - <400> 263
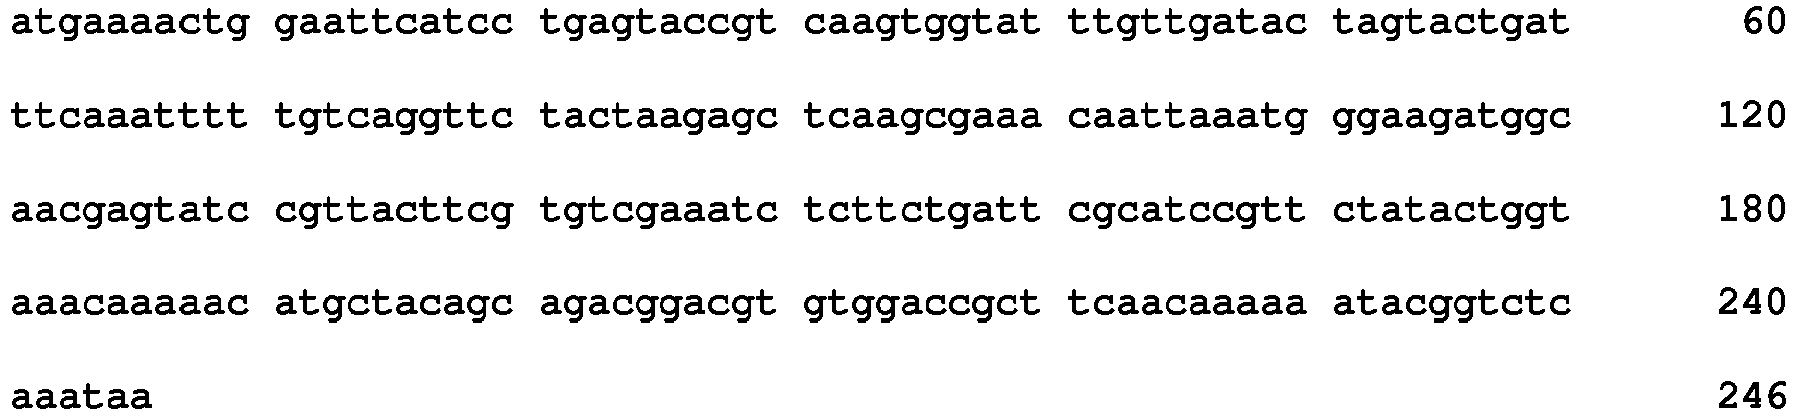
- <210> 264
<211> 273
<212> DNA
<213> Listeria ivanovii - <400> 264

- <210> 265
<211> 312
<212> DNA
<213> Listeria ivanovii - <400> 265

- <210> 266
<211> 537
<212> DNA
<213> Listeria ivanovii - <400> 266

- <210> 267
<211> 360
<212> DNA
<213> Listeria ivanovii - <400> 267

- <210> 268
<211> 441
<212> DNA
<213> Listeria ivanovii - <400> 268

- <210> 269
<211> 390
<212> DNA
<213> Listeria ivanovii - <400> 269

- <210> 270
<211> 393
<212> DNA
<213> Listeria ivanovii - <400> 270

- <210> 271
<211> 246
<212> DNA
<213> Listeria ivanovii - <400> 271

- <210> 272
<211> 273
<212> DNA
<213> Listeria ivanovii - <400> 272

- <210> 273
<211> 312
<212> DNA
<213> Listeria seeligeri - <400> 273

- <210> 274
<211> 537
<212> DNA
<213> Listeria seeligeri - <400> 274

- <210> 275
<211> 360
<212> DNA
<213> Listeria seeligeri - <400> 275

- <210> 276
<211> 441
<212> DNA
<213> Listeria seeligeri - <400> 276

- <210> 277
<211> 390
<212> DNA
<213> Listeria seeligeri - <400> 277

- <210> 278
<211> 393
<212> DNA
<213> Listeria seeligeri - <400> 278

- <210> 279
<211> 246
<212> DNA
<213> Listeria seeligeri - <400> 279

- <210> 280
<211> 273
<212> DNA
<213> Listeria seeligeri - <400> 280

- <210> 281
<211> 312
<212> DNA
<213> Listeria welshimeri - <400> 281

- <210> 282
<211> 537
<212> DNA
<213> Listeria welshimeri - <400> 282

- <210> 283
<211> 360
<212> DNA
<213> Listeria welshimeri - <400> 283

- <210> 284
<211> 441
<212> DNA
<213> Listeria welshimeri - <400> 284

- <210> 285
<211> 390
<212> DNA
<213> Listeria welshimeri - <400> 285

- <210> 286
<211> 393
<212> DNA
<213> Listeria welshimeri - <400> 286

- <210> 287
<211> 246
<212> DNA
<213> Listeria welshimeri - <400> 287

- <210> 288
<211> 273
<212> DNA
<213> Listeria welshimeri - <400> 288
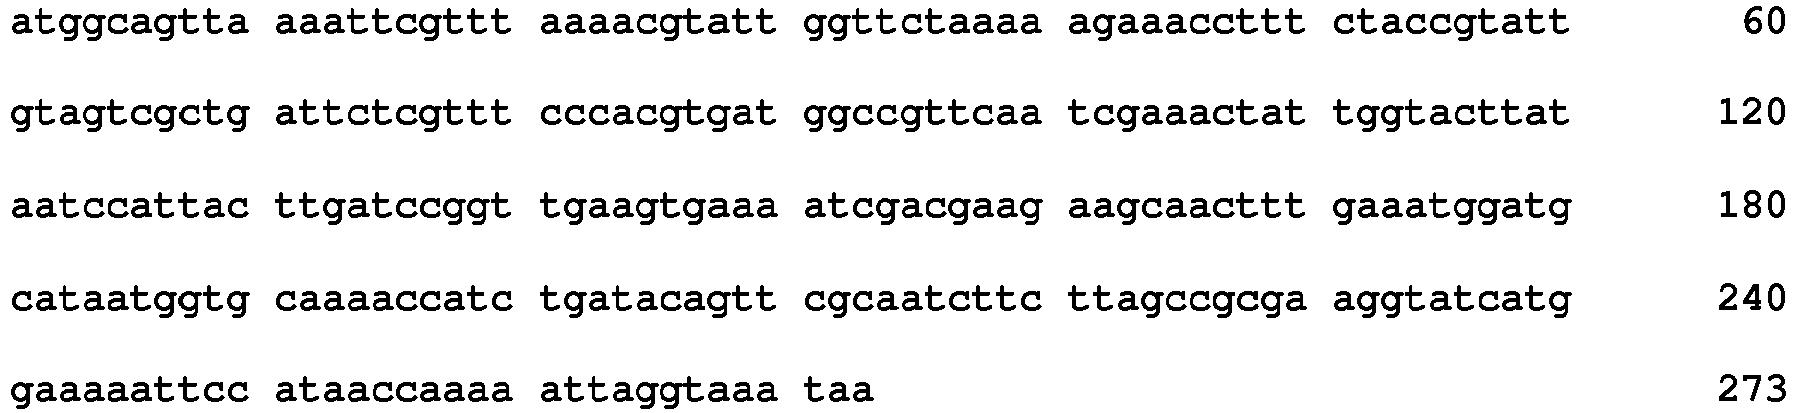
- <210> 289
<211> 321
<212> DNA
<213> Listeria rocourtiae - <400> 289
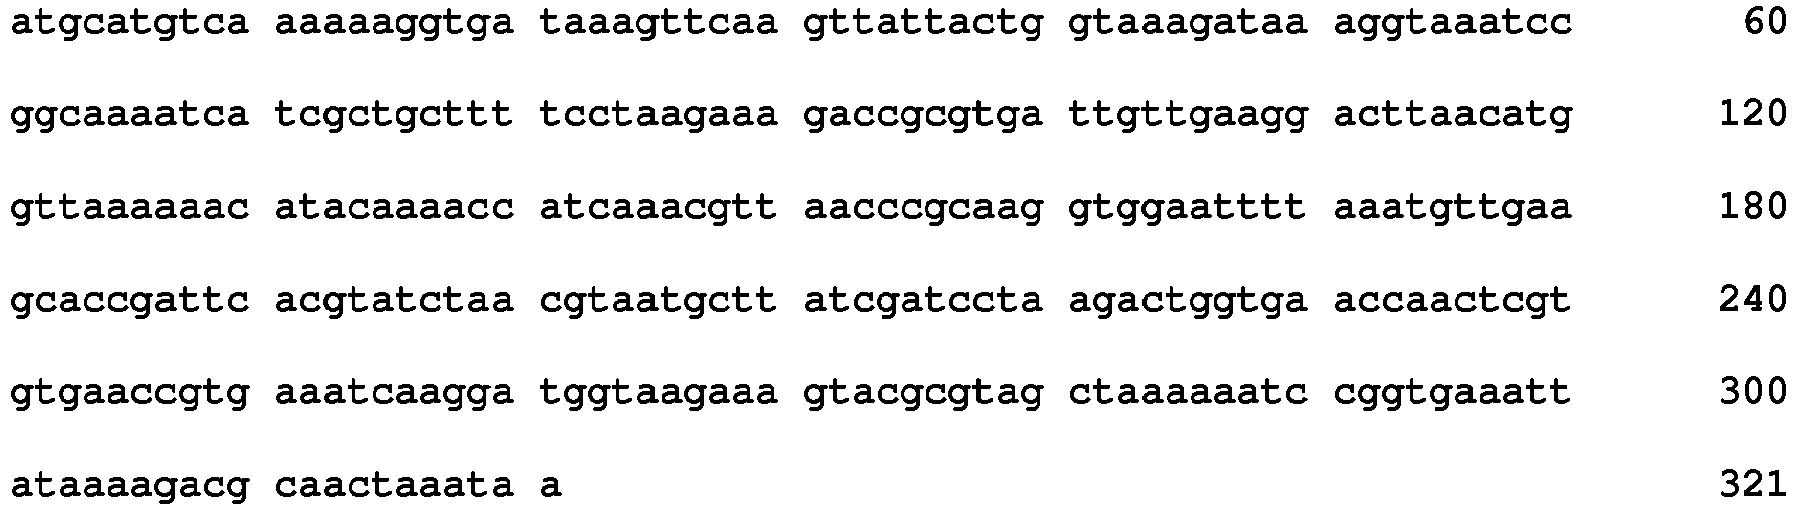
- <210> 290
<211> 537
<212> DNA
<213> Listeria rocourtiae - <400> 290

- <210> 291
<211> 360
<212> DNA
<213> Listeria rocourtiae - <400> 291

- <210> 292
<211> 441
<212> DNA
<213> Listeria rocourtiae - <400> 292


- <210> 293
<211> 390
<212> DNA
<213> Listeria rocourtiae - <400> 293
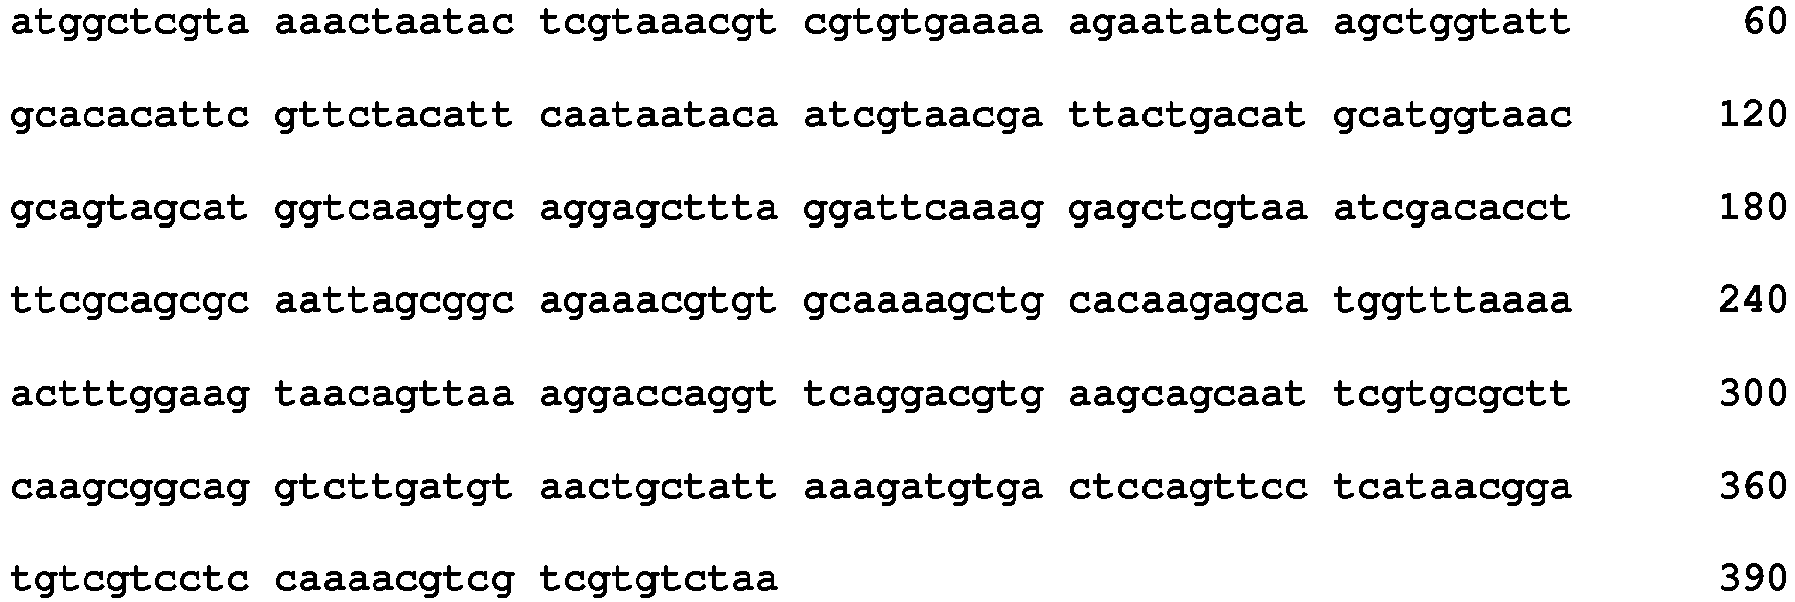
- <210> 294
<211> 393
<212> DNA
<213> Listeria rocourtiae - <400> 294
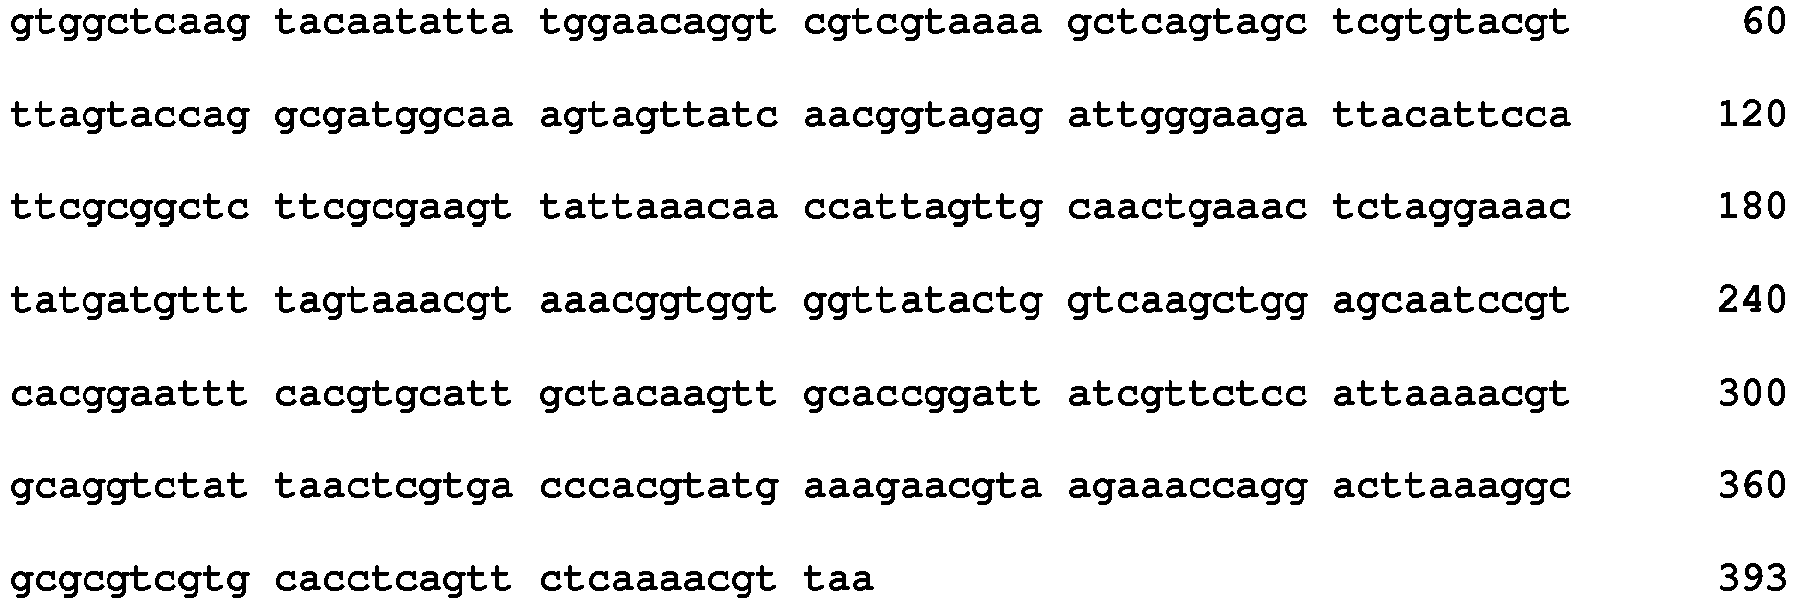
- <210> 295
<211> 246
<212> DNA
<213> Listeria rocourtiae - <400> 295

- <210> 296
<211> 273
<212> DNA
<213> Listeria rocourtiae - <400> 296

- <210> 297
<211> 312
<212> DNA
<213> Listeria grayi - <400> 297

- <210> 298
<211> 537
<212> DNA
<213> Listeria grayi - <400> 298
- <210> 299
<211> 360
<212> DNA
<213> Listeria grayi - <400> 299
- <210> 300
<211> 441
<212> DNA
<213> Listeria grayi - <400> 300

- <210> 301
<211> 390
<212> DNA
<213> Listeria grayi - <400> 301

- <210> 302
<211> 393
<212> DNA
<213> Listeria grayi - <400> 302

- <210> 303
<211> 246
<212> DNA
<213> Listeria grayi - <400> 303

- <210> 304
<211> 273
<212> DNA
<213> Listeria grayi - <400> 304

Claims (6)
- A method for discriminating a microorganism, the method comprising:a) a step of subjecting a sample containing a microorganism to mass spectrometry to obtain a mass spectrum;b) a reading step of reading a mass-to-charge ratio m/z of a peak derived from a marker protein from the mass spectrum; andc) a discrimination step of discriminating which bacterial species of Listeria bacteria the microorganism contained in the sample contains based on the mass-to-charge ratio m/z,wherein
at least one of 8 ribosomal proteins L24, L6, L18, L15, S11, S9, L31, S16 is used as the marker protein, wherein a bacterial species of the Listeria bacteria is one of Listeria monocytogenes, Listeria innocua, Listeria welshimeri, and Listeria ivanovii; and wherein(i) the discrimination step discriminates whether or not Listeria monocytogenes is contained in the microorganism based on at least a mass-to-charge ratio m/z of a peak derived from each of the ribosomal proteins L15, S11, and S9, or a mass-to-charge ratio m/z of a peak derived from each of the ribosomal proteins L24, L6, L18, and S9, or a mass-to-charge ratio m/z of a peak derived from each of the ribosomal proteins S11, S9, L31, and S16, or a mass-to-charge ratio m/z of a peak derived from each of the ribosomal proteins L18, S9, L31, and S16, or a mass-to-charge ratios m/z of a peak derived from each of the ribosomal proteins L18, L15, and S9, or a mass-to-charge ratio m/z of a peak derived from each of the ribosomal proteins L24, L6, S11, and S9;
or(ii) the discrimination step discriminates whether or not Listeria innocua is contained in the microorganism based on at least a mass-to-charge ratio m/z of a peak derived from the ribosomal protein S16 or a mass-to-charge ratio m/z of a peak derived from each of the ribosomal proteins L15 and L31;
or(iii) the discrimination step discriminates whether or not Listeria ivanovii is contained in the microorganism based on at least a mass-to-charge ratio m/z of a peak derived from the ribosomal proteins S9 and L31;
or(iv) the discrimination step discriminates whether or not Listeria ivanovii londiniensis as a subspecies of Listeria ivanovii is contained in the microorganism based on at least a mass-to-charge ratio m/z of a peak derived from each of the ribosomal proteins L18, S9, and L31, or a mass-to-charge ratio m/z of a peak derived from each of the ribosomal proteins L15, S11, and L31, or a mass-to-charge ratios m/z of a peak derived from each of the ribosomal proteins L15, S9, and L31, or a mass-to-charge ratio m/z of a peak derived from each of the ribosomal proteins L18, S11, and L31;
or(v) the discrimination step discriminates whether or not Listeria welshimeri is contained in the microorganism based on at least a mass-to-charge ratio m/z of a peak derived from the ribosomal protein S11 or a mass-to-charge ratio m/z of a peak derived from each of the ribosomal proteins L18 and S9;
or(vi) the discrimination step discriminates which bacterial species of Listeria bacteria the microorganism contained in the sample contains using a cluster analysis in which at least a mass-to-charge ratio m/z of a peak of each of the ribosomal proteins L24, L18, S9, and L31 and a mass-to-charge ratio m/z of a peak of one of the ribosomal proteins L6, L15, and S11, or a mass-to-charge ratio m/z of a peak of each of the ribosomal proteins L24, L18, S9, and S16 and a mass-to-charge ratio m/z of a peak of one of the ribosomal proteins L6, L15, and S11 are used as indexes. - The method for discriminating a microorganism according to claim 1 part (i), wherein when the microorganism is discriminated as containing Listeria monocytogenes, the discrimination step further discriminates a lineage of Listeria monocytogenes based on a mass-to-charge ratio m/z of a peak derived from the ribosomal protein S9 and a mass-to-charge ratio m/z of a peak derived from at least one of the ribosomal proteins L24 and L6.
- The method for discriminating a microorganism according to claim 1 part (ii), wherein when the microorganism is discriminated as containing Listeria innocua, the discrimination step further determines a strain of Listeria innocua based on at least a mass-to-charge ratio m/z of a peak derived from the ribosomal protein L18.
- The method for discriminating a microorganism according to claim 1 part (vi), wherein the discrimination step discriminates which bacterial species of Listeria bacteria the microorganism contained in the sample contains using a cluster analysis in which the mass-to-charge ratio m/z of the peak derived from each of the 8 ribosomal proteins L24, L6, L18, L15, S11, S9, L31, and S16 is used as an index.
- The method for discriminating a microorganism according to claim 1 part (vi) or claim 4, further comprising a step of creating a dendrogram representing a discrimination result by the cluster analysis.
- A computer program comprising instructions which, when the program is executed by a computer, cause the computer to carry out:a reading step of reading a mass-to-charge ratio m/z of a peak derived from a marker protein from a mass spectrum obtainable by subjecting a sample containing a microorganism to mass spectrometry; anda discrimination step of discriminating which bacterial species of Listeria bacteria the microorganism contained in the sample contains based on the mass-to-charge ratio m/z,wherein at least one of 8 ribosomal proteins L24, L6, L18, L15, S11, S9, L31, S16 is used as the marker protein, wherein a bacterial species of the Listeria bacteria is one of Listeria monocytogenes, Listeria innocua, Listeria welshimeri, and Listeria ivanovii; and wherein(i) the discrimination step discriminates whether or not Listeria monocytogenes is contained in the microorganism based on at least a mass-to-charge ratio m/z of a peak derived from each of the ribosomal proteins L15, S11, and S9, or a mass-to-charge ratio m/z of a peak derived from each of the ribosomal proteins L24, L6, L18, and S9, or a mass-to-charge ratio m/z of a peak derived from each of the ribosomal proteins S11, S9, L31, and S16, or a mass-to-charge ratio m/z of a peak derived from each of the ribosomal proteins L18, S9, L31, and S16, or a mass-to-charge ratios m/z of a peak derived from each of the ribosomal proteins L18, L15, and S9, or a mass-to-charge ratio m/z of a peak derived from each of the ribosomal proteins L24, L6, S11, and S9;
or(ii) the discrimination step discriminates whether or not Listeria innocua is contained in the microorganism based on at least a mass-to-charge ratio m/z of a peak derived from the ribosomal protein S16 or a mass-to-charge ratio m/z of a peak derived from each of the ribosomal proteins L15 and L31;
or(iii) the discrimination step discriminates whether or not Listeria ivanovii is contained in the microorganism based on at least a mass-to-charge ratio m/z of a peak derived from the ribosomal proteins S9 and L31;
or(iv) the discrimination step discriminates whether or not Listeria ivanovii londiniensis as a subspecies of Listeria ivanovii is contained in the microorganism based on at least a mass-to-charge ratio m/z of a peak derived from each of the ribosomal proteins L18, S9, and L31, or a mass-to-charge ratio m/z of a peak derived from each of the ribosomal proteins L15, S11, and L31, or a mass-to-charge ratios m/z of a peak derived from each of the ribosomal proteins L15, S9, and L31, or a mass-to-charge ratio m/z of a peak derived from each of the ribosomal proteins L18, S11, and L31;
or(v) the discrimination step discriminates whether or not Listeria welshimeri is contained in the microorganism based on at least a mass-to-charge ratio m/z of a peak derived from the ribosomal protein S11 or a mass-to-charge ratio m/z of a peak derived from each of the ribosomal proteins L18 and S9;
or(vi) the discrimination step discriminates which bacterial species of Listeria bacteria the microorganism contained in the sample contains using a cluster analysis in which at least a mass-to-charge ratio m/z of a peak of each of the ribosomal proteins L24, L18, S9, and L31 and a mass-to-charge ratio m/z of a peak of one of the ribosomal proteins L6, L15, and S11, or a mass-to-charge ratio m/z of a peak of each of the ribosomal proteins L24, L18, S9, and S16 and a mass-to-charge ratio m/z of a peak of one of the ribosomal proteins L6, L15, and S11 are used as indexes.
Applications Claiming Priority (1)
| Application Number | Priority Date | Filing Date | Title |
|---|---|---|---|
| PCT/JP2016/060868 WO2017168743A1 (en) | 2016-03-31 | 2016-03-31 | Microorganism identification method |
Publications (4)
| Publication Number | Publication Date |
|---|---|
| EP3438276A1 EP3438276A1 (en) | 2019-02-06 |
| EP3438276A4 EP3438276A4 (en) | 2019-12-25 |
| EP3438276B1 EP3438276B1 (en) | 2021-05-12 |
| EP3438276B2 true EP3438276B2 (en) | 2024-01-17 |
Family
ID=59963780
Family Applications (1)
| Application Number | Title | Priority Date | Filing Date |
|---|---|---|---|
| EP16896960.8A Active EP3438276B2 (en) | 2016-03-31 | 2016-03-31 | Microorganism identification method |
Country Status (5)
| Country | Link |
|---|---|
| US (2) | US11561228B2 (en) |
| EP (1) | EP3438276B2 (en) |
| JP (1) | JP6709434B2 (en) |
| CN (1) | CN109154018A (en) |
| WO (1) | WO2017168743A1 (en) |
Families Citing this family (7)
| Publication number | Priority date | Publication date | Assignee | Title |
|---|---|---|---|---|
| JP7079429B2 (en) * | 2019-03-22 | 2022-06-02 | 株式会社島津製作所 | How to identify microorganisms |
| CN110218805B (en) * | 2019-06-11 | 2022-07-05 | 扬州大学 | Listeria monocytogenes serotype 4h multiplex PCR detection kit |
| JP7334549B2 (en) * | 2019-09-06 | 2023-08-29 | 株式会社島津製作所 | Microorganism discrimination method, microorganism discrimination system, and microorganism discrimination program |
| JP7302524B2 (en) * | 2020-04-23 | 2023-07-04 | 株式会社島津製作所 | Microbial analysis method |
| CN115698698A (en) * | 2020-06-02 | 2023-02-03 | 株式会社岛津制作所 | Method for determining marker for identifying microorganism |
| CN113504290B (en) * | 2021-08-06 | 2022-10-14 | 河北省食品检验研究院 | Listeria typing method based on time-of-flight mass spectrometry |
| WO2023204008A1 (en) * | 2022-04-21 | 2023-10-26 | 株式会社島津製作所 | Method and apparatus for constructing database for microbial identification |
Citations (1)
| Publication number | Priority date | Publication date | Assignee | Title |
|---|---|---|---|---|
| JP2007316063A (en) † | 2006-04-28 | 2007-12-06 | National Institute Of Advanced Industrial & Technology | Method and device for quickly identifying cell |
Family Cites Families (5)
| Publication number | Priority date | Publication date | Assignee | Title |
|---|---|---|---|---|
| US5134063A (en) * | 1990-07-06 | 1992-07-28 | Biolog, Inc. | Methods for detection, identification and specification of listerias |
| JP5565991B2 (en) | 2004-12-15 | 2014-08-06 | 株式会社島津製作所 | Microbe species estimation system and method |
| CN102253111A (en) * | 2011-06-09 | 2011-11-23 | 曹际娟 | MALDI-TOF MS (Matrix-assisted Laser Desorption/Ionization Time of Flight Mass Spectrometry)-assisted identification method for listeria monocytogenes |
| JP5750676B2 (en) | 2011-10-18 | 2015-07-22 | 株式会社島津製作所 | Cell identification device and program |
| JP6238069B2 (en) | 2014-03-20 | 2017-11-29 | 株式会社島津製作所 | Microbial identification method |
-
2016
- 2016-03-31 WO PCT/JP2016/060868 patent/WO2017168743A1/en active Application Filing
- 2016-03-31 EP EP16896960.8A patent/EP3438276B2/en active Active
- 2016-03-31 CN CN201680084038.9A patent/CN109154018A/en active Pending
- 2016-03-31 JP JP2018508331A patent/JP6709434B2/en active Active
- 2016-03-31 US US16/089,922 patent/US11561228B2/en active Active
-
2022
- 2022-11-28 US US18/059,404 patent/US20230213528A1/en active Pending
Patent Citations (1)
| Publication number | Priority date | Publication date | Assignee | Title |
|---|---|---|---|---|
| JP2007316063A (en) † | 2006-04-28 | 2007-12-06 | National Institute Of Advanced Industrial & Technology | Method and device for quickly identifying cell |
Non-Patent Citations (4)
| Title |
|---|
| P-R Hsueh et al (2014} J. Clin. Microbiol. 52(7), p. 2371-2379 † |
| S Jadhav (2013) Ph D Thesis; Detection, subtyping and control of Listeria monocytogenes in food processing environments † |
| S. B. BARBUDDHE ET AL: "Rapid Identification and Typing of Listeria Species by Matrix-Assisted Laser Desorption Ionization-Time of Flight Mass Spectrometry", APPLIED AND ENVIRONMENTAL MICROBIOLOGY, vol. 74, no. 17, 1 September 2008 (2008-09-01), pages 5402 - 5407 † |
| TAMURA HIROTO ET AL: "Novel Accurate Bacterial Discrimination by MALDI-Time-of-Flight MS Based on Ribosomal Proteins Coding inS10-spc-alphaOperon at Strain LevelS10-GERMS", JOURNAL OF THE AMERICAN SOCIETY FOR MASS SPECTROMETRY, vol. 24, no. 8, 18 May 2013 (2013-05-18), pages 1185 - 1193 † |
Also Published As
| Publication number | Publication date |
|---|---|
| WO2017168743A1 (en) | 2017-10-05 |
| JP6709434B2 (en) | 2020-06-17 |
| JPWO2017168743A1 (en) | 2019-03-14 |
| EP3438276B1 (en) | 2021-05-12 |
| US20190056407A1 (en) | 2019-02-21 |
| US11561228B2 (en) | 2023-01-24 |
| CN109154018A (en) | 2019-01-04 |
| US20230213528A1 (en) | 2023-07-06 |
| EP3438276A4 (en) | 2019-12-25 |
| EP3438276A1 (en) | 2019-02-06 |
Similar Documents
| Publication | Publication Date | Title |
|---|---|---|
| US20230213528A1 (en) | Method for discriminating a microorganism | |
| US11137406B2 (en) | Method for discriminating microorganism | |
| JP6238069B2 (en) | Microbial identification method | |
| Seibold et al. | Identification of Francisella tularensis by whole-cell matrix-assisted laser desorption ionization-time of flight mass spectrometry: fast, reliable, robust, and cost-effective differentiation on species and subspecies levels | |
| Kallow et al. | MALDI‐TOF MS for microbial identification: Years of experimental development to an established protocol | |
| EP3438655B1 (en) | Microorganism identification method | |
| Xiao et al. | Novel strategy for typing Mycoplasma pneumoniae isolates by use of matrix-assisted laser desorption ionization–time of flight mass spectrometry coupled with ClinProTools | |
| Dekio et al. | Correlation between phylogroups and intracellular proteomes of Propionibacterium acnes and differences in the protein expression profiles between anaerobically and aerobically grown cells | |
| Godmer et al. | Revisiting species identification within the Enterobacter cloacae complex by matrix-assisted laser desorption ionization–time of flight mass spectrometry | |
| Hong et al. | Molecular markers reveal epidemiological patterns and evolutionary histories of the human pathogenic Cryptococcus | |
| Huang et al. | Establishment and application of an analytical in-house database (IHDB) for rapid discrimination of Bacillus subtilis group (BSG) using whole-cell MALDI-TOF MS technology | |
| Xiao et al. | High natural variability bacteria identification and typing: Helicobacter pylori analysis based on peptide mass fingerprinting | |
| EP3438274B1 (en) | Microorganism identification method | |
| US11150249B2 (en) | Microorganism identification method | |
| Svobodová et al. | Novel method for reliable identification of Siccibacter and Franconibacter strains: from “Pseudo-Cronobacter” to new Enterobacteriaceae genera | |
| Velichko et al. | Classification and identification tasks in microbiology: Mass spectrometric methods coming to the aid | |
| Misra et al. | Tandem Mass Spectrometry Analysis as an Approach to Delineate Genetically Related Taxa | |
| Yi et al. | Introduction of Mass Spectrometry-based Microorganism Detection | |
| CN117174181A (en) | Analysis method of pan genome of Rameyer bacillus | |
| Dekio et al. | Research Article Correlation between Phylogroups and Intracellular Proteomes of Propionibacterium acnes and Differences in the Protein Expression Profiles between Anaerobically and Aerobically Grown Cells | |
| Rose | A call for a statewide bioinformatics institute | |
| Fox et al. | Proteomics: universal biomarkers for inherited and infectious diseases | |
| Deshpande | Sequence Information Derived from Proteins or Nucleic Acids |
Legal Events
| Date | Code | Title | Description |
|---|---|---|---|
| STAA | Information on the status of an ep patent application or granted ep patent |
Free format text: STATUS: THE INTERNATIONAL PUBLICATION HAS BEEN MADE |
|
| PUAI | Public reference made under article 153(3) epc to a published international application that has entered the european phase |
Free format text: ORIGINAL CODE: 0009012 |
|
| STAA | Information on the status of an ep patent application or granted ep patent |
Free format text: STATUS: REQUEST FOR EXAMINATION WAS MADE |
|
| 17P | Request for examination filed |
Effective date: 20181026 |
|
| AK | Designated contracting states |
Kind code of ref document: A1 Designated state(s): AL AT BE BG CH CY CZ DE DK EE ES FI FR GB GR HR HU IE IS IT LI LT LU LV MC MK MT NL NO PL PT RO RS SE SI SK SM TR |
|
| AX | Request for extension of the european patent |
Extension state: BA ME |
|
| DAV | Request for validation of the european patent (deleted) | ||
| DAX | Request for extension of the european patent (deleted) | ||
| A4 | Supplementary search report drawn up and despatched |
Effective date: 20191125 |
|
| RIC1 | Information provided on ipc code assigned before grant |
Ipc: C12Q 1/04 20060101AFI20191119BHEP Ipc: C12N 15/09 20060101ALI20191119BHEP Ipc: G01N 33/569 20060101ALI20191119BHEP Ipc: G01N 27/62 20060101ALI20191119BHEP |
|
| RIC1 | Information provided on ipc code assigned before grant |
Ipc: G01N 27/62 20060101ALI20200715BHEP Ipc: C12Q 1/04 20060101AFI20200715BHEP Ipc: C12N 15/09 20060101ALI20200715BHEP Ipc: G01N 33/569 20060101ALI20200715BHEP |
|
| GRAP | Despatch of communication of intention to grant a patent |
Free format text: ORIGINAL CODE: EPIDOSNIGR1 |
|
| STAA | Information on the status of an ep patent application or granted ep patent |
Free format text: STATUS: GRANT OF PATENT IS INTENDED |
|
| GRAJ | Information related to disapproval of communication of intention to grant by the applicant or resumption of examination proceedings by the epo deleted |
Free format text: ORIGINAL CODE: EPIDOSDIGR1 |
|
| STAA | Information on the status of an ep patent application or granted ep patent |
Free format text: STATUS: REQUEST FOR EXAMINATION WAS MADE |
|
| INTG | Intention to grant announced |
Effective date: 20200821 |
|
| GRAP | Despatch of communication of intention to grant a patent |
Free format text: ORIGINAL CODE: EPIDOSNIGR1 |
|
| INTG | Intention to grant announced |
Effective date: 20200824 |
|
| STAA | Information on the status of an ep patent application or granted ep patent |
Free format text: STATUS: GRANT OF PATENT IS INTENDED |
|
| INTC | Intention to grant announced (deleted) | ||
| INTG | Intention to grant announced |
Effective date: 20200924 |
|
| GRAJ | Information related to disapproval of communication of intention to grant by the applicant or resumption of examination proceedings by the epo deleted |
Free format text: ORIGINAL CODE: EPIDOSDIGR1 |
|
| STAA | Information on the status of an ep patent application or granted ep patent |
Free format text: STATUS: REQUEST FOR EXAMINATION WAS MADE |
|
| GRAP | Despatch of communication of intention to grant a patent |
Free format text: ORIGINAL CODE: EPIDOSNIGR1 |
|
| STAA | Information on the status of an ep patent application or granted ep patent |
Free format text: STATUS: GRANT OF PATENT IS INTENDED |
|
| GRAJ | Information related to disapproval of communication of intention to grant by the applicant or resumption of examination proceedings by the epo deleted |
Free format text: ORIGINAL CODE: EPIDOSDIGR1 |
|
| GRAP | Despatch of communication of intention to grant a patent |
Free format text: ORIGINAL CODE: EPIDOSNIGR1 |
|
| STAA | Information on the status of an ep patent application or granted ep patent |
Free format text: STATUS: REQUEST FOR EXAMINATION WAS MADE |
|
| GRAJ | Information related to disapproval of communication of intention to grant by the applicant or resumption of examination proceedings by the epo deleted |
Free format text: ORIGINAL CODE: EPIDOSDIGR1 |
|
| INTC | Intention to grant announced (deleted) | ||
| INTG | Intention to grant announced |
Effective date: 20201221 |
|
| INTC | Intention to grant announced (deleted) | ||
| GRAP | Despatch of communication of intention to grant a patent |
Free format text: ORIGINAL CODE: EPIDOSNIGR1 |
|
| STAA | Information on the status of an ep patent application or granted ep patent |
Free format text: STATUS: GRANT OF PATENT IS INTENDED |
|
| INTG | Intention to grant announced |
Effective date: 20210202 |
|
| GRAS | Grant fee paid |
Free format text: ORIGINAL CODE: EPIDOSNIGR3 |
|
| GRAA | (expected) grant |
Free format text: ORIGINAL CODE: 0009210 |
|
| STAA | Information on the status of an ep patent application or granted ep patent |
Free format text: STATUS: THE PATENT HAS BEEN GRANTED |
|
| AK | Designated contracting states |
Kind code of ref document: B1 Designated state(s): AL AT BE BG CH CY CZ DE DK EE ES FI FR GB GR HR HU IE IS IT LI LT LU LV MC MK MT NL NO PL PT RO RS SE SI SK SM TR |
|
| REG | Reference to a national code |
Ref country code: GB Ref legal event code: FG4D |
|
| REG | Reference to a national code |
Ref country code: CH Ref legal event code: EP |
|
| REG | Reference to a national code |
Ref country code: DE Ref legal event code: R096 Ref document number: 602016057911 Country of ref document: DE |
|
| REG | Reference to a national code |
Ref country code: IE Ref legal event code: FG4D |
|
| REG | Reference to a national code |
Ref country code: AT Ref legal event code: REF Ref document number: 1392210 Country of ref document: AT Kind code of ref document: T Effective date: 20210615 |
|
| REG | Reference to a national code |
Ref country code: LT Ref legal event code: MG9D |
|
| REG | Reference to a national code |
Ref country code: AT Ref legal event code: MK05 Ref document number: 1392210 Country of ref document: AT Kind code of ref document: T Effective date: 20210512 |
|
| REG | Reference to a national code |
Ref country code: NL Ref legal event code: MP Effective date: 20210512 |
|
| PG25 | Lapsed in a contracting state [announced via postgrant information from national office to epo] |
Ref country code: HR Free format text: LAPSE BECAUSE OF FAILURE TO SUBMIT A TRANSLATION OF THE DESCRIPTION OR TO PAY THE FEE WITHIN THE PRESCRIBED TIME-LIMIT Effective date: 20210512 Ref country code: BG Free format text: LAPSE BECAUSE OF FAILURE TO SUBMIT A TRANSLATION OF THE DESCRIPTION OR TO PAY THE FEE WITHIN THE PRESCRIBED TIME-LIMIT Effective date: 20210812 Ref country code: AT Free format text: LAPSE BECAUSE OF FAILURE TO SUBMIT A TRANSLATION OF THE DESCRIPTION OR TO PAY THE FEE WITHIN THE PRESCRIBED TIME-LIMIT Effective date: 20210512 Ref country code: LT Free format text: LAPSE BECAUSE OF FAILURE TO SUBMIT A TRANSLATION OF THE DESCRIPTION OR TO PAY THE FEE WITHIN THE PRESCRIBED TIME-LIMIT Effective date: 20210512 Ref country code: FI Free format text: LAPSE BECAUSE OF FAILURE TO SUBMIT A TRANSLATION OF THE DESCRIPTION OR TO PAY THE FEE WITHIN THE PRESCRIBED TIME-LIMIT Effective date: 20210512 |
|
| PG25 | Lapsed in a contracting state [announced via postgrant information from national office to epo] |
Ref country code: LV Free format text: LAPSE BECAUSE OF FAILURE TO SUBMIT A TRANSLATION OF THE DESCRIPTION OR TO PAY THE FEE WITHIN THE PRESCRIBED TIME-LIMIT Effective date: 20210512 Ref country code: GR Free format text: LAPSE BECAUSE OF FAILURE TO SUBMIT A TRANSLATION OF THE DESCRIPTION OR TO PAY THE FEE WITHIN THE PRESCRIBED TIME-LIMIT Effective date: 20210813 Ref country code: IS Free format text: LAPSE BECAUSE OF FAILURE TO SUBMIT A TRANSLATION OF THE DESCRIPTION OR TO PAY THE FEE WITHIN THE PRESCRIBED TIME-LIMIT Effective date: 20210912 Ref country code: SE Free format text: LAPSE BECAUSE OF FAILURE TO SUBMIT A TRANSLATION OF THE DESCRIPTION OR TO PAY THE FEE WITHIN THE PRESCRIBED TIME-LIMIT Effective date: 20210512 Ref country code: RS Free format text: LAPSE BECAUSE OF FAILURE TO SUBMIT A TRANSLATION OF THE DESCRIPTION OR TO PAY THE FEE WITHIN THE PRESCRIBED TIME-LIMIT Effective date: 20210512 Ref country code: PT Free format text: LAPSE BECAUSE OF FAILURE TO SUBMIT A TRANSLATION OF THE DESCRIPTION OR TO PAY THE FEE WITHIN THE PRESCRIBED TIME-LIMIT Effective date: 20210913 Ref country code: PL Free format text: LAPSE BECAUSE OF FAILURE TO SUBMIT A TRANSLATION OF THE DESCRIPTION OR TO PAY THE FEE WITHIN THE PRESCRIBED TIME-LIMIT Effective date: 20210512 Ref country code: NO Free format text: LAPSE BECAUSE OF FAILURE TO SUBMIT A TRANSLATION OF THE DESCRIPTION OR TO PAY THE FEE WITHIN THE PRESCRIBED TIME-LIMIT Effective date: 20210812 |
|
| PG25 | Lapsed in a contracting state [announced via postgrant information from national office to epo] |
Ref country code: NL Free format text: LAPSE BECAUSE OF FAILURE TO SUBMIT A TRANSLATION OF THE DESCRIPTION OR TO PAY THE FEE WITHIN THE PRESCRIBED TIME-LIMIT Effective date: 20210512 |
|
| PG25 | Lapsed in a contracting state [announced via postgrant information from national office to epo] |
Ref country code: SM Free format text: LAPSE BECAUSE OF FAILURE TO SUBMIT A TRANSLATION OF THE DESCRIPTION OR TO PAY THE FEE WITHIN THE PRESCRIBED TIME-LIMIT Effective date: 20210512 Ref country code: SK Free format text: LAPSE BECAUSE OF FAILURE TO SUBMIT A TRANSLATION OF THE DESCRIPTION OR TO PAY THE FEE WITHIN THE PRESCRIBED TIME-LIMIT Effective date: 20210512 Ref country code: EE Free format text: LAPSE BECAUSE OF FAILURE TO SUBMIT A TRANSLATION OF THE DESCRIPTION OR TO PAY THE FEE WITHIN THE PRESCRIBED TIME-LIMIT Effective date: 20210512 Ref country code: DK Free format text: LAPSE BECAUSE OF FAILURE TO SUBMIT A TRANSLATION OF THE DESCRIPTION OR TO PAY THE FEE WITHIN THE PRESCRIBED TIME-LIMIT Effective date: 20210512 Ref country code: CZ Free format text: LAPSE BECAUSE OF FAILURE TO SUBMIT A TRANSLATION OF THE DESCRIPTION OR TO PAY THE FEE WITHIN THE PRESCRIBED TIME-LIMIT Effective date: 20210512 Ref country code: RO Free format text: LAPSE BECAUSE OF FAILURE TO SUBMIT A TRANSLATION OF THE DESCRIPTION OR TO PAY THE FEE WITHIN THE PRESCRIBED TIME-LIMIT Effective date: 20210512 Ref country code: ES Free format text: LAPSE BECAUSE OF FAILURE TO SUBMIT A TRANSLATION OF THE DESCRIPTION OR TO PAY THE FEE WITHIN THE PRESCRIBED TIME-LIMIT Effective date: 20210512 |
|
| REG | Reference to a national code |
Ref country code: DE Ref legal event code: R026 Ref document number: 602016057911 Country of ref document: DE |
|
| PLBI | Opposition filed |
Free format text: ORIGINAL CODE: 0009260 |
|
| PLAX | Notice of opposition and request to file observation + time limit sent |
Free format text: ORIGINAL CODE: EPIDOSNOBS2 |
|
| 26 | Opposition filed |
Opponent name: BIOMERIEUX Effective date: 20220214 |
|
| PG25 | Lapsed in a contracting state [announced via postgrant information from national office to epo] |
Ref country code: IS Free format text: LAPSE BECAUSE OF FAILURE TO SUBMIT A TRANSLATION OF THE DESCRIPTION OR TO PAY THE FEE WITHIN THE PRESCRIBED TIME-LIMIT Effective date: 20210912 Ref country code: AL Free format text: LAPSE BECAUSE OF FAILURE TO SUBMIT A TRANSLATION OF THE DESCRIPTION OR TO PAY THE FEE WITHIN THE PRESCRIBED TIME-LIMIT Effective date: 20210512 |
|
| PLBB | Reply of patent proprietor to notice(s) of opposition received |
Free format text: ORIGINAL CODE: EPIDOSNOBS3 |
|
| PG25 | Lapsed in a contracting state [announced via postgrant information from national office to epo] |
Ref country code: IT Free format text: LAPSE BECAUSE OF FAILURE TO SUBMIT A TRANSLATION OF THE DESCRIPTION OR TO PAY THE FEE WITHIN THE PRESCRIBED TIME-LIMIT Effective date: 20210512 |
|
| PG25 | Lapsed in a contracting state [announced via postgrant information from national office to epo] |
Ref country code: MC Free format text: LAPSE BECAUSE OF FAILURE TO SUBMIT A TRANSLATION OF THE DESCRIPTION OR TO PAY THE FEE WITHIN THE PRESCRIBED TIME-LIMIT Effective date: 20210512 |
|
| REG | Reference to a national code |
Ref country code: CH Ref legal event code: PL |
|
| GBPC | Gb: european patent ceased through non-payment of renewal fee |
Effective date: 20220331 |
|
| REG | Reference to a national code |
Ref country code: BE Ref legal event code: MM Effective date: 20220331 |
|
| PG25 | Lapsed in a contracting state [announced via postgrant information from national office to epo] |
Ref country code: LU Free format text: LAPSE BECAUSE OF NON-PAYMENT OF DUE FEES Effective date: 20220331 Ref country code: LI Free format text: LAPSE BECAUSE OF NON-PAYMENT OF DUE FEES Effective date: 20220331 Ref country code: IE Free format text: LAPSE BECAUSE OF NON-PAYMENT OF DUE FEES Effective date: 20220331 Ref country code: GB Free format text: LAPSE BECAUSE OF NON-PAYMENT OF DUE FEES Effective date: 20220331 Ref country code: CH Free format text: LAPSE BECAUSE OF NON-PAYMENT OF DUE FEES Effective date: 20220331 |
|
| PG25 | Lapsed in a contracting state [announced via postgrant information from national office to epo] |
Ref country code: BE Free format text: LAPSE BECAUSE OF NON-PAYMENT OF DUE FEES Effective date: 20220331 |
|
| PGFP | Annual fee paid to national office [announced via postgrant information from national office to epo] |
Ref country code: FR Payment date: 20230208 Year of fee payment: 8 |
|
| PGFP | Annual fee paid to national office [announced via postgrant information from national office to epo] |
Ref country code: DE Payment date: 20230131 Year of fee payment: 8 |
|
| PUAH | Patent maintained in amended form |
Free format text: ORIGINAL CODE: 0009272 |
|
| STAA | Information on the status of an ep patent application or granted ep patent |
Free format text: STATUS: PATENT MAINTAINED AS AMENDED |
|
| 27A | Patent maintained in amended form |
Effective date: 20240117 |
|
| AK | Designated contracting states |
Kind code of ref document: B2 Designated state(s): AL AT BE BG CH CY CZ DE DK EE ES FI FR GB GR HR HU IE IS IT LI LT LU LV MC MK MT NL NO PL PT RO RS SE SI SK SM TR |
|
| REG | Reference to a national code |
Ref country code: DE Ref legal event code: R102 Ref document number: 602016057911 Country of ref document: DE |
|
| PG25 | Lapsed in a contracting state [announced via postgrant information from national office to epo] |
Ref country code: HU Free format text: LAPSE BECAUSE OF FAILURE TO SUBMIT A TRANSLATION OF THE DESCRIPTION OR TO PAY THE FEE WITHIN THE PRESCRIBED TIME-LIMIT; INVALID AB INITIO Effective date: 20160331 |