EP3414704B1 - Method for quantitative measurement of a biomarker by in situ immunofluorescence and uses thereof - Google Patents
Method for quantitative measurement of a biomarker by in situ immunofluorescence and uses thereof Download PDFInfo
- Publication number
- EP3414704B1 EP3414704B1 EP17705060.6A EP17705060A EP3414704B1 EP 3414704 B1 EP3414704 B1 EP 3414704B1 EP 17705060 A EP17705060 A EP 17705060A EP 3414704 B1 EP3414704 B1 EP 3414704B1
- Authority
- EP
- European Patent Office
- Prior art keywords
- probe
- sample
- target
- screening
- values
- Prior art date
- Legal status (The legal status is an assumption and is not a legal conclusion. Google has not performed a legal analysis and makes no representation as to the accuracy of the status listed.)
- Active
Links
- 238000000034 method Methods 0.000 title claims description 97
- 238000010166 immunofluorescence Methods 0.000 title claims description 35
- 238000011065 in-situ storage Methods 0.000 title claims description 7
- 238000005259 measurement Methods 0.000 title claims description 6
- 239000000090 biomarker Substances 0.000 title description 14
- 239000000523 sample Substances 0.000 claims description 433
- 238000012216 screening Methods 0.000 claims description 143
- 102100030086 Receptor tyrosine-protein kinase erbB-2 Human genes 0.000 claims description 102
- 101001012157 Homo sapiens Receptor tyrosine-protein kinase erbB-2 Proteins 0.000 claims description 99
- 102000011782 Keratins Human genes 0.000 claims description 71
- 108010076876 Keratins Proteins 0.000 claims description 71
- 238000011534 incubation Methods 0.000 claims description 48
- 239000003550 marker Substances 0.000 claims description 47
- 238000003384 imaging method Methods 0.000 claims description 45
- 238000004458 analytical method Methods 0.000 claims description 42
- 206010028980 Neoplasm Diseases 0.000 claims description 27
- 238000010186 staining Methods 0.000 claims description 27
- FWBHETKCLVMNFS-UHFFFAOYSA-N 4',6-Diamino-2-phenylindol Chemical compound C1=CC(C(=N)N)=CC=C1C1=CC2=CC=C(C(N)=N)C=C2N1 FWBHETKCLVMNFS-UHFFFAOYSA-N 0.000 claims description 24
- 238000011156 evaluation Methods 0.000 claims description 22
- 210000004027 cell Anatomy 0.000 claims description 21
- 210000002919 epithelial cell Anatomy 0.000 claims description 20
- 238000012545 processing Methods 0.000 claims description 20
- 201000011510 cancer Diseases 0.000 claims description 19
- 239000013641 positive control Substances 0.000 claims description 10
- 102100033793 ALK tyrosine kinase receptor Human genes 0.000 claims description 9
- 101710168331 ALK tyrosine kinase receptor Proteins 0.000 claims description 9
- 238000001914 filtration Methods 0.000 claims description 9
- 239000013642 negative control Substances 0.000 claims description 6
- 238000005406 washing Methods 0.000 claims description 6
- 239000012528 membrane Substances 0.000 claims description 5
- BUOYTFVLNZIELF-UHFFFAOYSA-N 2-phenyl-1h-indole-4,6-dicarboximidamide Chemical compound N1C2=CC(C(=N)N)=CC(C(N)=N)=C2C=C1C1=CC=CC=C1 BUOYTFVLNZIELF-UHFFFAOYSA-N 0.000 claims description 3
- 238000010828 elution Methods 0.000 claims description 3
- 238000002509 fluorescent in situ hybridization Methods 0.000 description 49
- 238000003364 immunohistochemistry Methods 0.000 description 34
- 210000001519 tissue Anatomy 0.000 description 32
- 230000014509 gene expression Effects 0.000 description 28
- 239000011159 matrix material Substances 0.000 description 25
- 108090000623 proteins and genes Proteins 0.000 description 21
- 230000000875 corresponding effect Effects 0.000 description 17
- 230000000717 retained effect Effects 0.000 description 16
- LOKCTEFSRHRXRJ-UHFFFAOYSA-I dipotassium trisodium dihydrogen phosphate hydrogen phosphate dichloride Chemical compound P(=O)(O)(O)[O-].[K+].P(=O)(O)([O-])[O-].[Na+].[Na+].[Cl-].[K+].[Cl-].[Na+] LOKCTEFSRHRXRJ-UHFFFAOYSA-I 0.000 description 12
- 239000002953 phosphate buffered saline Substances 0.000 description 12
- 102000004169 proteins and genes Human genes 0.000 description 12
- 238000003556 assay Methods 0.000 description 11
- 230000008569 process Effects 0.000 description 10
- 206010006187 Breast cancer Diseases 0.000 description 9
- 208000026310 Breast neoplasm Diseases 0.000 description 9
- 239000000427 antigen Substances 0.000 description 9
- 102000036639 antigens Human genes 0.000 description 9
- 108091007433 antigens Proteins 0.000 description 9
- 238000001514 detection method Methods 0.000 description 9
- 238000011002 quantification Methods 0.000 description 9
- 239000000872 buffer Substances 0.000 description 7
- 239000000243 solution Substances 0.000 description 7
- 241000283707 Capra Species 0.000 description 6
- 239000003153 chemical reaction reagent Substances 0.000 description 6
- 239000011521 glass Substances 0.000 description 6
- 238000007901 in situ hybridization Methods 0.000 description 6
- 230000002018 overexpression Effects 0.000 description 6
- 238000012935 Averaging Methods 0.000 description 5
- 108010022366 Carcinoembryonic Antigen Proteins 0.000 description 5
- 102100025475 Carcinoembryonic antigen-related cell adhesion molecule 5 Human genes 0.000 description 5
- 102000001301 EGF receptor Human genes 0.000 description 5
- 108060006698 EGF receptor Proteins 0.000 description 5
- 102100041003 Glutamate carboxypeptidase 2 Human genes 0.000 description 5
- 101000892862 Homo sapiens Glutamate carboxypeptidase 2 Proteins 0.000 description 5
- 102000009616 Mucin 5AC Human genes 0.000 description 5
- 108010034536 Mucin 5AC Proteins 0.000 description 5
- 102000007296 Mucin-2 Human genes 0.000 description 5
- 108010008705 Mucin-2 Proteins 0.000 description 5
- 108010072866 Prostate-Specific Antigen Proteins 0.000 description 5
- 102100038358 Prostate-specific antigen Human genes 0.000 description 5
- 230000008901 benefit Effects 0.000 description 5
- 239000012472 biological sample Substances 0.000 description 5
- 239000013068 control sample Substances 0.000 description 5
- 238000011282 treatment Methods 0.000 description 5
- 101150054472 HER2 gene Proteins 0.000 description 4
- -1 Napsin A Proteins 0.000 description 4
- 238000013459 approach Methods 0.000 description 4
- 238000006243 chemical reaction Methods 0.000 description 4
- 230000000295 complement effect Effects 0.000 description 4
- 238000003745 diagnosis Methods 0.000 description 4
- 208000037265 diseases, disorders, signs and symptoms Diseases 0.000 description 4
- 108700020302 erbB-2 Genes Proteins 0.000 description 4
- 238000002474 experimental method Methods 0.000 description 4
- 238000012360 testing method Methods 0.000 description 4
- 102100040410 Alpha-methylacyl-CoA racemase Human genes 0.000 description 3
- 108010044434 Alpha-methylacyl-CoA racemase Proteins 0.000 description 3
- 102100028843 DNA mismatch repair protein Mlh1 Human genes 0.000 description 3
- 108010026664 MutL Protein Homolog 1 Proteins 0.000 description 3
- 108091028043 Nucleic acid sequence Proteins 0.000 description 3
- 102100025803 Progesterone receptor Human genes 0.000 description 3
- 102100035703 Prostatic acid phosphatase Human genes 0.000 description 3
- 102100023347 Proto-oncogene tyrosine-protein kinase ROS Human genes 0.000 description 3
- 101710100968 Receptor tyrosine-protein kinase erbB-2 Proteins 0.000 description 3
- 102100027881 Tumor protein 63 Human genes 0.000 description 3
- 230000003321 amplification Effects 0.000 description 3
- 238000001574 biopsy Methods 0.000 description 3
- 230000002596 correlated effect Effects 0.000 description 3
- 239000003814 drug Substances 0.000 description 3
- 102000015694 estrogen receptors Human genes 0.000 description 3
- 108010038795 estrogen receptors Proteins 0.000 description 3
- 238000010191 image analysis Methods 0.000 description 3
- 208000030776 invasive breast carcinoma Diseases 0.000 description 3
- 230000000877 morphologic effect Effects 0.000 description 3
- 238000003199 nucleic acid amplification method Methods 0.000 description 3
- 230000007170 pathology Effects 0.000 description 3
- 108090000468 progesterone receptors Proteins 0.000 description 3
- 108010043671 prostatic acid phosphatase Proteins 0.000 description 3
- 108091032973 (ribonucleotides)n+m Proteins 0.000 description 2
- 101100189945 Arabidopsis thaliana PER63 gene Proteins 0.000 description 2
- 108010074708 B7-H1 Antigen Proteins 0.000 description 2
- 102000008096 B7-H1 Antigen Human genes 0.000 description 2
- 206010005003 Bladder cancer Diseases 0.000 description 2
- 108010083123 CDX2 Transcription Factor Proteins 0.000 description 2
- 102000006277 CDX2 Transcription Factor Human genes 0.000 description 2
- 201000009030 Carcinoma Diseases 0.000 description 2
- 208000001333 Colorectal Neoplasms Diseases 0.000 description 2
- 230000003350 DNA copy number gain Effects 0.000 description 2
- 102100034157 DNA mismatch repair protein Msh2 Human genes 0.000 description 2
- 102100021147 DNA mismatch repair protein Msh6 Human genes 0.000 description 2
- LFQSCWFLJHTTHZ-UHFFFAOYSA-N Ethanol Chemical compound CCO LFQSCWFLJHTTHZ-UHFFFAOYSA-N 0.000 description 2
- WZUVPPKBWHMQCE-UHFFFAOYSA-N Haematoxylin Chemical compound C12=CC(O)=C(O)C=C2CC2(O)C1C1=CC=C(O)C(O)=C1OC2 WZUVPPKBWHMQCE-UHFFFAOYSA-N 0.000 description 2
- 108010020382 Hepatocyte Nuclear Factor 1-alpha Proteins 0.000 description 2
- 102100022057 Hepatocyte nuclear factor 1-alpha Human genes 0.000 description 2
- 102100028092 Homeobox protein Nkx-3.1 Human genes 0.000 description 2
- 101001134036 Homo sapiens DNA mismatch repair protein Msh2 Proteins 0.000 description 2
- 101000968658 Homo sapiens DNA mismatch repair protein Msh6 Proteins 0.000 description 2
- 101000578249 Homo sapiens Homeobox protein Nkx-3.1 Proteins 0.000 description 2
- 101000686031 Homo sapiens Proto-oncogene tyrosine-protein kinase ROS Proteins 0.000 description 2
- 101000579425 Homo sapiens Proto-oncogene tyrosine-protein kinase receptor Ret Proteins 0.000 description 2
- 101000984753 Homo sapiens Serine/threonine-protein kinase B-raf Proteins 0.000 description 2
- 206010058467 Lung neoplasm malignant Diseases 0.000 description 2
- 229910015837 MSH2 Inorganic materials 0.000 description 2
- 102000015728 Mucins Human genes 0.000 description 2
- 108010063954 Mucins Proteins 0.000 description 2
- 101100512532 Mus musculus Atf7ip2 gene Proteins 0.000 description 2
- 102000014160 PTEN Phosphohydrolase Human genes 0.000 description 2
- 108010011536 PTEN Phosphohydrolase Proteins 0.000 description 2
- 206010060862 Prostate cancer Diseases 0.000 description 2
- 208000000236 Prostatic Neoplasms Diseases 0.000 description 2
- 102100028286 Proto-oncogene tyrosine-protein kinase receptor Ret Human genes 0.000 description 2
- 102100027103 Serine/threonine-protein kinase B-raf Human genes 0.000 description 2
- 108010022394 Threonine synthase Proteins 0.000 description 2
- 102000005497 Thymidylate Synthase Human genes 0.000 description 2
- 101150071739 Tp63 gene Proteins 0.000 description 2
- 208000007097 Urinary Bladder Neoplasms Diseases 0.000 description 2
- 201000008275 breast carcinoma Diseases 0.000 description 2
- 210000000170 cell membrane Anatomy 0.000 description 2
- 239000008367 deionised water Substances 0.000 description 2
- 229910021641 deionized water Inorganic materials 0.000 description 2
- 230000008021 deposition Effects 0.000 description 2
- 201000010099 disease Diseases 0.000 description 2
- 208000035475 disorder Diseases 0.000 description 2
- 208000028715 ductal breast carcinoma in situ Diseases 0.000 description 2
- 239000000975 dye Substances 0.000 description 2
- 238000005516 engineering process Methods 0.000 description 2
- 239000012530 fluid Substances 0.000 description 2
- 201000005202 lung cancer Diseases 0.000 description 2
- 208000020816 lung neoplasm Diseases 0.000 description 2
- 238000002493 microarray Methods 0.000 description 2
- 229940051875 mucins Drugs 0.000 description 2
- 238000007481 next generation sequencing Methods 0.000 description 2
- 238000002360 preparation method Methods 0.000 description 2
- 238000004393 prognosis Methods 0.000 description 2
- 238000011160 research Methods 0.000 description 2
- 230000004044 response Effects 0.000 description 2
- 239000000758 substrate Substances 0.000 description 2
- 201000005112 urinary bladder cancer Diseases 0.000 description 2
- 239000011534 wash buffer Substances 0.000 description 2
- XLYOFNOQVPJJNP-UHFFFAOYSA-N water Chemical compound O XLYOFNOQVPJJNP-UHFFFAOYSA-N 0.000 description 2
- HSTOKWSFWGCZMH-UHFFFAOYSA-N 3,3'-diaminobenzidine Chemical compound C1=C(N)C(N)=CC=C1C1=CC=C(N)C(N)=C1 HSTOKWSFWGCZMH-UHFFFAOYSA-N 0.000 description 1
- 239000012110 Alexa Fluor 594 Substances 0.000 description 1
- 239000012114 Alexa Fluor 647 Substances 0.000 description 1
- 108020004414 DNA Proteins 0.000 description 1
- 108020003215 DNA Probes Proteins 0.000 description 1
- 239000003298 DNA probe Substances 0.000 description 1
- 206010061818 Disease progression Diseases 0.000 description 1
- 238000002965 ELISA Methods 0.000 description 1
- 102000004190 Enzymes Human genes 0.000 description 1
- 108090000790 Enzymes Proteins 0.000 description 1
- 102100027842 Fibroblast growth factor receptor 3 Human genes 0.000 description 1
- 101710182396 Fibroblast growth factor receptor 3 Proteins 0.000 description 1
- 206010017993 Gastrointestinal neoplasms Diseases 0.000 description 1
- 102100027893 Homeobox protein Nkx-2.1 Human genes 0.000 description 1
- 208000037396 Intraductal Noninfiltrating Carcinoma Diseases 0.000 description 1
- 206010073094 Intraductal proliferative breast lesion Diseases 0.000 description 1
- 241000283973 Oryctolagus cuniculus Species 0.000 description 1
- 229920001213 Polysorbate 20 Polymers 0.000 description 1
- 102000008022 Proto-Oncogene Proteins c-met Human genes 0.000 description 1
- 108010089836 Proto-Oncogene Proteins c-met Proteins 0.000 description 1
- 101710126806 Proto-oncogene tyrosine-protein kinase ROS Proteins 0.000 description 1
- 102100037253 Solute carrier family 45 member 3 Human genes 0.000 description 1
- 108010057966 Thyroid Nuclear Factor 1 Proteins 0.000 description 1
- RQQIRMLGKSPXSE-WIPMOJCBSA-N [1-acetyloxy-2-[[(2s,3r,5s,6s)-2,6-dihydroxy-3,4,5-triphosphonooxycyclohexyl]oxy-hydroxyphosphoryl]oxyethyl] acetate Chemical compound CC(=O)OC(OC(C)=O)COP(O)(=O)OC1[C@H](O)[C@H](OP(O)(O)=O)C(OP(O)(O)=O)[C@H](OP(O)(O)=O)[C@H]1O RQQIRMLGKSPXSE-WIPMOJCBSA-N 0.000 description 1
- SXEHKFHPFVVDIR-UHFFFAOYSA-N [4-(4-hydrazinylphenyl)phenyl]hydrazine Chemical compound C1=CC(NN)=CC=C1C1=CC=C(NN)C=C1 SXEHKFHPFVVDIR-UHFFFAOYSA-N 0.000 description 1
- 238000002835 absorbance Methods 0.000 description 1
- 230000032683 aging Effects 0.000 description 1
- 230000015572 biosynthetic process Effects 0.000 description 1
- 238000004364 calculation method Methods 0.000 description 1
- 230000005907 cancer growth Effects 0.000 description 1
- 239000003593 chromogenic compound Substances 0.000 description 1
- 238000004140 cleaning Methods 0.000 description 1
- 238000003759 clinical diagnosis Methods 0.000 description 1
- 238000007796 conventional method Methods 0.000 description 1
- 210000000805 cytoplasm Anatomy 0.000 description 1
- 230000003247 decreasing effect Effects 0.000 description 1
- 238000013461 design Methods 0.000 description 1
- 238000003795 desorption Methods 0.000 description 1
- 238000011161 development Methods 0.000 description 1
- 230000018109 developmental process Effects 0.000 description 1
- 238000007435 diagnostic evaluation Methods 0.000 description 1
- 229910003460 diamond Inorganic materials 0.000 description 1
- 239000010432 diamond Substances 0.000 description 1
- 239000004205 dimethyl polysiloxane Substances 0.000 description 1
- 230000005750 disease progression Effects 0.000 description 1
- 239000006185 dispersion Substances 0.000 description 1
- 238000012137 double-staining Methods 0.000 description 1
- 229940079593 drug Drugs 0.000 description 1
- 201000007273 ductal carcinoma in situ Diseases 0.000 description 1
- 230000000694 effects Effects 0.000 description 1
- 239000012149 elution buffer Substances 0.000 description 1
- YQGOJNYOYNNSMM-UHFFFAOYSA-N eosin Chemical compound [Na+].OC(=O)C1=CC=CC=C1C1=C2C=C(Br)C(=O)C(Br)=C2OC2=C(Br)C(O)=C(Br)C=C21 YQGOJNYOYNNSMM-UHFFFAOYSA-N 0.000 description 1
- 238000013401 experimental design Methods 0.000 description 1
- 238000010195 expression analysis Methods 0.000 description 1
- 210000002950 fibroblast Anatomy 0.000 description 1
- 238000002073 fluorescence micrograph Methods 0.000 description 1
- 230000002068 genetic effect Effects 0.000 description 1
- 238000003018 immunoassay Methods 0.000 description 1
- 238000010569 immunofluorescence imaging Methods 0.000 description 1
- 238000012744 immunostaining Methods 0.000 description 1
- 230000010354 integration Effects 0.000 description 1
- 230000003993 interaction Effects 0.000 description 1
- 238000002372 labelling Methods 0.000 description 1
- 238000012332 laboratory investigation Methods 0.000 description 1
- 239000007788 liquid Substances 0.000 description 1
- 230000002934 lysing effect Effects 0.000 description 1
- 230000000873 masking effect Effects 0.000 description 1
- 239000000463 material Substances 0.000 description 1
- 230000007246 mechanism Effects 0.000 description 1
- 108020004999 messenger RNA Proteins 0.000 description 1
- 238000007479 molecular analysis Methods 0.000 description 1
- 238000013188 needle biopsy Methods 0.000 description 1
- 208000002154 non-small cell lung carcinoma Diseases 0.000 description 1
- 102000039446 nucleic acids Human genes 0.000 description 1
- 108020004707 nucleic acids Proteins 0.000 description 1
- 150000007523 nucleic acids Chemical class 0.000 description 1
- 238000011275 oncology therapy Methods 0.000 description 1
- 238000010827 pathological analysis Methods 0.000 description 1
- 229920000435 poly(dimethylsiloxane) Polymers 0.000 description 1
- 239000000256 polyoxyethylene sorbitan monolaurate Substances 0.000 description 1
- 235000010486 polyoxyethylene sorbitan monolaurate Nutrition 0.000 description 1
- 238000001556 precipitation Methods 0.000 description 1
- 238000004321 preservation Methods 0.000 description 1
- 230000002265 prevention Effects 0.000 description 1
- 230000037452 priming Effects 0.000 description 1
- 238000003672 processing method Methods 0.000 description 1
- 108010079891 prostein Proteins 0.000 description 1
- 238000012113 quantitative test Methods 0.000 description 1
- 238000009877 rendering Methods 0.000 description 1
- 238000013077 scoring method Methods 0.000 description 1
- 230000028327 secretion Effects 0.000 description 1
- 210000002966 serum Anatomy 0.000 description 1
- 239000001509 sodium citrate Substances 0.000 description 1
- NLJMYIDDQXHKNR-UHFFFAOYSA-K sodium citrate Chemical compound O.O.[Na+].[Na+].[Na+].[O-]C(=O)CC(O)(CC([O-])=O)C([O-])=O NLJMYIDDQXHKNR-UHFFFAOYSA-K 0.000 description 1
- 238000002626 targeted therapy Methods 0.000 description 1
- 230000008685 targeting Effects 0.000 description 1
- 238000002560 therapeutic procedure Methods 0.000 description 1
- 231100000167 toxic agent Toxicity 0.000 description 1
- 239000003440 toxic substance Substances 0.000 description 1
- 230000032258 transport Effects 0.000 description 1
- 208000029729 tumor suppressor gene on chromosome 11 Diseases 0.000 description 1
- 230000002485 urinary effect Effects 0.000 description 1
- 238000012800 visualization Methods 0.000 description 1
- 238000001262 western blot Methods 0.000 description 1
Images


Classifications
-
- G—PHYSICS
- G06—COMPUTING; CALCULATING OR COUNTING
- G06T—IMAGE DATA PROCESSING OR GENERATION, IN GENERAL
- G06T7/00—Image analysis
- G06T7/0002—Inspection of images, e.g. flaw detection
- G06T7/0012—Biomedical image inspection
-
- G—PHYSICS
- G01—MEASURING; TESTING
- G01N—INVESTIGATING OR ANALYSING MATERIALS BY DETERMINING THEIR CHEMICAL OR PHYSICAL PROPERTIES
- G01N33/00—Investigating or analysing materials by specific methods not covered by groups G01N1/00 - G01N31/00
- G01N33/48—Biological material, e.g. blood, urine; Haemocytometers
- G01N33/50—Chemical analysis of biological material, e.g. blood, urine; Testing involving biospecific ligand binding methods; Immunological testing
- G01N33/53—Immunoassay; Biospecific binding assay; Materials therefor
- G01N33/574—Immunoassay; Biospecific binding assay; Materials therefor for cancer
- G01N33/57484—Immunoassay; Biospecific binding assay; Materials therefor for cancer involving compounds serving as markers for tumor, cancer, neoplasia, e.g. cellular determinants, receptors, heat shock/stress proteins, A-protein, oligosaccharides, metabolites
-
- G—PHYSICS
- G06—COMPUTING; CALCULATING OR COUNTING
- G06T—IMAGE DATA PROCESSING OR GENERATION, IN GENERAL
- G06T7/00—Image analysis
- G06T7/0002—Inspection of images, e.g. flaw detection
- G06T7/0012—Biomedical image inspection
- G06T7/0014—Biomedical image inspection using an image reference approach
-
- G—PHYSICS
- G06—COMPUTING; CALCULATING OR COUNTING
- G06V—IMAGE OR VIDEO RECOGNITION OR UNDERSTANDING
- G06V20/00—Scenes; Scene-specific elements
- G06V20/60—Type of objects
- G06V20/69—Microscopic objects, e.g. biological cells or cellular parts
-
- G—PHYSICS
- G06—COMPUTING; CALCULATING OR COUNTING
- G06T—IMAGE DATA PROCESSING OR GENERATION, IN GENERAL
- G06T2207/00—Indexing scheme for image analysis or image enhancement
- G06T2207/10—Image acquisition modality
- G06T2207/10056—Microscopic image
-
- G—PHYSICS
- G06—COMPUTING; CALCULATING OR COUNTING
- G06T—IMAGE DATA PROCESSING OR GENERATION, IN GENERAL
- G06T2207/00—Indexing scheme for image analysis or image enhancement
- G06T2207/20—Special algorithmic details
- G06T2207/20076—Probabilistic image processing
-
- G—PHYSICS
- G06—COMPUTING; CALCULATING OR COUNTING
- G06T—IMAGE DATA PROCESSING OR GENERATION, IN GENERAL
- G06T2207/00—Indexing scheme for image analysis or image enhancement
- G06T2207/30—Subject of image; Context of image processing
- G06T2207/30004—Biomedical image processing
- G06T2207/30024—Cell structures in vitro; Tissue sections in vitro
-
- G—PHYSICS
- G06—COMPUTING; CALCULATING OR COUNTING
- G06T—IMAGE DATA PROCESSING OR GENERATION, IN GENERAL
- G06T2207/00—Indexing scheme for image analysis or image enhancement
- G06T2207/30—Subject of image; Context of image processing
- G06T2207/30004—Biomedical image processing
- G06T2207/30096—Tumor; Lesion
Definitions
- the present invention pertains generally to the fields of biomarkers and quantitative measurements thereof.
- Chromogens are molecules that allow detection of a target using enzyme-based precipitation reactions and their use in immunohistochemistry (IHC) allows visualization of the immune complex (and hence the antigen) in the context of tissue architecture.
- IHC immunohistochemistry
- the most widely used chromogenic compound, 3,3'-diaminobenzidine (DAB) provides brown-colored staining, also commonly called “brown staining” (diaminobenzidine chromogenic staining or immunostaining).
- Optimal chromogenic staining relies on the deposition of a sufficient amount of substrate to block light.
- Chromogenic IHC is omnipresent in cancer diagnosis but has been criticized for its technical limit in quantifying the level of protein expression on tissue sections, thus potentially masking clinically relevant data.
- brown staining aimed at determining the presence or absence of a biomarker rather than intensity level of the staining.
- high levels of signal (staining) were even aimed at in order to ease the readings.
- ISH in situ hybridization
- NGS next generation sequencing
- IHC Immunohistochemistry
- FISH Fluorescent In-Situ Hybridization
- WO 02/086498 discloses a method for quantitative measurement of a target marker by in situ immunofluorescence
- IF immunofluorescence
- a 2-step IF assay does not result in a signal that is linearly proportional to the Ag expression ( Caelen et al., 2000, Langmuir, 16, 9125-9130 ; Squires et al., 2008, Nat. Biotechnol., 26, 417-426 ), which potentially ends up in a misleading quantification and, hence, obscures the potential of IF in providing precise biomarker data.
- An object of this invention is to provide a method for quantifying by immunofluorescence the amount of a target marker present in a biological sample fixated on a support, which enables accurate quantification of the level of said marker in a continuous manner.
- FISH fluorescence in situ hybridization
- FISH fluorescence in situ hybridization
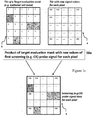
- a threshold is defined for each tile.
- the threshold for a corresponding tile may be defined by means of a per se known autothresholding algorithm applied over said corresponding tile.
- Raw signals emitted by each of the imaging probes may be raw signals of pixels of the image and wherein assigning screening probe signals to a first value or to a second value may be performed on each pixel.
- the method may include calculating, for each tile, an average of the values proportional to the raw signal values of the first screening probe for the active area, to obtain an average first screening probe signal value per tile.
- the method may further comprise a second screening probe.
- the method may comprise defining a threshold for signals of said second screening probe, and assigning said binary values to the second screening probe signals, whereby second screening probe signal values that are beyond said corresponding threshold are set to the first value, and second screening probe signal values that are not beyond said corresponding threshold are set to the second value.
- Generating a target evaluation mark may advantageously comprise multiplying the binary values corresponding to the first screening probe signals with binary values corresponding to the second screening probe signals.
- the method may include filtering the screening probe data set, said filtering comprising defining a data set threshold, for instance by means of an autothresholding algorithm, and excluding data of the screening probe data set that are beyond said data set threshold, to obtain a filtered screening probe data set for a filtered active area.
- the method may include filtering the target probe data set, said filtering comprising excluding data of the target probe data set such that a filtered active area covered by the filtered target probe data set matches the filtered active area covered by the filtered screening probe data set.
- step (f) the method includes applying the active area of the target evaluation mask on the raw signal values of the target screening probe to obtain values proportional to the raw signal values of the target probe for the active area.
- the method may include calculating, for each tile, an average of the values proportional to the raw signal values of the target probe for the active area, to obtain an average target probe signal value per tile.
- generating sample output may comprise any one or more of:
- the method comprises acquiring images of the stained sample comprising imaging a signal emitted by each of the said imaging probes, i.e. the first screening probe signal, optionally the second screening probe signal and the target probe signal.
- the threshold is a fixed value or obtained by an autothresholding step.
- the method comprises an image processing step before generating the target evaluation mask, comprising creating images of sample surface area units ("tiles") and creating raw files of each raw signal values for each imaging probe signal for each pixel of each tile.
- the incubation times of the sample with each of said probes are advantageously not higher than 16 minutes in order to avoid saturation of the sample.
- the incubation times of the sample with each of said probes may be less than 8 minutes, for example between 1 and 5 minutes.
- the incubation times of the sample with each of said probes are not higher than about 3-5 min (typically incubation times of about 1 to 3 min) to obtain a stained sample.
- the staining step comprises the incubation in sequence with a plurality of reagents, including:
- the staining step comprises the incubation in sequence of the sample with a plurality of imaging probes according to the invention wherein the incubation with probes is in the following sequence: first screening probe for imaging the sample region of interest, target probe for imaging the target marker and second screening probe for imaging the sample region to be discarded for analysis.
- the elution step or washing step are conducted at a flow rate between about 0.2 nl/s and about 25 ⁇ l/s.
- the incubation of the sample with each of said probes is conducted at a temperature from about 25 to about 60°C.
- the imaging probe is a labelled probe suitable for interacting with specific molecular entities on the sample (e.g. target maker such as expressed protein, screening marker such as a marker for a certain cell type, or a cell compartment, a screening marker such as a cell compartment marker such a marker for the nucleus, cytoplasm, membrane etc.).
- target maker such as expressed protein
- screening marker such as a marker for a certain cell type, or a cell compartment
- a screening marker such as a cell compartment marker such a marker for the nucleus, cytoplasm, membrane etc.
- an imaging probe can be a labeled RNA or DNA sequence useful for hybridizing in-situ with RNA or DNA sequences from the sample (complementary sequences).
- the imaging probe is a labeled primary antibody (e.g. fluorescent), which binds directly the target antigen or indirectly such as those used in Tyramid Signal Amplification (TSA).
- TSA Tyramid Signal Amplification
- the imaging probe results from the incubation with a sequence of labelling probes such as specific antibodies and chromogenic or fluorescent detection molecules, targeting the molecular entities to be analyzed within the sample.
- the imaging probe results from a labeled secondary (e.g. fluorescent) antibody that is incubated after a primary antibody.
- the first screening probe is an imaging probe for a marker of epithelial cells.
- the first screening probe comprises an antibody specific for cytokeratin, such as anti-cytokeratin.
- the target probe is an imaging probe for a membrane-associated molecule of a cancer cell such as human epidermal growth factor receptor 2 (HER2), anaplastic lymphoma kinase (ALK).
- HER2 human epidermal growth factor receptor 2
- ALK anaplastic lymphoma kinase
- the target probe is an imaging probe for human epidermal growth factor receptor 2 (HER2).
- HER2 human epidermal growth factor receptor 2
- the target probe is an imaging probe for an antibody specific for HER2 such as anti-cerb-2.
- the second screening probe is an imaging probe for a marker for the cells' nucleus.
- the second screening probe is a dye specific for the cells' nucleus such as DAPI (4,6-diamidino-2- phenylindole).
- the sample output generation step comprises a step of comparing the sample output for the analyzed sample with the same output obtained by the method of the invention on a positive control sample (such as a cancer positive case) and a negative sample (e.g. non-cancerous sample).
- a positive control sample such as a cancer positive case
- a negative sample e.g. non-cancerous sample
- the sample output generation step comprises representing the values of the ratios of target probe signal over the values of the first screening probe signal.
- the sample output generation step comprises the representation of the frequencies of occurrence of a particular ratio (value of target probe signal over the value of the first screening probe signal) over the sample (i.e. number of tiles presenting such ratio) normalized to the number of tiles for a given sample (e.g. histogram).
- a Gaussian fit is applied to the obtained histograms and the mean value of the ratios (value of target probe signal over the value of the first screening probe signal) is derived from this Gaussian fit and then normalized by the mean value obtained on a positive control sample (e.g. cancerous sample) for defining the mean score of the analyzed sample (M-score).
- a positive control sample e.g. cancerous sample
- the standard deviation ( ⁇ ) of the said Gaussian fit is normalized by the standard deviation of a positive control sample (e.g. cancerous sample) for defining the standard deviation score ( ⁇ -score) of the analyzed sample.
- a positive control sample e.g. cancerous sample
- a sample score is assigned to the analyzed sample by multiplying the so-obtained M- and ⁇ -scores.
- the MTP-score correlates with the amount of overexpression of the target in the sample.
- An advantageous characteristic of the invention is to provide a method which can quickly replace routine chromogenic stain-based diagnostic IHC, since it would use the same primary antibodies, established sample preparation techniques and, hence, can be easily implemented in current laboratory practice without too drastic changes.
- a noticeable advantage of the method of the invention is for providing automated and precise continuous quantitative in situ target marker (e.g. biomarker) information using low-cost immunofluorescence assays, as increasingly required for personalized cancer therapy.
- target marker e.g. biomarker
- the method can be applied to all markers, notably in the field of cancer diagnosis.
- sample refers to a biological sample immobilized on a sample support which includes biological samples derived from a tissue, fluid or secretion of the biological source, such as biopsy tissue samples, histology tissue samples, cell smears, needle biopsy samples or tissue microarrays.
- tile refers to a portion of an image from a sample surface area.
- the portion of image represented by a tile might correspond to an acquired image of a surface portion of interest from the sample, or the portion of image represented by a tile may be obtained by subdividing an acquired image of the sample surface area into portions.
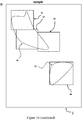
- tilting refers to generating portions of an image of a sample over a sample surface area or to generate portions of an image of the sample. Examples of tiling process are illustrated on Figure 10 .
- data binning refers to a known process in data processing which comprises allocating a single value to each of all the values comprised within a certain range of values.
- screening probe refers to an imaging probe which allows imaging a sample region of specific interest or a sample region to be discarded for further analysis.
- target probe refers to an imaging probe which allows imaging a target marker of specific interest within the sample.
- a target marker is a protein, DNA, RNA marker which is present in a cell or a tissue and would be indicative of a disorder.
- a target marker according to the invention is a protein expressed by a cancer cell.
- marker is a distinctive biological or biologically derived indicator of a process, event, or condition or of a specific cell or tissue compartment or area.
- target marker is a marker of interest for analysis which is indicative of a process, event, or a certain condition (as aging, disease, or exposure to a toxic substance, treatment or disease progression status) in a cell or biological sample or tissue which is useful for obtaining information useful for the diagnosis, prevention and/or treatment of disease or disorders.
- target markers are markers of cancer cells.
- target markers are cancer cell membrane-associated molecules. According to a further embodiment, target markers are markers which are predominantly present in cancer cells of epithelial origin (carcinomas).
- target markers are markers predominantly present in cancer cells from epithelial origin selected from PanCK (AE1-AE3), ER (Estrogen receptor), PR (Progesterone receptor), Ki67, P53, Epidermal growth factor receptor (EGFR), Thyroid transcription factor 1 (TTF-1), P63, Anaplastic lymphoma kinase (ALK), Napsin A, BRAF, Proto-oncogene tyrosine-protein kinase ROS (ROS1), Hepatocyte growth factor receptor (MET), RET, Phosphatidylinositol-3,4,5-trisphosphate 3-phosphatase (PTEN), PD-L1, Prostate specific antigen (PSA), Prostate specific membrane antigen (PSMA), Alpha-methylacyl-CoA racemase (AMACR), Prostatic acid phosphatase (PAP), Prostein (P5015), NKX3.1, CDX2, Carcinoembryonic antigen (CEA), mucins such as mu
- cancer cell membrane-associated molecules include, but are not limited to human epidermal growth factor receptor 2 (HER2), carcinoembryonic antigen (CEA), prostate-specific antigen (PSA), prostate specific membrane antigen (PSMA), and mucins such as mucin 2 (MUC2) and mucin 5AC (MUC5AC)
- HER2 human epidermal growth factor receptor 2
- CEA carcinoembryonic antigen
- PSA prostate-specific antigen
- PSMA prostate specific membrane antigen
- mucins such as mucin 2 (MUC2) and mucin 5AC (MUC5AC)
- target markers are markers for gynecological cancers such as breast cancer.
- target markers are markers for gynecological cancers for breast cancer such as PanC, ER, PR, Ki67, P5, Epidermal growth factor receptor and HER2.
- target markers are markers for lung cancer such as non-small cell lung cancer.
- target markers are markers for lung cancer such as TTF-1, P63, ALK, Napsin A, EGFR, BRAF, ROS1, MET, RET, PTEN and PD-L1.
- target markers are markers for gastrointestinal cancers such as colorectal cancers.
- target markers are markers for colorectal cancers such as thymidylate synthase (TS), CDX2, CEA, MUC2, MUC5AC, MLH1, MSH2, MSH6 and PSM2.
- TS thymidylate synthase
- CDX2 CDX2
- CEA thymidylate synthase
- MUC2 MUC5AC
- MLH1, MSH2, MSH6 PSM2.
- target markers are markers for urinary track cancers such as bladder cancer.
- target markers are markers for bladder cancer such as Fibroblast FGFR3 and P53.
- target markers are markers for prostate cancer.
- target markers are markers for prostate cancer such as PSA, PSMA, AMACR, P63, PAP, P5015 and NKX3.1.
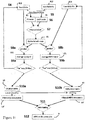
- FIG. 1 is illustrated a method for quantitative measurement of a target marker by in situ immunofluorescence according to the invention comprising the steps of:
- FFPE Formmalin-Fixed, Paraffin-Embedded
- HE Hematoxylin and eosin
- PBS Phosphate Buffered Saline
- Example 1 Continuous signal quantification of double IF staining using microfluidic precision immunofluorescence
- HER2 protein is situated on epithelial cell membranes and cytokeratin (CK) constitutes a marker for epithelial cells and it has been widely used in carcinomas to distinguish epithelia from stroma ( Barak et al., 2004, Clin. Biochem., 37, 529-540 ; Gustavson et al., 2009, Arch. Pathol., Lab. Med., 133, 1413-1419 ), the method of the invention is used wherein the staining step (i) is carried out by using a probe for HER2 (target probe) in combination with a probe for CK (first screening probe) to label the sample areas where the expression of HER2 should be interrogated during the fluorescence signal analysis, since it is expressed in epithelial cells.
- CK cytokeratin
- a nucleus marker is used as a second screening probe during the staining step in order to label the sample areas where the expression of HER2 should not be interrogated during the fluorescence signal analysis.
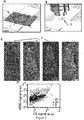
- a microfluidic tissue processor as described in Ciftlik et al., 2013, Proc. Natl. Acad. Sci. 110, 5363-5368 has been used to perform the staining step by immunofluorescence on formalin-fixed paraffin-embedded (FFPE) sections of surgically resected human invasive breast carcinoma samples ( Fig. 2A ), retrieved from the archives of the Institute of Pathology at the University Hospital of Lausanne (Switzerland) as described below.
- FFPE formalin-fixed paraffin-embedded
- a shallow flow chamber with a height of 100 ⁇ m is formed, allowing fast and uniform delivery and washing of the reagents over a large surface (16 ⁇ 16 mm 2 ) of the tissue section.
- a distributed microfluidic channel network 250- ⁇ m wide microfluidic channels) permitted homogeneous flow throughout the entire chamber and assured that convection was the dominant mechanism for the in-plane bioreagent transport and the method of the invention was performed as described below.
- the staining protocol lasted about 10 minutes in total, including the washing steps, wherein the combined sequential use of Anti-human cytokeratin, clone AE1/AE3 and AF 647 goat anti-mouse IgG (H+L) was used as target probe (primary and secondary antibody, respectively for imaging the target), the combined sequential use of Anti-human c-erbB-2 oncoprotein and AF 594 goat anti-rabbit IgG (H+L) was used as a first screening probe (primary and secondary antibody, respectively for imaging the area of interest) as detailed in Table 1 below: Table 1 Reagent Flow duration, s Incubation time, min Total time, s PBS buffer 10 - 10 Anti-human cytokeratin, clone AE1/AE3 12 2 132 PBS buffer 10 - 10 Anti-human c-erbB-2 oncoprotein 12 2 132 PBS buffer 10 - 10 AF 594 goat anti-rabbit Ig
- PBS solution used to wash the chamber in between steps, was delivered at 25 ⁇ L/s for 10 seconds.
- Antibody (Ab) solutions were delivered at 10 ⁇ L/s for 12 seconds, and incubated for 2 minutes with a slow flow of 20 nL/s.
- the tissue samples were washed off-chip with deionized water for ten seconds and mounted using 170- ⁇ m coverslips using a DAPI-containing solution.
- the typical values of IgG Ag-Ab binding constants were considered as k on ( ⁇ 10 6 M -1 ) and k off ( ⁇ 10 -3 s -1 ).
- the bulk Ab concentration c bulk ( ⁇ 10 -8 M) was chosen large enough so that it is not a limiting factor for the Ab surface coverage and the IF signal in a Langmuir isotherm hypothesis.
- tissue slide samples were first incubated with primary antibodies for HER2 and CK, in a sequential manner.
- two fluorescently labeled secondary antibodies as described below were sequentially delivered into the chamber of the microfluidic microprocessor, first for HER2 and then for CK detection.
- the slides were washed with deionized water and cover-slipped using a solution containing 4',6-diamidino-2-phenylindole (DAPI) for nuclear counterstaining.
- DAPI 4',6-diamidino-2-phenylindole
- the slides were automatically scanned tile-by-tile (e.g. regions of about 446 x 335 ⁇ m) to obtain a mosaic image in three fluorescent channels, corresponding to the signals of DAPI, CK and HER2, respectively ( Fig. 2 , B-C).
- tile-by-tile e.g. regions of about 446 x 335 ⁇ m
- the histological slides were inserted into the device to run the staining assay.
- PBS was used as a buffer for cleaning and priming of the fluidic path.
- Double-staining was performed using rabbit anti-human c-erbB-2 oncoprotein (code: A0485, Dako, Denmark) and mouse anti-human cytokeratin, clone AE1/AE3 (code M3515, Dako, Denmark), as primary antibodies, with a concentration of 1.28 ⁇ g/mL and 1.02 ⁇ g/mL, respectively.
- Alexa Fluor 594 goat anti-rabbit IgG (H+L) (code: A-11037, Life Technologies, CA, USA) and Alexa Fluor 647 goat anti-mouse IgG (H+L) (code: A-21236, Life Technologies, CA, USA) secondary antibodies, at a concentration of 50 ⁇ g/mL, were employed.
- Nuclear counterstaining was realized using DAPI, included in Fluoroshield (code: F6057, Sigma Aldrich, MO, USA) mounting solution. All the antibodies were dissolved in a 0.05% (vol/vol) solution of Tween 20 (code: P137-9, Sigma Aldrich, MO, USA) in PBS.
- the microfluidic microprocessor formed a fluidic halve-chamber that was reversibly clamped with a tissue slide using the force provided by a permanent magnet.
- MTP-glass slide fluidic chamber the histological glass slide was clamped against the MTP via a polydimethylsiloxane gasket, both to fix the height of the reaction chamber to 100 ⁇ m and to prevent leakage.
- a polymethylmetacrylate holder was assembled with the MTP. Fluid manipulation was realized using five syringe pumps (Cetoni, Germany) that were filled with the required reagents and connected to the inlet of the MTP via the holder.
- IHC For routine determination of HER2 status of breast cancer cases, IHC was performed on 4 ⁇ m FFPE sections on the Ventana Benchmark automat (Ventana Medical Systems, AZ, USA). The samples were stained using Ventana anti-HER2/ neu Ab (clone: 4B5) and scored according to current ASCO/CAP guidelines (Wolff et al., 2013, supra). FISH was done manually on 4 ⁇ m FFPE sections using the PathVysion HER-2 DNA probe kit (Abbott Molecular, IL, USA). Signal analysis was performed on a minimum of 40 nuclei per case after screening of the whole section.
- Each tile from the resulting mosaic images obtained as described above was then analyzed by running an image-processing method as described in Figure 1 which identified locations of CK expression and created a region of interest to limit the interrogation of the HER2 signal to epithelial areas only ("CK mask").
- Information from the DAPI channel was used to remove the nuclei from the interrogation zones ("DAPI mask"), as the HER2 and CK markers of interest are not expressed in the nuclei.
- the steps used in the analysis of the obtained images can be schematized in Figure 1 .
- OriginLab software (OriginLab Corporation, MA, USA) was used to obtain scatter plots, histograms and statistical values.
- the image-processing step comprising the whole process from creating binary masks for each image sub-element to the formation of scatter plots (steps S5 to S12) takes approximately 20 minutes per batch, giving an average of 3 minutes per sample.
- FIG. 2D is an example of such scatter plot, in which an IHC HER2 2+ (equivocal) case is compared to a 3+ and a 0 case, the latter two being used as positive and negative controls, respectively.
- the data from each scatter plot were subsequently processed to provide statistical indicators of HER2 expression as described in Figure 1g , which finally resulted in a sample scoring through the method of the invention ('MTP-score').
- Table 2 shows the classification of IHC results for these 25 cases following the 2013 ASCO/CAP interpretation guidelines ( Wolff et al., 2013, supra ) by two blinded experienced pathologists.
- HER2 FISH analysis based on the N FISH values, 10 cases out of the 25 were classified as negative ( N FISH ⁇ 4 ), 9 cases as positive ( N FISH ⁇ 6 ), and 6 cases as equivocal ( 4 ⁇ N FISH ⁇ 6 ) (Neg., Pos., and Equ., respectively, in Fig. 5 ).
- the 2013 ASCO/CAP guidelines for HER2 status classification also take into account the HER2 /CEP17 ratio, it was decided for the purpose of this study to focus on the correlation between HER2 protein expression and N FISH .
- Case 13 was removed from the dataset in Fig. 7 since a control HE slide showed that only ductal carcinoma in situ (DCIS) was left on the sections used for the study.
- case 14 was removed from the dataset in Fig. 7 because the section presented heterogeneous HER2 status, resulting in two N FISH values.
- interpretation of routine IHC on the resected tumor specimen failed due to repeated tissue detachment from the glass slide.
- the IHC score indicated for these cases is the one found on the initial core biopsy.
- the steps of the method according to the invention for the analysis of the obtained image was automated in the form of an algorithm in order to determine the regions of interest with epithelial cells and remove the background, as illustrated in Fig. 1i , for each tile of the mosaic image of a given sample.
- the scatter plot shows the correlation between the tile-averaged HER2 and CK signals ( a ), compared with the scatter plot data obtained from the IHC 3+ ( b ) and IHC 0 ( c ) control samples of the batch.
- the MTP score for each patient obtained as described below clearly correlated with N FISH obtained from routine analysis.
- Fig. 6 shows as examples the histograms obtained for five patients, to whom prior routine analysis attributed the following IHC scores: 3+ ( a ), 0 ( b ), and three cases ( c1-c3 ) from which two scored as 2+ and one as 3+ and had N FISH values of 1.9, 4.4, and 9.4, respectively.
- the positive and negative controls were used as references of the expected HER2 signal intensities for each sample.
- the histograms shifted more towards the right as the N FISH increased, indicating an average increment in the acquired HER2 signal with respect to CK, when the number of HER2 gene copies was higher.
- the widening of the histogram for high N FISH cases showed that the overexpression of HER2 also corresponded to a larger dispersion of the HER2 signal.
- a Gaussian fit of a histogram allowed determining the mean HER2/CK value and normalizing this by the mean obtained for the IHC 3+ control sample in the batch defined the M-score.
- the standard deviation ( ⁇ ) was extracted from the Gaussian fit of a histogram and normalized it by the ⁇ value of the positive control of the batch to define the ⁇ -score.
- MTP-score was determined for each sample as the product of the M- and ⁇ -scores.
- the three scores found by this analysis showed Pearson correlation coefficients of at least 0.9 against the N FISH values obtained by routine FISH analysis.
- Fig. 7 shows the score values obtained using the method of analysis over the full set of cases used in this study.
- the M-, ⁇ -, and MTP-scores obtained a Pearson coefficient ⁇ of 0.90, 0.90, and 0.93, respectively, and an increasing exponent ⁇ of the power law fit ( y ⁇ x ⁇ ).
- HER2 biomarker quantification as obtained by the presented method, can provide molecular information that is as precise as data obtained by FISH tests, while keeping the cost and time advantage of an IF assay.
- case 15 was considered equivocal/positive by FISH analysis, even though the IHC score was +1 (Table 2).
- a method of the invention and the integration of the obtained information to routine diagnostic workflows may imply a major leap towards the concretization of precision medicine and the so-obtained quantitative data can be used as a scoring aid to pathologists, to increase success of treatment response prediction and prognosis and can be applied to other markers in the field of cancer diagnostics.
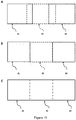
- the CK channel could be used to define the areas where the expression of HER2 should be interrogated.
- HER2-overexpressing samples Fig. 3B
- the use of the HER2 signal alone would be clearly sufficient to determine the regions of interest, for tumors that do not strongly overexpress HER2 ( Fig. 3C ), it would be difficult to distinguish epithelial cells from surrounding parts in the tissue.
- employing the signal in the CK channel allowed to ensure that the regions of interest for the interrogation of the HER2 signal corresponded to epithelial cells, independently from the intensity of the HER2 signal.
- every tile was first assigned an average signal value for the CK and HER2 signals.
- the thus obtained CK signal intensities were then analyzed and filtered, in a case-by-case fashion, in order to remove the tiles that had none or a few epithelial cells from further analysis.
- tiles which showed a CK average below a given threshold were automatically filtered out from the dataset (autothresholding) as shown on Fig. 4 .
- fluorescently labeled antigens were immobilized on the surface of a glass slide with various volume concentrations, which ranged from 0 to 1'000 ⁇ g/mL.
- the recognition process is also based on an Ag-Ab interaction at a surface, like on a tissue slide.
- the implementation of a spotting microarray allowed obtaining a direct fluorescence signal from the Ags and compare it to the signal from the recognizing Abs in an analytical fashion.
- this assay allowed to create a controlled gradient of Ag concentrations on the same slide, which is not possible with tissue sections.
- a second incubation was performed with antibodies that recognized the previously incubated IgGs. The results also manifested that a short incubation time of 2 minutes gives a signal that is more proportional to the Ag concentration than an incubation time of one hour and that the IF signal was more proportional to the antigen concentration than what could be obtained by traditional IHC methods.
- Figure 9 shows the histograms of the HER2/CK ratio for several cases, either obtained with (i) the using short incubation times (at the order of a few minutes), or (ii) the off-chip protocol using an incubation time of 1 hour. It can be seen that the histograms become broader and shift to higher HER2/CK ratios for cases treated with the long incubation time, rendering a less accurate assessment of the HER2 expression level, as evidenced in the plot of the M-score ( Fig. 9B ) and the ⁇ -score ( Fig. 9C ), especially for N FISH ⁇ 6, which is the interval for which equivocal results are encountered.
Description
- The present invention pertains generally to the fields of biomarkers and quantitative measurements thereof.
- Chromogens are molecules that allow detection of a target using enzyme-based precipitation reactions and their use in immunohistochemistry (IHC) allows visualization of the immune complex (and hence the antigen) in the context of tissue architecture. The most widely used chromogenic compound, 3,3'-diaminobenzidine (DAB), provides brown-colored staining, also commonly called "brown staining" (diaminobenzidine chromogenic staining or immunostaining). Optimal chromogenic staining relies on the deposition of a sufficient amount of substrate to block light. In the case of DAB, a "desirable' image" is regarded to be produced when deposition of the substrate leads to an absorbance of 1-2 units, meaning that 90 to 99% of the light signal is blocked. Although this creates a contrast that is easy to read, it hampers the use of multiple colocalized chromogens on routine assays (Carvajal-Hausdorf et al., 2015, Laboratory investigation, 95, 385-396).
- Chromogenic IHC is omnipresent in cancer diagnosis but has been criticized for its technical limit in quantifying the level of protein expression on tissue sections, thus potentially masking clinically relevant data. Historically, the use of brown staining aimed at determining the presence or absence of a biomarker rather than intensity level of the staining. In fact, high levels of signal (staining) were even aimed at in order to ease the readings.
- However, with the development of assays and treatments, assay read-outs no longer aim at a simple binary answer (expressed or not) but the quantification of the expression amount has also become a critical variable which is of high importance in the field of biomarkers, evolving from diagnostics to prediction of response to therapy. In this context, the limitations of immunodiagnostic assays have become more important (Rimm et al., 2006, Nature Biotechnology, 24, 914-916).
- In particular, with the advancement of personalized cancer medicine, precise molecular profiling of tumors is gaining significant importance in routine diagnostic pathology and with the evolution towards personalized treatments tailored to the molecular features of malignant tumors, the last decade has witnessed an increasing use of molecular analysis approaches, including but not limited to in situ hybridization (ISH), mRNA expression profiling techniques and next generation sequencing (NGS). Immunohistochemistry (IHC), however, remains by far the most used method in the routine diagnostic evaluation of tumor tissues, with the advantages of wide availability, low cost, and preservation of the information-rich morphological context.
- Continuous quantification of protein expression in tumor sections has long been the missing link between methods analyzing nucleic acids and conventional IHC. The majority of IHC tests currently used in clinical diagnosis cannot quantify the antigen (Ag) expression but rather perform a binary or semi-quantitative assessment as interpreted by the pathologist. An example of such semi-quantitative tests is the assessment of epidermal growth factor receptor 2 (HER2) protein expression level in breast cancer (known to promote the growth of cancer cells), for which the scoring can have four different levels: 0, 1+, 2+ or 3+ (Wolf et al., 2013, J. Clin. Oncol., 31, 3997-4013). Therefore, this non-continuous assessment results in a loss of information regarding the Ag expression level (Rimm, 2006, supra; Carvajal-Hausdorf et al., 2015, supra). Furthermore, it suffers from possible ambiguous, equivocal results and relative subjectivity in scoring between different pathologists.
- To overcome the discrete nature of the semi-quantitative scoring methods, more continuous scoring algorithms such as the "H-score" have been proposed (Detre et al., 1995, J. Clin. Pathol., 48, 876-878). These methods involve manually assessing the approximate sample areas with different levels of target biomarker expression (e.g. HER2) and multiplying the areas with appropriate "weights" according to the expression amount. However, this approach has other drawbacks such as the inability of the scorer to detect subtle differences in target expression especially at the low and high ends of the scale and the tendency to round scores, effectively converting the approach to another semi-quantitative one (Camp et al., 2002, Nature Medicine, 8, 1323-1328).
- Techniques such as Western Blot and ELISA provide means for protein quantification but at the cost of the loss of morphological information and the integrity of the samples of interest since they require the lysing of the samples (Becker et al., 2007, J. Pathol., 211, 370-378). While they potentially offer high reproducibility and accuracy, they are either regarded as complementary methods or utilized in assays for liquid media such as detection of circulating tumor elements in serum and therefore are less suitable for assessing protein expression levels in the morphological context of the tissue slide.
- Genetic methods, particularly Fluorescent In-Situ Hybridization (FISH), are widely utilized as complementary techniques in cases of inconclusive results obtained with IHC or similar tests. Metrics such as the gene copy number provide quantitative information on the biomarker of interest. On the other hand, FISH is relatively expensive. Furthermore, the existence or amplification of a gene is a necessary but not a sufficient condition for the expression of a diagnostically relevant antigen biomarker. Comparison studies between IHC and FISH methods for HER2 have been widely performed in clinical research (Pauletti et al., 2000, J. Clin. Oncol., 18, 3651-3664 ; Owens et al., 20014, Clin. Breast Cancer, 5, 63-69) and studies conclude that agreement between IHC and FISH is not complete, especially for
IHC 2+ cases, creating issues with false positives and false negatives. -
WO 02/086498 - In this context, as clinical pathology moves from qualitative to quantitative, immunofluorescence (IF) is gaining relevance in the research settings and laboratory-developed tests, mainly due to its increased capacity to measure the signal intensity of one or more biomarkers as compared to traditional chromogenic techniques (Carvajal-Hausdorf et al., 2015, supra). Several image processing techniques that quantify the extent of IF signal have already been reported in the literature (McCabe et al., 2005, JNCI J. Natl. Cancer Inst., 97, 1808-1815 ; Rojo et al., 2010, Folia Histochem. Cytobiol. 47). However, there is little or no evidence suggesting that the IF signal per se can be used to precisely quantify Ag expression amount on tissue sections. Indeed, due to the kinetics of Ag-antibody (Ab) binding, a 2-step IF assay does not result in a signal that is linearly proportional to the Ag expression (Caelen et al., 2000, Langmuir, 16, 9125-9130 ; Squires et al., 2008, Nat. Biotechnol., 26, 417-426), which potentially ends up in a misleading quantification and, hence, obscures the potential of IF in providing precise biomarker data.
- Therefore, shifting from qualitative to quantitative, immunofluorescence (IF) has recently gained attention, yet the question of how precisely IF can quantify antigen expression remains unanswered, regarding in particular its technical limitations and applicability to multiple markers. There is therefore a need to find precise methods that allow to routinely and precisely quantify biomarker expression in tissues while preserving the morphology since those methods would not only reduce the requirement for expensive complementary gene analysis but also increase the precision of diagnosis, prognosis and the success of targeted therapies, in clinical trials and routine patient care.
- An object of this invention is to provide a method for quantifying by immunofluorescence the amount of a target marker present in a biological sample fixated on a support, which enables accurate quantification of the level of said marker in a continuous manner.
- It is advantageous to provide a method of detection of a target marker by immunofluorescence where the immunofluorescence signal is directly proportional to the said target marker's concentration.
- It is advantageous to provide a method of detection of a target marker by immunofluorescence which enables the establishment of a linearly proportional relationship between the IF signal intensity and its antigen expression level.
- It is advantageous to provide a method of detection of a target marker by immunofluorescence which enables continuous quantification of protein expression levels and can obtain a score correlated to the number of the corresponding protein expressing gene copy numbers in a reliable manner comparable as assessed by fluorescence in situ hybridization (FISH).
- It is advantageous to provide a method of detection of a target marker by immunofluorescence which enables establishing a continuous scoring that linearly follows the gene copy number as assessed by fluorescence in situ hybridization (FISH) and which allows to provide additional information compared to FISH of particular interest for equivocal cases since the existence or amplification of a gene, while being necessary, is not sufficient for the expression of a diagnostically relevant antigen biomarker.
- Objects of this invention have been achieved by providing a method according to
claim 1. - Disclosed herein is a method for quantitative measurement of a target marker by in situ immunofluorescence comprising the steps of:
- a) providing a sample immobilized on a sample support;
- b) carrying out a staining step comprising incubating said sample with at least one target probe, at least one screening probe for imaging the sample region of interest (first screening probe) and optionally at least one further screening probe for the sample region of non-interest to be discarded in further analysis (second screening probe), wherein incubation times of the sample with each of said probes are sufficiently low to avoid saturation of the sample with the probes, while ensuring suitable staining of the sample so that a linear relationship between the target marker concentration and the resultant fluorescent signal intensity can be formed;
- c) acquiring an image of the stained sample comprising raw signals emitted by each of the imaging probes;
- d) generating a target evaluation mask comprising an active area for analysis of said target marker, comprising defining a threshold for signals of said at least one screening probe, and assigning binary values to screening probe signals, said binary values comprising a first value (for example 0) and a second value (for example 1), whereby screening probe signal values that are beyond said corresponding threshold are set to said first value, and screening probe signal values that are not beyond said corresponding threshold are set to said second value, said active area of the mask being defined by areas of the image comprising signals set to said second value;
- e) applying the active area of the target evaluation mask on the raw signal values of the first screening probe to obtain a screening probe data set comprising values proportional to the raw signal values of the first screening probe for the active area;
- f) processing signals of the target probe, including extracting target probe signal data limited to said active area to obtain a target probe data set comprising target probe signal values for the active area; and
- g) generating a sample output including combining said target probe data set with said screening probe data set to provide information on quantitative levels of the target marker.
- The method may advantageously further include:
- processing said image before generating said target evaluation mask, comprising defining tiles representing surface area portions of the image; and
- effecting steps (d) and (e) on each tile.
- In an advantageous embodiment, a threshold is defined for each tile.
- The threshold for a corresponding tile may be defined by means of a per se known autothresholding algorithm applied over said corresponding tile.
- Raw signals emitted by each of the imaging probes may be raw signals of pixels of the image and wherein assigning screening probe signals to a first value or to a second value may be performed on each pixel.
- In an embodiment, in step (e) the method may include calculating, for each tile, an average of the values proportional to the raw signal values of the first screening probe for the active area, to obtain an average first screening probe signal value per tile.
- In an embodiment, the method may further comprise a second screening probe.
- In an embodiment, the method may comprise defining a threshold for signals of said second screening probe, and assigning said binary values to the second screening probe signals, whereby second screening probe signal values that are beyond said corresponding threshold are set to the first value, and second screening probe signal values that are not beyond said corresponding threshold are set to the second value.
- Generating a target evaluation mark may advantageously comprise multiplying the binary values corresponding to the first screening probe signals with binary values corresponding to the second screening probe signals.
- In an embodiment, in step (e) the method may include filtering the screening probe data set, said filtering comprising defining a data set threshold, for instance by means of an autothresholding algorithm, and excluding data of the screening probe data set that are beyond said data set threshold, to obtain a filtered screening probe data set for a filtered active area.
- The method may include filtering the target probe data set, said filtering comprising excluding data of the target probe data set such that a filtered active area covered by the filtered target probe data set matches the filtered active area covered by the filtered screening probe data set.
- In an embodiment, in step (f), the method includes applying the active area of the target evaluation mask on the raw signal values of the target screening probe to obtain values proportional to the raw signal values of the target probe for the active area.
- In an embodiment, the method may include calculating, for each tile, an average of the values proportional to the raw signal values of the target probe for the active area, to obtain an average target probe signal value per tile.
- In an embodiment, generating sample output may comprise any one or more of:
- representing in a graph, for instance in the form of a scatter plot (9), values of the target probe signal versus values of the first screening probe signal for each tile;
- generating a histogram (10) representing the frequencies of occurrence of a ratio of target probe signal over the first screening probe signal for the sample;
- generating a score for the sample by comparing the output of said sample with outputs for a positive control sample (such as a cancer positive case) and a negative control sample (non-cancerous sample) obtained by a method according to any of the preceding claims;
- generating a score for the sample by comparing the output of said sample with target marker levels obtained by other methods.
- calculating ratios of target probe signals over the values of the first screening probe signals for each tile, and displaying the said ratios;
- generating a histogram (10) representing the frequencies of occurrence of a ratio of target probe signal over the first screening probe signal for the sample normalized to the number of tiles for a given sample.
- In an advantageous embodiment,
- the first screening probe is an imaging probe for a marker of epithelial cells, for instance the first screening probe comprises an antibody specific for cytokeratin, such as anti-cytokeratin;
- the target probe is an imaging probe for a membrane-associated molecule of a cancer cell such as human epidermal growth factor receptor 2 (HER2), or anaplastic lymphoma kinase (ALK), for instance, the target probe comprises an imaging probe for an antibody specific for HER2 such as anti-cerb-2;
- optionally, the second screening probe is an imaging probe for a marker for the cells' nucleus, for instance the second screening probe is a dye specific for the cells' nucleus such as DAPI (4,6-diamidino-2- phenylindole).
- In an embodiment, in step c), the method comprises acquiring images of the stained sample comprising imaging a signal emitted by each of the said imaging probes, i.e. the first screening probe signal, optionally the second screening probe signal and the target probe signal.
- In an embodiment, the threshold is a fixed value or obtained by an autothresholding step.
- In an embodiment, the method comprises an image processing step before generating the target evaluation mask, comprising creating images of sample surface area units ("tiles") and creating raw files of each raw signal values for each imaging probe signal for each pixel of each tile.
- In an embodiment, the incubation times of the sample with each of said probes are advantageously not higher than 16 minutes in order to avoid saturation of the sample.
- In an embodiment, the incubation times of the sample with each of said probes may be less than 8 minutes, for example between 1 and 5 minutes.
- In an embodiment, the incubation times of the sample with each of said probes are not higher than about 3-5 min (typically incubation times of about 1 to 3 min) to obtain a stained sample.
- In a particular embodiment, the staining step comprises the incubation in sequence with a plurality of reagents, including:
- at least one first screening probe;
- at least one target probe; and
- at least one second screening probe;
- an optional elution step where an elution buffer is eluted against the sample for removing undesirable material such as probes used in previous steps potentially remaining on the sample before starting the incubation with the first probe;
- a washing step wherein a washing buffer is flowed on the sample preceding and following the incubation of the sample with of each of the probes, wherein flow times during each washing step between the sample and the washing buffer is about 10-15 s.
- In another particular embodiment, the staining step comprises the incubation in sequence of the sample with a plurality of imaging probes according to the invention wherein the incubation with probes is in the following sequence: first screening probe for imaging the sample region of interest, target probe for imaging the target marker and second screening probe for imaging the sample region to be discarded for analysis.
- In an embodiment, the elution step or washing step are conducted at a flow rate between about 0.2 nl/s and about 25 µl/s.
- In an embodiment, the incubation of the sample with each of said probes is conducted at a temperature from about 25 to about 60°C.
- In another embodiment, the imaging probe is a labelled probe suitable for interacting with specific molecular entities on the sample (e.g. target maker such as expressed protein, screening marker such as a marker for a certain cell type, or a cell compartment, a screening marker such as a cell compartment marker such a marker for the nucleus, cytoplasm, membrane etc.). For example, an imaging probe can be a labeled RNA or DNA sequence useful for hybridizing in-situ with RNA or DNA sequences from the sample (complementary sequences). In another example, the imaging probe is a labeled primary antibody (e.g. fluorescent), which binds directly the target antigen or indirectly such as those used in Tyramid Signal Amplification (TSA).
- In another embodiment, the imaging probe results from the incubation with a sequence of labelling probes such as specific antibodies and chromogenic or fluorescent detection molecules, targeting the molecular entities to be analyzed within the sample. In one embodiment, the imaging probe results from a labeled secondary (e.g. fluorescent) antibody that is incubated after a primary antibody.
- According to a particular embodiment, the first screening probe is an imaging probe for a marker of epithelial cells.
- According to a further particular embodiment, the first screening probe comprises an antibody specific for cytokeratin, such as anti-cytokeratin.
- According to another particular embodiment, the target probe is an imaging probe for a membrane-associated molecule of a cancer cell such as human epidermal growth factor receptor 2 (HER2), anaplastic lymphoma kinase (ALK).
- According to further particular embodiment, the target probe is an imaging probe for human epidermal growth factor receptor 2 (HER2).
- According to a further particular embodiment, the target probe is an imaging probe for an antibody specific for HER2 such as anti-cerb-2.
- According to another particular embodiment, the second screening probe is an imaging probe for a marker for the cells' nucleus.
- According to a further particular embodiment, the second screening probe is a dye specific for the cells' nucleus such as DAPI (4,6-diamidino-2- phenylindole).
- According to a particular embodiment, the sample output generation step, comprises a step of comparing the sample output for the analyzed sample with the same output obtained by the method of the invention on a positive control sample (such as a cancer positive case) and a negative sample (e.g. non-cancerous sample).
- According to a particular embodiment, the sample output generation step comprises representing the values of the ratios of target probe signal over the values of the first screening probe signal. In a more particular embodiment, the sample output generation step comprises the representation of the frequencies of occurrence of a particular ratio (value of target probe signal over the value of the first screening probe signal) over the sample (i.e. number of tiles presenting such ratio) normalized to the number of tiles for a given sample (e.g. histogram).
- According to a further particular aspect, a Gaussian fit is applied to the obtained histograms and the mean value of the ratios (value of target probe signal over the value of the first screening probe signal) is derived from this Gaussian fit and then normalized by the mean value obtained on a positive control sample (e.g. cancerous sample) for defining the mean score of the analyzed sample (M-score).
- According to a further particular aspect, the standard deviation (σ) of the said Gaussian fit is normalized by the standard deviation of a positive control sample (e.g. cancerous sample) for defining the standard deviation score (∑-score) of the analyzed sample.
- According to a further particular aspect, a sample score (MTP-score) is assigned to the analyzed sample by multiplying the so-obtained M- and ∑-scores. In a more particular embodiment, the MTP-score correlates with the amount of overexpression of the target in the sample.
- The above mentioned features may be combined in any appropriate manner.
- An advantageous characteristic of the invention is to provide a method which can quickly replace routine chromogenic stain-based diagnostic IHC, since it would use the same primary antibodies, established sample preparation techniques and, hence, can be easily implemented in current laboratory practice without too drastic changes.
- A noticeable advantage of the method of the invention is for providing automated and precise continuous quantitative in situ target marker (e.g. biomarker) information using low-cost immunofluorescence assays, as increasingly required for personalized cancer therapy.
- According to a further aspect, the method can be applied to all markers, notably in the field of cancer diagnosis.
- Other features and advantages of the invention will be apparent from the claims, detailed description, and figures.
-
-
Figure 1 is an illustration of the steps used in an embodiment of a method of the invention as described in Examples 1 and 2. Images, tiles and pixels are illustrated schematically, the tiles and pixels representing image signal information, in particular fluorescence signal information. Tiles and pixels are illustrated in a contiguous arrangement; however, tiles and pixels may represent signal information in a contiguous image area, or in a non-contiguous image area. Also, the tiles and pixels may represent a same geometric area over the sample surface or a plurality of non-contiguous geometric areas over the sample surface.- a: Steps S1 to S6: staining the sample with at least one target probe, at least one screening probe for imaging the sample region of interest (first screening probe) and optionally at least one further screening probe for the sample region of non-interest to be discarded for further analysis (second screening probe); acquiring images of the stained sample, forming image tiles based on the obtained images, processing the images where a tile-specific threshold filter is applied to each pixel comprising setting to a first value (e.g. 0) pixels having a screening probe signal beyond the thresholds that need to be discarded and to a second value (e.g. 1) to the retained pixels;
- b: Step S7: creating a target evaluation mask on the tile;
- c & d: Steps S8a and 8b: creating a data set for screening probe signals C11 to Cjj (1c) and target probe signal T11 to Tjj (1d) for each pixel (1 to j) over each tile;
- e: Steps S9a and 9b: averaging the data sets of screening probe signals over the tile to an average value Cav and averaging the data sets of target probe signals over the tile to an average value Tav to create a screening probe signal data matrix with all the average values Cav (C avll to C avnn ) and a target probe signal data matrix with all the average values Tav (T avll to T avnn ) for all the tiles (1 to N);
- f: Step S10: applying a threshold filter ("autothreshold") to the screening probe signal data matrix comprising setting to a first value (e.g. 0) tiles having a screening probe signal beyond the thresholds and need to be discarded and to a second value (e.g. 1) the retained tiles (S10a) to form a filtered first screening probe signal data matrix; Mirroring the resulting filtered first screening probe signal data matrix on the target probe signal data matrix obtained under step S9b to form a filtered target probe signal data matrix (SlOb) to retain only the data for target probe signal for the tiles retained on the basis of their first screening probe signal;
- g: Step S11: data binning on both filtered first screening probe signal data and target signal data matrices and generation of sample output data;
- h: Steps S12a-d: generation of sample output including comparing scoring of the analyzed sample;
- i: Overview of the image analysis steps S4 to S12 iterated over the entire tile set (N) of the sample image of the method of the invention using target (HER2) probe signal, first screening (CK) probe signal and second screening (DAPI) probe signal.
-
Figure 2 is an illustration of the method of the invention using immunofluorescence imaging of a breast tumor surgically resected in the form of thin histological tissue slides for analysis as described in Example 1 and analyzed as described in Example 2.- A: Sample slide is clamped (biological sample immobilized on a sample support (1)) on a microfluidic device and applied short incubation times with imaging probes for IF staining (S2);
- B: The stained sample (2) is imaged using a fluorescent microscope (S3);
- C: Mosaic images (3) of the stained sample acquired in 3 fluorescent channels, corresponding to the signals of the second screening probe: DAPI (a), the first screening probe: CK (b), and the target probe: HER2 (c) and the merge by superimposition of the images (a) to (c) leading to image (d), respectively which are automatically and tile-by-tile analyzed (S5-S12).
- D: 2D scatter plot (S12a) showing the correlation between the averaged HER2 and CK signal per tile, for three samples with different IHC score obtained from routine analysis: 3+ (squares), 2+ (triangles) and 0 (dots). Scale bars: 10 mm for A & B, 100 µm for C.
-
Figure 3 is an illustration of a step of target evaluation (binary) mask applied on image tile processing in a method of the invention. The image processing is applied to a case where HER2 is overexpressed (A) and not expressed (B). The image processing uses DAPI channel to mask the locations of the nuclei ("DAPI mask"), while the CK channel indicates the location of epithelial cells, i.e. exactly the areas where the HER2 and CK signals should be interrogated ("CK mask"). This allows constructing a binary mask where the pixels of the tile appear then as black (discarded) or white (retained) and by applying this mask to the raw values, one obtains the masked tile from which can be extracted an average signal for the each of the CK and HER2 signals, obtained from the areas of interest only. Scale bar: 100 µm. -
Figure 4 is an illustration of an autothresholding step (S10a) based on CK signal intensity for removing tiles showing low CK signal from the data set for further analysis. A: Example of tissue areas with (top) and without (bottom) epithelial cells and visualized in the raw CK channel (two middle images: epithelial cells (EC) area, background area (BG)) and after running the image processing algorithm (two right images: high CK signal (HCK) and low CK signal (LCK)). B: Raw histograms of the intensity distribution of the CK (first row) and HER2 (second row) signals for aHER2 IHC 3+ case (left column) and a HER2 IHC 0 case (right column). Third row: HER2 histograms plotted after application of this CK filter where the tiles with a low CK signal intensity have been removed from the histogram for further analysis. -
Figure 5 represents scatter plot signatures obtained by the immunofluorescence method according to the invention (HER2 and CK signals: triangles) compared with the immunofluorescence signal obtained from the IHC3+ (squares) and IHC0 (dots) control samples of the batch, together with the corresponding HER2 gene copy number for 3 of the 25 invasive breast carcinoma cases as described in Example 2. The listed values for the cell-averaged HER2 gene copy number (NFISH ) were obtained from FISH routine analysis. HER2 status classification (Class) by the pathologist based on NFISH as follows: NFISH <4: Negative; 4≤ NFISH <6: Equivocal; NFISH ≥6: Positive. -
Figure 6 shows a comparison of histograms of borderline and control cases as described in Example 2 with the following IHC scores: One 3+ case (a), one 0 case (b), and three borderline cases (c1-c3). M-score: Mean value of the Gaussian fit of the histogram determining the mean HER2/CK value normalized by the mean of the 3+ control sample in the batch; ∑-score: Standard deviation (σ) of the Gaussian fit, normalized by σ of the 3+ control sample; MTP-score: product of the M- and ∑-scores. -
Figure 7 shows that the MTP-Score can estimate NFISH with a high confidence. A: M-score, B: ∑-score; C: MTP-score vs NFISH. HER2 status classification according to routine FISH analysis is indicated by the greyed zones, representing from left to right negative (Neg), equivocal (Equ) and positive (Pos) cases, respectively. ρ and α represent Pearson's coefficients and slopes of the power law fits, respectively. Error bars are obtained from Gaussian fits to the histogram data. -
Figure 8 shows the effect of the Ab incubation time on the proportionality of Ag and Ab signals. A: Fluorescent image of AF647 mouse antibodies used as Ag and spotted on an epoxy-functionalized glass slide with a concentration ranging from 0 to 1000 µg/mL; B: Fluorescent image of AF488 anti-mouse antibodies, used as Ab delivered and incubated using the MTP; C & D: normalized fluorescent signals of the spotted Ag and its recognizing Ab for an 1 h and 2 min incubation time, respectively, versus the Ag spotting concentrations; E & F: normalized fluorescent signals of the recognizing Ab versus the signals of the spotted Ag for an incubation time of 1 h and 2 min, respectively. -
Figure 9 shows the comparison of the use of short vs long Ab incubation times for accurate IF analysis. A: Histograms of the HER2/CK ratio obtained with (i) the method of the invention (MTP) using short incubation times, or (ii) an off-chip protocol using an incubation time of 1 hour; B: M-score plot; C: ∑-score plot. The triangle-shaped data points correspond to experiments done with the 1 hour incubation time, while the circular data points were obtained using a 2 min incubation time protocol in a micro fluidic device as described herein. The diamond shaped data points represent additional control stains done with the MTP using a long incubation time of 1 hour. -
Figure 10 illustrates schematically examples of possible tile generation processes, wherein the signal information oftiles interest - The term "sample" according to the invention refers to a biological sample immobilized on a sample support which includes biological samples derived from a tissue, fluid or secretion of the biological source, such as biopsy tissue samples, histology tissue samples, cell smears, needle biopsy samples or tissue microarrays.
- The term "tile" according to the invention refers to a portion of an image from a sample surface area. The portion of image represented by a tile might correspond to an acquired image of a surface portion of interest from the sample, or the portion of image represented by a tile may be obtained by subdividing an acquired image of the sample surface area into portions.
- The term "tiling" according to the invention refers to generating portions of an image of a sample over a sample surface area or to generate portions of an image of the sample. Examples of tiling process are illustrated on
Figure 10 . - The term "data binning" according to the invention refers to a known process in data processing which comprises allocating a single value to each of all the values comprised within a certain range of values.
- The term "screening probe" refers to an imaging probe which allows imaging a sample region of specific interest or a sample region to be discarded for further analysis.
- The term "target probe" refers to an imaging probe which allows imaging a target marker of specific interest within the sample. For example, a target marker is a protein, DNA, RNA marker which is present in a cell or a tissue and would be indicative of a disorder. For example, a target marker according to the invention is a protein expressed by a cancer cell.
- The term "marker" is a distinctive biological or biologically derived indicator of a process, event, or condition or of a specific cell or tissue compartment or area.
- The term "target marker" is a marker of interest for analysis which is indicative of a process, event, or a certain condition (as aging, disease, or exposure to a toxic substance, treatment or disease progression status) in a cell or biological sample or tissue which is useful for obtaining information useful for the diagnosis, prevention and/or treatment of disease or disorders.
- According to a particular embodiment, target markers are markers of cancer cells.
- According to a further embodiment, target markers are cancer cell membrane-associated molecules. According to a further embodiment, target markers are markers which are predominantly present in cancer cells of epithelial origin (carcinomas).
- According to a further embodiment, target markers are markers predominantly present in cancer cells from epithelial origin selected from PanCK (AE1-AE3), ER (Estrogen receptor), PR (Progesterone receptor), Ki67, P53, Epidermal growth factor receptor (EGFR), Thyroid transcription factor 1 (TTF-1), P63, Anaplastic lymphoma kinase (ALK), Napsin A, BRAF, Proto-oncogene tyrosine-protein kinase ROS (ROS1), Hepatocyte growth factor receptor (MET), RET, Phosphatidylinositol-3,4,5-trisphosphate 3-phosphatase (PTEN), PD-L1, Prostate specific antigen (PSA), Prostate specific membrane antigen (PSMA), Alpha-methylacyl-CoA racemase (AMACR), Prostatic acid phosphatase (PAP), Prostein (P5015), NKX3.1, CDX2, Carcinoembryonic antigen (CEA), mucins such as mucin 2 (MUC2) and mucin 5AC (MUC5AC), MutL homolog 1 (MLH1), MSH2, MSH6, PSM2 and human epidermal growth factor receptor 2 (HER2).
- According to a further embodiment, cancer cell membrane-associated molecules include, but are not limited to human epidermal growth factor receptor 2 (HER2), carcinoembryonic antigen (CEA), prostate-specific antigen (PSA), prostate specific membrane antigen (PSMA), and mucins such as mucin 2 (MUC2) and mucin 5AC (MUC5AC)
- In a further embodiment, target markers are markers for gynecological cancers such as breast cancer. In a further embodiment, target markers are markers for gynecological cancers for breast cancer such as PanC, ER, PR, Ki67, P5, Epidermal growth factor receptor and HER2.
- In another further embodiment, target markers are markers for lung cancer such as non-small cell lung cancer.
- In a further embodiment, target markers are markers for lung cancer such as TTF-1, P63, ALK, Napsin A, EGFR, BRAF, ROS1, MET, RET, PTEN and PD-L1.
- According to a particular embodiment, target markers are markers for gastrointestinal cancers such as colorectal cancers.
- In a further embodiment, target markers are markers for colorectal cancers such as thymidylate synthase (TS), CDX2, CEA, MUC2, MUC5AC, MLH1, MSH2, MSH6 and PSM2.
- According to a particular embodiment, target markers are markers for urinary track cancers such as bladder cancer.
- In a further embodiment, target markers are markers for bladder cancer such as Fibroblast FGFR3 and P53.
- According to a particular embodiment, target markers are markers for prostate cancer.
- In a further embodiment, target markers are markers for prostate cancer such as PSA, PSMA, AMACR, P63, PAP, P5015 and NKX3.1.
- Referring to
Figure 1 , is illustrated a method for quantitative measurement of a target marker by in situ immunofluorescence according to the invention comprising the steps of: - (i) providing a sample (1) immobilized on a sample support (S1);
- (ii) carrying out a staining step (S2) comprising incubating said sample with at least one target probe, at least one screening probe for imaging the sample region of interest (first screening probe) and optionally at least one screening probe for the sample region of non-interest to be discarded for further analysis (second screening probe), wherein incubation times of each of said probes with the sample are not higher 3-5 min (typically of about 1-3 min) to obtain a stained sample (2);
- (iii) acquiring images of the stained sample comprising imaging a signal emitted by each of the said imaging probes (S3), i.e. the first screening probe signal (C), the second screening probe signal (D) and the target probe signal (T);
- (iv) carrying out an image processing step (S4) defining image tiles (4) (e.g. typically regions of about 400 x 300 µm) based on the obtained images ("tiling") where the tiled image (3) is formed of 1 to n tiles and creating raw files with raw signal values for each imaging probe signal in each pixel (5) of each tile (4) of the tiled image (3);
- (v) generating a target evaluation mask comprising an active area for analysis of the target marker, comprising:
- a. carrying out a tile-specific threshold determination step (S5) for each screening probe signal in each tile (e.g. CK probe signal and DAPI probe signal);
- b. applying the tile-specific thresholding filter (S6) to each pixel (5) within the same tile (4) comprising setting to a first value (e.g. 0) pixels having a screening probe signal beyond the thresholds that need to be discarded and to a second value (e.g. 1) to the retained pixels;
- c. obtaining the target evaluation mark (S7) by multiplying the binary value for each pixel of the tile (e.g. 0 or 1) corresponding to the first screening probe signal with the binary value (e.g. 0 or 1) for the same pixel of the tile corresponding to the second screening probe signal to obtain a target evaluation mask (8) (e.g. target epithelial cell mask) for the tile (4), wherein the active area of the mask is defined by pixels comprising signals set to said second value;
- (vi) applying the active area of the target evaluation mask on raw values of screening probe signal data and on raw values of the target probe signal data by
- a. multiplying the obtained target evaluation mask (8) of the tile with the raw values of the first screening probe signal and with the raw values of the target probe signal, respectively for the same tile to generate screening probe signal data (9) C11 to Cjj (S8a) and target probe signal data (10) T11 to Tjj (S8b), respectively, for each pixel (1 to j) within a tile, where only a raw probe signal in the regions of interest remains (e.g. epithelial cell region);
- b. averaging the pixel data sets of screening probe signals over a tile to an average value Cav (e.g. average CK signal) and iterating this process over the N tiles to create a screening probe signal data matrix with all the average values Cav (C avll to C avnn ) for all the tiles (1 to N) to obtain a screening probe data set comprising values proportional to the raw signal values for the first screening probe for the active area;
- c. applying a threshold filter ("autothreshold") to the value of the screening probe signal data matrix comprising setting to a first value (e.g. 0) tiles having a screening probe signal beyond the thresholds and need to be discarded and to a second value (e.g. 1) the retained tiles (S10a) to form a filtered first screening probe signal data matrix (13') (e.g. filtered CK data matrix) to obtain a filtered first screening probe data set comprising values proportional to the raw signal values for the first screening probe for the filtered active area;
- (vii) Processing the signal of the target probe including
- a. averaging the pixel data sets of target probe signals over the same tile to an average value Tav (e.g. average HER2 signal) and iterating this process over the N tiles to create a target probe signal data matrix with all the average values Tav (T avll to T avnn ) for all the tiles (1 to N);
- b. Matching the resulting filtered first screening probe data set on the values of the target probe signal data matrix obtained under step S9b (S10b) to form a filtered target probe signal data matrix (14') (e.g. filtered HER2 data matrix) to retain only target probe signal data for the tiles retained on the basis of their first screening probe signal (e.g. signal from the epithelial cell regions) over the entire image (3) to obtain a target probe data set comprising target probe signal values for the active area
- (viii) carrying out a data binning step on both the filtered first screening probe signal data matrix (13') and the target signal data matrix (14') by setting to a single value all values Cavij or Tavij within the same range of values to generate values for the first screening probe signal and values for the target probe signal over the tiles retained for analysis to generate a sample output data;
- (ix) generating a sample output (S12), wherein said sample output comprises representing the values of the target probe signal versus the values of the first screening probe signal (such as generating a scatter plot (9), step S12a), wherein said sample output optionally further comprises the calculation of the ratios of target probe signals over the values of the first screening probe signals for each tile (S12b) and optionally a further step of generating a histogram (10) representing the frequencies of occurrence of a particular ratio (value of target probe signal over the value of the first screening probe signal) over the sample (i.e. number of tiles presenting such ratio) normalized to the number of tiles for a given sample (S12c);
- (x) Optionally generating a score for the sample (S12d) by comparing the output of said sample with outputs for a positive control sample (such as a cancer positive case) and a negative sample (non-cancerous sample) obtained by a method of the invention and/or generating a score for the sample by comparing the output of said sample with target marker levels obtained by other methods of marker quantification on reference samples.
- Referring to
Figure 1i , is provided an illustration of a specific embodiment regarding image processing steps (iv) to (xii) of a method according to the invention: - a) carrying out an imaging processing step (S4) comprising generating surface area units, "tiles" (44) ("tiling") of the images of the sample and creating raw files with raw signal values for pixel of a tile for each imaging probe, wherein for each pixel in a tile, there is a file for raw signals for the CK probe (411), for the signal for the DAPI probe (412) and for the signal of the HER2 probe (413);
- b) generating a target evaluation mask comprising
- (i) carrying out a tile-specific threshold determination step (S5) for each screening probe signal, i.e. over the raw signals for the CK probe (411) and for the DAPI probe (412) over a tile;
- (ii) applying the tile-specific thresholding filter (CK and DAPI masks) to each pixel of the same tile (S6) comprising setting to a first value (e.g. zero) the pixels having screening probe signals beyond the thresholds and setting pixels to a second value (e.g. 1), otherwise (retained pixels for further analysis), wherein the retained pixels for the CK probe signal correspond to pixels having a CK probe signal not higher nor lower than the CK tile-specific threshold and the retained pixels for the DAPI probe signal, those not having a DAPI probe signal higher than the DAPI tile-specific threshold;
- (iii)obtaining a target evaluation mask (S7) comprising multiplying for each pixel the binary value of the CK mask (e.g. 0 or 1) with the binary value of the DAPI mask (e.g. 0 or 1) to obtain a tile specific target evaluation mask (epithelial cell mask (81));
- c) Applying the active area of the target evaluation mask for a tile by
- (i) multiplying the said tile-specific epithelial cell mask (81) with the pixel raw values of the first screening probe signal (raw CK probe signal value (411)) and with the pixel raw values of the target probe signal (raw HER2 probe signal value (413)), respectively of the same tile to generate a screening probe signal data for each retained pixel and a target probe signal data for each retained pixel;
- (ii) Averaging the raw CK probe signal values of the retained pixels over one tile and the raw CK target probe signal values of the retained pixels over the same tile to obtain a tile-specific average CK signal (111) and an average HER2 signal (121)), respectively (S9a and S9b);
- d) repeating steps (b) to (c) for each tile of the image of the sample and obtaining data matrices containing the CK data ((13) and HER2 data (14)) for the N tiles;
- e) Filtering the values of the data matrices (CK data matrix (13) for the screening probe signal data (S10a) to generate a filtered CK data matrix (13'));
- f) Processing signals of the target probe comprising matching the filtered CK data matrix on the HER data matrix (14) to retain only the HER2 probe signal values corresponding to the tiles retained in the filtered CK data matrix to generate a filtered HER2 data matrix (14'));
- g) Carrying a data binning step (S11) of the values of the data of the obtained filtered matrices ((13') and (14')) to obtain a sample output data matrix;
- h) Generating a sample output (S12), based on the obtained sample data output matrix wherein said sample output comprises representing the values of the target probe signal (HER2 probe signal) versus the values of the first screening probe signal (CK probe signal) as a scatter plot (9).
- The invention having been described, the following examples are presented by way of illustration, and not limitation.
- The following abbreviations refer respectively to the definitions below:
FFPE (Formalin-Fixed, Paraffin-Embedded), HE (Hematoxylin and eosin); PBS (Phosphate Buffered Saline). - In order to assess the performance of the method of the invention and its ability to quantitatively score the level of overexpression of a biomarker of interest (in the present case, HER2 protein in breast carcinoma samples is the target marker) data obtained with the method of the invention were compared with the NFISH value and the HER2/CEP17 ratio provided by routine diagnostics as described below.
- Since HER2 protein is situated on epithelial cell membranes and cytokeratin (CK) constitutes a marker for epithelial cells and it has been widely used in carcinomas to distinguish epithelia from stroma (Barak et al., 2004, Clin. Biochem., 37, 529-540 ; Gustavson et al., 2009, Arch. Pathol., Lab. Med., 133, 1413-1419), the method of the invention is used wherein the staining step (i) is carried out by using a probe for HER2 (target probe) in combination with a probe for CK (first screening probe) to label the sample areas where the expression of HER2 should be interrogated during the fluorescence signal analysis, since it is expressed in epithelial cells.
- Then, since the target marker (HER2) is not expressed in the nucleus, a nucleus marker, DAPI, is used as a second screening probe during the staining step in order to label the sample areas where the expression of HER2 should not be interrogated during the fluorescence signal analysis.
- A microfluidic tissue processor as described in Ciftlik et al., 2013, Proc. Natl. Acad. Sci. 110, 5363-5368 has been used to perform the staining step by immunofluorescence on formalin-fixed paraffin-embedded (FFPE) sections of surgically resected human invasive breast carcinoma samples (
Fig. 2A ), retrieved from the archives of the Institute of Pathology at the University Hospital of Lausanne (Switzerland) as described below. By clamping the microfluidic microprocessor half-chamber with the tissue slide (Fig. 2B ), a shallow flow chamber with a height of 100 µm is formed, allowing fast and uniform delivery and washing of the reagents over a large surface (16 × 16 mm2) of the tissue section. A distributed microfluidic channel network (250-µm wide microfluidic channels) permitted homogeneous flow throughout the entire chamber and assured that convection was the dominant mechanism for the in-plane bioreagent transport and the method of the invention was performed as described below. - After clamping the microfluidic microprocessor with the glass slide, the staining protocol lasted about 10 minutes in total, including the washing steps, wherein the combined sequential use of Anti-human cytokeratin, clone AE1/AE3 and AF 647 goat anti-mouse IgG (H+L) was used as target probe (primary and secondary antibody, respectively for imaging the target), the combined sequential use of Anti-human c-erbB-2 oncoprotein and AF 594 goat anti-rabbit IgG (H+L) was used as a first screening probe (primary and secondary antibody, respectively for imaging the area of interest) as detailed in Table 1 below:
Table 1 Reagent Flow duration, s Incubation time, min Total time, s PBS buffer 10 - 10 Anti-human cytokeratin, clone AE1/ AE3 12 2 132 PBS buffer 10 - 10 Anti-human c-erbB-2 oncoprotein 12 2 132 PBS buffer 10 - 10 AF 594 goat anti-rabbit IgG (H+L) 12 2 132 PBS buffer 10 - 10 AF 647 goat anti-mouse IgG (H+L) 12 2 132 PBS buffer 10 - 10 Total 98 8 578 - PBS solution, used to wash the chamber in between steps, was delivered at 25 µL/s for 10 seconds. Antibody (Ab) solutions were delivered at 10 µL/s for 12 seconds, and incubated for 2 minutes with a slow flow of 20 nL/s. Upon finalization of the staining protocol, the tissue samples were washed off-chip with deionized water for ten seconds and mounted using 170-µm coverslips using a DAPI-containing solution. For the experimental design related to the incubation time, the typical values of IgG Ag-Ab binding constants were considered as kon (∼106 M-1) and koff (∼10-3 s-1). The bulk Ab concentration cbulk (∼10-8 M) was chosen large enough so that it is not a limiting factor for the Ab surface coverage and the IF signal in a Langmuir isotherm hypothesis. The binding constants allow to calculate the desorption time td = 1/koff ∼ 103 s, while the time constant of the recognition reaction is τ = 1/(kon cbulk + koff) ∼ 102 s. This forms the basis for the choice of the incubation time at the order of a few minutes.
- The tissue slide samples were first incubated with primary antibodies for HER2 and CK, in a sequential manner. In a second step, two fluorescently labeled secondary antibodies as described below were sequentially delivered into the chamber of the microfluidic microprocessor, first for HER2 and then for CK detection. Finally, the slides were washed with deionized water and cover-slipped using a solution containing 4',6-diamidino-2-phenylindole (DAPI) for nuclear counterstaining.
- After the staining process, the slides were automatically scanned tile-by-tile (e.g. regions of about 446 x 335µm) to obtain a mosaic image in three fluorescent channels, corresponding to the signals of DAPI, CK and HER2, respectively (
Fig. 2 , B-C). - Twenty-five samples from patients were carefully selected to span across a wide range of NFISH values, assessed at the Institute of Pathology according to 2013 ASCO recommendations (Wolff et al., 2013, J. Clin. Oncol. 31, 3997-4013). For the analysis by the method of the invention, the 25 cases were grouped into 5 batches that were processed sequentially. One positive (
IHC 3+ score) and one negative (IHC 0 score) control sample was included in each batch. The study has been conducted on anonymized tissues. - Breast carcinoma samples were obtained as 4 µm FFPE sections mounted on Super Frost Plus slides (Menzel-Glaser, Germany). Tissue samples were first heated for 10 min at 65 °C, then dewaxed using Histo-clear (National Diagnostics, GA, USA) for 10 min and rapidly rehydrated using ethanol solutions in decreasing concentrations (100%, 95%, 70% and 40% vol/vol) (Sigma-Aldrich, MO, USA). Subsequently, heat-induced Ag retrieval was done using sodium citrate buffer pH 6 (code: S1699 Dako, Denmark) for 10 min at 95 °C in a hot bath. The samples were then cooled down to room temperature for 20 min and immersed in phosphate buffered saline pH 7.4 (PBS) (Sigma Aldrich, MO, USA).
- The histological slides were inserted into the device to run the staining assay. PBS was used as a buffer for cleaning and priming of the fluidic path. Double-staining was performed using rabbit anti-human c-erbB-2 oncoprotein (code: A0485, Dako, Denmark) and mouse anti-human cytokeratin, clone AE1/AE3 (code M3515, Dako, Denmark), as primary antibodies, with a concentration of 1.28 µg/mL and 1.02 µg/mL, respectively. For fluorescent detection, Alexa Fluor 594 goat anti-rabbit IgG (H+L) (code: A-11037, Life Technologies, CA, USA) and Alexa Fluor 647 goat anti-mouse IgG (H+L) (code: A-21236, Life Technologies, CA, USA) secondary antibodies, at a concentration of 50 µg/mL, were employed. Nuclear counterstaining was realized using DAPI, included in Fluoroshield (code: F6057, Sigma Aldrich, MO, USA) mounting solution. All the antibodies were dissolved in a 0.05% (vol/vol) solution of Tween 20 (code: P137-9, Sigma Aldrich, MO, USA) in PBS.
- The microfluidic microprocessor (MTP) formed a fluidic halve-chamber that was reversibly clamped with a tissue slide using the force provided by a permanent magnet. When forming the MTP-glass slide fluidic chamber, the histological glass slide was clamped against the MTP via a polydimethylsiloxane gasket, both to fix the height of the reaction chamber to 100 µm and to prevent leakage. For interfacing the MTP with external fluidic control systems, a polymethylmetacrylate holder was assembled with the MTP. Fluid manipulation was realized using five syringe pumps (Cetoni, Germany) that were filled with the required reagents and connected to the inlet of the MTP via the holder.
- For routine determination of HER2 status of breast cancer cases, IHC was performed on 4 µm FFPE sections on the Ventana Benchmark automat (Ventana Medical Systems, AZ, USA). The samples were stained using Ventana anti-HER2/neu Ab (clone: 4B5) and scored according to current ASCO/CAP guidelines (Wolff et al., 2013, supra). FISH was done manually on 4 µm FFPE sections using the PathVysion HER-2 DNA probe kit (Abbott Molecular, IL, USA). Signal analysis was performed on a minimum of 40 nuclei per case after screening of the whole section.
- Slides were inserted in an automated epi-fluorescent microscope (Axio Imager M2m, Zeiss, Germany) and mosaic images were obtained using a CCD (charge-coupled device) camera. Images in three fluorescent channels, corresponding to the signals of DAPI, CK and HER2, respectively, were automatically obtained. Autofocusing, acquisition, scanning and stitching were done automatically. Prior to analysis, all images were checked if they contained artifacts that could influence the analysis. Based on this assessment,
cases 22 and 25 were removed from the dataset due to the lack of epithelial cells in the stained slide that eventually resulted in a Gaussian fit with a low adjusted R2 value of 0.4837 and 0.4806, respectively. The average image acquisition varies from 10 to 40 minutes, depending on the size of the sample. - Each tile from the resulting mosaic images obtained as described above was then analyzed by running an image-processing method as described in
Figure 1 which identified locations of CK expression and created a region of interest to limit the interrogation of the HER2 signal to epithelial areas only ("CK mask"). Information from the DAPI channel was used to remove the nuclei from the interrogation zones ("DAPI mask"), as the HER2 and CK markers of interest are not expressed in the nuclei. - The steps used in the analysis of the obtained images can be schematized in
Figure 1 . - OriginLab software (OriginLab Corporation, MA, USA) was used to obtain scatter plots, histograms and statistical values. The image-processing step comprising the whole process from creating binary masks for each image sub-element to the formation of scatter plots (steps S5 to S12) takes approximately 20 minutes per batch, giving an average of 3 minutes per sample.
- As a result of the tile processing, 2D scatter plots were obtained, in which the averaged HER2 and CK signals per tile were represented as points.
Fig. 2D is an example of such scatter plot, in which anIHC HER2 2+ (equivocal) case is compared to a 3+ and a 0 case, the latter two being used as positive and negative controls, respectively. The data from each scatter plot were subsequently processed to provide statistical indicators of HER2 expression as described inFigure 1g , which finally resulted in a sample scoring through the method of the invention ('MTP-score'). - In order to compare the information contained in the scatter plot signatures of HER2 protein expression for breast cancer cases obtained by a method of the invention, the corresponding HER2 copy number was obtained by routine FISH as follows:
Routine FISH analysis on the same samples gave a wide range of HER2 gene copy numbers (NFISH ) ranging from 1.9 to 15 (Table 2) where comparison is made between: - i) IHC scoring following 2013 ASCO/CAP guidelines (Wolff et al., 2013, supra);
- ii) NFISH;
- iii) HER2/CEP17 ratio;
- iv) HER2 status classification based on NFISH; and
- v) HER2 status classification according to 2013 ASCO/CAP guidelines (Wolff et al., 2013, supra).
- Table 2 shows the classification of IHC results for these 25 cases following the 2013 ASCO/CAP interpretation guidelines (Wolff et al., 2013, supra) by two blinded experienced pathologists. By routine HER2 FISH analysis, based on the NFISH values, 10 cases out of the 25 were classified as negative ( NFISH <4), 9 cases as positive ( NFISH ≥6), and 6 cases as equivocal (4≤ NFISH <6) (Neg., Pos., and Equ., respectively, in
Fig. 5 ). Although the 2013 ASCO/CAP guidelines for HER2 status classification also take into account the HER2/CEP17 ratio, it was decided for the purpose of this study to focus on the correlation between HER2 protein expression and NFISH. -
Case 13 was removed from the dataset inFig. 7 since a control HE slide showed that only ductal carcinoma in situ (DCIS) was left on the sections used for the study. Similarly,case 14 was removed from the dataset inFig. 7 because the section presented heterogeneous HER2 status, resulting in two NFISH values. Forcases 22 and 25, interpretation of routine IHC on the resected tumor specimen failed due to repeated tissue detachment from the glass slide. The IHC score indicated for these cases is the one found on the initial core biopsy.Table 2 Case i) IHC scoring ii) NFISH iii) HER2/CEP17 ratio iv) HER2 status based on NFISH v) HER2 status classification 1 2+ 1.9 0.76 negative negative 2 2+ 2.25 1.06 negative negative 3 1+ 2.30 1.01 negative negative 4 1+ 2.38 1.29 negative negative 5 1+ 2.54 1.20 negative negative 6 0 2.70 1.19 negative negative 7 0 2.80 1.22 negative negative 8 2+ 2.90 1.12 negative negative 9 2+ 3.10 1.60 negative negative 10 1+ 3.30 1.38 negative negative 11 2+ 4.38 1.80 equivocal equivocal 12 3+ 4.64 1.48 equivocal positive 13 2+ (only DCIS left) 4.85 2.09 equivocal positive 14 2+ 4.90/2.50 2.7/1.3 equivocal (heterogeneous) positive (heterogeneous) 15 1+ 4.90 2.30 equivocal positive 16 1+ 5.80 2.80 equivocal positive 17 2+ 6.13 2.08 positive positive 18 2+ 6.80 1.80 positive positive 19 3+ 7.60 3.30 positive positive 20 3+ 9.35 5.30 positive positive 21 3+ 9.40 2.60 positive positive 22 3+ 10.70 4.90 positive positive 23 3+ 13.00 3.40 positive positive 24 3+ 15.00 3.00 positive positive 25 3+ (on the core biopsy) 15.00 7.50 positive positive - 25 invasive breast carcinoma cases were selected and grouped into 5 batches and they were all processed in a batch sequentially in one experimental run according to the method of the invention, while one positive (
IHC 3+ score) and one negative (IHC 0 score) control sample were each time included in the batch. - The steps of the method according to the invention for the analysis of the obtained image was automated in the form of an algorithm in order to determine the regions of interest with epithelial cells and remove the background, as illustrated in
Fig. 1i , for each tile of the mosaic image of a given sample. This resulted in one average HER2 and CK signal per tile, which is represented by a point in a scatter plot for each patient. The scatter plot shows the correlation between the tile-averaged HER2 and CK signals (a), compared with the scatter plot data obtained from theIHC 3+ (b) and IHC 0 (c) control samples of the batch. The MTP score for each patient obtained as described below clearly correlated with NFISH obtained from routine analysis. - To exploit the scatter plot data, of which three examples are shown in
Fig. 5 , the scatter plot of a case under interrogation was compared to scatter plots obtained from absolute negative and positive control cases by following the following steps: - i) Calculating the ratio between HER2 and CK signals on a tile-by-tile basis;
- ii) Representing the thus obtained data array as a histogram, representing the frequency of occurrence of a given HER2/CK ratio normalized to the number of tiles.
-
Fig. 6 shows as examples the histograms obtained for five patients, to whom prior routine analysis attributed the following IHC scores: 3+ (a), 0 (b), and three cases (c1-c3) from which two scored as 2+ and one as 3+ and had NFISH values of 1.9, 4.4, and 9.4, respectively. The positive and negative controls were used as references of the expected HER2 signal intensities for each sample. For the three samples represented in c1-c3, the histograms shifted more towards the right as the NFISH increased, indicating an average increment in the acquired HER2 signal with respect to CK, when the number of HER2 gene copies was higher. Moreover, the widening of the histogram for high NFISH cases showed that the overexpression of HER2 also corresponded to a larger dispersion of the HER2 signal. A Gaussian fit of a histogram allowed determining the mean HER2/CK value and normalizing this by the mean obtained for theIHC 3+ control sample in the batch defined the M-score. Similarly, the standard deviation (σ) was extracted from the Gaussian fit of a histogram and normalized it by the σ value of the positive control of the batch to define the ∑-score. - Finally, the defined score (MTP-score) was determined for each sample as the product of the M- and ∑-scores. The three scores found by this analysis showed Pearson correlation coefficients of at least 0.9 against the NFISH values obtained by routine FISH analysis.
Fig. 7 shows the score values obtained using the method of analysis over the full set of cases used in this study. The M-, ∑-, and MTP-scores obtained a Pearson coefficient ρ of 0.90, 0.90, and 0.93, respectively, and an increasing exponent α of the power law fit (y ∼ xα ). - The score for each patient clearly correlated with NFISH obtained from routine analysis. At first sight already, the scatter plots of
Fig. 5 show that the samples assigned a low NFISH value (< ∼3) have a linear correlation of HER2 with CK, while for NFISH > ∼5, HER2 values get systematically higher and more dispersed. - This correlation demonstrates that MTP-scoring based on the method of the invention can indeed deliver quantitative information on the overexpression of HER2, which as precise as the gene copy number obtained by FISH.
- Altogether, the presented data support that a method of the invention proved to be very powerful in terms of quantifying target marker expression in histopathological tissue sections, significantly increasing the precision of the information that can be obtained by an immunoassay. In particular, experiments showed that HER2 biomarker quantification, as obtained by the presented method, can provide molecular information that is as precise as data obtained by FISH tests, while keeping the cost and time advantage of an IF assay.
- The linearity of the staining, combined with low-complexity image analysis, allowed to establish a continuous scoring that linearly followed the gene copy number as assessed by in situ hybridization.
- Interestingly, for
cases - It also shows that gene copy number gain is not always sufficient for protein overexpression. The scatter plot of
case 15 with NFISH value of 4.9 correlates more with the HER2-negative control signature with MTP-scores less than 0.1, suggesting that although there is a moderate copy number gain, there is no significant protein overexpression. Indeed,case 15 was considered equivocal/positive by FISH analysis, even though the IHC score was +1 (Table 2). - Therefore, a method of the invention and the integration of the obtained information to routine diagnostic workflows may imply a major leap towards the concretization of precision medicine and the so-obtained quantitative data can be used as a scoring aid to pathologists, to increase success of treatment response prediction and prognosis and can be applied to other markers in the field of cancer diagnostics.
- The CK channel could be used to define the areas where the expression of HER2 should be interrogated. ImageJ macros were applied tile-by-tile (n=40482) for the purpose of automation of the image processing algorithm.
- However, if in HER2-overexpressing samples (
Fig. 3B ), the use of the HER2 signal alone would be clearly sufficient to determine the regions of interest, for tumors that do not strongly overexpress HER2 (Fig. 3C ), it would be difficult to distinguish epithelial cells from surrounding parts in the tissue. Especially in these cases, employing the signal in the CK channel allowed to ensure that the regions of interest for the interrogation of the HER2 signal corresponded to epithelial cells, independently from the intensity of the HER2 signal. - As a result, every tile was first assigned an average signal value for the CK and HER2 signals. The thus obtained CK signal intensities were then analyzed and filtered, in a case-by-case fashion, in order to remove the tiles that had none or a few epithelial cells from further analysis. In particular, tiles which showed a CK average below a given threshold were automatically filtered out from the dataset (autothresholding) as shown on
Fig. 4 . - Finally, de facto establishing an upper threshold of the CK signal, 5% of the brightest tiles was removed for each case, to account for possible artifacts like small agglomerates of fluorophores that eventually result in the saturation of the fluorescent signal intensity.
- Consequently, all tiles that showed a CK value above the lower and below the upper thresholds were kept for further analysis.
- In order to assess the precision of the obtained IF staining with respect to conventional methods with longer incubation times, fluorescently labeled antigens (Ag) were immobilized on the surface of a glass slide with various volume concentrations, which ranged from 0 to 1'000 µg/mL.
- As depicted in
Fig. 8 , long incubation times of one hour for manual assays resulted in a non-linear relationship between the Ag fluorescent signal and its Ab, showing sudden Ab signal saturation with respect to its Ag concentration. On the contrary, when the incubation time for the Ab-Ag reaction was limited to 2 minutes, a signal from the antibodies that was more proportional to that of the Ags was obtained. The linear fit of the Ab-Ag signal plotted inFig. 8F resulted in a regression coefficient of 0.96. This experiment was performed using fluorescently labeled IgG and showed the advantage of reducing the incubation times (e.g. by using precise microfluidic IF) when compared to current standard protocols that use incubation times ranging from 30 minutes to a few hours. Even though the characteristics of the IgG spotting experiments do not fully correspond to those of the tissue, the recognition process is also based on an Ag-Ab interaction at a surface, like on a tissue slide. The implementation of a spotting microarray allowed obtaining a direct fluorescence signal from the Ags and compare it to the signal from the recognizing Abs in an analytical fashion. - On top of this, this assay allowed to create a controlled gradient of Ag concentrations on the same slide, which is not possible with tissue sections. Finally, a second incubation was performed with antibodies that recognized the previously incubated IgGs. The results also manifested that a short incubation time of 2 minutes gives a signal that is more proportional to the Ag concentration than an incubation time of one hour and that the IF signal was more proportional to the antigen concentration than what could be obtained by traditional IHC methods.
- The influence of the incubation time was further validated by performing an off-chip protocol with long incubation times (typically 1 hour) for the staining of actual tissue samples, after which IF was assessed using the same automatic image analysis protocol.
-
Figure 9 shows the histograms of the HER2/CK ratio for several cases, either obtained with (i) the using short incubation times (at the order of a few minutes), or (ii) the off-chip protocol using an incubation time of 1 hour. It can be seen that the histograms become broader and shift to higher HER2/CK ratios for cases treated with the long incubation time, rendering a less accurate assessment of the HER2 expression level, as evidenced in the plot of the M-score (Fig. 9B ) and the ∑-score (Fig. 9C ), especially for NFISH < 6, which is the interval for which equivocal results are encountered. - These results show that the obtained automated scores when using long incubation times have little or no diagnostic value for low NFISH values, the interval where quantitative results are most required in practical diagnostics. Using short incubation times with a method of the invention not only solves this problem but also provides a much more proportional score to quantitative results obtained with in-situ hybridization in the whole diagnostic range.
Claims (19)
- A method for quantitative measurement of a target marker by in situ immunofluorescence comprising the steps of:a) providing a sample immobilized on a sample support;b) carrying out a staining step comprising incubating said sample with at least one target probe, at least one screening probe for imaging the sample region of interest (first screening probe) and optionally at least one further screening probe for the sample region of non-interest to be discarded in further analysis (second screening probe), wherein incubation times of the sample with each of said probes are sufficiently low to avoid saturation of the sample with the probes, while ensuring suitable staining of the sample so that a linear relationship between the target marker concentration and the resultant fluorescent signal intensity can be formed, wherein incubation times of the sample with each of said probes are less than 16 minutes;c) acquiring an image of the stained sample comprising raw signals emitted by each of the imaging probes;d) generating a target evaluation mask comprising an active area for analysis of said target marker, comprising defining a threshold for signals of said at least one screening probe, and assigning binary values to screening probe signals, said binary values comprising a first value (for example 0) and a second value (for example 1), whereby screening probe signal values that are beyond said corresponding threshold are set to said first value, and screening probe signal values that are not beyond said corresponding threshold are set to said second value, said active area of the mask being defined by areas of the image comprising signals set to said second value;e) applying the active area of the target evaluation mask on the raw signal values of the first screening probe to obtain a screening probe data set comprising values proportional to the raw signal values of the first screening probe for the active area;f) processing signals of the target probe, including extracting target probe signal data limited to said active area to obtain a target probe data set comprising target probe signal values for the active area; andg) generating a sample output including combining said target probe data set with said screening probe data set to provide information on quantitative levels of the target marker.
- Method according to claim 1 wherein said incubation times are less than 8 minutes.
- Method according to claim 2, wherein said incubation times are less than 5 minutes.
- Method according to any preceding claim further including:- processing said image before generating said target evaluation mask, comprising defining tiles representing surface area portions of the image; and- effecting steps (d) and (e) on each tile.
- Method according to the preceding claim, wherein a said threshold is defined for each tile.
- Method according to the preceding claim wherein said threshold for a corresponding tile is defined by means of an autothresholding algorithm applied over said corresponding tile.
- Method according to any preceding claims, wherein said raw signals emitted by each of the imaging probes are raw signals of pixels of the image and wherein assigning screening probe signals to a first value or to a second value is performed on each pixel.
- Method according to any of the preceding claims in conjunction with claim 4, comprising in step (e): calculating, for each tile, an average of the values proportional to the raw signal values of the first screening probe for the active area, to obtain an average first screening probe signal value (111) per tile.
- Method according to any preceding claim, further comprising a second screening probe.
- Method according to the preceding claim, comprising defining a threshold for signals of said second screening probe, and assigning said binary values to the second screening probe signals, whereby second screening probe signal values that are beyond said corresponding threshold are set to the first value, and second screening probe signal values that are not beyond said corresponding threshold are set to the second value.
- Method according to the preceding claim wherein said generating a target evaluation mark comprises multiplying the binary values corresponding to the first screening probe signals with binary values corresponding to the second screening probe signals.
- Method according to any preceding claim, further including in step (e), filtering the screening probe data set, said filtering comprising defining a data set threshold, for instance by means of an autothresholding algorithm, and excluding data of the screening probe data set that are beyond said data set threshold, to obtain a filtered screening probe data set for a filtered active area.
- Method according to the preceding claim, including filtering the target probe data set, said filtering comprising excluding data of the target probe data set such that a filtered active area covered by the filtered target probe data set matches the filtered active area covered by the filtered screening probe data set.
- Method according to any preceding claim, comprising in step (f): applying the active area of the target evaluation mask on the raw signal values of the target screening probe to obtain values proportional to the raw signal values of the target probe for the active area.
- Method according to the preceding claim, in conjunction with claim 4, including: calculating, for each tile, an average of the values proportional to the raw signal values of the target probe for the active area, to obtain an average target probe signal value (121) per tile.
- Method according to any preceding claim, wherein in step (g), generating sample output comprises any one or more of:- representing in a graph, for instance in the form of a scatter plot (9), values of the target probe signal versus values of the first screening probe signal;- generating a histogram (10) representing the frequencies of occurrence of a ratio of target probe signal over the first screening probe signal for the sample;- generating a score for the sample by comparing the output of said sample with outputs for a positive control sample (such as a cancer positive case) and a negative control sample (non-cancerous sample) obtained by a method according to any of the preceding claims;- generating a score for the sample by comparing the output of said sample with target marker levels obtained by other methods.- calculating ratios of target probe signals over the values of the first screening probe signals for each tiles, and displaying;- generating a histogram (10) representing the frequencies of occurrence of a ratio of target probe signal over the first screening probe signal for the sample normalized to the number of tiles for a given sample.
- Method according to any preceding claim, wherein:- the first screening probe is an imaging probe for a marker of epithelial cells, for instance the first screening probe comprises an antibody specific for cytokeratin, such as anti-cytokeratin;- the target probe is an imaging probe for a membrane-associated molecule of a cancer cell such as human epidermal growth factor receptor 2 (HER2), or anaplastic lymphoma kinase (ALK), for instance, the target probe comprises an imaging probe for an antibody specific for HER2 such as anti-cerb-2;- optionally, the second screening probe is an imaging probe for a marker for the cells' nucleus, for instance the second screening probe is a dye specific for the cells' nucleus such as DAPI (4,6-diamidino-2- phenylindole).
- Method according to any preceding claim, wherein the elution step or washing step are conducted at a flow rate between 0.2 nl/s and 25 µl/s.
- Method according to any preceding claim wherein the incubation between each of said probes and the sample is conducted at a temperature from 25 to 60°C.
Applications Claiming Priority (2)
| Application Number | Priority Date | Filing Date | Title |
|---|---|---|---|
| EP16154745.0A EP3203413A1 (en) | 2016-02-08 | 2016-02-08 | Method for quantitative measurement of a biomarker by in situ immunofluorescence and uses thereof |
| PCT/EP2017/052717 WO2017137422A1 (en) | 2016-02-08 | 2017-02-08 | Method for quantitative measurement of a biomarker by in situ immunofluorescence and uses thereof |
Publications (2)
| Publication Number | Publication Date |
|---|---|
| EP3414704A1 EP3414704A1 (en) | 2018-12-19 |
| EP3414704B1 true EP3414704B1 (en) | 2019-12-11 |
Family
ID=55398192
Family Applications (2)
| Application Number | Title | Priority Date | Filing Date |
|---|---|---|---|
| EP16154745.0A Withdrawn EP3203413A1 (en) | 2016-02-08 | 2016-02-08 | Method for quantitative measurement of a biomarker by in situ immunofluorescence and uses thereof |
| EP17705060.6A Active EP3414704B1 (en) | 2016-02-08 | 2017-02-08 | Method for quantitative measurement of a biomarker by in situ immunofluorescence and uses thereof |
Family Applications Before (1)
| Application Number | Title | Priority Date | Filing Date |
|---|---|---|---|
| EP16154745.0A Withdrawn EP3203413A1 (en) | 2016-02-08 | 2016-02-08 | Method for quantitative measurement of a biomarker by in situ immunofluorescence and uses thereof |
Country Status (4)
| Country | Link |
|---|---|
| US (1) | US10509945B2 (en) |
| EP (2) | EP3203413A1 (en) |
| ES (1) | ES2776873T3 (en) |
| WO (1) | WO2017137422A1 (en) |
Families Citing this family (3)
| Publication number | Priority date | Publication date | Assignee | Title |
|---|---|---|---|---|
| US11515009B2 (en) | 2018-03-19 | 2022-11-29 | International Business Machines Corporation | Biomarker quantification in a tissue sample |
| US11030744B2 (en) * | 2018-06-26 | 2021-06-08 | Astrazeneca Computational Pathology Gmbh | Deep learning method for tumor cell scoring on cancer biopsies |
| CN110907796B (en) * | 2018-09-14 | 2022-02-08 | 长鑫存储技术有限公司 | Integrated circuit measurement result imaging analysis method and system |
Family Cites Families (8)
| Publication number | Priority date | Publication date | Assignee | Title |
|---|---|---|---|---|
| US6986993B1 (en) * | 1999-08-05 | 2006-01-17 | Cellomics, Inc. | System for cell-based screening |
| US7219016B2 (en) * | 2001-04-20 | 2007-05-15 | Yale University | Systems and methods for automated analysis of cells and tissues |
| JP2008536480A (en) * | 2005-02-17 | 2008-09-11 | ダナ−ファーバー キャンサー インスティテュート,インコーポレイテッド | Compositions, kits, and methods for cancer identification, evaluation, prevention, and treatment, and methods of cancer treatment |
| US11573235B2 (en) * | 2012-03-30 | 2023-02-07 | Leica Microsystems Cms Gmbh | Methods for generating an image of a biological sample |
| US20130338016A1 (en) * | 2012-04-17 | 2013-12-19 | Vala Sciences, Inc. | Method For Integrated Pathology Diagnosis And Digital Biomarker Pattern Analysis |
| US9778263B2 (en) * | 2013-11-13 | 2017-10-03 | General Electric Company | Quantitative in situ characterization of biological samples |
| JP6604960B2 (en) * | 2014-02-21 | 2019-11-13 | ベンタナ メディカル システムズ, インコーポレイテッド | Medical image analysis to identify biomarker positive tumor cells |
| JP6654634B2 (en) * | 2014-12-03 | 2020-02-26 | ベンタナ メディカル システムズ, インコーポレイテッド | Methods, systems and devices for quantitatively analyzing heterogeneous biomarker distributions |
-
2016
- 2016-02-08 EP EP16154745.0A patent/EP3203413A1/en not_active Withdrawn
-
2017
- 2017-02-08 ES ES17705060T patent/ES2776873T3/en active Active
- 2017-02-08 US US16/075,998 patent/US10509945B2/en active Active
- 2017-02-08 WO PCT/EP2017/052717 patent/WO2017137422A1/en active Application Filing
- 2017-02-08 EP EP17705060.6A patent/EP3414704B1/en active Active
Non-Patent Citations (1)
| Title |
|---|
| None * |
Also Published As
| Publication number | Publication date |
|---|---|
| US20190347465A1 (en) | 2019-11-14 |
| ES2776873T3 (en) | 2020-08-03 |
| EP3203413A1 (en) | 2017-08-09 |
| EP3414704A1 (en) | 2018-12-19 |
| WO2017137422A1 (en) | 2017-08-17 |
| US10509945B2 (en) | 2019-12-17 |
Similar Documents
| Publication | Publication Date | Title |
|---|---|---|
| Dixon et al. | Recent developments in multiplexing techniques for immunohistochemistry | |
| Dupouy et al. | Continuous quantification of HER2 expression by microfluidic precision immunofluorescence estimates HER2 gene amplification in breast cancer | |
| Ross et al. | Circulating and disseminated tumor cells in the management of breast cancer | |
| Hicks et al. | Assessment of the HER2 status in breast cancer by fluorescence in situ hybridization: a technical review with interpretive guidelines | |
| Shipitsin et al. | Automated quantitative multiplex immunofluorescence in situ imaging identifies phospho-S6 and phospho-PRAS40 as predictive protein biomarkers for prostate cancer lethality | |
| Holten-Rossing et al. | Optimizing HER2 assessment in breast cancer: application of automated image analysis | |
| JP2022169540A (en) | Methods and systems for quantitative immunohistochemistry | |
| Jakabova et al. | Molecular characterization and heterogeneity of circulating tumor cells in breast cancer | |
| EP3117259B1 (en) | Assessment of staining quality | |
| EP3414704B1 (en) | Method for quantitative measurement of a biomarker by in situ immunofluorescence and uses thereof | |
| Nguyen et al. | Microfluidics-assisted fluorescence in situ hybridization for advantageous human epidermal growth factor receptor 2 assessment in breast cancer | |
| Schwamborn | The importance of histology and pathology in mass spectrometry imaging | |
| Kwon et al. | A microfluidic immunostaining system enables quality assured and standardized immunohistochemical biomarker analysis | |
| Fowler et al. | Tissue microarrays: construction and uses | |
| Kang et al. | Cytopathological study of the circulating tumor cells filtered from the cancer patients’ blood using hydrogel-based cell block formation | |
| Kashyap et al. | Quantitative microimmunohistochemistry for the grading of immunostains on tumour tissues | |
| Oyejide et al. | Molecular pathology: Applications in nonclinical drug development | |
| Zoppoli et al. | Her2 assessment using quantitative reverse transcriptase polymerase chain reaction reliably identifies Her2 overexpression without amplification in breast cancer cases | |
| Kelloff et al. | Biomarker development in the context of urologic cancers | |
| Schiavon et al. | Evaluation of reliability of FISH versus brightfield dual-probe in situ hybridization (BDISH) for frontline assessment of HER2 status in breast cancer samples in a community setting: influence of poor tissue preservation | |
| Furrer et al. | Concordance of HER2 immunohistochemistry and fluorescence in situ hybridization using tissue microarray in breast cancer | |
| Yaseen et al. | Validation of an accurate automated multiplex immunofluorescence method for immuno-profiling melanoma | |
| Sode et al. | Digital image analysis and assisted reading of the HER2 score display reduced concordance: pitfalls in the categorisation of HER2‐low breast cancer | |
| Caselli et al. | Looking for more reliable biomarkers in breast cancer: Comparison between routine methods and RT-qPCR | |
| Barresi et al. | Prognostic relevance of histopathological features in signet ring cell carcinoma of the colorectum |
Legal Events
| Date | Code | Title | Description |
|---|---|---|---|
| STAA | Information on the status of an ep patent application or granted ep patent |
Free format text: STATUS: UNKNOWN |
|
| STAA | Information on the status of an ep patent application or granted ep patent |
Free format text: STATUS: THE INTERNATIONAL PUBLICATION HAS BEEN MADE |
|
| PUAI | Public reference made under article 153(3) epc to a published international application that has entered the european phase |
Free format text: ORIGINAL CODE: 0009012 |
|
| STAA | Information on the status of an ep patent application or granted ep patent |
Free format text: STATUS: REQUEST FOR EXAMINATION WAS MADE |
|
| 17P | Request for examination filed |
Effective date: 20180814 |
|
| AK | Designated contracting states |
Kind code of ref document: A1 Designated state(s): AL AT BE BG CH CY CZ DE DK EE ES FI FR GB GR HR HU IE IS IT LI LT LU LV MC MK MT NL NO PL PT RO RS SE SI SK SM TR |
|
| AX | Request for extension of the european patent |
Extension state: BA ME |
|
| DAV | Request for validation of the european patent (deleted) | ||
| DAX | Request for extension of the european patent (deleted) | ||
| GRAP | Despatch of communication of intention to grant a patent |
Free format text: ORIGINAL CODE: EPIDOSNIGR1 |
|
| STAA | Information on the status of an ep patent application or granted ep patent |
Free format text: STATUS: GRANT OF PATENT IS INTENDED |
|
| INTG | Intention to grant announced |
Effective date: 20190920 |
|
| RAP1 | Party data changed (applicant data changed or rights of an application transferred) |
Owner name: ECOLE POLYTECHNIQUE FEDERALE DE LAUSANNE (EPFL) |
|
| GRAS | Grant fee paid |
Free format text: ORIGINAL CODE: EPIDOSNIGR3 |
|
| GRAA | (expected) grant |
Free format text: ORIGINAL CODE: 0009210 |
|
| STAA | Information on the status of an ep patent application or granted ep patent |
Free format text: STATUS: THE PATENT HAS BEEN GRANTED |
|
| AK | Designated contracting states |
Kind code of ref document: B1 Designated state(s): AL AT BE BG CH CY CZ DE DK EE ES FI FR GB GR HR HU IE IS IT LI LT LU LV MC MK MT NL NO PL PT RO RS SE SI SK SM TR |
|
| REG | Reference to a national code |
Ref country code: GB Ref legal event code: FG4D |
|
| REG | Reference to a national code |
Ref country code: CH Ref legal event code: EP Ref country code: CH Ref legal event code: NV Representative=s name: REUTELER AND CIE S.A., CH |
|
| REG | Reference to a national code |
Ref country code: AT Ref legal event code: REF Ref document number: 1212917 Country of ref document: AT Kind code of ref document: T Effective date: 20191215 |
|
| REG | Reference to a national code |
Ref country code: DE Ref legal event code: R096 Ref document number: 602017009618 Country of ref document: DE |
|
| REG | Reference to a national code |
Ref country code: IE Ref legal event code: FG4D |
|
| REG | Reference to a national code |
Ref country code: SE Ref legal event code: TRGR |
|
| REG | Reference to a national code |
Ref country code: NL Ref legal event code: MP Effective date: 20191211 |
|
| REG | Reference to a national code |
Ref country code: LT Ref legal event code: MG4D |
|
| PG25 | Lapsed in a contracting state [announced via postgrant information from national office to epo] |
Ref country code: BG Free format text: LAPSE BECAUSE OF FAILURE TO SUBMIT A TRANSLATION OF THE DESCRIPTION OR TO PAY THE FEE WITHIN THE PRESCRIBED TIME-LIMIT Effective date: 20200311 Ref country code: FI Free format text: LAPSE BECAUSE OF FAILURE TO SUBMIT A TRANSLATION OF THE DESCRIPTION OR TO PAY THE FEE WITHIN THE PRESCRIBED TIME-LIMIT Effective date: 20191211 Ref country code: LV Free format text: LAPSE BECAUSE OF FAILURE TO SUBMIT A TRANSLATION OF THE DESCRIPTION OR TO PAY THE FEE WITHIN THE PRESCRIBED TIME-LIMIT Effective date: 20191211 Ref country code: LT Free format text: LAPSE BECAUSE OF FAILURE TO SUBMIT A TRANSLATION OF THE DESCRIPTION OR TO PAY THE FEE WITHIN THE PRESCRIBED TIME-LIMIT Effective date: 20191211 Ref country code: NO Free format text: LAPSE BECAUSE OF FAILURE TO SUBMIT A TRANSLATION OF THE DESCRIPTION OR TO PAY THE FEE WITHIN THE PRESCRIBED TIME-LIMIT Effective date: 20200311 Ref country code: GR Free format text: LAPSE BECAUSE OF FAILURE TO SUBMIT A TRANSLATION OF THE DESCRIPTION OR TO PAY THE FEE WITHIN THE PRESCRIBED TIME-LIMIT Effective date: 20200312 |
|
| PG25 | Lapsed in a contracting state [announced via postgrant information from national office to epo] |
Ref country code: HR Free format text: LAPSE BECAUSE OF FAILURE TO SUBMIT A TRANSLATION OF THE DESCRIPTION OR TO PAY THE FEE WITHIN THE PRESCRIBED TIME-LIMIT Effective date: 20191211 Ref country code: RS Free format text: LAPSE BECAUSE OF FAILURE TO SUBMIT A TRANSLATION OF THE DESCRIPTION OR TO PAY THE FEE WITHIN THE PRESCRIBED TIME-LIMIT Effective date: 20191211 |
|
| PG25 | Lapsed in a contracting state [announced via postgrant information from national office to epo] |
Ref country code: AL Free format text: LAPSE BECAUSE OF FAILURE TO SUBMIT A TRANSLATION OF THE DESCRIPTION OR TO PAY THE FEE WITHIN THE PRESCRIBED TIME-LIMIT Effective date: 20191211 |
|
| PG25 | Lapsed in a contracting state [announced via postgrant information from national office to epo] |
Ref country code: NL Free format text: LAPSE BECAUSE OF FAILURE TO SUBMIT A TRANSLATION OF THE DESCRIPTION OR TO PAY THE FEE WITHIN THE PRESCRIBED TIME-LIMIT Effective date: 20191211 Ref country code: RO Free format text: LAPSE BECAUSE OF FAILURE TO SUBMIT A TRANSLATION OF THE DESCRIPTION OR TO PAY THE FEE WITHIN THE PRESCRIBED TIME-LIMIT Effective date: 20191211 Ref country code: CZ Free format text: LAPSE BECAUSE OF FAILURE TO SUBMIT A TRANSLATION OF THE DESCRIPTION OR TO PAY THE FEE WITHIN THE PRESCRIBED TIME-LIMIT Effective date: 20191211 Ref country code: PT Free format text: LAPSE BECAUSE OF FAILURE TO SUBMIT A TRANSLATION OF THE DESCRIPTION OR TO PAY THE FEE WITHIN THE PRESCRIBED TIME-LIMIT Effective date: 20200506 Ref country code: EE Free format text: LAPSE BECAUSE OF FAILURE TO SUBMIT A TRANSLATION OF THE DESCRIPTION OR TO PAY THE FEE WITHIN THE PRESCRIBED TIME-LIMIT Effective date: 20191211 |
|
| REG | Reference to a national code |
Ref country code: ES Ref legal event code: FG2A Ref document number: 2776873 Country of ref document: ES Kind code of ref document: T3 Effective date: 20200803 |
|
| PG25 | Lapsed in a contracting state [announced via postgrant information from national office to epo] |
Ref country code: IS Free format text: LAPSE BECAUSE OF FAILURE TO SUBMIT A TRANSLATION OF THE DESCRIPTION OR TO PAY THE FEE WITHIN THE PRESCRIBED TIME-LIMIT Effective date: 20200411 Ref country code: SK Free format text: LAPSE BECAUSE OF FAILURE TO SUBMIT A TRANSLATION OF THE DESCRIPTION OR TO PAY THE FEE WITHIN THE PRESCRIBED TIME-LIMIT Effective date: 20191211 Ref country code: SM Free format text: LAPSE BECAUSE OF FAILURE TO SUBMIT A TRANSLATION OF THE DESCRIPTION OR TO PAY THE FEE WITHIN THE PRESCRIBED TIME-LIMIT Effective date: 20191211 |
|
| REG | Reference to a national code |
Ref country code: DE Ref legal event code: R097 Ref document number: 602017009618 Country of ref document: DE |
|
| REG | Reference to a national code |
Ref country code: AT Ref legal event code: MK05 Ref document number: 1212917 Country of ref document: AT Kind code of ref document: T Effective date: 20191211 |
|
| PLBE | No opposition filed within time limit |
Free format text: ORIGINAL CODE: 0009261 |
|
| STAA | Information on the status of an ep patent application or granted ep patent |
Free format text: STATUS: NO OPPOSITION FILED WITHIN TIME LIMIT |
|
| REG | Reference to a national code |
Ref country code: BE Ref legal event code: MM Effective date: 20200229 |
|
| PG25 | Lapsed in a contracting state [announced via postgrant information from national office to epo] |
Ref country code: MC Free format text: LAPSE BECAUSE OF FAILURE TO SUBMIT A TRANSLATION OF THE DESCRIPTION OR TO PAY THE FEE WITHIN THE PRESCRIBED TIME-LIMIT Effective date: 20191211 Ref country code: LU Free format text: LAPSE BECAUSE OF NON-PAYMENT OF DUE FEES Effective date: 20200208 Ref country code: DK Free format text: LAPSE BECAUSE OF FAILURE TO SUBMIT A TRANSLATION OF THE DESCRIPTION OR TO PAY THE FEE WITHIN THE PRESCRIBED TIME-LIMIT Effective date: 20191211 |
|
| 26N | No opposition filed |
Effective date: 20200914 |
|
| PG25 | Lapsed in a contracting state [announced via postgrant information from national office to epo] |
Ref country code: AT Free format text: LAPSE BECAUSE OF FAILURE TO SUBMIT A TRANSLATION OF THE DESCRIPTION OR TO PAY THE FEE WITHIN THE PRESCRIBED TIME-LIMIT Effective date: 20191211 Ref country code: SI Free format text: LAPSE BECAUSE OF FAILURE TO SUBMIT A TRANSLATION OF THE DESCRIPTION OR TO PAY THE FEE WITHIN THE PRESCRIBED TIME-LIMIT Effective date: 20191211 |
|
| PG25 | Lapsed in a contracting state [announced via postgrant information from national office to epo] |
Ref country code: IE Free format text: LAPSE BECAUSE OF NON-PAYMENT OF DUE FEES Effective date: 20200208 |
|
| PG25 | Lapsed in a contracting state [announced via postgrant information from national office to epo] |
Ref country code: BE Free format text: LAPSE BECAUSE OF NON-PAYMENT OF DUE FEES Effective date: 20200229 Ref country code: PL Free format text: LAPSE BECAUSE OF FAILURE TO SUBMIT A TRANSLATION OF THE DESCRIPTION OR TO PAY THE FEE WITHIN THE PRESCRIBED TIME-LIMIT Effective date: 20191211 |
|
| REG | Reference to a national code |
Ref country code: DE Ref legal event code: R079 Ref document number: 602017009618 Country of ref document: DE Free format text: PREVIOUS MAIN CLASS: G06K0009000000 Ipc: G06V0010000000 |
|
| PG25 | Lapsed in a contracting state [announced via postgrant information from national office to epo] |
Ref country code: TR Free format text: LAPSE BECAUSE OF FAILURE TO SUBMIT A TRANSLATION OF THE DESCRIPTION OR TO PAY THE FEE WITHIN THE PRESCRIBED TIME-LIMIT Effective date: 20191211 Ref country code: MT Free format text: LAPSE BECAUSE OF FAILURE TO SUBMIT A TRANSLATION OF THE DESCRIPTION OR TO PAY THE FEE WITHIN THE PRESCRIBED TIME-LIMIT Effective date: 20191211 Ref country code: CY Free format text: LAPSE BECAUSE OF FAILURE TO SUBMIT A TRANSLATION OF THE DESCRIPTION OR TO PAY THE FEE WITHIN THE PRESCRIBED TIME-LIMIT Effective date: 20191211 |
|
| PG25 | Lapsed in a contracting state [announced via postgrant information from national office to epo] |
Ref country code: MK Free format text: LAPSE BECAUSE OF FAILURE TO SUBMIT A TRANSLATION OF THE DESCRIPTION OR TO PAY THE FEE WITHIN THE PRESCRIBED TIME-LIMIT Effective date: 20191211 |
|
| PGFP | Annual fee paid to national office [announced via postgrant information from national office to epo] |
Ref country code: FR Payment date: 20230221 Year of fee payment: 7 Ref country code: CH Payment date: 20230307 Year of fee payment: 7 |
|
| PGFP | Annual fee paid to national office [announced via postgrant information from national office to epo] |
Ref country code: SE Payment date: 20230216 Year of fee payment: 7 Ref country code: IT Payment date: 20230223 Year of fee payment: 7 |
|
| P01 | Opt-out of the competence of the unified patent court (upc) registered |
Effective date: 20230527 |
|
| PGFP | Annual fee paid to national office [announced via postgrant information from national office to epo] |
Ref country code: ES Payment date: 20230427 Year of fee payment: 7 |
|
| PGFP | Annual fee paid to national office [announced via postgrant information from national office to epo] |
Ref country code: ES Payment date: 20240301 Year of fee payment: 8 |
|
| PGFP | Annual fee paid to national office [announced via postgrant information from national office to epo] |
Ref country code: DE Payment date: 20240228 Year of fee payment: 8 Ref country code: GB Payment date: 20240227 Year of fee payment: 8 Ref country code: CH Payment date: 20240301 Year of fee payment: 8 |