EP3388799A2 - Infrared detection system - Google Patents
Infrared detection system Download PDFInfo
- Publication number
- EP3388799A2 EP3388799A2 EP18166882.3A EP18166882A EP3388799A2 EP 3388799 A2 EP3388799 A2 EP 3388799A2 EP 18166882 A EP18166882 A EP 18166882A EP 3388799 A2 EP3388799 A2 EP 3388799A2
- Authority
- EP
- European Patent Office
- Prior art keywords
- infrared
- wavelength
- infrared detector
- temperature
- spectrum
- Prior art date
- Legal status (The legal status is an assumption and is not a legal conclusion. Google has not performed a legal analysis and makes no representation as to the accuracy of the status listed.)
- Withdrawn
Links
- 238000001514 detection method Methods 0.000 title claims abstract description 198
- 238000010521 absorption reaction Methods 0.000 claims abstract description 86
- 238000012937 correction Methods 0.000 claims abstract description 82
- 238000000862 absorption spectrum Methods 0.000 claims abstract description 58
- 238000010408 sweeping Methods 0.000 claims abstract description 41
- 238000003860 storage Methods 0.000 claims abstract description 28
- 238000001228 spectrum Methods 0.000 claims description 132
- 230000005855 radiation Effects 0.000 claims description 24
- 238000005259 measurement Methods 0.000 claims description 23
- 239000002096 quantum dot Substances 0.000 claims description 19
- 230000003287 optical effect Effects 0.000 claims description 18
- 238000000034 method Methods 0.000 claims description 15
- 238000012545 processing Methods 0.000 claims description 11
- 238000006073 displacement reaction Methods 0.000 claims description 7
- 238000004590 computer program Methods 0.000 claims 1
- 239000007789 gas Substances 0.000 description 27
- 238000010586 diagram Methods 0.000 description 24
- 230000005457 Black-body radiation Effects 0.000 description 18
- 238000006243 chemical reaction Methods 0.000 description 8
- 230000000694 effects Effects 0.000 description 8
- 230000008859 change Effects 0.000 description 6
- 230000031700 light absorption Effects 0.000 description 6
- 239000000523 sample Substances 0.000 description 6
- 239000013074 reference sample Substances 0.000 description 5
- 238000009826 distribution Methods 0.000 description 4
- MWUXSHHQAYIFBG-UHFFFAOYSA-N Nitric oxide Chemical compound O=[N] MWUXSHHQAYIFBG-UHFFFAOYSA-N 0.000 description 2
- 230000004888 barrier function Effects 0.000 description 2
- 238000002329 infrared spectrum Methods 0.000 description 2
- 238000004519 manufacturing process Methods 0.000 description 2
- 239000000463 material Substances 0.000 description 2
- 230000035945 sensitivity Effects 0.000 description 2
- 238000004088 simulation Methods 0.000 description 2
- XLYOFNOQVPJJNP-UHFFFAOYSA-N water Chemical compound O XLYOFNOQVPJJNP-UHFFFAOYSA-N 0.000 description 2
- UGFAIRIUMAVXCW-UHFFFAOYSA-N Carbon monoxide Chemical compound [O+]#[C-] UGFAIRIUMAVXCW-UHFFFAOYSA-N 0.000 description 1
- 229910000661 Mercury cadmium telluride Inorganic materials 0.000 description 1
- CBENFWSGALASAD-UHFFFAOYSA-N Ozone Chemical compound [O-][O+]=O CBENFWSGALASAD-UHFFFAOYSA-N 0.000 description 1
- 238000002835 absorbance Methods 0.000 description 1
- 230000008901 benefit Effects 0.000 description 1
- MCMSPRNYOJJPIZ-UHFFFAOYSA-N cadmium;mercury;tellurium Chemical compound [Cd]=[Te]=[Hg] MCMSPRNYOJJPIZ-UHFFFAOYSA-N 0.000 description 1
- 229910002091 carbon monoxide Inorganic materials 0.000 description 1
- 238000011161 development Methods 0.000 description 1
- 230000006870 function Effects 0.000 description 1
- 238000011835 investigation Methods 0.000 description 1
- 238000012986 modification Methods 0.000 description 1
- 230000004048 modification Effects 0.000 description 1
- 230000008569 process Effects 0.000 description 1
- 230000005701 quantum confined stark effect Effects 0.000 description 1
Images








Classifications
-
- G—PHYSICS
- G01—MEASURING; TESTING
- G01J—MEASUREMENT OF INTENSITY, VELOCITY, SPECTRAL CONTENT, POLARISATION, PHASE OR PULSE CHARACTERISTICS OF INFRARED, VISIBLE OR ULTRAVIOLET LIGHT; COLORIMETRY; RADIATION PYROMETRY
- G01J3/00—Spectrometry; Spectrophotometry; Monochromators; Measuring colours
- G01J3/02—Details
- G01J3/0297—Constructional arrangements for removing other types of optical noise or for performing calibration
-
- G—PHYSICS
- G01—MEASURING; TESTING
- G01J—MEASUREMENT OF INTENSITY, VELOCITY, SPECTRAL CONTENT, POLARISATION, PHASE OR PULSE CHARACTERISTICS OF INFRARED, VISIBLE OR ULTRAVIOLET LIGHT; COLORIMETRY; RADIATION PYROMETRY
- G01J3/00—Spectrometry; Spectrophotometry; Monochromators; Measuring colours
- G01J3/28—Investigating the spectrum
-
- G—PHYSICS
- G01—MEASURING; TESTING
- G01J—MEASUREMENT OF INTENSITY, VELOCITY, SPECTRAL CONTENT, POLARISATION, PHASE OR PULSE CHARACTERISTICS OF INFRARED, VISIBLE OR ULTRAVIOLET LIGHT; COLORIMETRY; RADIATION PYROMETRY
- G01J3/00—Spectrometry; Spectrophotometry; Monochromators; Measuring colours
- G01J3/28—Investigating the spectrum
- G01J3/42—Absorption spectrometry; Double beam spectrometry; Flicker spectrometry; Reflection spectrometry
-
- G—PHYSICS
- G01—MEASURING; TESTING
- G01J—MEASUREMENT OF INTENSITY, VELOCITY, SPECTRAL CONTENT, POLARISATION, PHASE OR PULSE CHARACTERISTICS OF INFRARED, VISIBLE OR ULTRAVIOLET LIGHT; COLORIMETRY; RADIATION PYROMETRY
- G01J5/00—Radiation pyrometry, e.g. infrared or optical thermometry
- G01J5/0014—Radiation pyrometry, e.g. infrared or optical thermometry for sensing the radiation from gases, flames
-
- G—PHYSICS
- G01—MEASURING; TESTING
- G01J—MEASUREMENT OF INTENSITY, VELOCITY, SPECTRAL CONTENT, POLARISATION, PHASE OR PULSE CHARACTERISTICS OF INFRARED, VISIBLE OR ULTRAVIOLET LIGHT; COLORIMETRY; RADIATION PYROMETRY
- G01J5/00—Radiation pyrometry, e.g. infrared or optical thermometry
- G01J5/10—Radiation pyrometry, e.g. infrared or optical thermometry using electric radiation detectors
- G01J5/20—Radiation pyrometry, e.g. infrared or optical thermometry using electric radiation detectors using resistors, thermistors or semiconductors sensitive to radiation, e.g. photoconductive devices
-
- G—PHYSICS
- G01—MEASURING; TESTING
- G01J—MEASUREMENT OF INTENSITY, VELOCITY, SPECTRAL CONTENT, POLARISATION, PHASE OR PULSE CHARACTERISTICS OF INFRARED, VISIBLE OR ULTRAVIOLET LIGHT; COLORIMETRY; RADIATION PYROMETRY
- G01J3/00—Spectrometry; Spectrophotometry; Monochromators; Measuring colours
- G01J3/28—Investigating the spectrum
- G01J2003/2859—Peak detecting in spectrum
-
- G—PHYSICS
- G01—MEASURING; TESTING
- G01N—INVESTIGATING OR ANALYSING MATERIALS BY DETERMINING THEIR CHEMICAL OR PHYSICAL PROPERTIES
- G01N21/00—Investigating or analysing materials by the use of optical means, i.e. using sub-millimetre waves, infrared, visible or ultraviolet light
- G01N21/17—Systems in which incident light is modified in accordance with the properties of the material investigated
- G01N21/25—Colour; Spectral properties, i.e. comparison of effect of material on the light at two or more different wavelengths or wavelength bands
- G01N21/31—Investigating relative effect of material at wavelengths characteristic of specific elements or molecules, e.g. atomic absorption spectrometry
- G01N21/35—Investigating relative effect of material at wavelengths characteristic of specific elements or molecules, e.g. atomic absorption spectrometry using infrared light
- G01N21/3504—Investigating relative effect of material at wavelengths characteristic of specific elements or molecules, e.g. atomic absorption spectrometry using infrared light for analysing gases, e.g. multi-gas analysis
- G01N2021/3531—Investigating relative effect of material at wavelengths characteristic of specific elements or molecules, e.g. atomic absorption spectrometry using infrared light for analysing gases, e.g. multi-gas analysis without instrumental source, i.e. radiometric
Definitions
- the present disclosure relates to an infrared detection system.
- thermal units such as bolometers are widely used as infrared detectors.
- a thermal infrared detector measures temperature changes occurring when infrared light is absorbed. As such, the detector cannot respond quickly, and the wavelengths to be measured cannot be selected.
- optical infrared detectors utilizing carrier generation from entering photons are also known.
- the wavelength of the maximum sensitivity can be selected by changing the ratio of these components, and thus the detector can handle both a Mid-Wavelength Infrared Range (MWIR) and a Long-Wavelength Infrared Range (LWIR).
- MWIR Mid-Wavelength Infrared Range
- LWIR Long-Wavelength Infrared Range
- Quantum Well Infrared Photodetector QWIP
- Quantum Dot Infrared Photodetector QDIP
- Shih-Yen Lin et al. Voltage-tunable two-color quantum-dot infrared photodetectors
- Appl. Phys. Lett. Vol. 95 (12), 123504-123504-3, 2009 .
- Joe C. Campbell et al. “Quantum-Dot Infrared Photodetectors;
- materials By optimizing dot growth processes, materials have been produced that demonstrate potential, with further development, for high-performance infrared sensing", Proceedings of IEEE, Vol. 95 (9), 2007, pp. 1815-1827 .
- These infrared detectors have structures in which a quantum well layer or quantum dot layer is layered as a light absorption layer, and have a characteristic of being able to shift the wavelength of maximum sensitivity by varying a bias voltage applied to the light absorption layer.
- JP 10-096667 A is an example of a patent document of relation to the present disclosure. This document is to provide an automatic temperature conversion table creation method that can create a temperature conversion table in an infrared detector without taking actual measurements for each optical system configuration of lenses, window members, and filters used.
- the inventors of the present application investigated a system of a quantum well infrared detector or a quantum dot infrared detector in which the radiation spectrum of a measuring object is detected by sweeping a bias voltage sweep, and the temperature of the measuring object is then estimated based on the detected radiation spectrum.
- the inventors of the present application discovered the following problems through these investigations.
- the Full Width at Half Maximum (FWHM) of the absorption wavelength for a given bias voltage may be from 2 to 3 ⁇ m.
- a similar FWHM may also be found in a quantum well detector.
- an atmospheric window which corresponds to mid-wavelength infrared ranges (from 3.4 ⁇ m to 5.5 ⁇ m) and long-wavelength infrared regions (from 8 ⁇ m to 14 ⁇ m).
- the atmospheric window for mid-wavelength infrared ranges (from 3.4 ⁇ m to 5.5 ⁇ m) is divided into a range of from 3.4 ⁇ m to 4.2 ⁇ m and a range of from 4.4 ⁇ m to 5.5 ⁇ m, but will be denoted simply as from 3.4 ⁇ m to 5.5 ⁇ m in this specification.
- Infrared light from 4.2 ⁇ m to 4.4 ⁇ m does not reach far distances and thus may be handled in the same manner as the range from 5.5 ⁇ m to 8 ⁇ m.
- the width of the atmospheric window is approximately from 2 to 3 times the FWHM of the absorption wavelengthof electromagnetic waves by a quantum well or quantum dot infrared detector.
- the energy absorption ratio of the infrared detector will appear to be different between near the borders of the atmospheric window and near the center of the atmospheric window.
- the shape of the detection spectrum will therefore differ from the actual shape, e.g., the peak positions will be different.
- one object of the present disclosure is to accurately detect a spectrum of infrared light radiated from a measuring object in an infrared detection system using an infrared detector, such as a quantum well infrared detector or a quantum dot infrared detector, that can detect infrared light while sweeping an absorption peak wavelength in the detection spectrum of the infrared light.
- an infrared detector such as a quantum well infrared detector or a quantum dot infrared detector
- An infrared detection system includes an infrared detector, a storage, and a correction calculator.
- the infrared detector is configured to detect infrared light by absorbing and photoelectrically converting infrared light of a specific wavelength range.
- the infrared detector is capable of sweeping an absorption peak wavelength of an absorption spectrum of infrared light.
- the storage is configured to store a plurality of correction coefficients for correcting a detection value from the infrared detector in accordance with the absorption peak wavelength of the infrared detector with respect to a wavelength range of an atmospheric window.
- the correction calculator is configured to correct the detection value from the infrared detector for each absorption peak wavelength using corresponding correction coefficients stored in the storage.
- the spectrum of infrared light radiated from a measuring object can be accurately detected.
- FIG. 1 is a block diagram illustrating the overall configuration of an infrared detection system according to a first embodiment.
- an infrared detection system 100 includes an infrared detector 110, a storage 140, and a processing circuit 130.
- the infrared detector 110 is a photoelectric conversion element configured to absorb infrared light 210 radiated onto a light-receiving surface 111 from a measuring object 200 and converts the absorbed photons into a charge.
- the infrared detector 110 can detect infrared light while sweeping an absorption peak wavelength of an absorption spectrum (i.e., a wavelength where the absorption spectrum is at a peak value).
- a spectrum detected by the infrared detector while sweeping the absorption peak wavelength will be called a "detection spectrum" in the following descriptions.
- the wavelength ranges that can be detected by the infrared detector 110 include a Mid-Wavelength Infrared Range (MWIR), i.e., infrared light in a wavelength range of from 3.4 ⁇ m to 5.5 ⁇ m, and a Long-Wavelength Infrared Range (LWIR), i.e. infrared light in a wavelength range of from 8 ⁇ m to 14 ⁇ m. These wavelength ranges are called “atmospheric windows”.
- MWIR Mid-Wavelength Infrared Range
- LWIR Long-Wavelength Infrared Range
- FIG. 1 illustrates a single infrared detector 110
- an imager constituted of a plurality of elements rather than a single element can also be used in the infrared detection system 100 of the present embodiment.
- the storage 140 is configured to store, as a correction table 141, a plurality of correction coefficients for correcting detection values from the infrared detector 110 in accordance with the absorption peak wavelength of the infrared detector 110 with respect to the wavelength range of the atmospheric window.
- a correction table 141 a plurality of correction coefficients for correcting detection values from the infrared detector 110 in accordance with the absorption peak wavelength of the infrared detector 110 with respect to the wavelength range of the atmospheric window.
- the processing circuit 130 may be configured as a microcomputer including a processor and memory, or may be configured as a Field Programmable Gate Array (FPGA). Alternatively, the processing circuit 130 may be configured as a dedicated integrated circuit. Functionally speaking, the processing circuit 130 includes a correction calculator 131, a temperature determiner 132, and a measurement controller 133.
- FPGA Field Programmable Gate Array
- the correction calculator 131 is configured to correct the detection value from the infrared detector 110 based on the correction table 141. Particularly, the correction calculator 131 is configured to correct the detection value from the infrared detector 110 for each absorption peak wavelength of the infrared detector 110, using the corresponding correction coefficient stored in the storage 140.
- the temperature determiner 132 determines the temperature of the measuring object 200 based on a shape of the corrected spectrum, e.g., the peak wavelength.
- the measurement controller 133 is configured to control operations of the infrared detector 110.
- the measurement controller 133 is configured to sweep the absorption peak wavelength of the absorption spectrum of the infrared detector 110 by sweeping a bias voltage applied to an infrared detection element 120.
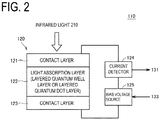
- FIG. 2 is a block diagram schematically illustrating an example of the configuration of the infrared detector illustrated in FIG. 1 .
- the configuration of the infrared detector 110 illustrated in FIG. 2 is merely an example, and the configuration of the infrared detector 110 that can be applied in the infrared detection system 100 of the present embodiment is not limited to the configuration illustrated in FIG. 2 .
- the infrared detector 110 includes the infrared detection element 120, a bias voltage source 125, and a current detector 124.
- the bias voltage source 125 and the current detector 124 may be consolidated into a single circuit.
- the infrared detection element 120 includes a light absorption layer 122 and contact layers 121 and 123 arranged on respective sides of the light absorption layer 122. There may be electrode layers in contact with the contact layers 121 and 123, and in this case, the bias voltage source 125 and the current detector 124 are connected to the contact layers 121 and 123 by the electrode layers.
- the light absorption layer 122 has a structure in which quantum well layers and barrier layers are layered in a repeating manner (a layered quantum well layer) or a structure in which quantum dot layers and barrier layers are layered in a repeating manner (a layered quantum dot layer).
- a bias voltage from the bias voltage source 125 is applied via the contact layers 121 and 123.
- the layered quantum well layer and the layered quantum dot layer change the infrared light absorption peak wavelength in accordance with the bias voltage through the quantum-confined Stark effect.
- the measurement controller 133 can sweep the peak wavelength of the absorption spectrum by causing the bias voltage source 125 to vary the bias voltage. Note that the relationship between the value of the bias voltage and the absorption peak wavelength is obtained in advance through experimentation or simulations.
- the infrared detection element 120 may have any configuration as long as the absorption peak can be changed by varying the bias voltage. However, using quantum wells or quantum dots makes it easier to set the amount by which the absorption wavelength shifts with respect to the bias voltage value according to a material and/or a shape.
- the current detector 124 is configured to detect current flowing in the infrared detection element 120.
- a difference between current when being irradiated by the infrared light 210 and dark current when not being irradiated by the infrared light 210 corresponds to photocurrent proportional to the intensity of the infrared light 210.
- the intensity of the infrared light 210 radiated from the measuring object 200 can be calculated on based on the magnitude of the photocurrent.
- FIG. 3 is a diagram illustrating a relationship between an intensity distribution of the absorption spectrum of the infrared detector and the atmospheric windows.
- an "atmospheric window” an atmospheric window A and an atmospheric window B, in FIG. 3
- a mid-wavelength infrared range from 3.4 ⁇ m to 5.5 ⁇ m
- a long-wavelength infrared range from 8 ⁇ m to 14 ⁇ m
- the FWHM of the absorption spectrum for a given bias voltage can be from 2 to 3 ⁇ m or greater.
- a similar FWHM may also be found in a quantum well infrared detector.
- FIG. 3 illustrates examples in which the peak wavelength of the absorption spectrum of the infrared detector 110 is 8 ⁇ m, 10 ⁇ m, and 14 ⁇ m.
- a shape of each absorption spectrum is a Gaussian distribution, and the Full Width at Half Maximum (FWHM) of each absorption spectrum is 3 ⁇ m.
- FWHM Full Width at Half Maximum
- each absorption spectrum has the same peak value in FIG. 3 .
- the peak value of the absorption spectrum may be different in accordance with the absorption peak wavelength.
- the width of the atmospheric window is approximately from 2 to 3 times the FWHM of the absorption wavelength of electromagnetic waves by the infrared detector. Accordingly, approximately half of the absorption spectrum is outside the atmospheric window when the absorption peak is 8 ⁇ m and 14 ⁇ m. There are ranges of the absorption spectrum outside the atmospheric window even at absorption peak wavelengths between these peaks. As a result, compared to when the absorption peak wavelength is near the center of the atmospheric window, when the absorption peak wavelength is near a border of the atmospheric window, the detection value from the infrared detector 110 will be a lower value even in a case where the energy of the electromagnetic waves radiated from the measuring object is the same. This trend is more remarkable as the FWHM of the absorption spectrum of the infrared detector 110 gets boarder.
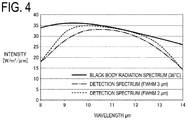
- FIG. 4 is a diagram illustrating a relationship between a black body radiation spectrum at 36°C and a detection spectrum by the infrared detector.
- the solid line graph represents the black body radiation spectrum at 36°C.
- the broken line graph represents the detection spectrum when the FWHM of the absorption spectrum of the infrared detector 110 is 2 ⁇ m.
- the dot-dash line graph represents the detection spectrum when the FWHM of the absorption spectrum of the infrared detector 110 is 3 ⁇ m.
- the detection spectrum by the infrared detector 110 has a different shape (peak wavelength, curvature, and the like) from the black body radiation spectrum at 36°C.
- the black body radiation spectrum has a peak at approximately 9.4 ⁇ m at 36°C
- a peak appears in the detection spectrum near 10 ⁇ m when the FWHM of the absorption spectrum of the infrared detector 110 is 2 ⁇ m.
- a peak appears in the detection spectrum near 11 ⁇ m when the FWHM of the absorption spectrum of the infrared detector 110 is 3 ⁇ m.
- the emissivity drops when the measuring object is not a perfectly black body, depending on the surface shape of the measuring object, and the like, the shape of the detection spectrum does not change.
- correction coefficients determined for each absorption peak wavelength are stored in the storage 140 as the correction table 141.
- the correction coefficients change in accordance with the absorption peak wavelength of the infrared detector 110 with respect to the wavelength range of the atmospheric window.
- the inverse of a percentage that can be absorbed in the long-wavelength range atmospheric window of from 8 to 14 ⁇ m for each absorption peak wavelength of the infrared detector 110 i.e., an effective absorption rate for each absorption peak wavelength
- the correction calculator 131 illustrated in FIG. 1 corrects the detection value from the infrared detector 110 by multiplying the value with the corresponding correction coefficient stored in the correction table 141.
- FIG. 5 is a diagram illustrating an example of the correction table.
- values normalized by an integral of the absorption spectrum throughout the entire wavelength range and an integral of the absorption spectrum throughout a wavelength range of from 8 to 14 ⁇ m are indicated as the correction coefficients.
- Values approximated by Gaussian distribution as indicated in FIG. 3 may be used as the shape of each absorption spectrum.
- the actual shape of the absorption spectrum is horizontally symmetrical, and cases where the peak value differs depending on the peak wavelength (the influence of these is reflected in the calculated correction coefficients).
- FIG. 5 indicates the absorption peak wavelength in 1 ⁇ m intervals, the correction coefficients are actually calculated at finer wavelength intervals.
- the correction coefficients are indicated for each peak wavelength of each absorption spectrum, but the correction coefficients may be indicated for each of bias voltages.
- a conversion table for converting the bias voltages into absorption spectrum peak wavelengths may be held separately in the storage 140, and the correction calculator 131 may carry out the conversion.
- the correction table may be constituted by the absorption spectrum peak wavelengths, the bias voltages corresponding thereto, and the correction coefficients for each set thereof.
- FIG. 6 is a diagram illustrating a relationship between a black body radiation spectrum at 36°C and a corrected detection spectrum.
- the solid line graph represents the black body radiation spectrum at 36°C.
- the broken line graph indicates a corrected spectrum obtained by multiplying the detection spectrum from the infrared detector 110 in a case where the FWHM is 2 ⁇ m, indicated by the broken line in FIG. 4 , by the correction coefficient for the case where the FWHM is 2 ⁇ m, indicated in FIG. 5 .
- the dot-dash line graph indicates a corrected spectrum obtained by multiplying the detection spectrum from the infrared detector 110 in a case where the FWHM is 3 ⁇ m, indicated by the broken line in FIG. 4 , by the correction coefficient for the case where the FWHM is 3 ⁇ m, indicated in FIG. 5 .
- the shape of the corrected spectrum in FIG. 6 is closer to the shape of the black body radiation spectrum at 36°C.
- the black body radiation spectrum has a peak at approximately 9.4 ⁇ m at 36°C, and a peak appears in the corrected spectrum near 9.4 ⁇ m when the FWHM of the absorption spectrum is 2 ⁇ m.
- a peak appears in the corrected spectrum near 10 ⁇ m when the FWHM of the absorption spectrum is 3 ⁇ m.
- the value is closer to the original peak wavelength of the black body radiation spectrum at 36°C than with the detection spectrum illustrated in FIG. 4 .
- the closer to both ends of the atmospheric window i.e., 8 ⁇ m and 14 ⁇ m
- the temperature T may be determined based on a table that holds relationships between temperatures T calculated based on Formula (2) and the peak wavelengths ⁇ max [ ⁇ m] as a database.
- the peak wavelength ⁇ max is 9.4 ⁇ m, for a temperature T of 36°C, which means that the correction is essentially accurate.
- the peak wavelength ⁇ max is different, meaning that the temperature cannot be detected accurately. Accordingly, with the infrared detection system 100 of the present embodiment, the temperature of the measuring object can be detected more accurately in the case where the radiation peak wavelength is far from both ends of the atmospheric window, i.e., 8 ⁇ m and 14 ⁇ m, due to the FWHM being comparatively narrow or the temperature of the measuring object being low to a certain extent.
- FIG. 7 is a flowchart illustrating a temperature determination sequence performed by the infrared detection system according to the first embodiment.
- the temperature determination sequence performed by the infrared detection system will be described next with reference to FIGS. 1 , 2 , and 7 , while summarizing the descriptions given thus far.
- step S100 the measurement controller 133 sets the bias voltage to be applied to the infrared detection element 120 of the infrared detector 110 to an initial value.
- the value of the bias voltage corresponds to the peak wavelength of the absorption spectrum of the infrared detector 110.
- step S110 the infrared detector 110 detects photocurrent produced by photoelectric conversion of the infrared light 210 entering from the measuring object 200 at the set bias voltage.
- the measurement controller 133 sets the bias voltage to correspond to the peak wavelength of each absorption spectrum.
- step S120 the correction calculator 131 converts the bias voltage into an absorption peak wavelength and reads out, from the correction table 141 stored in the storage 140, the correction coefficient corresponding to the absorption peak wavelength obtained from the conversion. The correction calculator 131 then multiplies the read-out correction coefficient to correct the value detected in step S120.
- step S140 the measurement controller 133 changes the bias voltage to be applied to the infrared detection element 120 of the infrared detector 110.
- the peak wavelength of the absorption spectrum of the infrared detector 110 is changed as a result.
- the measurement controller 133 ends the measurement (YES in step S130).
- the corrected spectrum data which is data obtained by correcting the detection spectrum data from the infrared detector 110 according to the correction table 141, is generated as a result. Then, in step S150, the temperature determiner 132 calculates the temperature from the peak wavelength of the corrected spectrum according to Wien's displacement law. This completes the temperature determination sequence.
- the detection value from the infrared detector 110 is corrected with a correction coefficient based on the absorption peak wavelength of the absorption spectrum of the infrared detector 110. Accordingly, the radiation spectrum of the measuring object and the temperature thereof can be detected accurately even in a case where the shape of the absorption spectrum of the infrared detector 110 appears to have changed in wavelength ranges near the borders of an atmospheric window.
- the above-described correction coefficient can be calculated as long as the absorption spectrum of the infrared detector 110 is known.
- the temperature of the measuring object can be detected more easily then when using a method in which many known temperature reference samples are prepared.
- a second embodiment differs from the first embodiment in terms of the timing at which the measurement controller 133 finishes sweeping the bias voltage. Specifically, the bias voltage sweep is stopped at the point in time when the peak wavelength of the corrected spectrum is found. This makes it possible to shorten the time for measuring the temperature of the measuring object, and thus the amount of power consumed by the infrared detection system 100 can be suppressed. This will be described hereinafter with reference to the drawings.
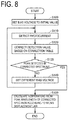
- FIG. 8 is a flowchart illustrating a temperature detection sequence performed by the infrared detection system according to the second embodiment.
- the flowchart of FIG. 8 corresponds to the flowchart of FIG. 7 , and differs from the flowchart in that step S135 is carried out instead of step S130.
- step S135 the measurement controller 133 determines whether the detection value from the infrared detector 110 corrected using the correction table 141 has indicated a peak value (maximum value), i.e., whether a peak value is present in the corrected spectrum, in the bias voltage range swept up until that point in time.
- a peak value i.e., whether a peak value is present in the corrected spectrum
- the bias voltage sweep is stopped at that point in time, and the temperature determiner 132 determines the temperature of the measuring object 200 in the following step S150.
- step S140 the measurement controller 133 changes the bias voltage to be applied to the infrared detection element 120 of the infrared detector 110.
- the peak wavelength of the absorption spectrum of the infrared detector 110 is changed as a result.
- FIG. 8 is the same as the flowchart of FIG. 7 in other respects, and thus the same reference signs are assigned to corresponding steps, and descriptions thereof will not be repeated.
- the configuration of the infrared detection system according to the second embodiment is also the same as that of the first embodiment, described with reference to FIG. 1 , and thus descriptions thereof will not be repeated.
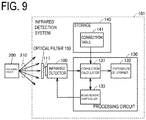
- FIG. 9 is a block diagram illustrating the overall configuration of an infrared detection system according to a third embodiment.
- An infrared detection system 101 illustrated in FIG. 9 differs from the infrared detection system 100 illustrated in FIG. 1 in that an optical filter 150 covering the light-receiving surface 111 of the infrared detection system 100 is further included.
- the optical filter 150 is configured to block the mid-wavelength infrared range of from 3.4 ⁇ m to 5.5 ⁇ m when measuring the long-wavelength infrared range of from 8 ⁇ m to 14 ⁇ m.
- the optical filter 150 may be constituted by a filter configured to block the long-wavelength infrared range of from 8 ⁇ m to 14 ⁇ m, thus only the mid-wavelength infrared range of from 3.4 ⁇ m to 5.5 ⁇ m is measured.
- the optical filter may be constituted by a combination of filters configured to block a plurality of wavelength ranges, including at least a filter that blocks the mid-wavelength infrared range of from 3.4 ⁇ m to 5.5 ⁇ m and a filter than blocks the long-wavelength infrared range of from 8 ⁇ m to 14 ⁇ m.
- An infrared detection system differs from the infrared detection system according to the first embodiment in that the method through which the temperature determiner 132 calculates the temperature is different.
- the configuration of the infrared detection system 100 is the same as in the first embodiment, described with reference to FIG. 1 , in other respects, and thus detailed descriptions thereof will not be repeated.
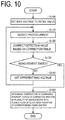
- FIG. 10 is a flowchart illustrating a temperature determination sequence performed by the infrared detection system according to the fourth embodiment. Steps S100 to S140 in FIG. 10 are the same as in the first embodiment, described with reference to FIG. 7 , and thus descriptions thereof will not be repeated. When these steps are executed, the infrared detector 110 generates the detection spectrum, and the correction calculator 131 generates the corrected spectrum by correcting the detection spectrum using the correction table 141.
- the temperature determiner 132 calculates the temperature of the measuring object 200 based on Planck's law of black body radiation, indicated below as Formula (3).
- B( ⁇ ) represents a radiation intensity at a wavelength ⁇
- h Planck's constant
- c represents the speed of light
- k B represents Boltzmann's constant
- T [K] represents temperature.
- B ⁇ 2 hc 2 ⁇ 5 1 exp hc ⁇ k B T ⁇ 1
- the temperature determiner 132 is configured to calculate an intensity ratio of corrected spectra at wavelengths ⁇ 1 and ⁇ 2 , and compares the spectrum intensity ratios with Planck's law of black body radiation at the same wavelengths ⁇ 1 and ⁇ 2 to find the temperature T at which the ratios coincide.
- the temperature determiner 132 may calculate a plurality of intensity ratios of the corrected spectra at different wavelengths and compare the spectrum intensity ratios with Planck's law of black body radiation at the corresponding wavelengths to determine the temperature T through the least squares method, for example. This makes it possible to estimate the temperature T more precisely than when using only the ratio at two wavelengths.
- the temperature of the measuring object 200 can be calculated even when there is no peak value in the corrected spectrum.
- the infrared detection system of the fourth embodiment can also be combined with the infrared detection systems of the second and third embodiments.
- An infrared detection system is a combination of the infrared detection system of the first embodiment and the infrared detection system of the fourth embodiment, and a characteristic thereof lies in the method through which the temperature determiner 132 calculates the temperature.
- the configuration of the infrared detection system 100 illustrated in FIG. 1 is the same as those described in the first embodiment and the fourth embodiment in other respects, and thus detailed descriptions thereof will not be repeated.
- FIG. 11 is a flowchart illustrating a temperature detection sequence performed by the infrared detection system according to the fifth embodiment. Steps S100 to S140 in FIG. 11 are the same as in the first embodiment, described with reference to FIG. 7 , and in the fourth embodiment, described with reference to FIG. 10 , and thus descriptions thereof will not be repeated.
- the infrared detector 110 generates the detection spectrum
- the correction calculator 131 generates the corrected spectrum by correcting the detection spectrum using the correction table 141.
- step S145 the temperature determiner 132 determines whether there is a peak value in the corrected spectrum.
- step S150 the temperature determiner 132 calculates the temperature from the peak wavelength of the corrected spectrum according to Wien's displacement law.
- step S160 the temperature determiner 132 calculates an intensity ratio of corrected spectra at wavelengths ⁇ 1 and ⁇ 2 , and compares the spectrum intensity ratios with Planck's law of black body radiation at the same wavelengths ⁇ 1 and ⁇ 2 to find the temperature T at which the ratios coincide.
- the temperature determiner 132 may calculate a plurality of intensity ratios of the corrected spectra at different wavelengths and compare the spectrum intensity ratios with Planck's law of black body radiation at the corresponding wavelengths to determine the temperature T through the least squares method, for example.
- the temperature of the measuring object 200 can be calculated regardless of whether there is a peak value in the corrected spectrum.
- the infrared detection system of the fifth embodiment can also be combined with the infrared detection systems of the second and third embodiments.
- a sixth embodiment describes an infrared detection system that detects the temperature of the measuring object 200 based on a plurality of instances of reference data 142 calculated by the infrared detector 110 while sweeping a bias voltage with respect to a plurality of reference samples, each sample having a plurality of known temperatures.
- FIG. 12 is a block diagram illustrating the overall configuration of the infrared detection system according to the sixth embodiment.
- An infrared detection system 102 illustrated in FIG. 12 is a variation on the infrared detection system 100 illustrated in FIG. 1 .
- the infrared detection system 102 includes the infrared detector 110, the storage 140, and a processing circuit 130A.
- the functions and specific configuration of the infrared detector 110 are as described in the first embodiment with reference to FIGS. 1 and 2 , and thus descriptions thereof will not be repeated.
- the storage 140 stores a reference data table 142.
- the reference data table 142 includes a plurality of instances of reference data detected by the infrared detector 110 while sweeping a bias voltage with respect to a plurality of reference samples, each sample having a plurality of known temperatures.
- the reference data is detection spectrum data obtained in advance for each of the plurality of known temperatures.
- the reference samples may be ideal black bodies, or may be gray bodies having known emissivity.
- the reference samples may be gray bodies with unknown emissivity, in a case where there is no wavelength dependency for the emissivity.
- the processing circuit 130A may be configured as a microcomputer including a processor and memory, or may be configured as a FPGA. Alternatively, the processing circuit 130A may be configured as a dedicated integrated circuit. Functionally speaking, the processing circuit 130A includes the temperature determiner 132 and the measurement controller 133.
- the temperature determiner 132 determines the temperature of the measuring object 200 by comparing detection data obtained while sweeping the bias voltage of the infrared detector 110 with respect to the measuring object 200 (this corresponds to the detection spectrum) with the reference data for each known temperature. Specifically, the temperature determiner 132 calculates a ratio between the detection data and the reference data corresponding to each known temperature on a wavelength-by-wavelength basis, and determines the temperature of the measuring object 200 based on the known temperature for the case where the wavelength dependency of the calculated ratio is the lowest. The method through which the temperature determiner 132 determines the temperature of the measuring object will be described in detail hereinafter.
- FIG. 13 is a diagram illustrating an example of the reference data table in the infrared detection system according to the sixth embodiment. As illustrated in FIG. 13 , reference data in which the reference sample temperatures are 30°C, 35°C, and 40°C is associated with different wavelengths. Each reference data value is obtained by converting a detected photocurrent to a spectrum intensity.
- the reference sample temperatures are set at intervals of 5°C in FIG. 13
- the temperature of the measuring object 200 can be calculated more precisely by setting the reference sample temperatures at finer intervals.
- the wavelengths are set at intervals of 1 ⁇ m in FIG. 13 , susceptibility to the effects of error can be reduced by setting the wavelengths at finer intervals, which in turn makes it possible to improve the temperature detection accuracy.
- limiting the number of wavelengths to only several wavelengths makes it possible to shorten the detection time of the infrared detector 110 and the time for calculating the temperature.
- FIG. 14 is a diagram illustrating the detection data of the measuring object at 36°C with an emissivity of 0.95, and the reference data illustrated in FIG. 13 .
- the solid line graph in FIG. 14 represents the detection data of the measuring object.
- the reference data obtained for the 30°C reference samples is represented by the diamond-shaped points; the reference data obtained for the 35°C reference samples, by the square points; and the reference data obtained for the 40°C reference samples, by the triangular points.
- the detection data is located between the 30°C reference data and the 35° reference data, and thus at a glance, the data of the measuring object may be determined to be between 30°C and 35°C.
- the above result is obtained because there is not a single emissivity for the measuring object, and thus the correct determination should be made as follows.
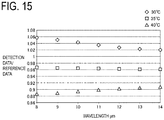
- FIG. 15 is a diagram illustrating a ratio between the detection data of FIG. 14 and the reference data for each of the wavelengths.
- the ratio between the detection data and the 30°C reference data is represented by the diamond-shaped points; the ratio between the detection data and the 35°C reference data, by the square points; and the ratio between the detection data and the 40°C reference data, by the triangular points.
- the ratio between the detection data and the 35°C reference data has the lowest wavelength dependency. This means that the curvature of a spectrum curve expressed by the detection data is closest to the curvature of a spectrum curve expressed by the 35°C reference data. It can thus be concluded that the temperature of the measuring object is near 35°C.
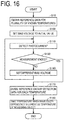
- FIG. 16 is a flowchart illustrating a temperature determination sequence performed by the infrared detection system according to the sixth embodiment. The temperature determination sequence performed by the infrared detection system will be described next with reference to FIGS. 1 , 12 , and 16 , while summarizing the descriptions given thus far.
- the infrared detection system 102 detects the radiation spectrum of each reference sample as the reference data by detecting a radiation intensity while sweeping the bias voltage, for each of the plurality of reference samples, each sample having a plurality of different known temperatures.
- the infrared detection system 102 detects the radiation spectrum of the measuring object as the detection data by detecting the radiation intensity while sweeping the bias voltage with respect to the measuring object. Specifically, this is carried out through the following procedure.
- step S100 the measurement controller 133 sets the bias voltage to be applied to the infrared detection element 120 of the infrared detector 110 to an initial value.
- the value of the bias voltage corresponds to the peak wavelength of the absorption spectrum of the infrared detector 110.
- step S110 the infrared detector 110 detects photocurrent produced by photoelectric conversion of the infrared light 210 entering from the measuring object 200 at the set bias voltage.
- step S140 the measurement controller 133 changes the bias voltage to be applied to the infrared detection element 120 of the infrared detector 110.
- the peak wavelength of the absorption spectrum of the infrared detector 110 is changed as a result.
- the above-described step S110 is then repeated.
- the measurement controller 133 ends the measurement (YES in step S130). This completes the obtainment of the detection data of the measuring object.
- step S150 the temperature determiner 132 divides the reference data corresponding to each known temperature by the detection data to calculate a ratio between the two on a wavelength-by-wavelength basis. Then, in step S180, the temperature determiner 132 takes the temperature corresponding to the reference data for the case where the value of the calculated ratio has the lowest wavelength dependency as the temperature of the measuring object. Specifically, the case where a difference between the ratio between the detection data and the reference data at a maximum wavelength, and the ratio at a minimum wavelength, is the lowest may be taken as the case where the wavelength dependency is the lowest.
- the temperature of the measuring object is determined by comparing the spectra of a plurality of instances of reference data, each having a plurality of known temperatures obtained in advance, with the spectrum of the measuring object. Accordingly, the temperature of the measuring object can be determined accurately even in the case where the shape of the absorption spectrum of the infrared detector 110 appears to have changed in wavelength ranges near the borders of an atmospheric window.
- An infrared detection system differs from the infrared detection system according to the sixth embodiment in that the method through which the temperature determiner 132 calculates the temperature is different.
- the configuration of the infrared detection system is the same as in the sixth embodiment, described with reference to FIG. 12 , in other respects, and thus detailed descriptions thereof will not be repeated.
- FIG. 17 is a flowchart illustrating a temperature determination sequence performed by the infrared detection system according to the seventh embodiment.
- the infrared detection system 102 detects the radiation spectrum of each reference sample as the reference data by detecting a radiation intensity while sweeping the bias voltage, for each of the plurality of reference samples, each sample having a plurality of different known temperatures.
- step S20 the temperature determiner 132 determines a peak wavelength of each instance of reference data.
- the peak wavelengths obtained are stored in the reference data table 142.
- the infrared detection system 102 detects the radiation spectrum of the measuring object as the detection data by detecting the radiation intensity while sweeping the bias voltage with respect to the measuring object.
- the specific procedure is the same as that illustrated in FIG. 12 , and thus descriptions thereof will not be repeated.
- step S190 the temperature determiner 132 determines a peak wavelength of the detection data of the radiation spectrum of the measuring object.
- the temperature determiner 132 compares the peak wavelength of the detection data with the peak wavelength of each instance of reference data, and takes the temperature corresponding to the reference data having a matching peak wavelength as the temperature of the measuring object.
- the seventh embodiment can be combined with the sixth embodiment. That is, in the case where there is a peak value in the detection data, the temperature determiner 132 can determine the temperature of the measuring object by comparing the peak wavelength of the detection data with the peak wavelength of each instance of reference data. On the other hand, in the case where there is no peak value in the detection data, the temperature determiner 132 calculates a ratio between the detection data and each instance of reference data on a wavelength-by-wavelength basis, and determines the temperature of the measuring object based on the known temperature for the case where a temperature dependency of the calculated ratio is the lowest. Accordingly, the temperature of the measuring object 200 can be calculated regardless of whether there is a peak value in the detection data.
- An infrared detection system calculates a type and concentration of a gas in the atmosphere from a unique absorption wavelength of that gas, rather than calculating a temperature from the radiation spectrum of a measuring object.
- the measuring object is therefore a gas in the atmosphere.
- ambient thermal radiation serves as the light source. This will be described in detail hereinafter with reference to the drawings.
- FIG. 18 is a block diagram illustrating the overall configuration of the infrared detection system according to the eighth embodiment.
- a processing circuit 130B in an infrared detection system 103 illustrated in FIG. 18 differs from the processing circuit 130 illustrated in FIG. 1 in that a gas type determiner 134 is provided instead of the temperature determiner 132.
- the configuration of the infrared detection system 103 illustrated in FIG. 18 is the same as that in FIG. 1 .
- Identical or equivalent parts are assigned the same reference signs, and descriptions thereof will in some cases not be repeated.
- the optical filter 150 of the third embodiment can be incorporated into the infrared detection system 103 of the eighth embodiment.
- thermal radiation 211 from an ambient heat source reaches the light-receiving surface 111 of the infrared detector 110 having passed through the atmosphere, which contains a gas 201 serving as the measuring object.
- the infrared detector 110 generates spectrum data by detecting the thermal radiation while sweeping an absorption peak wavelength.
- the correction calculator 131 generates corrected spectrum data by correcting the detection spectrum data using a plurality of correction coefficients stored in the storage 140 as the correction table 141.
- the gas type determiner 134 determines the type of the gas present in the atmosphere based on a unique absorption wavelength included in the corrected spectrum data. For example, carbon monoxide has an absorption line near 4.5 ⁇ m; nitrogen monoxide, near 5.2 ⁇ m; and ozone, near 9.5 ⁇ m. These are within the wavelength range of the atmospheric window and can therefore be detected.
- the gas type determiner 134 can further determine the concentration of the identified gas. Specifically, the gas concentration can be calculated based on an absorption rate obtained by dividing a post-gas production spectrum intensity by a pre-gas production spectrum intensity, an absorbance per unit of distance, and a travel distance of infrared light within the gas.
- FIG. 19 is a flowchart illustrating a gas type determination sequence performed by the infrared detection system according to the eighth embodiment.
- steps S100 to S140 the infrared detector 110 detects the thermal radiation while sweeping the absorption spectrum wavelength, and the correction calculator 131 generates the corrected spectrum data by correcting the spectrum data detected by the infrared detector 110 using the correction table 141.
- Steps S100 to S140 are as described with reference to FIG. 7 , and thus detailed descriptions thereof will not be repeated.
- step S150 the gas type determiner 134 determines the type of the gas present in the atmosphere based on a unique absorption line included in the corrected spectrum data.
- the peak position in the spectrum data will shift, as described in the first embodiment.
- the type of gas present in the atmosphere will be erroneously determined.
- the corrected spectrum data is generated by correcting the spectrum data detected by the infrared detector 110 using the correction table 141 illustrated in FIG. 18 , and the type of the gas present in the atmosphere is determined based on the corrected spectrum data. As such, the type of the gas in the atmosphere can be determined accurately.
- the present embodiment describes ambient thermal radiation as the light source rather than a specific light source that radiates infrared light, a light source may be provided. In a case where no light source is provided, changes in the ambient temperature will affect the gas detection result. A thermometer may be provided in order to reduce such influence.
Landscapes
- Physics & Mathematics (AREA)
- Spectroscopy & Molecular Physics (AREA)
- General Physics & Mathematics (AREA)
- Radiation Pyrometers (AREA)
- Photometry And Measurement Of Optical Pulse Characteristics (AREA)
Abstract
Description
- This application claims the benefit of priority to Japanese Patent Application Number
2017-080763 filed on April 14, 2017 - The present disclosure relates to an infrared detection system.
- At present, thermal units such as bolometers are widely used as infrared detectors. A thermal infrared detector measures temperature changes occurring when infrared light is absorbed. As such, the detector cannot respond quickly, and the wavelengths to be measured cannot be selected.
- However, optical infrared detectors utilizing carrier generation from entering photons are also known. For example, with an infrared detector utilizing mercury cadmium telluride, the wavelength of the maximum sensitivity can be selected by changing the ratio of these components, and thus the detector can handle both a Mid-Wavelength Infrared Range (MWIR) and a Long-Wavelength Infrared Range (LWIR).
- Quantum Well Infrared Photodetector (QWIP) and Quantum Dot Infrared Photodetector (QDIP) are known (see, for example, Shih-Yen Lin et al., "Voltage-tunable two-color quantum-dot infrared photodetectors", Appl. Phys. Lett., Vol. 95 (12), 123504-123504-3, 2009.; and Joe C. Campbell et al., "Quantum-Dot Infrared Photodetectors; By optimizing dot growth processes, materials have been produced that demonstrate potential, with further development, for high-performance infrared sensing", Proceedings of IEEE, Vol. 95 (9), 2007, pp. 1815-1827. These infrared detectors have structures in which a quantum well layer or quantum dot layer is layered as a light absorption layer, and have a characteristic of being able to shift the wavelength of maximum sensitivity by varying a bias voltage applied to the light absorption layer.
-
JP 10-096667 A - The inventors of the present application investigated a system of a quantum well infrared detector or a quantum dot infrared detector in which the radiation spectrum of a measuring object is detected by sweeping a bias voltage sweep, and the temperature of the measuring object is then estimated based on the detected radiation spectrum. The inventors of the present application discovered the following problems through these investigations.
- Due to the width of absorption energy of quantum dots, variations in the sizes of quantum dots, and the like, the Full Width at Half Maximum (FWHM) of the absorption wavelength for a given bias voltage may be from 2 to 3 µm. A similar FWHM may also be found in a quantum well detector. However, because far-infrared light is absorbed by gas and water vapor in the atmosphere in almost all wavelength ranges, electromagnetic waves radiated at a distance can be detected only in what is called an "atmospheric window", which corresponds to mid-wavelength infrared ranges (from 3.4 µm to 5.5 µm) and long-wavelength infrared regions (from 8 µm to 14 µm). Note that the atmospheric window for mid-wavelength infrared ranges (from 3.4 µm to 5.5 µm) is divided into a range of from 3.4 µm to 4.2 µm and a range of from 4.4 µm to 5.5 µm, but will be denoted simply as from 3.4 µm to 5.5 µm in this specification. Infrared light from 4.2 µm to 4.4 µm does not reach far distances and thus may be handled in the same manner as the range from 5.5 µm to 8 µm.
- As described above, the width of the atmospheric window is approximately from 2 to 3 times the FWHM of the absorption wavelengthof electromagnetic waves by a quantum well or quantum dot infrared detector. As such, when using the above-described infrared detector to detect a radiation spectrum by sweeping a bias voltage, the energy absorption ratio of the infrared detector will appear to be different between near the borders of the atmospheric window and near the center of the atmospheric window. The shape of the detection spectrum will therefore differ from the actual shape, e.g., the peak positions will be different.
- Having been achieved in light of the above-described problem, one object of the present disclosure is to accurately detect a spectrum of infrared light radiated from a measuring object in an infrared detection system using an infrared detector, such as a quantum well infrared detector or a quantum dot infrared detector, that can detect infrared light while sweeping an absorption peak wavelength in the detection spectrum of the infrared light.
- An infrared detection system according to an embodiment includes an infrared detector, a storage, and a correction calculator. The infrared detector is configured to detect infrared light by absorbing and photoelectrically converting infrared light of a specific wavelength range. The infrared detector is capable of sweeping an absorption peak wavelength of an absorption spectrum of infrared light. The storage is configured to store a plurality of correction coefficients for correcting a detection value from the infrared detector in accordance with the absorption peak wavelength of the infrared detector with respect to a wavelength range of an atmospheric window. The correction calculator is configured to correct the detection value from the infrared detector for each absorption peak wavelength using corresponding correction coefficients stored in the storage.
- According to the above-described embodiment, the spectrum of infrared light radiated from a measuring object can be accurately detected.
- The invention will be described with reference to the accompanying drawings, wherein like numbers reference like elements.
-
FIG. 1 is a block diagram illustrating the overall configuration of an infrared detection system according to a first embodiment. -
FIG. 2 is a block diagram schematically illustrating an example of the configuration of an infrared detector illustrated inFIG. 1 . -
FIG. 3 is a diagram illustrating a relationship between an intensity distribution of an absorption spectrum of an infrared detector and atmospheric windows. -
FIG. 4 is a diagram illustrating a relationship between a black body radiation spectrum at 36°C and a detection spectrum by the infrared detector. -
FIG. 5 is a diagram illustrating an example of a correction table. -
FIG. 6 is a diagram illustrating a relationship between a black body radiation spectrum at 36°C and a corrected detection spectrum. -
FIG. 7 is a flowchart illustrating a temperature determination sequence performed by the infrared detection system according to the first embodiment. -
FIG. 8 is a flowchart illustrating a temperature detection sequence performed by an infrared detection system according to a second embodiment. -
FIG. 9 is a block diagram illustrating the overall configuration of an infrared detection system according to a third embodiment. -
FIG. 10 is a flowchart illustrating a temperature determination sequence performed by an infrared detection system according to a fourth embodiment. -
FIG. 11 is a flowchart illustrating a temperature detection sequence performed by an infrared detection system according to a fifth embodiment. -
FIG. 12 is a block diagram illustrating the overall configuration of an infrared detection system according to a sixth embodiment. -
FIG. 13 is a diagram illustrating an example of a reference data table in the infrared detection system according to the sixth embodiment. -
FIG. 14 is a diagram illustrating detection data of a measuring object at 36°C with an emissivity of 0.95, and the reference data illustrated inFIG. 13 . -
FIG. 15 is a diagram illustrating a ratio between the detection data ofFIG. 14 and the reference data for each of wavelengths. -
FIG. 16 is a flowchart illustrating a temperature determination sequence performed by an infrared detection system according to the sixth embodiment. -
FIG. 17 is a flowchart illustrating a temperature determination sequence performed by an infrared detection system according to a seventh embodiment. -
FIG. 18 is a block diagram illustrating the overall configuration of an infrared detection system according to an eighth embodiment. -
FIG. 19 is a flowchart illustrating a gas type determination sequence performed by the infrared detection system according to the eighth embodiment. - Embodiments will be described in detail hereinafter with reference to the drawings. The same reference signs will be assigned to identical or equivalent parts, and descriptions thereof will not be repeated.
-
FIG. 1 is a block diagram illustrating the overall configuration of an infrared detection system according to a first embodiment. As illustrated inFIG. 1 , aninfrared detection system 100 includes aninfrared detector 110, astorage 140, and aprocessing circuit 130. - The
infrared detector 110 is a photoelectric conversion element configured to absorbinfrared light 210 radiated onto a light-receivingsurface 111 from ameasuring object 200 and converts the absorbed photons into a charge. Theinfrared detector 110 can detect infrared light while sweeping an absorption peak wavelength of an absorption spectrum (i.e., a wavelength where the absorption spectrum is at a peak value). A spectrum detected by the infrared detector while sweeping the absorption peak wavelength will be called a "detection spectrum" in the following descriptions. - The wavelength ranges that can be detected by the
infrared detector 110 include a Mid-Wavelength Infrared Range (MWIR), i.e., infrared light in a wavelength range of from 3.4 µm to 5.5 µm, and a Long-Wavelength Infrared Range (LWIR), i.e. infrared light in a wavelength range of from 8 µm to 14 µm. These wavelength ranges are called "atmospheric windows". - A specific example of the configuration of the
infrared detector 110 will be described later with reference toFIG. 2 . AlthoughFIG. 1 illustrates a singleinfrared detector 110, an imager constituted of a plurality of elements rather than a single element can also be used in theinfrared detection system 100 of the present embodiment. - The
storage 140 is configured to store, as a correction table 141, a plurality of correction coefficients for correcting detection values from theinfrared detector 110 in accordance with the absorption peak wavelength of theinfrared detector 110 with respect to the wavelength range of the atmospheric window. A specific example of the correction table 141 will be described later with reference toFIGS. 3 and4 . - The
processing circuit 130 may be configured as a microcomputer including a processor and memory, or may be configured as a Field Programmable Gate Array (FPGA). Alternatively, theprocessing circuit 130 may be configured as a dedicated integrated circuit. Functionally speaking, theprocessing circuit 130 includes acorrection calculator 131, atemperature determiner 132, and ameasurement controller 133. - The
correction calculator 131 is configured to correct the detection value from theinfrared detector 110 based on the correction table 141. Particularly, thecorrection calculator 131 is configured to correct the detection value from theinfrared detector 110 for each absorption peak wavelength of theinfrared detector 110, using the corresponding correction coefficient stored in thestorage 140. - Data obtained by using the plurality of correction coefficients to correct detection spectrum data detected by the
infrared detector 110 while sweeping the absorption peak wavelength will be called "corrected spectrum data" in the following descriptions. Thetemperature determiner 132 determines the temperature of the measuringobject 200 based on a shape of the corrected spectrum, e.g., the peak wavelength. - The
measurement controller 133 is configured to control operations of theinfrared detector 110. For example, themeasurement controller 133 is configured to sweep the absorption peak wavelength of the absorption spectrum of theinfrared detector 110 by sweeping a bias voltage applied to aninfrared detection element 120. -
FIG. 2 is a block diagram schematically illustrating an example of the configuration of the infrared detector illustrated inFIG. 1 . The configuration of theinfrared detector 110 illustrated inFIG. 2 is merely an example, and the configuration of theinfrared detector 110 that can be applied in theinfrared detection system 100 of the present embodiment is not limited to the configuration illustrated inFIG. 2 . - As illustrated in
FIG. 2 , theinfrared detector 110 includes theinfrared detection element 120, abias voltage source 125, and acurrent detector 124. Thebias voltage source 125 and thecurrent detector 124 may be consolidated into a single circuit. - The
infrared detection element 120 includes alight absorption layer 122 andcontact layers light absorption layer 122. There may be electrode layers in contact with the contact layers 121 and 123, and in this case, thebias voltage source 125 and thecurrent detector 124 are connected to the contact layers 121 and 123 by the electrode layers. Thelight absorption layer 122 has a structure in which quantum well layers and barrier layers are layered in a repeating manner (a layered quantum well layer) or a structure in which quantum dot layers and barrier layers are layered in a repeating manner (a layered quantum dot layer). - A bias voltage from the
bias voltage source 125 is applied via the contact layers 121 and 123. The layered quantum well layer and the layered quantum dot layer change the infrared light absorption peak wavelength in accordance with the bias voltage through the quantum-confined Stark effect. As such, themeasurement controller 133 can sweep the peak wavelength of the absorption spectrum by causing thebias voltage source 125 to vary the bias voltage. Note that the relationship between the value of the bias voltage and the absorption peak wavelength is obtained in advance through experimentation or simulations. Theinfrared detection element 120 may have any configuration as long as the absorption peak can be changed by varying the bias voltage. However, using quantum wells or quantum dots makes it easier to set the amount by which the absorption wavelength shifts with respect to the bias voltage value according to a material and/or a shape. - The
current detector 124 is configured to detect current flowing in theinfrared detection element 120. A difference between current when being irradiated by theinfrared light 210 and dark current when not being irradiated by theinfrared light 210 corresponds to photocurrent proportional to the intensity of theinfrared light 210. Thus, the intensity of theinfrared light 210 radiated from the measuringobject 200 can be calculated on based on the magnitude of the photocurrent. -
FIG. 3 is a diagram illustrating a relationship between an intensity distribution of the absorption spectrum of the infrared detector and the atmospheric windows. - As illustrated in
FIG. 3 , because far-infrared light is absorbed by gas and water vapor in the atmosphere in almost all wavelength ranges, electromagnetic waves radiated at a distance can be detected only in what is called an "atmospheric window" (an atmospheric window A and an atmospheric window B, inFIG. 3 ), which corresponds to a mid-wavelength infrared range (from 3.4 µm to 5.5 µm) and a long-wavelength infrared range (from 8 µm to 14 µm). - On the other hand, in the case of the quantum dot infrared detector described with reference to
FIG. 2 , due to the width of absorption energy of quantum dots, variations in the sizes of quantum dots, and the like, the FWHM of the absorption spectrum for a given bias voltage can be from 2 to 3 µm or greater. A similar FWHM may also be found in a quantum well infrared detector. -
FIG. 3 illustrates examples in which the peak wavelength of the absorption spectrum of theinfrared detector 110 is 8 µm, 10 µm, and 14 µm. However, a shape of each absorption spectrum is a Gaussian distribution, and the Full Width at Half Maximum (FWHM) of each absorption spectrum is 3 µm. For the sake of simplicity, each absorption spectrum has the same peak value inFIG. 3 . However, the peak value of the absorption spectrum may be different in accordance with the absorption peak wavelength. - As illustrated in
FIG. 3 , the width of the atmospheric window is approximately from 2 to 3 times the FWHM of the absorption wavelength of electromagnetic waves by the infrared detector. Accordingly, approximately half of the absorption spectrum is outside the atmospheric window when the absorption peak is 8 µm and 14 µm. There are ranges of the absorption spectrum outside the atmospheric window even at absorption peak wavelengths between these peaks. As a result, compared to when the absorption peak wavelength is near the center of the atmospheric window, when the absorption peak wavelength is near a border of the atmospheric window, the detection value from theinfrared detector 110 will be a lower value even in a case where the energy of the electromagnetic waves radiated from the measuring object is the same. This trend is more remarkable as the FWHM of the absorption spectrum of theinfrared detector 110 gets boarder. -
FIG. 4 is a diagram illustrating a relationship between a black body radiation spectrum at 36°C and a detection spectrum by the infrared detector. InFIG. 4 , the solid line graph represents the black body radiation spectrum at 36°C. The broken line graph represents the detection spectrum when the FWHM of the absorption spectrum of theinfrared detector 110 is 2 µm. The dot-dash line graph represents the detection spectrum when the FWHM of the absorption spectrum of theinfrared detector 110 is 3 µm. - It can be seen that due to the influence of the atmospheric windows described with reference to
FIG. 3 , the detection spectrum by theinfrared detector 110 has a different shape (peak wavelength, curvature, and the like) from the black body radiation spectrum at 36°C. Specifically, although the black body radiation spectrum has a peak at approximately 9.4 µm at 36°C, a peak appears in the detection spectrum near 10 µm when the FWHM of the absorption spectrum of theinfrared detector 110 is 2 µm. Likewise, a peak appears in the detection spectrum near 11 µm when the FWHM of the absorption spectrum of theinfrared detector 110 is 3 µm. Although the emissivity drops when the measuring object is not a perfectly black body, depending on the surface shape of the measuring object, and the like, the shape of the detection spectrum does not change. - To eliminate such measurement error, correction coefficients determined for each absorption peak wavelength are stored in the
storage 140 as the correction table 141. The correction coefficients change in accordance with the absorption peak wavelength of theinfrared detector 110 with respect to the wavelength range of the atmospheric window. To be more precise, the inverse of a percentage that can be absorbed in the long-wavelength range atmospheric window of from 8 to 14 µm for each absorption peak wavelength of the infrared detector 110 (i.e., an effective absorption rate for each absorption peak wavelength) can be taken as the correction coefficient. Thecorrection calculator 131 illustrated inFIG. 1 corrects the detection value from theinfrared detector 110 by multiplying the value with the corresponding correction coefficient stored in the correction table 141. -
FIG. 5 is a diagram illustrating an example of the correction table. InFIG. 5 , values normalized by an integral of the absorption spectrum throughout the entire wavelength range and an integral of the absorption spectrum throughout a wavelength range of from 8 to 14 µm are indicated as the correction coefficients. Values approximated by Gaussian distribution as indicated inFIG. 3 , or actual measured values or simulation values, may be used as the shape of each absorption spectrum. There are cases where the actual shape of the absorption spectrum is horizontally symmetrical, and cases where the peak value differs depending on the peak wavelength (the influence of these is reflected in the calculated correction coefficients). AlthoughFIG. 5 indicates the absorption peak wavelength in 1 µm intervals, the correction coefficients are actually calculated at finer wavelength intervals. - In the correction table of
FIG. 5 , the correction coefficients are indicated for each peak wavelength of each absorption spectrum, but the correction coefficients may be indicated for each of bias voltages. In this case, a conversion table for converting the bias voltages into absorption spectrum peak wavelengths may be held separately in thestorage 140, and thecorrection calculator 131 may carry out the conversion. Alternatively, the correction table may be constituted by the absorption spectrum peak wavelengths, the bias voltages corresponding thereto, and the correction coefficients for each set thereof. -
FIG. 6 is a diagram illustrating a relationship between a black body radiation spectrum at 36°C and a corrected detection spectrum. InFIG. 6 , the solid line graph represents the black body radiation spectrum at 36°C. The broken line graph indicates a corrected spectrum obtained by multiplying the detection spectrum from theinfrared detector 110 in a case where the FWHM is 2 µm, indicated by the broken line inFIG. 4 , by the correction coefficient for the case where the FWHM is 2 µm, indicated inFIG. 5 . The dot-dash line graph indicates a corrected spectrum obtained by multiplying the detection spectrum from theinfrared detector 110 in a case where the FWHM is 3 µm, indicated by the broken line inFIG. 4 , by the correction coefficient for the case where the FWHM is 3 µm, indicated inFIG. 5 . - Comparing the detection spectrum in
FIG. 4 with the corrected spectrum inFIG. 6 , it can be seen that the shape of the corrected spectrum inFIG. 6 is closer to the shape of the black body radiation spectrum at 36°C. For example, the black body radiation spectrum has a peak at approximately 9.4 µm at 36°C, and a peak appears in the corrected spectrum near 9.4 µm when the FWHM of the absorption spectrum is 2 µm. Likewise, a peak appears in the corrected spectrum near 10 µm when the FWHM of the absorption spectrum is 3 µm. In both cases, the value is closer to the original peak wavelength of the black body radiation spectrum at 36°C than with the detection spectrum illustrated inFIG. 4 . However, the closer to both ends of the atmospheric window (i.e., 8 µm and 14 µm), the greater the error between the original black body radiation spectrum at 36°C and the corrected spectrum becomes. - To determine the temperature of the measuring object, the
temperature determiner 132 illustrated inFIG. 1 first finds the peak wavelength of the corrected spectrum. Next, thetemperature determiner 132 calculates the temperature using Wien's displacement law (Wien's law), which indicates the relationship between the black body radiation peak wavelength and temperature. According to Wien's displacement law, a peak wavelength λmax [µm] is expressed as follows, using a temperature T [K]:
- Accordingly, the
temperature determiner 132 may calculate the temperature T by rearranging Formula (1) as follows:
- Alternatively, the temperature T may be determined based on a table that holds relationships between temperatures T calculated based on Formula (2) and the peak wavelengths λmax [µm] as a database.
- For example, when the corrected spectrum data with a FWHM of 2 µm indicated in
FIG. 6 is used, the peak wavelength λmax is 9.4 µm, for a temperature T of 36°C, which means that the correction is essentially accurate. However, when the FWHM is 3 µm, the peak wavelength λmax is different, meaning that the temperature cannot be detected accurately. Accordingly, with theinfrared detection system 100 of the present embodiment, the temperature of the measuring object can be detected more accurately in the case where the radiation peak wavelength is far from both ends of the atmospheric window, i.e., 8 µm and 14 µm, due to the FWHM being comparatively narrow or the temperature of the measuring object being low to a certain extent. -
FIG. 7 is a flowchart illustrating a temperature determination sequence performed by the infrared detection system according to the first embodiment. The temperature determination sequence performed by the infrared detection system will be described next with reference toFIGS. 1 ,2 , and7 , while summarizing the descriptions given thus far. - First, in step S100, the
measurement controller 133 sets the bias voltage to be applied to theinfrared detection element 120 of theinfrared detector 110 to an initial value. The value of the bias voltage corresponds to the peak wavelength of the absorption spectrum of theinfrared detector 110. - Next, in step S110, the
infrared detector 110 detects photocurrent produced by photoelectric conversion of theinfrared light 210 entering from the measuringobject 200 at the set bias voltage. Themeasurement controller 133 sets the bias voltage to correspond to the peak wavelength of each absorption spectrum. - Next, in step S120, the
correction calculator 131 converts the bias voltage into an absorption peak wavelength and reads out, from the correction table 141 stored in thestorage 140, the correction coefficient corresponding to the absorption peak wavelength obtained from the conversion. Thecorrection calculator 131 then multiplies the read-out correction coefficient to correct the value detected in step S120. - Next, in step S140, the
measurement controller 133 changes the bias voltage to be applied to theinfrared detection element 120 of theinfrared detector 110. The peak wavelength of the absorption spectrum of theinfrared detector 110 is changed as a result. The above-described steps S110 and S120 are then repeated. - Once the detection of infrared light in the absorption peak wavelength range to be swept is complete, the
measurement controller 133 ends the measurement (YES in step S130). - The corrected spectrum data, which is data obtained by correcting the detection spectrum data from the
infrared detector 110 according to the correction table 141, is generated as a result. Then, in step S150, thetemperature determiner 132 calculates the temperature from the peak wavelength of the corrected spectrum according to Wien's displacement law. This completes the temperature determination sequence. - According to the
infrared detection system 100 of the present embodiment as described thus far, the detection value from theinfrared detector 110 is corrected with a correction coefficient based on the absorption peak wavelength of the absorption spectrum of theinfrared detector 110. Accordingly, the radiation spectrum of the measuring object and the temperature thereof can be detected accurately even in a case where the shape of the absorption spectrum of theinfrared detector 110 appears to have changed in wavelength ranges near the borders of an atmospheric window. - Additionally, the above-described correction coefficient can be calculated as long as the absorption spectrum of the
infrared detector 110 is known. Thus, according to theinfrared detection system 100 of the present embodiment, the temperature of the measuring object can be detected more easily then when using a method in which many known temperature reference samples are prepared. - A second embodiment differs from the first embodiment in terms of the timing at which the
measurement controller 133 finishes sweeping the bias voltage. Specifically, the bias voltage sweep is stopped at the point in time when the peak wavelength of the corrected spectrum is found. This makes it possible to shorten the time for measuring the temperature of the measuring object, and thus the amount of power consumed by theinfrared detection system 100 can be suppressed. This will be described hereinafter with reference to the drawings. -
FIG. 8 is a flowchart illustrating a temperature detection sequence performed by the infrared detection system according to the second embodiment. The flowchart ofFIG. 8 corresponds to the flowchart ofFIG. 7 , and differs from the flowchart in that step S135 is carried out instead of step S130. - To be more specific, in step S135, the
measurement controller 133 determines whether the detection value from theinfrared detector 110 corrected using the correction table 141 has indicated a peak value (maximum value), i.e., whether a peak value is present in the corrected spectrum, in the bias voltage range swept up until that point in time. In a case where a peak has been detected in the corrected spectrum (YES in step S135), the bias voltage sweep is stopped at that point in time, and thetemperature determiner 132 determines the temperature of the measuringobject 200 in the following step S150. - However, in a case where no peak value has been detected in the corrected spectrum (NO in step S135), in the following step S140, the
measurement controller 133 changes the bias voltage to be applied to theinfrared detection element 120 of theinfrared detector 110. The peak wavelength of the absorption spectrum of theinfrared detector 110 is changed as a result. The above-described steps S110 and S120 are then repeated. -
FIG. 8 is the same as the flowchart ofFIG. 7 in other respects, and thus the same reference signs are assigned to corresponding steps, and descriptions thereof will not be repeated. The configuration of the infrared detection system according to the second embodiment is also the same as that of the first embodiment, described with reference toFIG. 1 , and thus descriptions thereof will not be repeated. -
FIG. 9 is a block diagram illustrating the overall configuration of an infrared detection system according to a third embodiment. Aninfrared detection system 101 illustrated inFIG. 9 differs from theinfrared detection system 100 illustrated inFIG. 1 in that anoptical filter 150 covering the light-receivingsurface 111 of theinfrared detection system 100 is further included. Theoptical filter 150 is configured to block the mid-wavelength infrared range of from 3.4 µm to 5.5 µm when measuring the long-wavelength infrared range of from 8 µm to 14 µm. - When the peak wavelength is 8 µm, as indicated by the broken line in
FIG. 3 , part of the absorption spectrum extends into the atmospheric window A of from 3.4 µm to 5.5 µm. Error will therefore arise in a case where the correction coefficient is calculated by integrating the absorption spectrum in the wavelength range of from 8 to 14 µm. However, this error can be reduced by using an optical filter to block wavelength ranges that have essentially no effect. - The
optical filter 150 may be constituted by a filter configured to block the long-wavelength infrared range of from 8 µm to 14 µm, thus only the mid-wavelength infrared range of from 3.4 µm to 5.5 µm is measured. Alternatively, the optical filter may be constituted by a combination of filters configured to block a plurality of wavelength ranges, including at least a filter that blocks the mid-wavelength infrared range of from 3.4 µm to 5.5 µm and a filter than blocks the long-wavelength infrared range of from 8 µm to 14 µm. - An infrared detection system according to a fourth embodiment differs from the infrared detection system according to the first embodiment in that the method through which the
temperature determiner 132 calculates the temperature is different. The configuration of theinfrared detection system 100 is the same as in the first embodiment, described with reference toFIG. 1 , in other respects, and thus detailed descriptions thereof will not be repeated. -
FIG. 10 is a flowchart illustrating a temperature determination sequence performed by the infrared detection system according to the fourth embodiment. Steps S100 to S140 inFIG. 10 are the same as in the first embodiment, described with reference toFIG. 7 , and thus descriptions thereof will not be repeated. When these steps are executed, theinfrared detector 110 generates the detection spectrum, and thecorrection calculator 131 generates the corrected spectrum by correcting the detection spectrum using the correction table 141. - In the following step S150, the
temperature determiner 132 calculates the temperature of the measuringobject 200 based on Planck's law of black body radiation, indicated below as Formula (3). In Formula (3), B(λ) represents a radiation intensity at a wavelength λ, h represents Planck's constant, c represents the speed of light, kB represents Boltzmann's constant, and T [K] represents temperature.
[Expression 1]
- To be more specific, the
temperature determiner 132 is configured to calculate an intensity ratio of corrected spectra at wavelengths λ1 and λ2, and compares the spectrum intensity ratios with Planck's law of black body radiation at the same wavelengths λ1 and λ2 to find the temperature T at which the ratios coincide. Thetemperature determiner 132 may calculate a plurality of intensity ratios of the corrected spectra at different wavelengths and compare the spectrum intensity ratios with Planck's law of black body radiation at the corresponding wavelengths to determine the temperature T through the least squares method, for example. This makes it possible to estimate the temperature T more precisely than when using only the ratio at two wavelengths. - According to the infrared detection system of the fourth embodiment as described above, the temperature of the measuring
object 200 can be calculated even when there is no peak value in the corrected spectrum. The infrared detection system of the fourth embodiment can also be combined with the infrared detection systems of the second and third embodiments. - An infrared detection system according to a fifth embodiment is a combination of the infrared detection system of the first embodiment and the infrared detection system of the fourth embodiment, and a characteristic thereof lies in the method through which the
temperature determiner 132 calculates the temperature. The configuration of theinfrared detection system 100 illustrated inFIG. 1 is the same as those described in the first embodiment and the fourth embodiment in other respects, and thus detailed descriptions thereof will not be repeated. -
FIG. 11 is a flowchart illustrating a temperature detection sequence performed by the infrared detection system according to the fifth embodiment. Steps S100 to S140 inFIG. 11 are the same as in the first embodiment, described with reference toFIG. 7 , and in the fourth embodiment, described with reference toFIG. 10 , and thus descriptions thereof will not be repeated. When these steps are executed, theinfrared detector 110 generates the detection spectrum, and thecorrection calculator 131 generates the corrected spectrum by correcting the detection spectrum using the correction table 141. - Next, in step S145, the
temperature determiner 132 determines whether there is a peak value in the corrected spectrum. In a case where there is a peak value in the corrected spectrum (YES is step S145), in step S150, thetemperature determiner 132 calculates the temperature from the peak wavelength of the corrected spectrum according to Wien's displacement law. On the other hand, in a case where there is no peak value in the corrected spectrum (NO in step S145), in step S160, thetemperature determiner 132 calculates an intensity ratio of corrected spectra at wavelengths λ1 and λ2, and compares the spectrum intensity ratios with Planck's law of black body radiation at the same wavelengths λ1 and λ2 to find the temperature T at which the ratios coincide. Thetemperature determiner 132 may calculate a plurality of intensity ratios of the corrected spectra at different wavelengths and compare the spectrum intensity ratios with Planck's law of black body radiation at the corresponding wavelengths to determine the temperature T through the least squares method, for example. - According to the infrared detection system of the fifth embodiment as described above, the temperature of the measuring
object 200 can be calculated regardless of whether there is a peak value in the corrected spectrum. The infrared detection system of the fifth embodiment can also be combined with the infrared detection systems of the second and third embodiments. - A sixth embodiment describes an infrared detection system that detects the temperature of the measuring
object 200 based on a plurality of instances ofreference data 142 calculated by theinfrared detector 110 while sweeping a bias voltage with respect to a plurality of reference samples, each sample having a plurality of known temperatures. -
FIG. 12 is a block diagram illustrating the overall configuration of the infrared detection system according to the sixth embodiment. Aninfrared detection system 102 illustrated inFIG. 12 is a variation on theinfrared detection system 100 illustrated inFIG. 1 . - Particularly, the
infrared detection system 102 includes theinfrared detector 110, thestorage 140, and aprocessing circuit 130A. The functions and specific configuration of theinfrared detector 110 are as described in the first embodiment with reference toFIGS. 1 and2 , and thus descriptions thereof will not be repeated. - The
storage 140 stores a reference data table 142. The reference data table 142 includes a plurality of instances of reference data detected by theinfrared detector 110 while sweeping a bias voltage with respect to a plurality of reference samples, each sample having a plurality of known temperatures. The reference data is detection spectrum data obtained in advance for each of the plurality of known temperatures. - The reference samples may be ideal black bodies, or may be gray bodies having known emissivity. Alternatively, the reference samples may be gray bodies with unknown emissivity, in a case where there is no wavelength dependency for the emissivity.
- The
processing circuit 130A may be configured as a microcomputer including a processor and memory, or may be configured as a FPGA. Alternatively, theprocessing circuit 130A may be configured as a dedicated integrated circuit. Functionally speaking, theprocessing circuit 130A includes thetemperature determiner 132 and themeasurement controller 133. - The
temperature determiner 132 determines the temperature of the measuringobject 200 by comparing detection data obtained while sweeping the bias voltage of theinfrared detector 110 with respect to the measuring object 200 (this corresponds to the detection spectrum) with the reference data for each known temperature. Specifically, thetemperature determiner 132 calculates a ratio between the detection data and the reference data corresponding to each known temperature on a wavelength-by-wavelength basis, and determines the temperature of the measuringobject 200 based on the known temperature for the case where the wavelength dependency of the calculated ratio is the lowest. The method through which thetemperature determiner 132 determines the temperature of the measuring object will be described in detail hereinafter. -
FIG. 13 is a diagram illustrating an example of the reference data table in the infrared detection system according to the sixth embodiment. As illustrated inFIG. 13 , reference data in which the reference sample temperatures are 30°C, 35°C, and 40°C is associated with different wavelengths. Each reference data value is obtained by converting a detected photocurrent to a spectrum intensity. - Although the reference sample temperatures are set at intervals of 5°C in
FIG. 13 , the temperature of the measuringobject 200 can be calculated more precisely by setting the reference sample temperatures at finer intervals. - Additionally, although the wavelengths are set at intervals of 1 µm in
FIG. 13 , susceptibility to the effects of error can be reduced by setting the wavelengths at finer intervals, which in turn makes it possible to improve the temperature detection accuracy. On the other hand, limiting the number of wavelengths to only several wavelengths makes it possible to shorten the detection time of theinfrared detector 110 and the time for calculating the temperature. -
FIG. 14 is a diagram illustrating the detection data of the measuring object at 36°C with an emissivity of 0.95, and the reference data illustrated inFIG. 13 . The solid line graph inFIG. 14 represents the detection data of the measuring object. The reference data obtained for the 30°C reference samples is represented by the diamond-shaped points; the reference data obtained for the 35°C reference samples, by the square points; and the reference data obtained for the 40°C reference samples, by the triangular points. - In
FIG. 14 , the detection data is located between the 30°C reference data and the 35° reference data, and thus at a glance, the data of the measuring object may be determined to be between 30°C and 35°C. However, the above result is obtained because there is not a single emissivity for the measuring object, and thus the correct determination should be made as follows. -
FIG. 15 is a diagram illustrating a ratio between the detection data ofFIG. 14 and the reference data for each of the wavelengths. InFIG. 15 , the ratio between the detection data and the 30°C reference data is represented by the diamond-shaped points; the ratio between the detection data and the 35°C reference data, by the square points; and the ratio between the detection data and the 40°C reference data, by the triangular points. - From
FIG. 15 , it can be seen that the ratio between the detection data and the 35°C reference data has the lowest wavelength dependency. This means that the curvature of a spectrum curve expressed by the detection data is closest to the curvature of a spectrum curve expressed by the 35°C reference data. It can thus be concluded that the temperature of the measuring object is near 35°C. -
FIG. 16 is a flowchart illustrating a temperature determination sequence performed by the infrared detection system according to the sixth embodiment. The temperature determination sequence performed by the infrared detection system will be described next with reference toFIGS. 1 ,12 , and16 , while summarizing the descriptions given thus far. - First, in step S10, the
infrared detection system 102 detects the radiation spectrum of each reference sample as the reference data by detecting a radiation intensity while sweeping the bias voltage, for each of the plurality of reference samples, each sample having a plurality of different known temperatures. - Next, the
infrared detection system 102 detects the radiation spectrum of the measuring object as the detection data by detecting the radiation intensity while sweeping the bias voltage with respect to the measuring object. Specifically, this is carried out through the following procedure. - First, in step S100, the
measurement controller 133 sets the bias voltage to be applied to theinfrared detection element 120 of theinfrared detector 110 to an initial value. The value of the bias voltage corresponds to the peak wavelength of the absorption spectrum of theinfrared detector 110. - Next, in step S110, the
infrared detector 110 detects photocurrent produced by photoelectric conversion of theinfrared light 210 entering from the measuringobject 200 at the set bias voltage. - Next, in step S140, the
measurement controller 133 changes the bias voltage to be applied to theinfrared detection element 120 of theinfrared detector 110. The peak wavelength of the absorption spectrum of theinfrared detector 110 is changed as a result. The above-described step S110 is then repeated. - Once the detection of infrared light in the absorption peak wavelength range to be swept is complete, the
measurement controller 133 ends the measurement (YES in step S130). This completes the obtainment of the detection data of the measuring object. - Next, in step S150, the
temperature determiner 132 divides the reference data corresponding to each known temperature by the detection data to calculate a ratio between the two on a wavelength-by-wavelength basis. Then, in step S180, thetemperature determiner 132 takes the temperature corresponding to the reference data for the case where the value of the calculated ratio has the lowest wavelength dependency as the temperature of the measuring object. Specifically, the case where a difference between the ratio between the detection data and the reference data at a maximum wavelength, and the ratio at a minimum wavelength, is the lowest may be taken as the case where the wavelength dependency is the lowest. - As described thus far, according to the
infrared detection system 102 of the present embodiment, the temperature of the measuring object is determined by comparing the spectra of a plurality of instances of reference data, each having a plurality of known temperatures obtained in advance, with the spectrum of the measuring object. Accordingly, the temperature of the measuring object can be determined accurately even in the case where the shape of the absorption spectrum of theinfrared detector 110 appears to have changed in wavelength ranges near the borders of an atmospheric window. - An infrared detection system according to a seventh embodiment differs from the infrared detection system according to the sixth embodiment in that the method through which the
temperature determiner 132 calculates the temperature is different. The configuration of the infrared detection system is the same as in the sixth embodiment, described with reference toFIG. 12 , in other respects, and thus detailed descriptions thereof will not be repeated. -
FIG. 17 is a flowchart illustrating a temperature determination sequence performed by the infrared detection system according to the seventh embodiment. - Referring to
FIGS. 12 and17 , first, in step S10, theinfrared detection system 102 detects the radiation spectrum of each reference sample as the reference data by detecting a radiation intensity while sweeping the bias voltage, for each of the plurality of reference samples, each sample having a plurality of different known temperatures. - Next, in step S20, the
temperature determiner 132 determines a peak wavelength of each instance of reference data. The peak wavelengths obtained are stored in the reference data table 142. - Next, in steps S100 to S140, the
infrared detection system 102 detects the radiation spectrum of the measuring object as the detection data by detecting the radiation intensity while sweeping the bias voltage with respect to the measuring object. The specific procedure is the same as that illustrated inFIG. 12 , and thus descriptions thereof will not be repeated. - Next, in step S190, the
temperature determiner 132 determines a peak wavelength of the detection data of the radiation spectrum of the measuring object. Next, in step S200, thetemperature determiner 132 compares the peak wavelength of the detection data with the peak wavelength of each instance of reference data, and takes the temperature corresponding to the reference data having a matching peak wavelength as the temperature of the measuring object. - The seventh embodiment can be combined with the sixth embodiment. That is, in the case where there is a peak value in the detection data, the
temperature determiner 132 can determine the temperature of the measuring object by comparing the peak wavelength of the detection data with the peak wavelength of each instance of reference data. On the other hand, in the case where there is no peak value in the detection data, thetemperature determiner 132 calculates a ratio between the detection data and each instance of reference data on a wavelength-by-wavelength basis, and determines the temperature of the measuring object based on the known temperature for the case where a temperature dependency of the calculated ratio is the lowest. Accordingly, the temperature of the measuringobject 200 can be calculated regardless of whether there is a peak value in the detection data. - An infrared detection system according to an eighth embodiment calculates a type and concentration of a gas in the atmosphere from a unique absorption wavelength of that gas, rather than calculating a temperature from the radiation spectrum of a measuring object. The measuring object is therefore a gas in the atmosphere. Instead of a specific light source that radiates infrared light, ambient thermal radiation serves as the light source. This will be described in detail hereinafter with reference to the drawings.
-
FIG. 18 is a block diagram illustrating the overall configuration of the infrared detection system according to the eighth embodiment. Aprocessing circuit 130B in aninfrared detection system 103 illustrated inFIG. 18 differs from theprocessing circuit 130 illustrated inFIG. 1 in that agas type determiner 134 is provided instead of thetemperature determiner 132. In other respects, the configuration of theinfrared detection system 103 illustrated inFIG. 18 is the same as that inFIG. 1 . Identical or equivalent parts are assigned the same reference signs, and descriptions thereof will in some cases not be repeated. Note that theoptical filter 150 of the third embodiment can be incorporated into theinfrared detection system 103 of the eighth embodiment. - As illustrated in
FIG. 18 ,thermal radiation 211 from an ambient heat source reaches the light-receivingsurface 111 of theinfrared detector 110 having passed through the atmosphere, which contains agas 201 serving as the measuring object. Theinfrared detector 110 generates spectrum data by detecting the thermal radiation while sweeping an absorption peak wavelength. Thecorrection calculator 131 generates corrected spectrum data by correcting the detection spectrum data using a plurality of correction coefficients stored in thestorage 140 as the correction table 141. - The
gas type determiner 134 determines the type of the gas present in the atmosphere based on a unique absorption wavelength included in the corrected spectrum data. For example, carbon monoxide has an absorption line near 4.5 µm; nitrogen monoxide, near 5.2 µm; and ozone, near 9.5 µm. These are within the wavelength range of the atmospheric window and can therefore be detected. - The
gas type determiner 134 can further determine the concentration of the identified gas. Specifically, the gas concentration can be calculated based on an absorption rate obtained by dividing a post-gas production spectrum intensity by a pre-gas production spectrum intensity, an absorbance per unit of distance, and a travel distance of infrared light within the gas. -
FIG. 19 is a flowchart illustrating a gas type determination sequence performed by the infrared detection system according to the eighth embodiment. - In steps S100 to S140, the
infrared detector 110 detects the thermal radiation while sweeping the absorption spectrum wavelength, and thecorrection calculator 131 generates the corrected spectrum data by correcting the spectrum data detected by theinfrared detector 110 using the correction table 141. Steps S100 to S140 are as described with reference toFIG. 7 , and thus detailed descriptions thereof will not be repeated. - Next, in step S150, the
gas type determiner 134 determines the type of the gas present in the atmosphere based on a unique absorption line included in the corrected spectrum data. - In a case where the spectrum data detected by the
infrared detector 110 is not corrected using the correction table 141 illustrated inFIG. 18 , the peak position in the spectrum data will shift, as described in the first embodiment. As a result, the type of gas present in the atmosphere will be erroneously determined. - However, according to the
infrared detection system 103 of the present embodiment, the corrected spectrum data is generated by correcting the spectrum data detected by theinfrared detector 110 using the correction table 141 illustrated inFIG. 18 , and the type of the gas present in the atmosphere is determined based on the corrected spectrum data. As such, the type of the gas in the atmosphere can be determined accurately. Although the present embodiment describes ambient thermal radiation as the light source rather than a specific light source that radiates infrared light, a light source may be provided. In a case where no light source is provided, changes in the ambient temperature will affect the gas detection result. A thermometer may be provided in order to reduce such influence. - Some of the characteristics of the above-described first to eighth embodiments can be summarized as follows.
- [1] The
infrared detection systems infrared detector 110, thestorage 140, and thecorrection calculator 131. Theinfrared detector 110 detects infrared light by absorbing and photoelectrically converting infrared light of a specific wavelength range. Theinfrared detector 110 is capable of sweeping an absorption peak wavelength of an absorption spectrum of infrared light. Thestorage 140 stores a plurality of correction coefficients for correcting a detection value from theinfrared detector 110 in accordance with a value of the absorption peak wavelength with respect to a wavelength range of an atmospheric window. Thecorrection calculator 131 corrects the detection value from theinfrared detector 110 for each absorption peak wavelength using corresponding correction coefficients stored in thestorage 140.
According to this configuration, even in a case where the absorption spectrum has a broad wavelength range and the shape of the absorption spectrum of theinfrared detector 110 appears to change in the wavelength range near the borders of the atmospheric window, the detection value from theinfrared detector 110 can be corrected to cancel out the effects of that change. Accordingly, the spectrum of infrared light radiated from a measuring object can be accurately detected. - [2] The
infrared detection systems infrared detector 110, thestorage 140, and thecorrection calculator 131. Theinfrared detector 110 detects infrared light by absorbing and photoelectrically converting infrared light of a specific wavelength range. Theinfrared detector 110 is an infrared detector that includes quantum wells or quantum dots in an active layer. Thestorage 140 stores a plurality of correction coefficients for correcting a detection value from theinfrared detector 110 in accordance with a value of the absorption peak wavelength of the infrared detector with respect to a wavelength range of an atmospheric window. Thecorrection calculator 131 corrects the detection value from theinfrared detector 110 based on the absorption peak wavelength using a corresponding correction coefficient stored in thestorage 140. - [3] In the above-described [1] or [2], the
infrared detection systems temperature determiner 132 that determines a temperature of the measuringobject 200 based on corrected spectrum data. The corrected spectrum data is obtained by using the plurality of correction coefficients to correct spectrum data detected by theinfrared detector 110 while sweeping the absorption peak wavelength. Using the corrected spectrum data in this manner makes it possible to more accurately determine the temperature of the measuringobject 200. - [4] In the above-described [3], the
temperature determiner 132 determines the temperature of the measuringobject 200 from a peak wavelength of the corrected spectrum data, in accordance with Wien's displacement law. According to this configuration, the temperature can be determined accurately from only the peak wavelength. - [5] In the above-described [4], the
infrared detection systems measurement controller 133 that controls the sweeping of the absorption peak wavelength by theinfrared detector 110. Themeasurement controller 133 stops the sweeping of the absorption peak wavelength by theinfrared detector 110 at a point in time when the corrected spectrum data is found to have a peak. This makes it possible to shorten the time for measuring the temperature of the measuring object, and thus the amount of power consumed by theinfrared detection system 100 can be suppressed. - [6] In the above-described [3], the
temperature determiner 132 determines the temperature of the measuringobject 200 by comparing an intensity ratio at a plurality of wavelengths in the corrected spectrum data with a ratio of spectrum intensity according to Planck's formula of radiation at the same wavelengths as the plurality of wavelengths. According to this configuration, the temperature of the measuringobject 200 can be determined even in a case where no peak value is present in the corrected spectrum data. - [7] In the above-described [3], in a case where a peak value is present in the corrected spectrum data, the
temperature determiner 132 determines the temperature of the measuringobject 200 from a peak wavelength of the corrected spectrum data, in accordance with Wien's displacement law. In the case where there is no peak value present in the corrected spectrum data, thetemperature determiner 132 determines the temperature of the measuringobject 200 by comparing an intensity ratio at a plurality of wavelengths in the corrected spectrum data with a ratio of spectrum intensity according to Planck's formula of radiation at the same wavelengths as the plurality of wavelengths. According to this configuration, the temperature of the measuringobject 200 can be determined regardless of whether a peak value is present in the corrected spectrum data. - [8] The
infrared detection system 102 according to yet another embodiment includes theinfrared detector 110, thestorage 140, and thetemperature determiner 132. Theinfrared detector 110 detects infrared light by absorbing and photoelectrically converting infrared light of a specific wavelength range. Theinfrared detector 110 is capable of sweeping an absorption peak wavelength of an absorption spectrum of infrared light. Thestorage 140 stores a plurality of instances of reference data obtained while sweeping an absorption peak wavelength of theinfrared detector 110 with respect to a plurality of reference samples, each sample having a plurality of known temperatures. Thetemperature determiner 132 determines a temperature of the measuringobject 200 by comparing detection data obtained by sweeping the absorption peak wavelength of theinfrared detector 110 with respect to the measuringobject 200 with the reference data for each of the known temperatures.
According to this configuration, the temperature is determined based on a comparison with reference data for each of known temperatures obtained in advance. The temperature of the measuring object can therefore be determined accurately, even in the case where the absorption spectrum has a broad wavelength range and the shape of the absorption spectrum of theinfrared detector 110 appears to change in the wavelength range near the borders of the atmospheric window. - [9] The
infrared detection system 102 according to yet another embodiment includes theinfrared detector 110, thestorage 140, and thetemperature determiner 132. Theinfrared detector 110 detects infrared light by absorbing and photoelectrically converting infrared light of a specific wavelength range. Theinfrared detector 110 is an infrared detector that includes quantum wells or quantum dots in an active layer. Thestorage 140 stores a plurality of instances of reference data obtained while sweeping an absorption peak wavelength of theinfrared detector 110 with respect to a plurality of reference samples, each sample having a plurality of known temperatures. Thetemperature determiner 132 determines a temperature of the measuringobject 200 by comparing detection data obtained by sweeping the absorption peak wavelength of theinfrared detector 110 with respect to the measuringobject 200 with the reference data for each of the known temperatures. - [10] In the above-described [8] or [9], the
temperature determiner 132 calculates a ratio between the reference data corresponding to each of the known temperatures and the detection data on a wavelength-by-wavelength basis, and determines the temperature of the measuringobject 200 based on the known temperature in a case where a wavelength dependency of the calculated ratio is lowest. According to this configuration, the temperature can be accurately determined even when the measuring object is not a perfect black body. - [11] In the above-described [8] or [9], the
temperature determiner 132 determines the temperature of the measuringobject 200 by comparing a peak wavelength of the detection data with a peak wavelength of the reference data for each of the known temperatures. According to this configuration, the temperature can be determined accurately from only the peak wavelength. - [12] In the above-described [1] or [2], the
infrared detection system 103 further includes thegas type determiner 134 that determines a type of a gas present in an atmosphere based on a unique absorption wavelength present in the corrected spectrum data. The corrected spectrum data is obtained by using the plurality of correction coefficients to correct spectrum data detected by theinfrared detector 110 while sweeping the absorption peak wavelength. Using the corrected spectrum data in this manner makes it possible to more accurately determine the type of the gas. - [13] In the above-described [1] to [7] and [12], each of the correction coefficients is obtained from a ratio between a value obtained by integrating an absorption spectrum of the
infrared detector 110 estimated for each of the absorption peak wavelengths over a wavelength range and a value obtained by integrating the absorption spectrum of theinfrared detector 110 estimated for each of the absorption peak wavelengths over the wavelength range of the atmospheric window. The correction coefficients can thus be determined with ease based on the effective absorption rate for each absorption peak wavelength, and the infrared spectrum can be detected accurately. - [14] In the above-described [13], the estimated peak intensity of the absorption spectrum of the
infrared detector 110 differs depending on the absorption peak wavelength. Such changes in the absorption peak wavelength can also be incorporated into the correction coefficients. In this case too, the above-described [13] makes it possible to accurately detect the infrared spectrum. - [15] In the above-described [1] to [14], the
infrared detection system 101 further includes theoptical filter 150 that covers the light-receiving surface of theinfrared detector 110. Theoptical filter 150 blocks the mid-wavelength infrared range of from 3.4 µm to 5.5 µm when measuring the long-wavelength infrared range of from 8 µm to 14 µm. In this manner, error can be reduced by using an optical filter to block wavelength ranges that have essentially no effect. - [16] In the above-described [1] to [14], the
infrared detection system 101 further includes theoptical filter 150 that covers the light-receiving surface of theinfrared detector 110. Theoptical filter 150 blocks the long-wavelength infrared range of from 8 µm to 14 µm when measuring the mid-wavelength infrared range of from 3.4 µm to 5.5 µm. In this manner, error can be reduced by using an optical filter to block wavelength ranges that have essentially no effect. - The embodiments disclosed here are to be understood as being in all ways exemplary and in no ways limiting. The scope of the invention is defined not by the foregoing descriptions but by the appended claims, and is intended to include all changes equivalent in meaning and scope to the claims.
- While preferred embodiments of the present invention have been described above, it is to be understood that variations and modifications will be apparent to those skilled in the art without departing from the scope and spirit of the present invention. The scope of the present invention, therefore, is to be determined solely by the following claims.
Claims (15)
- An infrared detection system (100, 101, 103) comprising:an infrared detector (110) configured to detect infrared light by absorbing and photoelectrically converting infrared light of a specific wavelength range, the infrared detector (110) being capable of sweeping an absorption peak wavelength of an absorption spectrum of infrared light;a storage (140) configured to store a plurality of correction coefficients to correct a detection value from the infrared detector (110) in accordance with the absorption peak wavelength of the infrared detector (110) with respect to a wavelength range of an atmospheric window; anda correction calculator (131) configured to correct the detection value from the infrared detector (110) for each absorption peak wavelength using corresponding correction coefficients stored in the storage (140).
- The infrared detection system (100, 101, 103) according to claim 1, further comprising:a temperature determiner (132) configured to determine a temperature of a measuring object (200) based on corrected spectrum data,wherein the corrected spectrum data is obtained by using the plurality of correction coefficients to correct spectrum data detected by the infrared detector (110) while sweeping the absorption peak wavelength.
- The infrared detection system (100, 101, 103) according to claim 2,
wherein the temperature determiner (132) determines the temperature of the measuring object from a peak wavelength of the corrected spectrum data, in accordance with Wien's displacement law. - The infrared detection system (100, 101, 103) according to claim 3, further comprising:a measurement controller (133) configured to control the sweeping of the absorption peak wavelength by the infrared detector (110),wherein the measurement controller (133) stops the sweeping of the absorption peak wavelength by the infrared detector (110) at a point in time when the corrected spectrum data is found to have a peak.
- The infrared detection system (100, 101, 103) according to claim 2,
wherein the temperature determiner (132) determines the temperature of the measuring object (200) by comparing an intensity ratio at a plurality of wavelengths in the corrected spectrum data with a ratio of spectrum intensity according to Planck's formula of radiation at the same wavelengths as the plurality of wavelengths. - An infrared detection system (100, 101, 102, 103) comprising:an infrared detector (110) configured to detect infrared light by absorbing and photoelectrically converting infrared light of a specific wavelength range, the infrared detector (110) being capable of sweeping an absorption peak wavelength of an absorption spectrum of infrared light;a storage (140) configured to store a plurality of instances of reference data obtained while sweeping the absorption peak wavelength of the infrared detector (110) with respect to a plurality of reference samples, each sample having a plurality of known temperatures; anda temperature determiner (132) configured to determine a temperature of a measuring object (200) by comparing detection data obtained by sweeping the absorption peak wavelength of the infrared detector (110) with respect to the measuring object (200) with the reference data for each of the known temperatures.
- The infrared detection system (100, 101, 102, 103) according to claim 1 or 6, wherein the infrared detector (110) includes a quantum well or a quantum dot in an active layer.
- The infrared detection system (100, 101, 102, 103) according to claim 6 or 7,
wherein the temperature determiner (132) calculates a ratio between the reference data corresponding to each of the known temperatures and the detection data on a wavelength-by-wavelength basis, and determines the temperature of the measuring object based on the known temperature in a case where a wavelength dependency of the calculated ratio is lowest. - The infrared detection system (100, 101, 102, 103) according to claim 6 or 7,
wherein the temperature determiner (132) determines the temperature of the measuring object by comparing a peak wavelength of the detection data with a peak wavelength of the reference data for each of the known temperatures. - The infrared detection system (100, 101, 102, 103) according to claim 1, further comprising:a gas type determiner (134) configured to determine a type of a gas present in an atmosphere based on a unique absorption wavelength present in the corrected spectrum data,wherein the corrected spectrum data is obtained by using the plurality of correction coefficients to correct spectrum data detected by the infrared detector (110) while sweeping the absorption peak wavelength.
- The infrared detection system (100, 101, 102, 103) according to any one of claims 1 to 5 and 10,
wherein each of the correction coefficients is obtained from a ratio between a value obtained by integrating an absorption spectrum of the infrared detector (110) estimated for each of the absorption peak wavelengths over a wavelength range and a value obtained by integrating the absorption spectrum of the infrared detector (110) estimated for each of the absorption peak wavelengths over the wavelength range of the atmospheric window. - The infrared detection system (100, 101, 102, 103) according to any one of claims 1 to 11, further comprising:an optical filter (150) configured to cover a light-receiving surface (111) of the infrared detector (110),wherein in the case where a long-wavelength infrared range of from 8 µm to 14 µm is measured, the optical filter (150) blocks a mid-wavelength infrared range of from 3.4 µm to 5.5 µm.
- The infrared detection system (100, 101, 102, 103) according to any one of claims 1 to 11, further comprising:an optical filter (150) configured to cover a light-receiving surface (111) of the infrared detector (110),wherein in the case where a mid-wavelength infrared range of from 3.4 µm to 5.5 µm is measured, the optical filter (150) blocks a long-wavelength infrared range of from 8 µm to 14 µm.
- A computer program comprising instructions which, when executed by a processor, cause the processor to execute a method comprising:receiving detection values from an infrared detector that is configured to absorb and photoelectrically convert infrared light of a specific wavelength range and is capable of sweeping an absorption peak wavelength of an absorption spectrum of infrared light, the detection values being detected while sweeping the absorption peak; andcorrecting the detection values from the infrared detector for respective absorption peak wavelengths using corresponding correction coefficients, the correction coefficients differing in accordance with the absorption peak wavelength of the infrared detector with respect to a wavelength range of an atmospheric window.
- A method comprising:detecting infrared light by an infrared detector that is configured to absorb and photoelectrically convert infrared light of a specific wavelength range and is capable of sweeping an absorption peak wavelength of an absorption spectrum of infrared light, the detecting infrared light including sweeping the absorption peak; andcorrecting, by a processing circuit, detection values from the infrared detector for respective absorption peak wavelengths using corresponding correction coefficients, the correction coefficients differing in accordance with the absorption peak wavelength of the infrared detector with respect to a wavelength range of an atmospheric window.
Applications Claiming Priority (1)
| Application Number | Priority Date | Filing Date | Title |
|---|---|---|---|
| JP2017080763A JP6602335B2 (en) | 2017-04-14 | 2017-04-14 | Infrared detection system, method and program |
Publications (2)
| Publication Number | Publication Date |
|---|---|
| EP3388799A2 true EP3388799A2 (en) | 2018-10-17 |
| EP3388799A3 EP3388799A3 (en) | 2018-12-26 |
Family
ID=61971984
Family Applications (1)
| Application Number | Title | Priority Date | Filing Date |
|---|---|---|---|
| EP18166882.3A Withdrawn EP3388799A3 (en) | 2017-04-14 | 2018-04-11 | Infrared detection system |
Country Status (3)
| Country | Link |
|---|---|
| US (1) | US10684168B2 (en) |
| EP (1) | EP3388799A3 (en) |
| JP (1) | JP6602335B2 (en) |
Cited By (1)
| Publication number | Priority date | Publication date | Assignee | Title |
|---|---|---|---|---|
| US20230018507A1 (en) * | 2021-07-19 | 2023-01-19 | Electronics And Telecommunications Research Institute | Apparatus and method for spectroscopic analysis on infrared rays |
Families Citing this family (10)
| Publication number | Priority date | Publication date | Assignee | Title |
|---|---|---|---|---|
| JP6664367B2 (en) * | 2017-11-27 | 2020-03-13 | シャープ株式会社 | Detector, and method of correcting, calibrating, and detecting the detector |
| KR102655740B1 (en) * | 2018-06-20 | 2024-04-05 | 삼성전자주식회사 | Apparatus and method for correcting spectral image and, apparatus and method for analyzing substances of object |
| WO2020184626A1 (en) * | 2019-03-12 | 2020-09-17 | シャープ株式会社 | Infrared ray detection method and device, program for causing computer to execute infrared ray detection method, and computer-readable recording medium upon which program is recorded |
| CN111912815B (en) * | 2019-12-20 | 2023-03-14 | 南开大学 | Near infrared spectrum analysis method for evaluating quality of oil crops |
| CN111458725A (en) * | 2020-04-29 | 2020-07-28 | 武汉齐物科技有限公司 | Riding anti-collision method, device and system based on infrared detection |
| US12536829B2 (en) * | 2020-06-30 | 2026-01-27 | Sharp Kabushiki Kaisha | Electromagnetic wave sensor device and display device |
| JP7393322B2 (en) * | 2020-12-17 | 2023-12-06 | Jfeテクノリサーチ株式会社 | Temperature measurement device, temperature measurement method and atmospheric measurement system |
| CN115900958A (en) * | 2022-12-06 | 2023-04-04 | 中国自然资源航空物探遥感中心 | Geothermal region judgment system and method based on thermal infrared hyperspectral remote sensing |
| CN116295853B (en) * | 2023-03-22 | 2024-03-15 | 大连海事大学 | Multichannel thermal infrared data surface temperature inversion method and device and electronic equipment |
| CN119984530B (en) * | 2025-03-17 | 2026-01-30 | 北京令博红外科技有限公司 | Three-band infrared thermometry methods, temperature monitoring methods, and calculation equipment |
Citations (1)
| Publication number | Priority date | Publication date | Assignee | Title |
|---|---|---|---|---|
| JPH1096667A (en) | 1996-09-20 | 1998-04-14 | Nippon Avionics Co Ltd | Infrared thermal imager and circuit for creating temperature conversion table for each optical system |
Family Cites Families (14)
| Publication number | Priority date | Publication date | Assignee | Title |
|---|---|---|---|---|
| JPH05312653A (en) * | 1992-05-12 | 1993-11-22 | Nikon Corp | Infrared ray image pick-up device |
| US7217951B2 (en) * | 2003-09-23 | 2007-05-15 | Stc@Unm | Detector with tunable spectral response |
| JP2005257358A (en) * | 2004-03-10 | 2005-09-22 | Matsushita Electric Ind Co Ltd | Gas measuring device and gas measuring method |
| US7355182B2 (en) * | 2004-10-06 | 2008-04-08 | Harold Szu | Infrared multi-spectral camera and process of using infrared multi-spectral camera |
| JP2007003308A (en) * | 2005-06-22 | 2007-01-11 | Pasuko:Kk | Method of estimating ground temperature and program for it |
| JP4586650B2 (en) * | 2005-06-29 | 2010-11-24 | オムロン株式会社 | Temperature measurement module and temperature measurement method using the same |
| JP2007178265A (en) * | 2005-12-28 | 2007-07-12 | Yamatake Corp | Temperature measuring method and temperature measuring device |
| US20110202323A1 (en) * | 2009-08-18 | 2011-08-18 | U.S.Government as represented by the Secretary of the Army | Photodetectors using resonance and method of making |
| US9318628B2 (en) * | 2011-05-20 | 2016-04-19 | The University Of Chicago | Mid-infrared photodetectors |
| US8389939B1 (en) * | 2011-09-26 | 2013-03-05 | Rockwell Collins, Inc. | System and method of dual energy radiation detection |
| JP6201286B2 (en) * | 2012-09-19 | 2017-09-27 | 日本電気株式会社 | Quantum dot infrared detector bias voltage determination system, manufacturing method thereof, bias voltage determination method, and control program |
| CA2899045A1 (en) * | 2013-02-21 | 2014-08-28 | The Governing Council Of The University Of Toronto | Photovoltaic devices with plasmonic nanoparticles |
| CN103500766A (en) | 2013-10-19 | 2014-01-08 | 山东大学 | GaAs/AlxGa1-xAs Quantum Well Infrared Detector with Broadband Long-Wave Response and Its Preparation Method and Application |
| US9426397B2 (en) * | 2013-11-12 | 2016-08-23 | EO Vista, LLC | Apparatus and methods for hyperspectral imaging with on-chip digital time delay and integration |
-
2017
- 2017-04-14 JP JP2017080763A patent/JP6602335B2/en not_active Expired - Fee Related
-
2018
- 2018-03-23 US US15/933,437 patent/US10684168B2/en not_active Expired - Fee Related
- 2018-04-11 EP EP18166882.3A patent/EP3388799A3/en not_active Withdrawn
Patent Citations (1)
| Publication number | Priority date | Publication date | Assignee | Title |
|---|---|---|---|---|
| JPH1096667A (en) | 1996-09-20 | 1998-04-14 | Nippon Avionics Co Ltd | Infrared thermal imager and circuit for creating temperature conversion table for each optical system |
Non-Patent Citations (2)
| Title |
|---|
| JOE C. CAMPBELL ET AL.: "Quantum-Dot Infrared Photodetectors; By optimizing dot growth processes, materials have been produced that demonstrate potential, with further development, for high-performance infrared sensing", PROCEEDINGS OF IEEE, vol. 95, no. 9, 2007, pages 1815 - 1827 |
| SHIH-YEN LIN ET AL.: "Voltage-tunable two-color quantum-dot infrared photodetectors", APPL. PHYS. LETT., vol. 95, no. 12, 2009, pages 123504 - 123504,3, XP012122209, DOI: doi:10.1063/1.3236543 |
Cited By (1)
| Publication number | Priority date | Publication date | Assignee | Title |
|---|---|---|---|---|
| US20230018507A1 (en) * | 2021-07-19 | 2023-01-19 | Electronics And Telecommunications Research Institute | Apparatus and method for spectroscopic analysis on infrared rays |
Also Published As
| Publication number | Publication date |
|---|---|
| US20180299326A1 (en) | 2018-10-18 |
| EP3388799A3 (en) | 2018-12-26 |
| JP2018179808A (en) | 2018-11-15 |
| US10684168B2 (en) | 2020-06-16 |
| JP6602335B2 (en) | 2019-11-06 |
Similar Documents
| Publication | Publication Date | Title |
|---|---|---|
| US10684168B2 (en) | Infrared detection system | |
| Dinh et al. | A review on non-dispersive infrared gas sensors: Improvement of sensor detection limit and interference correction | |
| US10156475B2 (en) | Radiation measuring systems and methods thereof | |
| US8282273B2 (en) | Blackbody fitting for temperature determination | |
| Yang et al. | An enhanced three-band index for estimating chlorophyll-a in turbid case-II waters: case studies of Lake Kasumigaura, Japan, and Lake Dianchi, China | |
| Zhou et al. | InAs Photodiodes for 3.43$\mu\text {m} $ Radiation Thermometry | |
| KR101459668B1 (en) | Method For Correcting Temperature Distribution of Semiconductor Device Measured by Infrared Thermal Imaging Camera And System Using The Same | |
| US11353361B2 (en) | Methods, systems, and apparatuses for accurate measurement of health relevant UV exposure from sunlight | |
| Zhou et al. | An InGaAlAs–InGaAs two-color photodetector for ratio thermometry | |
| JP5576162B2 (en) | Quantum infrared gas concentration meter | |
| CN104280136A (en) | Temperature drift and spectral response compensation method for pyroelectric detector | |
| US20220155152A1 (en) | Infrared photodetection device, infrared photodetection process, computer program, and computer-readable storage medium containing program | |
| US10677720B2 (en) | Detector, correction method and calibration method of detector, detection apparatus and detection system | |
| Zhang et al. | Absolute detector calibration applied to nonlinearity error correction in FT-IR measurements | |
| Şahin | Optimization, fabrication, and characterization of dual-band ingaas nbn photodetectors | |
| RU2529200C1 (en) | Method of measuring quantum efficiency and dark current of photosensitive elements in infrared photodetector array | |
| US20150171233A1 (en) | Ultraviolet sensor, ultraviolet sensing apparatus, and sensing method for obtaining compensated ultraviolet sensing result | |
| JP2019184516A (en) | Infrared detection system, infrared detection method, program, and computer readable recording medium in which program is recorded | |
| RU2489772C1 (en) | Method of measuring quantum efficiency and dark current of photosensitive cells of infrared matrix photodetectors | |
| US20210055210A1 (en) | Devices, systems and methods utilizing an improved optical absorption model for direct-gap semiconductors | |
| Pulli | Improvements in spectroradiometric measurements and applications | |
| JPH0462013B2 (en) | ||
| Al-Hajjah et al. | Clouds and the Earth's Radiant Energy System (CERES) spectral response characterizations | |
| Zhou et al. | In As photodiode for low temperature sensing |
Legal Events
| Date | Code | Title | Description |
|---|---|---|---|
| PUAI | Public reference made under article 153(3) epc to a published international application that has entered the european phase |
Free format text: ORIGINAL CODE: 0009012 |
|
| STAA | Information on the status of an ep patent application or granted ep patent |
Free format text: STATUS: THE APPLICATION HAS BEEN PUBLISHED |
|
| AK | Designated contracting states |
Kind code of ref document: A2 Designated state(s): AL AT BE BG CH CY CZ DE DK EE ES FI FR GB GR HR HU IE IS IT LI LT LU LV MC MK MT NL NO PL PT RO RS SE SI SK SM TR |
|
| AX | Request for extension of the european patent |
Extension state: BA ME |
|
| PUAL | Search report despatched |
Free format text: ORIGINAL CODE: 0009013 |
|
| AK | Designated contracting states |
Kind code of ref document: A3 Designated state(s): AL AT BE BG CH CY CZ DE DK EE ES FI FR GB GR HR HU IE IS IT LI LT LU LV MC MK MT NL NO PL PT RO RS SE SI SK SM TR |
|
| AX | Request for extension of the european patent |
Extension state: BA ME |
|
| RIC1 | Information provided on ipc code assigned before grant |
Ipc: G01J 5/20 20060101ALI20181123BHEP Ipc: G01J 3/42 20060101AFI20181123BHEP Ipc: G01N 21/3504 20140101ALI20181123BHEP Ipc: G01J 3/28 20060101ALI20181123BHEP Ipc: G01J 5/00 20060101ALI20181123BHEP Ipc: G01J 3/02 20060101ALI20181123BHEP |
|
| STAA | Information on the status of an ep patent application or granted ep patent |
Free format text: STATUS: REQUEST FOR EXAMINATION WAS MADE |
|
| 17P | Request for examination filed |
Effective date: 20190514 |
|
| RBV | Designated contracting states (corrected) |
Designated state(s): AL AT BE BG CH CY CZ DE DK EE ES FI FR GB GR HR HU IE IS IT LI LT LU LV MC MK MT NL NO PL PT RO RS SE SI SK SM TR |
|
| RIC1 | Information provided on ipc code assigned before grant |
Ipc: G01N 21/3504 20140101ALN20220422BHEP Ipc: G01J 3/28 20060101ALI20220422BHEP Ipc: G01J 5/20 20060101ALI20220422BHEP Ipc: G01J 5/00 20060101ALI20220422BHEP Ipc: G01J 3/42 20060101AFI20220422BHEP |
|
| RIC1 | Information provided on ipc code assigned before grant |
Ipc: G01N 21/3504 20140101ALN20220506BHEP Ipc: G01J 3/28 20060101ALI20220506BHEP Ipc: G01J 5/20 20060101ALI20220506BHEP Ipc: G01J 5/00 20060101ALI20220506BHEP Ipc: G01J 3/42 20060101AFI20220506BHEP |
|
| GRAP | Despatch of communication of intention to grant a patent |
Free format text: ORIGINAL CODE: EPIDOSNIGR1 |
|
| STAA | Information on the status of an ep patent application or granted ep patent |
Free format text: STATUS: GRANT OF PATENT IS INTENDED |
|
| INTG | Intention to grant announced |
Effective date: 20220714 |
|
| STAA | Information on the status of an ep patent application or granted ep patent |
Free format text: STATUS: THE APPLICATION IS DEEMED TO BE WITHDRAWN |
|
| 18D | Application deemed to be withdrawn |
Effective date: 20221125 |