EP3352083B1 - Fehlerbeseitigungsverfahren, mehrkernprozessor und fehlerbeseitigungsausrüstung - Google Patents
Fehlerbeseitigungsverfahren, mehrkernprozessor und fehlerbeseitigungsausrüstung Download PDFInfo
- Publication number
- EP3352083B1 EP3352083B1 EP16848168.7A EP16848168A EP3352083B1 EP 3352083 B1 EP3352083 B1 EP 3352083B1 EP 16848168 A EP16848168 A EP 16848168A EP 3352083 B1 EP3352083 B1 EP 3352083B1
- Authority
- EP
- European Patent Office
- Prior art keywords
- debugging
- preset event
- core
- running
- function
- Prior art date
- Legal status (The legal status is an assumption and is not a legal conclusion. Google has not performed a legal analysis and makes no representation as to the accuracy of the status listed.)
- Active
Links
Images


Classifications
-
- G—PHYSICS
- G06—COMPUTING OR CALCULATING; COUNTING
- G06F—ELECTRIC DIGITAL DATA PROCESSING
- G06F11/00—Error detection; Error correction; Monitoring
- G06F11/36—Prevention of errors by analysis, debugging or testing of software
- G06F11/362—Debugging of software
-
- G—PHYSICS
- G06—COMPUTING OR CALCULATING; COUNTING
- G06F—ELECTRIC DIGITAL DATA PROCESSING
- G06F11/00—Error detection; Error correction; Monitoring
- G06F11/22—Detection or location of defective computer hardware by testing during standby operation or during idle time, e.g. start-up testing
- G06F11/2205—Detection or location of defective computer hardware by testing during standby operation or during idle time, e.g. start-up testing using arrangements specific to the hardware being tested
- G06F11/2236—Detection or location of defective computer hardware by testing during standby operation or during idle time, e.g. start-up testing using arrangements specific to the hardware being tested to test CPU or processors
- G06F11/2242—Detection or location of defective computer hardware by testing during standby operation or during idle time, e.g. start-up testing using arrangements specific to the hardware being tested to test CPU or processors in multi-processor systems, e.g. one processor becoming the primary tester
-
- G—PHYSICS
- G06—COMPUTING OR CALCULATING; COUNTING
- G06F—ELECTRIC DIGITAL DATA PROCESSING
- G06F11/00—Error detection; Error correction; Monitoring
- G06F11/36—Prevention of errors by analysis, debugging or testing of software
-
- G—PHYSICS
- G06—COMPUTING OR CALCULATING; COUNTING
- G06F—ELECTRIC DIGITAL DATA PROCESSING
- G06F11/00—Error detection; Error correction; Monitoring
- G06F11/36—Prevention of errors by analysis, debugging or testing of software
- G06F11/362—Debugging of software
- G06F11/3648—Debugging of software using additional hardware
- G06F11/3656—Debugging of software using additional hardware using a specific debug interface
-
- G—PHYSICS
- G06—COMPUTING OR CALCULATING; COUNTING
- G06F—ELECTRIC DIGITAL DATA PROCESSING
- G06F11/00—Error detection; Error correction; Monitoring
- G06F11/36—Prevention of errors by analysis, debugging or testing of software
- G06F11/3698—Environments for analysis, debugging or testing of software
-
- G—PHYSICS
- G06—COMPUTING OR CALCULATING; COUNTING
- G06F—ELECTRIC DIGITAL DATA PROCESSING
- G06F9/00—Arrangements for program control, e.g. control units
- G06F9/06—Arrangements for program control, e.g. control units using stored programs, i.e. using an internal store of processing equipment to receive or retain programs
- G06F9/46—Multiprogramming arrangements
- G06F9/54—Interprogram communication
- G06F9/545—Interprogram communication where tasks reside in different layers, e.g. user- and kernel-space
-
- G—PHYSICS
- G06—COMPUTING OR CALCULATING; COUNTING
- G06F—ELECTRIC DIGITAL DATA PROCESSING
- G06F9/00—Arrangements for program control, e.g. control units
- G06F9/06—Arrangements for program control, e.g. control units using stored programs, i.e. using an internal store of processing equipment to receive or retain programs
- G06F9/44—Arrangements for executing specific programs
- G06F9/445—Program loading or initiating
-
- G—PHYSICS
- G06—COMPUTING OR CALCULATING; COUNTING
- G06F—ELECTRIC DIGITAL DATA PROCESSING
- G06F9/00—Arrangements for program control, e.g. control units
- G06F9/06—Arrangements for program control, e.g. control units using stored programs, i.e. using an internal store of processing equipment to receive or retain programs
- G06F9/46—Multiprogramming arrangements
- G06F9/48—Program initiating; Program switching, e.g. by interrupt
Definitions
- the present invention relates to the field of computer technologies, and in particular, to a debugging method, a multi-core processor, and a debugging device.
- Program debugging is a process in which a compiled computer program is tested manually or by using a method such as a compiling program before being put into actual operation, so as to correct a syntax error and a logic error. This step is indispensable for ensuring correctness of a computer information system. Therefore, the compiled computer program needs to be loaded into a computer for debugging.
- kernel mode code code that runs in kernel space
- user mode code code that runs in user space
- different debugging platforms need to be used to debug the kernel mode code and the user mode code.
- a target machine described below refers to a physical host in which a debugged code runs
- a host machine described below refers to a physical host in which a debugger runs.
- a debugger when user mode code is being debugged, a debugger needs to run in an operating system of a target machine to perform local debugging; or when user mode code is being debugged, a process tracing module (Ptrace) needs to be implanted into an operating system of a target machine, a debugging stub may further need to run in the operating system, and then a debugger runs in a host machine to perform remote debugging.
- a kernel debugger When kernel mode code such as a kernel module is being debugged, a kernel debugger needs to be implanted into an operating system of a target machine, and then a debugger runs in a host machine to perform remote debugging.
- CN102346708A discloses a debugger and a debugging method thereof.
- the debugging method comprises the following steps: after the debugging relation is established, a debugged task runs in a kernel mode or a user mode by means of the debugger; when the debugger receives a stop instruction sent by a top level or runs into an abnormal event during the debugging process of the debugged task or captures a concerned signal message during the debugging process of the debugged task in the user mode, the debugged task stops running, and a stop mark bit is set in the debugged task; and after the debugged task stops running, the debugger accesses the memory information and/or register information of the debugged task.
- the running status of the debugged task in user address space and kernel address space can be tracked and debugged.
- the present invention provides a debugging method, a multi-core processor, and a debugging device, so as to debug kernel mode code and user mode code on a same debugging platform.
- the present invention provides a debugging method, applied to a target machine in a remote debugging system, where the target machine includes a multi-core processor, and the debugging method includes:
- the debugging information collection function includes a debugging interface function, a first debugging exception instruction is set in a header of the debugging interface function, and the first debugging exception instruction is used to instruct the core A to stop running; and the stopping running, by the core A after completing execution of a processing routine of a preset event, and sending a running stop signal to other cores in a process of stopping running specifically includes: after completing the execution of the processing routine of the preset event, starting, by the core A, to execute the first debugging exception instruction located in the header of the debugging interface function, and sending the running stop signal to the other cores in a process of executing the first debugging exception instruction.
- the debugging information collection function further includes a function associated with the preset event, a second debugging exception instruction is further set in a trailer of the debugging interface function, and the second debugging exception instruction is used to instruct the core A to stop running; and the executing, by the core A, a debugging information collection function to collect debugging information of the preset event, and stopping running after completing the execution of the debugging information collection function specifically includes: executing, by the core A, the function associated with the preset event to collect the debugging information of the preset event, and then executing the second debugging exception instruction located in the trailer of the debugging interface function.
- the function associated with the preset event is located in a kernel debugging stub, and the kernel debugging stub is implanted into an operating system of the target machine in advance.
- the kernel mode code processing function is a kernel module loading function; and the user mode code processing function is a process creation function, a process switching function, a process blocking function, a process wakeup function, a thread creation function, a thread switching function, a thread blocking function, or a thread wakeup function.
- the preset event is the kernel module loading function
- the operation object of the preset event is a kernel module
- the preset event is the process creation function, the process switching function, the process blocking function, or the process wakeup function
- the operation object of the preset event is a process
- the preset event is the thread creation function, the thread switching function, the thread blocking function, or the thread wakeup function
- the debugging information of the preset event includes an identifier of the operation object of the preset event; and if the preset event is the kernel module loading function, the process creation function, or the thread creation function, the debugging information of the preset event further includes a loading address of the operation object of the preset event.
- the multi-core processor is integrated into a system on chip SOC; the sending, by a core A, a running stop signal to other cores, where the running stop signal is used to instruct the other cores to stop running specifically includes:
- the present invention provides a debugging method, executed by a debugging apparatus deployed in a host machine, where the host machine is located in a remote debugging system, and the method includes:
- the method further includes: if the reason that the core A stops running is a reason other than the preset event, instructing, by the debugging apparatus, the core A to resume running, to collect the debugging information of the preset event.
- the function of the kernel mode code is a kernel module loading function; and the function of the user mode code is a process creation function, a process switching function, a process blocking function, a process wakeup function, a thread creation function, a thread switching function, a thread blocking function, or a thread wakeup function.
- the debugging information of the preset event includes a loading address of the operation object of the preset event; and the obtaining, by the debugging apparatus, debugging information of the preset event, and setting a preset pending breakpoint as an operation object of the preset event according to the debugging information of the preset event specifically includes: obtaining, by the debugging apparatus, the loading address of the operation object of the preset event, and setting the preset pending breakpoint as a destination address of the operation object of the preset event according to the loading address of the operation object of the preset event.
- the debugging information of the preset event includes an identifier of the operation object of the preset event; and the obtaining, by the debugging apparatus, debugging information of the preset event, and setting a preset pending breakpoint as an operation object of the preset event according to the debugging information of the preset event specifically includes: obtaining, by the debugging apparatus, the identifier of the operation object of the preset event, determining a loading address of the operation object of the preset event according to the identifier of the operation object of the preset event, and setting the preset pending breakpoint as a destination address of the operation object of the preset event according to the loading address of the operation object of the preset event.
- a correspondence between the identifier of the operation object of the preset event and the loading address of the operation object of the preset event is pre-stored in storage space of the host machine; and the determining a loading address of the operation object of the preset event according to the identifier of the operation object of the preset event specifically includes: obtaining, from the storage space of the host machine, the loading address of the operation object of the preset event according to the identifier of the operation object of the preset event and the correspondence.
- the debugging apparatus includes a debugger and a debugging agent; the determining, by the debugging apparatus after determining that a core A stops running, a reason that the core A stops running, and if the reason that the core A stops running is a preset event, obtaining, by the debugging apparatus, debugging information of the preset event, and setting a preset pending breakpoint as an operation object of the preset event according to the debugging information of the preset event specifically includes:
- the determining, by the debugging apparatus after determining that a core A stops running, a reason that the core A stops running, and if the reason that the core A stops running is a reason other than the preset event, instructing, by the debugging apparatus, the core A to resume running, to collect the debugging information of the preset event specifically includes: after determining, in a polling manner, that the core A stops running, determining, by the debugging agent, the reason that the core A stops running, and if the reason that the core A stops running is a reason other than the preset event, sending, by the debugging agent, a first stop termination instruction to the core A, where the first stop termination instruction is used to instruct the core A to resume running, to collect the debugging information of the preset event.
- the debugging apparatus includes the debugger and the debugging agent; and the determining, by the debugging apparatus after determining that a core A stops running, a reason that the core A stops running, and if the reason that the core A stops running is a reason other than the preset event, instructing, by the debugging apparatus, the core A to resume running, to collect the debugging information of the preset event specifically includes:
- the preset event is the kernel module loading function, the operation object of the preset event is a kernel module; if the preset event is the process creation function, the process switching function, the process blocking function, or the process wakeup function, the operation object of the preset event is a process; and if the preset event is the thread creation function, the thread switching function, the thread blocking function, or the thread wakeup function, the operation object of the preset event is a thread.
- the present invention provides a multi-core processor, applied to a target machine in a remote debugging system, where the multi-core processor includes a core A, other cores, and an input port, and the other cores refer to all cores that are located in the multi-core processor and that belong to a same logical group as the core A, where the core A is configured to: stop running after completing execution of a processing routine of a preset event, and send a running stop signal to the other cores in a process of stopping running, where the running stop signal is used to instruct the other cores to stop running, and the preset event is a kernel mode code processing function or a user mode code processing function; the input port is configured to: receive a first stop termination instruction, and forward the first stop termination instruction to the core A, where the first stop termination instruction is sent by a debugging apparatus in the remote debugging system after the debugging apparatus determines that the core A stops running and that a reason that the core A stops running is a reason other than the prese
- the debugging information collection function includes a debugging interface function, a first debugging exception instruction is set in a header of the debugging interface function, and the first debugging exception instruction is used to instruct the core A to stop running; and the core A is specifically configured to: after completing the execution of the processing routine of the preset event, start to execute the first debugging exception instruction located in the header of the debugging interface function, and send the running stop signal to the other cores in a process of executing the first debugging exception instruction.
- the debugging information collection function further includes a function associated with the preset event, a second debugging exception instruction is further set in a trailer of the debugging interface function, and the second debugging exception instruction is used to instruct the core A to stop running; and the core A is specifically configured to: execute the function associated with the preset event to collect the debugging information of the preset event, and then execute the second debugging exception instruction located in the trailer of the debugging interface function.
- the function associated with the preset event is located in a kernel debugging stub, and the kernel debugging stub is implanted into an operating system of the target machine in advance.
- the kernel mode code processing function is a kernel module loading function; and the user mode code processing function is a process creation function, a process switching function, a process blocking function, a process wakeup function, a thread creation function, a thread switching function, a thread blocking function, or a thread wakeup function.
- the preset event is the kernel module loading function
- the operation object of the preset event is a kernel module
- the preset event is the process creation function, the process switching function, the process blocking function, or the process wakeup function
- the operation object of the preset event is a process
- the preset event is the thread creation function, the thread switching function, the thread blocking function, or the thread wakeup function
- the debugging information of the preset event includes an identifier of the operation object of the preset event; and if the preset event is the kernel module loading function, the process creation function, or the thread creation function, the debugging information of the preset event further includes a loading address of the operation object of the preset event.
- the multi-core processor is integrated into a system on chip SOC; the core A is specifically configured to send the running stop signal to the other cores by using a hardware cross-trigger network of the SOC, where the running stop signal is used to instruct the other cores to stop running; and the core A is specifically configured to send the running resumption instruction to the other cores by using the hardware cross-trigger network of the SOC, where the running resumption instruction is used to instruct the other cores to resume running.
- the present invention provides a debugging apparatus, where the debugging device is deployed on a host machine in a remote debugging system, and the debugging device includes a debugging unit and a receiving unit, where the receiving unit is configured to: receive a message used for instructing a core A to stop running, and forward the message used for instructing the core A to stop running to the debugging unit, where a target machine located in the remote debugging system includes a multi-core processor, and the multi-core processor includes the core A; the debugging unit is configured to: after determining that the core A stops running, determine a reason that the core A stops running; if the reason that the core A stops running is a preset event, the debugging unit is further configured to: obtain debugging information of the preset event, and set a preset pending breakpoint as an operation object of the preset event according to the debugging information of the preset event, where the preset event is a kernel mode code processing function or a user mode code
- the debugging unit is further configured to instruct the core A to resume running, to collect the debugging information of the preset event.
- the function of the kernel mode code is a kernel module loading function; and the function of the user mode code is a process creation function, a process switching function, a process blocking function, a process wakeup function, a thread creation function, a thread switching function, a thread blocking function, or a thread wakeup function.
- the debugging information of the preset event includes a loading address of the operation object of the preset event; and the debugging unit is specifically configured to: obtain the loading address of the operation object of the preset event, and set the preset pending breakpoint as a destination address of the operation object of the preset event according to the loading address of the operation object of the preset event.
- the debugging information of the preset event includes an identifier of the operation object of the preset event; and the debugging unit is specifically configured to: obtain the identifier of the operation object of the preset event, determine a loading address of the operation object of the preset event according to the identifier of the operation object of the preset event, and set the preset pending breakpoint as a destination address of the operation object of the preset event according to the loading address of the operation object of the preset event.
- a correspondence between the identifier of the operation object of the preset event and the loading address of the operation object of the preset event is pre-stored in storage space of the host machine; and the debugging unit is specifically configured to obtain, from the storage space of the host machine, the loading address of the operation object of the preset event according to the identifier of the operation object of the preset event and the correspondence.
- the debugging unit includes a debugger and a debugging agent; the debugging agent is specifically configured to: after determining that the core A stops running, determine the reason that the core A stops running, and if the reason that the core A stops running is the preset event, report a second message to the debugger, where the second message includes an identifier indicating that the core A stops running and an identifier of the preset event; the debugger is specifically configured to: after receiving the second message, obtain the debugging information of the preset event according to the identifier of the preset event, and set the preset pending breakpoint as the operation object of the preset event according to the debugging information of the preset event; and the debugger is specifically configured to instruct the debugging agent to send a second stop termination instruction to the core A, where the second stop termination instruction is used to instruct the core A
- the debugging agent is specifically configured to: after determining that the core A stops running, determine the reason that the core A stops running, and if the reason that the core A stops running is a reason other than the preset event, send a first stop termination instruction to the core A, where the first stop termination instruction is used to instruct the core A to resume running, to collect the debugging information of the preset event.
- the debugging apparatus further includes the debugger and the debugging agent; the debugging agent is specifically configured to: after determining that the core A stops running, determine the reason that the core A stops running, and if the reason that the core A stops running is a reason other than the preset event, report a first message to the debugger, where the first message includes the identifier indicating that the core A stops running and a default identifier; and the debugger is specifically configured to: after receiving the first message, instruct the debugging agent to send a first stop termination instruction to the core A, where the first stop termination instruction is used to instruct the core A to resume running, to collect the debugging information of the preset event.
- a debugging interface function is added to a trailer of a preset event that runs on a core A.
- the debugging interface function invokes a function that is associated with a type of the preset event and that is in a kernel debugging stub, to obtain debugging information of the preset event.
- a debugger sets a preset pending breakpoint as a destination address of an operation object of the preset event according to the debugging information of the preset event, so that the core A knocks the pending breakpoint in a subsequent process of running the operation object of the preset event, implementation manner of the fifth aspect, if the preset event is the kernel module loading function, the process creation function, or the thread creation function, the debugging information of the preset event includes a loading address of the operation object of the preset event; and the processor is specifically configured to: obtain the loading address of the operation object of the preset event, and set the preset pending breakpoint as a destination address of the operation object of the preset event according to the loading address of the operation object of the preset event.
- the debugging information of the preset event includes an identifier of the operation object of the preset event; and the processor is specifically configured to: obtain the identifier of the operation object of the preset event, determine a loading address of the operation object of the preset event according to the identifier of the operation object of the preset event, and set the preset pending breakpoint as a destination address of the operation object of the preset event according to the loading address of the operation object of the preset event.
- a correspondence between the identifier of the operation object of the preset event and the loading address of the operation object of the preset event is pre-stored in storage space of the host machine; and the processor is specifically configured to obtain, from the storage space of the host machine, the loading address of the operation object of the preset event according to the identifier of the operation object of the preset event and the correspondence.
- a debugging interface function is added to a trailer of a preset event that runs on a core A.
- the debugging interface function invokes a function that is associated with a type of the preset event and that is in a kernel debugging stub, to obtain debugging information of the preset event.
- a debugger sets a preset pending breakpoint as a destination address of an operation object of the preset event according to the debugging information of the preset event, so that the core A knocks the pending breakpoint in a subsequent process of running the operation object of the preset event, so as to enter a debugging state.
- the preset event is a kernel mode code processing function or a user mode code processing function. Therefore, according to the technical solutions provided by the present invention, kernel mode code and user mode code can be debugged on a same debugging platform.
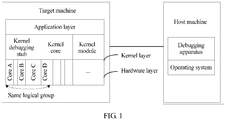
- the remote debugging system includes a target machine and a host machine, the target machine includes a multi-core processor, and a debugging apparatus is deployed on the host machine.
- the target machine and the host machine are different physical hosts, and the target machine communicates with and connects to the host machine.
- the multi-core processor may be a homogeneous multi-core processor, or may be a heterogeneous multi-core processor. If the target machine includes multiple multi-core processors, a core A may be any core of any multi-core processor in the target machine, instead of a specific core of a specific multi-core processor in the target machine.
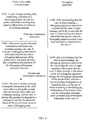
- the debugging method provided in this embodiment of the present invention is a cross debugging method, and is a system-level debugging method. Referring to FIG. 3 , the debugging method provided in this embodiment of the present invention includes the following steps.
- the core A stops running after completing execution of a processing routine of a preset event, and sends a running stop signal to other cores in a process of stopping running, where the running stop signal is used to instruct the other cores to stop running, the other cores refer to all cores that are located in the multi-core processor and that belong to a same logical group as the core A, and the preset event is a kernel mode code processing function or a user mode code processing function.
- a debugging interface function is added to a trailer of the preset event.
- the debugging interface function is located outside the preset event, and is not a part of the preset event.
- a first debugging exception instruction is set in a header of the debugging interface function, and the core A stops running after completing execution of the first debugging exception instruction.
- a second debugging exception instruction is further set in a trailer of the debugging interface function, and the core A stops running after completing execution of the second debugging exception instruction.
- the core A stops running after completing execution of a processing routine of a preset event, and sends a running stop signal to other cores in a process of stopping running includes: after completing the execution of the processing routine of the preset event, the core A starts to execute the first debugging exception instruction located in the header of the debugging interface function, and sends the running stop signal to the other cores in a process of executing the first debugging exception instruction. It should be noted that, the core A executes the first debugging exception instruction for a period of time.
- the core A first starts to execute the first debugging exception instruction, then sends the running stop signal to the other cores at a moment before the execution of the first debugging exception instruction is completed, and continues to execute the first debugging exception instruction after sending the running stop signal to the other cores.
- the core A stops running after completing the execution of the first debugging exception instruction.
- Logical grouping means that multiple cores in a service association relationship are classified into a same logical group by a debugging engineer according to experience.
- the core A, a core B, a core C, and a core D are located in a same logical group.
- that the core A sends a running stop signal to other cores is specifically: the core A sends the running stop signal to the core B, the core C, and the core D.
- the target machine includes a system on chip SOC
- the multi-core processor including the core A is integrated into the SOC
- that the core A sends a running stop signal to other cores, where the running stop signal is used to instruct the other cores to stop running is specifically: the core A sends the running stop signal to the other cores by using a hardware cross-trigger network of the SOC, where the running stop signal is used to instruct the other cores to stop running.
- the core A when sending a running resumption instruction to the other cores by using the hardware cross-trigger network of the SOC, the core A sends the running resumption instruction in a broadcast form.
- An advantage of transmitting a signal by using the hardware cross-trigger network of the system on chip SOC lies in: compared with transmitting a signal by using software, transmitting a signal by using hardware can improve time validity of transmission of the running stop signal.
- kernel mode code processing function is a kernel module loading function
- user mode code processing function is a process creation function, a process switching function, a process blocking function, a process wakeup function, a thread creation function, a thread switching function, a thread blocking function, or a thread wakeup function.
- the debugging apparatus After determining that the core A stops running, the debugging apparatus determines a reason that the core A stops running, and if the reason that the core A stops running is a reason other than the preset event, the debugging apparatus sends a first stop termination instruction to the core A, where the first stop termination instruction is used to instruct the core A to resume running.
- step S101 the core A stops running after completing the execution of the processing routine of the preset event, and instructs the other cores to stop running; in step S102, the debugging apparatus sends the first stop termination instruction to the core A.
- the core A, the core B, the core C, and the core D are located in the same logical group. Data exchange is performed between code that runs on at least one core (such as the core B) of the core B, the core C, or the core D and code that runs on the core A.
- the core A during debugging of the core A, if the core B continues to run, distortion may occur because data exchange cannot be correctly performed between the code that runs on the core B and the code that runs on the core A. Therefore, in the solution provided in this embodiment of the present invention, during debugging of the core A, the other cores that belong to the same logical group as the core A stop running, to avoid distortion. Further, the core A and the other cores first synchronously stop running, and then the core A resumes running for debugging. In addition, in order that the core A and the other cores synchronously stop running, a time at which the running stop signal sent by the core A is transmitted to the other cores and a time at which the core A stops running are further fully considered in design of the solution. Specifically, after stopping running, the core A sends a running stop instruction to the other cores in a running stop period, so that the core A and the other cores synchronously stop running, thereby implementing relatively precise synchronous debugging.
- the preset storage space is specified by a debugging engineer in the memory of the target machine in advance, and both a size and an address of the preset storage space are fixed.
- the preset storage space is used to store a data header. Initially, the data header includes first default information and an address of a data body, and certainly, the first default information may be empty.
- the data body includes second default information, and certainly, the second default information may also be empty.
- the debugging apparatus determines a reason that the core A stops running in S102 specifically includes: after determining, in a polling manner, that the core A stops running, the debugging apparatus determines, by reading content of the data header, the reason that the core A stops running. Because the content of the data header includes the first default information, the debugging apparatus can determine, according to the first default information, that the reason that the core A stops running is a reason other than the preset event.
- the debugging apparatus includes a debugging agent and a debugger, and the debugging apparatus is applied to the remote debugging system described in FIG. 2 .
- the debugging agent and the debugger may be located in a same host machine, or may be located in different host machines.
- the debugging agent is located in a first host machine, and the debugger is located in a second host machine.
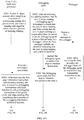
- S102 in FIG. 3 specifically includes the following steps.
- the debugging agent After determining, in a polling manner, that the core A stops running, the debugging agent determines the reason that the core A stops running, and if the reason that the core A stops running is a reason other than the preset event, the debugging agent reports a first message to the debugger, where the first message includes an identifier indicating that the core A stops running and a default identifier.
- S202 specifically includes: after determining, in a polling manner, that the core A stops running, the debugging agent determines, by reading the content of the data header, the reason that the core A stops running. Because the content of the data header includes the first default information, the debugging agent can determine, according to the first default information, that the reason that the core A stops running is a reason other than the preset event, and report, to the debugger, the first message including the identifier indicating that the core A stops running and the default identifier.
- the debugger instructs the debugging agent to send the first stop termination instruction to the core A, where the first stop termination instruction is used to instruct the core A to resume running.
- the debugging agent sends the first stop termination instruction to the core A.
- S102 in FIG. 3 specifically includes: after determining, in a polling manner, that the core A stops running, the debugging agent determines the reason that the core A stops running, and if the reason that the core A stops running is a reason other than the preset event, the debugging agent sends the first stop termination instruction to the core A, where the first stop termination instruction is used to instruct the core A to resume running.
- step S402. Details are not described herein again. It should be noted that, in this embodiment of the present invention, the debugging agent no longer reports, to the debugger, the first message including the identifier indicating that the core A stops running and the default identifier. Instead, the debugging agent sends the first stop termination instruction to the core A after reading the first default information from the data header and determining that the reason that the core A stops running is a reason other than the preset event.
- a difference between this embodiment and the foregoing embodiment lies in: the debugging agent sends the first stop termination instruction to the core A because the debugging agent determines that the reason that the core A stops running is a reason other than the preset event, instead of receiving an instruction of the debugger.
- the debugging agent shares more work of the debugger in this embodiment. Therefore, fewer function requirements are imposed on the debugger, which helps to simplify the debugger.
- the core A executes a debugging information collection function to collect debugging information of the preset event, and stops running after completing the execution of the debugging information collection function.
- the debugging information collection function includes the debugging interface function added to the trailer of the preset event and a function associated with the preset event.
- the function associated with the preset event is located in a kernel debugging stub, and the kernel debugging stub is implanted into an operating system of the target machine in advance.
- the first debugging exception instruction is set in the header of the debugging interface function
- the second debugging exception instruction is set in the trailer of the debugging interface function.
- S103 includes: the core A executes the function associated with the preset event to collect the debugging information of the preset event, and then executes the second debugging exception instruction located in the trailer of the debugging interface function.
- the core A stops running after the core A completes the execution of the second debugging exception instruction.
- the debugging information of the preset event includes an identifier of the preset event and an identifier of an operation object of the preset event. If the preset event is the kernel module loading function, the process creation function, or the thread creation function, the debugging information of the preset event further includes a loading address of the operation object of the preset event. It can be learned that an information amount of the debugging information of the preset event is relatively small, and is generally only about 100 rows. Therefore, according to the technical solution provided in this embodiment of the present invention, an amount of data to be processed by a processor of the target machine can be reduced, thereby improving debugging efficiency.
- the debugging apparatus After determining that the core A stops running, the debugging apparatus determines the reason that the core A stops running, and if the reason that the core A stops running is the preset event, the debugging apparatus obtains the debugging information of the preset event, and sets a preset pending breakpoint as an operation object of the preset event according to the debugging information of the preset event, where the operation object of the preset event is the kernel mode code or the user mode code.
- the debugging apparatus sends a second stop termination instruction to the core A, where the second stop termination instruction is used to instruct the core A to resume running.
- the core A if the core A stops running after completing the execution of the debugging information collection function, in a process of executing the debugging information collection function, the core A writes, into the data header to replace default information, an identifier that is of the preset event and that is used for triggering the core A to execute the debugging information collection function, and writes the identifier of the operation object of the preset event into the data body.
- the preset event is the kernel module loading function, the process creation function, or the thread creation function
- the core A further writes the loading address of the operation object of the preset event into the data body. It should be noted that, the loading address of the operation object of the preset event may be continuous or discontinuous.
- the debugging information collection function includes the identifier the preset event and the identifier of the operation object of the preset event. If the preset event is the kernel module loading function, the process creation function, or the thread creation function, the debugging information collection function includes the identifier of the preset event, the identifier of the operation object of the preset event, and the loading address of the operation object of the preset event.
- the debugging apparatus determines the reason that the core A stops running in S104 specifically includes: after determining, in a polling manner, that the core A stops running, the debugging apparatus determines, by reading the content of the data header, the reason that the core A stops running. Because the content of the data header includes the identifier of the preset event, the debugging apparatus can determine, according to the identifier of the preset event, that the reason that the core A stops running is the preset event.
- the debugging apparatus obtains the debugging information of the preset event, and sets a preset pending breakpoint as an operation object of the preset event according to the debugging information of the preset event in S104 specifically includes: if the debugging apparatus determines, according to the identifier of the preset event, that the preset event is the kernel module loading function, the process creation function, or the thread creation function, the debugging apparatus reads, from the data body, the loading address of the operation object of the preset event according to the address of the data body located in the data header, and then sets the preset pending breakpoint as a destination address of the operation object of the preset event according to the loading address of the operation object of the preset event. Certainly, the destination address of the operation object of the preset event is located in the loading address of the operation object of the preset event.
- the debugging apparatus determines, according to the identifier of the preset event, that the preset event is the process switching function, the process blocking function, the process wakeup function, the thread creation function, the thread switching function, or the thread blocking function
- the debugging apparatus reads, from the data body, the identifier of the operation object of the preset event according to the address of the data body located in the data header, determines the loading address of the operation object of the preset event according to the identifier of the operation object of the preset event, and sets the preset pending breakpoint as a destination address of the operation object of the preset event according to the loading address of the operation object of the preset event.
- the debugging apparatus determines the loading address of the operation object of the preset event according to the identifier of the operation object of the preset event. Specifically, the debugging apparatus obtains, from the storage space of the second host machine, the loading address of the operation object of the preset event according to the identifier of the operation object of the preset event and the correspondence.
- the preset event is the kernel module loading function, the process creation function, the process switching function, the process blocking function, the process wakeup function, the thread creation function, the thread switching function, the thread blocking function, or the thread wakeup function
- the core A stops running after completing the execution of the debugging information collection function content of the data header and the data body is shown in FIG. 6.2 ; if the core A stops running due to another event, content of the data header and the data body is shown in FIG. 6.1 .
- the execution of the debugging information collection function is completed is excluded from the another event.
- the data header and the data body include only one message.
- the debugging apparatus does not need to distinguish which is target information.
- the data header and the data body include only one message, the size of the preset storage space in the memory of the target machine is fixed, and space occupied by the preset storage space is extremely small, thereby avoiding occupying excessive storage resources of the target machine, and improving efficiency of obtaining information.
- the operation object of the preset event is a kernel module
- the preset event is the process creation function, the process switching function, the process blocking function, or the process wakeup function
- the operation object of the preset event is a process
- the preset event is the thread creation function, the thread switching function, the thread blocking function, or the thread wakeup function
- the operation object of the preset event is a thread.
- the kernel module may be a dynamic patch, a hot patch, a dynamic library, or the like.
- the debugging apparatus includes a debugging agent and a debugger, and the debugging apparatus is applied to the remote debugging system described in FIG. 2 .
- the debugging agent and the debugger may be located in a same host machine, or may be located in different host machines.
- the debugging agent is located in a first host machine, and the debugger is located in a second host machine.
- S104 in FIG. 3 specifically includes the following steps.
- the debugging agent After determining that the core A stops running, the debugging agent determines the reason that the core A stops running, and if the reason that the core A stops running is the preset event, the debugging agent reports a second message to the debugger, where the second message includes the identifier indicating that the core A stops running and an identifier of the preset event.
- S206 specifically includes: after determining, in a polling manner, that the core A stops running, the debugging agent determines, by reading the content of the data header, the reason that the core A stops running. Because the content of the data header includes the identifier of the preset event, the debugging agent can determine, according to the identifier of the preset event, that the reason that the core A stops running is the preset event, and report, to the debugger, the second message including the identifier indicating that the core A stops running and the identifier of the preset event.
- the debugger After receiving the second message, the debugger obtains the debugging information of the preset event according to the identifier of the preset event, and sets the preset pending breakpoint as the operation object of the preset event according to the debugging information of the preset event.
- the debugger instructs the debugging agent to send the second stop termination instruction to the core A, where the second stop termination instruction is used to instruct the core A to resume running.
- the debugger obtains the debugging information of the preset event according to the identifier of the preset event specifically includes: the debugger reads, from the data body, the identifier of the operation object of the preset event or the loading address of the operation object of the preset event according to the identifier of the preset event.
- the debugger reads, from the data body, the loading address of the operation object of the preset event according to the address of the data body located in the data header, and then sets the preset pending breakpoint as the destination address of the operation object of the preset event according to the loading address of the operation object of the preset event.
- the destination address of the operation object of the preset event is located in the loading address of the operation object of the preset event.
- the debugger reads, from the data body, the identifier of the operation object of the preset event according to the address of the data body located in the data header, determines the loading address of the operation object of the preset event according to the identifier of the operation object of the preset event, and sets the preset pending breakpoint as the destination address of the operation object of the preset event according to the loading address of the operation object of the preset event.
- the debugger determines the loading address of the operation object of the preset event according to the identifier of the operation object of the preset event. Specifically, the debugger obtains, from the storage space of the second host machine, the loading address of the operation object of the preset event according to the identifier of the operation object of the preset event and the correspondence.
- the loading address of the operation object of the preset event in this embodiment of the present invention refers to a loading address of a target code of the operation object of the preset event
- the loading address of the target code of the operation object of the preset event refers to a loading address, on the target machine side, of the target code of the operation object of the preset event
- a loading address of a source code of the operation object of the preset event refers to a loading address, on the second host machine side, of the source code of the operation object of the preset event.
- the debugger sets the preset pending breakpoint as the destination address of the operation object of the preset event according to the loading address of the operation object of the preset event includes: the debugger creates a symbol table according to a correspondence between the loading address of the target code of the operation object of the preset event and the loading address of the source code of the operation object of the preset event; and then the debugger determines, according to the symbol table, a target address that is on the target code side of the operation object of the preset event and that is mapped to the pending breakpoint (or the pending breakpoint), and sets the pending breakpoint as the destination address of the operation object of the preset event.
- the pending breakpoint (or the pending breakpoint) is set by a debugging engineer on the source code side of the operation object of the preset event in advance.
- that "the debugger instructs the debugging agent to send the second stop termination instruction” occurs after “the debugger sets the preset pending breakpoint as the operation object of the preset event".
- that "the debugger instructs the debugging agent to send the second stop termination instruction” may occur at any moment after “the debugger obtains the debugging information of the preset event” and before “the debugger sets the preset pending breakpoint as the operation object of the preset event”.
- the debugging agent sends a second stop termination instruction to the core A.
- the core A sends a running resumption instruction to the other cores after receiving the second stop termination instruction and resuming running, where the running resumption instruction is used to instruct the other cores to resume running.
- the core A knocks the pending breakpoint in a process of running the operation object of the preset event, so as to enter a debugging state.
- step S301 if the target machine includes the system on chip SOC, and the multi-core processor including the core A is integrated into the SOC, that the core A sends a running resumption instruction to the other cores, where the running resumption instruction is used to instruct the other cores to resume running is specifically: the core A sends the running resumption instruction to the other cores by using the hardware cross-trigger network of the SOC, where the running resumption instruction is used to instruct the other cores to resume running.
- the core A when sending the running resumption instruction to the other cores by using the hardware cross-trigger network of the SOC, the core A sends the running resumption instruction in a broadcast form.
- an advantage of transmitting a signal by using the hardware cross-trigger network of the SOC lies in that time validity of transmission of the running resumption instruction can be improved.
- a debugging interface function is added to a trailer of a preset event that runs on a core A.
- the debugging interface function invokes a function that is associated with a type of the preset event and that is in a kernel debugging stub, to obtain debugging information of the preset event.
- a debugger may set a preset pending breakpoint as a destination address of an operation object of the preset event according to the debugging information of the preset event, so that the core A knocks the pending breakpoint in a subsequent process of running the operation object of the preset event, so as to enter a debugging state.
- the preset event is a kernel mode code processing function or a user mode code processing function. Therefore, according to the technical solution provided in this embodiment of the present invention, kernel mode code and user mode code can be debugged on a same debugging platform.
- this embodiment of the present invention provides a multi-core processor applied to the debugging method described in Embodiment 1, and the multi-core processor is deployed on a target machine in the remote debugging system shown in FIG. 1 .
- the multi-core processor includes a core A, an input port, and other cores.
- the other cores include a core B, a core C, and a core D.
- the core B, the core C, the core D, and the core A all are located in the multi-core processor and belong to a same logical group.
- the core A is configured to: stop running after completing execution of a processing routine of a preset event, and send a running stop signal to the other cores in a process of stopping running, where the running stop signal is used to instruct the other cores to stop running, and the preset event is a kernel mode code processing function or a user mode code processing function.
- a debugging interface function is added to a trailer of the preset event.
- the debugging interface function is located outside the preset event, and is not a part of the preset event.
- a first debugging exception instruction is set in a header of the debugging interface function, and the core A stops running after completing execution of the first debugging exception instruction. Therefore, the core A is specifically configured to: after completing the execution of the processing routine of the preset event, start to execute the first debugging exception instruction located in the header of the debugging interface function, and send the running stop signal to the other cores in a process of executing the first debugging exception instruction.
- the core A is specifically configured to send the running stop signal to the other cores by using a hardware cross-trigger network of the SOC.
- the running stop signal is used to instruct the other cores to stop running. It should be noted that, when sending a running resumption instruction to the other cores by using the hardware cross-trigger network of the SOC, the core A sends the running resumption instruction in a broadcast form.
- the kernel mode code processing function is a kernel module loading function
- the user mode code processing function is a process creation function, a process switching function, a process blocking function, a process wakeup function, a thread creation function, a thread switching function, a thread blocking function, or a thread wakeup function.
- synchronous debugging can be implemented by using the multi-core processor provided in this embodiment of the present invention.
- the core A, the core B, the core C, and the core D are located in the same logical group.
- Data exchange is performed between code that runs on at least one core (such as the core B) of the core B, the core C, or the core D and code that runs on the core A.
- the core B continues to run
- distortion may occur because data exchange cannot be correctly performed between the code that runs on the core B and the code that runs on the core A. Therefore, in the solution provided in this embodiment of the present invention, during debugging of the core A, the other cores that belong to the same logical group as the core A stop running, to avoid distortion.
- the core A and the other cores first synchronously stop running, and then the core A resumes running for debugging.
- a time at which the running stop signal sent by the core A is transmitted to the other cores and a time at which the core A stops running are further fully considered in design of the solution.
- the core A sends a running stop instruction to the other cores in a running stop period, so that the core A and the other cores synchronously stop running, thereby implementing relatively precise synchronous debugging.
- the input port is configured to: receive a first stop termination instruction, and forward the first stop termination instruction to the core A, where the first stop termination instruction is sent by a debugging apparatus in the remote debugging system after the debugging apparatus determines that the core A stops running and that a reason that the core A stops running is a reason other than the preset event.
- the core A is further configured to: after receiving the first stop termination instruction and resuming running, execute a debugging information collection function to collect debugging information of the preset event, and stop running after completing the execution of the debugging information collection function.
- the debugging information collection function includes the debugging interface function added to the trailer of the preset event and a function associated with the preset event.
- the function associated with the preset event is located in a kernel debugging stub, and the kernel debugging stub is implanted into an operating system of the target machine in advance.
- a second debugging exception instruction is set in a trailer of the debugging interface function.
- the function that is associated with the preset event and that is located in the kernel debugging stub is invoked.
- the core A is specifically configured to: execute the function associated with the preset event to collect the debugging information of the preset event, and then execute the second debugging exception instruction located in the trailer of the debugging interface function.
- the core A stops running after the core A completes the execution of the second debugging exception instruction.
- the debugging information of the preset event includes an identifier of the preset event and an identifier of an operation object of the preset event. If the preset event is the kernel module loading function, the process creation function, or the thread creation function, the debugging information of the preset event further includes a loading address of the operation object of the preset event. It can be learned that an information amount of the debugging information of the preset event is relatively small, and is generally only about 100 rows. Therefore, according to the technical solution provided in this embodiment of the present invention, an amount of data to be processed by a processor of the target machine can be reduced, thereby improving debugging efficiency.
- the input port is further configured to: receive a second stop termination instruction, and forward the second stop termination instruction to the core A, where the second stop termination instruction is sent by the debugging apparatus after the debugging apparatus sets a preset pending breakpoint as the operation object of the preset event according to the debugging information of the preset event.
- the operation object of the preset event is a kernel module
- the preset event is the process creation function, the process switching function, the process blocking function, or the process wakeup function
- the operation object of the preset event is a process
- the preset event is the thread creation function, the thread switching function, the thread blocking function, or the thread wakeup function
- the operation object of the preset event is a thread.
- the kernel module may be a dynamic patch, a hot patch, a dynamic library, or the like.
- the core A is further configured to: send a running resumption instruction to the other cores after receiving the second stop termination instruction and resuming running, where the running resumption instruction is used to instruct the other cores to resume running; and knock the pending breakpoint in a process of running the operation object of the preset event, so as to enter a debugging state.
- the core A is specifically configured to send the running resumption instruction to the other cores by using the hardware cross-trigger network of the SOC.
- the running resumption instruction is used to instruct the other cores to resume running.
- the core A sends the running resumption instruction in a broadcast form.
- an advantage of transmitting a signal by using the hardware cross-trigger network of the SOC lies in that time validity of transmission of the running resumption instruction can be improved.
- a debugging interface function is added to a trailer of a preset event that runs on a core A.
- the debugging interface function invokes a function that is associated with a type of the preset event and that is in a kernel debugging stub, to obtain debugging information of the preset event. Therefore, a debugging apparatus sets a preset pending breakpoint as a destination address of an operation object of the preset event according to the debugging information of the preset event, so that the core A knocks the pending breakpoint in a subsequent process of running the operation object of the preset event, so as to enter a debugging state.
- the preset event is a kernel mode code processing function or a user mode code processing function. Therefore, according to the multi-core processor provided in this embodiment of the present invention, kernel mode code and user mode code can be debugged on a same debugging platform.
- this embodiment of the present invention includes a debugging apparatus applied to the debugging method described in Embodiment 1, and the debugging apparatus is deployed on a host machine in the remote debugging system shown in FIG. 1 .
- the debugging apparatus includes a debugging unit and a receiving unit.
- the receiving unit is configured to: receive a message used for instructing a core A to stop running, and forward the message used for instructing the core A to stop running to the debugging apparatus, where a target machine located in the remote debugging system includes a multi-core processor, and the multi-core processor includes the core A.
- the debugging unit is configured to: after determining that the core A stops running, determine a reason that the core A stops running.
- the debugging unit is further configured to: obtain debugging information of the preset event, and set a preset pending breakpoint as an operation object of the preset event according to the debugging information of the preset event, where the preset event is a kernel mode code processing function or a user mode code processing function, and the operation object of the preset event is the kernel mode code or the user mode code.
- the kernel mode code processing function is a kernel module loading function
- the user mode code processing function is a process creation function, a process switching function, a process blocking function, a process wakeup function, a thread creation function, a thread switching function, a thread blocking function, or a thread wakeup function.
- the preset event is the kernel module loading function
- the operation object of the preset event is a kernel module
- the preset event is the process creation function, the process switching function, the process blocking function, or the process wakeup function
- the operation object of the preset event is a process
- the preset event is the thread creation function, the thread switching function, the thread blocking function, or the thread wakeup function
- the operation object of the preset event is a thread.
- the kernel module may be a dynamic patch, a hot patch, a dynamic library, or the like.
- the preset storage space is specified by a debugging engineer in the memory of the target machine in advance, and both a size and an address of the preset storage space are fixed.
- the preset storage space is used to store a data header. Initially, the data header includes first default information and an address of a data body, and certainly, the first default information may be empty.
- the data body includes second default information, and certainly, the second default information may also be empty.
- the core A if the core A stops running after completing execution of the debugging information collection function, in a process of executing the debugging information collection function, the core A writes, into the data header to replace default information, an identifier that is of the preset event and that is used for triggering the core A to execute the debugging information collection function, and writes an identifier of the operation object of the preset event into the data body.
- the preset event is the kernel module loading function, the process creation function, or the thread creation function
- the core A further writes a loading address of the operation object of the preset event into the data body. It should be noted that, the loading address of the operation object of the preset event may be continuous or discontinuous.
- the debugging unit is specifically configured to: after determining that the core A stops running, determine, by reading content of the data header, the reason that the core A stops running. Because the content of the data header includes the identifier of the preset event, the debugging unit can determine, according to the identifier of the preset event, that the reason that the core A stops running is the preset event.
- the debugging unit is specifically configured to: read, from the data body, the loading address of the operation object of the preset event according to the address of the data body located in the data header, and then set the preset pending breakpoint as a destination address of the operation object of the preset event according to the loading address of the operation object of the preset event.
- the debugging unit is specifically configured to: read, from the data body, the identifier of the operation object of the preset event according to the address of the data body located in the data header, determine the loading address of the operation object of the preset event according to the identifier of the operation object of the preset event, and set the preset pending breakpoint as a destination address of the operation object of the preset event according to the loading address of the operation object of the preset event.
- the debugging unit is specifically configured to obtain, from the storage space of the second host machine, the loading address of the operation object of the preset event according to the identifier of the operation object of the preset event and the correspondence.
- the debugging unit in the debugging apparatus is further configured to instruct the core A to resume running, to collect the debugging information of the preset event.
- the debugging unit is specifically configured to: after determining that the core A stops running, determine, by reading the content of the data header, the reason that the core A stops running. Because the content of the data header includes the first default information, the debugging unit can determine, according to the first default information, that the reason that the core A stops running is a reason other than the preset event.
- the debugging unit includes a debugging agent and a debugger.
- the debugging agent and the debugger in the debugging apparatus shown in FIG. 8 may be located in a same host machine, or may be located in different host machines. Referring to the remote debugging system shown in FIG. 2 , the debugging agent and the debugger are respectively located in different host machines. The debugging agent is located in a first host machine, and the debugger is located in the second host machine.
- the debugging agent is specifically configured to: after determining that the core A stops running, determine the reason that the core A stops running, and if the reason that the core A stops running is the preset event, report a second message to the debugger, where the second message includes an identifier indicating that the core A stops running and the identifier of the preset event.
- the debugging agent is specifically configured to: after determining, in a polling manner, that the core A stops running, determine, by reading the identifier that is of the preset event and that is included in the content of the data header, that the reason that the core A stops running is the preset event; and report, to the debugger, the second message including the identifier indicating that the core A stops running and the identifier of the preset event.
- the debugger is specifically configured to: after receiving the second message, obtain the debugging information of the preset event according to the identifier of the preset event, and set the preset pending breakpoint as the operation object of the preset event according to the debugging information of the preset event.
- the debugger is specifically configured to read, from the data body, the identifier of the operation object of the preset event or the loading address of the operation object of the preset event according to the identifier that is of the preset event and that is in the second message.
- the debugger is specifically configured to: read, from the data body, the loading address of the operation object of the preset event according to the address of the data body located in the data header, and then set the preset pending breakpoint as the destination address of the operation object of the preset event according to the loading address of the operation object of the preset event.
- the debugger is specifically configured to: read, from the data body, the identifier of the operation object of the preset event according to the address of the data body located in the data header, determine the loading address of the operation object of the preset event according to the identifier of the operation object of the preset event, and set the preset pending breakpoint as the destination address of the operation object of the preset event according to the loading address of the operation object of the preset event.
- the debugger determines the loading address of the operation object of the preset event according to the identifier of the operation object of the preset event. Specifically, the debugger obtains, from the storage space of the second host machine, the loading address of the operation object of the preset event according to the identifier of the operation object of the preset event and the correspondence.
- the debugging agent is specifically configured to: after determining that the core A stops running, determine the reason that the core A stops running, and if the reason that the core A stops running is a reason other than the preset event, send a first stop termination instruction to the core A, where the first stop termination instruction is used to instruct the core A to resume running, to collect the debugging information of the preset event.
- the debugging agent is specifically configured to: after determining, in a polling manner, that the core A stops running, read the first default information included in the content of the data header, and determine, according to the first default information, that the reason that the core A stops running is a reason other than the preset event.
- the debugging agent is specifically configured to: after determining, in a polling manner, that the core A stops running, determine the reason that the core A stops running, and if the reason that the core A stops running is a reason other than the preset event, report a first message to the debugger, where the first message includes the identifier indicating that the core A stops running and a default identifier.
- the debugging agent is specifically configured to: after determining, in a polling manner, that the core A stops running, read the first default information included in the content of the data header; determine, according to the first default information, that the reason that the core A stops running is a reason other than the preset event; and report, to the debugger, the identifier indicating that the core A stops running and the default identifier.
- the debugger is specifically configured to: after receiving the first message, instruct the debugging agent to send the first stop termination instruction to the core A, where the first stop termination instruction is used to instruct the core A to resume running.
- the debugging agent is specifically configured to send the first stop termination instruction to the core A.
- the debugging unit is further configured to instruct the core A to resume running, so that the core A knocks the pending breakpoint in a process of running the operation object of the preset event, and the core A enters a debugging state.
- the debugger is specifically configured to instruct the debugging agent to send a second stop termination instruction to the core A, where the second stop termination instruction is used to instruct the core A to resume running, so that the core A knocks the pending breakpoint in process of running the operation object of the preset event, and the core A enters a debugging state.
- the debugging apparatus after determining that a core A of a multi-core processor on a target machine side stops running, if it is determined that a reason that the core A stops running is a preset event, the debugging apparatus obtains, from the target machine side, debugging information of the preset event, and sets a preset pending breakpoint as an operation object of the preset event according to the debugging information of the preset event, so as to debug the operation object of the preset event.
- the preset event is a kernel mode code processing function or a user mode code processing function
- the operation object of the preset event is kernel mode code or user mode code. Therefore, according to the debugging apparatus provided in this embodiment of the present invention, not only the kernel mode code can be debugged, but also the user mode code can be debugged.
- FIG. 9 is a structural block diagram of a debugging device 900 according to an embodiment of the present invention.
- the debugging device 900 is applied to the remote debugging system shown in FIG. 1 , and the debugging device 900 is a specific implementation manner of a host machine in the remote debugging system shown in FIG. 1 .
- the debugging device 900 includes: at least one processor 901, at least one network interface 904 or another user interface 903, a memory 905, and at least one communications bus 902.
- the communications bus 902 is configured to implement connection and communication between these components.
- the debugging device 900 optionally includes the user interface 903, including a display (such as a touchscreen, an LCD, a CTR, a holographic (Holographic) device, or a projector (Projector)), a keyboard, or a click device (such as a mouse, a trackball (trackball), a touchpad, or a touchscreen).
- a display such as a touchscreen, an LCD, a CTR, a holographic (Holographic) device, or a projector (Projector)
- a keyboard such as a mouse, a trackball (trackball), a touchpad, or a touchscreen.
- a click device such as a mouse, a trackball (trackball), a touchpad, or a touchscreen.
- the memory 905 may include a read-only memory and a random access memory, and may provide an instruction and data for the processor. A part of the memory 905 may further include a nonvolatile random access memory (NVRAM).
- NVRAM nonvolatile random access memory
- the memory 905 stores the following elements: an executable module or a data structure, or a subset thereof, or an extension set thereof:
- the processor 901 is configured to: after determining that the core A stops running, determine a reason that the core A stops running.
- a target machine located in the remote debugging system includes a multi-core processor, and the multi-core processor includes the core A.
- the preset storage space is specified by a debugging engineer in the memory of the target machine in advance, and both a size and an address of the preset storage space are fixed.
- the preset storage space is used to store a data header. Initially, the data header includes first default information and an address of a data body, and certainly, the first default information may be empty.
- the data body includes second default information, and certainly, the second default information may also be empty.
- the core A if the core A stops running after completing execution of the debugging information collection function, in a process of executing the debugging information collection function, the core A writes, into the data header to replace default information, an identifier that is of a preset event and that is used for triggering the core A to execute the debugging information collection function, and writes an identifier of an operation object of the preset event into the data body.
- the preset event is a kernel module loading function, a process creation function, or a thread creation function
- the core A further writes a loading address of the operation object of the preset event into the data body. It should be noted that, the loading address of the operation object of the preset event may be continuous or discontinuous.
- the data header still includes the first default information and the address of the data body, and the data body still includes the second default information.
- the processor 901 is specifically configured to: after determining that the core A stops running, determine, by reading content of the data header, the reason that the core A stops running; if the data header includes the identifier of the preset event, determine that the reason that the core A stops running is the preset event; and if the data header includes the first default information, determine that the reason that the core A stops running is a reason other than the preset event.
- the processor 901 is further configured to: obtain debugging information of the preset event, and set a preset pending breakpoint as the operation object of the preset event according to the debugging information of the preset event, where the preset event is a kernel mode code processing function or a user mode code processing function, and the operation object of the preset event is kernel mode code or user mode code.
- the debugging information of the preset event includes the identifier of the preset event and the identifier of the operation object of the preset event. If the preset event is the kernel module loading function, the process creation function, or the thread creation function, the debugging information of the preset event further includes the loading address of the operation object of the preset event.
- the kernel mode code processing function is the kernel module loading function
- the user mode code processing function is the process creation function, a process switching function, a process blocking function, a process wakeup function, the thread creation function, a thread switching function, a thread blocking function, or a thread wakeup function.
- the preset event is the kernel module loading function
- the operation object of the preset event is a kernel module
- the preset event is the process creation function, the process switching function, the process blocking function, or the process wakeup function
- the operation object of the preset event is a process
- the preset event is the thread creation function, the thread switching function, the thread blocking function, or the thread wakeup function, the operation object of the preset event is a thread.
- the processor 901 is specifically configured to: read, from the data body, the loading address of the operation object of the preset event according to the address of the data body located in the data header, and then set the preset pending breakpoint as a destination address of the operation object of the preset event according to the loading address of the operation object of the preset event.
- the processor 901 is configured to: read, from the data body, the identifier of the operation object of the preset event according to the address of the data body located in the data header, determine the loading address of the operation object of the preset event according to the identifier of the operation object of the preset event, and set the preset pending breakpoint as a destination address of the operation object of the preset event according to the loading address of the operation object of the preset event.
- the processor 901 is specifically configured to obtain, from the storage space of the second host machine, the loading address of the operation object of the preset event according to the identifier of the operation object of the preset event and the correspondence.
- the memory 905 is configured to store the debugging information of the preset event.
- the processor 901 is further configured to instruct the core A to resume running, so that the core A knocks the pending breakpoint in a process of running the operation object of the preset event, and the core A enters a debugging state.
- the processor 901 is further configured to instruct the core A to resume running, to collect the debugging information of the preset event.
- the debugging device after determining that a core A of a multi-core processor on a target machine side stops running, if it is determined that a reason that the core A stops running is a preset event, the debugging device obtains, from the target machine side, debugging information of the preset event, and sets a preset pending breakpoint as an operation object of the preset event according to the debugging information of the preset event, so as to debug the operation object of the preset event.
- the preset event is a kernel mode code processing function or a user mode code processing function
- the operation object of the preset event is kernel mode code or user mode code. Therefore, according to the debugging device provided in this embodiment of the present invention, not only the kernel mode code can be debugged, but also the user mode code can be debugged.
- the technical solutions of the present invention essentially, or the part contributing to the prior art, or some of the technical solutions may be implemented in a form of a software product.
- the software product is stored in a storage medium, and includes several instructions for instructing a computer device (which may be a personal computer, a server, a network device, or the like) to perform all or some of the steps of the methods described in the embodiments of the present invention.
- the foregoing storage medium includes: any medium that can store program code, such as a USB flash drive, a removable hard disk, a read-only memory (ROM, Read-Only Memory), a random access memory (RAM, Random Access Memory), a magnetic disk, or an optical disc.
Landscapes
- Engineering & Computer Science (AREA)
- Theoretical Computer Science (AREA)
- Computer Hardware Design (AREA)
- General Engineering & Computer Science (AREA)
- Physics & Mathematics (AREA)
- General Physics & Mathematics (AREA)
- Quality & Reliability (AREA)
- Software Systems (AREA)
- Debugging And Monitoring (AREA)
Claims (31)
- "Debugging"-Verfahren, das bei einer Zielmaschine in einem Fern-"Debugging"-System angewendet wird, wobei die Zielmaschine einen Mehrkernprozessor umfasst, und das Verfahren Folgendes umfasst:Stoppen (S101) der Ausführung, durch einen Kern A des Mehrkernprozessors nach der Beendigung der Durchführung einer Verarbeitungsroutine eines voreingestellten Ereignisses, und Senden eines Ausführungsstoppsignals zu anderen Kernen in einem Prozess des Stoppens der Ausführung, wobei das Ausführungsstoppsignal dafür verwendet wird, die anderen Kerne anzuweisen, die Ausführung zu stoppen, wobei sich die anderen Kerne auf alle Kerne beziehen, die sich im Mehrkernprozessor befinden und zu derselben logischen Gruppe wie der Kern A gehören, und das voreingestellte Ereignis eine Kernel-Moduscode-Verarbeitungsfunktion oder eine Benutzermoduscode-Verarbeitungsfunktion ist;nach dem Empfang einer ersten Stoppabbruchsanweisung und der Wiederaufnahme der Ausführung, Durchführen (S103), durch den Kern A, einer "Debugging"-Informationen-Sammelfunktion zum Sammeln von "Debugging"-Informationen des voreingestellten Ereignisses, und Stoppen der Ausführung nach Beendigung der Durchführung der "Debugging"-Informationen-Sammelfunktion, wobei die erste Stoppabbruchsanweisung durch eine "Debugging"-Vorrichtung im Fern-"Debugging"-System gesendet wird, nachdem die "Debugging"-Vorrichtung bestimmt, dass der Kern A die Ausführung stoppt und dass ein Grund dafür, dass der Kern A die Ausführung stoppt, ein Grund außer dem voreingestellten Ereignis ist;nach dem Empfang einer zweiten Stoppabbruchsanweisung und der Wiederaufnahme der Ausführung, Senden (S105), durch den Kern A, einer Ausführungswiederaufnahmeanweisung zu den anderen Kernen, wobei die Ausführungswiederaufnahmeanweisung dafür verwendet wird, die anderen Kerne anzuweisen, die Ausführung wiederaufzunehmen, und die zweite Stoppabbruchsanweisung durch die "Debugging"-Vorrichtung gesendet wird, nachdem die "Debugging"-Vorrichtung einen voreingestellten bevorstehenden Haltepunkt als ein Operationsobjekt des voreingestellten Ereignisses gemäß den "Debugging"-Informationen des voreingestellten Ereignisses einstellt; und"Knocking" (S105), durch den Kern A, des bevorstehenden Haltepunktes in einem Prozess der Ausführung des Operationsobjekts des voreingestellten Ereignisses, sodass in einen "Debugging"-Zustand eingetreten wird.
- Verfahren nach Anspruch 1, wobei
die "Debugging"-Informationen-Sammelfunktion eine "Debugging"-Schnittstellenfunktion umfasst, eine erste "Debugging"-Ausnahmeanweisung in einem "Header" der "Debugging"-Schnittstellenfunktion eingestellt ist und die erste "Debugging"-Ausnahmeanweisung dafür verwendet wird, den Kern A anzuweisen, die Ausführung zu stoppen; und
der Schritt des Stoppens (S101) der Ausführung, durch den Kern A nach der Beendigung der Durchführung einer Verarbeitungsroutine eines voreingestellten Ereignisses, und des Sendens eines Ausführungsstoppsignals zu anderen Kernen in einem Prozess des Stoppens der Ausführung spezifisch Folgendes umfasst:
nach der Beendigung der Durchführung der Verarbeitungsroutine des voreingestellten Ereignisses, Starten, durch den Kern A, der Durchführung der ersten "Debugging"-Ausnahmeanweisung, die sich im "Header" der "Debugging"-Schnittstellenfunktion befindet, und Senden des Ausführungsstoppsignals zu den anderen Kernen in einem Prozess des Durchführens der ersten "Debugging"-Ausnahmeanweisung. - Verfahren nach Anspruch 2, wobei
die "Debugging"-Informationen-Sammelfunktion ferner eine mit dem voreingestellten Ereignis assoziierte Funktion umfasst, eine zweite "Debugging"-Ausnahmeanweisung ferner in einem "Trailer" der "Debugging"-Schnittstellenfunktion eingestellt ist und die zweite "Debugging"-Ausnahmeanweisung dafür verwendet wird, den Kern A anzuweisen, die Ausführung zu stoppen; und
der Schritt des Durchführens (S103), durch den Kern A, einer "Debugging"-Informationen-Sammelfunktion zum Sammeln von "Debugging"-Informationen des voreingestellten Ereignisses, und des Stoppens der Ausführung nach Beendigung der Durchführung der "Debugging"-Informationen-Sammelfunktion spezifisch Folgendes umfasst:
Durchführen, durch den Kern A, der mit dem voreingestellten Ereignis assoziierten Funktion, um die "Debugging"-Informationen des voreingestellten Ereignisses zu sammeln, und dann Durchführen der zweiten "Debugging"-Ausnahmeanweisung, die sich im "Trailer" der "Debugging"-Schnittstellenfunktion befindet. - Verfahren nach Anspruch 3, wobei
sich die mit dem voreingestellten Ereignis assoziierte Funktion in einem Kernel-"Debugging-Stub" befindet und das Kernel-"Debugging-Stub" im Voraus in ein Betriebssystem der Zielmaschine implantiert wird. - Verfahren nach einem der Ansprüche 1 bis 4, wobei
die Kernel-Moduscode-Verarbeitungsfunktion eine Kernel-Modulladefunktion ist; und
die Benutzermoduscode-Verarbeitungsfunktion eine Prozesserzeugungsfunktion, eine Prozessschaltfunktion, eine Prozessblockierfunktion, eine Prozessaufweckfunktion, eine Thread-Erzeugungsfunktion, eine Thread-Schaltfunktion, eine Thread-Blockierfunktion oder eine Thread-Aufweckfunktion ist. - Verfahren nach Anspruch 5, wobei
falls das voreingestellte Ereignis die Kernel-Modulladefunktion ist, das Operationsobjekt des voreingestellten Ereignisses ein Kernel-Modul ist;
falls das voreingestellte Ereignis die Prozesserzeugungsfunktion, die Prozessschaltfunktion, die Prozessblockierfunktion oder die Prozessaufweckfunktion ist, das Operationsobjekt des voreingestellten Ereignisses ein Prozess ist; und
falls das voreingestellte Ereignis die Thread-Erzeugungsfunktion, die Thread-Schaltfunktion, die Thread-Blockierfunktion oder die Thread-Aufweckfunktion ist, das Operationsobjekt des voreingestellten Ereignisses ein Thread ist. - Verfahren nach Anspruch 5 oder 6, wobei die "Debugging"-Informationen des voreingestellten Ereignisses eine Kennung des Operationsobjekts des voreingestellten Ereignisses umfassen; und
falls das voreingestellte Ereignis die Kernel-Modulladefunktion, die Prozesserzeugungsfunktion oder die Thread-Erzeugungsfunktion ist, die "Debugging"-Informationen des voreingestellten Ereignisses ferner eine Ladeadresse des Operationsobjekts des voreingestellten Ereignisses umfassen. - Verfahren nach einem der Ansprüche 1 bis 7, wobei der Mehrkernprozessor in ein System-auf-Chip bzw. SOC ("System On Chip") integriert ist;
der Schritt des Sendens, durch einen Kern A, eines Ausführungsstoppsignals zu anderen Kernen, wobei das Ausführungsstoppsignal dafür verwendet wird, die anderen Kerne anzuweisen, die Ausführung zu stoppen, spezifisch Folgendes umfasst:Senden, durch den Kern A, des Ausführungsstoppsignals zu den anderen Kernen unter Verwendung eines Hardware-"Cross-Trigger"-Netzwerks des SOC, wobei das Ausführungsstoppsignal dafür verwendet wird, die anderen Kerne anzuweisen, die Ausführung zu stoppen; undder Schritt des Sendens (S105), durch den Kern A, einer Ausführungswiederaufnahmeanweisung zu den anderen Kernen, wobei die Ausführungswiederaufnahmeanweisung dafür verwendet wird, die anderen Kerne anzuweisen, die Ausführung wiederaufzunehmen, spezifisch Folgendes umfasst:
Senden, durch den Kern A, der Ausführungswiederaufnahmeanweisung zu den anderen Kernen unter Verwendung des Hardware-"Cross-Trigger"-Netzwerks des SOC, wobei die Ausführungswiederaufnahmeanweisung dafür verwendet wird, die anderen Kerne anzuweisen, die Ausführung wiederaufzunehmen. - "Debugging"-Verfahren, das durch eine "Debugging"-Vorrichtung ausgeführt wird, die in einer Host-Maschine eingesetzt wird, wobei sich die Host-Maschine in einem Fern-"Debugging"-System befindet, und das Verfahren Folgendes umfasst:Bestimmen (S102), durch die "Debugging"-Vorrichtung nach der Bestimmung, dass ein Kern A die Ausführung stoppt, eines Grundes dafür, dass der Kern A die Ausführung stoppt, wobei der Kern A zu einem Mehrkernprozessor einer Zielmaschine im Fern-"Debugging"-System gehört;falls der Grund dafür, dass der Kern A die Ausführung stoppt, ein voreingestelltes Ereignis ist, Erhalten (S104), durch die "Debugging"-Vorrichtung, von "Debugging"-Informationen des voreingestellten Ereignisses und Einstellen eines voreingestellten bevorstehenden Haltepunktes als ein Operationsobjekt des voreingestellten Ereignisses gemäß den "Debugging"-Informationen des voreingestellten Ereignisses, wobei das des voreingestellte Ereignis eine Kernel-Moduscode-Verarbeitungsfunktion oder eine Benutzermoduscode-Verarbeitungsfunktion ist und das Operationsobjekt des voreingestellten Ereignisses ein Kernel-Moduscode oder ein Benutzermoduscode ist; undAnweisen, durch die "Debugging"-Vorrichtung, des Kerns A, die Ausführung wiederaufzunehmen, sodass der Kern A den bevorstehenden Haltepunkt in einem Prozess der Ausführung des Operationsobjekts des voreingestellten Ereignisses "knockt" und der Kern A in einen "Debugging"-Zustand eintritt.
- Verfahren nach Anspruch 9, wobei
falls der Grund dafür, dass der Kern A die Ausführung stoppt, ein Grund außer dem voreingestellten Ereignis ist, Anweisen, durch die "Debugging"-Vorrichtung, des Kerns A, die Ausführung wiederaufzunehmen, um die "Debugging"-Informationen des voreingestellten Ereignisses zu sammeln. - Verfahren nach Anspruch 9 oder 10, wobei
die Funktion des Kernel-Moduscodes eine Kernel-Modulladefunktion ist; und die Funktion des Benutzermoduscodes eine Prozesserzeugungsfunktion, eine Prozessschaltfunktion, eine Prozessblockierfunktion, eine Prozessaufweckfunktion, eine Thread-Erzeugungsfunktion, eine Thread-Schaltfunktion, eine Thread-Blockierfunktion oder eine Thread-Aufweckfunktion ist. - Verfahren nach Anspruch 11, wobei
falls das voreingestellte Ereignis die Kernel-Modulladefunktion, die Prozesserzeugungsfunktion oder die Thread-Erzeugungsfunktion ist, die "Debugging"-Informationen des voreingestellten Ereignisses eine Ladeadresse des Operationsobjekts des voreingestellten Ereignisses umfassen; und
der Schritt des Erhaltens, durch die "Debugging"-Vorrichtung, von "Debugging"-Informationen des voreingestellten Ereignisses und des Einstellens eines voreingestellten bevorstehenden Haltepunktes als ein Operationsobjekt des voreingestellten Ereignisses gemäß den "Debugging"-Informationen des voreingestellten Ereignisses spezifisch Folgendes umfasst:
Erhalten, durch die "Debugging"-Vorrichtung, der Ladeadresse des Operationsobjekts des voreingestellten Ereignisses und Einstellen des bevorstehenden Haltepunktes als eine Zieladresse des Operationsobjekts des voreingestellten Ereignisses gemäß der Ladeadresse des Operationsobjekts des voreingestellten Ereignisses. - Verfahren nach Anspruch 11, wobei
falls das voreingestellte Ereignis die Prozessschaltfunktion, die Prozessblockierfunktion, die Prozessaufweckfunktion, die Thread-Schaltfunktion, die Thread-Blockierfunktion oder die Thread-Aufweckfunktion ist, die "Debugging"-Informationen des voreingestellten Ereignisses eine Kennung des Operationsobjekts des voreingestellten Ereignisses umfassen; und
der Schritt des Erhaltens (S104), durch die "Debugging"-Vorrichtung, von "Debugging"-Informationen des voreingestellten Ereignisses und des Einstellens eines voreingestellten bevorstehenden Haltepunktes als ein Operationsobjekt des voreingestellten Ereignisses gemäß den "Debugging"-Informationen des voreingestellten Ereignisses spezifisch Folgendes umfasst:
Erhalten, durch die "Debugging"-Vorrichtung, der Kennung des Operationsobjekts des voreingestellten Ereignisses, Bestimmen einer Ladeadresse des Operationsobjekt des voreingestellten Ereignisses gemäß der Kennung des Operationsobjekts des voreingestellten Ereignisses und Einstellen des bevorstehenden Haltepunktes als eine Zieladresse des Operationsobjekts des voreingestellten Ereignisses gemäß der Ladeadresse des Operationsobjekt des voreingestellten Ereignisses. - Verfahren nach Anspruch 13, wobei eine Korrespondenz zwischen der Kennung des Operationsobjekt des voreingestellten Ereignisses und der Ladeadresse des Operationsobjekt des voreingestellten Ereignisses in einem Speicherraum der Host-Maschine vorgespeichert wird; und
der Schritt des Bestimmens einer Ladeadresse des Operationsobjekt des voreingestellten Ereignisses gemäß der Kennung des Operationsobjekt des voreingestellten Ereignisses spezifisch Folgendes umfasst:
Erhalten, aus dem Speicherraum der Host-Maschine, der Ladeadresse des Operationsobjekt des voreingestellten Ereignisses gemäß der Kennung des Operationsobjekt des voreingestellten Ereignisses und der Korrespondenz. - Verfahren nach einem der Ansprüche 9 bis 14, wobei die "Debugging"-Vorrichtung einen Debugger und einen "Debugging"-Agenten umfasst;
der Schritt des Bestimmens, durch die "Debugging"-Vorrichtung, nach der Bestimmung, dass der Kern A die Ausführung stoppt, eines Grundes dafür, dass der Kern A die Ausführung stoppt, und, falls der Grund dafür, dass der Kern A die Ausführung stoppt, ein voreingestelltes Ereignis ist, des Erhaltens, durch die "Debugging"-Vorrichtung, von "Debugging"-Informationen des voreingestellten Ereignisses und des Einstellens eines bevorstehenden Haltepunktes als ein Operationsobjekt des voreingestellten Ereignisses gemäß den "Debugging"-Informationen des voreingestellten Ereignisses spezifisch Folgendes umfasst:nach der Bestimmung, auf eine "Polling"-Weise, dass der Kern A die Ausführung stoppt, Bestimmen (S202), durch den "Debugging"-Agenten, des Grundes dafür, dass der Kern A die Ausführung stoppt, und, falls der Grund dafür, dass der Kern A die Ausführung stoppt, das voreingestellte Ereignis ist, Melden (S202), durch den "Debugging"-Agenten, einer zweiten Nachricht an den Debugger, wobei die zweite Nachricht eine Kennung, die ein Stoppen der Ausführung durch den Kern A angibt, und eine Kennung des voreingestellten Ereignisses umfasst; undnach dem Empfang der zweiten Nachricht, Erhalten, durch den Debugger, der "Debugging"-Informationen des voreingestellten Ereignisses gemäß der Kennung des voreingestellten Ereignisses und Einstellen des bevorstehenden Haltepunktes als das Operationsobjekt des voreingestellten Ereignisses gemäß den "Debugging"-Informationen des voreingestellten Ereignisses; undder Schritt des Anweisens, durch die "Debugging"-Vorrichtung, des Kerns A, die Ausführung wiederaufzunehmen, spezifisch Folgendes umfasst:
Anweisen, durch den Debugger, des "Debugging"-Agenten, eine zweite Stoppabbruchsanweisung zum Kern A zu senden, wobei die zweite Stoppabbruchsanweisung dafür verwendet wird, den Kern A anzuweisen, die Ausführung wiederaufzunehmen. - Verfahren nach Anspruch 15, wobei
der Schritt des Bestimmens, durch die "Debugging"-Vorrichtung nach der Bestimmung, dass ein Kern A die Ausführung stoppt, eines Grundes dafür, dass der Kern A die Ausführung stoppt, und, falls der Grund dafür, dass der Kern A die Ausführung stoppt, ein Grund außer dem voreingestellten Ereignis ist, des Anweisens, durch die "Debugging"-Vorrichtung, des Kerns A, die Ausführung wiederaufzunehmen, um die "Debugging"-Informationen des voreingestellten Ereignisses zu sammeln, spezifisch Folgendes umfasst:
nach der Bestimmung, auf eine "Polling"-Weise, dass der Kern A die Ausführung stoppt, Bestimmen (S202), durch den "Debugging"-Agenten, des Grundes dafür, dass der Kern A die Ausführung stoppt, und, falls der Grund dafür, dass der Kern A die Ausführung stoppt, ein Grund außer dem voreingestellten Ereignis ist, Senden, durch den "Debugging"-Agenten, einer ersten Stoppabbruchsanweisung zum Kern A, wobei die erste Stoppabbruchsanweisung dafür verwendet wird, den Kern A anzuweisen, die Ausführung wiederaufzunehmen, um die "Debugging"-Informationen des voreingestellten Ereignisses zu sammeln. - Verfahren nach einem der Ansprüche 9 bis 15, wobei die "Debugging"-Vorrichtung den Debugger und den "Debugging"-Agenten umfasst; und
der Schritt des Bestimmens, durch die "Debugging"-Vorrichtung nach der Bestimmung, dass der Kern A die Ausführung stoppt, eines Grundes dafür, dass der Kern A die Ausführung stoppt, und, falls der Grund dafür, dass der Kern A die Ausführung stoppt, ein Grund außer dem voreingestellten Ereignis ist, des Anweisens, durch die "Debugging"-Vorrichtung, des Kerns A, die Ausführung wiederaufzunehmen, um die "Debugging"-Informationen des voreingestellten Ereignisses zu sammeln, spezifisch Folgendes umfasst:nach der Bestimmung, auf eine "Polling"-Weise, dass der Kern A die Ausführung stoppt, Bestimmen (S202), durch den "Debugging"-Agenten, des Grundes dafür, dass der Kern A die Ausführung stoppt, und, falls der Grund dafür, dass der Kern A die Ausführung stoppt, ein Grund außer dem voreingestellten Ereignis ist, Melden (S202) einer ersten Nachricht zum Debugger, wobei die erste Nachricht die Kennung, die das Stoppen der Ausführung durch den Kern A angibt, und eine Standardkennung umfasst; undnach dem Empfang der ersten Nachricht, Anweisen, durch den Debugger, des "Debugging"-Agenten, eine erste Stoppabbruchsanweisung zum Kern A zu senden, wobei die erste Stoppabbruchsanweisung dafür verwendet wird, den Kern A anzuweisen, die Ausführung wiederaufzunehmen, um die "Debugging"-Informationen des voreingestellten Ereignisses zu sammeln. - Mehrkernprozessor, der an einer Zielmaschine in einem Fern-"Debugging"-System angewendet wird, wobei der Mehrkernprozessor einen Kern A, andere Kerne und einen Eingangsport umfasst und sich die anderen Kerne auf alle Kerne beziehen, die sich im Mehrkernprozessor befinden und zu derselben logischen Gruppe wie der Kern A gehören, wobei
der Kern A ausgelegt ist zum: Stoppen der Ausführung nach der Beendigung der Durchführung einer Verarbeitungsroutine eines voreingestellten Ereignisses und Senden eines Ausführungsstoppsignals zu den anderen Kernen in einem Prozess des Stoppens der Ausführung, wobei das Ausführungsstoppsignal dafür verwendet wird, die anderen Kerne anzuweisen, die Ausführung zu stoppen, und das voreingestellte Ereignis eine Kernel-Moduscode-Verarbeitungsfunktion oder eine Benutzermoduscode-Verarbeitungsfunktion ist;
der Eingangsport ausgelegt ist zum: Empfangen einer ersten Stoppabbruchsanweisung und Weiterleiten der ersten Stoppabbruchsanweisung zum Kern A, wobei die erste Stoppabbruchsanweisung durch eine "Debugging"-Vorrichtung im Fern-"Debugging"-System gesendet wird, nachdem die "Debugging"-Vorrichtung bestimmt, dass der Kern A die Ausführung stoppt, und dass ein Grund dafür, dass der Kern A die Ausführung stoppt, ein Grund außer dem voreingestellten Ereignis ist; der Kern A ferner ausgelegt ist zum: nach dem Empfang einer ersten Stoppabbruchsanweisung und der Wiederaufnahme der Ausführung, Durchführen einer "Debugging"-Informationen-Sammelfunktion zum Sammeln von "Debugging"-Informationen des voreingestellten Ereignisses, und Stoppen der Ausführung nach Beendigung der Durchführung der "Debugging"-Informationen-Sammelfunktion;
der Eingangsport ferner ausgelegt ist zum: Empfangen einer zweiten Stoppabbruchsanweisung und Weiterleiten der zweiten Stoppabbruchsanweisung zum Kern A, wobei die zweite Stoppabbruchsanweisung durch die "Debugging"-Vorrichtung gesendet wird, nachdem die "Debugging"-Vorrichtung einen voreingestellten bevorstehenden Haltepunkt als ein Operationsobjekt des voreingestellten Ereignisses gemäß den "Debugging"-Informationen des voreingestellten Ereignisses einstellt; und
der Kern A ferner ausgelegt ist zum: Senden einer Ausführungswiederaufnahmeanweisung zu den anderen Kernen nach dem Empfang der zweiten Stoppabbruchsanweisung und der Wiederaufnahme der Ausführung, wobei die Ausführungswiederaufhahmeanweisung dafür verwendet wird, die anderen Kerne anzuweisen, die Ausführung wiederaufzunehmen, und "Knocking" des bevorstehenden Haltepunktes in einem Prozess der Ausführung des Operationsobjekts des voreingestellten Ereignisses, sodass in einen "Debugging"-Zustand eingetreten wird. - Mehrkernprozessor nach Anspruch 18, wobei
die "Debugging"-Informationen-Sammelfunktion eine "Debugging"-Schnittstellenfunktion umfasst, eine erste "Debugging"-Ausnahmeanweisung in einem Header der "Debugging"-Schnittstellenfunktion eingestellt ist und die erste "Debugging"-Ausnahmeanweisung dafür verwendet wird, den Kern A anzuweisen, die Ausführung zu stoppen; und
der Kern A spezifisch ausgelegt ist zum: nach der Beendigung der Durchführung der Verarbeitungsroutine des voreingestellten Ereignisses, Starten der Durchführung der ersten "Debugging"-Ausnahmeanweisung, die sich im Header der "Debugging"-Schnittstellenfunktion befindet, und Senden des Ausführungsstoppsignals zu den anderen Kernen in einem Prozess des Durchführens der ersten "Debugging"-Ausnahmeanweisung. - Mehrkernprozessor nach Anspruch 19, wobei
die "Debugging"-Informationen-Sammelfunktion ferner eine mit dem voreingestellten Ereignis assoziierte Funktion umfasst, eine zweite "Debugging"-Ausnahmeanweisung ferner in einem "Trailer" der "Debugging"-Schnittstellenfunktion eingestellt ist und die zweite "Debugging"-Ausnahmeanweisung dafür verwendet wird, den Kern A anzuweisen, die Ausführung zu stoppen; und
der Kern A spezifisch ausgelegt ist zum: Durchführen der mit dem voreingestellten Ereignis assoziierten Funktion, um die "Debugging"-Informationen des voreingestellten Ereignisses zu sammeln, und dann Durchführen der zweiten "Debugging"-Ausnahmeanweisung, die sich im "Trailer" der "Debugging"-Schnittstellenfunktion befindet. - Mehrkernprozessor nach Anspruch 20, wobei
sich die mit dem voreingestellten Ereignis assoziierte Funktion in einem Kernel-"Debugging-Stub" befindet und das Kernel-"Debugging-Stub" im Voraus in ein Betriebssystem der Zielmaschine implantiert wird. - Mehrkernprozessor nach einem der Ansprüche 18 bis 21, wobei der Mehrkernprozessor in ein System-auf-Chip bzw. SOC integriert ist;
der Kern A spezifisch ausgelegt ist zum Senden des Ausführungsstoppsignals zu den anderen Kernen unter Verwendung eines Hardware-"Cross-Trigger"-Netzwerks des SOC, wobei das Ausführungsstoppsignal dafür verwendet wird, die anderen Kerne anzuweisen, die Ausführung zu stoppen; und
der Kern A spezifisch ausgelegt ist zum Senden der Ausführungswiederaufnahmeanweisung zu den anderen Kernen unter Verwendung des Hardware-"Cross-Trigger"-Netzwerks des SOC, wobei die Ausführungswiederaufnahmeanweisung dafür verwendet wird, die anderen Kerne anzuweisen, die Ausführung wiederaufzunehmen. - "Debugging"-Vorrichtung, wobei die "Debugging"-Vorrichtung auf einer Host-Maschine in einem Fern-"Debugging"-System eingesetzt wird und die "Debugging"-Vorrichtung eine "Debugging"-Einheit und eine Empfangseinheit umfasst, wobei die Empfangseinheit ausgelegt ist zum: Empfangen einer Nachricht, die dafür verwendet wird, einen Kern A anzuweisen, die Ausführung zu stoppen, und Weiterleiten der Nachricht, die dafür verwendet wird, den Kern A anzuweisen, die Ausführung zu stoppen, zu der "Debugging"-Einheit, wobei eine Zielmaschine, die sich in dem Fern-"Debugging"-System befindet, einen Mehrkernprozessor umfasst und der Mehrkernprozessor den Kern A umfasst;
die "Debugging"-Einheit ausgelegt ist zum: nach der Bestimmung, dass ein Kern A die Ausführung stoppt, Bestimmen eines Grundes dafür, dass der Kern A die Ausführung stoppt;
falls der Grund dafür, dass der Kern A die Ausführung stoppt, ein voreingestelltes Ereignis ist, die "Debugging"-Einheit ferner ausgelegt ist zum: Erhalten von "Debugging"-Informationen des voreingestellten Ereignisses und Einstellen eines voreingestellten bevorstehenden Haltepunktes als ein Operationsobjekt des voreingestellten Ereignisses gemäß den "Debugging"-Informationen des voreingestellten Ereignisses, wobei das des voreingestellte Ereignis eine Kernel-Moduscode-Verarbeitungsfunktion oder eine Benutzermoduscode-Verarbeitungsfunktion ist und das Operationsobjekt des voreingestellten Ereignisses ein Kernel-Moduscode oder ein Benutzermoduscode ist; und
die "Debugging"-Einheit ferner ausgelegt ist zum Anweisen des Kerns A, die Ausführung wiederaufzunehmen, sodass der Kern A den bevorstehenden Haltepunkt in einem Prozess der Ausführung des Operationsobjekts des voreingestellten Ereignisses "knockt" und der Kern A in einen "Debugging"-Zustand eintritt. - Vorrichtung nach Anspruch 23, wobei
falls der Grund dafür, dass der Kern A die Ausführung stoppt, ein Grund außer dem voreingestellten Ereignis ist, die "Debugging"-Einheit ferner ausgelegt ist zum Anweisen des Kerns A, die Ausführung wiederaufzunehmen, um die "Debugging"-Informationen des voreingestellten Ereignisses zu sammeln. - Vorrichtung nach Anspruch 23 oder 24, wobei
die Funktion des Kernel-Moduscodes eine Kernel-Modulladefunktion ist; und
die Funktion des Benutzermoduscodes eine Prozesserzeugungsfunktion, eine Prozessschaltfünktion, eine Prozessblockierfunktion, eine Prozessaufweckfunktion, eine Thread-Erzeugungsfunktion, eine Thread-Schaltfünktion, eine Thread-Blockierfunktion oder eine Thread-Aufweckfunktion ist. - Vorrichtung nach Anspruch 25, wobei
falls das voreingestellte Ereignis die Kernel-Modulladefunktion, die Prozesserzeugungsfunktion oder die Thread-Erzeugungsfunktion ist, die "Debugging"-Informationen des voreingestellten Ereignisses eine Ladeadresse des Operationsobjekts des voreingestellten Ereignisses umfassen; und
die "Debugging"-Einheit spezifisch ausgelegt ist zum: Erhalten der Ladeadresse des Operationsobjekts des voreingestellten Ereignisses und Einstellen des bevorstehenden Haltepunktes als eine Zieladresse des Operationsobjekts des voreingestellten Ereignisses gemäß der Ladeadresse des Operationsobjekts des voreingestellten Ereignisses. - Vorrichtung nach Anspruch 25, wobei
falls das voreingestellte Ereignis die Prozessschaltfunktion, die Prozessblockierfunktion, die Prozessaufweckfunktion, die Thread-Schaltfunktion, die Thread-Blockierfunktion oder die Thread-Aufweckfünktion ist, die "Debugging"-Informationen des voreingestellten Ereignisses eine Kennung des Operationsobjekts des voreingestellten Ereignisses umfassen; und
die "Debugging"-Einheit spezifisch ausgelegt ist zum: Erhalten der Kennung des Operationsobjekts des voreingestellten Ereignisses, Bestimmen einer Ladeadresse des Operationsobjekt des voreingestellten Ereignisses gemäß der Kennung des Operationsobjekts des voreingestellten Ereignisses und Einstellen des bevorstehenden Haltepunktes als eine Zieladresse des Operationsobjekts des voreingestellten Ereignisses gemäß der Ladeadresse des Operationsobjekt des voreingestellten Ereignisses. - Vorrichtung nach Anspruch 27, wobei eine Korrespondenz zwischen der Kennung des Operationsobjekt des voreingestellten Ereignisses und der Ladeadresse des Operationsobjekt des voreingestellten Ereignisses in einem Speicherraum der Host-Maschine vorgespeichert wird; und
die "Debugging"-Einheit spezifisch ausgelegt ist zum Erhalten, aus dem Speicherraum der Host-Maschine, der Ladeadresse des Operationsobjekt des voreingestellten Ereignisses gemäß der Kennung des Operationsobjekt des voreingestellten Ereignisses und der Korrespondenz. - Vorrichtung nach einem der Ansprüche 23 bis 28, wobei die "Debugging"-Einheit einen Debugger und einen "Debugging"-Agenten umfasst;
der "Debugging"-Agent spezifisch ausgelegt ist zum: nach der Bestimmung, dass der Kern A die Ausführung stoppt, Bestimmen des Grundes dafür, dass der Kern A die Ausführung stoppt, und, falls der Grund dafür, dass der Kern A die Ausführung stoppt, das voreingestellte Ereignis ist, Melden einer zweiten Nachricht an den Debugger, wobei die zweite Nachricht eine Kennung, die das Stoppen der Ausführung durch den Kern A angibt, und eine Kennung des voreingestellten Ereignisses umfasst; und
der Debugger spezifisch ausgelegt ist zum: nach dem Empfang der zweiten Nachricht, Erhalten der "Debugging"-Informationen des voreingestellten Ereignisses gemäß der Kennung des voreingestellten Ereignisses und Einstellen des bevorstehenden Haltepunktes als das Operationsobjekt des voreingestellten Ereignisses gemäß den "Debugging"-Informationen des voreingestellten Ereignisses; und
der Debugger spezifisch ausgelegt ist zum Anweisen des "Debugging"-Agenten, eine zweite Stoppabbruchsanweisung zum Kern A zu senden, wobei die zweite Stoppabbruchsanweisung dafür verwendet wird, den Kern A anzuweisen, die Ausführung wiederaufzunehmen. - Vorrichtung nach Anspruch 29, wobei
der "Debugging"-Agent spezifisch ausgelegt ist zum: nach der Bestimmung, dass der Kern A die Ausführung stoppt, Bestimmen des Grundes dafür, dass der Kern A die Ausführung stoppt, und, falls der Grund dafür, der Kern A die Ausführung stoppt, ein Grund außer dem voreingestellten Ereignis ist, Senden einer ersten Stoppabbruchsanweisung zum Kern A, wobei die erste Stoppabbruchsanweisung dafür verwendet wird, den Kern A anzuweisen, die Ausführung wiederaufzunehmen, um die "Debugging"-Informationen des voreingestellten Ereignisses zu sammeln. - Vorrichtung nach einem der Ansprüche 23 bis 29, wobei die "Debugging"-Vorrichtung ferner den Debugger und den "Debugging"-Agenten umfasst;
der "Debugging"-Agent spezifisch ausgelegt ist zum: nach der Bestimmung, dass der Kern A die Ausführung stoppt, Bestimmen des Grundes dafür, dass der Kern A die Ausführung stoppt, und, falls der Grund dafür, dass der Kern A die Ausführung stoppt, ein Grund außer dem voreingestellten Ereignis ist, Melden einer ersten Nachricht zum Debugger, wobei die erste Nachricht die Kennung, die das Stoppen der Ausführung durch den Kern A angibt, und eine Standardkennung umfasst; und
der Debugger spezifisch ausgelegt ist zum: nach dem Empfang der ersten Nachricht, Anweisen des "Debugging"-Agenten, eine erste Stoppabbruchsanweisung zum Kern A zu senden, wobei die erste Stoppabbruchsanweisung dafür verwendet wird, den Kern A anzuweisen, die Ausführung wiederaufzunehmen, um die "Debugging"-Informationen des voreingestellten Ereignisses zu sammeln.
Applications Claiming Priority (2)
| Application Number | Priority Date | Filing Date | Title |
|---|---|---|---|
| CN201510623830.4A CN105224454B (zh) | 2015-09-25 | 2015-09-25 | 一种调试方法、多核处理器和调试设备 |
| PCT/CN2016/099996 WO2017050287A1 (zh) | 2015-09-25 | 2016-09-24 | 一种调试方法、多核处理器和调试设备 |
Publications (3)
| Publication Number | Publication Date |
|---|---|
| EP3352083A1 EP3352083A1 (de) | 2018-07-25 |
| EP3352083A4 EP3352083A4 (de) | 2018-09-05 |
| EP3352083B1 true EP3352083B1 (de) | 2019-11-06 |
Family
ID=54993439
Family Applications (1)
| Application Number | Title | Priority Date | Filing Date |
|---|---|---|---|
| EP16848168.7A Active EP3352083B1 (de) | 2015-09-25 | 2016-09-24 | Fehlerbeseitigungsverfahren, mehrkernprozessor und fehlerbeseitigungsausrüstung |
Country Status (6)
| Country | Link |
|---|---|
| US (1) | US10503629B2 (de) |
| EP (1) | EP3352083B1 (de) |
| KR (1) | KR102119585B1 (de) |
| CN (1) | CN105224454B (de) |
| BR (1) | BR112018005588B1 (de) |
| WO (1) | WO2017050287A1 (de) |
Families Citing this family (23)
| Publication number | Priority date | Publication date | Assignee | Title |
|---|---|---|---|---|
| CN105224454B (zh) | 2015-09-25 | 2018-06-05 | 华为技术有限公司 | 一种调试方法、多核处理器和调试设备 |
| CN105354136B (zh) | 2015-09-25 | 2018-06-15 | 华为技术有限公司 | 一种调试方法、多核处理器和调试设备 |
| US10025741B2 (en) * | 2016-01-13 | 2018-07-17 | Samsung Electronics Co., Ltd. | System-on-chip, mobile terminal, and method for operating the system-on-chip |
| CN107015847A (zh) * | 2016-01-28 | 2017-08-04 | 扬智科技股份有限公司 | 电子装置及其工作模式切换方法 |
| CN105740119A (zh) * | 2016-01-29 | 2016-07-06 | 华为技术有限公司 | 一种芯片及芯片内多核的调试方法 |
| US10169133B2 (en) * | 2016-04-26 | 2019-01-01 | Juniper Networks, Inc. | Method, system, and apparatus for debugging networking malfunctions within network nodes |
| CN106201896A (zh) * | 2016-07-26 | 2016-12-07 | 华中科技大学 | 一种嵌入式环境下基于检查点的调试方法、系统及装置 |
| CN106775732B (zh) * | 2016-12-23 | 2019-02-12 | 优刻得科技股份有限公司 | 一种热补丁加载方法以及装置 |
| US10579499B2 (en) | 2017-04-04 | 2020-03-03 | International Business Machines Corporation | Task latency debugging in symmetric multiprocessing computer systems |
| US10606679B2 (en) * | 2017-12-04 | 2020-03-31 | Arm Limited | Debug apparatus and method |
| KR102518370B1 (ko) * | 2018-01-19 | 2023-04-05 | 삼성전자주식회사 | 저장 장치 및 이의 디버깅 시스템 |
| JP6981920B2 (ja) * | 2018-05-25 | 2021-12-17 | ルネサスエレクトロニクス株式会社 | 半導体装置、およびデバッグ方法 |
| CN109726135B (zh) * | 2019-01-25 | 2022-06-14 | 嘉楠明芯(北京)科技有限公司 | 一种多核调试方法、装置及计算机可读存储介质 |
| WO2020186518A1 (en) | 2019-03-21 | 2020-09-24 | Hangzhou Fabu Technology Co. Ltd | Method and apparatus for debugging, and system on chip |
| CN110300037A (zh) * | 2019-08-06 | 2019-10-01 | 郭金海 | 一种网络设备调试台及调试系统 |
| CN111708662B (zh) * | 2020-05-26 | 2023-09-29 | 新华三技术有限公司 | 调试方法及装置 |
| CN111639312B (zh) * | 2020-06-02 | 2023-04-14 | 腾讯科技(成都)有限公司 | 反调试方法、装置、存储介质及电子装置 |
| CN113051088B (zh) * | 2021-03-31 | 2022-03-08 | 广州锦行网络科技有限公司 | 程序加载方法、装置、设备及计算机可读介质 |
| CN113342554B (zh) * | 2021-08-02 | 2022-01-04 | 阿里云计算有限公司 | Io多路复用方法、介质、设备和操作系统 |
| CN114035855B (zh) * | 2021-09-30 | 2023-10-27 | 鸣芯信息科技(上海)有限公司 | 固件的调试方法、装置、终端及存储介质 |
| KR20230059128A (ko) | 2021-10-25 | 2023-05-03 | 한국전자통신연구원 | 코드 실행에 기반한 매니코어 병렬 프로세서의 프로그램 디버깅 방법 및 이를 위한 장치 |
| CN114355802B (zh) * | 2021-12-15 | 2024-09-13 | 中国航空工业集团公司成都飞机设计研究所 | 一种多核并起的处理器同步调试方法 |
| CN117785591B (zh) * | 2024-02-27 | 2024-04-26 | 北京壁仞科技开发有限公司 | 用于计算设备的计算内核的调试方法、计算设备、计算机可读存储介质和计算机程序产品 |
Family Cites Families (37)
| Publication number | Priority date | Publication date | Assignee | Title |
|---|---|---|---|---|
| US6886110B2 (en) | 2000-11-21 | 2005-04-26 | Wind River Systems, Inc. | Multiple device scan chain emulation/debugging |
| US20040098639A1 (en) | 2002-11-14 | 2004-05-20 | Liu Bao Gang | Debugging kernel-loadable modules and suspending and replacing functions in non-microkernel operating systems |
| US20050216895A1 (en) * | 2004-03-23 | 2005-09-29 | Tran Hieu T | Method and apparatus for remote debugging of kernel and application software |
| CN1282085C (zh) | 2004-04-09 | 2006-10-25 | 中兴通讯股份有限公司 | 一种嵌入式系统多任务并发调试的方法 |
| US7941585B2 (en) * | 2004-09-10 | 2011-05-10 | Cavium Networks, Inc. | Local scratchpad and data caching system |
| CN100359486C (zh) * | 2004-11-24 | 2008-01-02 | 中兴通讯股份有限公司 | 一种调试操作系统内核态程序的方法及装置 |
| US7581087B2 (en) * | 2006-01-17 | 2009-08-25 | Qualcomm Incorporated | Method and apparatus for debugging a multicore system |
| KR20070109432A (ko) * | 2006-05-11 | 2007-11-15 | 삼성전자주식회사 | 커널 인지 디버깅 장치 및 방법 |
| US7755154B2 (en) * | 2006-08-01 | 2010-07-13 | Dongbu Hitek Co., Ltd. | Image sensor |
| US20100174892A1 (en) | 2006-08-21 | 2010-07-08 | Nxp, B.V. | Multiprocessor system and method for synchronizing a debugging process of a multiprocessor system |
| EP2003534A3 (de) * | 2007-06-11 | 2009-02-18 | MediaTek Inc. | Verfahren und Vorrichtung zur Verringerung des Stromverbrauchs in einer integrierten Schaltung |
| JP2008310727A (ja) * | 2007-06-18 | 2008-12-25 | Toshiba Corp | シミュレーション装置及びシミュレーション方法 |
| CN101398780B (zh) | 2007-09-27 | 2011-08-24 | 国际商业机器公司 | 可基于进程定制调试器的即时调试的方法和系统 |
| CN101685420B (zh) | 2008-09-24 | 2013-06-12 | 中兴通讯股份有限公司 | 多线程调试方法和装置 |
| CN101504626B (zh) | 2009-03-06 | 2012-06-06 | 中兴通讯股份有限公司 | 一种调试控制实现方法及系统 |
| CN101515251A (zh) | 2009-03-31 | 2009-08-26 | 华为技术有限公司 | 板级平台调试方法、装置和系统 |
| CN101540706B (zh) | 2009-04-23 | 2011-12-28 | 中兴通讯股份有限公司 | 一种实现远程调试的方法及系统 |
| US8832666B2 (en) * | 2009-12-21 | 2014-09-09 | International Business Machines Corporation | Dynamic instrumentation |
| US8495344B2 (en) * | 2010-01-22 | 2013-07-23 | Via Technologies, Inc. | Simultaneous execution resumption of multiple processor cores after core state information dump to facilitate debugging via multi-core processor simulator using the state information |
| US8533418B2 (en) | 2010-06-30 | 2013-09-10 | International Business Machines Corporation | Memory allocation with identification of requesting loadable kernel module |
| CN102346708B (zh) * | 2010-08-03 | 2014-07-16 | 中兴通讯股份有限公司 | 一种调试器及其调试方法 |
| US8635476B2 (en) * | 2010-12-22 | 2014-01-21 | Via Technologies, Inc. | Decentralized power management distributed among multiple processor cores |
| CN102073565B (zh) * | 2010-12-31 | 2014-02-19 | 华为技术有限公司 | 触发操作方法、多核分组调试方法、装置及系统 |
| US20130031419A1 (en) * | 2011-07-28 | 2013-01-31 | International Business Machines Corporation | Collecting Debug Data in a Secure Chip Implementation |
| CN102521087B (zh) | 2011-11-02 | 2014-11-19 | 烽火通信科技股份有限公司 | 一种远程获取内核模块实时分级调试信息的方法 |
| US9703950B2 (en) | 2012-03-30 | 2017-07-11 | Irdeto B.V. | Method and system for preventing and detecting security threats |
| US9304880B2 (en) | 2013-03-15 | 2016-04-05 | Freescale Semiconductor, Inc. | System and method for multicore processing |
| CN105074671B (zh) | 2013-03-27 | 2018-04-20 | 英特尔公司 | 用于在内核模块和设备驱动程序中检测并发编程错误的方法和系统 |
| EP2962205B1 (de) * | 2013-04-09 | 2018-06-20 | Siemens Aktiengesellschaft | Mehrkern-prozessorsystem mit fehleranalysefunktion |
| CN103226504B (zh) | 2013-04-19 | 2016-05-11 | 中国科学院自动化研究所 | 一种分布式片上调试系统 |
| US9600397B2 (en) | 2013-08-29 | 2017-03-21 | Stmicroelectronics (Grenoble 2) Sas | Dynamic debugging method of a software module and corresponding device |
| CN103729288B (zh) * | 2013-11-01 | 2016-02-24 | 华中科技大学 | 一种嵌入式多核环境下应用程序的调试方法 |
| CN104750603B (zh) | 2013-12-30 | 2018-12-11 | 辰芯科技有限公司 | 一种多核dsp软件仿真器及其物理层软件测试方法 |
| US10102050B2 (en) * | 2015-02-05 | 2018-10-16 | Microchip Technology Incorporated | System and method for generating cross-core breakpoints in a multi-core microcontroller |
| US9626265B2 (en) * | 2015-06-29 | 2017-04-18 | International Business Machines Corporation | Efficiency of cycle-reproducible debug processes in a multi-core environment |
| US20170062075A1 (en) * | 2015-08-31 | 2017-03-02 | Sandisk Technologies Inc. | Apparatus including core and clock gating circuit and method of operating same |
| CN105224454B (zh) * | 2015-09-25 | 2018-06-05 | 华为技术有限公司 | 一种调试方法、多核处理器和调试设备 |
-
2015
- 2015-09-25 CN CN201510623830.4A patent/CN105224454B/zh active Active
-
2016
- 2016-09-24 EP EP16848168.7A patent/EP3352083B1/de active Active
- 2016-09-24 WO PCT/CN2016/099996 patent/WO2017050287A1/zh not_active Ceased
- 2016-09-24 BR BR112018005588-3A patent/BR112018005588B1/pt not_active IP Right Cessation
- 2016-09-24 KR KR1020187010961A patent/KR102119585B1/ko not_active Expired - Fee Related
-
2018
- 2018-03-26 US US15/936,030 patent/US10503629B2/en active Active
Non-Patent Citations (1)
| Title |
|---|
| None * |
Also Published As
| Publication number | Publication date |
|---|---|
| BR112018005588B1 (pt) | 2023-12-26 |
| BR112018005588A2 (pt) | 2018-10-09 |
| EP3352083A1 (de) | 2018-07-25 |
| CN105224454A (zh) | 2016-01-06 |
| KR20180054773A (ko) | 2018-05-24 |
| US20180217915A1 (en) | 2018-08-02 |
| EP3352083A4 (de) | 2018-09-05 |
| US10503629B2 (en) | 2019-12-10 |
| CN105224454B (zh) | 2018-06-05 |
| KR102119585B1 (ko) | 2020-06-05 |
| WO2017050287A1 (zh) | 2017-03-30 |
Similar Documents
| Publication | Publication Date | Title |
|---|---|---|
| EP3352083B1 (de) | Fehlerbeseitigungsverfahren, mehrkernprozessor und fehlerbeseitigungsausrüstung | |
| US10409709B2 (en) | Debugging method, multi-core processor and debugging device | |
| CN102722431B (zh) | 进程监控方法及装置 | |
| US7971104B2 (en) | Apparatus and methods for stabilization of processors, operating systems and other hardware and/or software configurations | |
| CN103109276B (zh) | 系统测试方法 | |
| WO2018040494A1 (zh) | 一种扩展处理器指令集的方法及装置 | |
| US11409636B2 (en) | Processor including debug unit and debug system | |
| US11868799B2 (en) | Command information transmission method, system, and apparatus, and readable storage medium | |
| US20160299859A1 (en) | Apparatus and method for external access to core resources of a processor, semiconductor systems development tool comprising the apparatus, and computer program product and non-transitory computer-readable storage medium associated with the method | |
| CN109144873B (zh) | 一种linux内核处理方法及装置 | |
| US20250165348A1 (en) | Processor, method for obtaining information, board, and network device | |
| CN103186447B (zh) | 一种总线读写检测装置 | |
| WO2024139423A1 (zh) | 故障检测方法及计算机设备 | |
| CN107179982A (zh) | 一种跨进程调试方法和装置 | |
| CN113742113B (zh) | 一种嵌入式系统健康管理方法、设备及储存介质 | |
| US20260010363A1 (en) | Non-inductive upgrade method for interrupt processing program, and computer system | |
| CN118916202A (zh) | 一种针对程序跑飞的数据处理方法、装置、设备和介质 | |
| CN110908869A (zh) | 一种应用程序数据监控方法、装置、设备及储存介质 | |
| CN117851303A (zh) | 一种多线程dma的高速数据传输方法及系统 | |
| CN104572332A (zh) | 处理系统崩溃的方法和装置 | |
| CN106598755B (zh) | 一种处理器及dcc通信系统 | |
| RU2830957C1 (ru) | Способ отладки многоядерных многопроцессных вычислительных систем с механизмом контроля режима реального времени | |
| CN115981880B (zh) | 避免主机访问从机出现死锁的方法、装置、系统、存储介质及芯片 | |
| CN119003225B (zh) | 一种故障定位方法及设备、存储介质和计算机程序产品 | |
| JP2011180840A (ja) | プロセッサ、マルチプロセッサシステム、及びメモリアクセス不正検出方法 |
Legal Events
| Date | Code | Title | Description |
|---|---|---|---|
| STAA | Information on the status of an ep patent application or granted ep patent |
Free format text: STATUS: THE INTERNATIONAL PUBLICATION HAS BEEN MADE |
|
| PUAI | Public reference made under article 153(3) epc to a published international application that has entered the european phase |
Free format text: ORIGINAL CODE: 0009012 |
|
| STAA | Information on the status of an ep patent application or granted ep patent |
Free format text: STATUS: REQUEST FOR EXAMINATION WAS MADE |
|
| 17P | Request for examination filed |
Effective date: 20180417 |
|
| AK | Designated contracting states |
Kind code of ref document: A1 Designated state(s): AL AT BE BG CH CY CZ DE DK EE ES FI FR GB GR HR HU IE IS IT LI LT LU LV MC MK MT NL NO PL PT RO RS SE SI SK SM TR |
|
| AX | Request for extension of the european patent |
Extension state: BA ME |
|
| A4 | Supplementary search report drawn up and despatched |
Effective date: 20180806 |
|
| RIC1 | Information provided on ipc code assigned before grant |
Ipc: G06F 11/36 20060101AFI20180731BHEP |
|
| DAV | Request for validation of the european patent (deleted) | ||
| DAX | Request for extension of the european patent (deleted) | ||
| GRAP | Despatch of communication of intention to grant a patent |
Free format text: ORIGINAL CODE: EPIDOSNIGR1 |
|
| STAA | Information on the status of an ep patent application or granted ep patent |
Free format text: STATUS: GRANT OF PATENT IS INTENDED |
|
| RIC1 | Information provided on ipc code assigned before grant |
Ipc: G06F 9/48 20060101ALI20190415BHEP Ipc: G06F 9/445 20180101ALI20190415BHEP Ipc: G06F 11/36 20060101AFI20190415BHEP |
|
| INTG | Intention to grant announced |
Effective date: 20190508 |
|
| GRAS | Grant fee paid |
Free format text: ORIGINAL CODE: EPIDOSNIGR3 |
|
| GRAA | (expected) grant |
Free format text: ORIGINAL CODE: 0009210 |
|
| STAA | Information on the status of an ep patent application or granted ep patent |
Free format text: STATUS: THE PATENT HAS BEEN GRANTED |
|
| AK | Designated contracting states |
Kind code of ref document: B1 Designated state(s): AL AT BE BG CH CY CZ DE DK EE ES FI FR GB GR HR HU IE IS IT LI LT LU LV MC MK MT NL NO PL PT RO RS SE SI SK SM TR |
|
| REG | Reference to a national code |
Ref country code: GB Ref legal event code: FG4D |
|
| REG | Reference to a national code |
Ref country code: CH Ref legal event code: EP Ref country code: AT Ref legal event code: REF Ref document number: 1199725 Country of ref document: AT Kind code of ref document: T Effective date: 20191115 |
|
| REG | Reference to a national code |
Ref country code: IE Ref legal event code: FG4D |
|
| REG | Reference to a national code |
Ref country code: DE Ref legal event code: R096 Ref document number: 602016024055 Country of ref document: DE |
|
| REG | Reference to a national code |
Ref country code: NL Ref legal event code: MP Effective date: 20191106 |
|
| REG | Reference to a national code |
Ref country code: LT Ref legal event code: MG4D |
|
| PG25 | Lapsed in a contracting state [announced via postgrant information from national office to epo] |
Ref country code: NL Free format text: LAPSE BECAUSE OF FAILURE TO SUBMIT A TRANSLATION OF THE DESCRIPTION OR TO PAY THE FEE WITHIN THE PRESCRIBED TIME-LIMIT Effective date: 20191106 Ref country code: PL Free format text: LAPSE BECAUSE OF FAILURE TO SUBMIT A TRANSLATION OF THE DESCRIPTION OR TO PAY THE FEE WITHIN THE PRESCRIBED TIME-LIMIT Effective date: 20191106 Ref country code: LT Free format text: LAPSE BECAUSE OF FAILURE TO SUBMIT A TRANSLATION OF THE DESCRIPTION OR TO PAY THE FEE WITHIN THE PRESCRIBED TIME-LIMIT Effective date: 20191106 Ref country code: FI Free format text: LAPSE BECAUSE OF FAILURE TO SUBMIT A TRANSLATION OF THE DESCRIPTION OR TO PAY THE FEE WITHIN THE PRESCRIBED TIME-LIMIT Effective date: 20191106 Ref country code: BG Free format text: LAPSE BECAUSE OF FAILURE TO SUBMIT A TRANSLATION OF THE DESCRIPTION OR TO PAY THE FEE WITHIN THE PRESCRIBED TIME-LIMIT Effective date: 20200206 Ref country code: GR Free format text: LAPSE BECAUSE OF FAILURE TO SUBMIT A TRANSLATION OF THE DESCRIPTION OR TO PAY THE FEE WITHIN THE PRESCRIBED TIME-LIMIT Effective date: 20200207 Ref country code: LV Free format text: LAPSE BECAUSE OF FAILURE TO SUBMIT A TRANSLATION OF THE DESCRIPTION OR TO PAY THE FEE WITHIN THE PRESCRIBED TIME-LIMIT Effective date: 20191106 Ref country code: PT Free format text: LAPSE BECAUSE OF FAILURE TO SUBMIT A TRANSLATION OF THE DESCRIPTION OR TO PAY THE FEE WITHIN THE PRESCRIBED TIME-LIMIT Effective date: 20200306 Ref country code: SE Free format text: LAPSE BECAUSE OF FAILURE TO SUBMIT A TRANSLATION OF THE DESCRIPTION OR TO PAY THE FEE WITHIN THE PRESCRIBED TIME-LIMIT Effective date: 20191106 Ref country code: NO Free format text: LAPSE BECAUSE OF FAILURE TO SUBMIT A TRANSLATION OF THE DESCRIPTION OR TO PAY THE FEE WITHIN THE PRESCRIBED TIME-LIMIT Effective date: 20200206 |
|
| PG25 | Lapsed in a contracting state [announced via postgrant information from national office to epo] |
Ref country code: HR Free format text: LAPSE BECAUSE OF FAILURE TO SUBMIT A TRANSLATION OF THE DESCRIPTION OR TO PAY THE FEE WITHIN THE PRESCRIBED TIME-LIMIT Effective date: 20191106 Ref country code: IS Free format text: LAPSE BECAUSE OF FAILURE TO SUBMIT A TRANSLATION OF THE DESCRIPTION OR TO PAY THE FEE WITHIN THE PRESCRIBED TIME-LIMIT Effective date: 20200306 Ref country code: RS Free format text: LAPSE BECAUSE OF FAILURE TO SUBMIT A TRANSLATION OF THE DESCRIPTION OR TO PAY THE FEE WITHIN THE PRESCRIBED TIME-LIMIT Effective date: 20191106 |
|
| PG25 | Lapsed in a contracting state [announced via postgrant information from national office to epo] |
Ref country code: AL Free format text: LAPSE BECAUSE OF FAILURE TO SUBMIT A TRANSLATION OF THE DESCRIPTION OR TO PAY THE FEE WITHIN THE PRESCRIBED TIME-LIMIT Effective date: 20191106 |
|
| PG25 | Lapsed in a contracting state [announced via postgrant information from national office to epo] |
Ref country code: CZ Free format text: LAPSE BECAUSE OF FAILURE TO SUBMIT A TRANSLATION OF THE DESCRIPTION OR TO PAY THE FEE WITHIN THE PRESCRIBED TIME-LIMIT Effective date: 20191106 Ref country code: RO Free format text: LAPSE BECAUSE OF FAILURE TO SUBMIT A TRANSLATION OF THE DESCRIPTION OR TO PAY THE FEE WITHIN THE PRESCRIBED TIME-LIMIT Effective date: 20191106 Ref country code: ES Free format text: LAPSE BECAUSE OF FAILURE TO SUBMIT A TRANSLATION OF THE DESCRIPTION OR TO PAY THE FEE WITHIN THE PRESCRIBED TIME-LIMIT Effective date: 20191106 Ref country code: EE Free format text: LAPSE BECAUSE OF FAILURE TO SUBMIT A TRANSLATION OF THE DESCRIPTION OR TO PAY THE FEE WITHIN THE PRESCRIBED TIME-LIMIT Effective date: 20191106 Ref country code: DK Free format text: LAPSE BECAUSE OF FAILURE TO SUBMIT A TRANSLATION OF THE DESCRIPTION OR TO PAY THE FEE WITHIN THE PRESCRIBED TIME-LIMIT Effective date: 20191106 |
|
| REG | Reference to a national code |
Ref country code: DE Ref legal event code: R097 Ref document number: 602016024055 Country of ref document: DE |
|
| REG | Reference to a national code |
Ref country code: AT Ref legal event code: MK05 Ref document number: 1199725 Country of ref document: AT Kind code of ref document: T Effective date: 20191106 |
|
| PG25 | Lapsed in a contracting state [announced via postgrant information from national office to epo] |
Ref country code: SK Free format text: LAPSE BECAUSE OF FAILURE TO SUBMIT A TRANSLATION OF THE DESCRIPTION OR TO PAY THE FEE WITHIN THE PRESCRIBED TIME-LIMIT Effective date: 20191106 Ref country code: SM Free format text: LAPSE BECAUSE OF FAILURE TO SUBMIT A TRANSLATION OF THE DESCRIPTION OR TO PAY THE FEE WITHIN THE PRESCRIBED TIME-LIMIT Effective date: 20191106 |
|
| PLBE | No opposition filed within time limit |
Free format text: ORIGINAL CODE: 0009261 |
|
| STAA | Information on the status of an ep patent application or granted ep patent |
Free format text: STATUS: NO OPPOSITION FILED WITHIN TIME LIMIT |
|
| 26N | No opposition filed |
Effective date: 20200807 |
|
| PG25 | Lapsed in a contracting state [announced via postgrant information from national office to epo] |
Ref country code: AT Free format text: LAPSE BECAUSE OF FAILURE TO SUBMIT A TRANSLATION OF THE DESCRIPTION OR TO PAY THE FEE WITHIN THE PRESCRIBED TIME-LIMIT Effective date: 20191106 Ref country code: SI Free format text: LAPSE BECAUSE OF FAILURE TO SUBMIT A TRANSLATION OF THE DESCRIPTION OR TO PAY THE FEE WITHIN THE PRESCRIBED TIME-LIMIT Effective date: 20191106 |
|
| PG25 | Lapsed in a contracting state [announced via postgrant information from national office to epo] |
Ref country code: IT Free format text: LAPSE BECAUSE OF FAILURE TO SUBMIT A TRANSLATION OF THE DESCRIPTION OR TO PAY THE FEE WITHIN THE PRESCRIBED TIME-LIMIT Effective date: 20191106 |
|
| REG | Reference to a national code |
Ref country code: CH Ref legal event code: PL |
|
| REG | Reference to a national code |
Ref country code: BE Ref legal event code: MM Effective date: 20200930 |
|
| PG25 | Lapsed in a contracting state [announced via postgrant information from national office to epo] |
Ref country code: LU Free format text: LAPSE BECAUSE OF NON-PAYMENT OF DUE FEES Effective date: 20200924 |
|
| PG25 | Lapsed in a contracting state [announced via postgrant information from national office to epo] |
Ref country code: LI Free format text: LAPSE BECAUSE OF NON-PAYMENT OF DUE FEES Effective date: 20200930 Ref country code: IE Free format text: LAPSE BECAUSE OF NON-PAYMENT OF DUE FEES Effective date: 20200924 Ref country code: BE Free format text: LAPSE BECAUSE OF NON-PAYMENT OF DUE FEES Effective date: 20200930 Ref country code: CH Free format text: LAPSE BECAUSE OF NON-PAYMENT OF DUE FEES Effective date: 20200930 |
|
| PG25 | Lapsed in a contracting state [announced via postgrant information from national office to epo] |
Ref country code: TR Free format text: LAPSE BECAUSE OF FAILURE TO SUBMIT A TRANSLATION OF THE DESCRIPTION OR TO PAY THE FEE WITHIN THE PRESCRIBED TIME-LIMIT Effective date: 20191106 Ref country code: MT Free format text: LAPSE BECAUSE OF FAILURE TO SUBMIT A TRANSLATION OF THE DESCRIPTION OR TO PAY THE FEE WITHIN THE PRESCRIBED TIME-LIMIT Effective date: 20191106 Ref country code: CY Free format text: LAPSE BECAUSE OF FAILURE TO SUBMIT A TRANSLATION OF THE DESCRIPTION OR TO PAY THE FEE WITHIN THE PRESCRIBED TIME-LIMIT Effective date: 20191106 |
|
| PG25 | Lapsed in a contracting state [announced via postgrant information from national office to epo] |
Ref country code: MK Free format text: LAPSE BECAUSE OF FAILURE TO SUBMIT A TRANSLATION OF THE DESCRIPTION OR TO PAY THE FEE WITHIN THE PRESCRIBED TIME-LIMIT Effective date: 20191106 Ref country code: MC Free format text: LAPSE BECAUSE OF FAILURE TO SUBMIT A TRANSLATION OF THE DESCRIPTION OR TO PAY THE FEE WITHIN THE PRESCRIBED TIME-LIMIT Effective date: 20191106 |
|
| P01 | Opt-out of the competence of the unified patent court (upc) registered |
Effective date: 20230524 |
|
| PGFP | Annual fee paid to national office [announced via postgrant information from national office to epo] |
Ref country code: DE Payment date: 20250730 Year of fee payment: 10 |
|
| PGFP | Annual fee paid to national office [announced via postgrant information from national office to epo] |
Ref country code: GB Payment date: 20250731 Year of fee payment: 10 |
|
| PGFP | Annual fee paid to national office [announced via postgrant information from national office to epo] |
Ref country code: FR Payment date: 20250808 Year of fee payment: 10 |