EP3336527A1 - X-ray fluorescence spectrometer - Google Patents
X-ray fluorescence spectrometer Download PDFInfo
- Publication number
- EP3336527A1 EP3336527A1 EP16834897.7A EP16834897A EP3336527A1 EP 3336527 A1 EP3336527 A1 EP 3336527A1 EP 16834897 A EP16834897 A EP 16834897A EP 3336527 A1 EP3336527 A1 EP 3336527A1
- Authority
- EP
- European Patent Office
- Prior art keywords
- thickness
- composition
- measurement
- intensities
- thin film
- Prior art date
- Legal status (The legal status is an assumption and is not a legal conclusion. Google has not performed a legal analysis and makes no representation as to the accuracy of the status listed.)
- Granted
Links
Images


Classifications
-
- G—PHYSICS
- G01—MEASURING; TESTING
- G01N—INVESTIGATING OR ANALYSING MATERIALS BY DETERMINING THEIR CHEMICAL OR PHYSICAL PROPERTIES
- G01N23/00—Investigating or analysing materials by the use of wave or particle radiation, e.g. X-rays or neutrons, not covered by groups G01N3/00 – G01N17/00, G01N21/00 or G01N22/00
- G01N23/22—Investigating or analysing materials by the use of wave or particle radiation, e.g. X-rays or neutrons, not covered by groups G01N3/00 – G01N17/00, G01N21/00 or G01N22/00 by measuring secondary emission from the material
- G01N23/223—Investigating or analysing materials by the use of wave or particle radiation, e.g. X-rays or neutrons, not covered by groups G01N3/00 – G01N17/00, G01N21/00 or G01N22/00 by measuring secondary emission from the material by irradiating the sample with X-rays or gamma-rays and by measuring X-ray fluorescence
-
- G—PHYSICS
- G01—MEASURING; TESTING
- G01N—INVESTIGATING OR ANALYSING MATERIALS BY DETERMINING THEIR CHEMICAL OR PHYSICAL PROPERTIES
- G01N23/00—Investigating or analysing materials by the use of wave or particle radiation, e.g. X-rays or neutrons, not covered by groups G01N3/00 – G01N17/00, G01N21/00 or G01N22/00
- G01N23/20—Investigating or analysing materials by the use of wave or particle radiation, e.g. X-rays or neutrons, not covered by groups G01N3/00 – G01N17/00, G01N21/00 or G01N22/00 by using diffraction of the radiation by the materials, e.g. for investigating crystal structure; by using scattering of the radiation by the materials, e.g. for investigating non-crystalline materials; by using reflection of the radiation by the materials
- G01N23/207—Diffractometry using detectors, e.g. using a probe in a central position and one or more displaceable detectors in circumferential positions
-
- G—PHYSICS
- G01—MEASURING; TESTING
- G01N—INVESTIGATING OR ANALYSING MATERIALS BY DETERMINING THEIR CHEMICAL OR PHYSICAL PROPERTIES
- G01N2223/00—Investigating materials by wave or particle radiation
- G01N2223/07—Investigating materials by wave or particle radiation secondary emission
- G01N2223/076—X-ray fluorescence
-
- G—PHYSICS
- G01—MEASURING; TESTING
- G01N—INVESTIGATING OR ANALYSING MATERIALS BY DETERMINING THEIR CHEMICAL OR PHYSICAL PROPERTIES
- G01N2223/00—Investigating materials by wave or particle radiation
- G01N2223/07—Investigating materials by wave or particle radiation secondary emission
- G01N2223/076—X-ray fluorescence
- G01N2223/0766—X-ray fluorescence with indicator, tags
Definitions
- the present invention relates to an X-ray fluorescence spectrometer which irradiates, with primary X-rays, a sample having a single-layer or multi-layer thin film formed independently or on a substrate and which obtains quantitative values of a composition and/or a thickness of the thin film by a fundamental parameter method on the basis of measured intensities of generated secondary X-rays.
- secondary X-rays to be measured that is, measurement lines are appropriately selected and set depending on the type of a sample to be analyzed.
- selecting the measurement lines is not easy because both a composition and a thickness of the thin film are analyzed, or the same elements are contained in different layers or a substrate, in some cases. When selection is inappropriate, accurate analysis cannot be performed.
- a measurement line evaluation unit calculates, for each specified measurement line, a first theoretical intensity for a thickness and a composition specified for each layer of a thin film, and a second theoretical intensity for a thickness and a composition after change of the thickness or the content ratio by a predetermined amount; calculates a predetermined thickness accuracy or content ratio accuracy by using the first and second theoretical intensities; and determines possibility of analysis using the specified measurement lines on the basis of the thickness accuracy or the content ratio accuracy, and the possibility of analysis is displayed on a display.
- an operator can easily select the measurement lines on the basis of the displayed possibility.
- Patent Document 1 JP Laid-open Patent Publication No. 2001-356103
- the first theoretical intensity for the thickness and the composition specified for the plated layer, the second theoretical intensity obtained by changing only the thickness by a predetermined amount, and the second theoretical intensity obtained by changing only the content ratio by a predetermined amount are calculated for each of specified measurement lines; predetermined thickness accuracy and content ratio accuracy are calculated using these theoretical intensities; and the possibility of analysis using the specified measurement lines is determined on the basis of the thickness accuracy and the content ratio accuracy.
- change in quantitative value of each of the thickness and the composition does not correspond to intensity change of a single measurement line, but the intensity of each measurement line greatly depends on both the thickness and the composition of the plated layer.
- the present invention has been made in view of the above conventional problems, and an object of thereof is to provide a spectrometer that facilitates selection of appropriate measurement lines and enables accurate analysis, even in the case where both the composition and the thickness of each layer of a thin film are analyzed and the same elements are contained in different layers, in X-ray fluorescence analysis of the thin film sample.
- a first aspect of the present invention is an X-ray fluorescence spectrometer which irradiates, with primary X-rays, a sample having a single-layer or multi-layer thin film formed independently or on a substrate, and obtains quantitative values of a composition and/or a thickness of the thin film by a fundamental parameter method on the basis of measured intensities of generated secondary X-rays.
- the spectrometer includes a measurement line evaluation unit configured to estimate a quantitative error and/or to determine possibility of analysis, for analysis using measurement lines which are secondary X-rays of which the intensities are to be measured, and a display control unit configured to cause a display to display the quantitative error and/or the possibility of analysis obtained by the measurement line evaluation unit.
- the measurement line evaluation unit calculates, for all specified measurement lines, estimated measured intensities by theoretical intensity calculation and apparatus sensitivity on the basis of a composition and/or a thickness specified for the thin film.
- the measurement line evaluation unit repeats a process of, on the basis of a set of estimated measured intensities obtained by changing, by a predetermined amount, only an estimated measured intensity of one measurement line among a set of the calculated estimated measured intensities, obtaining quantitative values of the composition and/or the thickness of the thin film after change of the estimated measured intensity by the fundamental parameter method, while changing a measurement line of which the estimated measured intensity is to be changed.
- the measurement line evaluation unit estimates the quantitative error and/or determines the possibility of analysis, on the basis of the obtained quantitative values and the specified composition and/or the specified thickness.
- the estimated measured intensities are calculated by the theoretical intensity calculation and the apparatus sensitivity on the basis of the composition and/or the thickness specified for the thin film; only the estimated measured intensity of one measurement line is changed by the predetermined amount and the process of obtaining the quantitative values of the composition and/or the thickness of the thin film after change of the estimated measured intensity by the fundamental parameter method is repeated, while changing the measurement line of which the estimated measured intensity is to be changed; and the quantitative error is estimated and/or the possibility of analysis is determined, on the basis of the obtained quantitative values and the specified composition and/or the specified thickness.
- the intensities of the measurement lines greatly depend on both the composition and the thickness of the thin film, the quantitative error is estimated and/or the possibility of analysis is determined. Accordingly, even in the case where both the composition and the thickness of each layer of the thin film are analyzed and the same elements are contained in different layers, selection of appropriate measurement lines is facilitated and accurate analysis can be performed.
- a second aspect of the present invention is an X-ray fluorescence spectrometer which irradiates, with primary X-rays, a sample having a single-layer or multi-layer thin film formed independently or on a substrate, and obtains quantitative values of a composition and/or a thickness of the thin film by a fundamental parameter method on the basis of measured intensities of generated secondary X-rays.
- the spectrometer includes a measurement line evaluation unit configured to estimate a quantitative error and/or determine possibility of analysis, and to select an optimum combination of measurement lines which are secondary X-rays of which the intensities are to be measured, for analysis using the measurement lines, and a display control unit configured to cause a display to display the quantitative error and/or the possibility of analysis, and the optimum combination of the measurement lines obtained by the measurement line evaluation unit.
- the measurement line evaluation unit calculates, for all the measurement lines of which the intensities can be measured, estimated measured intensities by theoretical intensity calculation and apparatus sensitivity on the basis of a composition and/or a thickness specified for the thin film.
- the measurement line evaluation unit creates combinations of the measurement lines for obtaining the quantitative values of the composition and/or the thickness of the thin film, from all the measurement lines of which the intensities can be measured.
- the measurement line evaluation unit repeats, for each combination of the measurement lines, a process of obtaining quantitative values of the composition and/or the thickness of the thin film after change of an estimated measured intensity by the fundamental parameter method on the basis of a set of estimated measured intensities obtained by changing, by a predetermined amount, only the estimated measured intensity of one measurement line among a set of the calculated estimated measured intensities of the measurement lines included in the combination, while changing a measurement line of which the estimated measured intensity is to be changed.
- the measurement line evaluation unit estimates the quantitative error and/or determines the possibility of analysis, and selects an optimum combination of the measurement lines, on the basis of the obtained quantitative values and the specified composition and/or the specified thickness.
- the X-ray fluorescence spectrometer for all the measurement lines of which the intensities can be measured, estimated measured intensities are calculated by the theoretical intensity calculation and the apparatus sensitivity on the basis of the composition and/or the thickness specified for the thin film; the combinations of the measurement lines for obtaining the quantitative values of the composition and/or the thickness of the thin film are created; for each combination of the measurement lines, only the estimated measured intensity of one measurement line is changed by the predetermined amount, and the process of obtaining the quantitative values of the composition and/or the thickness of the thin film after change of the estimated measured intensity by the fundamental parameter method is repeated, while changing the measurement line of which the estimated measured intensity is to be changed; and the quantitative error is estimated and/or the possibility of analysis is determined, and the optimum combination of the measurement lines is selected, on the basis of the obtained quantitative values and the specified composition and/or the specified thickness.
- the intensities of the measurement lines greatly depend on both the composition and the thickness of the thin film, not only the quantitative error is estimated and/or the possibility of analysis is determined, but also the optimum combination of the measurement lines is selected. Accordingly, even in the case where both the composition and the thickness of each layer of the thin film are analyzed and the same elements are contained in different layers, appropriate measurement lines are automatically selected and accurate analysis can be performed.
- the spectrometer is an X-ray fluorescence spectrometer that irradiates, with primary X-rays 2 from an X-ray source 1 such as an X-ray tube, a sample 3 having a single-layer or multi-layer thin film formed independently or on a substrate, measures intensities of generated secondary X-rays 4 by using detection unit 9, and obtains quantitative values of a composition and/or a thickness of the thin film by a fundamental parameter method (hereinafter, also referred to as "FP method”) on the basis of the measured intensities of the secondary X-rays 4.
- FP method fundamental parameter method
- the spectrometer includes a measurement line evaluation unit 23 configured to estimate a quantitative error and/or determine possibility of analysis, for analysis using measurement lines 4 which are secondary X-rays of which the intensities are to be measured, and a display control unit 22 configured to cause a display 16 such as a liquid crystal display to display the quantitative error and/or the possibility of analysis obtained by the measurement line evaluation unit 23.
- a measurement line evaluation unit 23 configured to estimate a quantitative error and/or determine possibility of analysis, for analysis using measurement lines 4 which are secondary X-rays of which the intensities are to be measured
- a display control unit 22 configured to cause a display 16 such as a liquid crystal display to display the quantitative error and/or the possibility of analysis obtained by the measurement line evaluation unit 23.
- the sample 3 is a so-called thin film sample such as an iron-zinc alloy plated steel sheet, and is placed on a sample stage 8.
- the detection unit 9 is composed of a spectroscopic device 5 which monochromates the secondary X-rays 4 such as fluorescent X-rays generated from the sample 3, and a detector 7 which measures the intensity of each of monochromated secondary X-rays 6.
- a detector having a high energy resolution may be used without using the spectroscopic device 5.
- the display control unit 22 and the measurement line evaluation unit 23 are included in analysis condition creating unit 20.
- Obtaining the quantitative values of the composition and/or the thickness of the thin film by an FP method on the basis of the measured intensities refers to calculating theoretical intensities of the secondary X-rays 4 generated from the sample 3 being excited by the primary X-rays 2 on the basis of a composition and/or a thickness assumed for each thin film (which may be a single layer) included in the sample 3, sequentially and approximately correcting and calculating the composition and/or the thickness assumed for each thin film such that the theoretical intensities match converted measured intensities which are obtained by converting the measured intensities of the sample 3 to theoretical intensity scale, and thereby obtaining the quantitative values of the composition and/or the thickness.
- the measurement line evaluation unit 23 calculates, on the basis of a composition Wi1 (the content ratio of each component) and/or a thickness Ti1 (reference numeral 1 indicates a specified numerical value) specified for the thin film i by an operator using an input unit (not illustrated) provided in the analysis condition creating unit 20, estimated measured intensities IipM1 (reference character M indicates a measured intensity scale) for all measurementment lines ip which are similarly specified, by the theoretical intensity calculation and apparatus sensitivity.
- a composition Wi1 the content ratio of each component
- a thickness Ti1 reference numeral 1 indicates a specified numerical value
- IipM1 reference character M indicates a measured intensity scale
- Each of the estimated measured intensities IipM1 is calculated by dividing, by the apparatus sensitivity kip, a theoretical intensity IipT1 (reference character T indicates a theoretical intensity scale) obtained for each measurement line ip by theoretical calculation, to convert to a measured intensity scale.
- the apparatus sensitivity kip is obtained in advance as the ratio of the theoretical intensity with respect to the measured intensity, by measuring, for each measurement line ip, a standard sample made of a pure substance, etc. and then is stored in the measurement line evaluation unit 23.
- t represents a measurement time (second), and is assumed to be 40 seconds, for example.
- predetermined times ( ⁇ times, e.g., two times) of the accuracy Sip are added to only an estimated measured intensity IipM1 of one measurement line ip among the set of the estimated measured intensities IipM1 calculated at step S1, by the following equation (2), to obtain an estimated measured intensity IipM2.
- IipM 2 IipM 1 + ⁇ ⁇ Sip
- a new set of the estimated measured intensities IipM2 is created from the estimated measured intensities IipM2 obtained by the equations (2) and (3). Subsequently, a quantitative value Wi2(ip) of the composition and/or a quantitative value Ti2(ip) of the thickness of the thin film after change of the estimated measured intensity is obtained by the FP method on the basis of the new set of the estimated measured intensities IipM2.
- the upper limit value (for example, two) may be set for the number of times of repeating calculation by the FP method to reach the quantitative value. This operation is performed while changing the estimated measured intensities of the measurement lines ip to IipM1 + ⁇ ⁇ Sip one by one.
- step S2 is repeated while changing a measurement line ip of which the estimated measured intensity IipM1 is to be changed.
- Variation in X-ray intensity of the measurement line is an independent phenomenon of each measurement line. Thus, the rationality is not impaired even if only the estimated measured intensity of each individual measurement line is changed.
- step S3 on the basis of the quantitative value Wi2(ip) of the composition and/or the quantitative value Ti2(ip) of the thickness calculated at step S2 and the specified composition Wi1 and/or the specified thickness Ti1, quantitative errors ⁇ Wi and/or ⁇ Ti are estimated and/or possibility of analysis is determined. More specifically, for each measurement line ip of which the estimated measured intensity has been changed, a difference between the quantitative value Wi2(ip) of the composition and/or the quantitative value Ti2(ip) of the thickness after change and the specified composition Wi1 and/or the specified thickness Ti1 is first obtained by the following equations (4) and/or (5).
- ⁇ Wi ip Wi 2 ip ⁇ Wi 1
- the quantitative error ⁇ Wi of the composition and/or the quantitative error ⁇ Ti of the thickness are estimated as root-mean-square error(s) represented by the following equations (6) and/or (7), considering all the specified measurement lines ip.
- n represents the number of the measurement lines.
- Rs represents a required relative accuracy, and is assumed to be uniformly 0.05, for example, but may be individually set for each thin film i.
- the equations (8) and/or (9) are satisfied for the compositions and/or the thicknesses of all the thin films, it is determined that analysis is possible, and when the equations (8) and/or (9) are not satisfied for any one of the thin films, it is determined that analysis is impossible.
- the possibility of analysis may be determined for each of specified measurement lines by the following equations (10) and/or (11), and may be determined in the loop at step S2. ⁇ Wi ip / Wi 1 ⁇ Rs ⁇ Ti ip / Ti 1 ⁇ Rs
- the quantitative errors ⁇ Wi and/or ⁇ Ti and/or the possibility of analysis obtained by the measurement line evaluation unit 23 in this way, are displayed on the display 16 by the display control unit 22.
- the X-ray fluorescence spectrometer estimates the quantitative errors ⁇ Wi and/or ⁇ Ti, and/or determines the possibility of analysis, and displays the result on the display 16. Accordingly, even in the case where both the composition and the thickness of each layer of the thin film are analyzed and the same elements are contained in different layers, an operator can easily and appropriately select the measurement lines on the basis of the displayed result, thus enabling accurate analysis.
- this spectrometer is an X-ray fluorescence spectrometer that irradiates, with the primary X-rays 2, a sample 3 having a single-layer or multi-layer thin film formed independently or on a substrate, and obtains quantitative values of a composition and/or a thickness of the thin film by an FP method on the basis of the measured intensities of generated secondary X-rays 4.
- the spectrometer includes a measurement line evaluation unit 33 configured to estimate a quantitative error and/or determine possibility of analysis, and to select an optimum combination of measurement lines which are secondary X-rays of which the intensities are to be measured, for analysis using the measurement lines 4, and a display control unit 32 configured to cause a display 16 to display the quantitative error and/or the possibility of the analysis, and the optimum combination of the measurement lines obtained by the measurement line evaluation unit 33.
- the spectrometer according to the second embodiment differs from the spectrometer according to the first embodiment in operations of the measurement line evaluation unit 33 and operations of the display control unit 32, that is, what is displayed on the display 16. Thus, the explanation thereof is given.
- step S1A for all the measurement lines ip of which the intensities can be measured, the estimated measured intensities IipM1 are calculated, as in the spectrometer according to the first embodiment, by the theoretical intensity calculation and the apparatus sensitivity on the basis of the composition Wi1 and/or the thickness Ti1 specified for the thin film i as in the spectrometer according to the first embodiment.
- a table of the measurement lines corresponding to elements contained in the thin film i stored in the measurement line evaluation unit 33 is searched on the basis of the configuration (for example, a spectroscopic device) of the spectrometer being used.
- the sample 3 is an iron-zinc alloy plated steel sheet having a plated coat made of iron and zinc formed on a steel plate substrate, in which the specified composition Wi1 is the content ratio of iron, zinc is a residue, and the substrate is iron
- six measuringment lines ip, Zn-K ⁇ , Zn-K ⁇ , Zn-L ⁇ , Fe-K ⁇ , Fe-K ⁇ , and Fe-L ⁇ are retrieved in searching.
- step S2A-1 combinations j of the measurement lines ip for obtaining the quantitative values of the composition and/or the thickness of the thin film are created from all the measurement lines ip which are retrieved at step S1A.
- fifteen combinations are created because two measurement lines are used in order to analyze the iron content ratio and the thickness of the plated coat.
- the quantitative value Wi2(ip,j) of the composition and/or the quantitative value Ti2(ip,j) of the thickness of the thin film after change of an estimated measured intensity is obtained by the FP method on the basis of a set of estimated measured intensities IipM2 obtained by changing, by a predetermined amount, only the estimated measured intensity of one measurement line among a set of the estimated measured intensities IipM1, which are calculated at step S1A, of the measurement lines ip included in the combination j, and such a process is repeated while changing a measurement line ip of which the estimated measured intensity IipM1 is to be changed. That is, for all the combinations j of the measurement lines ip created at step S2A-1, the operation at step S2 by the measurement line evaluation unit 23 of the spectrometer according to the first embodiment is performed.
- step S3A on the basis of the quantitative value Wi2(ip,j) of the composition and/or the quantitative value Ti2(ip,j) of the thickness obtained at step S2A-2 and the specified composition Wi1 and/or the specified thickness Ti1, the quantitative errors ⁇ Wij and/or ⁇ Tij are estimated and/or the possibility of analysis is determined, and the optimum combination of the measurement lines is selected.
- each difference between the quantitative value Wi2(ip,j) of the composition and/or the quantitative value Ti2(ip,j) of the thickness after change and the specified composition Wi1 and/or the specified thickness Ti1 is first obtained, by the following equations (12) and/or (13), for each measurement line ip of which the estimated measured intensity has been changed.
- the quantitative error ⁇ Wij of the composition and/or the quantitative error ⁇ Tij of the thickness of each thin film i are estimated by the following equations (14) and/or (15), considering all the combined measurement lines ip.
- n represents the number of the measurement lines, as described above.
- ⁇ Wij ⁇ ip ⁇ Wi ip , j 2 / n 1 / 2
- ⁇ Tij ⁇ ip ⁇ Ti ip , j 2 / n 1 / 2
- a quantitative relative error ⁇ Wij/Wi1 of the composition and/or a quantitative relative error ⁇ Tij/Ti1 of the thickness are calculated for each combination j of the measurement lines ip.
- the largest numerical value of the quantitative relative errors is defined as the representative quantitative relative error of the combination j.
- a combination having the smallest representative quantitative relative error is selected as the optimum combination of the measurement lines.
- the optimum combination of the measurement lines and the quantitative errors ⁇ Wij and/or ⁇ Tij of the optimum combination j and/or the possibility of analysis of the optimum combination j, which are obtained by the measurement line evaluation unit 33 in this way, are displayed on the display 16 by the display control unit 32.
- a layer having an unanalyzable thickness and/or a component of which the content ratio is unanalyzable and a layer containing the unanalyzable component may be displayed on the display 16.
- Table 1 shows the estimation result of quantitative errors by the measurement line evaluation unit 33 in a case of analyzing an iron-zinc alloy layer of an iron-zinc alloy plated steel sheet by using the spectrometer according to the second embodiment, as an example.
- the specified content ratio of Fe is 10.0% and the specified thickness is 4.3 ⁇ m.
- the number of the measurement lines of which the intensities can be measured is six, and fifteen combinations of the measurement lines are created, as described above.
- the change amount of the estimated measured intensity in the equation (2) is set to two times of the accuracy, and the lower limit of the relative accuracy of X-ray intensities is set to 0.05% considering various types of reproducibility.
- the X-ray fluorescence spectrometer according to the second embodiment not only estimates the quantitative errors and/or determines the possibility of analysis, but also selects the optimum combination of the measurement lines. Accordingly, even in the case where both the composition and the thickness of each layer of the thin film are analyzed and the same elements are contained in different layers, appropriate measurement lines are automatically selected, thus enabling accurate analysis.
Landscapes
- Chemical & Material Sciences (AREA)
- General Health & Medical Sciences (AREA)
- Life Sciences & Earth Sciences (AREA)
- Health & Medical Sciences (AREA)
- Analytical Chemistry (AREA)
- Biochemistry (AREA)
- Physics & Mathematics (AREA)
- General Physics & Mathematics (AREA)
- Immunology (AREA)
- Pathology (AREA)
- Crystallography & Structural Chemistry (AREA)
- Analysing Materials By The Use Of Radiation (AREA)
- Length-Measuring Devices Using Wave Or Particle Radiation (AREA)
Description
- This application is based on and claims Convention priority to Japanese patent application No.
2015-157958, filed August 10, 2015 - The present invention relates to an X-ray fluorescence spectrometer which irradiates, with primary X-rays, a sample having a single-layer or multi-layer thin film formed independently or on a substrate and which obtains quantitative values of a composition and/or a thickness of the thin film by a fundamental parameter method on the basis of measured intensities of generated secondary X-rays.
- In X-ray fluorescence analysis, secondary X-rays to be measured, that is, measurement lines are appropriately selected and set depending on the type of a sample to be analyzed. However, in a so-called thin film sample such as a semiconductor wafer and an iron-zinc alloy plated steel sheet, selecting the measurement lines is not easy because both a composition and a thickness of the thin film are analyzed, or the same elements are contained in different layers or a substrate, in some cases. When selection is inappropriate, accurate analysis cannot be performed.
- Accordingly, as a conventional technology, there is an X-ray fluorescence spectrometer (see Patent Document 1) below, for example. In this X-ray fluorescence spectrometer, a measurement line evaluation unit: calculates, for each specified measurement line, a first theoretical intensity for a thickness and a composition specified for each layer of a thin film, and a second theoretical intensity for a thickness and a composition after change of the thickness or the content ratio by a predetermined amount; calculates a predetermined thickness accuracy or content ratio accuracy by using the first and second theoretical intensities; and determines possibility of analysis using the specified measurement lines on the basis of the thickness accuracy or the content ratio accuracy, and the possibility of analysis is displayed on a display. Thus, an operator can easily select the measurement lines on the basis of the displayed possibility.
- [Patent Document 1]
JP Laid-open Patent Publication No. 2001-356103 - However, in a case where both a composition and a thickness of a plated layer, which is a thin film, are analyzed and iron is contained as a common element in a substrate and a plated layer, which are different layers, such as a case where a sample is the iron-zinc alloy plated steel sheet, possibility of analysis using specified measurement lines might be incorrectly determined. The reason for that is as follows. In this conventional spectrometer: the first theoretical intensity for the thickness and the composition specified for the plated layer, the second theoretical intensity obtained by changing only the thickness by a predetermined amount, and the second theoretical intensity obtained by changing only the content ratio by a predetermined amount are calculated for each of specified measurement lines; predetermined thickness accuracy and content ratio accuracy are calculated using these theoretical intensities; and the possibility of analysis using the specified measurement lines is determined on the basis of the thickness accuracy and the content ratio accuracy. However, in actuality, change in quantitative value of each of the thickness and the composition does not correspond to intensity change of a single measurement line, but the intensity of each measurement line greatly depends on both the thickness and the composition of the plated layer.
- The present invention has been made in view of the above conventional problems, and an object of thereof is to provide a spectrometer that facilitates selection of appropriate measurement lines and enables accurate analysis, even in the case where both the composition and the thickness of each layer of a thin film are analyzed and the same elements are contained in different layers, in X-ray fluorescence analysis of the thin film sample.
- To achieve the above object, a first aspect of the present invention is an X-ray fluorescence spectrometer which irradiates, with primary X-rays, a sample having a single-layer or multi-layer thin film formed independently or on a substrate, and obtains quantitative values of a composition and/or a thickness of the thin film by a fundamental parameter method on the basis of measured intensities of generated secondary X-rays. The spectrometer includes a measurement line evaluation unit configured to estimate a quantitative error and/or to determine possibility of analysis, for analysis using measurement lines which are secondary X-rays of which the intensities are to be measured, and a display control unit configured to cause a display to display the quantitative error and/or the possibility of analysis obtained by the measurement line evaluation unit.
- First, the measurement line evaluation unit calculates, for all specified measurement lines, estimated measured intensities by theoretical intensity calculation and apparatus sensitivity on the basis of a composition and/or a thickness specified for the thin film. Next, the measurement line evaluation unit repeats a process of, on the basis of a set of estimated measured intensities obtained by changing, by a predetermined amount, only an estimated measured intensity of one measurement line among a set of the calculated estimated measured intensities, obtaining quantitative values of the composition and/or the thickness of the thin film after change of the estimated measured intensity by the fundamental parameter method, while changing a measurement line of which the estimated measured intensity is to be changed. Next, the measurement line evaluation unit estimates the quantitative error and/or determines the possibility of analysis, on the basis of the obtained quantitative values and the specified composition and/or the specified thickness.
- In the X-ray fluorescence spectrometer according to the first aspect: for all the specified measurement lines, the estimated measured intensities are calculated by the theoretical intensity calculation and the apparatus sensitivity on the basis of the composition and/or the thickness specified for the thin film; only the estimated measured intensity of one measurement line is changed by the predetermined amount and the process of obtaining the quantitative values of the composition and/or the thickness of the thin film after change of the estimated measured intensity by the fundamental parameter method is repeated, while changing the measurement line of which the estimated measured intensity is to be changed; and the quantitative error is estimated and/or the possibility of analysis is determined, on the basis of the obtained quantitative values and the specified composition and/or the specified thickness.
- That is, by considering the fact that the intensities of the measurement lines greatly depend on both the composition and the thickness of the thin film, the quantitative error is estimated and/or the possibility of analysis is determined. Accordingly, even in the case where both the composition and the thickness of each layer of the thin film are analyzed and the same elements are contained in different layers, selection of appropriate measurement lines is facilitated and accurate analysis can be performed.
- A second aspect of the present invention is an X-ray fluorescence spectrometer which irradiates, with primary X-rays, a sample having a single-layer or multi-layer thin film formed independently or on a substrate, and obtains quantitative values of a composition and/or a thickness of the thin film by a fundamental parameter method on the basis of measured intensities of generated secondary X-rays. The spectrometer includes a measurement line evaluation unit configured to estimate a quantitative error and/or determine possibility of analysis, and to select an optimum combination of measurement lines which are secondary X-rays of which the intensities are to be measured, for analysis using the measurement lines, and a display control unit configured to cause a display to display the quantitative error and/or the possibility of analysis, and the optimum combination of the measurement lines obtained by the measurement line evaluation unit.
- First, the measurement line evaluation unit calculates, for all the measurement lines of which the intensities can be measured, estimated measured intensities by theoretical intensity calculation and apparatus sensitivity on the basis of a composition and/or a thickness specified for the thin film. Next, the measurement line evaluation unit creates combinations of the measurement lines for obtaining the quantitative values of the composition and/or the thickness of the thin film, from all the measurement lines of which the intensities can be measured. Next, the measurement line evaluation unit repeats, for each combination of the measurement lines, a process of obtaining quantitative values of the composition and/or the thickness of the thin film after change of an estimated measured intensity by the fundamental parameter method on the basis of a set of estimated measured intensities obtained by changing, by a predetermined amount, only the estimated measured intensity of one measurement line among a set of the calculated estimated measured intensities of the measurement lines included in the combination, while changing a measurement line of which the estimated measured intensity is to be changed. Next, the measurement line evaluation unit estimates the quantitative error and/or determines the possibility of analysis, and selects an optimum combination of the measurement lines, on the basis of the obtained quantitative values and the specified composition and/or the specified thickness.
- In the X-ray fluorescence spectrometer according to the second aspect: for all the measurement lines of which the intensities can be measured, estimated measured intensities are calculated by the theoretical intensity calculation and the apparatus sensitivity on the basis of the composition and/or the thickness specified for the thin film; the combinations of the measurement lines for obtaining the quantitative values of the composition and/or the thickness of the thin film are created; for each combination of the measurement lines, only the estimated measured intensity of one measurement line is changed by the predetermined amount, and the process of obtaining the quantitative values of the composition and/or the thickness of the thin film after change of the estimated measured intensity by the fundamental parameter method is repeated, while changing the measurement line of which the estimated measured intensity is to be changed; and the quantitative error is estimated and/or the possibility of analysis is determined, and the optimum combination of the measurement lines is selected, on the basis of the obtained quantitative values and the specified composition and/or the specified thickness.
- That is, by considering the fact that the intensities of the measurement lines greatly depend on both the composition and the thickness of the thin film, not only the quantitative error is estimated and/or the possibility of analysis is determined, but also the optimum combination of the measurement lines is selected. Accordingly, even in the case where both the composition and the thickness of each layer of the thin film are analyzed and the same elements are contained in different layers, appropriate measurement lines are automatically selected and accurate analysis can be performed.
- Any combination of at least two constructions, disclosed in the appended claims and/or the specification and/or the accompanying drawings should be construed as included within the scope of the present invention. In particular, any combination of two or more of the appended claims should be equally construed as included within the scope of the present invention.
- In any event, the present invention will become more clearly understood from the following description of preferred embodiments thereof, when taken in conjunction with the accompanying drawings. However, the embodiments and the drawings are given only for the purpose of illustration and explanation, and are not to be taken as limiting the scope of the present invention in any way whatsoever, which scope is to be determined by the appended claims. In the accompanying drawings, like reference numerals are used to denote like parts throughout the several views, and:
-
Fig. 1 is a schematic view of an X-ray fluorescence spectrometer according to a first or second embodiment of the present invention; -
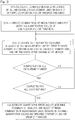
Fig. 2 is a flowchart showing operations of the X-ray fluorescence spectrometer according to the first embodiment; and -
Fig. 3 is a flowchart showing operations of the X-ray fluorescence spectrometer according to the second embodiment. - Hereinafter, a spectrometer according to a first embodiment of the present invention is described with reference to the drawings. As illustrated in
Fig. 1 , the spectrometer is an X-ray fluorescence spectrometer that irradiates, withprimary X-rays 2 from anX-ray source 1 such as an X-ray tube, a sample 3 having a single-layer or multi-layer thin film formed independently or on a substrate, measures intensities of generated secondary X-rays 4 by using detection unit 9, and obtains quantitative values of a composition and/or a thickness of the thin film by a fundamental parameter method (hereinafter, also referred to as "FP method") on the basis of the measured intensities of the secondary X-rays 4. The spectrometer includes a measurement line evaluation unit 23 configured to estimate a quantitative error and/or determine possibility of analysis, for analysis using measurement lines 4 which are secondary X-rays of which the intensities are to be measured, and a display control unit 22 configured to cause adisplay 16 such as a liquid crystal display to display the quantitative error and/or the possibility of analysis obtained by the measurement line evaluation unit 23. - Here, the sample 3 is a so-called thin film sample such as an iron-zinc alloy plated steel sheet, and is placed on a sample stage 8. The detection unit 9 is composed of a spectroscopic device 5 which monochromates the secondary X-rays 4 such as fluorescent X-rays generated from the sample 3, and a detector 7 which measures the intensity of each of monochromated secondary X-rays 6. As the detection unit, a detector having a high energy resolution may be used without using the spectroscopic device 5. The display control unit 22 and the measurement line evaluation unit 23 are included in analysis condition creating unit 20.
- Obtaining the quantitative values of the composition and/or the thickness of the thin film by an FP method on the basis of the measured intensities refers to calculating theoretical intensities of the secondary X-rays 4 generated from the sample 3 being excited by the
primary X-rays 2 on the basis of a composition and/or a thickness assumed for each thin film (which may be a single layer) included in the sample 3, sequentially and approximately correcting and calculating the composition and/or the thickness assumed for each thin film such that the theoretical intensities match converted measured intensities which are obtained by converting the measured intensities of the sample 3 to theoretical intensity scale, and thereby obtaining the quantitative values of the composition and/or the thickness. - Operations of the measurement line evaluation unit 23 included in the X-ray fluorescence spectrometer according to the first embodiment are specifically shown in the flowchart in
Fig. 2 . First, at step S1, the measurement line evaluation unit 23 calculates, on the basis of a composition Wi1 (the content ratio of each component) and/or a thickness Ti1 (reference numeral 1 indicates a specified numerical value) specified for the thin film i by an operator using an input unit (not illustrated) provided in the analysis condition creating unit 20, estimated measured intensities IipM1 (reference character M indicates a measured intensity scale) for all mesurement lines ip which are similarly specified, by the theoretical intensity calculation and apparatus sensitivity. Each of the estimated measured intensities IipM1 is calculated by dividing, by the apparatus sensitivity kip, a theoretical intensity IipT1 (reference character T indicates a theoretical intensity scale) obtained for each measurement line ip by theoretical calculation, to convert to a measured intensity scale. The apparatus sensitivity kip is obtained in advance as the ratio of the theoretical intensity with respect to the measured intensity, by measuring, for each measurement line ip, a standard sample made of a pure substance, etc. and then is stored in the measurement line evaluation unit 23. - Next, at step S2, on the basis of a set of estimated measured intensities IipM2 obtained by changing, by a predetermined amount, only an estimated measured intensity of one measurement line among a set of the estimated measured intensities IipM1 calculated at step S1, a quantitative value Wi2(ip) of the composition and/or a quantitative value Ti2(ip) of the thickness (
reference numeral 2 indicates a numerical value changed from a specified value) of the thin film after change of the estimated measured intensity is obtained by the FP method. More specifically, an accuracy Sip of the intensity of each measurement line ip is first estimated by the following equation (1).
- Here, t represents a measurement time (second), and is assumed to be 40 seconds, for example. Next, predetermined times (α times, e.g., two times) of the accuracy Sip are added to only an estimated measured intensity IipM1 of one mesurement line ip among the set of the estimated measured intensities IipM1 calculated at step S1, by the following equation (2), to obtain an estimated measured intensity IipM2.

- For the other mesurement lines ip, the current measured intensities IipM1 are used as they are, as shown by the following equation (3).

- A new set of the estimated measured intensities IipM2 is created from the estimated measured intensities IipM2 obtained by the equations (2) and (3). Subsequently, a quantitative value Wi2(ip) of the composition and/or a quantitative value Ti2(ip) of the thickness of the thin film after change of the estimated measured intensity is obtained by the FP method on the basis of the new set of the estimated measured intensities IipM2. The upper limit value (for example, two) may be set for the number of times of repeating calculation by the FP method to reach the quantitative value. This operation is performed while changing the estimated measured intensities of the mesurement lines ip to IipM1 + α × Sip one by one. That is, until the estimated measured intensities IipM1 of all the specified mesurement lines ip are changed, the process at step S2 is repeated while changing a mesurement line ip of which the estimated measured intensity IipM1 is to be changed. Variation in X-ray intensity of the measurement line is an independent phenomenon of each measurement line. Thus, the rationality is not impaired even if only the estimated measured intensity of each individual measurement line is changed.
- Next, at step S3, on the basis of the quantitative value Wi2(ip) of the composition and/or the quantitative value Ti2(ip) of the thickness calculated at step S2 and the specified composition Wi1 and/or the specified thickness Ti1, quantitative errors ΔWi and/or ΔTi are estimated and/or possibility of analysis is determined. More specifically, for each measurement line ip of which the estimated measured intensity has been changed, a difference between the quantitative value Wi2(ip) of the composition and/or the quantitative value Ti2(ip) of the thickness after change and the specified composition Wi1 and/or the specified thickness Ti1 is first obtained by the following equations (4) and/or (5).


- Next, for each thin film i, the quantitative error ΔWi of the composition and/or the quantitative error ΔTi of the thickness are estimated as root-mean-square error(s) represented by the following equations (6) and/or (7), considering all the specified mesurement lines ip. Here, n represents the number of the measurement lines.


- Instead of estimating the quantitative errors ΔWi and/or ΔTi, or in addition to estimating the quantitative errors ΔWi and/or ΔTi, the possibility of analysis using the specified measurement lines may be determined by the following equations (8) and/or (9).


- Here, Rs represents a required relative accuracy, and is assumed to be uniformly 0.05, for example, but may be individually set for each thin film i. When the equations (8) and/or (9) are satisfied for the compositions and/or the thicknesses of all the thin films, it is determined that analysis is possible, and when the equations (8) and/or (9) are not satisfied for any one of the thin films, it is determined that analysis is impossible. The possibility of analysis may be determined for each of specified measurement lines by the following equations (10) and/or (11), and may be determined in the loop at step S2.


- The quantitative errors ΔWi and/or ΔTi and/or the possibility of analysis obtained by the measurement line evaluation unit 23 in this way, are displayed on the
display 16 by the display control unit 22. As described above, by considering the fact that the intensities of the mesurement lines ip greatly depend on both the composition and the thickness of the thin film, the X-ray fluorescence spectrometer according to the first embodiment estimates the quantitative errors ΔWi and/or ΔTi, and/or determines the possibility of analysis, and displays the result on thedisplay 16. Accordingly, even in the case where both the composition and the thickness of each layer of the thin film are analyzed and the same elements are contained in different layers, an operator can easily and appropriately select the measurement lines on the basis of the displayed result, thus enabling accurate analysis. - An X-ray fluorescence spectrometer according to a second embodiment of the present invention is described. As illustrated in
Fig. 1 , this spectrometer is an X-ray fluorescence spectrometer that irradiates, with theprimary X-rays 2, a sample 3 having a single-layer or multi-layer thin film formed independently or on a substrate, and obtains quantitative values of a composition and/or a thickness of the thin film by an FP method on the basis of the measured intensities of generated secondary X-rays 4. The spectrometer includes a measurement line evaluation unit 33 configured to estimate a quantitative error and/or determine possibility of analysis, and to select an optimum combination of measurement lines which are secondary X-rays of which the intensities are to be measured, for analysis using the measurement lines 4, and a display control unit 32 configured to cause adisplay 16 to display the quantitative error and/or the possibility of the analysis, and the optimum combination of the measurement lines obtained by the measurement line evaluation unit 33. - The spectrometer according to the second embodiment differs from the spectrometer according to the first embodiment in operations of the measurement line evaluation unit 33 and operations of the display control unit 32, that is, what is displayed on the
display 16. Thus, the explanation thereof is given. - Operations of the measurement line evaluation unit 33 included in the spectrometer according to the second embodiment are specifically shown in the flowchart in
Fig. 3 . At step S1A, for all the mesurement lines ip of which the intensities can be measured, the estimated measured intensities IipM1 are calculated, as in the spectrometer according to the first embodiment, by the theoretical intensity calculation and the apparatus sensitivity on the basis of the composition Wi1 and/or the thickness Ti1 specified for the thin film i as in the spectrometer according to the first embodiment. For the mesurement lines ip of which the intensities can be measured, a table of the measurement lines corresponding to elements contained in the thin film i stored in the measurement line evaluation unit 33 is searched on the basis of the configuration (for example, a spectroscopic device) of the spectrometer being used. For example, in a case where the sample 3 is an iron-zinc alloy plated steel sheet having a plated coat made of iron and zinc formed on a steel plate substrate, in which the specified composition Wi1 is the content ratio of iron, zinc is a residue, and the substrate is iron, six mesurement lines ip, Zn-Kα, Zn-Kβ, Zn-Lα, Fe-Kα, Fe-Kβ, and Fe-Lα are retrieved in searching. - Next, at step S2A-1, combinations j of the mesurement lines ip for obtaining the quantitative values of the composition and/or the thickness of the thin film are created from all the mesurement lines ip which are retrieved at step S1A. In the above case, fifteen combinations are created because two measurement lines are used in order to analyze the iron content ratio and the thickness of the plated coat.
- Next, at step S2A-2, for each combination j of the measurement lines ip created at step S2A-1, the quantitative value Wi2(ip,j) of the composition and/or the quantitative value Ti2(ip,j) of the thickness of the thin film after change of an estimated measured intensity is obtained by the FP method on the basis of a set of estimated measured intensities IipM2 obtained by changing, by a predetermined amount, only the estimated measured intensity of one measurement line among a set of the estimated measured intensities IipM1, which are calculated at step S1A, of the mesurement lines ip included in the combination j, and such a process is repeated while changing a mesurement line ip of which the estimated measured intensity IipM1 is to be changed. That is, for all the combinations j of the mesurement lines ip created at step S2A-1, the operation at step S2 by the measurement line evaluation unit 23 of the spectrometer according to the first embodiment is performed.
- Next, at step S3A, on the basis of the quantitative value Wi2(ip,j) of the composition and/or the quantitative value Ti2(ip,j) of the thickness obtained at step S2A-2 and the specified composition Wi1 and/or the specified thickness Ti1, the quantitative errors ΔWij and/or ΔTij are estimated and/or the possibility of analysis is determined, and the optimum combination of the measurement lines is selected. More specifically, for each of all the combinations j of measurement lines ip created at step S2A-1, each difference between the quantitative value Wi2(ip,j) of the composition and/or the quantitative value Ti2(ip,j) of the thickness after change and the specified composition Wi1 and/or the specified thickness Ti1 is first obtained, by the following equations (12) and/or (13), for each measurement line ip of which the estimated measured intensity has been changed.


- Next, for each of all the combinations j of measurement lines ip created at step S2A-1, the quantitative error ΔWij of the composition and/or the quantitative error ΔTij of the thickness of each thin film i, are estimated by the following equations (14) and/or (15), considering all the combined mesurement lines ip. Here, n represents the number of the measurement lines, as described above.


- Furthermore, on the basis of the quantitative error ΔWij of the composition and/or the quantitative error ΔTij of the thickness estimated in this way, for example, a quantitative relative error ΔWij/Wi1 of the composition and/or a quantitative relative error ΔTij/Ti1 of the thickness are calculated for each combination j of the measurement lines ip. The largest numerical value of the quantitative relative errors is defined as the representative quantitative relative error of the combination j. Of all the combinations, a combination having the smallest representative quantitative relative error is selected as the optimum combination of the measurement lines.
- The possibility of analysis may be determined for the selected optimum combination of the measurement lines by the above equations (8) and/or (9).
- Also in this case, when the equations (8) and/or (9) are satisfied for the compositions and/or the thicknesses of all the thin films, it is determined that analysis is possible, and when the equations (8) and/or (9) are not satisfied for any one of those, it is determined that analysis is impossible. In each combination j of the measurement lines ip created at step S2A-2, the possibility of analysis may be determined for each measurement line ip by the above equations (10) and/or (11), and the process for the combination may be ended at a time point at which it is determined that analysis is impossible, to proceed to the process for a next combination.
- The optimum combination of the measurement lines and the quantitative errors ΔWij and/or ΔTij of the optimum combination j and/or the possibility of analysis of the optimum combination j, which are obtained by the measurement line evaluation unit 33 in this way, are displayed on the
display 16 by the display control unit 32. When analysis is impossible, a layer having an unanalyzable thickness and/or a component of which the content ratio is unanalyzable and a layer containing the unanalyzable component may be displayed on thedisplay 16. - Table 1 shows the estimation result of quantitative errors by the measurement line evaluation unit 33 in a case of analyzing an iron-zinc alloy layer of an iron-zinc alloy plated steel sheet by using the spectrometer according to the second embodiment, as an example. In this example, the specified content ratio of Fe is 10.0% and the specified thickness is 4.3 µm. In addition, the number of the measurement lines of which the intensities can be measured is six, and fifteen combinations of the measurement lines are created, as described above. The change amount of the estimated measured intensity in the equation (2) is set to two times of the accuracy, and the lower limit of the relative accuracy of X-ray intensities is set to 0.05% considering various types of reproducibility. In Table 1, "RMS" indicates the quantitative error (the root-mean-square error) estimated by the equations (14) and (15), and "no solution" means that no quantitative value having a consistency between the content ratio and the thickness is obtained.
[Table 1] No. Combination of Measurement Lines Thickness (µm) Fe mass% Measurement Line 1 Measurement Line 2 Measurement Line for Intensity Change Quantitative Value Error Quantitative Value Error 1 ZnKα ZnKβ ZnKα 4.249 -0.051 9.343 -0.657 ZnKβ 4.355 0.055 10.615 0.615 RMS 0.053 0.636 2 ZnKα FeKα ZnKα 4.226 -0.074 9.070 -0.930 FeKα 4.200 -0.100 8.844 -1.156 RMS 0.088 1.049 3 ZnKα FeKβ ZnKα 4.257 -0.043 9.442 -0.558 FeKβ 4.230 -0.070 9.192 -0.808 RMS 0.058 0.694 4 ZnKα ZnLα ZnKα 4.306 0.006 10.000 0.000 ZnLα 4.297 -0.003 9.969 -0.031 RMS 0.005 0.022 5 ZnKα FeLα ZnKα 4.306 0.006 10.000 0.000 FeLα 4.303 0.003 10.034 0.034 RMS 0.005 0.024 6 ZnKβ FeKα ZnKβ 3.411 -0.889 0.000 -10.000 FeKα 3.395 -0.905 0.000 -10.000 RMS 0.897 10.000 7 ZnKβ FeKβ ZnKβ No Solution No Solution FeKβ 3.638 -0.662 0.000 7.071 RMS 8 ZnKβ ZnLα ZnKβ 4.306 0.006 10.000 0.000 ZnLα 4.298 -0.002 9.969 -0.031 RMS 0.004 0.022 9 ZnKβ FeLα ZnKβ 4.306 0.006 10.000 0.000 FeLα 4.303 0.003 10.034 0.034 RMS 0.005 0.024 10 FeKα FeKβ FeKα 4.408 0.108 11.560 1.560 FeKβ 4.169 -0.131 8.097 -1.903 RMS 0.120 1.740 11 FeKα ZnLα FeKα 4.293 -0.007 10.000 0.000 ZnLα 4.298 -0.002 9.969 -0.031 RMS 0.005 0.022 12 FeKα FeLα FeKα 4.293 -0.007 10.000 0.000 FeLα 4.302 0.002 10.034 0.034 RMS 0.005 0.024 13 FeKβ ZnLα FeKβ 4.292 -0.008 10.000 0.000 ZnLα 4.298 -0.002 9.969 -0.031 RMS 0.006 0.022 14 FeKβ FeLα FeKβ 4.292 -0.008 10.000 0.000 FeLα 4.302 0.002 10.034 0.034 RMS 0.006 0.024 15 ZnLα FeLα ZnLα No Solution No Solution FeLα No Solution No Solution RMS - The combination of Zn-Kβ and Zn-Lα in which the quantitative errors RMS estimated for the content ratio and the thickness are both minimum in Table 1, is selected as the optimum combination of the measurement lines, by the measurement line evaluation unit 33, and this fact is displayed on the
display 16 by the display control unit 32. - As described above, by considering the fact that the intensities of the measurement lines greatly depend on both the composition and the thickness of a thin film, the X-ray fluorescence spectrometer according to the second embodiment not only estimates the quantitative errors and/or determines the possibility of analysis, but also selects the optimum combination of the measurement lines. Accordingly, even in the case where both the composition and the thickness of each layer of the thin film are analyzed and the same elements are contained in different layers, appropriate measurement lines are automatically selected, thus enabling accurate analysis.
- Although the present invention has been fully described in connection with the preferred embodiments thereof with reference to the accompanying drawings which are used only for the purpose of illustration, those skilled in the art will readily conceive numerous changes and modifications within the framework of obviousness upon the reading of the specification herein presented of the present invention. Accordingly, such changes and modifications are, unless they depart from the scope of the present invention as delivered from the claims annexed hereto, to be construed as included therein.
-
- 2
- primary X-rays
- 3
- sample
- 4
- secondary X-rays (measurement lines)
- 16
- display
- 22, 32
- display control unit
- 23, 33
- measurement line evaluation unit
Claims (2)
- An X-ray fluorescence spectrometer which irradiates, with primary X-rays, a sample having a single-layer or multi-layer thin film formed independently or on a substrate, and obtains quantitative values of a composition and/or a thickness of the thin film by a fundamental parameter method on the basis of measured intensities of generated secondary X-rays, the spectrometer comprising:a measurement line evaluation unit configured to estimate a quantitative error and/or to determine possibility of analysis, for analysis using measurement lines which are secondary X-rays of which the intensities are to be measured; anda display control unit configured to cause a display to display the quantitative error and/or the possibility of analysis obtained by the measurement line evaluation unit, whereinthe measurement line evaluation unitcalculates, for all specified measurement lines, estimated measured intensities by theoretical intensity calculation and apparatus sensitivity on the basis of a composition and/or a thickness specified for the thin film,repeats a process of, on the basis of a set of estimated measured intensities obtained by changing, by a predetermined amount, only an estimated measured intensity of one measurement line among a set of the calculated estimated measured intensities, obtaining quantitative values of the composition and/or the thickness of the thin film after change of the estimated measured intensity by the fundamental parameter method, while changing a measurement line of which the estimated measured intensity is to be changed, andestimates the quantitative error and/or determines the possibility of analysis, on the basis of the obtained quantitative values and the specified composition and/or the specified thickness.
- An X-ray fluorescence spectrometer which irradiates, with primary X-rays, a sample having a single-layer or multi-layer thin film formed independently or on a substrate, and obtains quantitative values of a composition and/or a thickness of the thin film by a fundamental parameter method on the basis of measured intensities of generated secondary X-rays, the spectrometer comprising:a measurement line evaluation unit configured to estimate a quantitative error and/or determine possibility of analysis, and to select an optimum combination of measurement lines which are secondary X-rays of which the intensities are to be measured, for analysis using the measurement lines; anda display control unit configured to cause a display to display the quantitative error and/or the possibility of analysis, and the optimum combination of the measurement lines obtained by the measurement line evaluation unit, whereinthe measurement line evaluation unitcalculates, for all the measurement lines of which the intensities can be measured, estimated measured intensities by theoretical intensity calculation and apparatus sensitivity on the basis of a composition and/or a thickness specified for the thin film,creates combinations of the measurement lines for obtaining the quantitative values of the composition and/or the thickness of the thin film, from all the measurement lines of which the intensities can be measured,repeats, for each combination of the measurement lines, a process of obtaining quantitative values of the composition and/or the thickness of the thin film after change of an estimated measured intensity by the fundamental parameter method on the basis of a set of estimated measured intensities obtained by changing, by a predetermined amount, only the estimated measured intensity of one measurement line among a set of the calculated estimated measured intensities of the measurement lines included in the combination, while changing a measurement line of which the estimated measured intensity is to be changed, andestimates the quantitative error and/or determines the possibility of analysis, and selects an optimum combination of the measurement lines, on the basis of the obtained quantitative values and the specified composition and/or the specified thickness.
Applications Claiming Priority (2)
| Application Number | Priority Date | Filing Date | Title |
|---|---|---|---|
| JP2015157958 | 2015-08-10 | ||
| PCT/JP2016/069689 WO2017026200A1 (en) | 2015-08-10 | 2016-07-01 | X-ray fluorescence spectrometer |
Publications (3)
| Publication Number | Publication Date |
|---|---|
| EP3336527A1 true EP3336527A1 (en) | 2018-06-20 |
| EP3336527A4 EP3336527A4 (en) | 2019-04-17 |
| EP3336527B1 EP3336527B1 (en) | 2020-04-22 |
Family
ID=57984259
Family Applications (1)
| Application Number | Title | Priority Date | Filing Date |
|---|---|---|---|
| EP16834897.7A Active EP3336527B1 (en) | 2015-08-10 | 2016-07-01 | X-ray fluorescence spectrometer |
Country Status (5)
| Country | Link |
|---|---|
| US (1) | US10012605B2 (en) |
| EP (1) | EP3336527B1 (en) |
| JP (1) | JP6175662B2 (en) |
| CN (2) | CN107076687A (en) |
| WO (1) | WO2017026200A1 (en) |
Cited By (1)
| Publication number | Priority date | Publication date | Assignee | Title |
|---|---|---|---|---|
| US12235229B2 (en) * | 2021-12-01 | 2025-02-25 | Rigaku Corporation | X-ray fluorescence spectrometer |
Families Citing this family (7)
| Publication number | Priority date | Publication date | Assignee | Title |
|---|---|---|---|---|
| JP6732347B1 (en) | 2019-03-29 | 2020-07-29 | 株式会社リガク | X-ray fluorescence analyzer |
| CN110530912B (en) * | 2019-09-12 | 2022-01-04 | 岛津企业管理(中国)有限公司 | X-ray fluorescence spectrum analysis method for precious metal component containing coating |
| JP6838754B1 (en) * | 2019-09-26 | 2021-03-03 | 株式会社リガク | X-ray fluorescence analyzer |
| JP7249666B2 (en) * | 2020-10-30 | 2023-03-31 | 株式会社リガク | X-ray fluorescence analyzer |
| JP7190751B2 (en) * | 2020-10-30 | 2022-12-16 | 株式会社リガク | X-ray fluorescence analyzer |
| JP7178725B2 (en) * | 2020-11-30 | 2022-11-28 | 株式会社リガク | X-ray fluorescence analyzer |
| JP7653718B2 (en) * | 2023-02-24 | 2025-03-31 | 株式会社リガク | X-ray fluorescence analyzer |
Family Cites Families (15)
| Publication number | Priority date | Publication date | Assignee | Title |
|---|---|---|---|---|
| JPH0750043B2 (en) * | 1988-09-20 | 1995-05-31 | 住金テクノリサーチ株式会社 | X-ray spectroscopic analysis method for thin layer |
| JP2853261B2 (en) * | 1989-05-16 | 1999-02-03 | 三菱マテリアル株式会社 | Metal analysis method and analyzer |
| JPH05240808A (en) * | 1992-02-29 | 1993-09-21 | Horiba Ltd | Method for determining fluorescent x rays |
| JPH0763709A (en) * | 1993-08-31 | 1995-03-10 | Kawasaki Steel Corp | Depth direction texture measuring method and apparatus |
| EP0805967A1 (en) * | 1995-07-25 | 1997-11-12 | Koninklijke Philips Electronics N.V. | X-ray spectrometer comprising a plurality of fixed measuring channels |
| JPH11295245A (en) * | 1998-04-10 | 1999-10-29 | Rigaku Industrial Co | X-ray spectroscopic element and x-ray analysis apparatus using the same |
| JP3949850B2 (en) | 1999-08-06 | 2007-07-25 | 理学電機工業株式会社 | X-ray fluorescence analyzer |
| JP3567177B2 (en) | 2000-04-11 | 2004-09-22 | 理学電機工業株式会社 | X-ray fluorescence analyzer |
| DE10159828B4 (en) * | 2001-12-06 | 2007-09-20 | Rigaku Industrial Corporation, Takatsuki | X-ray fluorescence spectrometer |
| JP3965191B2 (en) * | 2005-04-06 | 2007-08-29 | 理学電機工業株式会社 | X-ray fluorescence analyzer and program used therefor |
| JP4247559B2 (en) * | 2005-06-07 | 2009-04-02 | 株式会社リガク | X-ray fluorescence analyzer and program used therefor |
| JP4262734B2 (en) * | 2005-09-14 | 2009-05-13 | 株式会社リガク | X-ray fluorescence analyzer and method |
| JP4908119B2 (en) * | 2005-10-19 | 2012-04-04 | 株式会社リガク | X-ray fluorescence analyzer |
| CN101887038A (en) | 2009-05-15 | 2010-11-17 | 上海优特化工有限公司 | Device and method for measuring coating by using X-ray fluorescence spectrometer |
| CN103604818B (en) | 2013-11-21 | 2016-11-09 | 同济大学 | A self-absorption correction processing method for fluorescence EXAFS data |
-
2016
- 2016-07-01 WO PCT/JP2016/069689 patent/WO2017026200A1/en not_active Ceased
- 2016-07-01 US US15/522,944 patent/US10012605B2/en active Active
- 2016-07-01 EP EP16834897.7A patent/EP3336527B1/en active Active
- 2016-07-01 CN CN201680003309.3A patent/CN107076687A/en active Pending
- 2016-07-01 JP JP2017520570A patent/JP6175662B2/en active Active
- 2016-07-01 CN CN202011009411.9A patent/CN112378938B/en active Active
Cited By (1)
| Publication number | Priority date | Publication date | Assignee | Title |
|---|---|---|---|---|
| US12235229B2 (en) * | 2021-12-01 | 2025-02-25 | Rigaku Corporation | X-ray fluorescence spectrometer |
Also Published As
| Publication number | Publication date |
|---|---|
| US10012605B2 (en) | 2018-07-03 |
| JPWO2017026200A1 (en) | 2017-08-31 |
| CN112378938A (en) | 2021-02-19 |
| WO2017026200A1 (en) | 2017-02-16 |
| EP3336527B1 (en) | 2020-04-22 |
| US20170322165A1 (en) | 2017-11-09 |
| CN112378938B (en) | 2025-01-17 |
| CN107076687A (en) | 2017-08-18 |
| EP3336527A4 (en) | 2019-04-17 |
| JP6175662B2 (en) | 2017-08-09 |
Similar Documents
| Publication | Publication Date | Title |
|---|---|---|
| EP3336527B1 (en) | X-ray fluorescence spectrometer | |
| EP3598116B1 (en) | X-ray fluorescence analysis method, x-ray fluorescence analysis program, and x-ray fluorescence spectrometer | |
| US6668038B2 (en) | X-ray fluorescence spectrometer | |
| US10082475B2 (en) | X-ray fluorescence spectrometer | |
| US9349572B2 (en) | Energy dispersive X-ray analyzer and method for energy dispersive X-ray analysis | |
| EP3521814A1 (en) | Wavelength-dispersive x-ray fluorescence analysis device and x-ray fluorescence analysis method using same | |
| JP6917668B1 (en) | Energy dispersive X-ray fluorescence analyzer, evaluation method and evaluation program | |
| JP4523958B2 (en) | X-ray fluorescence analyzer and program used therefor | |
| US11832981B2 (en) | X-ray fluorescence spectrometer | |
| JP3729186B2 (en) | X-ray fluorescence analyzer | |
| US11921065B2 (en) | X-ray fluorescence spectrometer | |
| KR101411595B1 (en) | Method of measuring coating weight of iridium | |
| JP3567177B2 (en) | X-ray fluorescence analyzer | |
| JP3301729B2 (en) | X-ray fluorescence analysis method and apparatus by quantitative analysis | |
| JP2017026511A (en) | Fluorescence x-ray analysis device | |
| JP7249666B2 (en) | X-ray fluorescence analyzer | |
| JP2001304843A (en) | Method and apparatus for measuring film thickness | |
| JP2015094643A (en) | X-ray fluorescence analyzer | |
| JP2000275195A (en) | X-ray fluorescence analyzer | |
| EP4707788A1 (en) | X-ray fluorescence spectrometer | |
| JP2002365244A (en) | X-ray fluorescence analyzer | |
| INC | Quantitative Analysis Software |
Legal Events
| Date | Code | Title | Description |
|---|---|---|---|
| STAA | Information on the status of an ep patent application or granted ep patent |
Free format text: STATUS: THE INTERNATIONAL PUBLICATION HAS BEEN MADE |
|
| PUAI | Public reference made under article 153(3) epc to a published international application that has entered the european phase |
Free format text: ORIGINAL CODE: 0009012 |
|
| STAA | Information on the status of an ep patent application or granted ep patent |
Free format text: STATUS: REQUEST FOR EXAMINATION WAS MADE |
|
| 17P | Request for examination filed |
Effective date: 20170424 |
|
| AK | Designated contracting states |
Kind code of ref document: A1 Designated state(s): AL AT BE BG CH CY CZ DE DK EE ES FI FR GB GR HR HU IE IS IT LI LT LU LV MC MK MT NL NO PL PT RO RS SE SI SK SM TR |
|
| AX | Request for extension of the european patent |
Extension state: BA ME |
|
| DAV | Request for validation of the european patent (deleted) | ||
| DAX | Request for extension of the european patent (deleted) | ||
| A4 | Supplementary search report drawn up and despatched |
Effective date: 20190320 |
|
| RIC1 | Information provided on ipc code assigned before grant |
Ipc: G01N 23/223 20060101AFI20190314BHEP |
|
| GRAP | Despatch of communication of intention to grant a patent |
Free format text: ORIGINAL CODE: EPIDOSNIGR1 |
|
| STAA | Information on the status of an ep patent application or granted ep patent |
Free format text: STATUS: GRANT OF PATENT IS INTENDED |
|
| INTG | Intention to grant announced |
Effective date: 20191007 |
|
| GRAJ | Information related to disapproval of communication of intention to grant by the applicant or resumption of examination proceedings by the epo deleted |
Free format text: ORIGINAL CODE: EPIDOSDIGR1 |
|
| GRAJ | Information related to disapproval of communication of intention to grant by the applicant or resumption of examination proceedings by the epo deleted |
Free format text: ORIGINAL CODE: EPIDOSDIGR1 |
|
| STAA | Information on the status of an ep patent application or granted ep patent |
Free format text: STATUS: REQUEST FOR EXAMINATION WAS MADE |
|
| GRAP | Despatch of communication of intention to grant a patent |
Free format text: ORIGINAL CODE: EPIDOSNIGR1 |
|
| STAA | Information on the status of an ep patent application or granted ep patent |
Free format text: STATUS: GRANT OF PATENT IS INTENDED |
|
| INTG | Intention to grant announced |
Effective date: 20191007 |
|
| INTG | Intention to grant announced |
Effective date: 20200107 |
|
| GRAS | Grant fee paid |
Free format text: ORIGINAL CODE: EPIDOSNIGR3 |
|
| GRAA | (expected) grant |
Free format text: ORIGINAL CODE: 0009210 |
|
| STAA | Information on the status of an ep patent application or granted ep patent |
Free format text: STATUS: THE PATENT HAS BEEN GRANTED |
|
| AK | Designated contracting states |
Kind code of ref document: B1 Designated state(s): AL AT BE BG CH CY CZ DE DK EE ES FI FR GB GR HR HU IE IS IT LI LT LU LV MC MK MT NL NO PL PT RO RS SE SI SK SM TR |
|
| REG | Reference to a national code |
Ref country code: CH Ref legal event code: EP |
|
| REG | Reference to a national code |
Ref country code: IE Ref legal event code: FG4D |
|
| REG | Reference to a national code |
Ref country code: DE Ref legal event code: R096 Ref document number: 602016034745 Country of ref document: DE |
|
| REG | Reference to a national code |
Ref country code: AT Ref legal event code: REF Ref document number: 1260787 Country of ref document: AT Kind code of ref document: T Effective date: 20200515 |
|
| REG | Reference to a national code |
Ref country code: NL Ref legal event code: FP |
|
| REG | Reference to a national code |
Ref country code: LT Ref legal event code: MG4D |
|
| PG25 | Lapsed in a contracting state [announced via postgrant information from national office to epo] |
Ref country code: LT Free format text: LAPSE BECAUSE OF FAILURE TO SUBMIT A TRANSLATION OF THE DESCRIPTION OR TO PAY THE FEE WITHIN THE PRESCRIBED TIME-LIMIT Effective date: 20200422 Ref country code: NO Free format text: LAPSE BECAUSE OF FAILURE TO SUBMIT A TRANSLATION OF THE DESCRIPTION OR TO PAY THE FEE WITHIN THE PRESCRIBED TIME-LIMIT Effective date: 20200722 Ref country code: FI Free format text: LAPSE BECAUSE OF FAILURE TO SUBMIT A TRANSLATION OF THE DESCRIPTION OR TO PAY THE FEE WITHIN THE PRESCRIBED TIME-LIMIT Effective date: 20200422 Ref country code: GR Free format text: LAPSE BECAUSE OF FAILURE TO SUBMIT A TRANSLATION OF THE DESCRIPTION OR TO PAY THE FEE WITHIN THE PRESCRIBED TIME-LIMIT Effective date: 20200723 Ref country code: IS Free format text: LAPSE BECAUSE OF FAILURE TO SUBMIT A TRANSLATION OF THE DESCRIPTION OR TO PAY THE FEE WITHIN THE PRESCRIBED TIME-LIMIT Effective date: 20200822 Ref country code: SE Free format text: LAPSE BECAUSE OF FAILURE TO SUBMIT A TRANSLATION OF THE DESCRIPTION OR TO PAY THE FEE WITHIN THE PRESCRIBED TIME-LIMIT Effective date: 20200422 Ref country code: PT Free format text: LAPSE BECAUSE OF FAILURE TO SUBMIT A TRANSLATION OF THE DESCRIPTION OR TO PAY THE FEE WITHIN THE PRESCRIBED TIME-LIMIT Effective date: 20200824 |
|
| REG | Reference to a national code |
Ref country code: AT Ref legal event code: MK05 Ref document number: 1260787 Country of ref document: AT Kind code of ref document: T Effective date: 20200422 |
|
| PG25 | Lapsed in a contracting state [announced via postgrant information from national office to epo] |
Ref country code: RS Free format text: LAPSE BECAUSE OF FAILURE TO SUBMIT A TRANSLATION OF THE DESCRIPTION OR TO PAY THE FEE WITHIN THE PRESCRIBED TIME-LIMIT Effective date: 20200422 Ref country code: HR Free format text: LAPSE BECAUSE OF FAILURE TO SUBMIT A TRANSLATION OF THE DESCRIPTION OR TO PAY THE FEE WITHIN THE PRESCRIBED TIME-LIMIT Effective date: 20200422 Ref country code: LV Free format text: LAPSE BECAUSE OF FAILURE TO SUBMIT A TRANSLATION OF THE DESCRIPTION OR TO PAY THE FEE WITHIN THE PRESCRIBED TIME-LIMIT Effective date: 20200422 Ref country code: BG Free format text: LAPSE BECAUSE OF FAILURE TO SUBMIT A TRANSLATION OF THE DESCRIPTION OR TO PAY THE FEE WITHIN THE PRESCRIBED TIME-LIMIT Effective date: 20200722 |
|
| PG25 | Lapsed in a contracting state [announced via postgrant information from national office to epo] |
Ref country code: AL Free format text: LAPSE BECAUSE OF FAILURE TO SUBMIT A TRANSLATION OF THE DESCRIPTION OR TO PAY THE FEE WITHIN THE PRESCRIBED TIME-LIMIT Effective date: 20200422 |
|
| REG | Reference to a national code |
Ref country code: DE Ref legal event code: R097 Ref document number: 602016034745 Country of ref document: DE |
|
| PG25 | Lapsed in a contracting state [announced via postgrant information from national office to epo] |
Ref country code: IT Free format text: LAPSE BECAUSE OF FAILURE TO SUBMIT A TRANSLATION OF THE DESCRIPTION OR TO PAY THE FEE WITHIN THE PRESCRIBED TIME-LIMIT Effective date: 20200422 Ref country code: DK Free format text: LAPSE BECAUSE OF FAILURE TO SUBMIT A TRANSLATION OF THE DESCRIPTION OR TO PAY THE FEE WITHIN THE PRESCRIBED TIME-LIMIT Effective date: 20200422 Ref country code: EE Free format text: LAPSE BECAUSE OF FAILURE TO SUBMIT A TRANSLATION OF THE DESCRIPTION OR TO PAY THE FEE WITHIN THE PRESCRIBED TIME-LIMIT Effective date: 20200422 Ref country code: SM Free format text: LAPSE BECAUSE OF FAILURE TO SUBMIT A TRANSLATION OF THE DESCRIPTION OR TO PAY THE FEE WITHIN THE PRESCRIBED TIME-LIMIT Effective date: 20200422 Ref country code: AT Free format text: LAPSE BECAUSE OF FAILURE TO SUBMIT A TRANSLATION OF THE DESCRIPTION OR TO PAY THE FEE WITHIN THE PRESCRIBED TIME-LIMIT Effective date: 20200422 Ref country code: ES Free format text: LAPSE BECAUSE OF FAILURE TO SUBMIT A TRANSLATION OF THE DESCRIPTION OR TO PAY THE FEE WITHIN THE PRESCRIBED TIME-LIMIT Effective date: 20200422 Ref country code: RO Free format text: LAPSE BECAUSE OF FAILURE TO SUBMIT A TRANSLATION OF THE DESCRIPTION OR TO PAY THE FEE WITHIN THE PRESCRIBED TIME-LIMIT Effective date: 20200422 Ref country code: CZ Free format text: LAPSE BECAUSE OF FAILURE TO SUBMIT A TRANSLATION OF THE DESCRIPTION OR TO PAY THE FEE WITHIN THE PRESCRIBED TIME-LIMIT Effective date: 20200422 |
|
| PG25 | Lapsed in a contracting state [announced via postgrant information from national office to epo] |
Ref country code: SK Free format text: LAPSE BECAUSE OF FAILURE TO SUBMIT A TRANSLATION OF THE DESCRIPTION OR TO PAY THE FEE WITHIN THE PRESCRIBED TIME-LIMIT Effective date: 20200422 Ref country code: PL Free format text: LAPSE BECAUSE OF FAILURE TO SUBMIT A TRANSLATION OF THE DESCRIPTION OR TO PAY THE FEE WITHIN THE PRESCRIBED TIME-LIMIT Effective date: 20200422 Ref country code: MC Free format text: LAPSE BECAUSE OF FAILURE TO SUBMIT A TRANSLATION OF THE DESCRIPTION OR TO PAY THE FEE WITHIN THE PRESCRIBED TIME-LIMIT Effective date: 20200422 |
|
| PLBE | No opposition filed within time limit |
Free format text: ORIGINAL CODE: 0009261 |
|
| REG | Reference to a national code |
Ref country code: CH Ref legal event code: PL |
|
| STAA | Information on the status of an ep patent application or granted ep patent |
Free format text: STATUS: NO OPPOSITION FILED WITHIN TIME LIMIT |
|
| 26N | No opposition filed |
Effective date: 20210125 |
|
| GBPC | Gb: european patent ceased through non-payment of renewal fee |
Effective date: 20200722 |
|
| REG | Reference to a national code |
Ref country code: BE Ref legal event code: MM Effective date: 20200731 |
|
| PG25 | Lapsed in a contracting state [announced via postgrant information from national office to epo] |
Ref country code: CH Free format text: LAPSE BECAUSE OF NON-PAYMENT OF DUE FEES Effective date: 20200731 Ref country code: LU Free format text: LAPSE BECAUSE OF NON-PAYMENT OF DUE FEES Effective date: 20200701 Ref country code: LI Free format text: LAPSE BECAUSE OF NON-PAYMENT OF DUE FEES Effective date: 20200731 Ref country code: IE Free format text: LAPSE BECAUSE OF NON-PAYMENT OF DUE FEES Effective date: 20200701 Ref country code: GB Free format text: LAPSE BECAUSE OF NON-PAYMENT OF DUE FEES Effective date: 20200722 Ref country code: FR Free format text: LAPSE BECAUSE OF NON-PAYMENT OF DUE FEES Effective date: 20200731 |
|
| PG25 | Lapsed in a contracting state [announced via postgrant information from national office to epo] |
Ref country code: BE Free format text: LAPSE BECAUSE OF NON-PAYMENT OF DUE FEES Effective date: 20200731 Ref country code: SI Free format text: LAPSE BECAUSE OF FAILURE TO SUBMIT A TRANSLATION OF THE DESCRIPTION OR TO PAY THE FEE WITHIN THE PRESCRIBED TIME-LIMIT Effective date: 20200422 |
|
| PG25 | Lapsed in a contracting state [announced via postgrant information from national office to epo] |
Ref country code: TR Free format text: LAPSE BECAUSE OF FAILURE TO SUBMIT A TRANSLATION OF THE DESCRIPTION OR TO PAY THE FEE WITHIN THE PRESCRIBED TIME-LIMIT Effective date: 20200422 Ref country code: MT Free format text: LAPSE BECAUSE OF FAILURE TO SUBMIT A TRANSLATION OF THE DESCRIPTION OR TO PAY THE FEE WITHIN THE PRESCRIBED TIME-LIMIT Effective date: 20200422 Ref country code: CY Free format text: LAPSE BECAUSE OF FAILURE TO SUBMIT A TRANSLATION OF THE DESCRIPTION OR TO PAY THE FEE WITHIN THE PRESCRIBED TIME-LIMIT Effective date: 20200422 |
|
| PG25 | Lapsed in a contracting state [announced via postgrant information from national office to epo] |
Ref country code: MK Free format text: LAPSE BECAUSE OF FAILURE TO SUBMIT A TRANSLATION OF THE DESCRIPTION OR TO PAY THE FEE WITHIN THE PRESCRIBED TIME-LIMIT Effective date: 20200422 |
|
| PGFP | Annual fee paid to national office [announced via postgrant information from national office to epo] |
Ref country code: NL Payment date: 20250613 Year of fee payment: 10 |
|
| PGFP | Annual fee paid to national office [announced via postgrant information from national office to epo] |
Ref country code: DE Payment date: 20250528 Year of fee payment: 10 |