EP3325653B1 - Gene signature for immune therapies in cancer - Google Patents
Gene signature for immune therapies in cancer Download PDFInfo
- Publication number
- EP3325653B1 EP3325653B1 EP16745140.0A EP16745140A EP3325653B1 EP 3325653 B1 EP3325653 B1 EP 3325653B1 EP 16745140 A EP16745140 A EP 16745140A EP 3325653 B1 EP3325653 B1 EP 3325653B1
- Authority
- EP
- European Patent Office
- Prior art keywords
- cancer
- immune checkpoint
- gene
- agonist
- antagonist
- Prior art date
- Legal status (The legal status is an assumption and is not a legal conclusion. Google has not performed a legal analysis and makes no representation as to the accuracy of the status listed.)
- Active
Links
Images


Classifications
-
- C—CHEMISTRY; METALLURGY
- C12—BIOCHEMISTRY; BEER; SPIRITS; WINE; VINEGAR; MICROBIOLOGY; ENZYMOLOGY; MUTATION OR GENETIC ENGINEERING
- C12Q—MEASURING OR TESTING PROCESSES INVOLVING ENZYMES, NUCLEIC ACIDS OR MICROORGANISMS; COMPOSITIONS OR TEST PAPERS THEREFOR; PROCESSES OF PREPARING SUCH COMPOSITIONS; CONDITION-RESPONSIVE CONTROL IN MICROBIOLOGICAL OR ENZYMOLOGICAL PROCESSES
- C12Q1/00—Measuring or testing processes involving enzymes, nucleic acids or microorganisms; Compositions therefor; Processes of preparing such compositions
- C12Q1/68—Measuring or testing processes involving enzymes, nucleic acids or microorganisms; Compositions therefor; Processes of preparing such compositions involving nucleic acids
- C12Q1/6876—Nucleic acid products used in the analysis of nucleic acids, e.g. primers or probes
- C12Q1/6883—Nucleic acid products used in the analysis of nucleic acids, e.g. primers or probes for diseases caused by alterations of genetic material
- C12Q1/6886—Nucleic acid products used in the analysis of nucleic acids, e.g. primers or probes for diseases caused by alterations of genetic material for cancer
-
- G—PHYSICS
- G16—INFORMATION AND COMMUNICATION TECHNOLOGY [ICT] SPECIALLY ADAPTED FOR SPECIFIC APPLICATION FIELDS
- G16H—HEALTHCARE INFORMATICS, i.e. INFORMATION AND COMMUNICATION TECHNOLOGY [ICT] SPECIALLY ADAPTED FOR THE HANDLING OR PROCESSING OF MEDICAL OR HEALTHCARE DATA
- G16H50/00—ICT specially adapted for medical diagnosis, medical simulation or medical data mining; ICT specially adapted for detecting, monitoring or modelling epidemics or pandemics
- G16H50/30—ICT specially adapted for medical diagnosis, medical simulation or medical data mining; ICT specially adapted for detecting, monitoring or modelling epidemics or pandemics for calculating health indices; for individual health risk assessment
-
- C—CHEMISTRY; METALLURGY
- C12—BIOCHEMISTRY; BEER; SPIRITS; WINE; VINEGAR; MICROBIOLOGY; ENZYMOLOGY; MUTATION OR GENETIC ENGINEERING
- C12Q—MEASURING OR TESTING PROCESSES INVOLVING ENZYMES, NUCLEIC ACIDS OR MICROORGANISMS; COMPOSITIONS OR TEST PAPERS THEREFOR; PROCESSES OF PREPARING SUCH COMPOSITIONS; CONDITION-RESPONSIVE CONTROL IN MICROBIOLOGICAL OR ENZYMOLOGICAL PROCESSES
- C12Q2600/00—Oligonucleotides characterized by their use
- C12Q2600/106—Pharmacogenomics, i.e. genetic variability in individual responses to drugs and drug metabolism
-
- C—CHEMISTRY; METALLURGY
- C12—BIOCHEMISTRY; BEER; SPIRITS; WINE; VINEGAR; MICROBIOLOGY; ENZYMOLOGY; MUTATION OR GENETIC ENGINEERING
- C12Q—MEASURING OR TESTING PROCESSES INVOLVING ENZYMES, NUCLEIC ACIDS OR MICROORGANISMS; COMPOSITIONS OR TEST PAPERS THEREFOR; PROCESSES OF PREPARING SUCH COMPOSITIONS; CONDITION-RESPONSIVE CONTROL IN MICROBIOLOGICAL OR ENZYMOLOGICAL PROCESSES
- C12Q2600/00—Oligonucleotides characterized by their use
- C12Q2600/158—Expression markers
Definitions
- the present invention relates to a molecular diagnostic test useful for diagnosing cancers from different anatomical sites that includes the use of an immune response subtype associated with DNA damage.
- the invention includes the use of a 44-gene classification model to identify this immune response associated with DNA damage repair deficiency molecular subtype.
- One application is the stratification of response to, and selection of patients for therapeutic drug classes, including antagonists of an inhibitory immune checkpoint and/or agonists of a stimulatory immune checkpoint.
- Another application is the stratification of cancer patients into those that respond and those that do not respond to antagonists of an inhibitory immune checkpoint and/or agonists of a stimulatory immune checkpoint.
- the present invention provides a test that can guide conventional therapy selection as well as selecting patient groups for enrichment strategies during clinical trial evaluation of novel therapeutics.
- Cancer subtypes with activation of the innate immune pathway STING/TBK1/IRF3 can be identified from fresh/frozen (FF) or formalin fixed paraffin embedded (FFPE) patient samples.
- Standard chemotherapy typically includes direct DNA damaging agents such as anthracyclines and alkylating agents as well as anti-metabolites and anti-microtubule agents.
- Ovarian cancer is the leading cause of death among all gynecological cancers in western countries. This high death rate is due to the diagnosis at an advanced stage in most patients.
- Epithelial ovarian cancer (EOC) constitutes 90% of ovarian malignancies and is classified into distinct histologic categories including serous, mucinous, endometrioid, clear cell, transitional, mixed, and undifferentiated subtypes. There is increasing evidence that these histologies arise from different etiologies.
- the current standard treatment for ovarian cancer is debulking surgery and standard platinum taxane - based cytotoxic chemotherapy. However, not all patients respond to this, and of those that do, approximately 70% will experience a recurrence.
- Specific targeted therapies for ovarian cancer based on histological or molecular classification have not yet reached the marketplace. Similarly for other types of cancer, there is still no accurate way of selecting appropriate cytotoxic chemotherapeutic agents.
- microarrays and molecular genomics have the potential for a significant impact on the diagnostic capability and prognostic classification of disease, which may aid in the prediction of the response of an individual patient to a defined therapeutic regimen.
- Microarrays provide for the analysis of large amounts of genomic information, thereby providing a genomic fingerprint of an individual. There is much enthusiasm that this is one of the molecular technologies that will provide the necessary tools for custom-made drug treatment regimens.
- breast tumors that do not express the estrogen and progesterone hormone receptors as well as the HER2 growth factor receptor appear to be responsive to PARP-1 inhibitor therapy ( Linn, S. C., and Van 't Veer, L., J. Eur J Cancer 45 Suppl 1, 11-26 (2009 ); O'Shaughnessy, J., et al. N Engl J Med 364, 205-214 (2011 ).
- triple negative status of a breast tumor may indicate responsiveness to combination therapy including PARP-1 inhibitors, but may not be sufficient to indicate responsiveness to individual PARP-1 inhibitors.(O'Shaughnessy et al., 2011).
- the immune checkpoint is not the PD1/PDL1 (referred to interchangeably as PD-1 and PD-L1 respectively throughout the disclosure) checkpoint.
- the antagonist of an inhibitory immune checkpoint is not pembrolizumab.
- the invention is based on the elucidation of the mechanism of immune response associated with DNA damage repair deficient (DDRD) tumours.
- DNA damage repair deficient (DDRD) tumours activate the immune pathway STING/TBK1/IRF3 resulting in the production of chemokines.
- the invention is in part directed to methods of using a collection of gene expression markers in cancer such that when some or all of the transcripts are over or under-expressed, they identify a subtype of cancer that displays an innate immune response which is associated with a deficiency in DNA damage repair. Designation of this subtype can be considered as a diagnostic test as it is not related to any specific drug but rather describes the biology of the cancer in a manner that has utility in screening and selecting appropriate cancer therapies.
- the invention also provides methods for indicating responsiveness or resistance to therapies including antagonists of an inhibitory immune checkpoint and/or agonists of a stimulatory immune checkpoint, optionally in combination with DNA-damage therapeutic agents.
- this gene or gene product list may form the basis of a single parameter or a multiparametric predictive test that could be delivered using methods known in the art such as microarray, nucleic acid amplification (e.g. Q-PCR), sequencing (including next generation sequencing and RNAseq), immunohistochemistry, ELISA or other technologies that can quantify mRNA expression.
- the biological pathway described herein is a feature of cancer itself, similar to grade and stage, and as such, is not limited to a single cancer disease type. Therefore, the collection of genes or gene products may be used to predict responsiveness of cancer therapeutics across different cancer types in different tissues. In one embodiment of the invention, these genes or gene products are useful for evaluating both breast and ovarian cancer tumors.
- the invention described herein is not limited to any one drug; it can be used to identify responders and non-responders to any of a range of drugs that represent antagonists of an inhibitory immune checkpoint and/or agonists of a stimulatory immune checkpoint. Examples are provided herein.
- Such drugs may be administered in combination with drugs that directly or indirectly affect DNA damage and/or DNA damage repair e.g. neoadjuvant 5-fluorouracil, anthracycline and cyclophosphamide based regimens such as FEC (5-fluorouracil/epirubicin/cyclophosphamide) and FAC (5-fluorouracil/Adriamycin/cyclophosphamide).
- the present invention relates to prediction of response to drugs using different classifications of response, such as overall survival, progression free survival, radiological response, as defined by RECIST, complete response, partial response, stable disease and serological markers such as, but not limited to, PSA, CEA, CA125, CA15-3 and CA19-9.
- the present invention relates to the identification of an innate immune response associated with a DNA damage response deficiency (DDRD) molecular subtype in cancer.
- DDRD DNA damage response deficiency
- This molecular subtype can, inter alia, be detected by the use of two different gene classifiers - one comprising of 40 genes and the other comprising of 44 genes.
- the DDRD classifier was first defined by a classifier consisting of 53 probesets on the Almac Breast Disease Specific Array (DSATM).
- the classifier needed to be re-defined at a gene level. This would facilitate evaluation of the DDRD classifier using microarray data from independent datasets that were profiled on microarray platforms other than the Almac Breast DSATM.
- the genes to which the Almac Breast DSATM probesets map to needed to be defined This involved the utilization of publicly available genome browser databases such as Ensembl and NCBI Reference Sequence. Results are provided only for the 44-gene DDRD classifier model, as this model supersedes that of the 40-gene DDRD classifier model. These results demonstrate that the classifier model is an effective and significant predictor of response to chemotherapy regimens that contain DNA damaging therapeutics.
- the identification of the subtype by both the 40-gene classifier model and the 44-gene classifier model can be used to predict response to, and select patients for, cancer therapeutic drug classes, in particular antagonists of an inhibitory immune checkpoint and/or agonists of a stimulatory immune checkpoint optionally in combination with DNA damage causing agents and DNA repair targeted therapies.
- kits for conventional diagnostic uses listed above such as qPCR, microarray, sequencing (e.g. RNAseq) and immunoassays such as immunohistochemistry, ELISA, Western blot and the like.
- Such kits include appropriate reagents and directions to assay the expression of the genes or gene products and quantify mRNA or protein expression.
- the invention also provides methods for identifying DNA damage response-deficient (DDRD) human tumors having an increased immune response. It is likely that this invention can be used to identify patients that are sensitive to and respond to, or are resistant to and do not respond to, drugs that influence immune checkpoints, such as antagonists of an inhibitory immune checkpoint and/or agonists of a stimulatory immune checkpoint. These drugs may be combined with drugs that damage DNA directly, damage DNA indirectly or inhibit normal DNA damage signaling and/or repair processes.
- DDRD DNA damage response-deficient
- the invention also relates to guiding conventional treatment of patients.
- the invention also relates to selecting patients for clinical trials where novel drugs of the classes that agonise or antagonize specific immune checkpoints.
- the present invention and methods accommodate the use of archived formalin fixed paraffin-embedded (FFPE) biopsy material, as well as fresh/frozen (FF) tissue, for assay of all transcripts in the invention, and are therefore compatible with the most widely available type of biopsy material.
- the expression level may be determined using RNA obtained from FFPE tissue, fresh frozen tissue or fresh tissue that has been stored in solutions such as RNAlater®.
- the invention provides a method for predicting responsiveness to an antagonist of an inhibitory immune checkpoint and/or an agonist of a stimulatory immune checkpoint, comprising: determining the RNA expression level of at least one gene selected from Table 2B in a sample comprising cancer cells or nucleic acids derived therefrom from the subject wherein the determined RNA expression level is used to identify the subject as having a cancer in which the STING/TBK1/IRF3 pathway is activated due to a deficiency in DNA damage repair and thereby predict responsiveness to an antagonist of an inhibitory immune checkpoint and/or an agonist of a stimulatory immune checkpoint.
- the RNA expression level of one or more additional genes may also be determined and used to predict responsiveness to an antagonist of an inhibitory immune checkpoint and/or an agonist of a stimulatory immune checkpoint.
- an increased RNA expression level of the at least one gene may predict responsiveness to an antagonist of an inhibitory immune checkpoint and/or an agonist of a stimulatory immune checkpoint.
- the methods may comprise determining the RNA expression level of at least 2 of the genes and the determined RNA expression levels may be used to generate a combined test score, wherein a positive combined test score (generally above threshold, but may be equal to or above threshold) predicts responsiveness to an antagonist of an inhibitory immune checkpoint and/or an agonist of a stimulatory immune checkpoint.
- a positive combined test score generally above threshold, but may be equal to or above threshold
- the methods may comprise: deriving a combined test score that captures the RNA expression levels; providing a threshold score comprising information correlating the combined test score and responsiveness; and comparing the combined test score to the threshold score; wherein responsiveness is predicted when the combined test score exceeds the threshold score.
- the methods may comprise determining the RNA expression level of at least 6 genes, at least 7 genes, at least 8 genes, at least 9 genes, at least 10 genes, at least 11 genes, at least 12 genes, at least 13 genes, at least 14 genes, at least 15 genes, at least 16 genes, at least 17 genes, at least 18 genes, at least 19 genes, at least 20 genes, at least 21 genes, at least 22 genes, at least 23 genes, at least 24 genes, at least 25 genes, at least 26 genes, at least 27 genes, at least 28 genes, at least 29 genes, at least 30 genes, at least 31 genes, at least 32 genes, at least 33 genes, at least 34 genes, at least 35 genes, at least 36 genes, at least 37 genes, at least 38 genes, at least 39 genes, at least 40 genes, at least 41 genes, at least 42 genes, or at least 43 genes, selected from CXCL10, MX1, IDO1, IFI44L, CD2, GBP5, PRAME, ITGAL, LRP4, APOL3, CDR1, FYB, TSPAN7, RAC2,
- the methods may comprise determining the RNA expression level of at least 1 gene selected from CD2, ITGAL, PTPRC, CXCL10 and IDO1, together with at least 1 further gene, at least 2 further genes, at least 3 further genes, at least 4 further genes, at least 5 further genes, at least 6 further genes, at least 7 further genes, at least 8 further genes, at least 9 further genes, at least 10 further genes, at least 11 further genes, at least 12 further genes, at least 13 further genes, at least 14 further genes, at least 15 further genes, at least 16 further genes, at least 17 further genes, at least 18 further genes, at least 19 further genes, at least 20 further genes, at least 21 further genes, at least 22 further genes, at least 23 further genes, at least 24 further genes, at least 25 further genes, at least 26 further genes, at least 27 further genes, at least 28 further genes, at least 29 further genes, at least 30 further genes, at least 31 further genes, at least 32 further genes, at least 33 further genes, at least 34 further genes, at least 35 further genes, at least 36 further genes,
- the methods comprise determining the RNA expression level of at least 1 gene selected from CD2, ITGAL, PTPRC, CXCL10 and IDO1, together with each of MX1, IFI44L, GBP5, PRAME, LRP4, APOL3, CDR1, FYB, TSPAN7, RAC2, KLHDC7B, GRB14, AC138128.1, KIF26A, CD274, CD109, ETV7, MFAP5, OLFM4, PI15, FOSB, FAM19A5, NLRC5, PRICKLE1, EGR1, CLDN10, ADAMTS4, SP140L, ANXA1, RSAD2, ESR1, IKZF3, OR2I1P, EGFR, NAT1, LATS2, CYP2B6, PPP1R1A, and AL137218.1.
- the methods may comprise determining the RNA expression level of at least 2 genes selected from CD2, ITGAL, PTPRC, CXCL10 and IDO1, together with at least 1 further gene, at least 2 further genes, at least 3 further genes, at least 4 further genes, at least 5 further genes, at least 6 further genes, at least 7 further genes, at least 8 further genes, at least 9 further genes, at least 10 further genes, at least 11 further genes, at least 12 further genes, at least 13 further genes, at least 14 further genes, at least 15 further genes, at least 16 further genes, at least 17 further genes, at least 18 further genes, at least 19 further genes, at least 20 further genes, at least 21 further genes, at least 22 further genes, at least 23 further genes, at least 24 further genes, at least 25 further genes, at least 26 further genes, at least 27 further genes, at least 28 further genes, at least 29 further genes, at least 30 further genes, at least 31 further genes, at least 32 further genes, at least 33 further genes, at least 34 further genes, at least 35 further genes, at least 36 further genes,
- the methods comprise determining the RNA expression level of at least 2 genes selected from CD2, ITGAL, PTPRC, CXCL10 and IDO1, together with each of MX1, IFI44L, GBP5, PRAME, LRP4, APOL3, CDR1, FYB, TSPAN7, RAC2, KLHDC7B, GRB14, AC138128.1, KIF26A, CD274, CD109, ETV7, MFAP5, OLFM4, PI15, FOSB, FAM19A5, NLRC5, PRICKLE1, EGR1, CLDN10, ADAMTS4, SP140L, ANXA1, RSAD2, ESR1, IKZF3, OR2I1P, EGFR, NAT1, LATS2, CYP2B6, PPP1R1A, and AL137218.1.
- the methods may comprise determining the RNA expression level of at least 3 genes selected from CD2, ITGAL, PTPRC, CXCL10 and IDO1, together with at least 1 further gene, at least 2 further genes, at least 3 further genes, at least 4 further genes, at least 5 further genes, at least 6 further genes, at least 7 further genes, at least 8 further genes, at least 9 further genes, at least 10 further genes, at least 11 further genes, at least 12 further genes, at least 13 further genes, at least 14 further genes, at least 15 further genes, at least 16 further genes, at least 17 further genes, at least 18 further genes, at least 19 further genes, at least 20 further genes, at least 21 further genes, at least 22 further genes, at least 23 further genes, at least 24 further genes, at least 25 further genes, at least 26 further genes, at least 27 further genes, at least 28 further genes, at least 29 further genes, at least 30 further genes, at least 31 further genes, at least 32 further genes, at least 33 further genes, at least 34 further genes, at least 35 further genes, at least 36 further genes,
- the methods comprise determining the RNA expression level of at least 3 genes selected from CD2, ITGAL, PTPRC, CXCL10 and IDO1, together with each of MX1, IFI44L, GBP5, PRAME, LRP4, APOL3, CDR1, FYB, TSPAN7, RAC2, KLHDC7B, GRB14, AC138128.1, KIF26A, CD274, CD109, ETV7, MFAP5, OLFM4, PI15, FOSB, FAM19A5, NLRC5, PRICKLE1, EGR1, CLDN10, ADAMTS4, SP140L, ANXA1, RSAD2, ESR1, IKZF3, OR2I1P, EGFR, NAT1, LATS2, CYP2B6, PPP1R1A, and AL137218.1.
- the methods may comprise determining the RNA expression level of at least 4 genes selected from CD2, ITGAL, PTPRC, CXCL10 and IDO1, together with at least 1 further gene, at least 2 further genes, at least 3 further genes, at least 4 further genes, at least 5 further genes, at least 6 further genes, at least 7 further genes, at least 8 further genes, at least 9 further genes, at least 10 further genes, at least 11 further genes, at least 12 further genes, at least 13 further genes, at least 14 further genes, at least 15 further genes, at least 16 further genes, at least 17 further genes, at least 18 further genes, at least 19 further genes, at least 20 further genes, at least 21 further genes, at least 22 further genes, at least 23 further genes, at least 24 further genes, at least 25 further genes, at least 26 further genes, at least 27 further genes, at least 28 further genes, at least 29 further genes, at least 30 further genes, at least 31 further genes, at least 32 further genes, at least 33 further genes, at least 34 further genes, at least 35 further genes, at least 36 further genes,
- the methods comprise determining the RNA expression level of at least 4 genes selected from CD2, ITGAL, PTPRC, CXCL10 and IDO1, together with each of MX1, IFI44L, GBP5, PRAME, LRP4, APOL3, CDR1, FYB, TSPAN7, RAC2, KLHDC7B, GRB14, AC138128.1, KIF26A, CD274, CD109, ETV7, MFAP5, OLFM4, PI15, FOSB, FAM19A5, NLRC5, PRICKLE1, EGR1, CLDN10, ADAMTS4, SP140L, ANXA1, RSAD2, ESR1, IKZF3, OR2I1P, EGFR, NAT1, LATS2, CYP2B6, PPP1R1A, and AL137218.1.
- the methods may comprise determining the RNA expression level of each of CD2, ITGAL, PTPRC, CXCL10 and IDO1, together with at least 1 further gene, at least 2 further genes, at least 3 further genes, at least 4 further genes, at least 5 further genes, at least 6 further genes, at least 7 further genes, at least 8 further genes, at least 9 further genes, at least 10 further genes, at least 11 further genes, at least 12 further genes, at least 13 further genes, at least 14 further genes, at least 15 further genes, at least 16 further genes, at least 17 further genes, at least 18 further genes, at least 19 further genes, at least 20 further genes, at least 21 further genes, at least 22 further genes, at least 23 further genes, at least 24 further genes, at least 25 further genes, at least 26 further genes, at least 27 further genes, at least 28 further genes, at least 29 further genes, at least 30 further genes, at least 31 further genes, at least 32 further genes, at least 33 further genes, at least 34 further genes, at least 35 further genes, at least 36 further genes, at least 37 further
- the methods may comprise determining the RNA expression level of at least 12 genes selected from Table 1.
- the methods may comprise determining the RNA expression level of at least 1 gene selected from CD2, ITGAL, PTPRC, CXCL10, IDO1, CD3D, HLA-DPB1, CXCL9, CCL5, STAT1, IL2RG, CD3E, IRF1, IKZF3 and IGJ together with at least one further gene selected from (the remaining genes in) Table 1 or together with at least one further gene from the (remaining genes in) Table 2B (the 44 gene panel).
- the methods may comprise determining the RNA expression level of each of:
- weight values for each gene may be as set out in Table 2B or the weight and/or bias values for each gene may be as set out in any one of Tables 3-45.
- the methods may comprise determining the RNA expression level of at least one, up to all, of CCL5, CXCL9 and CXCL10 together with at least one further gene selected from (the remaining genes in) Table 1 or together with at least one further gene from the (remaining genes in) Table 2B (the 44 gene panel).
- the invention provides a method for predicting responsiveness to an antagonist of an inhibitory immune checkpoint and/or an agonist of a stimulatory immune checkpoint in combination with a DNA damage therapeutic agent comprising: determining the RNA expression level of at least one gene selected from Table 2Bin a sample comprising cancer cells or nucleic acids derived therefrom from the subject wherein the determined RNA expression level is used to identify the subject as having a cancer in which the STING/TBK1/IRF3 pathway is activated due to a deficiency in DNA damage repair and thereby predict responsiveness to an antagonist of an inhibitory immune checkpoint and/or an agonist of a stimulatory immune checkpoint in combination with a DNA damage therapeutic agent.
- the determined RNA expression level can be used to predict responsiveness to the simultaneous, separate or sequential administration (or use) of an antagonist of an inhibitory immune checkpoint and/or an agonist of a stimulatory immune checkpoint in combination with a DNA damage therapeutic agent
- an increased RNA expression level of the at least one gene may predict responsiveness to a an antagonist of an inhibitory immune checkpoint and/or an agonist of a stimulatory immune checkpoint in combination with a DNA damage therapeutic agent.
- the methods may comprise determining the RNA expression level of at least 2 of the genes and the determined RNA expression levels may be used to generate a combined test score, wherein a positive combined test score (generally above threshold, but may be equal to or above threshold) predicts responsiveness to an antagonist of an inhibitory immune checkpoint and/or an agonist of a stimulatory immune checkpoint in combination with a DNA damage therapeutic agent.
- a positive combined test score generally above threshold, but may be equal to or above threshold
- the methods for predicting responsiveness to an antagonist of an inhibitory immune checkpoint and/or an agonist of a stimulatory immune checkpoint in combination with a DNA damage therapeutic agent may comprise determining the RNA expression level of any of the genes or sets of genes described herein.
- the invention provides a method for identifying a cancer that can be effectively treated with an antagonist of an inhibitory immune checkpoint and/or an agonist of a stimulatory immune checkpoint comprising: determining the RNA expression level of at least one gene selected from Table 2B in a sample comprising cancer cells or nucleic acids derived therefrom from the subject wherein the determined RNA expression level is used to identify the subject as having a cancer in which the STING/TBK1/IRF3 pathway is activated due to a deficiency in DNA damage repair and thereby identify a cancer that can be effectively treated with an antagonist of an inhibitory immune checkpoint and/or an agonist of a stimulatory immune checkpoint.
- an increased RNA expression level of the at least one gene may identify a cancer that can be effectively treated with an antagonist of an inhibitory immune checkpoint and/or an agonist of a stimulatory immune checkpoint.
- the methods may comprise determining the RNA expression level of at least 2 genes and the determined RNA expression levels may be used to generate a combined test score, wherein a positive combined test score (generally above threshold, but may be equal to or above threshold) identifies a cancer that can be effectively treated with an antagonist of an inhibitory immune checkpoint and/or an agonist of a stimulatory immune checkpoint.
- a positive combined test score generally above threshold, but may be equal to or above threshold
- the methods may comprise: deriving a combined test score that captures the RNA expression levels; providing a threshold score comprising information correlating the combined test score and responsiveness; and comparing the combined test score to the threshold score; wherein a cancer that can be effectively treated is identified when the combined test score exceeds the threshold score.
- the methods for identifying a cancer that can be effectively treated with an antagonist of an inhibitory immune checkpoint and/or an agonist of a stimulatory immune checkpoint may comprise determining the RNA expression level of any of the genes or sets of genes described herein.
- the invention provides a method for identifying a cancer that can be effectively treated with an antagonist of an inhibitory immune checkpoint and/or an agonist of a stimulatory immune checkpoint in combination with a DNA damage therapeutic agent comprising: determining the RNA expression level of at least one gene selected from Table 2B in a sample comprising cancer cells or nucleic acids derived therefrom from the subject wherein the determined RNA expression level is used to identify the subject as having a cancer in which the STING/TBK1/IRF3 pathway is activated due to a deficiency in DNA damage repair and thereby identify a cancer that can be effectively treated with an antagonist of an inhibitory immune checkpoint and/or an agonist of a stimulatory immune checkpoint in combination with a DNA damage therapeutic agent.
- the determined RNA expression level can be used to identify a cancer that can be effectively treated with the simultaneous, separate or sequential administration (or use) of an antagonist of an inhibitory immune checkpoint and/or an agonist of a stimulatory immune checkpoint in combination with a DNA damage therapeutic agent.
- an increased RNA expression level of the at least one gene may identify a cancer that can be effectively treated with an antagonist of an inhibitory immune checkpoint and/or an agonist of a stimulatory immune checkpoint in combination with a DNA damage therapeutic agent.
- the methods may comprise determining the RNA expression level of at least 2 of the genes and the determined RNA expression levels may be used to generate a combined test score, wherein a positive combined test score (generally above threshold, but may be equal to or above threshold) identifies a cancer that can be effectively treated with an antagonist of an inhibitory immune checkpoint and/or an agonist of a stimulatory immune checkpoint in combination with a DNA damage therapeutic agent.
- a positive combined test score generally above threshold, but may be equal to or above threshold
- the methods for identifying a cancer that can be effectively treated with an antagonist of an inhibitory immune checkpoint and/or an agonist of a stimulatory immune checkpoint in combination with a DNA damage therapeutic agent may comprise determining the RNA expression level of any of the genes or sets of genes described herein.
- the invention provides a method for selecting treatment for a cancer comprising: determining the RNA expression level of at least one gene selected from Table 2B in a sample comprising cancer cells or nucleic acids derived therefrom from the subject wherein the determined RNA expression level is used to identify the subject as having a cancer in which the STING/TBK1/IRF3 pathway is activated due to a deficiency in DNA damage repair and thereby select an antagonist of an inhibitory immune checkpoint and/or an agonist of a stimulatory immune checkpoint for use in treatment of the cancer.
- an increased RNA expression level of the at least one gene is used to select an antagonist of an inhibitory immune checkpoint and/or an agonist of a stimulatory immune checkpoint for use in treatment of the cancer.
- the methods may comprise determining the RNA expression level of at least 2 of the genes and the determined RNA expression levels may be used to generate a combined test score, wherein a positive combined test score (generally above threshold, but may be equal to or above threshold) is used to select an antagonist of an inhibitory immune checkpoint and/or an agonist of a stimulatory immune checkpoint for use in treatment of the cancer.
- a positive combined test score generally above threshold, but may be equal to or above threshold
- the methods described herein may further comprise treating the cancer using the selected antagonist and/or agonist.
- the methods may comprise: deriving a combined test score that captures the RNA expression levels; providing a threshold score comprising information correlating the combined test score and responsiveness; and comparing the combined test score to the threshold score; wherein an antagonist of an inhibitory immune checkpoint and/or an agonist of a stimulatory immune checkpoint is selected for use when the combined test score exceeds the threshold score.
- the methods for selecting treatment for a cancer may comprise determining the RNA expression level of any of the genes or sets of genes described herein.
- the invention provides a method for selecting treatment for a cancer comprising: determining the RNA expression level of at least one gene selected from Table 2Bin a sample comprising cancer cells or nucleic acids derived therefrom from the subject wherein the determined RNA expression level is used to identify the subject as having a cancer in which the STING/TBK1/IRF3 pathway is activated due to a deficiency in DNA damage repair and thereby select an antagonist of an inhibitory immune checkpoint and/or an agonist of a stimulatory immune checkpoint, in combination with a DNA damage therapeutic agent, for use in treatment of the cancer.
- the determined RNA expression level can be used to select an antagonist of an inhibitory immune checkpoint and/or an agonist of a stimulatory immune checkpoint, in combination with a DNA damage therapeutic agent, for simultaneous, separate or sequential use in treatment of the cancer.
- an increased RNA expression level of the at least one gene may be used to select an antagonist of an inhibitory immune checkpoint and/or an agonist of a stimulatory immune checkpoint, in combination with a DNA damage therapeutic agent, for use in treatment of the cancer.
- the methods may comprise determining the RNA expression level of at least 2 of the genes and the determined RNA expression levels may be used to generate a combined test score, wherein a positive combined test score (generally above threshold, but may be equal to or above threshold) is used to select an antagonist of an inhibitory immune checkpoint and/or an agonist of a stimulatory immune checkpoint, in combination with a DNA damage therapeutic agent, for use in treatment of the cancer.
- a positive combined test score generally above threshold, but may be equal to or above threshold
- the methods described herein may comprise treating the cancer using the selected modulator, such as antagonist and/or agonist, in combination with a DNA damage therapeutic agent.
- the selected modulator such as antagonist and/or agonist
- the methods may comprise: deriving a combined test score that captures the RNA expression levels; providing a threshold score comprising information correlating the combined test score and responsiveness; and comparing the combined test score to the threshold score; wherein an antagonist of an inhibitory immune checkpoint and/or an agonist of a stimulatory immune checkpoint in combination with a DNA damage therapeutic agent is selected for use when the combined test score exceeds the threshold score.
- the combined test score may be derived using the RNA expression level(s) of any of the genes or groups of genes described herein.
- the combined test score may be derived using the RNA expression level of one or more additional genes.
- Described herein is a method of treating cancer comprising administration of a modulator of an immune checkpoint, such as an antagonist of an inhibitory immune checkpoint and/or an agonist of a stimulatory immune checkpoint to a subject, characterised in that a sample from the subject, prior to administration, displays a positive combined test score derived from the determined expression levels of at least 2 genes from Table 2B, 2A or 1 or an increased level of expression of at least 1 gene from Table 2B, 2A or 1.
- a modulator of an immune checkpoint such as an antagonist of an inhibitory immune checkpoint and/or an agonist of a stimulatory immune checkpoint
- Described herein is a method of treating cancer comprising administration of a modulator of an immune checkpoint, such as an antagonist of an inhibitory immune checkpoint and/or an agonist of a stimulatory immune checkpoint, in combination with a DNA damage therapeutic agent, to a subject, characterised in that a sample from the subject, prior to administration, displays a positive combined test score derived from the determined expression levels of at least 2 genes from Table 2B, 2A or 1 or an increased level of expression of at least 1 gene from Table 2B, 2A or 1.
- the a modulator of an immune checkpoint, such as antagonist of an inhibitory immune checkpoint and/or the agonist of a stimulatory immune checkpoint, and the DNA damage therapeutic agent can be administered simultaneously, separately or sequentially to the subject,
- the methods of treating cancer described herein may comprise determining the expression level of any of the genes or sets of genes described herein.
- the invention provides an antagonist of an inhibitory immune checkpoint and/or an agonist of a stimulatory immune checkpoint for use in the treatment of cancer in a subject wherein, prior to administration of the antagonist and/or agonist, a sample comprising cancer cells or nucleic acids derived therefrom from the subject displays:
- the invention provides an antagonist of an inhibitory immune checkpoint and/or an agonist of a stimulatory immune checkpoint for use in the treatment of cancer in a subject wherein, prior to administration of the antagonist and/or agonist, a sample comprising cancer cells or nucleic acids derived therefrom from the subject displays:
- the invention provides an antagonist of an inhibitory immune checkpoint in combination with a DNA damage therapeutic agent and/or an agonist of a stimulatory immune checkpoint in combination with a DNA damage therapeutic agent for use in the treatment of cancer in a subject wherein, prior to administration of the antagonist and/or agonist and DNA damage therapeutic agent, a sample comprising cancer cells or nucleic acids derived therefrom from the subject displays:
- RNA expression level may be any of the genes or sets of genes described herein.
- the subject may be selected for treatment according to any of the methods described herein.
- the sample may comprise cancer cells.
- the sample may be a tissue sample e.g. a fixed and embedded tissue sample.
- the cancer may be selected from leukemia, brain cancer, prostate cancer, liver cancer, ovarian cancer, stomach cancer, colorectal cancer, throat cancer, breast cancer, skin cancer, melanoma, lung cancer, sarcoma, cervical cancer, testicular cancer, bladder cancer, endocrine cancer, endometrial cancer, esophageal cancer, glioma, lymphoma, neuroblastoma, osteosarcoma, pancreatic cancer, pituitary cancer, renal cancer or head and neck cancer.
- the inhibitory immune checkpoint may be a regulatory pathway, or a molecule in such a pathway, that inhibits an immune response.
- the inhibitory immune checkpoint may be a polypeptide expressed by B-cells and/or T-cells.
- the inhibitory immune checkpoint may be an inhibitory receptor.
- the inhibitory immune checkpoint may be a membrane receptor.
- the inhibitory immune checkpoint is an inhibitory membrane receptor.
- the ligand of the inhibitory immune checkpoint may be membrane bound or soluble.
- the inhibitory immune checkpoint may be selected from A2AR, B7-H3 (CD276), B7-H4 (VTCN1), BTLA (CD272), CTLA-4 (CD152), IDO, KIR, LAG3, PD-1/PD-L1, TIM-3 and VISTA. In some embodiments, the inhibitory immune checkpoint is not PD-1/PD-L1. In some embodiments, the immune checkpoint is IDO.
- the antagonist of an inhibitory immune checkpoint may amplify an antigen-specific B-cell and/or T-cell response.
- the antagonist of an inhibitory immune checkpoint may inhibit the interaction between an inhibitory receptor and its ligand.
- the antagonist of an inhibitory immune checkpoint may be selected from an antibody and an inhibitory nucleic acid molecule.
- the antibody may be of monoclonal or polyclonal origin. Fragments and derivative antibodies may also be utilised, to include without limitation Fab fragments, ScFv, single domain antibodies, nanoantibodies, heavy chain antibodies, aptamers etc. which retain peptide-specific binding function and these are included in the definition of "antibody". Such antibodies are useful in the practice of the invention. Methods for generating specific antibodies are known to those skilled in the art. Antibodies may be of human or non-human origin (e.g. rodent, such as rat or mouse) and be humanized etc. according to known techniques ( Jones et al., Nature (1986) May 29-Jun.
- the inhibitory nucleic acid molecule may be single stranded or double stranded.
- inhibitory nucleic acid molecules include antisense nucleic acid, RNAi, siRNA, shRNA, miRNA, shmiRNA, or derivatives or pre-cursors thereof.
- the antagonist of an inhibitory immune checkpoint may be selected from MGA271 (targets B7-H3), ipilimumab (Yervoy - targets CTLA-4), indoximod (targets IDO pathway), NLG919 (targets IDO pathway), lirilumab (targets KIR), IMP321 (targets LAG3), BMS-986016 (targets LAG3), CT-011 (PD-1 blockade), nivolumab/BMS-936558 (PD-1 blockade), BMS-936559 (PDL1 blockade) and pembrolizumab (Keytruda - targets PD-1).
- the antagonist is not pembrolizumab.
- Further antagonists include MGB453 (targets TIM-3), LAG525 (targets LAG-3) and PDR001 (PD1 Blockade).
- the stimulatory immune checkpoint may be a regulatory pathway, or a molecule in such a pathway, that activates an immune response.
- the stimulatory immune checkpoint may be a polypeptide expressed by B-cells and/or T-cells.
- the stimulatory immune checkpoint may be a membrane receptor.
- the stimulatory immune checkpoint may be a co-stimulatory receptor.
- the co-stimulatory receptor may be a T-cell co-stimulatory receptor or a B-cell co-stimulatory receptor.
- the ligand of the stimulatory immune checkpoint may be membrane bound or soluble.
- the stimulatory immune checkpoint may be selected from CD27, CD28, CD40, CD122, CD137, OX40, GITR and ICOS.
- the agonist of a stimulatory immune checkpoint may amplify an antigen-specific B-cell and/or T-cell response.
- the agonist of a stimulatory immune checkpoint may increase the interaction between a co-stimulatory receptor and its ligand.
- the agonist of a stimulatory immune checkpoint may comprise a ligand molecule that binds to a (co-)stimulatory receptor.
- the agonist of a stimulatory immune checkpoint may be selected from an antibody (as described herein), a lipocalin and a cytokine.
- the lipocalin may be a molecule that incorporates a lipocalin, or a fragment or derivative of a lipocalin. Such molecules which retain the function of acting as an agonist of a stimulatory immune checkpoint are included in the definition of "lipocalin".
- the cytokine may be a molecule that incorporates a cytokine, or a fragment or derivative of a cytokine. Such molecules which retain the function of acting as an agonist of a stimulatory immune checkpoint are included in the definition of "cytokine".
- the agonist of a stimulatory immune checkpoint may be selected from CDX-1127 (agonist of CD27), NKTR-214 (agonist of CD122), BMS-663513 (agonist of CD137), TRX518 (agonist of GITR), CP-870893 (CD40 agonist), MEDI0562, MEDI6469 and MEDI6383 (OX40 agonists).
- the DNA damage therapeutic agent may be selected from a DNA damaging agent, a DNA repair targeted therapy, an inhibitor of DNA damage signalling, an inhibitor of DNA damage induced cell cycle arrest and an inhibitor of a process indirectly leading to DNA damage.
- the DNA damaging agent may be selected from an alkylating agent, a topoisomerase inhibitor and radiation.
- the alkylating agent may be selected from a platinum containing agent, cyclophosphamide and busulphan.
- the platinum containing agent may be selected from cisplatin, carboplatin and oxaliplatin.
- the topoisomerase inhibitor may be selected from a topoisomerase I inhibitor and a topoisomerase II inhibitor.
- the topoisomerase I inhibitor may be selected from irinotecan and topotecan.
- the topisomerase II inhibitor may be selected from etoposide and an anthracycline.
- the anthracycline may be selected from doxorubicin and epirubicin.
- the radiation may be ionising radiation
- the DNA repair targeted therapy may be selected from an inhibitor of Non-homologous end-joining, an inhibitor of homologous recombination, an inhibitors of nucleotide excision repair, an inhibitor of base excision repair and an inhibitor of the Fanconi anemia pathway.
- the inhibitor of Non-homologous end-joining may be selected from a DNA-PK inhibitor, Nu7441 and NU7026.
- the inhibitor of base excision repair may be selected from a PARP inhibitor, AG014699, AZD2281, ABT-888, MK4827, BSI-201, INO-1001, TRC-102, an APEX 1 inhibitor, an APEX 2 inhibitor and a Ligase III inhibitor.
- the inhibitor of DNA damage signalling may be selected from an ATM inhibitor, a CHK 1 inhibitor and a CHK 2 inhibitor.
- the ATM inhibitor may be selected from CP466722 and KU-55933.
- the CHK 1 inhibitor may be selected from XL-844, UCN-01, AZD7762 and PF00477736.
- the CHK 2 inhibitor may be selected from XL-844, AZD7762 and PF00477736.
- the inhibitor of DNA damage induced cell cycle arrest may be selected from a Wee1 kinase inhibitor and a CDC25a, b or c inhibitor.
- the inhibitor of a process indirectly leading to DNA damage may be selected from a histone deacetylase inhibitor and a heat shock protein inhibitor.
- the heat shock protein inhibitor may be selected from geldanamycin and AUY922.
- a major goal of current research efforts in cancer is to increase the efficacy of perioperative systemic therapy in patients by incorporating molecular parameters into clinical therapeutic decisions.
- Pharmacogenetics/genomics is the study of genetic/genomic factors involved in an individual's response to a foreign compound or drug. Agents or modulators which have a stimulatory or inhibitory effect on expression of a marker of the invention can be administered to individuals to treat (prophylactically or therapeutically) cancer in a patient. It is ideal to also consider the pharmacogenomics of the individual in conjunction with such treatment. Differences in metabolism of therapeutics may possibly lead to severe toxicity or therapeutic failure by altering the relationship between dose and blood concentration of the pharmacologically active drug.
- understanding the pharmacogenomics of an individual permits the selection of effective agents (e.g., drugs) for prophylactic or therapeutic treatments.
- Such pharmacogenomics can further be used to determine appropriate dosages and therapeutic regimens.
- the level of expression of a marker of the invention in an individual can be determined to thereby select appropriate agent(s) for therapeutic or prophylactic treatment of the individual.
- the invention is directed to a unique collection of gene or gene product markers (hereinafter referred to as "biomarkers") expressed in a cancer tissue.
- biomarkers gene or gene product markers expressed in a cancer tissue.
- this biomarker list may form the basis of a single parameter or multiparametric predictive test that could be delivered using methods known in the art such as microarray, Q-PCR, sequencing (e.g. RNA seq), immunohistochemistry, ELISA or other technologies that can quantify mRNA expression.
- the present invention also relates to methods that are useful for prognosis following cytotoxic chemotherapy or selection of specific treatments for cancer. Methods are provided such that when some or all of the transcripts are over or under-expressed, the expression profile indicates responsiveness or resistance to antagonists of an inhibitory immune checkpoint and/or agonists of a stimulatory immune checkpoint. These methods employ gene or gene product markers that are differentially expressed in tumors of patients with cancer.
- the expression profiles of these biomarkers are correlated with clinical outcome (response or survival) in archival tissue samples under a statistical method or a correlation model to create a database or model correlating expression profile with responsiveness to one or more antagonists of an inhibitory immune checkpoint and/or agonists of a stimulatory immune checkpoint, optionally in combination with DNA-damage therapeutic agents.
- the predictive model may then be used to predict the responsiveness in a patient whose responsiveness to antagonists of an inhibitory immune checkpoint and/or agonists of a stimulatory immune checkpoint is unknown.
- a patient population can be divided into at least two classes based on patients' clinical outcome, prognosis, or responsiveness to antagonists of an inhibitory immune checkpoint and/or agonists of a stimulatory immune checkpoint, and the biomarkers are substantially correlated with a class distinction between these classes of patients.
- the biological pathways described herein are common to cancer as a disease, similar to grade and stage, and as such, the classifiers and methods are not limited to a single cancer disease type.
- a unique collection of biomarkers as a genetic classifier expressed in a cancer tissue is provided that is useful in determining responsiveness or resistance to antagonists of an inhibitory immune checkpoint and/or agonists of a stimulatory immune checkpoint, used to treat cancer.
- Such a collection may be termed a "marker panel”, "expression classifier”, or "classifier”.
- biomarkers useful in the present methods are identified in Table 1. These biomarkers are identified as having predictive value to determine a patient response to a therapeutic agent, or lack thereof. Their expression correlates with the response to an agent, and more specifically, immune checkpoint therapies, such as antagonists of an inhibitory immune checkpoint and/or agonists of a stimulatory immune checkpoint, optionally in combination with a DNA-damage therapeutic agent.
- immune checkpoint therapies such as antagonists of an inhibitory immune checkpoint and/or agonists of a stimulatory immune checkpoint, optionally in combination with a DNA-damage therapeutic agent.
- these determinations can be made on a patient-by-patient basis or on an agent-by-agent basis. Thus, one can determine whether or not a particular therapeutic regimen is likely to benefit a particular patient or type of patient, and/or whether a particular regimen should be continued.
- biomarker panels selected from the biomarkers in Table 1 can be generated using the methods provided herein and can comprise between one, and all of the biomarkers set forth in Table 1 and each and every combination in between (e.g., four selected biomarkers, 16 selected biomarkers, 74 selected biomarkers, etc.).
- the predictive biomarker set comprises at least 5, 10, 20, 40, 60, 100, 150, 200, or 300 or more biomarkers.
- the predictive biomarker set comprises no more than 5, 10, 20, 40, 60, 100, 150, 200, 300, 400, 500, 600 or 700 biomarkers.
- the predictive biomarker set includes a plurality of biomarkers listed in Table 1.
- the predictive biomarker set includes at least about 1%, about 5%, about 10%, about 20%, about 30%, about 40%, about 50%, about 60%, about 70%, about 80%, about 90%, about 95%, about 96%, about 97%, about 98%, or about 99% of the biomarkers listed in Table 1.
- Selected predictive biomarker sets can be assembled from the predictive biomarkers provided using methods described herein and analogous methods known in the art.
- the biomarker panel contains all 203 biomarkers in Table 1.
- the biomarker panel contains 40 or 44 biomarkers in Table 1 or 2.
- Predictive biomarker sets may be defined in combination with corresponding scalar weights on the real scale with varying magnitude, which are further combined through linear or non-linear, algebraic, trigonometric or correlative means into a single scalar value via an algebraic, statistical learning, Bayesian, regression, or similar algorithms which together with a mathematically derived decision function on the scalar value provide a predictive model by which expression profiles from samples may be resolved into discrete classes of responder or non-responder, resistant or non-resistant, to a specified drug or drug class.
- Such predictive models are developed by learning weights and the decision threshold, optimized for sensitivity, specificity, negative and positive predictive values, hazard ratio or any combination thereof, under cross-validation, bootstrapping or similar sampling techniques, from a set of representative expression profiles from historical patient samples with known drug response and/or resistance.
- the biomarkers are used to form a weighted sum of their signals, where individual weights can be positive or negative.
- the resulting sum (“decisive function") is compared with a pre-determined reference point or value. The comparison with the reference point or value may be used to diagnose, or predict a clinical condition or outcome.
- biomarkers included in the classifier provided in Table 1 will carry unequal weights in a classifier for responsiveness or resistance to a therapeutic agent. Therefore, while as few as one sequence may be used to diagnose or predict an outcome such as responsiveness to therapeutic agent, the specificity and sensitivity or diagnosis or prediction accuracy may increase using more sequences.
- weight refers to the relative importance of an item in a statistical calculation.
- the weight of each biomarker in a gene expression classifier may be determined on a data set of patient samples using analytical methods known in the art.
- the biomarker panel is directed to the 40 biomarkers detailed in Table 2A with corresponding ranks and weights detailed in the table or alternative rankings and weightings, depending, for example, on the disease setting.
- the biomarker panel is directed to the 44 biomarkers detailed in Table 2B with corresponding ranks and weights detailed in the table or alternative rankings and weightings, depending, for example, on the disease setting.
- Tables 2A and 2B rank the biomarkers in order of decreasing weight in the classifier, defined as the rank of the average weight in the compound decision score function measured under cross-validation.
- Table 2C present the probe sets that represent the genes in Table 2A and 2B with reference to their sequence ID numbers.
- Table 2D presents the antisense probe sequences that were present on the array for the genes in the signatures.
- Table 2A Gene IDs and EntrezGene IDs for 40-gene DDRD classifier model with associated ranking and weightings DDRD classifier 40 gene model Rank Genes Symbol EntrezGene ID Weights 1 GBP5 115362 0.022389581 2 CXCL10 3627 0.021941734 3 IDO1 3620 0.020991115 4 MX1 4599 0.020098675 5 IFI44L 10964 0.018204957 6 CD2 914 0.018080661 7 PRAME 23532 0.016850837 8 ITGAL 3683 0.016783359 9 LRP4 4038 -0.015129969 10 SP140L 93349 0.014646025 11 APOL3 80833 0.014407174 12 FOSB 2354 -0.014310521 13 CDR1 1038 -0.014209848 14 RSAD2 91543 0.014177132 15
- subsets of the biomarkers listed in Table 2B may be used in the methods described herein. These subsets include but are not limited to biomarkers ranked 1-2, 1-3, 1-4, 1-5, 1-10, 1-20, 1-30, 1-40, 1-44, 6-10, 11-15, 16-20, 21-25, 26-30, 31-35, 36-40, 36-44, 11-20, 21-30, 31-40, and 31-44 in Table 2B.
- therapeutic responsiveness is predicted in an individual by conducting an assay on a biological sample from the individual and detecting biomarker values that each correspond to at least one of the biomarkers GBP5, CXCL10, IDO1 and MX1 and at least N additional biomarkers selected from the list of biomarkers in Table 2B, wherein N equals 1, 2, 3, 4, 5, 6, 7, 8, 9, 10, 11, 12, 13, 14, 15, 16, 17, 18, 19, 20, 21, 22, 23, 24, 25, 26, 27, 28, 29, 30, 31, 32, 33, 34, 35, or 36.
- biomarker can refer to a gene, an mRNA, cDNA, an antisense transcript, a miRNA, a polypeptide, a protein, a protein fragment, or any other nucleic acid sequence or polypeptide sequence that indicates either gene expression levels or protein production levels.
- the biomarker comprises an mRNA of CXCL10, IDO1, CD2, GBP5, PRAME, ITGAL, LRP4, APOL3, CDR1, FYB, TSPAN7, RAC2, KLHDC7B, GRB14, AC138128.1, KIF26A, CD274, ETV7, MFAP5, OLFM4, PI15, FOSB, FAM19A5, NLRC5, PRICKLE1, EGR1, CLDN10, ADAMTS4, SP140L, ANXA1, RSAD2, ESR1, IKZF3, OR2I1P, EGFR, NAT1, LATS2, CYP2B6, PTPRC, PPP1R1A, or AL137218.1
- the biomarker comprises an mRNA of CXCL10, IDO1, CD2, GBP5, PRAME, ITGAL, LRP4, APOL3, CDR1, FYB, TSPAN7, RAC2, KLHDC7B, GRB14, AC138128.1, KIF26
- the biomarker comprises an antisense transcript of MX1, IFI44L, GBP5, BIRC3, IGJ, IQGAP3, LOC100294459, SIX1, SLC9A3R1, STAT1, TOB1, UBD, C1QC, C2orf14, EPSTI, GALNT6, HIST1H4H, HIST2H4B, KIAA1244, LOC100287927, LOC100291682, or LOC100293679, the biomarker comprises an antisense transcript of MX1, IFI44L, GBP5, BIRC3, IGJ, IQGAP3, LOC100294459, SIX1, SLC9A3R1, STAT1, TOB1, UBD, C1QC, C2orf14, EPSTI, GALNT6, HIST1H4H, HIST2H4B, KIAA1244, LOC100287927, LOC100291682, or LOC100293679, respectively.
- therapeutic responsiveness is predicted, or a cancer diagnosis is indicated, in an individual by conducting an assay on a biological sample from the individual and detecting biomarker values that each correspond to the biomarkers GBP5, CXCL10, IDO1 and MX1 and one of at least N additional biomarkers selected from the list of biomarkers in Table 2B, wherein N equals 1, 2, 3, 4, 5, 6, 7, 8, 9, 10, 11, 12, 13, 14, 15, 16, 17, 18, 19, 20, 21, 22, 23, 24, 25, 26, 27, 28, 29, 30, 31, 32, 33, 34, 35, or 36.
- therapeutic responsiveness is predicted, or a cancer diagnosis is indicated, in an individual by conducting an assay on a biological sample from the individual and detecting biomarker values that each correspond to the biomarker GBP5 and one of at least N additional biomarkers selected from the list of biomarkers in Table 2B, wherein N equals 1, 2, 3, 4, 5, 6, 7, 8, 9, 10, 11, 12, 13, 14, 15, 16, 17, 18, 29, 20, 21, 22, 23, 24, 25, 26, 27, 28, 29, 30, 31, 32, 33, 34, 35, 36, 37, 38 or 39.
- therapeutic responsiveness is predicted, or a cancer diagnosis is indicated, in an individual by conducting an assay on a biological sample from the individual and detecting biomarker values that each correspond to the biomarker CXCL10 and one of at least N additional biomarkers selected from the list of biomarkers in Table 2B, wherein N equals 1, 2, 3, 4, 5, 6, 7, 8, 9, 10, 11, 12, 13, 14, 15, 16, 17, 18, 29, 20, 21, 22, 23, 24, 25, 26, 27, 28, 29, 30, 31, 32, 33, 34, 35, 36, 37, 38 or 39.
- therapeutic responsiveness is predicted, or a cancer diagnosis is indicated, in an individual by conducting an assay on a biological sample from the individual and detecting biomarker values that each correspond to the biomarker IDO1 and one of at least N additional biomarkers selected from the list of biomarkers in Table 2B, wherein N equals 1, 2, 3, 4, 5, 6, 7, 8, 9, 10, 11, 12, 13, 14, 15, 16, 17, 18, 29, 20, 21, 22, 23, 24, 25, 26, 27, 28, 29, 30, 31, 32, 33, 34, 35, 36, 37, 38 or 39.
- therapeutic responsiveness is predicted, or a cancer diagnosis is indicated, in an individual by conducting an assay on a biological sample from the individual and detecting biomarker values that each correspond to the biomarker MX-1 and one of at least N additional biomarkers selected from the list of biomarkers in Table 2B, wherein N equals 1, 2, 3, 4, 5, 6, 7, 8, 9, 10, 11, 12, 13, 14, 15, 16, 17, 18, 29, 20, 21, 22, 23, 24, 25, 26, 27, 28, 29, 30, 31, 32, 33, 34, 35, 36, 37, 38 or 39.
- therapeutic responsiveness is predicted, or a cancer diagnosis is indicated, in an individual by conducting an assay on a biological sample from the individual and detecting biomarker values that each correspond to at least two of the biomarkers CXCL10, MX1, IDO1 and IFI44L and at least N additional biomarkers selected from the list of biomarkers in Table 2B, wherein N equals 1, 2, 3, 4, 5, 6, 7, 8, 9, 10, 11, 12, 13, 14, 15, 16, 17, 18, 19, 20, 21, 22, 23, 24, 25, 26, 27, 28, 29, 30, 31, 32, 33, 34, 35, 36, 37, 38, 39, or 40.
- therapeutic responsiveness is predicted, or a cancer diagnosis is indicated, in an individual by conducting an assay on a biological sample from the individual and detecting biomarker values that each correspond to the biomarkers CXCL10, MX1, IDO1 and IFI44L and one of at least N additional biomarkers selected from the list of biomarkers in Table 2B, wherein N equals 1, 2, 3, 4, 5, 6, 7, 8, 9, 10, 11, 12, 13, 14, 15, 16, 17, 18, 19, 20, 21, 22, 23, 24, 25, 26, 27, 28, 29, 30, 31, 32, 33, 34, 35, 36, 37, 38, 39, or 40.
- therapeutic responsiveness is predicted, or a cancer diagnosis is indicated, in an individual by conducting an assay on a biological sample from the individual and detecting biomarker values that each correspond to the biomarker CXCL10 and one of at least N additional biomarkers selected from the list of biomarkers in Table 2B, wherein N equals 1, 2, 3, 4, 5, 6, 7, 8, 9, 10, 11, 12, 13, 14, 15, 16, 17, 18, 29, 20, 21, 22, 23, 24, 25, 26, 27, 28, 29, 30, 31, 32, 33, 34, 35, 36, 37, 38, 39, 40, 41, 42 or 43.
- therapeutic responsiveness is predicted, or a cancer diagnosis is indicated, in an individual by conducting an assay on a biological sample from the individual and detecting biomarker values that each correspond to the biomarker MX1 and one of at least N additional biomarkers selected from the list of biomarkers in Table 2B, wherein N equals 1, 2, 3, 4, 5, 6, 7, 8, 9, 10, 11, 12, 13, 14, 15, 16, 17, 18, 29, 20, 21, 22, 23, 24, 25, 26, 27, 28, 29, 30, 31, 32, 33, 34, 35, 36, 37, 38, 39, 40, 41, 42 or 43.
- therapeutic responsiveness is predicted, or a cancer diagnosis is indicated, in an individual by conducting an assay on a biological sample from the individual and detecting biomarker values that each correspond to the biomarker IDO1 and one of at least N additional biomarkers selected from the list of biomarkers in Table 2B, wherein N equals 1, 2, 3, 4, 5, 6, 7, 8, 9, 10, 11, 12, 13, 14, 15, 16, 17, 18, 29, 20, 21, 22, 23, 24, 25, 26, 27, 28, 29, 30, 31, 32, 33, 34, 35, 36, 37, 38, 39, 40, 41, 42 or 43.
- therapeutic responsiveness is predicted, or a cancer diagnosis is indicated, in an individual by conducting an assay on a biological sample from the individual and detecting biomarker values that each correspond to the biomarker IFI44L and one of at least N additional biomarkers selected from the list of biomarkers in Table 2B, wherein N equals 1, 2, 3, 4, 5, 6, 7, 8, 9, 10, 11, 12, 13, 14, 15, 16, 17, 18, 29, 20, 21, 22, 23, 24, 25, 26, 27, 28, 29, 30, 31, 32, 33, 34, 35, 36, 37, 38, 39, 40, 41, 42 or 43.
- the probes listed in Table 2C may be used in the methods described herein. These subsets include but are not limited to a subset of SEQ ID NOs corresponding to one or more of GBP5, CXCL10, IDO1, MX1, IF144I, CD2, PRAME, ITGAL, LRP4, and APOL3.
- the probes correspond to all of the biomarkers CXCL10, MX1, IDO1, IF144L, CD2, GBP5, PRAME, ITGAL, LRP4, APOL3, CDR1, FYB, TSPAN7, RAC2, KLHDC7B, GRB14, AC138128.1, KIF26A, CD274, CD109, ETV7, MFAP5, OLFM4, PI15, FOSB, FAM19A5, NLRC5, PRICKLE1, EGR1, CLDN10, ADAMTS4, SP140L, ANXA1, RSAD2, ESR1, IKZF3, OR2I1P, EGFR, NAT1, LATS2, CYP2B6, PTPRC, PPP1R1A, and AL137218.1.
- each subset can include multiple probes directed to the same biomarker.
- the probes represented by SEQ ID NOs: 135, 140, 142 and 195 are all directed to GBP5.
- a subset containing probes directed or corresponding to GBP5 includes one or more of SEQ ID NOs: 135, 140, 142 and 195.
- a subset containing probes directed to or corresponding to CXCL10 includes one or more of SEQ ID NOs: 131 and 160.
- specific nucleic acid amplification assays may be used to determine the expression level of one or more of the genes or sets of genes described herein.
- the expression level(s) of one or more of the genes may be determined using primers (primer pairs) and/or probes that hybridize with the sequence of the one or more genes.
- primer pairs and probes are provided in Table 2E for each of the genes of the 44-gene DDRD classifier model.
- the primer pairs and/or probes provided for each gene may be used alone or two or more of the primer pairs and/or probes may be used in combination in accordance with any of the sets of genes described herein.
- the primer pairs and/or probes provided in Table 2E may be used to determine the expression level of any of the gene signatures provided in Tables 3-45.
- Exemplary PCR assays are summarized in Table 2E for each of the genes of the 44-gene DDRD classifier model.
- the PCR assay provided for each gene may be used alone or two or more of the assays may be used in combination in accordance with any of the sets of genes described herein.
- the PCR assays provided in the table may be used to determine the expression level of any of the gene signatures provided in Tables 3-45.
- Additional gene signatures representing selections of the 44 gene signature are described herein and are applicable to all aspects of the invention.
- the additional gene signatures are set forth in Tables 3-45, together with suitable weight and bias scores that may be adopted when calculating the final signature score (as further described herein).
- the k value for each signature can be set once the threshold for defining a positive signature score has been determined, as would be readily appreciated by the skilled person.
- the rankings for each gene in the signature can readily be determined by reviewing the weightings attributed to each gene (where a larger weight indicates a higher ranking in the signature - see Tables 2A and 2B for the rank order in respect of the 40 and 44 gene signatures, respectively).
- Tables 3-45 provide an exemplary weight and bias for each gene in each signature, it will be appreciated that the gene signatures provided by these tables are not limited to the particular weights and biases given. Weight values may indicate the directionality of expression that is measured to indicate a positive signature score according to the invention. Thus, a positive weight indicates that an increase in gene expression contributes to a positive signature score/identification of DDRD biology and vice versa.
- Table 2C and Table 2D Suitable probes and probesets to investigate the expression of the genes included in Tables 3-45 are provided in Table 2C and Table 2D.
- suitable PCR assays to investigate the expression of the genes included in Tables 3-45 are provided in Table 2E.
- Table 3 One gene signature Gene Names Weight Bias CXCL10 0.137044 2.03931
- Table 4 Two gene signature Gene Names Weight Bias CXCL10 0.081638 2.03931 MX1 0.080192 3.43549
- Table 5 Three gene signature Gene Names Weight Bias CXCL10 0.058512 2.03931 IDO1 0.055977 0.725702 MX1 0.057475 3.43549
- Table 6 Four gene signature Gene Names Weight Bias CXCL10 0.048331 2.03931 IDO1 0.046238 0.725702 IFI44L 0.0401 1.17581 MX1 0.047475 3.43549
- Table 7 Five gene signature Gene Names Weight Bias CD2 0.034275
- biomarkers and diagnose disease A variety of methods have been utilized in an attempt to identify biomarkers and diagnose disease.
- protein-based markers these include two-dimensional electrophoresis, mass spectrometry, and immunoassay methods.
- nucleic acid markers these include mRNA expression profiles, microRNA profiles, FISH, serial analysis of gene expression (SAGE), methylation profiles, and large-scale gene expression arrays.
- biomarker When a biomarker indicates or is a sign of an abnormal process, disease or other condition in an individual, that biomarker is generally described as being either over-expressed or under-expressed as compared to an expression level or value of the biomarker that indicates or is a sign of a normal process, an absence of a disease or other condition in an individual.
- Up-regulation “up-regulated”, “over-expression”, “over-expressed”, and any variations thereof are used interchangeably to refer to a value or level of a biomarker in a biological sample that is greater than a value or level (or range of values or levels) of the biomarker that is typically detected in similar biological samples from healthy or normal individuals.
- the terms may also refer to a value or level of a biomarker in a biological sample that is greater than a value or level (or range of values or levels) of the biomarker that may be detected at a different stage of a particular disease.
- Down-regulation Down-regulated
- under-expression under-expressed
- any variations thereof are used interchangeably to refer to a value or level of a biomarker in a biological sample that is less than a value or level (or range of values or levels) of the biomarker that is typically detected in similar biological samples from healthy or normal individuals.
- the terms may also refer to a value or level of a biomarker in a biological sample that is less than a value or level (or range of values or levels) of the biomarker that may be detected at a different stage of a particular disease.
- a biomarker that is either over-expressed or under-expressed can also be referred to as being “differentially expressed” or as having a “differential level” or “differential value” as compared to a "normal” expression level or value of the biomarker that indicates or is a sign of a normal process or an absence of a disease or other condition in an individual.
- "differential expression” of a biomarker can also be referred to as a variation from a "normal” expression level of the biomarker.
- differential biomarker expression and “differential expression” are used interchangeably to refer to a biomarker whose expression is activated to a higher or lower level in a subject suffering from a specific disease, relative to its expression in a normal subject, or relative to its expression in a patient that responds differently to a particular therapy or has a different prognosis.
- the terms also include biomarkers whose expression is activated to a higher or lower level at different stages of the same disease. It is also understood that a differentially expressed biomarker may be either activated or inhibited at the nucleic acid level or protein level, or may be subject to alternative splicing to result in a different polypeptide product.
- Differential biomarker expression may include a comparison of expression between two or more genes or their gene products; or a comparison of the ratios of the expression between two or more genes or their gene products; or even a comparison of two differently processed products of the same gene, which differ between normal subjects and subjects suffering from a disease; or between various stages of the same disease.
- Differential expression includes both quantitative, as well as qualitative, differences in the temporal or cellular expression pattern in a biomarker among, for example, normal and diseased cells, or among cells which have undergone different disease events or disease stages.
- the expression profile obtained is a genomic or nucleic acid expression profile, where the amount or level of one or more nucleic acids in the sample is determined.
- the sample that is assayed to generate the expression profile employed in the diagnostic or prognostic methods is one that is a nucleic acid sample.
- the nucleic acid sample includes a population of nucleic acids that includes the expression information of the phenotype determinative biomarkers of the cell or tissue being analyzed.
- the nucleic acid includes RNA nucleic acids, e.g., mRNA, cRNA, etc., so long as the sample retains the expression information of the host cell or tissue from which it is obtained.
- the sample may be prepared in a number of different ways, as is known in the art, e.g., by mRNA isolation from a cell, where the isolated mRNA is used as isolated, amplified, or employed to prepare cDNA, cRNA, etc., as is known in the field of differential gene expression. Accordingly, determining the level of mRNA in a sample includes preparing cDNA or cRNA from the mRNA and subsequently measuring the cDNA or cRNA.
- the sample is typically prepared from a cell or tissue harvested from a subject in need of treatment, e.g., via biopsy of tissue, using standard protocols, where cell types or tissues from which such nucleic acids may be generated include any tissue in which the expression pattern of the to be determined phenotype exists, including, but not limited to, disease cells or tissue, body fluids, etc.
- the expression profile may be generated from the initial nucleic acid sample using any convenient protocol. While a variety of different manners of generating expression profiles are known, such as those employed in the field of differential gene expression/biomarker analysis, one representative and convenient type of protocol for generating expression profiles is array-based gene expression profile generation protocols. Such applications are hybridization assays in which a nucleic acid that displays "probe" nucleic acids for each of the genes to be assayed/profiled in the profile to be generated is employed. In these assays, a sample of target nucleic acids is first prepared from the initial nucleic acid sample being assayed, where preparation may include labeling of the target nucleic acids with a label, e.g., a member of a signal producing system.
- a label e.g., a member of a signal producing system.
- target nucleic acid sample preparation Following target nucleic acid sample preparation, the sample is contacted with the array under hybridization conditions, whereby complexes are formed between target nucleic acids that are complementary to probe sequences attached to the array surface. The presence of hybridized complexes is then detected, either qualitatively or quantitatively.
- Specific hybridization technology which may be practiced to generate the expression profiles employed in the subject methods includes the technology described in U.S. Pat. Nos.
- an array of "probe" nucleic acids that includes a probe for each of the biomarkers whose expression is being assayed is contacted with target nucleic acids as described above. Contact is carried out under hybridization conditions, e.g., stringent hybridization conditions as described above, and unbound nucleic acid is then removed.
- hybridization conditions e.g., stringent hybridization conditions as described above
- unbound nucleic acid is then removed.
- the resultant pattern of hybridized nucleic acids provides information regarding expression for each of the biomarkers that have been probed, where the expression information is in terms of whether or not the gene is expressed and, typically, at what level, where the expression data, i.e., expression profile, may be both qualitative and quantitative.
- the relative expression levels of biomarkers in a cancer tissue are measured to form a gene expression profile.
- the gene expression profile of a set of biomarkers from a patient tissue sample is summarized in the form of a compound decision score and compared to a score threshold that is mathematically derived from a training set of patient data.
- the score threshold separates a patient group based on different characteristics such as, but not limited to, responsiveness/non-responsiveness to treatment.
- the patient training set data is preferably derived from cancer tissue samples having been characterized by prognosis, likelihood of recurrence, long term survival, clinical outcome, treatment response, diagnosis, cancer classification, or personalized genomics profile.
- Expression profiles, and corresponding decision scores from patient samples may be correlated with the characteristics of patient samples in the training set that are on the same side of the mathematically derived score decision threshold.
- the threshold of the linear classifier scalar output is optimized to maximize the sum of sensitivity and specificity under cross-validation as observed within the training dataset.
- the overall expression data for a given sample is normalized using methods known to those skilled in the art in order to correct for differing amounts of starting material, varying efficiencies of the extraction and amplification reactions, etc.
- Using a linear classifier on the normalized data to make a diagnostic or prognostic call effectively means to split the data space, i.e. all possible combinations of expression values for all genes in the classifier, into two disjoint halves by means of a separating hyperplane. This split is empirically derived on a large set of training examples, for example from patients showing responsiveness or resistance to a therapeutic agent.
- the biomarker expression profile of a patient tissue sample is evaluated by a linear classifier.
- a linear classifier refers to a weighted sum of the individual biomarker intensities into a compound decision score ("decision function"). The decision score is then compared to a pre-defined cut-off score threshold, corresponding to a certain set-point in terms of sensitivity and specificity which indicates if a sample is above the score threshold (decision function positive) or below (decision function negative).
- the data space i.e. the set of all possible combinations of biomarker expression values
- the data space is split into two mutually exclusive halves corresponding to different clinical classifications or predictions, e.g. one corresponding to responsiveness to a therapeutic agent and the other to resistance.
- relative over-expression of a certain biomarker can either increase the decision score (positive weight) or reduce it (negative weight) and thus contribute to an overall decision of, for example, responsiveness or resistance to a therapeutic agent.
- AUC area under the curve
- ROC receiver operating characteristic
- the feature data across the entire population e.g., the cases and controls
- the true positive and false positive rates for the data are calculated.
- the true positive rate is determined by counting the number of cases above the value for that feature and then dividing by the total number of cases.
- the false positive rate is determined by counting the number of controls above the value for that feature and then dividing by the total number of controls.
- ROC curves can be generated for a single feature as well as for other single outputs, for example, a combination of two or more features can be mathematically combined (e.g., added, subtracted, multiplied, etc.) to provide a single sum value, and this single sum value can be plotted in a ROC curve. Additionally, any combination of multiple features, in which the combination derives a single output value, can be plotted in a ROC curve. These combinations of features may comprise a test.
- the ROC curve is the plot of the true positive rate (sensitivity) of a test against the false positive rate (1-specificity) of the test.
- this quantity i.e. the cut-off threshold responsiveness or resistance to a therapeutic agent
- the interpretation of this quantity is derived in the development phase ("training") from a set of patients with known outcome.
- the corresponding weights and the responsiveness/resistance cut-off threshold for the decision score are fixed a priori from training data by methods known to those skilled in the art.
- Partial Least Squares Discriminant Analysis (PLS-DA) is used for determining the weights. ( L. St ⁇ hle, S. Wold, J. Chemom. 1 (1987) 185-196 ; D. V. Nguyen, D.M. Rocke, Bioinformatics 18 (2002) 39-50 ).
- Other methods for performing the classification known to those skilled in the art, may also be with the methods described herein when applied to the transcripts of a cancer classifier.
- a training step a set of patient samples for both responsiveness/resistance cases are measured and the prediction method is optimised using the inherent information from this training data to optimally predict the training set or a future sample set.
- the used method is trained or parameterised to predict from a specific intensity pattern to a specific predictive call. Suitable transformation or pre-processing steps might be performed with the measured data before it is subjected to the prognostic method or algorithm.
- a weighted sum of the pre-processed intensity values for each transcript is formed and compared with a threshold value optimised on the training set ( Duda et al. Pattern Classification, 2nd ed., John Wiley, New York 2001 ).
- the weights can be derived by a multitude of linear classification methods, including but not limited to Partial Least Squares (PLS, ( Nguyen et al., 2002, Bioinformatics 18 (2002) 39-50 )) or Support Vector Machines (SVM, ( Schölkopf et al. Learning with Kernels, MIT Press, Cambridge 2002 )).
- the data is transformed non-linearly before applying a weighted sum as described above.
- This non-linear transformation might include increasing the dimensionality of the data.
- the non-linear transformation and weighted summation might also be performed implicitly, e.g. through the use of a kernel function. ( Schölkopf et al. Learning with Kernels, MIT Press, Cambridge 2002 ).
- a new data sample is compared with two or more class prototypes, being either real measured training samples or artificially created prototypes.
- This comparison is performed using suitable similarity measures, for example, but not limited to Euclidean distance ( Duda et al. Pattern Classification, 2nd ed., John Wiley, New York 2001 ), correlation coefficient ( Van't Veer, et al. 2002, Nature 415:530 ) etc.
- a new sample is then assigned to the prognostic group with the closest prototype or the highest number of prototypes in the vicinity.
- decision trees Hastie et al., The Elements of Statistical Learning, Springer, New York 2001
- random forests Breiman, Random Forests, Machine Learning 45:5 2001
- neural networks Bishop, Neural Networks for Pattern Recognition, Clarendon Press, Oxford 1995 ) are used to make a prognostic call from the measured intensity data for the transcript set or their products.
- discriminant analysis ( Duda et al., Pattern Classification, 2nd ed., John Wiley, New York 2001 ), comprising but not limited to linear, diagonal linear, quadratic and logistic discriminant analysis, is used to make a prognostic call from the measured intensity data for the transcript set or their products.
- PAM Prediction Analysis for Microarrays
- Soft Independent Modelling of Class Analogy (SIMCA, ( Wold, 1976, Pattern Recogn. 8:127-139 )) is used to make a predictive call from the measured intensity data for the transcript set or their products.
- the methods described herein permit the classification of a patient as responsive or non-responsive to a therapeutic agent that targets tumors with increased immune signaling associated with abnormal DNA repair.
- the therapeutic agents may be immune checkpoint therapies, such as antagonists of an inhibitory immune checkpoint and/or agonists of a stimulatory immune checkpoint.
- the inhibitory immune checkpoint is selected from A2AR, B7-H3 (CD276), B7-H4 (VTCN1), BTLA (CD272), CTLA-4 (CD152), IDO, KIR, LAG3, PD-1/PD-L1, TIM-3 and VISTA.
- the inhibitory immune checkpoint is not PD-1/PD-L1.
- the inhibitory immune checkpoint is IDO.
- the antagonist of an inhibitory immune checkpoint is selected from an antibody and an inhibitory nucleic acid molecule as defined herein.
- the antagonist of an inhibitory immune checkpoint is selected from MGA271 (targets B7-H3), ipilimumab (Yervoy - targets CTLA-4), indoximod (targets IDO pathway), NLG919 (targets IDO pathway), lirilumab (targets KIR), IMP321 (targets LAG3), BMS-986016 (targets LAG3), CT-011 (PD-1 blockade), nivolumab/BMS-936558 (PD-1 blockade), BMS-936559 (PDL1 blockade) and pembrolizumab (Keytruda - targets PD-1), optionally wherein the antagonist is not pembrolizumab.
- the stimulatory immune checkpoint is selected from CD27, CD28, CD40, CD122, CD137, OX40, GITR and ICOS.
- the agonist of a stimulatory immune checkpoint is selected from an antibody, a lipocalin and a cytokine, as defined herein.
- the agonist of a stimulatory immune checkpoint is selected from CDX-1127 (agonist of CD27), NKTR-214 (agonist of CD122), BMS-663513 (agonist of CD137), TRX518 (agonist of GITR), CP-870893 (CD40 agonist), MEDI0562, MEDI6469 and MEDI6383 (OX40 agonists).
- antagonists of an inhibitory immune checkpoint and/or agonists of a stimulatory immune checkpoint may be administered in combination with a "DNA-damage therapeutic agent".
- DNA-damage therapeutic agent includes agents known to damage DNA directly, agents that prevent DNA damage repair, agents that inhibit DNA damage signaling, agents that inhibit DNA damage induced cell cycle arrest, and agents that inhibit processes indirectly leading to DNA damage.
- Some current such therapeutics used to treat cancer include, but are not limited to, the following DNA-damage therapeutic agents.
- the predictive classifiers described herein are useful for determining responsiveness or resistance to a therapeutic agent for treating cancer.
- the biological pathway described herein is a feature of cancer itself, similar to grade and stage, and as such, is not limited to a single cancer disease type. Therefore, the collection of genes or gene products may be used to predict responsiveness of cancer therapeutics across different cancer types in different tissues. In one embodiment, this collection of genes or gene products is useful for evaluating both breast and ovarian cancer tumors.
- cancer includes, but is not limited to, leukemia, brain cancer, prostate cancer, liver cancer, ovarian cancer, stomach cancer, colorectal cancer, throat cancer, breast cancer, skin cancer, melanoma, lung cancer, sarcoma, cervical cancer, testicular cancer, bladder cancer, endocrine cancer, endometrial cancer, esophageal cancer, glioma, lymphoma, neuroblastoma, osteosarcoma, pancreatic cancer, pituitary cancer, renal cancer, head and neck cancer and the like.
- the methods described herein refer to cancers that are treated with antagonists of an inhibitory immune checkpoint and/or agonists of a stimulatory immune checkpoint, optionally in combination with DNA damaging agents, DNA repair target therapies, inhibitors of DNA damage signalling, inhibitors of DNA damage induced cell cycle arrest and inhibition of processes indirectly leading to DNA damage, (i.e. "DNA-damage therapeutic agent" as the term is used herein).
- Bio sample “sample”, and “test sample” are used interchangeably herein to refer to any material, biological fluid, tissue, or cell obtained or otherwise derived from an individual.
- a blood sample can be fractionated into serum or into fractions containing particular types of blood cells, such as red blood cells or white blood cells (leukocytes).
- a sample can be a combination of samples from an individual, such as a combination of a tissue and fluid sample.
- biological sample also includes materials containing homogenized solid material, such as from a stool sample, a tissue sample, or a tissue biopsy, for example.
- biological sample also includes materials derived from a tissue culture or a cell culture.
- any suitable methods for obtaining a biological sample can be employed; exemplary methods include, e.g., phlebotomy, swab (e.g., buccal swab), and a fine needle aspirate biopsy procedure. Samples can also be collected, e.g., by micro dissection (e.g., laser capture micro dissection (LCM) or laser micro dissection (LMD)), bladder wash, smear (e.g., a PAP smear), or ductal lavage.
- a "biological sample” obtained or derived from an individual includes any such sample that has been processed in any suitable manner after being obtained from the individual.
- the target cells may be tumor cells, for example colon cancer cells or stomach cancer cells.
- the target cells are derived from any tissue source, including human and animal tissue, such as, but not limited to, a newly obtained sample, a frozen sample, a biopsy sample, a sample of bodily fluid, a blood sample, preserved tissue such as a paraffin-embedded fixed tissue sample (i.e., a tissue block), or cell culture.
- kits can contain reagents, tools, and instructions for determining an appropriate therapy for a cancer patient.
- a kit can include reagents for collecting a tissue sample from a patient, such as by biopsy, and reagents for processing the tissue.
- the kit can also include one or more reagents for performing a biomarker expression analysis, such as reagents for performing RT-PCR, qPCR, northern blot, proteomic analysis, or immunohistochemistry to determine expression levels of biomarkers in a sample of a patient.
- primers for performing RT-PCR can be included in such kits.
- Appropriate buffers for the assays can also be included.
- Detection reagents required for any of these assays can also be included. The appropriate reagents and methods are described in further detail below.
- kits featured herein can also include an instruction sheet describing how to perform the assays for measuring biomarker expression.
- the instruction sheet can also include instructions for how to determine a reference cohort, including how to determine expression levels of biomarkers in the reference cohort and how to assemble the expression data to establish a reference for comparison to a test patient.
- the instruction sheet can also include instructions for assaying biomarker expression in a test patient and for comparing the expression level with the expression in the reference cohort to subsequently determine the appropriate chemotherapy for the test patient. Methods for determining the appropriate chemotherapy are described above and can be described in detail in the instruction sheet.
- kits can be descriptive, instructional, marketing or other material that relates to the methods described herein and/or the use of the reagents for the methods described herein.
- the informational material of the kit can contain contact information, e.g., a physical address, email address, website, or telephone number, where a user of the kit can obtain substantive information about performing a gene expression analysis and interpreting the results, particularly as they apply to a human's likelihood of having a positive response to a specific therapeutic agent.
- kits featured herein can also contain software necessary to infer a patient's likelihood of having a positive response to a specific therapeutic agent from the biomarker expression.
- Measuring mRNA in a biological sample may be used as a surrogate for detection of the level of the corresponding protein in the biological sample.
- any of the biomarkers or biomarker panels described herein can also be detected by detecting the appropriate RNA.
- Methods of gene expression profiling include, but are not limited to, microarray, RT-PCT, qPCR, northern blots, SAGE, mass spectrometry.
- mRNA expression levels are measured by reverse transcription quantitative polymerase chain reaction (RT-PCR followed with qPCR).
- RT-PCR is used to create a cDNA from the mRNA.
- the cDNA may be used in a qPCR assay to produce fluorescence as the DNA amplification process progresses. By comparison to a standard curve, qPCR can produce an absolute measurement such as number of copies of mRNA per cell.
- Northern blots, microarrays, Invader assays, and RT-PCR combined with capillary electrophoresis have all been used to measure expression levels of mRNA in a sample. See Gene Expression Profiling: Methods and Protocols, Richard A. Shimkets, editor, Humana Press, 2004 .
- miRNA molecules are small RNAs that are non-coding but may regulate gene expression. Any of the methods suited to the measurement of mRNA expression levels can also be used for the corresponding miRNA. Recently many laboratories have investigated the use of miRNAs as biomarkers for disease. Many diseases involve widespread transcriptional regulation, and it is not surprising that miRNAs might find a role as biomarkers. The connection between miRNA concentrations and disease is often even less clear than the connections between protein levels and disease, yet the value of miRNA biomarkers might be substantial.
- RNA biomarkers have similar requirements, although many potential protein biomarkers are secreted intentionally at the site of pathology and function, during disease, in a paracrine fashion. Many potential protein biomarkers are designed to function outside the cells within which those proteins are synthesized.
- Gene expression may also be evaluated using mass spectrometry methods.
- a variety of configurations of mass spectrometers can be used to detect biomarker values.
- Several types of mass spectrometers are available or can be produced with various configurations.
- a mass spectrometer has the following major components: a sample inlet, an ion source, a mass analyzer, a detector, a vacuum system, and instrument-control system, and a data system. Difference in the sample inlet, ion source, and mass analyzer generally define the type of instrument and its capabilities.
- an inlet can be a capillary-column liquid chromatography source or can be a direct probe or stage such as used in matrix-assisted laser desorption.
- Common ion sources are, for example, electrospray, including nanospray and microspray or matrix-assisted laser desorption.
- Common mass analyzers include a quadrupole mass filter, ion trap mass analyzer and time-of-flight mass analyzer. Additional mass spectrometry methods are well known in the art (see Burlingame et al., Anal. Chem. 70:647 R-716R (1998 ); Kinter and Sherman, New York (2000)).
- Protein biomarkers and biomarker values can be detected and measured by any of the following: electrospray ionization mass spectrometry (ESI-MS), ESI-MS/MS, ESI-MS/(MS)n, matrix-assisted laser desorption ionization time-of-flight mass spectrometry (MALDI-TOF-MS), surface-enhanced laser desorption/ionization time-of-flight mass spectrometry (SELDI-TOF-MS), desorption/ionization on silicon (DIOS), secondary ion mass spectrometry (SIMS), quadrupole time-of-flight (Q-TOF), tandem time-of-flight (TOF/TOF) technology, called ultraflex III TOF/TOF, atmospheric pressure chemical ionization mass spectrometry (APCI-MS), APCI-MS/MS, APCI-(MS).sup.N, atmospheric pressure photoionization mass spectrometry (APPI-MS), APPI-MS
- Labeling methods include but are not limited to isobaric tag for relative and absolute quantitation (iTRAQ) and stable isotope labeling with amino acids in cell culture (SILAC).
- Capture reagents used to selectively enrich samples for candidate biomarker proteins prior to mass spectroscopic analysis include but are not limited to aptamers, antibodies, nucleic acid probes, chimeras, small molecules, an F(ab') 2 fragment, a single chain antibody fragment, an Fv fragment, a single chain Fv fragment, a nucleic acid, a lectin, a ligand-binding receptor, affybodies, nanobodies, ankyrins, domain antibodies, alternative antibody scaffolds (e.g.
- the foregoing assays enable the detection of biomarker values that are useful in methods for predicting responsiveness of a cancer therapeutic agent, where the methods comprise detecting, in a biological sample from an individual, at least N biomarker values that each correspond to a biomarker selected from the group consisting of the biomarkers provided in Tables 1 or 2, wherein a classification, as described in detail below, using the biomarker values indicates whether the individual will be responsive to a therapeutic agent. While certain of the described predictive biomarkers are useful alone for predicting responsiveness to a therapeutic agent, methods are also described herein for the grouping of multiple subsets of the biomarkers that are each useful as a panel of two or more biomarkers.
- N is at least three biomarkers. It will be appreciated that N can be selected to be any number from any of the above-described ranges, as well as similar, but higher order, ranges.
- biomarker values can be detected and classified individually or they can be detected and classified collectively, as for example in a multiplex assay format.
- the present invention makes use of "oligonucleotide arrays” (also called herein “microarrays”).
- Microarrays can be employed for analyzing the expression of biomarkers in a cell, and especially for measuring the expression of biomarkers of cancer tissues.
- biomarker arrays are produced by hybridizing detectably labeled polynucleotides representing the mRNA transcripts present in a cell (e.g., fluorescently-labeled cDNA synthesized from total cell mRNA or labeled cRNA) to a microarray.
- a microarray is a surface with an ordered array of binding (e.g., hybridization) sites for products of many of the genes in the genome of a cell or organism, preferably most or almost all of the genes.
- Microarrays can be made in a number of ways known in the art. However produced, microarrays share certain characteristics. The arrays are reproducible, allowing multiple copies of a given array to be produced and easily compared with each other.
- the microarrays are small, usually smaller than 5 cm 2 , and they are made from materials that are stable under binding (e.g., nucleic acid hybridization) conditions.
- a given binding site or unique set of binding sites in the microarray will specifically bind the product of a single gene in the cell.
- positionally addressable arrays containing affixed nucleic acids of known sequence at each location are used.
- cDNA or cRNA complementary to the total cellular mRNA when detectably labeled (e.g., with a fluorophore) cDNA or cRNA complementary to the total cellular mRNA is hybridized to a microarray, the site on the array corresponding to a gene (i.e., capable of specifically binding the product of the gene) that is not transcribed in the cell will have little or no signal (e.g., fluorescent signal), and a gene for which the encoded mRNA is prevalent will have a relatively strong signal.
- a gene i.e., capable of specifically binding the product of the gene
- Nucleic acid hybridization and wash conditions are chosen so that the probe "specifically binds" or “specifically hybridizes' to a specific array site, i.e., the probe hybridizes, duplexes or binds to a sequence array site with a complementary nucleic acid sequence but does not hybridize to a site with a non-complementary nucleic acid sequence.
- one polynucleotide sequence is considered complementary to another when, if the shorter of the polynucleotides is less than or equal to 25 bases, there are no mismatches using standard base-pairing rules or, if the shorter of the polynucleotides is longer than 25 bases, there is no more than a 5% mismatch.
- the polynucleotides are perfectly complementary (no mismatches). It can be demonstrated that specific hybridization conditions result in specific hybridization by carrying out a hybridization assay including negative controls using routine experimentation.
- Optimal hybridization conditions will depend on the length (e.g., oligomer vs. polynucleotide greater than 200 bases) and type (e.g., RNA, DNA, PNA) of labeled probe and immobilized polynucleotide or oligonucleotide.
- length e.g., oligomer vs. polynucleotide greater than 200 bases
- type e.g., RNA, DNA, PNA
- hybridization conditions are hybridization in 5xSSC plus 0.2% SDS at 65C for 4 hours followed by washes at 25°C in low stringency wash buffer (1xSSC plus 0.2% SDS) followed by 10 minutes at 25°C in high stringency wash buffer (0.1SSC plus 0.2% SDS) (see Shena et al., Proc. Natl. Acad. Sci. USA, Vol. 93, p. 10614 (1996 )).
- Useful hybridization conditions are also provided in, e.g., Tijessen, Hybridization With Nucleic Acid Probes", Elsevier Science Publishers B.V. (1993 ) and Kricka, "Nonisotopic DNA Probe Techniques", Academic Press, San Diego, Calif. (1992 ).
- Immunoassay methods are based on the reaction of an antibody to its corresponding target or analyte and can detect the analyte in a sample depending on the specific assay format.
- monoclonal antibodies are often used because of their specific epitope recognition.
- Polyclonal antibodies have also been successfully used in various immunoassays because of their increased affinity for the target as compared to monoclonal antibodies
- Immunoassays have been designed for use with a wide range of biological sample matrices
- Immunoassay formats have been designed to provide qualitative, semi-quantitative, and quantitative results.
- Quantitative results may be generated through the use of a standard curve created with known concentrations of the specific analyte to be detected.
- the response or signal from an unknown sample is plotted onto the standard curve, and a quantity or value corresponding to the target in the unknown sample is established.
- ELISA or EIA can be quantitative for the detection of an analyte/biomarker. This method relies on attachment of a label to either the analyte or the antibody and the label component includes, either directly or indirectly, an enzyme. ELISA tests may be formatted for direct, indirect, competitive, or sandwich detection of the analyte. Other methods rely on labels such as, for example, radioisotopes (I 125 ) or fluorescence.
- Additional techniques include, for example, agglutination, nephelometry, turbidimetry, Western blot, immunoprecipitation, immunocytochemistry, immunohistochemistry, flow cytometry, Luminex assay, and others (see ImmunoAssay: A Practical Guide, edited by Brian Law, published by Taylor & Francis, Ltd., 2005 editi on).
- Exemplary assay formats include enzyme-linked immunosorbent assay (ELISA), radioimmunoassay, fluorescent, chemiluminescence, and fluorescence resonance energy transfer (FRET) or time resolved-FRET (TR-FRET) immunoassays.
- ELISA enzyme-linked immunosorbent assay
- FRET fluorescence resonance energy transfer
- TR-FRET time resolved-FRET
- biomarkers include biomarker immunoprecipitation followed by quantitative methods that allow size and peptide level discrimination, such as gel electrophoresis, capillary electrophoresis, planar electrochromatography, and the like.
- Methods of detecting and/or quantifying a detectable label or signal generating material depend on the nature of the label.
- the products of reactions catalyzed by appropriate enzymes can be, without limitation, fluorescent, luminescent, or radioactive or they may absorb visible or ultraviolet light.
- detectors suitable for detecting such detectable labels include, without limitation, x-ray film, radioactivity counters, scintillation counters, spectrophotometers, colorimeters, fluorometers, luminometers, and densitometers.
- Any of the methods for detection can be performed in any format that allows for any suitable preparation, processing, and analysis of the reactions. This can be, for example, in multi-well assay plates (e.g., 96 wells or 384 wells) or using any suitable array or microarray. Stock solutions for various agents can be made manually or robotically, and all subsequent pipetting, diluting, mixing, distribution, washing, incubating, sample readout, data collection and analysis can be done robotically using commercially available analysis software, robotics, and detection instrumentation capable of detecting a detectable label.
- Gene expression may also be determined using sequencing methods, which include the various next generation sequencing technologies.
- RNAseq may be utilized.
- methods are provided for identifying and/or selecting a cancer patient who is responsive to a therapeutic regimen.
- the methods are directed to identifying or selecting a cancer patient who is responsive to a therapeutic regimen that includes administering immune checkpoint therapies, such as antagonists of an inhibitory immune checkpoint and/or agonists of a stimulatory immune checkpoint, optionally in combination with an agent that directly or indirectly damages DNA.
- immune checkpoint therapies such as antagonists of an inhibitory immune checkpoint and/or agonists of a stimulatory immune checkpoint, optionally in combination with an agent that directly or indirectly damages DNA.
- These methods typically include determining the level of expression of a collection of predictive markers in a patient's tumor (primary, metastatic or other derivatives from the tumor such as, but not limited to, blood, or components in blood, urine, saliva and other bodily fluids)(e.g., a patient's cancer cells), comparing the level of expression to a reference expression level, and identifying whether expression in the sample includes a pattern or profile of expression of a selected predictive biomarker or biomarker set which corresponds to response or non-response to therapeutic agent.
- a patient's tumor primary, metastatic or other derivatives from the tumor such as, but not limited to, blood, or components in blood, urine, saliva and other bodily fluids
- a patient's cancer cells e.g., a patient's cancer cells
- a method of predicting responsiveness of an individual to immune checkpoint therapies comprises the following steps: obtaining a test sample from the individual; measuring expression levels of one or more biomarkers in the test sample, wherein the one or more biomarkers are selected from the group consisting of CXCL10, MX1, IDO1, IF144L, CD2, GBP5, PRAME, ITGAL, LRP4, and APOL3; deriving a test score that captures the expression levels; providing a threshold score comprising information correlating the test score and responsiveness; and comparing the test score to the threshold score; wherein responsiveness is predicted when the test score exceeds the threshold score.
- One of ordinary skill in the art can determine an appropriate threshold score, and appropriate biomarker weightings, using the teachings provided herein including the teachings of Example 1.
- the method of predicting responsiveness of an individual to antagonists of an inhibitory immune checkpoint and/or agonists of a stimulatory immune checkpoint, optionally in combination with a DNA-damage therapeutic agent comprises measuring the RNA expression levels of one or more biomarkers in the test sample, wherein the one or more biomarkers are selected from the group consisting of CXCL10, MX1, IDO1, IF144L, CD2, GBP5, PRAME, ITGAL, LRP4, APOL3, CDR1, FYB, TSPAN7, RAC2, KLHDC7B, GRB14, AC138128.1, KIF26A, CD274, CD109, ETV7, MFAP5, OLFM4, P115, FOSB, FAM19A5, NLRC5, PRICKLE1, EGR1, CLDN10, ADAMTS4, SP140L, ANXA1, RSAD2, ESR1, IKZF3, OR2I1P, EGFR, NAT1, LATS2, CYP2B6, PTPRC
- the method may comprise deriving a test score that captures the RNA expression levels; providing a threshold score comprising information correlating the test score and responsiveness; and comparing the test score to the threshold score; wherein responsiveness is predicted when the test score exceeds the threshold score.
- Tables 2A and 2B provide exemplary gene signatures (or gene classifiers) wherein the biomarkers consist of 40 or 44 of the gene products listed therein, respectively, and wherein a threshold score is derived from the individual gene product weightings listed therein.
- a test score that exceeds a threshold score of 0.3681 indicates a likelihood that the individual will be responsive to immune checkpoint therapies, such as antagonists of an inhibitory immune checkpoint and/or agonists of a stimulatory immune checkpoint, optionally in combination with a DNA-damage therapeutic agent.
- a cancer is "responsive" to a therapeutic agent if its rate of growth is inhibited as a result of contact with the therapeutic agent, compared to its growth in the absence of contact with the therapeutic agent.
- Growth of a cancer can be measured in a variety of ways, for instance, the size of a tumor or the expression of tumor markers appropriate for that tumor type may be measured.
- a cancer is "non-responsive" to a therapeutic agent if its rate of growth is not inhibited, or inhibited to a very low degree, as a result of contact with the therapeutic agent when compared to its growth in the absence of contact with the therapeutic agent.
- growth of a cancer can be measured in a variety of ways, for instance, the size of a tumor or the expression of tumor markers appropriate for that tumor type may be measured.
- the quality of being non-responsive to a therapeutic agent is a highly variable one, with different cancers exhibiting different levels of "non-responsiveness" to a given therapeutic agent, under different conditions. Still further, measures of non-responsiveness can be assessed using additional criteria beyond growth size of a tumor, including patient quality of life, degree of metastases, etc.
- An application of this test will predict end points including, but not limited to, overall survival, progression free survival, radiological response, as defined by RECIST, complete response, partial response, stable disease and serological markers such as, but not limited to, PSA, CEA, CA125, CA15-3 and CA19-9.
- RNA, DNA or protein within a sample of one or more nucleic acids or their biological derivatives such as encoded proteins may be employed, including quantitative PCR (QPCR), enzyme-linked immunosorbent assay (ELISA) or immunohistochemistry (IHC) and the like.
- QPCR quantitative PCR
- ELISA enzyme-linked immunosorbent assay
- IHC immunohistochemistry
- the expression profile is compared with a reference or control profile to make a diagnosis regarding the therapy responsive phenotype of the cell or tissue, and therefore host, from which the sample was obtained.
- the terms "reference” and "control” as used herein in relation to an expression profile mean a standardized pattern of gene or gene product expression or levels of expression of certain biomarkers to be used to interpret the expression classifier of a given patient and assign a prognostic or predictive class.
- the reference or control expression profile may be a profile that is obtained from a sample known to have the desired phenotype, e.g., responsive phenotype, and therefore may be a positive reference or control profile.
- the reference profile may be from a sample known to not have the desired phenotype, and therefore be a negative reference profile.
- this method quantifies the PCR product accumulation through measurement of fluorescence released by a dual-labeled fluorogenic probe (i.e. TaqMan® probe).
- the obtained expression profile is compared to a single reference profile to obtain information regarding the phenotype of the sample being assayed. In yet other embodiments, the obtained expression profile is compared to two or more different reference profiles to obtain more in depth information regarding the phenotype of the assayed sample. For example, the obtained expression profile may be compared to a positive and negative reference profile to obtain confirmed information regarding whether the sample has the phenotype of interest.
- the comparison of the obtained expression profile and the one or more reference profiles may be performed using any convenient methodology, where a variety of methodologies are known to those of skill in the array art, e.g., by comparing digital images of the expression profiles, by comparing databases of expression data, etc.
- Patents describing ways of comparing expression profiles include, but are not limited to, U.S. Pat. Nos. 6,308,170 and 6,228,575 .
- the comparison step results in information regarding how similar or dissimilar the obtained expression profile is to the one or more reference profiles, which similarity information is employed to determine the phenotype of the sample being assayed. For example, similarity with a positive control indicates that the assayed sample has a responsive phenotype similar to the responsive reference sample. Likewise, similarity with a negative control indicates that the assayed sample has a non-responsive phenotype to the non-responsive reference sample.
- the level of expression of a biomarker can be further compared to different reference expression levels.
- a reference expression level can be a predetermined standard reference level of expression in order to evaluate if expression of a biomarker or biomarker set is informative and make an assessment for determining whether the patient is responsive or non-responsive.
- determining the level of expression of a biomarker can be compared to an internal reference marker level of expression which is measured at the same time as the biomarker in order to make an assessment for determining whether the patient is responsive or non-responsive.
- expression of a distinct marker panel which is not comprised of biomarkers of the invention, but which is known to demonstrate a constant expression level can be assessed as an internal reference marker level, and the level of the biomarker expression is determined as compared to the reference.
- expression of the selected biomarkers in a tissue sample which is a non-tumor sample can be assessed as an internal reference marker level.
- the level of expression of a biomarker may be determined as having increased expression in certain aspects.
- the level of expression of a biomarker may be determined as having decreased expression in other aspects.
- the level of expression may be determined as no informative change in expression as compared to a reference level.
- the level of expression is determined against a pre-determined standard expression level as determined by the methods provided herein.
- the invention is also related to guiding conventional treatment of patients.
- Patients in which the diagnostics test reveals that they are responders to antagonists of an inhibitory immune checkpoint and/or agonists of a stimulatory immune checkpoint, optionally in combination with a DNA damage therapeutic agent, can be administered with that therapy and both patient and oncologist can be confident that the patient will benefit.
- Patients that are designated non-responders by the diagnostic test can be identified for alternative therapies which are more likely to offer benefit to them.
- the invention further relates to selecting patients for clinical trials with novel antagonists of an inhibitory immune checkpoint and/or agonists of a stimulatory immune checkpoint, optionally in combination with a DNA damage therapeutic agent. Enrichment of trial populations with potential responders will facilitate a more thorough evaluation of that drug under relevant criteria.
- DDRD DNA damage response deficiency
- DDRD is defined herein as any condition wherein a cell or cells of the patient have a reduced ability to repair DNA damage, which reduced ability is a causative factor in the development or growth of a tumor.
- the DDRD diagnosis may be associated with a mutation in the Fanconi anemia/BRCA pathway.
- the DDRD diagnosis may also be associated with breast cancer or ovarian cancer.
- Described herein are methods of diagnosis comprising the steps of obtaining a test sample from the individual; measuring expression levels of one or more biomarkers in the test sample, wherein the one or more biomarkers are selected from Table 2B, 2A or 1A, including the group consisting of CXCL10, MX1, IDO1, IF144L, CD2, GBP5, PRAME, ITGAL, LRP4, and APOL3; deriving a test score that captures the expression levels; providing a threshold score comprising information correlating the test score and a diagnosis of the cancer; and comparing the test score to the threshold score; wherein the individual is determined to have the cancer when the test score exceeds the threshold score.
- One of ordinary skill in the art can determine an appropriate threshold score, and appropriate biomarker weightings, using the teachings provided herein including the teachings of Example 1.
- the methods of diagnosing patients as having developing a cancer with increased innate immune response associated with DDRD comprise measuring RNA expression levels of one or more biomarkers in the test sample, wherein the one or more biomarkers are selected from the group consisting of CXCL10, MX1, IDO1, IF144L, CD2, GBP5, PRAME, ITGAL, LRP4, APOL3, CDR1, FYB, TSPAN7, RAC2, KLHDC7B, GRB14, AC138128.1, KIF26A, CD274, CD109, ETV7, MFAP5, OLFM4, P115, FOSB, FAM19A5, NLRC5, PRICKLE1, EGR1, CLDN10, ADAMTS4, SP140L, ANXA1, RSAD2, ESR1, IKZF3, OR2I1P, EGFR, NAT1, LATS2, CYP2B6, PTPRC, PPP1R1A, and AL137218.1.
- the one or more biomarkers are selected from the group consisting
- the method may comprise deriving a test score that captures the RNA expression levels; providing a threshold score comprising information correlating the test score and a diagnosis of the cancer; and comparing the test score to the threshold score; wherein the individual is determined to have the cancer when the test score exceeds the threshold score.
- Tables 2A and 2B provide exemplary gene signatures (or gene classifiers) wherein the biomarkers consist of 40 or 44 of the gene products listed therein, respectively, and wherein a threshold score is derived from the individual gene product weightings listed therein.
- a test score that exceeds a threshold score of 0.3681 indicates a diagnosis of cancer or of being susceptible to developing a cancer.
- Tissue processing hierarchical clustering, subtype identification and classifier development
- Table 2 The genes determined to be useful in the present methods (Table 2) were identified from gene expression analysis of a cohort of 107 macrodissected breast tumor FFPE tissue samples sourced from the Mayo Clinic Rochester. Ethical approval for this study was obtained from the Institutional Review Board and the Office of Research Ethics Northern Ireland.
- the Almac's Breast Cancer DSATM research tool has been optimised for analysis of FFPE tissue samples, enabling the use of valuable archived tissue banks.
- the Almac Breast Cancer DSATM research tool is an innovative microarray platform that represents the transcriptome in both normal and cancerous breast tissues. Consequently, the Breast Cancer DSATM provides a comprehensive representation of the transcriptome within the breast disease and tissue setting, not available using generic microarray platforms. Arrays were scanned using the Affymentrix Genechip® Scanner 7G (Affymetrix Inc., Santa Clara, CA).
- Quality Control (QC) of profiled samples was carried out using MAS5 pre-processing algorithm. Different technical aspects were addressed: average noise and background homogeneity, percentage of present call (array quality), signal quality, RNA quality and hybridization quality. Distributions and Median Absolute Deviation of corresponding parameters were analyzed and used to identify possible outliers.
- Almac's Ovarian Cancer DSATM contains probes that primarily target the area within 300 nucleotides from the 3' end of a polynucleotide. Therefore standard Affymetrix RNA quality measures were adapted - for housekeeping genes intensities of 3' end probesets along with ratios of 3' end probeset intensity to the average background intensity were used in addition to usual 3'/5' ratios. Hybridization controls were checked to ensure that their intensities and present calls conform to the requirements specified by Affymetrix.
- mRNA expression level E. avg for each sample was determined by the average expression of all ESR1 probe sets (BRAD.15436_s_at, BRAD.19080_s_at, BREM.1048_at, BRIH.10647C1n2_at, BRIH.5650C1n2_at, BRPD.10690C1n5_at, BRRS.81_at and BRRS.81-22_at).
- the mRNA median expression (E. med.all ) was calculated for all samples. Samples were considered ER positive when E. avg - E. med.all > 0.5 and ER negative when E. avg - E. med.all ⁇ 0.5.
- Pre-processing was performed in expression console v1.1 with Robust Multi-array Analysis (RMA) (Irizarry et al., 2003) resulting in 2 data matrices of ER positive and ER negative samples composed of 56 and 51 samples respectively.
- RMA Robust Multi-array Analysis
- An additional transformation was performed to remove the variance associated with array quality as described by Alter (Alter et al., 2000).
- a combined background & variance filter was applied to each data matrix to identify the most variable probesets.
- Hierarchical clustering techniques were applied to microarray data from 199 epithelial serous ovarian tumors analysed using the Ovarian Cancer DSATM (disease specific array) platform ( FIG. 1 ).
- Raw expression data was preprocessed using the standard Robust Multichip Algorithm (RMA) procedure.
- RMA Robust Multichip Algorithm
- 2-D cluster analysis (tumor, probeset) was performed to establish tumor relationships based on the intrinsic list.
- Hierarchical agglomerative clustering was applied (Pearson correlation distance and Ward's linkage).
- Optimal partition number was selected using the GAP index ( Tibshirani et al., 2002, J. R. Stat. Soc., 63:411-423 ). All probesets available in the subclusters were mapped to genes names.
- probesets were mapped to genes (Entrez gene ID) and an enrichment analysis, based on the hypergeometric function (False Discovery Rate applied ( Benjamini and Hochberg, 1995, J. R. Stat. Soc. 57:289:300 )), was performed.Over-representation of biological processes and pathways were analysed for each gene group generated by the hierarchical clustering for both ER-positive and ER-negative samples using MetacoreTM single experiment analysis workflow from GeneGo®. Antisense probesets were excluded from the analysis. Hypergeometric p-values were assessed for each enriched functional entity class. Functional entity classes with the highest p-values were selected as representative of the group and a general functional category representing these functional entities was assigned to the gene clusters based on significance of representation (i.e. p-value).
- DDRD DNA-damage response-deficiency
- the AUC was used to assess the performance of the different models. Iterative Feature Elimination (IFE) was implemented throughout the development of each model, where the maximum AUC was the main criteria in selecting an optimal number of features over cross validation. In cases where there was no visible AUC difference across features, the minimum feature length was selected.
- IFE Iterative Feature Elimination
- the selected probeset classifier was regenerated at the gene level.
- a redevelopment of the probeset classifier at a gene level required two separate steps:
- the gene level defined expression intensities for the 10 top genes could be used to re-develop the classifier based on only these 10 genes (or any number of features present in current 44 gene signature) by re-estimating classification parameters in cross-validation in the training data set as well as to re-establish the threshold by assessing and maximising the sensitivity and specificity obtained from all cross-validation predictions.
- the methodology would be similar to the method used when working from a larger feature set (described above) except there will be no feature selection involved: the features will remain the same but will be assigned new weights.
- the datasets used in for this analysis are namely: FAC1 [GEO accession number GSE20271, (Tabchy et al., 2010)], FAC2 [GEO accession number GSE22093, (Iwamoto et al., 2011)], FEC [GEO accession number GSE6861, (Bonnefoi et al., 2007)], T/FAC1 [http://bioinformatics.mdanderson.org/pubdata.html, (Hess et al., 2006)], T/FAC2 [GEO accession number GSE16716, (Lee et al., 2010)] and T/FAC3 [GEO accession number GSE20271, (Tabchy et al., 2010)].
- sample GSM508092 was removed from FAC1 as it is a metastatic lymph node sample.
- the objective of this study was to characterize at a transcriptomic level a set of genes that would be capable of determining responsiveness or resistance of a pathogenic cell to DNA-damage therapeutic agents.
- those samples within the Almac breast cancer dataset that best represented this biology were to be selected and compared to the remaining samples for classifier generation (see next section). It was decided that the samples from sample cluster two within the ER-ve sample set were the most relevant samples for this selection as these showed the greatest proportion of BRCA mutant samples (64%) and they exhibited the most dominant biology (IFN/immune response). From within the ER+ve sample set, the samples from sample cluster two and three were selected as these sample clusters had 73% and 67% BRCA mutant tumors respectively.
- ER-ve sample set Within the ER-ve sample set, the hierarchical cluster analysis defined three sample clusters and six probeset cluster groups. Probeset cluster three was identified as the most significant biology within the ER-ve sample set and was enriched for interferon and immune response signaling.
- ER+ve sample set Within the ER+ve sample set, the hierarchical analysis defined six sample groups and six probeset cluster groups. Probeset cluster five was identified as the most significant biology within the ER+ve sample set and was enriched for extracellular matrix remodeling. The next most significant probeset cluster within the ER+ve sample set is probeset cluster six and again was enriched for interferon and immune response signaling.
- the classification pipeline was used to derive a model using the set of combined ER-ve and ER+ve breast cancer samples.
- the classification pipeline has been developed in accordance with commonly accepted good practice [ MAQC Consortium, Nat Biotechnol 2010 ].
- the process will, in parallel: 1) derive gene classification models from empirical data; and 2) assess the classification performance of the models, both under cross-validation.
- the performance and success of the classifier generation depends on a number of parameters that can be varied, for instance the choice of classification method or probe set filtering.
- AUC-ROC Receiver Operating Characteristics Curve
- a cross comparison of the models was made, by first selecting the best number of features for each model based on the highest average AUC, and then using box-plots to visualize the performance for each model. This is demonstrated in FIG. 2 . From left to right, the first three plots represent the PLS, SDA and DSDA classifiers respectively that were developed using an initial filtering of probe sets to remove 75% with the lowest average variance and intensity (forcing the inclusion of the gene list). The next three plots respectively represent the PLS, SDA and DSDA classifiers developed using the DDRD (IFN/DNA damage) list only.
- DDRD IFN/DNA damage
- this model needed to be re-built at the gene level (Phase II). This involved mapping the probe sets in the classification model to the gene level and recalculating the weights for each gene.
- the 53 probe sets in the selected model mapped to 40 genes listed in Table 2A and subsequently mapped to 44 genes listed in Table 2B when the accuracy of the annotation pipeline was improved through further analysis.
- the median intensity of all probe sets associated with each gene (Table 2C) is used as the gene expression value. This was calculated for all samples, resulting in a gene expression data matrix, as opposed to a probe set expression data matrix that was used in Phase I for model development and selection. To stabilize the intensities across different batches, the median of all probe sets for each sample was subtracted from the corresponding intensity of each gene for that sample.
- the performance of the 44-gene DDRD classifier model was validated by the Area Under the ROC (Receiver Operator Characteristic) Curve (AUC) within the original Almac breast dataset and three independent datasets.
- the AUC is a statistic calculated on the observed disease scale and is a measure of the efficacy of prediction of a phenotype using a classifier model ( Wray et. al., PLoS Genetics Vol 6, 1-9 ).
- An AUC of 0.5 is typical of a random classifier, and an AUC of 1.0 would represent perfect separation of classes.
- the 44-gene DDRD classifier model is capable of predicting response to, and selecting patients for, standard breast and ovarian cancer therapeutic drug classes, including DNA damage causing agents and DNA repair targeted therapies, the hypothesis is that the AUCs following application within these datasets should be above 0.5 with the lowest confidence interval also above 0.5.
- the classifier scores for predicting DDRD status were utilized to assess the ability of the model to separate BRCA mutant samples from sporadic samples. This analysis was performed to assess the relationships between the classifier model and BRCA mutation status. BRCA mutant tumors display a high degree of genomic instability due to a deficiency in DNA damage response by virtue of the loss of functional BRCA1/2. As such, the hypothesis is that the DDRD classifier models should be able to separate BRCA mutant samples from BRCA wildtype sporadic samples.
- FIG. 3 shows that the 44-gene classifier models separate the BRCA mutants from the sporadic samples with an AUC of -0.68, where the lower confidence interval is ⁇ 0.56 for both models (Table 46A); showing that the performance is significantly better than a random classifier.
- this analysis confirms that the 44-gene DDRD classifier model is capable of identifying samples with high genomic instability due to an inability to repair DNA damage.
- the third dataset ( Bonnefoi et al., Lancet Oncol 8, 1071-1078(2007 )) had response data for 66 ER-negative primary breast tumor samples following neoadjuvant 5-fluorouracil, epirubicin and cyclophosphamide (FEC) treatment.
- FEC neoadjuvant 5-fluorouracil, epirubicin and cyclophosphamide
- Each study used pathological complete response (pCR) or residual disease (RD) as endpoints. As each dataset was relatively small, the data was combined to increase the power of the analysis.
- Stepwise logistic regression was used to determine the ability of the 44-gene DDRD classifier model to predict response in the combined datasets when adjusting for clinical variables (Table 47).
- the 44-gene DDRD classifier model was determined to be the most significant clinical variable in univariate analysis. Multivariate analysis confirmed that the 44-gene DDRD classifier model's predictive value was independent of stage, grade and notably ER status.
- Negativity for estrogen, progesterone and HER2 receptors has been suggested as a biomarker of abnormal DDR and thus response to DNA-damaging and DNA repair targeted therapies (Foulkes et al., 2010).
- this approach excludes the 20% of BRCA1 and the 40% of BRCA2 mutant tumors that are reported to be ER-positive (Foulkes et al., 2004; Tung et al., 2010).
- the 44-gene DDRD classifier detects the DDRD subgroup in both ER-positive and ER-negative tumors, as validated by the multivariate analysis of the 44-gene DDRD classifier's predictive value within the combined analysis of FEC and FAC datasets, demonstrating its independence from ER status.
- this is an important aspect of the translational application of the DDRD classifier as it suggests it can be applied to all breast cancer patients, irrespective of ER status, to determine their predicted responsiveness to DNA-damaging therapeutics.
- the Fanconi anemia/BRCA (FA/BRCA) pathway which includes BRCA1 and BRCA2, plays an integral role in DNA repair and can be lost in breast cancer either due to mutation or epigenetic silencing (Kennedy and D'Andrea, 2006). It was therefore determined if the 44-gene DDRD classifier model could detect abrogation of members of this pathway in addition to BRCA1 and BRCA2.
- a public dataset was identified with microarray data generated from the bone marrow of 21 FA patients carrying a range of mutations in the FA/BRCA pathway and 11 healthy controls with a functional FA/BRCA pathway ( Vanderwerf, S. M., et al., Blood 114, 5290-5298 (2009 ).
- the DDRD classifier model has been independently validated and demonstrated robustness in performance across three different disease areas (breast, ovarian and FA), demonstrated ability to separate responders from non-responders to four different chemotherapeutic regimens (FAC, FEC, T/FAC and platinum/taxane) in two different sample types (FFPE and FF) utilizing data from four different microarray platforms (Almac Breast DSATM and Almac Ovarian DSATM, Affymetrix X3P microarray and Affymetrix U133A microarray). It has been demonstrated that the DDRD is an independent predictor of response to DNA-damage therapeutic agents and can predict mutations in the FA/BRCA pathways.
- HCC1937 parental, HCC1937-EV and HCC1937-BR cell-lines were kindly donated by Professor Paul Harkin from Queen's University College Birmingham (QUB).
- the cell-lines were routinely maintained in RPMI-1640 medium supplemented with 50 U penicillin/ml, 50 ⁇ g streptomycin/ml, 2mM glutamine, 1mM Sodium Pyruvate and 20% (v/v) fetal bovine serum (FBS).
- FBS fetal bovine serum
- the HCC1937-EV and HCC937-BR cell-lines also required 0.2ml/mg geneticin.
- Cell-lines were cultured at 37°C with a humidified atmosphere of 5% CO 2 .
- the DDRD subgroup can be identified within breast cancer cell-line models
- HCC1937 breast cancer cell-line is DDRD due to a BRCA1 mutation (Tomlinson et al., 1998).
- the 44-gene classifier was applied to HCC1937 empty vector control cells (HCC1937-EV) and HCC1937 cells in which BRCA1 functionality was corrected (HCC1937-BR) ( FIG. 8A ).
- the DDRD 44-gene classifier score was found to be higher within HCC1937-EV relative to HCC1937-BR cells, with average scores of 0.5111 and 0.1516 respectively ( FIG. 8B ).
- the HCC1937 BRCA1 mutant cell-line was more sensitive to the PARP-1 inhibitor KU0058948 ( FIG. 8C ) and cisplatin ( FIG. 8D ) relative to the BRCA1 corrected cell-line.
- the DDRD 44-gene classifier measures immune signalling in DDRD-positive tumor cells and correlates with response to both a DNA-damaging agent (cisplatin) and a DNA repair targeted agent (PARP-1 inhibitor).
- the DDRD 44-gene classifier detects dysfunction of the Fanconi Anemia / BRCA pathway
- the Fanconi anemia/BRCA (FA/BRCA) pathway which includes BRCA1 and BRCA2, plays an integral role in DNA repair and can be lost in breast cancer either due to mutation or epigenetic silencing ( Kennedy, R. D., and D'Andrea, A. D., J Clin Oncol 24, 3799-3808 (2006 )). It was determined if the DDRD 44-gene classifier could detect abrogation of members of this pathway in addition to BRCA1 and BRCA2.
- a public dataset was identified with microarray data generated from the bone marrow of 21 FA patients carrying a range of mutations in the FA/BRCA pathway and 11 healthy controls with a functional FA/BRCA pathway (Vanderwerf et al., 2009).
- the DDRD 44-gene classifier score was significantly higher in the BRCA1 mutant, and thus DDRD, HCC1937 breast cancer cell-line relative to an isogenic BRCA1 corrected cell-line. As the 44-gene classifier score correlates with DDR dysfunction within these cells, it demonstrates that the immune signalling detected by the DDRD classifier is intrinsic to the cell and not a function of lymphocytic infiltrate.
- BRCA1 and BRCA2 represent part of the FA/BRCA DDR network, which contains a number of other proteins that have been reported to be mutant or under-expressed in approximately 33% of breast cancer ( Kennedy, R. D., and D'Andrea, A.
- the DDRD 44-gene classifier significantly separated bone marrow samples from patients with FA mutations from normal controls. This suggests that the DDRD classifier is capable of detecting any abnormality within the pathway rather than specifically BRCA1 or BRCA2 dysfunction. It is possible that the DDRD 44-gene classifier may identify tumors with DDR-deficiency due to other mechanisms such as PTEN loss, cell-cycle checkpoint dysfunction or increased reactive oxygen species due to metabolic disturbance. Due to constitutive DNA-damage, these tumors are likely to respond to DNA repair targeted therapies such as PARP-1 or CHK1/2 inhibitors.
- CD274 (PDL1) (Roche, SP142) was diluted 1:40 and an 8 minute amplification step using the OptiView Amplification Kit (Roche).
- a semi-quantitative scoring system was employed for CD4 and CD8 characterisation. Briefly, a score of 3 indicates strong CD4 or CD8 expression, 2 indicates moderate expression and 1 low or weak expression. If there was absence of CD4 or CD8 expression the score 0 was applied. Scores were determined by two independent observers for both the stromal and intratumoral component of cores visualized on TMA. For CD274 (PDL1) previously published cut offs of >1% and >5% were used for scoring positive cores on TMA. CD274 (PDL1) staining was investigated in both the tumour and stroma of cores.
- siRNA oligonucleotides (MWG Eurofins) were resuspended to a concentration of 100 ⁇ M according to the manufacturer's instructions. The following sequences were used for siRNA: STING_a 5' CAGCGGCUGUAUAUUCUCCUCCCUU 3' STING_b 5' GGUCAUAUUACAUCGGAUAUU 3' TBK1_a 5' GGAAAUAUCAUGCGUGUUAUU 3' TBK1_b 5' UGGUGCAGCUAGAGAAUUAUU 3' IRF3_a 5' CCUCUGAGAACCCACUGAAUU 3' IRF3_b 5' GGACAAUCCCACUCCCUUCUU 3' cGAS_a 5' AGAGAAAUGUUGCAGGAAAUU 3' cGAS_b 5' CAGCUUCUAAGAUGCUGUCAAAGUU 3' BRCA1_a 5' CCUAUCGGAAGAAGGCAAGUU 3' BRCA1 _ b 5' CAU
- Exon-spanning qPCR primers were designed using Roche Universal Probe Library Assay Design Centre and were used at a concentration of 0.5 ⁇ M.
- the product of Reverse Transcription was diluted 1:10 in Nuclease Free Water (NFW).
- Each 10 ⁇ l PCR reaction consisted of 0.5 ⁇ l of 10 ⁇ M Forward primer, 0.5 ⁇ l of 10 ⁇ M Reverse primer, 5 ⁇ l of 2X LightCycler@ 480 SYBR Green I Master mix (Roche), 1.5 ⁇ l NFW and 2.5 ⁇ l diluted Reverse Transcription product.
- These 10 ⁇ l reactions were pipetted into wells of a LightCycler@ 480 multiwell 96 plate (Roche), the plate was then sealed using clear adhesive film (Roche). The plate was placed into the LightCycler@ 480 (Roche) and run with the following protocol.
- Adherent cells formed whole cell lysates suspended in RIPA buffer containing phosphatase and protease inhibitors (Roche Inhibitor cocktails, Germany). Lysates were then spun to eliminate cell debris. Protein was quantified using the BCA Assay (Pierce, Rockford, IL, USA) according to manufacturer's instructions using a plate reader.
- Equal amounts of protein per sample was prepared in mercaptoethanol protein loading buffer and separated by size using a gradient 4-12% Bolt® Tris-Bis plus polyacrylamide gel (Life Technologies, Thermo Fisher Scientific Inc.) or a gradient 3-8% NuPAGE® Novex® Tris-acetate gel (for BRCA1 only; Life Technologies, Thermo Fisher Scientific Inc.) and transferred to a PVDF 0.45 ⁇ m membrane (Immoblion-P, Millipore) by electroblotting.
- the membranes were blocked in 3% BSA/TBST and probed overnight with ant-PDL1 antibody (catalogue no. #13684, Cell Signalling, Technology, MA, USA) diluted 1:500 in 3%BSA/TBST.
- conditioned media was collected from indicated cell lines with and without transfected knockdowns.
- Cells were seeded and/or treated on day 0, media was changed to Optimem on day 1 and collected on day 3.
- Media was then centrifuged at 800 g for 5 minutes to remove cellular debris.
- Invasion assays were performed using Corning® Transwell® polycarbonate membrane 5 ⁇ m 24 well cell culture inserts (Sigma, MO, USA). PBMCs were counted, and resuspended in Optimem 0.5% BSA at a density of 5 x 10 6 cells/ml. 100 ⁇ l of cell suspension was placed in the top chamber of the transwell plate equating to 5 x 10 5 cells.
- the cytotoxic effects of lymphocytes on cancer cells was measured using LIVE/DEAD® Cell-Mediated Cytotoxicity Kit (Life technologies, Paisley, UK.)
- RKO parental and Fanc G cells were trypsinised, counted and stained with green-fluorescent membrane stain DiOC18 in PBS at a concentration of 2 ⁇ l of stain per ml. Cells were incubated with the stain for 20 minutes at 37 °C before being seeded into 12 well plates at a density of 1 x 10 5 cells per well and left to adhere overnight. The next day PMBCs were counted and added to RKO cell cultures at the ratios indicated. For 1:1 ratio 1 x 10 5 PBMCs were added, for 5:1 ratio 5 x 10 5 PBMCs were added.
- the co-cultures were incubated for 4 hours before cells were collected for analysis by flow cytometry.
- a BD FACSCaliburTM (BD Biosciences, CA, USA) was used for the analysis of samples and Flow Jo software was used for data analysis.
- Cells were treated with interferon- ⁇ at a concentration of 20 ng/ml for 16 hours.
- Cells were treated with LEAF purified anti-human CD274 (Clone 29E.2A3) antibody (BioLegend, CA, USA) at a concentration of 100 ⁇ g/ml for 16 hours prior to addition of PBMCs.
- Cisplatin and Paclitaxel obtained from fresh Pharmacy stock
- Hydroxyurea Sigma Aldrich
- Cells were trypsinised and fixed in 70% ethanol, incubated with RNase A and propidium iodide (PI) and analysed using a BD FACSCaliburTM (BD Biosciences, CA, USA). Data was analysed using Flow Jo software to perform cell cycle analysis.
- PI propidium iodide
- Cells were fractionated using Buffer A (10mM Hepes pH7.4; 1.5 nM MgCl2, 10 mM NaCl, 0.1% NP-40, Protease and Phosphatase inhibitors) and Buffer C (10 mM Hepes pH7.4; 1.5 nM MgCI2, 420mM NaCl, 0.1% NP-40, Protease and Phosphatase inhibitors). Cells were cultured at ⁇ 70% confluency. Cells were then removed in PBS using a cell scraper and transferred to an Eppendorf. Following centrifugation at 1000 rpm at 4 °C for 5 minutes, cell pellets were resuspended in 350 ⁇ l Buffer A.
- Buffer A 10mM Hepes pH7.4; 1.5 nM MgCl2, 10 mM NaCl, 0.1% NP-40, Protease and Phosphatase inhibitors
- Buffer C 10 mM Hepes pH7.4; 1.5
- Cytoplasmic fractions were prepared as described above. 500 ⁇ g of protein was rotated at 4 °C overnight with 2 ⁇ g of Histone H3 antibody (ab1791, Abcam) resuspended in Pierce IP Lysis Buffer (Thermo Scientific). Secondary anti-rabbit Dynabeads® (Invitrogen) were pre-washed with Pierce IP Lysis Buffer and equal amounts added to samples. Following rotation for 2 hours at 4 °C, samples were washed with Pierce IP Lysis Buffer, using the Dynamag Magnetic Rack. Samples were then boiled at 95 °C for 15 minutes in NuPAGE LDS sample buffer (Life Technologies) and NuPAGE Reducing Agent (Life Technologies).
- Equal amounts of reduced samples were separated by size using a gradient 4-12% Bolt® Tris-Bis plus polyacrylamide gel (Life Technologies, Thermo Fisher Scientific Inc). Western blotting procedure was followed as described previously. Membranes were blocked for 1 hour at room temperature in 5% BSA/TBST and probed with cGAS antibody (HPA031700, Sigma Aldrich) in 5% BSA/TBST at 4 °C overnight. Membranes were probed with HRP-conjugated secondary (Anti-rabbit IgG, Catalogue no. #7074, Cell Signalling Technology). Results were then visualized and recorded using Luminata Crescendo Western HRP substrate (Millipore, UK) and an alpha imager.
- CD4+ and CD8+ T lymphocytes are associated with DDRD assay positive tumours.
- iTILs CD4+ and CD8+ intratumoral tumour infiltrating lymphocytes
- sTILs stromal tumour infiltrating lymphocytes
- Fig 9 A significant association of both CD4+ and CD8+ intratumoral tumour infiltrating lymphocytes (iTILs) and stromal tumour infiltrating lymphocytes (sTILs) with DDRD positivity was identified ( Fig 9 ). This is demonstrated by the increased proportion of tumour sample cores with a greater IHC score within the DDRD positive CD8+ (DDRD pos CD8) and DDRD positive CD4+ (DDRD pos CD4) populations (p ⁇ 0.0001) ( Fig 9A ). The association between CD4+ and CD8+ T-lymphocytes and DDRD positivity was confirmed by the IHC images whereby an increased staining intensity is indicative of a greater presence of iTILs and sTILS within the tumours ( Fig 9B ).
- Chemokine production is associated with DNA damage repair deficiency.
- CXCL10 is the most discriminating gene in the DDRD assay, and has previously been reported as a prognostic factor in breast cancer 1 .
- CCL5 (RANTES) was identified as the top differentially expressed gene in DDRD positive ER negative tumours (Table 48). The majority of differentially expressed genes were identified as interferon responsive indicated by an area under curve (AUC) greater than 0.5. This is in keeping with a chemokine rich inflammatory tumour microenvironment ( Fig 10A ). Further interferome analysis of the differentially expressed genes showed that 53.1% of these genes were interferon driven with a predominant association with Type I interferons ( Fig 10B ).
- CXCL10/CXCR3 axis has been reported as key for the chemotaxis of CD4+ and CD8+ T lymphocytes to sites of inflammation 2 .
- CXCL10 and CCL5 overexpression are associated with the presence of CD8+ lymphocytes in melanoma, gastric and colorectal cancers 3-5 .
- PBMCs peripheral blood mononuclear cells
- MDA436-EV activated peripheral blood mononuclear cells
- + BRCA1 cells Fig 13A & B .
- Chemokine expression is controlled in a cell cycle specific manner.
- HeLa, HCC1937 EV and MDA-MB-436 EV cells were treated with IC-50 doses of DNA damaging agents Cisplatin and Hydroxyurea, and the microtubule-stabilising agent Paclitaxel.
- Cisplatin and Hydroxyurea DNA damaging agents
- Paclitaxel the microtubule-stabilising agent
- upregulation of CXCL10 and CCL5 expression was stimulated in all cell lines following treatment with cisplatin and hydroxyurea.
- CXCL10 and CCL5 expression was not significantly increased with Paclitaxel treatment in either cell line model ( Fig 14 ).
- Treatment with cisplatin and hydroxyurea resulted in an increased proportion of cells in S phase ( Fig 14 ).
- Nocodazole caused an arrest in the M phase of cell cycle as observed by the reduced mRNA expression of CXCL10 ( Fig 15A ).
- the block in M phase was confirmed by the changes in the cell cycle profile shown in Figure 15 ( Fig 15B ). Together these data support an S-phase specific signal for activation of the immune response to DNA damage.
- Chemokine expression is independent of DNA damage sensors ATM, ATR and DNAPK.
- ATM Ataxia Telangiectasia Mutated
- ATR ATM-and RAD3 related
- DNA-PKcs DNA-dependent protein kinase catalytic subunit
- the STlNG / TBK1 / IRF3 pathway is constitutively active in DDRD tumour cells.
- IRFs Interferon Regulatory Factors
- IRF3 IRF3 +BRCA1 and HCC1937 +BRCA1
- TBK1 was constructively phosphorylation was observed in the repair deficient cells (EV) compared to the repair corrected DDRD negative cell lines (BRCA1) ( Fig 17B ).
- siRNA mediated knockdown we inhibited the function of STING (Sting_a/b), TBK1 (TBK1_a/b) and IRF3 (IRF3_a/b) in both MDA-436 and HCC1937 cells.
- STING STING
- TBK1_a/b TBK1_a/b
- IRF3_a/b IRF3
- cytosolic DNA sensor cGAS has been described as the most potent activator of the STING pathway. We therefore asked if it cytosolic DNA was associated with observed immune response to S phase specific DNA damage 9 .
- co-IP co-immunoprecipitation
- Cytosolic DNA is present in response to endogenous and exogenous DNA damage.
- Histone H3 protein expression was increased in the repair deficient lines (EV) ( Fig 19A , top panel of blots).
- EV repair deficient lines
- Fig 19B top panel of blots.
- PicoGreen fluorescent staining was used to detect double-stranded DNA (ds-DNA).
- HeLa cells treated with IC50 doses of DNA damaging agents Cisplatin (HeLa + Cisplatin IC50) and Hydroxyurea (HeLa + Hydroxyurea IC50) revealed increased cytosolic DNA when examined by confocal microscopy. This increase in cytosolic DNA was however not observed in response to treatment with Paclitaxel (HeLa + Paclitaxel IC50) ( Fig 19C ).
- DDRD positive tumours are associated with expression of PDL1.
- tumours were analysed based on their DDRD scores which assigns each tumour sample to a DDRD positive or DDRD negative subgroup based on the cut-off values within the defined gene signature.
- the DDRD scores of the PDL1 positive cohort (PDL1 pos) based on the aggregate tumour and lymphocyte staining using the predefined >1% and >5% cut offs demonstrated significantly higher DDRD scores than PDL1 negative cohort (PDL1 neg) (p ⁇ 0.001) ( Fig 21 ). This data suggests that PDL1 protein expression is associated with a positive DDRD assay result and likewise PDL1 positive tumours have active DDRD signalling.
- DNA Damage Repair Deficient cell lines are primed to express PDL1 in response to co-culture with PBMCs
- MDA-436 EV and MDA-436 + BRCA1 cells were co-cultured with activated PBMCs.
- HHC1937 EV, MDA-MB436 EV and HeLa cells treated with the DNA damaging Cisplatin (Cisp) or Hydroxyurea (HU) but not Paclitaxel induce expression of CD274 (PDL1) through Q-PCR analysis ( Fig 23A ). This effect was confirmed at the protein level through western blot analysis ( Fig 23B ).
- DDRD+ cells are protected from lymphocyte mediated cytotoxicity.
- PBMCs were co-cultured with RKO Parental and RKO FANCG-/- for 4 hours and labelled with 5-(6)-carboxyfluorescein diacetate succinimidyl ester (CFSE) to label the cancer cells, in combination with 7-AAD to label the dead cancer cells and PBMCs.
- the RKO FANCG-/- at both ratios demonstrated reduced lymphocyte mediated toxicity compared to the RKO Parental cells (Parental 1:1 and Parental 5:1), as shown by the lower percentage of cytotoxicity. This reduction in toxicity is consistent with the expression of PDL1 in these cells. It is apparent that DDRD positive cells exhibit protection against lymphocyte mediated toxicity ( Fig 26 ).
- Blockade of PDL1 function reverses DDRD resistance to lymphocyte mediated cytotoxicity.
- a PDL1 blocking antibody was introduced to inhibit PDL1 function.
- Pre-treatment of RKO Parental cells and RKO FANCG-/- cells with Interferon- ⁇ in combination with the PDL1 blocking antibody prior to cytotoxicity assays using PMBCs resulted in significantly more cytotoxicity in the DDRD positive RKO FANCG-/- .
- the DDRD subtype has upregulation of multiple Immune checkpoint targets in multiple indications.
- the DDRD biology is significantly enriched in Microsatellite Instable (MSI) colorectal cancers
- MSI Microsatellite Instability 14
- MMR DNA mismatch repair
- DDRD biology would represent MSI cancers and could be used as an improved stratification tool.
- semi-supervised clustering on a public gene expression dataset using an intrinsic DDRD biology derived from the breast cancer analysis (Mayo clinic data, Marisa dataset). This process identified a group of colorectal samples with activation of the DDRD biology and was highly enriched in MSI tumours ( Fig 29A , outlined within the box).
- the DDRD molecular subtype represents tumours that have loss of function of the FA/BRCA pathway, the primary response mechanism to DNA damage and stalled DNA replication in the S-phase of the cell cycle.
- Our new data suggest that in the absence of a functional FA/BRCA pathway or as a result of exogenous S phase DNA damage, there is a mechanism through which an accumulation of cytosolic DNA activates the STING/TBK1/IRF3 innate immune response.
- cytosolic DNA as an important immune-stimulating factor in response to DNA damage in the S phase of the cell cycle. This immune signal arises from the epithelial component of the cell and does not require immune recognition of abnormal proteins. Although it is unclear why S-phase DNA damage should result in cytosolic DNA we hypothesize that this may be a by-product of replication fork processing. Indeed there is some evidence that the cell may actively export DNA fragments from the nucleus, possibly to prevent misincorporation into genomic DNA 16 .
- cytosolic DNA is processed by cytoplasmic DNase II, however it may be that this mechanism is overwhelmed by a failure to respond to endogenous DNA damage or following exogenous DNA damage thereby triggering the cGAS-mediated innate immune response. Indeed, a similar activation of the STING pathway in response to an abnormal accumulation of cytosolic DNA has been observed in the disease Systemic Lupus Erythramatosis (SLE) 17 .
- SLE Systemic Lupus Erythramatosis
- DDRD gene assay contains 2 immune checkpointing genes that represent therapeutic targets, PD-L1 and IDO1. Inhibition of the PD1/PD-L1 axis has resulted in dramatic responses in a subset of patients with advanced solid tumors including melanoma and non-small cell lung cancer 18 . Importantly, our observation that DDRD positive tumours associate with PD-L1 expression provides a rationale for exploration of immune checkpoint treatments in this molecular subgroup. Using isolated lymphocytes we have demonstrated that blockade of PD-L1 causes significant increase in lymphoctyte mediated toxicity in DDRD positive tumours.
- the S phase specific nature of the immune signal also raises a potentially important issue around combination therapies with immune-checkpoint inhibitors.
- direct activation of the STING pathway using synthetic cyclic dinucleotide molecules has been reported to enhance responses to PD1 antibodies, which is in keeping with our data 20 .
- Another logical combination may be an S phase specific DNA damaging agents such as cisplatin along with a PD-L1 inhibitor.
- Anti-microtubule agents may antagonise PD-L1 inhibitors by causing cell cycle arrest in the mitotic phase thereby preventing the STING-mediated immune response. Additionally we also expect that these effects are not specific to PD-L1 as we have demonstrated activation of a number of additional immune checkpoint targets in DDRD positive tumours.
- Recursive feature elimination was performed on the 44 gene signature to define subsets of signatures comprising a single gene up to 43 genes.
- the DDRD training set comprising 107 samples with known DDRD status were used for this analysis.
- the DDRD signature of length 44 was used as a starting point for this analysis, where the absolute weight of the 44 genes was considered as a means for ranking the individual genes.
- the lowest ranked gene i.e. the gene with the lowest absolute weight, was removed from the signature and the model parameters were re-trained using partial least squares (PLS) regression with the 43 gene expression data against the DDRD class labels.
- PLS partial least squares
- the weighting parameters of the 43 gene signature were used to reduce the signature by one gene as previously described, and this process was repeated until only one gene remained. Leave one out cross validation was used to enable performance estimates to be calculated for each signature length evaluated.
- the performance of the signature was measured using area under the receiver operating characteristic curve (AUC), which assess the ability of the signature to discriminate between the DDRD positive and DDRD negative samples at each feature length considered. Details of each of the sub-signatures are provided in Table 3-45.
- Table 50 shows the AUC performance for predicting the subtype using a minimum of one gene up to 43 genes (see Tables 3-45 for details of the sub signatures). At a minimum of one gene, the AUC performance is significantly greater than 0.5, therefore it is possible to predict the DDRD molecular subgroup significantly better than by chance with a minimum of one gene.
- Table 50 - AUC performance for predicting the subtype using sub signatures of 1 to 43 genes Sub signature size AUC (leave-one-out CV) 1 0.7694 2 0.7925 3 0.7847 4 0.7866 5 0.7910 6 0.7899 7 0.7746 8 0.7873 9 0.8000 10 0.8026 11 0.8190 12 0.8172 13 0.8276 14 0.8265 15 0.8265 16 0.8377 17 0.8459 19 0.8496 20 0.8642 21 0.8612 22 0.8679 23 0.8813 24 0.8847 25 0.8899 26 0.8948 27 0.8937 28 0.8996 28 0.8526 29 0.9000 30 0.9049 31 0.9101 32 0.9108 33 0.9157 34 0.9149 35 0.9231 36 0.9231 37 0.9216 38 0.9228 39 0.9257 40 0.9269 41 0.9310 42 0.9306 43 0.9317
- RNAseq gene expression data from a TCGA cohort of 474 patients with skin cutaneous melanoma.
- Level 3 normalised gene expression data was downloaded from the TCGA data portal and the data matrix reduced to include only the DDRD genes.
- a constant value of 0.01 was added to all gene expression values and the resulting data matrix log transformed (using natural log).
- DDRD assay scores were generated (as described in Mulligan et al. 2014) and dichotomized such that 75% of samples (with highest DDRD scores) were classified as DDRD-positive and 25% of samples (with lowest DDRD scores) were classified as DDRD-negative.
- Figures 31, 32 and 33 respectively are the Kaplan Meier survival graphs illustrating the difference in survival probability by DDRD status, for time to local recurrence ( Figure 31 ), time to distant recurrence ( Figure 32 ) and overall survival time ( Figure 33 ).
- the resulting analyses of each endpoint demonstrated that, in a cohort treated with an immune based therapy (immune checkpoint modulator such as Ipilimumab or pembrolizumab) and/or a DNA damaging agent, patients in the DDRD positive group have a significantly lower risk of an event occurring after treatment compared to patients in the DDRD negative group:
- an immune based therapy immune checkpoint modulator such as Ipilimumab or pembrolizumab
- DDRD assay identifies a group of Melanoma patients that have significantly improved survival following treatment with an immune based therapy (immune checkpoint modulator such as Ipilimumab or pembrolizumab) and/or a DNA damaging agent which have been licensed for use in Melanoma.
- immune checkpoint modulator such as Ipilimumab or pembrolizumab
- DNA damaging agent which have been licensed for use in Melanoma.
Landscapes
- Health & Medical Sciences (AREA)
- Chemical & Material Sciences (AREA)
- Life Sciences & Earth Sciences (AREA)
- Engineering & Computer Science (AREA)
- Organic Chemistry (AREA)
- Proteomics, Peptides & Aminoacids (AREA)
- Pathology (AREA)
- Zoology (AREA)
- Genetics & Genomics (AREA)
- Wood Science & Technology (AREA)
- Analytical Chemistry (AREA)
- Immunology (AREA)
- General Health & Medical Sciences (AREA)
- Medical Informatics (AREA)
- Public Health (AREA)
- Microbiology (AREA)
- Biotechnology (AREA)
- Hospice & Palliative Care (AREA)
- Biophysics (AREA)
- Bioinformatics & Cheminformatics (AREA)
- General Engineering & Computer Science (AREA)
- Biochemistry (AREA)
- Oncology (AREA)
- Physics & Mathematics (AREA)
- Molecular Biology (AREA)
- Biomedical Technology (AREA)
- Data Mining & Analysis (AREA)
- Primary Health Care (AREA)
- Epidemiology (AREA)
- Databases & Information Systems (AREA)
- Measuring Or Testing Involving Enzymes Or Micro-Organisms (AREA)
- Pharmaceuticals Containing Other Organic And Inorganic Compounds (AREA)
- Medicines That Contain Protein Lipid Enzymes And Other Medicines (AREA)
Description
- The present invention relates to a molecular diagnostic test useful for diagnosing cancers from different anatomical sites that includes the use of an immune response subtype associated with DNA damage. The invention includes the use of a 44-gene classification model to identify this immune response associated with DNA damage repair deficiency molecular subtype. One application is the stratification of response to, and selection of patients for therapeutic drug classes, including antagonists of an inhibitory immune checkpoint and/or agonists of a stimulatory immune checkpoint. Another application is the stratification of cancer patients into those that respond and those that do not respond to antagonists of an inhibitory immune checkpoint and/or agonists of a stimulatory immune checkpoint. The present invention provides a test that can guide conventional therapy selection as well as selecting patient groups for enrichment strategies during clinical trial evaluation of novel therapeutics. Cancer subtypes with activation of the innate immune pathway STING/TBK1/IRF3 can be identified from fresh/frozen (FF) or formalin fixed paraffin embedded (FFPE) patient samples.
- The biopharmaceutical industry continuously pursues new drug treatment options that are more effective, more specific or have fewer adverse side effects than currently administered drugs. Novel or alternate drug therapies are constantly being developed because genetic variability within the human population results in substantial differences in the effectiveness of many drugs. Therefore, although a wide variety of drug therapeutic options are currently available, more drug therapies are always needed in the event that a patient fails to benefit.
- Traditionally, the treatment paradigm used by physicians has been to prescribe a first-line drug therapy that results in the highest success rate possible for treating a disease. Alternative drug therapies are then prescribed if the first is ineffective. This treatment paradigm is clearly not the optimal method for certain diseases. For example, in diseases such as cancer, the first treatment is often the most important and offers the best opportunity for successful therapy, so there exists a heightened need to choose an initial drug that will be the most effective against that particular patient's disease.
- It is anticipated that there will be 207,090 new female breast cancer diagnoses in the US this year and 39,840 female breast cancer related deaths (American Cancer Society: Cancer Facts and Figures 2010). Standard chemotherapy typically includes direct DNA damaging agents such as anthracyclines and alkylating agents as well as anti-metabolites and anti-microtubule agents.
- Ovarian cancer is the leading cause of death among all gynecological cancers in western countries. This high death rate is due to the diagnosis at an advanced stage in most patients. Epithelial ovarian cancer (EOC) constitutes 90% of ovarian malignancies and is classified into distinct histologic categories including serous, mucinous, endometrioid, clear cell, transitional, mixed, and undifferentiated subtypes. There is increasing evidence that these histologies arise from different etiologies. The current standard treatment for ovarian cancer is debulking surgery and standard platinum taxane - based cytotoxic chemotherapy. However, not all patients respond to this, and of those that do, approximately 70% will experience a recurrence. Specific targeted therapies for ovarian cancer based on histological or molecular classification have not yet reached the marketplace. Similarly for other types of cancer, there is still no accurate way of selecting appropriate cytotoxic chemotherapeutic agents.
- The advent of microarrays and molecular genomics has the potential for a significant impact on the diagnostic capability and prognostic classification of disease, which may aid in the prediction of the response of an individual patient to a defined therapeutic regimen. Microarrays provide for the analysis of large amounts of genomic information, thereby providing a genomic fingerprint of an individual. There is much enthusiasm that this is one of the molecular technologies that will provide the necessary tools for custom-made drug treatment regimens.
- Currently, healthcare professionals have limited options to help them identify cancer patients who will benefit from chemotherapeutic agents. Identification of the optimal first-line drug has been difficult because methods are not available for accurately predicting which drug treatment would be the most effective for a particular patient's cancer. This results in relatively poor single agent response rates and increased cancer morbidity and death. Furthermore, patients often needlessly undergo ineffective, and often times toxic drug therapy.
- Molecular markers have been used to select appropriate treatments in many cancer types. For example, breast tumors that do not express the estrogen and progesterone hormone receptors as well as the HER2 growth factor receptor, called "triple negative", appear to be responsive to PARP-1 inhibitor therapy (Linn, S. C., and Van 't Veer, L., J. Eur J Cancer 45 ); O'Shaughnessy, J., et al. N Engl J Med 364, 205-214 (2011). Recent studies indicate that the triple negative status of a breast tumor may indicate responsiveness to combination therapy including PARP-1 inhibitors, but may not be sufficient to indicate responsiveness to individual PARP-1 inhibitors.(O'Shaughnessy et al., 2011).
- Furthermore, there have been other studies that have attempted to identify gene classifiers associated with molecular subtypes to indicate responsiveness of chemotherapeutic agents (Sharma P. Breast Diseases: a YB Quarterly 25 (3), 235 - 237 (2014); Mulligan et al. J Natl Cancer Inst 106(1) (2014); Farmer et al. Nat Med 15, 68-74 (2009); Konstantinopoulos, P. A., et al., J Clin Oncol 28, 3555-3561 (2010)).
WO2012/037378 describes a molecular diagnostic test for cancer. - The invention is defined in the claims. Medical uses of the relevant therapeutic agents are contemplated. In some embodiments, according to all aspects of the invention, the immune checkpoint is not the PD1/PDL1 (referred to interchangeably as PD-1 and PD-L1 respectively throughout the disclosure) checkpoint. In some embodiments, according to all aspects of the invention, the antagonist of an inhibitory immune checkpoint is not pembrolizumab.
- The invention is based on the elucidation of the mechanism of immune response associated with DNA damage repair deficient (DDRD) tumours. DNA damage repair deficient (DDRD) tumours activate the immune pathway STING/TBK1/IRF3 resulting in the production of chemokines. Thus, the invention is in part directed to methods of using a collection of gene expression markers in cancer such that when some or all of the transcripts are over or under-expressed, they identify a subtype of cancer that displays an innate immune response which is associated with a deficiency in DNA damage repair. Designation of this subtype can be considered as a diagnostic test as it is not related to any specific drug but rather describes the biology of the cancer in a manner that has utility in screening and selecting appropriate cancer therapies. The immune response associated with DNA damage does not, however, result in an active T cell anti-tumour response, due to the expression of immune inhibitory molecules associated with T cell exhaustion and anergy, such as IDO1 or PDL1 (CD274). Accordingly, the invention also provides methods for indicating responsiveness or resistance to therapies including antagonists of an inhibitory immune checkpoint and/or agonists of a stimulatory immune checkpoint, optionally in combination with DNA-damage therapeutic agents. In different aspects, this gene or gene product list may form the basis of a single parameter or a multiparametric predictive test that could be delivered using methods known in the art such as microarray, nucleic acid amplification (e.g. Q-PCR), sequencing (including next generation sequencing and RNAseq), immunohistochemistry, ELISA or other technologies that can quantify mRNA expression.
- In addition, the biological pathway described herein is a feature of cancer itself, similar to grade and stage, and as such, is not limited to a single cancer disease type. Therefore, the collection of genes or gene products may be used to predict responsiveness of cancer therapeutics across different cancer types in different tissues. In one embodiment of the invention, these genes or gene products are useful for evaluating both breast and ovarian cancer tumors.
- The invention described herein is not limited to any one drug; it can be used to identify responders and non-responders to any of a range of drugs that represent antagonists of an inhibitory immune checkpoint and/or agonists of a stimulatory immune checkpoint. Examples are provided herein. Such drugs may be administered in combination with drugs that directly or indirectly affect DNA damage and/or DNA damage repair e.g. neoadjuvant 5-fluorouracil, anthracycline and cyclophosphamide based regimens such as FEC (5-fluorouracil/epirubicin/cyclophosphamide) and FAC (5-fluorouracil/Adriamycin/cyclophosphamide).
- The present invention relates to prediction of response to drugs using different classifications of response, such as overall survival, progression free survival, radiological response, as defined by RECIST, complete response, partial response, stable disease and serological markers such as, but not limited to, PSA, CEA, CA125, CA15-3 and CA19-9. In another aspect, the present invention relates to the identification of an innate immune response associated with a DNA damage response deficiency (DDRD) molecular subtype in cancer. This molecular subtype can, inter alia, be detected by the use of two different gene classifiers - one comprising of 40 genes and the other comprising of 44 genes. The DDRD classifier was first defined by a classifier consisting of 53 probesets on the Almac Breast Disease Specific Array (DSA™). So as to validate the functional relevance of this classifier in the context of its ability to predict response to DNA-damaging containing chemotherapy regimens, the classifier needed to be re-defined at a gene level. This would facilitate evaluation of the DDRD classifier using microarray data from independent datasets that were profiled on microarray platforms other than the Almac Breast DSA™. In order to facilitate defining the classifier at a gene level, the genes to which the Almac Breast DSA™ probesets map to needed to be defined. This involved the utilization of publicly available genome browser databases such as Ensembl and NCBI Reference Sequence. Results are provided only for the 44-gene DDRD classifier model, as this model supersedes that of the 40-gene DDRD classifier model. These results demonstrate that the classifier model is an effective and significant predictor of response to chemotherapy regimens that contain DNA damaging therapeutics.
- The identification of the subtype by both the 40-gene classifier model and the 44-gene classifier model can be used to predict response to, and select patients for, cancer therapeutic drug classes, in particular antagonists of an inhibitory immune checkpoint and/or agonists of a stimulatory immune checkpoint optionally in combination with DNA damage causing agents and DNA repair targeted therapies.
- Described herein are kits for conventional diagnostic uses listed above such as qPCR, microarray, sequencing (e.g. RNAseq) and immunoassays such as immunohistochemistry, ELISA, Western blot and the like. Such kits include appropriate reagents and directions to assay the expression of the genes or gene products and quantify mRNA or protein expression.
- The invention also provides methods for identifying DNA damage response-deficient (DDRD) human tumors having an increased immune response. It is likely that this invention can be used to identify patients that are sensitive to and respond to, or are resistant to and do not respond to, drugs that influence immune checkpoints, such as antagonists of an inhibitory immune checkpoint and/or agonists of a stimulatory immune checkpoint. These drugs may be combined with drugs that damage DNA directly, damage DNA indirectly or inhibit normal DNA damage signaling and/or repair processes.
- The invention also relates to guiding conventional treatment of patients. The invention also relates to selecting patients for clinical trials where novel drugs of the classes that agonise or antagonize specific immune checkpoints.
- The present invention and methods accommodate the use of archived formalin fixed paraffin-embedded (FFPE) biopsy material, as well as fresh/frozen (FF) tissue, for assay of all transcripts in the invention, and are therefore compatible with the most widely available type of biopsy material. The expression level may be determined using RNA obtained from FFPE tissue, fresh frozen tissue or fresh tissue that has been stored in solutions such as RNAlater®.
-
-
FIG. 1 provides a diagram representing the hierarchical analysis of ER-negative (A) and ER-positive (B) BRCA1/2 mutant and sporadic wildtype control breast samples. Probeset cluster groups are annotated on the right-hand side and pathway analysis of each probeset cluster group is annotated on the left-hand side of each image. The legend for each image indicates a sample's mutational status as well as the signature group each sample was assigned to for classifier generation. -
FIG. 2 provides a diagram of box plots comparing the AUC performance of each classification model under 10 repeats of 5-fold cross validation for (A) the combined sample set, (B) the ER-negative sample set and (C) the ER-positive sample set. (D) Sensitivity plus specificity plot of the cross validation predictions used to select threshold. The maximum sensitivity plus specificity is 1.682 with a corresponding signature score of ∼0.37. -
FIG. 3 provides a diagram of a ROC curve of the classification performance for predicting BRCA status using the 44-gene classifier model, estimated by cross validation. The AUC is ∼0.68 following application the classifier model. The 95% confidence limits have been estimated from bootstrap with 1000 iterations. -
FIG. 4 provides a diagram of a ROC curve of the classification performance of the 44-gene classifier model in a combined analysis of three independent datasets: FEC, FAC1 and FAC2 (Bonnefoi et al., 2007; Iwamoto et al., J ); Lee, J. K., et al. ) for predicting response to anthracycline-based chemotherapy. The AUC is ∼0.78 following application of the classifier model. The 95% confidence limits have been estimated from bootstrap with 1000 iterations. -
FIG. 5 provides a diagram of a ROC curve of the classification performance of the 44-gene classifier model in a combined analysis of three independent datasets for response in T/FAC treated samples (Hess et al., ); Lee et al., 2010; Tabchy, A., et al. ). The AUC is ∼0.61 following application of the classifier model respectively. The 95% confidence limits were determined using 1000 bootstrap iterations. -
FIG. 6 provides a diagram of a ROC curve of the classification performance of the 44-gene classifier model within 259 serous ovarian cancer samples for response in platinum and taxol treated samples from the in-house Almac Diagnostics ovarian dataset. The AUC is ∼0.68 following application of the classifier model. The 95% confidence limits were determined using 1000 bootstrap iterations. -
FIG. 7 provides a histogram representation of the 44-gene DDRD classifier scores in bone marrow samples taken from healthy donors and patients with Fanconi Anaemia mutations. The AUC is 0.90 following application of the classifier model. The 95% confidence limits were determined using 1000 bootstrap iterations. -
FIG. 8 provides a figure correlating the 44-gene classifier model with therapeutic response in BRCA1 mutant and wildtype cell-lines. (A) Western blot analysis confirming increased expression of BRCA1 in the HCC1937-BR cells compared with the HCC1937-EV cells. (B) Mean 44-gene model (DDRD) classifier score (±SEM) within the control vector-only transfected HCC1937 (HCC1937-EV) and HCC1937 with returned exogenous expression of BRCA1 (HCC1937-BR) cell-lines. Histogram representation of cell-viability of HCC1937 parental and HCC1937-BR cells under constant exposure to a range of concentrations of PARP inhibitor KU0058948 (C) and cisplatin (D). -
FIG. 9 provides a table and images showing that DDRD Tumours are Associated with Lymphocytic Infiltration. -
FIG. 10 shows a DDRD subtype, a type I interferon picture. -
FIG. 11 provides a graph showing that DNA damage induces Expression of Chemokines (and other DDRD assay genes). Statistical significance of the data is indicated with * signifying a p value of <0.05, ** a p value of <0.01 and *** a p value of <0.001. -
FIG. 12 provides a graph and images showing that correction of DNA Repair Defect Reduces Expression of Chemokines (and other DDRD assay genes). -
FIG. 13 shows that DDRD Positive Cells release chemokines into conditioned medium that attract lymphocytes. -
FIG. 14 provides graphs showing that DDRD Gene Expression is Induced by DNA Damaging Agents. -
FIG. 15 provides graphs showing that expression of DDRD Signature Genes is Cell Cycle Regulated. -
FIG. 16 provides a graph showing that DDRD gene expression is Independent of Classic DNA Damage Sensors ATM, ATR & DNAPK. -
FIG. 17 shows that the STING activated innate Immune Pathway is related to DDRD Signature Genes. -
FIG. 18 provides images and a graph showing that the cytosolic DNA sensor is activated by DNA damage and is required for DDRD signalling. -
FIG. 19 provides images showing that S Phase DNA Damage Increases Cytoplasmic DNA. -
FIG. 20 provides a table and images showing that DDRD+ shows significant levels of PD-L1 in breast cancer samples. -
FIG. 21 provides graphs showing that PDL1 positive tumours have active DDRD signalling. -
FIG. 22 provides a graph showing that PDL1 expression is increased by co-culture with lymphocytes, specifically in DDRD+ models. -
FIG. 23 provides a graph and images showing that PDL1 Expression is Increased by DNA damage. Statistical significance of the data is indicated with * signifying a p value of <0.05, ** a p value of <0.01 and *** a p value of <0.001. -
FIG. 24 provides an image showing that alternative immune checkpoint target IDO1 expression is increased by genomic instability. -
FIG 25 provides a graph showing that IDO1 expression is increased by co-culture with lymphocytes, specifically in DDRD+ models -
FIG. 26 provides a graph showing that DDRD+ cells are protected from lymphocyte mediated cytotoxicity. -
FIG. 27 provides graphs and an image showing that IFN-γ drives PDL-1 expression in DDRD+ and protects against PBMC mediated cytotoxicity. -
FIG. 28 provides a graph showing that a blocking antibody to PDL-1 reverses resistance to PBMC mediated cytotoxicity in DDRD+ cells alone. -
FIG. 29 shows that DDRD identifies MSI colorectal samples. -
FIG. 30 illustrates a model of a DNA damage pathway. -
FIG. 31 : Kaplan Meier illustrating the difference in local recurrence survival rates for DDRD positive and DDRD negative patients that were treated with an immune based therapy (immune checkpoint modulator such as Ipilimumab or pembrolizumab) and/or a DNA damaging agent. HR = 0.39 [95% ClI: 0.18-0.84], p = 0.0008. -
FIG. 32 : Kaplan Meier illustrating the difference in distant recurrence survival rates for DDRD positive and DDRD negative patients that were treated with an immune based therapy (immune checkpoint modulator such as Ipilimumab or pembrolizumab) and/or a DNA damaging agent. HR = 0.44 [95% CI: 0.19-0.99], p = 0.0095. -
FIG. 33 : Kaplan Meier illustrating the difference in overall survival rates for DDRD positive and DDRD negative patients that were treated with an immune based therapy (immune checkpoint modulator such as Ipilimumab or pembrolizumab) and/or a DNA damaging agent. HR = 0.31 [95% CI: 0.12-0.81], p = 0.0006. - The invention provides a method for predicting responsiveness to an antagonist of an inhibitory immune checkpoint and/or an agonist of a stimulatory immune checkpoint, comprising: determining the RNA expression level of at least one gene selected from Table 2B in a sample comprising cancer cells or nucleic acids derived therefrom from the subject wherein the determined RNA expression level is used to identify the subject as having a cancer in which the STING/TBK1/IRF3 pathway is activated due to a deficiency in DNA damage repair and thereby predict responsiveness to an antagonist of an inhibitory immune checkpoint and/or an agonist of a stimulatory immune checkpoint. In any of the methods of the invention, the RNA expression level of one or more additional genes (i.e. genes other than those provided in Table 2B) may also be determined and used to predict responsiveness to an antagonist of an inhibitory immune checkpoint and/or an agonist of a stimulatory immune checkpoint.
- In the methods an increased RNA expression level of the at least one gene may predict responsiveness to an antagonist of an inhibitory immune checkpoint and/or an agonist of a stimulatory immune checkpoint.
- The methods may comprise determining the RNA expression level of at least 2 of the genes and the determined RNA expression levels may be used to generate a combined test score, wherein a positive combined test score (generally above threshold, but may be equal to or above threshold) predicts responsiveness to an antagonist of an inhibitory immune checkpoint and/or an agonist of a stimulatory immune checkpoint.
- The methods may comprise: deriving a combined test score that captures the RNA expression levels; providing a threshold score comprising information correlating the combined test score and responsiveness; and comparing the combined test score to the threshold score; wherein responsiveness is predicted when the combined test score exceeds the threshold score.
- The methods may comprise determining the RNA expression level of at least 6 genes, at least 7 genes, at least 8 genes, at least 9 genes, at least 10 genes, at least 11 genes, at least 12 genes, at least 13 genes, at least 14 genes, at least 15 genes, at least 16 genes, at least 17 genes, at least 18 genes, at least 19 genes, at least 20 genes, at least 21 genes, at least 22 genes, at least 23 genes, at least 24 genes, at least 25 genes, at least 26 genes, at least 27 genes, at least 28 genes, at least 29 genes, at least 30 genes, at least 31 genes, at least 32 genes, at least 33 genes, at least 34 genes, at least 35 genes, at least 36 genes, at least 37 genes, at least 38 genes, at least 39 genes, at least 40 genes, at least 41 genes, at least 42 genes, or at least 43 genes, selected from CXCL10, MX1, IDO1, IFI44L, CD2, GBP5, PRAME, ITGAL, LRP4, APOL3, CDR1, FYB, TSPAN7, RAC2, KLHDC7B, GRB14, AC138128.1, KIF26A, CD274, CD109, ETV7, MFAP5, OLFM4, PI15, FOSB, FAM19A5, NLRC5, PRICKLE1, EGR1, CLDN10, ADAMTS4, SP140L, ANXA1, RSAD2, ESR1, IKZF3, OR2I1P, EGFR, NAT1, LATS2, CYP2B6, PTPRC, PPP1R1A, and AL137218.1.
- The methods may comprise determining the RNA expression level of at least 1 gene selected from CD2, ITGAL, PTPRC, CXCL10 and IDO1, together with at least 1 further gene, at least 2 further genes, at least 3 further genes, at least 4 further genes, at least 5 further genes, at least 6 further genes, at least 7 further genes, at least 8 further genes, at least 9 further genes, at least 10 further genes, at least 11 further genes, at least 12 further genes, at least 13 further genes, at least 14 further genes, at least 15 further genes, at least 16 further genes, at least 17 further genes, at least 18 further genes, at least 19 further genes, at least 20 further genes, at least 21 further genes, at least 22 further genes, at least 23 further genes, at least 24 further genes, at least 25 further genes, at least 26 further genes, at least 27 further genes, at least 28 further genes, at least 29 further genes, at least 30 further genes, at least 31 further genes, at least 32 further genes, at least 33 further genes, at least 34 further genes, at least 35 further genes, at least 36 further genes, at least 37 further genes, or at least 38 further genes, selected from MX1, IFI44L, GBP5, PRAME, LRP4, APOL3, CDR1, FYB, TSPAN7, RAC2, KLHDC7B, GRB14, AC138128.1, KIF26A, CD274, CD109, ETV7, MFAP5, OLFM4, PI15, FOSB, FAM19A5, NLRC5, PRICKLE1, EGR1, CLDN10, ADAMTS4, SP140L, ANXA1, RSAD2, ESR1, IKZF3, OR2I1P, EGFR, NAT1, LATS2, CYP2B6, PPP1R1A, and AL137218.1. Preferably, the methods comprise determining the RNA expression level of at least 1 gene selected from CD2, ITGAL, PTPRC, CXCL10 and IDO1, together with each of MX1, IFI44L, GBP5, PRAME, LRP4, APOL3, CDR1, FYB, TSPAN7, RAC2, KLHDC7B, GRB14, AC138128.1, KIF26A, CD274, CD109, ETV7, MFAP5, OLFM4, PI15, FOSB, FAM19A5, NLRC5, PRICKLE1, EGR1, CLDN10, ADAMTS4, SP140L, ANXA1, RSAD2, ESR1, IKZF3, OR2I1P, EGFR, NAT1, LATS2, CYP2B6, PPP1R1A, and AL137218.1.
- The methods may comprise determining the RNA expression level of at least 2 genes selected from CD2, ITGAL, PTPRC, CXCL10 and IDO1, together with at least 1 further gene, at least 2 further genes, at least 3 further genes, at least 4 further genes, at least 5 further genes, at least 6 further genes, at least 7 further genes, at least 8 further genes, at least 9 further genes, at least 10 further genes, at least 11 further genes, at least 12 further genes, at least 13 further genes, at least 14 further genes, at least 15 further genes, at least 16 further genes, at least 17 further genes, at least 18 further genes, at least 19 further genes, at least 20 further genes, at least 21 further genes, at least 22 further genes, at least 23 further genes, at least 24 further genes, at least 25 further genes, at least 26 further genes, at least 27 further genes, at least 28 further genes, at least 29 further genes, at least 30 further genes, at least 31 further genes, at least 32 further genes, at least 33 further genes, at least 34 further genes, at least 35 further genes, at least 36 further genes, at least 37 further genes, or at least 38 further genes, selected from MX1, IFI44L, GBP5, PRAME, LRP4, APOL3, CDR1, FYB, TSPAN7, RAC2, KLHDC7B, GRB14, AC138128.1, KIF26A, CD274, CD109, ETV7, MFAP5, OLFM4, PI15, FOSB, FAM19A5, NLRC5, PRICKLE1, EGR1, CLDN10, ADAMTS4, SP140L, ANXA1, RSAD2, ESR1, IKZF3, OR2I1P, EGFR, NAT1, LATS2, CYP2B6, PPP1R1A, and AL137218.1. Preferably, the methods comprise determining the RNA expression level of at least 2 genes selected from CD2, ITGAL, PTPRC, CXCL10 and IDO1, together with each of MX1, IFI44L, GBP5, PRAME, LRP4, APOL3, CDR1, FYB, TSPAN7, RAC2, KLHDC7B, GRB14, AC138128.1, KIF26A, CD274, CD109, ETV7, MFAP5, OLFM4, PI15, FOSB, FAM19A5, NLRC5, PRICKLE1, EGR1, CLDN10, ADAMTS4, SP140L, ANXA1, RSAD2, ESR1, IKZF3, OR2I1P, EGFR, NAT1, LATS2, CYP2B6, PPP1R1A, and AL137218.1.
- The methods may comprise determining the RNA expression level of at least 3 genes selected from CD2, ITGAL, PTPRC, CXCL10 and IDO1, together with at least 1 further gene, at least 2 further genes, at least 3 further genes, at least 4 further genes, at least 5 further genes, at least 6 further genes, at least 7 further genes, at least 8 further genes, at least 9 further genes, at least 10 further genes, at least 11 further genes, at least 12 further genes, at least 13 further genes, at least 14 further genes, at least 15 further genes, at least 16 further genes, at least 17 further genes, at least 18 further genes, at least 19 further genes, at least 20 further genes, at least 21 further genes, at least 22 further genes, at least 23 further genes, at least 24 further genes, at least 25 further genes, at least 26 further genes, at least 27 further genes, at least 28 further genes, at least 29 further genes, at least 30 further genes, at least 31 further genes, at least 32 further genes, at least 33 further genes, at least 34 further genes, at least 35 further genes, at least 36 further genes, at least 37 further genes, or at least 38 further genes, selected from MX1, IFI44L, GBP5, PRAME, LRP4, APOL3, CDR1, FYB, TSPAN7, RAC2, KLHDC7B, GRB14, AC138128.1, KIF26A, CD274, CD109, ETV7, MFAP5, OLFM4, PI15, FOSB, FAM19A5, NLRC5, PRICKLE1, EGR1, CLDN10, ADAMTS4, SP140L, ANXA1, RSAD2, ESR1, IKZF3, OR2I1P, EGFR, NAT1, LATS2, CYP2B6, PPP1R1A, and AL137218.1. Preferably, the methods comprise determining the RNA expression level of at least 3 genes selected from CD2, ITGAL, PTPRC, CXCL10 and IDO1, together with each of MX1, IFI44L, GBP5, PRAME, LRP4, APOL3, CDR1, FYB, TSPAN7, RAC2, KLHDC7B, GRB14, AC138128.1, KIF26A, CD274, CD109, ETV7, MFAP5, OLFM4, PI15, FOSB, FAM19A5, NLRC5, PRICKLE1, EGR1, CLDN10, ADAMTS4, SP140L, ANXA1, RSAD2, ESR1, IKZF3, OR2I1P, EGFR, NAT1, LATS2, CYP2B6, PPP1R1A, and AL137218.1.
- The methods may comprise determining the RNA expression level of at least 4 genes selected from CD2, ITGAL, PTPRC, CXCL10 and IDO1, together with at least 1 further gene, at least 2 further genes, at least 3 further genes, at least 4 further genes, at least 5 further genes, at least 6 further genes, at least 7 further genes, at least 8 further genes, at least 9 further genes, at least 10 further genes, at least 11 further genes, at least 12 further genes, at least 13 further genes, at least 14 further genes, at least 15 further genes, at least 16 further genes, at least 17 further genes, at least 18 further genes, at least 19 further genes, at least 20 further genes, at least 21 further genes, at least 22 further genes, at least 23 further genes, at least 24 further genes, at least 25 further genes, at least 26 further genes, at least 27 further genes, at least 28 further genes, at least 29 further genes, at least 30 further genes, at least 31 further genes, at least 32 further genes, at least 33 further genes, at least 34 further genes, at least 35 further genes, at least 36 further genes, at least 37 further genes, or at least 38 further genes, selected from MX1, IFI44L, GBP5, PRAME, LRP4, APOL3, CDR1, FYB, TSPAN7, RAC2, KLHDC7B, GRB14, AC138128.1, KIF26A, CD274, CD109, ETV7, MFAP5, OLFM4, PI15, FOSB, FAM19A5, NLRC5, PRICKLE1, EGR1, CLDN10, ADAMTS4, SP140L, ANXA1, RSAD2, ESR1, IKZF3, OR2I1P, EGFR, NAT1, LATS2, CYP2B6, PPP1R1A, and AL137218.1. Preferably, the methods comprise determining the RNA expression level of at least 4 genes selected from CD2, ITGAL, PTPRC, CXCL10 and IDO1, together with each of MX1, IFI44L, GBP5, PRAME, LRP4, APOL3, CDR1, FYB, TSPAN7, RAC2, KLHDC7B, GRB14, AC138128.1, KIF26A, CD274, CD109, ETV7, MFAP5, OLFM4, PI15, FOSB, FAM19A5, NLRC5, PRICKLE1, EGR1, CLDN10, ADAMTS4, SP140L, ANXA1, RSAD2, ESR1, IKZF3, OR2I1P, EGFR, NAT1, LATS2, CYP2B6, PPP1R1A, and AL137218.1.
- The methods may comprise determining the RNA expression level of each of CD2, ITGAL, PTPRC, CXCL10 and IDO1, together with at least 1 further gene, at least 2 further genes, at least 3 further genes, at least 4 further genes, at least 5 further genes, at least 6 further genes, at least 7 further genes, at least 8 further genes, at least 9 further genes, at least 10 further genes, at least 11 further genes, at least 12 further genes, at least 13 further genes, at least 14 further genes, at least 15 further genes, at least 16 further genes, at least 17 further genes, at least 18 further genes, at least 19 further genes, at least 20 further genes, at least 21 further genes, at least 22 further genes, at least 23 further genes, at least 24 further genes, at least 25 further genes, at least 26 further genes, at least 27 further genes, at least 28 further genes, at least 29 further genes, at least 30 further genes, at least 31 further genes, at least 32 further genes, at least 33 further genes, at least 34 further genes, at least 35 further genes, at least 36 further genes, at least 37 further genes, or at least 38 further genes, selected from MX1, IFI44L, GBP5, PRAME, LRP4, APOL3, CDR1, FYB, TSPAN7, RAC2, KLHDC7B, GRB14, AC138128.1, KIF26A, CD274, CD109, ETV7, MFAP5, OLFM4, PI15, FOSB, FAM19A5, NLRC5, PRICKLE1, EGR1, CLDN10, ADAMTS4, SP140L, ANXA1, RSAD2, ESR1, IKZF3, OR2I1P, EGFR, NAT1, LATS2, CYP2B6, PPP1R1A, and AL137218.1.
- The methods may comprise determining the RNA expression level of at least 12 genes selected from Table 1.
- The methods may comprise determining the RNA expression level of at least 1 gene selected from CD2, ITGAL, PTPRC, CXCL10, IDO1, CD3D, HLA-DPB1, CXCL9, CCL5, STAT1, IL2RG, CD3E, IRF1, IKZF3 and IGJ together with at least one further gene selected from (the remaining genes in) Table 1 or together with at least one further gene from the (remaining genes in) Table 2B (the 44 gene panel).
- The methods may comprise determining the RNA expression level of each of:
- CXCL10;
- CXCL10 and MX1;
- CXCL10, IDO1 and MX1;
- CXCL10, IDO1, IFI44L and MX1;
- CD2, CXCL10, IDO1, IFI44L and MX1;
- CD2, CXCL10, GBP5, IDO1, IFI44L and MX1;
- CD2, CXCL10, GBP5, IDO1, IFI44L, MX1 and PRAME;
- CD2, CXCL10, GBP5, IDO1, IFI44L, ITGAL, MX1 and PRAME;
- CD2, CXCL10, GBP5, IDO1, IFI44L, ITGAL, LRP4, MX1 and PRAME;
- APOL3, CD2, CXCL10, GBP5, IDO1, IFI44L, ITGAL, LRP4, MX1 and PRAME;
- APOL3, CD2, CDR1, CXCL10, GBP5, IDO1, IFI44L, ITGAL, LRP4, MX1 and PRAME;
- APOL3, CD2, CDR1, CXCL10, FYB, GBP5, IDO1, IFI44L, ITGAL, LRP4, MX1 and PRAME;
- APOL3, CD2, CDR1, CXCL10, FYB, GBP5, IDO1, IFI44L, ITGAL, LRP4, MX1, PRAME and TSPAN7;
- APOL3, CD2, CDR1, CXCL10, FYB, GBP5, IDO1, IFI44L, ITGAL, LRP4, MX1, PRAME, RAC2 and TSPAN7;
- APOL3, CD2, CDR1, CXCL10, FYB, GBP5, IDO1, IFI44L, ITGAL, KLHDC7B, LRP4, MX1, PRAME, RAC2 and TSPAN7;
- APOL3, CD2, CDR1, CXCL10, FYB, GBP5, GRB14, IDO1, IFI44L, ITGAL, KLHDC7B, LRP4, MX1, PRAME, RAC2 and TSPAN7;
- AC138128.1, APOL3, CD2, CDR1, CXCL10, FYB, GBP5, GRB14, IDO1, IFI44L, ITGAL, KLHDC7B, LRP4, MX1, PRAME, RAC2 and TSPAN7;
- AC138128.1, APOL3, CD2, CDR1, CXCL10, FYB, GBP5, GRB14, IDO1, IFI44L, ITGAL, KIF26A, KLHDC7B, LRP4, MX1, PRAME, RAC2 and TSPAN7;
- AC138128.1, APOL3, CD2, CD274, CDR1, CXCL10, FYB, GBP5, GRB14, IDO1, IFI44L, ITGAL, KIF26A, KLHDC7B, LRP4, MX1, PRAME, RAC2 and TSPAN7;
- AC138128.1, APOL3, CD109, CD2, CD274, CDR1, CXCL10, FYB, GBP5, GRB14, IDO1, IFI44L, ITGAL, KIF26A, KLHDC7B, LRP4, MX1, PRAME, RAC2 and TSPAN7;
- AC138128.1, APOL3, CD109, CD2, CD274, CDR1, CXCL10, ETV7, FYB, GBP5, GRB14, IDO1, IFI44L, ITGAL, KIF26A, KLHDC7B, LRP4, MX1, PRAME, RAC2 and TSPAN7;
- AC138128.1, APOL3, CD109, CD2, CD274, CDR1, CXCL10, ETV7, FYB, GBP5, GRB14, IDO1, IFI44L, ITGAL, KIF26A, KLHDC7B, LRP4, MFAP5, MX1, PRAME, RAC2 and TSPAN7;
- AC138128.1, APOL3, CD109, CD2, CD274, CDR1, CXCL10, ETV7, FYB, GBP5, GRB14, IDO1, IFI44L, ITGAL, KIF26A, KLHDC7B, LRP4, MFAP5, MX1, OLFM4, PRAME, RAC2 and TSPAN7;
- AC138128.1, APOL3, CD109, CD2, CD274, CDR1, CXCL10, ETV7, FYB, GBP5, GRB14, IDO1, IFI44L, ITGAL, KIF26A, KLHDC7B, LRP4, MFAP5, MX1, OLFM4, PI15, PRAME, RAC2 and TSPAN7;
- AC138128.1, APOL3, CD109, CD2, CD274, CDR1, CXCL10, ETV7, FOSB, FYB, GBP5, GRB14, IDO1, IFI44L, ITGAL, KIF26A, KLHDC7B, LRP4, MFAP5, MX1, OLFM4, PI15, PRAME, RAC2 and TSPAN7;
- AC138128.1, APOL3, CD109, CD2, CD274, CDR1, CXCL10, ETV7, FAM19A5, FOSB, FYB, GBP5, GRB14, IDO1, IFI44L, ITGAL, KIF26A, KLHDC7B, LRP4, MFAP5, MX1, OLFM4, PI15, PRAME, RAC2 and TSPAN7;
- AC138128.1, APOL3, CD109, CD2, CD274, CDR1, CXCL10, ETV7, FAM19A5, FOSB, FYB, GBP5, GRB14, IDO1, IFI44L, ITGAL, KIF26A, KLHDC7B, LRP4, MFAP5, MX1, NLRC5, OLFM4, PI15, PRAME, RAC2 and TSPAN7;
- AC138128.1, APOL3, CD109, CD2, CD274, CDR1, CXCL10, ETV7, FAM19A5, FOSB, FYB, GBP5, GRB14, IDO1, IFI44L, ITGAL, KIF26A, KLHDC7B, LRP4, MFAP5, MX1, NLRC5, OLFM4, P115, PRAME, PRICKLE1, RAC2 and TSPAN7;
- AC138128.1, APOL3, CD109, CD2, CD274, CDR1, CXCL10, EGR1, ETV7, FAM19A5, FOSB, FYB, GBP5, GRB14, IDO1, IFI44L, ITGAL, KIF26A, KLHDC7B, LRP4, MFAP5, MX1, NLRC5, OLFM4, P115, PRAME, PRICKLE1, RAC2 and TSPAN7;
- AC138128.1, APOL3, CD109, CD2, CD274, CDR1, CLDN10, CXCL10, EGR1, ETV7, FAM19A5, FOSB, FYB, GBP5, GRB14, IDO1, IFI44L, ITGAL, KIF26A, KLHDC7B, LRP4, MFAP5, MX1, NLRC5, OLFM4, PI15, PRAME, PRICKLE1, RAC2 and TSPAN7;
- AC138128.1, ADAMTS4, APOL3, CD109, CD2, CD274, CDR1, CLDN10, CXCL10, EGR1, ETV7, FAM19A5, FOSB, FYB, GBP5, GRB14, IDO1, IFI44L, ITGAL, KIF26A, KLHDC7B, LRP4, MFAP5, MX1, NLRC5, OLFM4, PI15, PRAME, PRICKLE1, RAC2 and TSPAN7;
- AC138128.1, ADAMTS4, APOL3, CD109, CD2, CD274, CDR1, CLDN10, CXCL10, EGR1, ETV7, FAM19A5, FOSB, FYB, GBP5, GRB14, IDO1, IFI44L, ITGAL, KIF26A, KLHDC7B, LRP4, MFAP5, MX1, NLRC5, OLFM4, PI15, PRAME, PRICKLE1, RAC2, SP140L and TSPAN7;
- AC138128.1, ADAMTS4, ANXA1, APOL3, CD109, CD2, CD274, CDR1, CLDN10, CXCL10, EGR1, ETV7, FAM19A5, FOSB, FYB, GBP5, GRB14, IDO1, IFI44L, ITGAL, KIF26A, KLHDC7B, LRP4, MFAP5, MX1, NLRC5, OLFM4, PI15, PRAME, PRICKLE1, RAC2, SP140L and TSPAN7;
- AC138128.1, ADAMTS4, ANXA1, APOL3, CD109, CD2, CD274, CDR1, CLDN10, CXCL10, EGR1, ETV7, FAM19A5, FOSB, FYB, GBP5, GRB14, IDO1, IFI44L, ITGAL, KIF26A, KLHDC7B, LRP4, MFAP5, MX1, NLRC5, OLFM4, PI15, PRAME, PRICKLE1, RAC2, RSAD2, SP140L and TSPAN7;
- AC138128.1, ADAMTS4, ANXA1, APOL3, CD109, CD2, CD274, CDR1, CLDN10, CXCL10, EGR1, ESR1, ETV7, FAM19A5, FOSB, FYB, GBP5, GRB14, IDO1, IFI44L, ITGAL, KIF26A, KLHDC7B, LRP4, MFAP5, MX1, NLRC5, OLFM4, PI15, PRAME, PRICKLE1, RAC2, RSAD2, SP140L and TSPAN7;
- AC138128.1, ADAMTS4, ANXA1, APOL3, CD109, CD2, CD274, CDR1, CLDN10, CXCL10, EGR1, ESR1, ETV7, FAM19A5, FOSB, FYB, GBP5, GRB14, IDO1, IFI44L, IKZF3, ITGAL, KIF26A, KLHDC7B, LRP4, MFAP5, MX1, NLRC5, OLFM4, PI15, PRAME, PRICKLE1, RAC2, RSAD2, SP140L and TSPAN7;
- AC138128.1, ADAMTS4, ANXA1, APOL3, CD109, CD2, CD274, CDR1, CLDN10, CXCL10, EGR1, ESR1, ETV7, FAM19A5, FOSB, FYB, GBP5, GRB14, IDO1, IFI44L, IKZF3, ITGAL, KIF26A, KLHDC7B, LRP4, MFAP5, MX1, NLRC5, OLFM4, OR2I1P, PI15, PRAME, PRICKLE1, RAC2, RSAD2, SP140L and TSPAN7;
- AC138128.1, ADAMTS4, ANXA1, APOL3, CD109, CD2, CD274, CDR1, CLDN10, CXCL10, EGFR, EGR1, ESR1, ETV7, FAM19A5, FOSB, FYB, GBP5, GRB14, IDO1, IFI44L, IKZF3, ITGAL, KIF26A, KLHDC7B, LRP4, MFAP5, MX1, NLRC5, OLFM4, OR2I1P, PI15, PRAME, PRICKLE1, RAC2, RSAD2, SP140L and TSPAN7;
- AC138128.1, ADAMTS4, ANXA1, APOL3, CD109, CD2, CD274, CDR1, CLDN10, CXCL10, EGFR, EGR1, ESR1, ETV7, FAM19A5, FOSB, FYB, GBP5, GRB14, IDO1, IFI44L, IKZF3, ITGAL, KIF26A, KLHDC7B, LRP4, MFAP5, MX1, NAT1, NLRC5, OLFM4, OR2I1P, PI15, PRAME, PRICKLE1, RAC2, RSAD2, SP140L and TSPAN7;
- AC138128.1, ADAMTS4, ANXA1, APOL3, CD109, CD2, CD274, CDR1, CLDN10, CXCL10, EGFR, EGR1, ESR1, ETV7, FAM19A5, FOSB, FYB, GBP5, GRB14, IDO1, IFI44L, IKZF3, ITGAL, KIF26A, KLHDC7B, LATS2, LRP4, MFAP5, MX1, NAT1, NLRC5, OLFM4, OR2I1P, P115, PRAME, PRICKLE1, RAC2, RSAD2, SP140 and TSPAN7;
- AC138128.1, ADAMTS4, ANXA1, APOL3, CD109, CD2, CD274, CDR1, CLDN10, CXCL10, CYP2B6, EGFR, EGR1, ESR1, ETV7, FAM19A5, FOSB, FYB, GBP5, GRB14, IDO1, IFI44L, IKZF3, ITGAL, KIF26A, KLHDC7B, LATS2, LRP4, MFAP5, MX1, NAT1, NLRC5, OLFM4, OR2I1P, P115, PRAME, PRICKLE1, RAC2, RSAD2, SP140L and TSPAN7;
- AC138128.1, ADAMTS4, ANXA1, APOL3, CD109, CD2, CD274, CDR1, CLDN10, CXCL10, CYP2B6, EGFR, EGR1, ESR1, ETV7, FAM19A5, FOSB, FYB, GBP5, GRB14, IDO1, IFI44L, IKZF3, ITGAL, KIF26A, KLHDC7B, LATS2, LRP4, MFAP5, MX1, NAT1, NLRC5, OLFM4, OR2I1P, P115, PRAME, PRICKLE1, PTPRC, RAC2, RSAD2, SP140L and TSPAN7;
- AC138128.1, ADAMTS4, ANXA1, APOL3, CD109, CD2, CD274, CDR1, CLDN10, CXCL10, CYP2B6, EGFR, EGR1, ESR1, ETV7, FAM19A5, FOSB, FYB, GBP5, GRB14, IDO1, IFI44L, IKZF3, ITGAL, KIF26A, KLHDC7B, LATS2, LRP4, MFAP5, MX1, NAT1, NLRC5, OLFM4, OR2I1P, P115, PPP1R1A, PRAME, PRICKLE1, PTPRC, RAC2, RSAD2, SP140L and TSPAN7; or
- CXCL10, MX1, IDO1, IFI44L, CD2, GBP5, PRAME, ITGAL, LRP4, APOL3, CDR1, FYB, TSPAN7, RAC2, KLHDC7B, GRB14, AC138128.1, KIF26A, CD274, CD109, ETV7, MFAP5, OLFM4, P115, FOSB, FAM19A5, NLRC5, PRICKLE1, EGR1, CLDN10, ADAMTS4, SP140L, ANXA1, RSAD2, ESR1, IKZF3, OR2I1P, EGFR, NAT1, LATS2, CYP2B6, PTPRC, PPP1R1A, and AL137218.1.
- In the methods the weight values for each gene may be as set out in Table 2B or the weight and/or bias values for each gene may be as set out in any one of Tables 3-45.
- The methods may comprise determining the RNA expression level of at least one, up to all, of CCL5, CXCL9 and CXCL10 together with at least one further gene selected from (the remaining genes in) Table 1 or together with at least one further gene from the (remaining genes in) Table 2B (the 44 gene panel).
- The invention provides a method for predicting responsiveness to an antagonist of an inhibitory immune checkpoint and/or an agonist of a stimulatory immune checkpoint in combination with a DNA damage therapeutic agent comprising: determining the RNA expression level of at least one gene selected from Table 2Bin a sample comprising cancer cells or nucleic acids derived therefrom from the subject wherein the determined RNA expression level is used to identify the subject as having a cancer in which the STING/TBK1/IRF3 pathway is activated due to a deficiency in DNA damage repair and thereby predict responsiveness to an antagonist of an inhibitory immune checkpoint and/or an agonist of a stimulatory immune checkpoint in combination with a DNA damage therapeutic agent. The determined RNA expression level can be used to predict responsiveness to the simultaneous, separate or sequential administration (or use) of an antagonist of an inhibitory immune checkpoint and/or an agonist of a stimulatory immune checkpoint in combination with a DNA damage therapeutic agent
- In the methods an increased RNA expression level of the at least one gene may predict responsiveness to a an antagonist of an inhibitory immune checkpoint and/or an agonist of a stimulatory immune checkpoint in combination with a DNA damage therapeutic agent.
- The methods may comprise determining the RNA expression level of at least 2 of the genes and the determined RNA expression levels may be used to generate a combined test score, wherein a positive combined test score (generally above threshold, but may be equal to or above threshold) predicts responsiveness to an antagonist of an inhibitory immune checkpoint and/or an agonist of a stimulatory immune checkpoint in combination with a DNA damage therapeutic agent.
- The methods for predicting responsiveness to an antagonist of an inhibitory immune checkpoint and/or an agonist of a stimulatory immune checkpoint in combination with a DNA damage therapeutic agent may comprise determining the RNA expression level of any of the genes or sets of genes described herein.
- The invention provides a method for identifying a cancer that can be effectively treated with an antagonist of an inhibitory immune checkpoint and/or an agonist of a stimulatory immune checkpoint comprising: determining the RNA expression level of at least one gene selected from Table 2B in a sample comprising cancer cells or nucleic acids derived therefrom from the subject wherein the determined RNA expression level is used to identify the subject as having a cancer in which the STING/TBK1/IRF3 pathway is activated due to a deficiency in DNA damage repair and thereby identify a cancer that can be effectively treated with an antagonist of an inhibitory immune checkpoint and/or an agonist of a stimulatory immune checkpoint.
- In the methods an increased RNA expression level of the at least one gene may identify a cancer that can be effectively treated with an antagonist of an inhibitory immune checkpoint and/or an agonist of a stimulatory immune checkpoint.
- The methods may comprise determining the RNA expression level of at least 2 genes and the determined RNA expression levels may be used to generate a combined test score, wherein a positive combined test score (generally above threshold, but may be equal to or above threshold) identifies a cancer that can be effectively treated with an antagonist of an inhibitory immune checkpoint and/or an agonist of a stimulatory immune checkpoint.
- The methods may comprise: deriving a combined test score that captures the RNA expression levels; providing a threshold score comprising information correlating the combined test score and responsiveness; and comparing the combined test score to the threshold score; wherein a cancer that can be effectively treated is identified when the combined test score exceeds the threshold score.
- The methods for identifying a cancer that can be effectively treated with an antagonist of an inhibitory immune checkpoint and/or an agonist of a stimulatory immune checkpoint may comprise determining the RNA expression level of any of the genes or sets of genes described herein.
- The invention provides a method for identifying a cancer that can be effectively treated with an antagonist of an inhibitory immune checkpoint and/or an agonist of a stimulatory immune checkpoint in combination with a DNA damage therapeutic agent comprising: determining the RNA expression level of at least one gene selected from Table 2B in a sample comprising cancer cells or nucleic acids derived therefrom from the subject wherein the determined RNA expression level is used to identify the subject as having a cancer in which the STING/TBK1/IRF3 pathway is activated due to a deficiency in DNA damage repair and thereby identify a cancer that can be effectively treated with an antagonist of an inhibitory immune checkpoint and/or an agonist of a stimulatory immune checkpoint in combination with a DNA damage therapeutic agent. The determined RNA expression level can be used to identify a cancer that can be effectively treated with the simultaneous, separate or sequential administration (or use) of an antagonist of an inhibitory immune checkpoint and/or an agonist of a stimulatory immune checkpoint in combination with a DNA damage therapeutic agent.
- In the methods an increased RNA expression level of the at least one gene may identify a cancer that can be effectively treated with an antagonist of an inhibitory immune checkpoint and/or an agonist of a stimulatory immune checkpoint in combination with a DNA damage therapeutic agent.
- The methods may comprise determining the RNA expression level of at least 2 of the genes and the determined RNA expression levels may be used to generate a combined test score, wherein a positive combined test score (generally above threshold, but may be equal to or above threshold) identifies a cancer that can be effectively treated with an antagonist of an inhibitory immune checkpoint and/or an agonist of a stimulatory immune checkpoint in combination with a DNA damage therapeutic agent.
- The methods for identifying a cancer that can be effectively treated with an antagonist of an inhibitory immune checkpoint and/or an agonist of a stimulatory immune checkpoint in combination with a DNA damage therapeutic agent may comprise determining the RNA expression level of any of the genes or sets of genes described herein.
- The invention provides a method for selecting treatment for a cancer comprising: determining the RNA expression level of at least one gene selected from Table 2B in a sample comprising cancer cells or nucleic acids derived therefrom from the subject wherein the determined RNA expression level is used to identify the subject as having a cancer in which the STING/TBK1/IRF3 pathway is activated due to a deficiency in DNA damage repair and thereby select an antagonist of an inhibitory immune checkpoint and/or an agonist of a stimulatory immune checkpoint for use in treatment of the cancer.
- In the methods an increased RNA expression level of the at least one gene is used to select an antagonist of an inhibitory immune checkpoint and/or an agonist of a stimulatory immune checkpoint for use in treatment of the cancer.
- The methods may comprise determining the RNA expression level of at least 2 of the genes and the determined RNA expression levels may be used to generate a combined test score, wherein a positive combined test score (generally above threshold, but may be equal to or above threshold) is used to select an antagonist of an inhibitory immune checkpoint and/or an agonist of a stimulatory immune checkpoint for use in treatment of the cancer.
- The methods described herein may further comprise treating the cancer using the selected antagonist and/or agonist.
- The methods may comprise: deriving a combined test score that captures the RNA expression levels; providing a threshold score comprising information correlating the combined test score and responsiveness; and comparing the combined test score to the threshold score; wherein an antagonist of an inhibitory immune checkpoint and/or an agonist of a stimulatory immune checkpoint is selected for use when the combined test score exceeds the threshold score.
- The methods for selecting treatment for a cancer may comprise determining the RNA expression level of any of the genes or sets of genes described herein.
- The invention provides a method for selecting treatment for a cancer comprising: determining the RNA expression level of at least one gene selected from Table 2Bin a sample comprising cancer cells or nucleic acids derived therefrom from the subject wherein the determined RNA expression level is used to identify the subject as having a cancer in which the STING/TBK1/IRF3 pathway is activated due to a deficiency in DNA damage repair and thereby select an antagonist of an inhibitory immune checkpoint and/or an agonist of a stimulatory immune checkpoint, in combination with a DNA damage therapeutic agent, for use in treatment of the cancer. The determined RNA expression level can be used to select an antagonist of an inhibitory immune checkpoint and/or an agonist of a stimulatory immune checkpoint, in combination with a DNA damage therapeutic agent, for simultaneous, separate or sequential use in treatment of the cancer.
- In the methods an increased RNA expression level of the at least one gene may be used to select an antagonist of an inhibitory immune checkpoint and/or an agonist of a stimulatory immune checkpoint, in combination with a DNA damage therapeutic agent, for use in treatment of the cancer.
- The methods may comprise determining the RNA expression level of at least 2 of the genes and the determined RNA expression levels may be used to generate a combined test score, wherein a positive combined test score (generally above threshold, but may be equal to or above threshold) is used to select an antagonist of an inhibitory immune checkpoint and/or an agonist of a stimulatory immune checkpoint, in combination with a DNA damage therapeutic agent, for use in treatment of the cancer.
- The methods described herein may comprise treating the cancer using the selected modulator, such as antagonist and/or agonist, in combination with a DNA damage therapeutic agent.
- The methods may comprise: deriving a combined test score that captures the RNA expression levels; providing a threshold score comprising information correlating the combined test score and responsiveness; and comparing the combined test score to the threshold score; wherein an antagonist of an inhibitory immune checkpoint and/or an agonist of a stimulatory immune checkpoint in combination with a DNA damage therapeutic agent is selected for use when the combined test score exceeds the threshold score.
- In the methods the combined test score (or "signature score") may be derived according to the formula:

- The combined test score may be derived using the RNA expression level(s) of any of the genes or groups of genes described herein. The combined test score may be derived using the RNA expression level of one or more additional genes.
- Described herein is a method of treating cancer comprising administration of a modulator of an immune checkpoint, such as an antagonist of an inhibitory immune checkpoint and/or an agonist of a stimulatory immune checkpoint to a subject, characterised in that a sample from the subject, prior to administration, displays a positive combined test score derived from the determined expression levels of at least 2 genes from Table 2B, 2A or 1 or an increased level of expression of at least 1 gene from Table 2B, 2A or 1.
- Described herein is a method of treating cancer comprising administration of a modulator of an immune checkpoint, such as an antagonist of an inhibitory immune checkpoint and/or an agonist of a stimulatory immune checkpoint, in combination with a DNA damage therapeutic agent, to a subject, characterised in that a sample from the subject, prior to administration, displays a positive combined test score derived from the determined expression levels of at least 2 genes from Table 2B, 2A or 1 or an increased level of expression of at least 1 gene from Table 2B, 2A or 1. The a modulator of an immune checkpoint, such as antagonist of an inhibitory immune checkpoint and/or the agonist of a stimulatory immune checkpoint, and the DNA damage therapeutic agent can be administered simultaneously, separately or sequentially to the subject,
- The methods of treating cancer described herein may comprise determining the expression level of any of the genes or sets of genes described herein.
- The invention provides an antagonist of an inhibitory immune checkpoint and/or an agonist of a stimulatory immune checkpoint for use in the treatment of cancer in a subject wherein, prior to administration of the antagonist and/or agonist, a sample comprising cancer cells or nucleic acids derived therefrom from the subject displays:
- (a) a positive combined test score derived from the determined RNA expression levels of at least 2 genes from Table 2B, wherein the positive combined test score is above or is equal to or above a threshold score;
- or (b) an increased level of RNA expression of at least 1 gene from Table 2B;
which identifies the subject as having a cancer in which the STING/TBK1/IRF3 pathway is activated due to a deficiency in DNA damage repair, wherein:- (i) the antagonist of an inhibitory immune checkpoint is selected from an antibody and an inhibitory nucleic acid molecule; and
- (ii) the agonist of a stimulatory immune checkpoint is selected from an antibody, a lipocalin and a cytokine.
- The invention provides an antagonist of an inhibitory immune checkpoint and/or an agonist of a stimulatory immune checkpoint for use in the treatment of cancer in a subject wherein, prior to administration of the antagonist and/or agonist, a sample comprising cancer cells or nucleic acids derived therefrom from the subject displays:
- (a) a positive combined test score derived from the determined RNA expression levels of at least 2 genes from Table 2B, wherein the positive combined test score is above or is equal to or above a threshold score; or
- (b) an increased level of RNA expression of at least 1 gene from Table 2B;
which identifies the subject as having a cancer in which the STING/TBK1/IRF3 pathway is activated due to a deficiency in DNA damage repair and wherein the antagonist and/or agonist is administered in combination with a DNA damage therapeutic agent wherein:- (i) the antagonist of an inhibitory immune checkpoint is selected from an antibody and an inhibitory nucleic acid molecule;
- (ii) the agonist of a stimulatory immune checkpoint is selected from an antibody, a lipocalin and a cytokine; and
- (iii) the DNA damage therapeutic agent is selected from a DNA damaging agent, a DNA repair targeted therapy, an inhibitor of DNA damage signalling, an inhibitor of DNA damage induced cell cycle arrest and an inhibitor of a process indirectly leading to DNA damage.
- The invention provides an antagonist of an inhibitory immune checkpoint in combination with a DNA damage therapeutic agent and/or an agonist of a stimulatory immune checkpoint in combination with a DNA damage therapeutic agent for use in the treatment of cancer in a subject wherein, prior to administration of the antagonist and/or agonist and DNA damage therapeutic agent, a sample comprising cancer cells or nucleic acids derived therefrom from the subject displays:
- (a) a positive combined test score derived from the determined RNA expression levels of at least 2 genes from Table 2B, wherein the positive combined test score is above or is equal to or above a threshold score;
- or (b) an increased level of RNA expression of at least 1 gene from Table 2B; which identifies the subject as having a cancer in which the STING/TBK1/IRF3 pathway is activated due to a deficiency in DNA damage repair, wherein:
- (i) the antagonist of an inhibitory immune checkpoint is selected from an antibody and an inhibitory nucleic acid molecule;
- (ii) the agonist of a stimulatory immune checkpoint is selected from an antibody, a lipocalin and a cytokine; and
- (iii) the DNA damage therapeutic agent is selected from a DNA damaging agent, a DNA repair targeted therapy, an inhibitor of DNA damage signalling, an inhibitor of DNA damage induced cell cycle arrest and an inhibitor of a process indirectly leading to DNA damage.
- The genes for which the RNA expression level is determined may be any of the genes or sets of genes described herein.
- The subject may be selected for treatment according to any of the methods described herein.
- The sample may comprise cancer cells. The sample may be a tissue sample e.g. a fixed and embedded tissue sample.
- The cancer may be selected from leukemia, brain cancer, prostate cancer, liver cancer, ovarian cancer, stomach cancer, colorectal cancer, throat cancer, breast cancer, skin cancer, melanoma, lung cancer, sarcoma, cervical cancer, testicular cancer, bladder cancer, endocrine cancer, endometrial cancer, esophageal cancer, glioma, lymphoma, neuroblastoma, osteosarcoma, pancreatic cancer, pituitary cancer, renal cancer or head and neck cancer.
- The inhibitory immune checkpoint may be a regulatory pathway, or a molecule in such a pathway, that inhibits an immune response. The inhibitory immune checkpoint may be a polypeptide expressed by B-cells and/or T-cells. The inhibitory immune checkpoint may be an inhibitory receptor. The inhibitory immune checkpoint may be a membrane receptor. Preferably, the inhibitory immune checkpoint is an inhibitory membrane receptor. The ligand of the inhibitory immune checkpoint may be membrane bound or soluble.
- The inhibitory immune checkpoint may be selected from A2AR, B7-H3 (CD276), B7-H4 (VTCN1), BTLA (CD272), CTLA-4 (CD152), IDO, KIR, LAG3, PD-1/PD-L1, TIM-3 and VISTA. In some embodiments, the inhibitory immune checkpoint is not PD-1/PD-L1. In some embodiments, the immune checkpoint is IDO.
- The antagonist of an inhibitory immune checkpoint may amplify an antigen-specific B-cell and/or T-cell response. The antagonist of an inhibitory immune checkpoint may inhibit the interaction between an inhibitory receptor and its ligand. The antagonist of an inhibitory immune checkpoint may be selected from an antibody and an inhibitory nucleic acid molecule.
- The antibody may be of monoclonal or polyclonal origin. Fragments and derivative antibodies may also be utilised, to include without limitation Fab fragments, ScFv, single domain antibodies, nanoantibodies, heavy chain antibodies, aptamers etc. which retain peptide-specific binding function and these are included in the definition of "antibody". Such antibodies are useful in the practice of the invention. Methods for generating specific antibodies are known to those skilled in the art. Antibodies may be of human or non-human origin (e.g. rodent, such as rat or mouse) and be humanized etc. according to known techniques (Jones et al., Nature (1986) May 29-Jun. 4;321 (6069):522-5; Roguska et al., Protein Engineering, 1996, 9(10):895-904; and Studnicka et al., Humanizing Mouse Antibody Frameworks While Preserving 3-D Structure. Protein Engineering, 1994, Vol.7, pg 805).
- The inhibitory nucleic acid molecule may be single stranded or double stranded. Examples of inhibitory nucleic acid molecules include antisense nucleic acid, RNAi, siRNA, shRNA, miRNA, shmiRNA, or derivatives or pre-cursors thereof.
- The antagonist of an inhibitory immune checkpoint may be selected from MGA271 (targets B7-H3), ipilimumab (Yervoy - targets CTLA-4), indoximod (targets IDO pathway), NLG919 (targets IDO pathway), lirilumab (targets KIR), IMP321 (targets LAG3), BMS-986016 (targets LAG3), CT-011 (PD-1 blockade), nivolumab/BMS-936558 (PD-1 blockade), BMS-936559 (PDL1 blockade) and pembrolizumab (Keytruda - targets PD-1). Preferably, the antagonist is not pembrolizumab. Further antagonists include MGB453 (targets TIM-3), LAG525 (targets LAG-3) and PDR001 (PD1 Blockade).
- The stimulatory immune checkpoint may be a regulatory pathway, or a molecule in such a pathway, that activates an immune response. The stimulatory immune checkpoint may be a polypeptide expressed by B-cells and/or T-cells. The stimulatory immune checkpoint may be a membrane receptor. The stimulatory immune checkpoint may be a co-stimulatory receptor. The co-stimulatory receptor may be a T-cell co-stimulatory receptor or a B-cell co-stimulatory receptor. The ligand of the stimulatory immune checkpoint may be membrane bound or soluble.
- The stimulatory immune checkpoint may be selected from CD27, CD28, CD40, CD122, CD137, OX40, GITR and ICOS.
- The agonist of a stimulatory immune checkpoint may amplify an antigen-specific B-cell and/or T-cell response. The agonist of a stimulatory immune checkpoint may increase the interaction between a co-stimulatory receptor and its ligand. The agonist of a stimulatory immune checkpoint may comprise a ligand molecule that binds to a (co-)stimulatory receptor. The agonist of a stimulatory immune checkpoint may be selected from an antibody (as described herein), a lipocalin and a cytokine.
- The lipocalin may be a molecule that incorporates a lipocalin, or a fragment or derivative of a lipocalin. Such molecules which retain the function of acting as an agonist of a stimulatory immune checkpoint are included in the definition of "lipocalin".
- The cytokine may be a molecule that incorporates a cytokine, or a fragment or derivative of a cytokine. Such molecules which retain the function of acting as an agonist of a stimulatory immune checkpoint are included in the definition of "cytokine".
- The agonist of a stimulatory immune checkpoint may be selected from CDX-1127 (agonist of CD27), NKTR-214 (agonist of CD122), BMS-663513 (agonist of CD137), TRX518 (agonist of GITR), CP-870893 (CD40 agonist), MEDI0562, MEDI6469 and MEDI6383 (OX40 agonists).
- The DNA damage therapeutic agent may be selected from a DNA damaging agent, a DNA repair targeted therapy, an inhibitor of DNA damage signalling, an inhibitor of DNA damage induced cell cycle arrest and an inhibitor of a process indirectly leading to DNA damage.
- The DNA damaging agent may be selected from an alkylating agent, a topoisomerase inhibitor and radiation. The alkylating agent may be selected from a platinum containing agent, cyclophosphamide and busulphan. The platinum containing agent may be selected from cisplatin, carboplatin and oxaliplatin. The topoisomerase inhibitor may be selected from a topoisomerase I inhibitor and a topoisomerase II inhibitor. The topoisomerase I inhibitor may be selected from irinotecan and topotecan. The topisomerase II inhibitor may be selected from etoposide and an anthracycline. The anthracycline may be selected from doxorubicin and epirubicin. The radiation may be ionising radiation
- The DNA repair targeted therapy may be selected from an inhibitor of Non-homologous end-joining, an inhibitor of homologous recombination, an inhibitors of nucleotide excision repair, an inhibitor of base excision repair and an inhibitor of the Fanconi anemia pathway. The inhibitor of Non-homologous end-joining may be selected from a DNA-PK inhibitor, Nu7441 and NU7026. The inhibitor of base excision repair may be selected from a PARP inhibitor, AG014699, AZD2281, ABT-888, MK4827, BSI-201, INO-1001, TRC-102, an
APEX 1 inhibitor, anAPEX 2 inhibitor and a Ligase III inhibitor. - The inhibitor of DNA damage signalling may be selected from an ATM inhibitor, a
CHK 1 inhibitor and aCHK 2 inhibitor. The ATM inhibitor may be selected from CP466722 and KU-55933. TheCHK 1 inhibitor may be selected from XL-844, UCN-01, AZD7762 and PF00477736. TheCHK 2 inhibitor may be selected from XL-844, AZD7762 and PF00477736. - The inhibitor of DNA damage induced cell cycle arrest may be selected from a Wee1 kinase inhibitor and a CDC25a, b or c inhibitor.
- The inhibitor of a process indirectly leading to DNA damage may be selected from a histone deacetylase inhibitor and a heat shock protein inhibitor.
- The heat shock protein inhibitor may be selected from geldanamycin and AUY922.
- Unless defined otherwise, technical and scientific terms used herein have the same meaning as commonly understood by one of ordinary skill in the art to which this invention belongs. Although any methods, devices, and materials similar or equivalent to those described herein can be used in the practice or testing of the invention, the preferred methods, devices and materials are now described.
- All publications, published patent documents, and patent applications cited in this application are indicative of the level of skill in the art(s) to which the application pertains.
- The articles "a" and "an" are used herein to refer to one or to more than one (i.e., to at least one) of the grammatical object of the article. By way of example, "an element" means one element or more than one element, unless explicitly indicated to the contrary.
- A major goal of current research efforts in cancer is to increase the efficacy of perioperative systemic therapy in patients by incorporating molecular parameters into clinical therapeutic decisions. Pharmacogenetics/genomics is the study of genetic/genomic factors involved in an individual's response to a foreign compound or drug. Agents or modulators which have a stimulatory or inhibitory effect on expression of a marker of the invention can be administered to individuals to treat (prophylactically or therapeutically) cancer in a patient. It is ideal to also consider the pharmacogenomics of the individual in conjunction with such treatment. Differences in metabolism of therapeutics may possibly lead to severe toxicity or therapeutic failure by altering the relationship between dose and blood concentration of the pharmacologically active drug. Thus, understanding the pharmacogenomics of an individual permits the selection of effective agents (e.g., drugs) for prophylactic or therapeutic treatments. Such pharmacogenomics can further be used to determine appropriate dosages and therapeutic regimens. Accordingly, the level of expression of a marker of the invention in an individual can be determined to thereby select appropriate agent(s) for therapeutic or prophylactic treatment of the individual.
- The invention is directed to a unique collection of gene or gene product markers (hereinafter referred to as "biomarkers") expressed in a cancer tissue. In different aspects, this biomarker list may form the basis of a single parameter or multiparametric predictive test that could be delivered using methods known in the art such as microarray, Q-PCR, sequencing (e.g. RNA seq), immunohistochemistry, ELISA or other technologies that can quantify mRNA expression.
- The present invention also relates to methods that are useful for prognosis following cytotoxic chemotherapy or selection of specific treatments for cancer. Methods are provided such that when some or all of the transcripts are over or under-expressed, the expression profile indicates responsiveness or resistance to antagonists of an inhibitory immune checkpoint and/or agonists of a stimulatory immune checkpoint. These methods employ gene or gene product markers that are differentially expressed in tumors of patients with cancer. In one embodiment of the invention, the expression profiles of these biomarkers are correlated with clinical outcome (response or survival) in archival tissue samples under a statistical method or a correlation model to create a database or model correlating expression profile with responsiveness to one or more antagonists of an inhibitory immune checkpoint and/or agonists of a stimulatory immune checkpoint, optionally in combination with DNA-damage therapeutic agents. The predictive model may then be used to predict the responsiveness in a patient whose responsiveness to antagonists of an inhibitory immune checkpoint and/or agonists of a stimulatory immune checkpoint is unknown. In many other embodiments, a patient population can be divided into at least two classes based on patients' clinical outcome, prognosis, or responsiveness to antagonists of an inhibitory immune checkpoint and/or agonists of a stimulatory immune checkpoint, and the biomarkers are substantially correlated with a class distinction between these classes of patients. The biological pathways described herein are common to cancer as a disease, similar to grade and stage, and as such, the classifiers and methods are not limited to a single cancer disease type.
- A unique collection of biomarkers as a genetic classifier expressed in a cancer tissue is provided that is useful in determining responsiveness or resistance to antagonists of an inhibitory immune checkpoint and/or agonists of a stimulatory immune checkpoint, used to treat cancer. Such a collection may be termed a "marker panel", "expression classifier", or "classifier".
- Some biomarkers useful in the present methods are identified in Table 1. These biomarkers are identified as having predictive value to determine a patient response to a therapeutic agent, or lack thereof. Their expression correlates with the response to an agent, and more specifically, immune checkpoint therapies, such as antagonists of an inhibitory immune checkpoint and/or agonists of a stimulatory immune checkpoint, optionally in combination with a DNA-damage therapeutic agent. By examining the expression of a collection of the identified biomarkers in a tumor, it is possible to determine which therapeutic agent or combination of agents will be most likely to reduce the growth rate of a cancer, and in some embodiments, breast or ovarian cancer cells. By examining a collection of identified transcript gene or gene product markers, it is also possible to determine which therapeutic agent or combination of agents will be the least likely to reduce the growth rate of a cancer. By examining the expression of a collection of biomarkers, it is therefore possible to eliminate ineffective or inappropriate therapeutic agents. Importantly, in certain embodiments, these determinations can be made on a patient-by-patient basis or on an agent-by-agent basis. Thus, one can determine whether or not a particular therapeutic regimen is likely to benefit a particular patient or type of patient, and/or whether a particular regimen should be continued.
Table 1A Sense genes (166) Antisense of known genes (24) Gene Symbol E ntrezGene ID Almac Gene ID Almac Gene symbol SEQ ID NO: ABCA12 26154 N/A ALDH3B2 222 N/A APOBEC3G 60489 N/A APOC1 341 N/A APOL6 80830 N/A ARHGAP9 64333 N/A BAMBI 25805 N/A BIK 638 N/A BIRC3 330 AS1_BIRC3 Hs127799.0C7n9_at 1 BTN3A3 10384 N/A C12orf48 55010 N/A C17orf28 283987 N/A C1orf162 128346 N/A C1orf64 149563 N/A C1QA 712 N/A C21orf70 85395 N/A C22orf32 91689 N/A C6orf211 79624 N/A CACNG4 27092 N/A CCDC69 26112 N/A CCL5 6352 N/A CCNB2 9133 N/A CCND1 595 N/A CCR7 1236 N/A CD163 9332 N/A CD2 914 N/A CD22 933 N/A CD24 100133941 N/A CD274 29126 N/A CD3D 915 N/A CD3E 916 N/A CD52 1043 N/A CD53 963 N/A CD79A 973 N/A CDH1 999 N/A CDKN3 1033 N/A CECR1 51816 N/A CHEK1 1111 N/A CKMT1B 1159 N/A CMPK2 129607 N/A CNTNAP2 26047 N/A COX16 51241 N/A CRIP1 1396 N/A CXCL10 3627 N/A CXCL9 4283 N/A CYBB 1536 N/A CYP2B6 1555 N/A DDX58 23586 N/A DDX60L 91351 N/A ERBB2 2064 N/A ETV7 51513 N/A FADS2 9415 N/A FAM26F 441168 N/A FAM46C 54855 N/A FASN 2194 N/A FBP1 2203 N/A FBXO2 26232 N/A FKBP4 2288 N/A FLJ40330 645784 N/A FYB 2533 N/A GBP1 2633 N/A GBP4 115361 N/A GBP5 115362 AS1_GBP5 BRMX.5143C1 n2_at 2 GIMAP4 55303 N/A GLRX 2745 N/A GLUL 2752 N/A GVIN1 387751 N/A H2AFJ 55766 N/A HGD 3081 N/A HIST1H2BK 85236 N/A HIST3H2A 92815 N/A HLA-DOA 3111 N/A HLA-DPB1 3115 N/A HMGB2 3148 N/A HMGB3 3149 N/A HSP90AA1 3320 N/A IDO1 3620 N/A IFI27 3429 N/A IFI44 10561 N/A IFI44L 10964 AS1_IFI44L BRSA.1606C1n4_at 3 IFI6 2537 N/A IFIH1 64135 N/A IGJ 3512 AS1_IGJ BRIH.1231C2n2_at 4 IKZF1 10320 N/A IL10RA 3587 N/A IL2RG 3561 N/A IL7R 3575 N/A IMPAD1 54928 N/A IQGAP3 128239 AS1_IQGAP3 BRAD.30779_s_at 5 IRF1 3659 N/A ISG15 9636 N/A ITGAL 3683 N/A KIAA1467 57613 N/A KIF20A 10112 N/A KITLG 4254 N/A KLRK1 22914 N/A KRT19 3880 N/A LAIR1 3903 N/A LCP1 3936 N/A LOC100289702 100289702 N/A LOC100294459 100294459 AS1_LOC100294459 BRSA.396C1n2_at 6 LOC150519 150519 N/A LOC439949 439949 N/A LYZ 4069 N/A MAL2 114569 N/A MGC29506 51237 N/A MIAT 440823 N/A MS4A1 931 N/A MX1 4599 AS1_MX1 BRMX.2948C3n7_at 7 NAPSB 256236 N/A NCKAP1L 3071 N/A NEK2 4751 N/A NLRC3 197358 N/A NLRC5 84166 N/A NPNT 255743 N/A NQO1 1728 N/A OAS2 4939 N/A OAS3 4940 N/A PAQR4 124222 N/A PARP14 54625 N/A PARP9 83666 N/A PIK3CG 5294 N/A PIM2 11040 N/A PLEK 5341 N/A POU2AF1 5450 N/A PP14571 100130449 N/A PPP2R2C 5522 N/A PSMB9 5698 N/A PTPRC 5788 N/A RAC2 5880 N/A RAMP1 10267 N/A RARA 5914 N/A RASSF7 8045 N/A RSAD2 91543 N/A RTP4 64108 N/A SAMD9 54809 N/A SAMD9L 219285 N/A SASH3 54440 N/A SCD 6319 N/A SELL 6402 N/A SIX1 6495 AS1_SIX1 Hs539969.0C4n3_at 8 SLAMF7 57823 N/A SLC12A2 6558 N/A SLC9A3R1 9368 AS1_SLC9A3R1 Hs396783.3C1n4_at 9 SPOCK2 9806 N/A SQLE 6713 N/A ST20 400410 N/A ST6GALNAC2 10610 N/A STAT1 6772 AS1_STAT1 BRMX.13670C1n2_at 10 STRA13 201254 N/A SUSD4 55061 N/A SYT12 91683 N/A TAP1 6890 N/A TBC1D10C 374403 N/A TNFRSF13B 23495 N/A TNFSF10 8743 N/A TOB1 10140 AS1_TOB1 BRAD.30243_at 11 TOM1L1 10040 N/A TRIM22 10346 N/A UBD 10537 AS1_UBD BRMX.941C2n2_at 12 UBE2T 29089 N/A UCK2 7371 N/A USP18 11274 N/A VNN2 8875 N/A XAF1 54739 N/A ZWINT 11130 N/A AS1_C1QC BRMX.4154C1n3_s_at 13 AS1_C2orf14 BRAD.39498_at 14 AS1_EPSTI1 BRAD.34868_s_at 15 AS1_GALNT6 5505575.0C1n42_at 16 AS1_HIST1H4H BREM.1442_at 17 AS1_HIST2H4B BRHP.827_s_at 18 AS2_HIST2H4B BRRS.18322_s_at 19 AS3_HIST2H4B BRRS.18792_s_at 20 AS1_KIAA1244 Hs632609.0C1n37_at 21 AS1_LOC100287927 Hs449575.0C1n22_at 22 AS1_LOC100291682 BRAD.18827_s_at 23 AS1_LOC100293679 BREM.2466_s_at 24 Table 1B Novel genes Gene symbol SEQ ID NO: BRAD.2605_at 25 BRAD.33618_at 26 BRAD.36579_s_at 27 BRAD1_5440961_s_at 28 BRAD1_66786229_s_at 29 BREM.2104_at 30 BRAG_AK097020.1_at 31 BRAD.20415_at 32 BRAD.29668_at 33 BRAD.30228_at 34 BRAD.34830_at 35 BRAD.37011_s_at 36 BRAD.37762_at 37 BRAD.40217_at 38 BRAD1_4307876_at 39 BREM.2505_at 40 Hs149363.0CB4n5_s_at 41 Hs172587.9C1n9_at 42 Hs271955.16C1n9_at 43 Hs368433.18C1n6_at 44 Hs435736.0C1n27_s_at 45 Hs493096.15C1n6_at 46 Hs493096.2C1n15_s_at 47 Hs592929.0CB2n8_at 48 Hs79953.0C1n23_at 49 BRMX.2377C1n3_at 50 - In combination with at least one gene selected from Table 2B, all or a portion of the biomarkers recited in Table 1 may be used in a predictive biomarker panel. For example, biomarker panels selected from the biomarkers in Table 1 can be generated using the methods provided herein and can comprise between one, and all of the biomarkers set forth in Table 1 and each and every combination in between (e.g., four selected biomarkers, 16 selected biomarkers, 74 selected biomarkers, etc.). In some embodiments, the predictive biomarker set comprises at least 5, 10, 20, 40, 60, 100, 150, 200, or 300 or more biomarkers. In other embodiments, the predictive biomarker set comprises no more than 5, 10, 20, 40, 60, 100, 150, 200, 300, 400, 500, 600 or 700 biomarkers. In some embodiments, the predictive biomarker set includes a plurality of biomarkers listed in Table 1. In some embodiments the predictive biomarker set includes at least about 1%, about 5%, about 10%, about 20%, about 30%, about 40%, about 50%, about 60%, about 70%, about 80%, about 90%, about 95%, about 96%, about 97%, about 98%, or about 99% of the biomarkers listed in Table 1. Selected predictive biomarker sets can be assembled from the predictive biomarkers provided using methods described herein and analogous methods known in the art. In one embodiment, the biomarker panel contains all 203 biomarkers in Table 1. In another embodiment, the biomarker panel contains 40 or 44 biomarkers in Table 1 or 2.
- Predictive biomarker sets may be defined in combination with corresponding scalar weights on the real scale with varying magnitude, which are further combined through linear or non-linear, algebraic, trigonometric or correlative means into a single scalar value via an algebraic, statistical learning, Bayesian, regression, or similar algorithms which together with a mathematically derived decision function on the scalar value provide a predictive model by which expression profiles from samples may be resolved into discrete classes of responder or non-responder, resistant or non-resistant, to a specified drug or drug class. Such predictive models, including biomarker membership, are developed by learning weights and the decision threshold, optimized for sensitivity, specificity, negative and positive predictive values, hazard ratio or any combination thereof, under cross-validation, bootstrapping or similar sampling techniques, from a set of representative expression profiles from historical patient samples with known drug response and/or resistance.
- In one embodiment, the biomarkers are used to form a weighted sum of their signals, where individual weights can be positive or negative. The resulting sum ("decisive function") is compared with a pre-determined reference point or value. The comparison with the reference point or value may be used to diagnose, or predict a clinical condition or outcome.
- As described above, one of ordinary skill in the art will appreciate that the biomarkers included in the classifier provided in Table 1 will carry unequal weights in a classifier for responsiveness or resistance to a therapeutic agent. Therefore, while as few as one sequence may be used to diagnose or predict an outcome such as responsiveness to therapeutic agent, the specificity and sensitivity or diagnosis or prediction accuracy may increase using more sequences.
- As used herein, the term "weight" refers to the relative importance of an item in a statistical calculation. The weight of each biomarker in a gene expression classifier may be determined on a data set of patient samples using analytical methods known in the art.
- In one instance the biomarker panel is directed to the 40 biomarkers detailed in Table 2A with corresponding ranks and weights detailed in the table or alternative rankings and weightings, depending, for example, on the disease setting. In another embodiment, the biomarker panel is directed to the 44 biomarkers detailed in Table 2B with corresponding ranks and weights detailed in the table or alternative rankings and weightings, depending, for example, on the disease setting. Tables 2A and 2B rank the biomarkers in order of decreasing weight in the classifier, defined as the rank of the average weight in the compound decision score function measured under cross-validation. Table 2C present the probe sets that represent the genes in Table 2A and 2B with reference to their sequence ID numbers. Table 2D presents the antisense probe sequences that were present on the array for the genes in the signatures.
Table 2A Gene IDs and EntrezGene IDs for 40-gene DDRD classifier model with associated ranking and weightings DDRD classifier 40 gene model Rank Genes Symbol EntrezGene ID Weights 1 GBP5 115362 0.022389581 2 CXCL10 3627 0.021941734 3 IDO1 3620 0.020991115 4 MX1 4599 0.020098675 5 IFI44L 10964 0.018204957 6 CD2 914 0.018080661 7 PRAME 23532 0.016850837 8 ITGAL 3683 0.016783359 9 LRP4 4038 -0.015129969 10 SP140L 93349 0.014646025 11 APOL3 80833 0.014407174 12 FOSB 2354 -0.014310521 13 CDR1 1038 -0.014209848 14 RSAD2 91543 0.014177132 15 TSPAN7 7102 -0.014111562 16 RAC2 5880 0.014093627 17 FYB 2533 0.01400475 18 KLHDC7B 113730 0.013298413 19 GRB14 2888 0.013031204 20 KIF26A 26153 -0.012942351 21 CD274 29126 0.012651964 22 CD109 135228 -0.012239425 23 ETV7 51513 0.011787297 24 MFAP5 8076 -0.011480443 25 OLFM4 10562 -0.011130113 26 PI15 51050 -0.010904326 27 FAM19A5 25817 -0.010500936 28 NLRC5 84166 0.009593449 29 EGR1 1958 -0.008947963 30 ANXA1 301 -0.008373991 31 CLDN10 9071 -0.008165127 32 ADAMTS4 9507 -0.008109892 33 ESR1 2099 0.007524594 34 PTPRC 5788 0.007258669 35 EGFR 1956 -0.007176203 36 NAT1 9 0.006165534 37 LATS2 26524 -0.005951091 38 CYP2B6 1555 0.005838391 39 PPP1R1A 5502 -0.003898835 40 TERF1 P1 348567 0.002706847 Table 2B Gene IDs and EntrezGene IDs for 44-gene DDRD classifier model with associated ranking and weightings DDRD Classfier - 44 Gene, Model (NA:genomic sequence) Rank Gene symbol EntrezGene ID Weight 1 CXCL10 3627 0.023 2 MX1 4599 0.0226 3 IDO1 3620 0.0221 4 IFI44L 10964 0.0191 5 CD2 914 0.019 6 GBP5 115362 0.0181 7 PRAME 23532 0.0177 8 ITGAL 3683 0.0176 9 LRP4 4038 -0.0159 10 APOL3 80833 0.0151 11 CDR1 1038 -0.0149 12 FYB 2533 -0.0149 13 TSPAN7 7102 0.0148 14 RAC2 5880 -0.0148 15 KLHDC7B 113730 0.014 16 GRB14 2888 0.0137 17 AC138128.1 N/A -0.0136 18 KIF26A 26153 -0.0136 19 CD274 29126 0.0133 20 CD109 135228 -0.0129 21 ETV7 51513 0.0124 22 MFAP5 8076 -0.0121 23 OLFM4 10562 -0.0117 24 PI15 51050 -0.0115 25 FOSB 2354 -0.0111 26 FAM19A5 25817 0.0101 27 NLRC5 84166 -0.011 28 PRICKLE1 144165 -0.0089 29 EGR1 1958 -0.0086 30 CLDN10 9071 -0.0086 31 ADAMTS4 9507 -0.0085 32 SP140L 93349 0.0084 33 ANXA1 301 -0.0082 34 RSAD2 91543 0.0081 35 ESR1 2099 0.0079 36 IKZF3 22806 0.0073 37 OR2I1 P 442197 0.007 38 EGFR 1956 -0.0066 39 NAT1 9 0.0065 40 LATS2 26524 -0.0063 41 CYP2B6 1555 0.0061 42 PTPRC 5788 0.0051 43 PPP1R1A 5502 -0.0041 44 AL137218.1 N/A -0.0017 Table 2C Probe set IDs and SEQ Numbers for genes contained in 40- and 44-gene signature Probe set IDs and SEQ Numbers for genes contained in 40 and 44 gene signature Gene symbol Probe Set ID SEQ ID NO. FYB BRAD.10849_at 83 CLDN10 BRAD.10890_at 84 PPP1R1A BRAD.11026_at 85 PI15 BRAD.12809_at 86 MFAP5 BRAD.14326_s_at 87 ESR1 BRAD.15436_s_at 88 FYB BRAD.15833_s_at 89 ESR1 BRAD.19080_s_at 90 TERF1P1 BRAD.2707_at 91 PRICKLE1 BRAD.27716_s_at 92 LATS2 BRAD.28628_s_at 93 IKZF3 BRAD.28643_at 94 MX1 BRAD.28663_s_at 95 CD274 BRAD.29038_at 96 FAM19A5 BRAD.30917_at 97 LATS2 BRAD.31470_at 98 EGFR BRAD.32716_at 99 EGFR BRAD.33042_at 100 EGFR BRAD.33341_at 101 ANXA1 BRAD.33405_at 102 EGFR BRAD.33431_at 103 KLHDC7B BRAD.35695_at 104 IKZF3 BRAD.35710_at 105 PTPRC BRAD.37907_at 106 TERF1P1 BRAD.40353_at 107 EGFR BRAD.40654_s_at 108 FYB BRAD.4701_at 109 PTPRC BRAD.5967_at 110 EGFR BRAD.7701_at 111 ESR1 BREM.1048_at 112 EGFR BREM.1129_at 113 NAT1 BREM.1226_at 114 FOSB BREM.1262_at 115 OR2I1P BREM.130_at 116 ADAMTS4 BREM.1689_s_at 117 CYP2B6 BREM.2334_at 118 EGFR BREM.2382_at 119 ETV7 BREM.532_at 120 ANXA1 BRHP.106_s_at 121 ESR1 BRIH.10647C1n2_at 122 EGFR BRIH.1453C1n2_at 123 EGR1 BRIH.1518C1n4_at 124 ANXA1 BRIH.2770C3n31_at 125 NAT1 BRIH.365C1n2_at 126 IFI44L BRIH.5410C1n7_at 127 MX1 BRIH.5478C1n2_s_at 128 ESR1 BRIH.5650C1n2_at 129 CD109 BRIH.5952C1n2_s_at 130 CXCL10 BRIH.7359C1n3_s_at 131 FYB BRIHRC.10930C1n2_s_at 132 AC138128.1 BRMX.13731C1n18_at 133 TERF1P1 BRMX.25436C1n2_at 134 GBP5 BRMX.25712C1n2_at 135 EGR1 BRMX.3079C1n3_at 136 EGR1 BRMX.3079C2n3_at 137 ESR1 BRPD.10690C1n5_at 138 FYB BRPD.4019C1n3_s_at 139 GBP5 BRPD.5301C1n2_s_at 140 NLRC5 BRRS.12588_at 141 GBP5 BRRS.13369_s_at 142 RSAD2 BRRS.13576_at 143 PTPRC BRRS.13647_at 144 PTPRC BRRS.13648_s_at 145 CD109 BRRS.13767_at 146 SP140L BRRS.13859_at 147 KLHDC7B BRRS.13881_at 148 APOL3 BRRS.14465_s_at 149 PRICKLE1 BRRS.15053_at 150 CLDN10 BRRS.16228_s_at 151 EGFR BRRS.16746_s_at 152 EGFR BRRS.16747_at 153 PRAME BRRS.16948_s_at 154 TERF1P1 BRRS.17863_s_at 155 TERF1P1 BRRS.17909_s_at 156 AL137218.1 BRRS.18137_at 157 KIF26A BRRS.18652_s_at 158 FYB BRRS.2573_s_at 159 CXCL10 BRRS.2644_at 160 CD2 BRRS.2783_s_at 161 EGR1 BRRS.2935_at 162 IDO1 BRRS.3099_at 163 ITGAL BRRS.3131_at 164 LRP4 BRRS.3220_at 165 MX1 BRRS.3319_at 166 MX1 BRRS.3319_s_at 167 RAC2 BRRS.3645_s_at 168 MFAP5 BRRS.4126_s_at 169 NAT1 BRRS.455_at 170 CDR1 BRRS.4562_at 171 ANXA1 BRRS.487_s_at 172 GRB14 BRRS.4891_s_at 173 TSPAN7 BRRS.4996_at 174 CYP2B6 BRRS.524_s_at 175 ADAMTS4 BRRS.5356_at 176 EGFR BRRS.5451_at 177 OLFM4 BRRS.6371_at 178 FOSB BRRS.6611_at 179 PPP1R1A BRRS.6619_at 180 PPP1R1A BRRS.6619-22_at 181 IFI44L BRRS.6684_at 182 CD274 BRRS.7616_at 183 LATS2 BRRS.7901_at 184 ESR1 BRRS.81_at 185 ESR1 BRRS.81-22_at 186 FAM19A5 BRRS.8480_s_at 187 PI15 BRRS.8711_at 188 ETV7 BRRS.8900_s_at 189 EGR1 BRSA.1686C1n5_at 190 RAC2 BRSA.8072C1n2_s_at 191 SP140L Hs369056.20C1n2_at 192 EGFR Hs488293.0CB1n69_at 193 ANXA1 Hs494173.0CB4n15_at 194 GBP5 Hs513726.0C2n39_s_at 195 TERF1P1 Hs514006.0C1n8_at 196 TERF1P1 Hs522202.0C1n6_at 197 PRICKLE1 Hs524348.0CB1n97_at 198 PRICKLE1 Hs524348.2C1n5_s_at 199 NLRC5 Hs528836.0C1n3_s_at 200 TERF1P1 Hs591893.1C1n4_s_at 201 RSAD2 Hs7155.0CB1n102_at 202 Table 2D Almac IDs and Almac Gene symbol and SEQ ID numbers for antisense probe sets in 40-gene signature (D) Almac IDs and Almac Gene symbol and SEQ ID numbers, for antisense probe sets in 40 gene signature Gene Symbol EntrezGene ID (40) Almac Gene ID (32) Almac Gene symbol SEQ ID NO: ADAMTS4 9507 ANXA1 301 ANXA1 301 AS1_ANXA1 BRAD.33405_at 51 APOL3 80833 CD109 135228 CD2 914 CD274 29126 CD274 29126 AS1_CD274 Hs584242.2C1n64_at 52 CDR1 1038 CDR1 1038 AS1_CDR1 BRRS1RC_NM_004065_at 53 CLDN10 9071 CLDN10 9071 AS1_CLDN10 BRRS.8182_at 54 CXCL10 3627 CXCL10 3627 AS1_CXCL10 BRMX.13815C1n5_at 55 CYP2B6 1555 EGFR 1956 EGFR 1956 AS1_EGFR BRMX.2637C1n26_at 56 EGFR 1956 AS2_EGFR BRAD.36737_at 57 EGFR 1956 AS3_EGFR BRAD.3853_at 58 EGFR 1956 AS4_EGFR BRAD1_19760734_at 59 EGR1 1958 EGR1 1958 AS1_EGR1 BRMX.2797C4n2_at 60 ESR1 2099 ESR1 2099 AS1_ESR1 BRMX.10399C1n5_at 61 ESR1 2099 AS2_ESR1 BRMX.8912C1n3_at 62 ETV7 51513 FAM19A5 25817 FOSB 2354 FOSB 2354 AS1_FOSB BRMX.13731C1n18_at 63 FYB 2533 FYB 2533 AS1_FYB BRAD.25947_at 64 GBP5 115362 GBP5 115362 AS1_GBP5 BRMX.5143C1n2(2)_at 65 GRB14 IDO1 3620 IFI44L 10964 IFI44L 10964 AS1_IFI44L Hs633116.0C1n30_at 66 IFI44L 10964 AS2_IFI44L BRSA.1606C1n4(2)_at 67 ITGAL ITGAL 3683 AS1_ITGAL BRAD.41047_at 68 ITGAL 3683 AS2_ITGAL BRAD.4420_at 69 KIF26A 26153 KLHDC7B 113730 KLHDC7B 113730 AS1_KLHDC7B Hs137007.0C1n9_at 70 LATS2 26524 LATS2 26524 AS1_LATS2 BRSA.18050C1n3_at 71 LRP4 4038 MFAP5 8076 MX1 4599 MX1 4599 AS1_MX1 BRMX.2948C3n7(2)_at 72 MX1 4599 AS2_MX1 Hs43047.0C4n40_at 73 MX1 4599 AS2_MX1 Hs926.1C10n7_at 74 NAT1 9 NLRC5 84166 NLRC5 84166 AS1_NLRC5 Hs528836.0CB6n98_s_at 75 OLFM4 10562 OLFM4 10562 AS1_OLFM4 BRMX.7284C1n6_at 76 PI15 51050 PI15 51050 AS1_PI15 BRAD1_19751014_at 77 PPP1R1A 5502 PRAME 23532 PTPRC 5788 RAC2 5880 RAC2 5880 AS1_RAC2 BRMX.13502C1n6_at 78 RSAD2 91543 SP140L 93349 SP140L 93349 AS1_SP140L BRMX.1111C4n3_at 79 SP140L 93349 AS2_SP140L Hs369056.9C26n3_at 80 TERF1P1 348567 TERF1P1 348567 AS1_TERF1P1 BRMX.24432C1n2_at 81 TERF1P1 348567 AS2_TERF1P1 BRRS.17773_at 82 TSPAN7 7102 - In different embodiments, subsets of the biomarkers listed in Table 2B may be used in the methods described herein. These subsets include but are not limited to biomarkers ranked 1-2, 1-3, 1-4, 1-5, 1-10, 1-20, 1-30, 1-40, 1-44, 6-10, 11-15, 16-20, 21-25, 26-30, 31-35, 36-40, 36-44, 11-20, 21-30, 31-40, and 31-44 in Table 2B. In one aspect, therapeutic responsiveness is predicted in an individual by conducting an assay on a biological sample from the individual and detecting biomarker values that each correspond to at least one of the biomarkers GBP5, CXCL10, IDO1 and MX1 and at least N additional biomarkers selected from the list of biomarkers in Table 2B, wherein N equals 1, 2, 3, 4, 5, 6, 7, 8, 9, 10, 11, 12, 13, 14, 15, 16, 17, 18, 19, 20, 21, 22, 23, 24, 25, 26, 27, 28, 29, 30, 31, 32, 33, 34, 35, or 36. As used herein, the term "biomarker" can refer to a gene, an mRNA, cDNA, an antisense transcript, a miRNA, a polypeptide, a protein, a protein fragment, or any other nucleic acid sequence or polypeptide sequence that indicates either gene expression levels or protein production levels. In some embodiments, when referring to a biomarker of CXCL10, IDO1, CD2, GBP5, PRAME, ITGAL, LRP4, APOL3, CDR1, FYB, TSPAN7, RAC2, KLHDC7B, GRB14, AC138128.1, KIF26A, CD274, ETV7, MFAP5, OLFM4, PI15, FOSB, FAM19A5, NLRC5, PRICKLE1, EGR1, CLDN10, ADAMTS4, SP140L, ANXA1, RSAD2, ESR1, IKZF3, OR2I1P, EGFR, NAT1, LATS2, CYP2B6, PTPRC, PPP1R1A, or AL137218.1, the biomarker comprises an mRNA of CXCL10, IDO1, CD2, GBP5, PRAME, ITGAL, LRP4, APOL3, CDR1, FYB, TSPAN7, RAC2, KLHDC7B, GRB14, AC138128.1, KIF26A, CD274, ETV7, MFAP5, OLFM4, PI15, FOSB, FAM19A5, NLRC5, PRICKLE1, EGR1, CLDN10, ADAMTS4, SP140L, ANXA1, RSAD2, ESR1, IKZF3, OR2I1P, EGFR, NAT1, LATS2, CYP2B6, PTPRC, PPP1R1A, or AL137218.1, respectively. In further or other instances, when referring to a biomarker of MX1, GBP5, IFI44L, BIRC3, IGJ, IQGAP3, LOC100294459, SIX1, SLC9A3R1, STAT1, TOB1, UBD, C1QC, C2orf14, EPSTI, GALNT6, HIST1H4H, HIST2H4B, KIAA1244, LOC100287927, LOC100291682, or LOC100293679, the biomarker comprises an antisense transcript of MX1, IFI44L, GBP5, BIRC3, IGJ, IQGAP3, LOC100294459, SIX1, SLC9A3R1, STAT1, TOB1, UBD, C1QC, C2orf14, EPSTI, GALNT6, HIST1H4H, HIST2H4B, KIAA1244, LOC100287927, LOC100291682, or LOC100293679, respectively.
- In a further aspect, therapeutic responsiveness is predicted, or a cancer diagnosis is indicated, in an individual by conducting an assay on a biological sample from the individual and detecting biomarker values that each correspond to the biomarkers GBP5, CXCL10, IDO1 and MX1 and one of at least N additional biomarkers selected from the list of biomarkers in Table 2B, wherein N equals 1, 2, 3, 4, 5, 6, 7, 8, 9, 10, 11, 12, 13, 14, 15, 16, 17, 18, 19, 20, 21, 22, 23, 24, 25, 26, 27, 28, 29, 30, 31, 32, 33, 34, 35, or 36. In a further aspect, therapeutic responsiveness is predicted, or a cancer diagnosis is indicated, in an individual by conducting an assay on a biological sample from the individual and detecting biomarker values that each correspond to the biomarker GBP5 and one of at least N additional biomarkers selected from the list of biomarkers in Table 2B, wherein N equals 1, 2, 3, 4, 5, 6, 7, 8, 9, 10, 11, 12, 13, 14, 15, 16, 17, 18, 29, 20, 21, 22, 23, 24, 25, 26, 27, 28, 29, 30, 31, 32, 33, 34, 35, 36, 37, 38 or 39. In a further aspect, therapeutic responsiveness is predicted, or a cancer diagnosis is indicated, in an individual by conducting an assay on a biological sample from the individual and detecting biomarker values that each correspond to the biomarker CXCL10 and one of at least N additional biomarkers selected from the list of biomarkers in Table 2B, wherein N equals 1, 2, 3, 4, 5, 6, 7, 8, 9, 10, 11, 12, 13, 14, 15, 16, 17, 18, 29, 20, 21, 22, 23, 24, 25, 26, 27, 28, 29, 30, 31, 32, 33, 34, 35, 36, 37, 38 or 39. In a further aspect, therapeutic responsiveness is predicted, or a cancer diagnosis is indicated, in an individual by conducting an assay on a biological sample from the individual and detecting biomarker values that each correspond to the biomarker IDO1 and one of at least N additional biomarkers selected from the list of biomarkers in Table 2B, wherein N equals 1, 2, 3, 4, 5, 6, 7, 8, 9, 10, 11, 12, 13, 14, 15, 16, 17, 18, 29, 20, 21, 22, 23, 24, 25, 26, 27, 28, 29, 30, 31, 32, 33, 34, 35, 36, 37, 38 or 39. In a further aspect, therapeutic responsiveness is predicted, or a cancer diagnosis is indicated, in an individual by conducting an assay on a biological sample from the individual and detecting biomarker values that each correspond to the biomarker MX-1 and one of at least N additional biomarkers selected from the list of biomarkers in Table 2B, wherein N equals 1, 2, 3, 4, 5, 6, 7, 8, 9, 10, 11, 12, 13, 14, 15, 16, 17, 18, 29, 20, 21, 22, 23, 24, 25, 26, 27, 28, 29, 30, 31, 32, 33, 34, 35, 36, 37, 38 or 39.
- In a further aspect, therapeutic responsiveness is predicted, or a cancer diagnosis is indicated, in an individual by conducting an assay on a biological sample from the individual and detecting biomarker values that each correspond to at least two of the biomarkers CXCL10, MX1, IDO1 and IFI44L and at least N additional biomarkers selected from the list of biomarkers in Table 2B, wherein N equals 1, 2, 3, 4, 5, 6, 7, 8, 9, 10, 11, 12, 13, 14, 15, 16, 17, 18, 19, 20, 21, 22, 23, 24, 25, 26, 27, 28, 29, 30, 31, 32, 33, 34, 35, 36, 37, 38, 39, or 40. In a further aspect, therapeutic responsiveness is predicted, or a cancer diagnosis is indicated, in an individual by conducting an assay on a biological sample from the individual and detecting biomarker values that each correspond to the biomarkers CXCL10, MX1, IDO1 and IFI44L and one of at least N additional biomarkers selected from the list of biomarkers in Table 2B, wherein N equals 1, 2, 3, 4, 5, 6, 7, 8, 9, 10, 11, 12, 13, 14, 15, 16, 17, 18, 19, 20, 21, 22, 23, 24, 25, 26, 27, 28, 29, 30, 31, 32, 33, 34, 35, 36, 37, 38, 39, or 40. In a further aspect, therapeutic responsiveness is predicted, or a cancer diagnosis is indicated, in an individual by conducting an assay on a biological sample from the individual and detecting biomarker values that each correspond to the biomarker CXCL10 and one of at least N additional biomarkers selected from the list of biomarkers in Table 2B, wherein N equals 1, 2, 3, 4, 5, 6, 7, 8, 9, 10, 11, 12, 13, 14, 15, 16, 17, 18, 29, 20, 21, 22, 23, 24, 25, 26, 27, 28, 29, 30, 31, 32, 33, 34, 35, 36, 37, 38, 39, 40, 41, 42 or 43. In a further aspect, therapeutic responsiveness is predicted, or a cancer diagnosis is indicated, in an individual by conducting an assay on a biological sample from the individual and detecting biomarker values that each correspond to the biomarker MX1 and one of at least N additional biomarkers selected from the list of biomarkers in Table 2B, wherein N equals 1, 2, 3, 4, 5, 6, 7, 8, 9, 10, 11, 12, 13, 14, 15, 16, 17, 18, 29, 20, 21, 22, 23, 24, 25, 26, 27, 28, 29, 30, 31, 32, 33, 34, 35, 36, 37, 38, 39, 40, 41, 42 or 43. In a further aspect, therapeutic responsiveness is predicted, or a cancer diagnosis is indicated, in an individual by conducting an assay on a biological sample from the individual and detecting biomarker values that each correspond to the biomarker IDO1 and one of at least N additional biomarkers selected from the list of biomarkers in Table 2B, wherein N equals 1, 2, 3, 4, 5, 6, 7, 8, 9, 10, 11, 12, 13, 14, 15, 16, 17, 18, 29, 20, 21, 22, 23, 24, 25, 26, 27, 28, 29, 30, 31, 32, 33, 34, 35, 36, 37, 38, 39, 40, 41, 42 or 43. In a further aspect, therapeutic responsiveness is predicted, or a cancer diagnosis is indicated, in an individual by conducting an assay on a biological sample from the individual and detecting biomarker values that each correspond to the biomarker IFI44L and one of at least N additional biomarkers selected from the list of biomarkers in Table 2B, wherein N equals 1, 2, 3, 4, 5, 6, 7, 8, 9, 10, 11, 12, 13, 14, 15, 16, 17, 18, 29, 20, 21, 22, 23, 24, 25, 26, 27, 28, 29, 30, 31, 32, 33, 34, 35, 36, 37, 38, 39, 40, 41, 42 or 43.
- In other embodiments, the probes listed in Table 2C (SEQ ID NOs:83-202), or subsets thereof, may be used in the methods described herein. These subsets include but are not limited to a subset of SEQ ID NOs corresponding to one or more of GBP5, CXCL10, IDO1, MX1, IF144I, CD2, PRAME, ITGAL, LRP4, and APOL3. In other embodiments, the probes correspond to all of the biomarkers CXCL10, MX1, IDO1, IF144L, CD2, GBP5, PRAME, ITGAL, LRP4, APOL3, CDR1, FYB, TSPAN7, RAC2, KLHDC7B, GRB14, AC138128.1, KIF26A, CD274, CD109, ETV7, MFAP5, OLFM4, PI15, FOSB, FAM19A5, NLRC5, PRICKLE1, EGR1, CLDN10, ADAMTS4, SP140L, ANXA1, RSAD2, ESR1, IKZF3, OR2I1P, EGFR, NAT1, LATS2, CYP2B6, PTPRC, PPP1R1A, and AL137218.1. It should be understood that each subset can include multiple probes directed to the same biomarker. For example, the probes represented by SEQ ID NOs: 135, 140, 142 and 195 are all directed to GBP5. Accordingly, a subset containing probes directed or corresponding to GBP5 includes one or more of SEQ ID NOs: 135, 140, 142 and 195. A subset containing probes directed to or corresponding to CXCL10 includes one or more of SEQ ID NOs: 131 and 160.
- In other embodiments, specific nucleic acid amplification assays (e.g. PCR, such as qPCR) may be used to determine the expression level of one or more of the genes or sets of genes described herein. The expression level(s) of one or more of the genes may be determined using primers (primer pairs) and/or probes that hybridize with the sequence of the one or more genes. Exemplary primer pairs and probes are provided in Table 2E for each of the genes of the 44-gene DDRD classifier model. The primer pairs and/or probes provided for each gene may be used alone or two or more of the primer pairs and/or probes may be used in combination in accordance with any of the sets of genes described herein. For example, the primer pairs and/or probes provided in Table 2E may be used to determine the expression level of any of the gene signatures provided in Tables 3-45. Exemplary PCR assays are summarized in Table 2E for each of the genes of the 44-gene DDRD classifier model. The PCR assay provided for each gene may be used alone or two or more of the assays may be used in combination in accordance with any of the sets of genes described herein. For example, the PCR assays provided in the table may be used to determine the expression level of any of the gene signatures provided in Tables 3-45.
Table 2E - PCR assays designed for each of the 44 genes listed in Table 2B GenBank ID Gene Symbol Assay ID Forward Primer ID Forward Primer SEQ ID NO Forward Primer ABI Tm (ºC) Reverse Primer ID Reverse Primer SEQ ID NO Reverse Primer ABI Tm (ºC) Probe ID Probe SEQ ID NO Probe ABI Tm (ºC) NM_002164 IDO1 IDO_A1 IDO_F1 203 56.80 IDO_R1 204 56.30 IDO_P1 205 62.00 NM_001767 CD2 CD2_A1 CD2_F1 206 58.20 CD2_R1 207 57.80 CD2_P1 208 64.90 NM_052942 GBP5 GBP5_A1 GBP5_F1 209 57.00 GBP5_R1 210 58.10 GBP5_P1 211 64.30 NM_206953 PRAME PRAME_A1 PRAME_F1 212 58.40 PRAME_R1 213 58.40 PRAME_P1 214 64.00 NM_002209 ITGAL ITGAL_A1 ITGAL_F1 215 59.20 ITGAL_R1 216 58.30 ITGAL_P1 217 66.10 NM_002334 LRP4 LRP4_A1 LRP4_F1 218 57.20 LRP4_R1 219 58.50 LRP4_P1 220 63.80 NM_145640 APOL3 APOL3_A1 APOL3_F1 221 57.10 APOL3_R1 222 57.90 APOL3_P1 223 63.10 NM_004065 CDR1 CDR1_A1 CDR1_F1 224 58.30 CDR1_R1 225 57.90 CDR1_P1 226 63.80 NM_001465 FYB FYBA1 FYB_F1 227 59.10 FYB_R1 228 59.20 FYB_P1 229 64.70 NM_004615 TSPAN7 TSPAN7_A1 TSPAN7_F1 230 58.00 TSPAN7_R1 231 57.40 TSPAN7_P1 232 63.20 NM_002872 RAC2 RAC2_A1 RAC2_F1 233 59.10 RAC2_R1 234 58.70 RAC2_P1 235 64.20 NM_138433 KLHDC7B KLHDC7B_A1 KLHDC7B_F1 236 59.40 KLHDC7B_R1 237 59.70 KLHDC7B_P1 238 66.50 NM_004490 GRB14 GRB14_A1 GRB14_F1 239 57.70 GRB14_R1 240 57.30 GRB14_P1 241 62.70 NM_015656 KIF26A KIF26A_A1 KIF26A_F1 242 58.40 KIF26A_R1 243 59.40 KIF26A_P1 244 66.80 NM_014143 CD274 CD274_A1 CD274_F1 245 58.60 CD274_R1 246 57.50 CD274_P1 247 65.80 NM_133493 CD109 CD109_A1 CD109_F1 248 59.60 CD109_R1 249 58.70 CD109_P1 250 67.10 NM_016135 ETV7 ETV7_A1 ETV7_F1 251 58.90 ETV7_R1 252 59.20 ETV7_P1 253 65.70 NM_003480 MFAP5 MFAP5_A1 MFAP5_F1 254 58.80 MFAP5_R1 255 59.40 MFAP5_P1 256 64.90 NM_006418 OLFM4 OLFM4_A1 OLFM4_F1 257 57.70 OLFM4_R1 258 58.60 OLFM4_P1 259 63.60 NM_015886 PI15 PI15_A1 PI15_F1 260 58.20 PI15_R1 261 58.60 PI15_P1 262 64.20 NM_006732 FOSB FOSB_A1 FOSB_F1 263 59.30 FOSB_R1 264 59.40 FOSB_P1 265 66.80 NM_001565 CXCL10 CXCL10_A1 CXCL10_F1 266 63.87 CXCL10_R1 267 63.23 CXCL10_P1 268 72.36 NM_001144925.2 MX1 MX1_A1 MX1_F1 269 61.41 MX1_R1 270 61.01 MX1_P1 271 72.48 NM_006820.3 IFI44L IFI44L_A1 IFI44L_F1 272 65.75 IFI44L_R1 273 65.12 IFI44L_P1 274 69.81 NM_001166049.1 AC138128.1 AC138128.1_A1 AC138128.1_F1 275 60.48 AC138128.1_R1 276 64.46 AC138128.1_P1 277 72.44 NM_001082967.2 FAM19A5 FAM19A5_A1 FAM19A5_F1 278 64.30 FAM19A5_R1 279 61.45 FAM19A5_P1 280 73.11 NM_032206.4 NLRC5 NLRC5_A1 NLRC5_F1 281 62.55 NLRC5_R1 282 62.69 NLRC5_P1 283 69.77 NM_001144881.1 PRICKLE1 PRICKLE1_A1 PRICKLE1_F1 284 68.01 PRICKLE1_R1 285 65.53 PRICKLE1_P1 286 70.66 NM_001964.2 EGR1 EGR1_A1 EGR1_F1 287 61.27 EGR1_R1 288 61.27 EGR1_P1 289 68.60 NM_001160100.1 CLDN10 CLDN10_A1 CLDN10_F1 290 68.19 CLDN10_R1 291 62.50 CLDN10_P1 292 68.19 NM_005099.4 ADAMTS4 ADAMTS4_A1 ADAMTS4_F1 293 63.69 ADAMTS4_R1 294 63.82 ADAMTS4_P1 295 71.38 NM_001308162.1 SP140L SP140L_A1 SP140L_F1 296 60.61 SP140L_R1 297 62.67 SP140L_P1 298 72.17 NM_000700.2 ANXA1 ANXA_A1 ANXA_F1 299 64.80 ANXA_R1 300 64.81 ANXA_P1 301 72.90 NM_080657.4 RSAD2 RSAD2_A1 RSAD2_F1 302 63.44 RSAD2_R1 303 63.00 RSAD2_P1 304 70.95 NM_000125.3 ESR1 ESR1_A1 ESR1_F1 305 61.54 ESR1_R1 306 64.65 ESR1_P1 307 70.06 NM_001257408.1 IKZF3 IKZF3_A1 IKZF3_F1 308 62.37 IKZF3_R1 309 64.92 IKZF3_P1 310 69.53 NT_167248.2 OR2I1P OR2I1P_A1 OR2I1P_F1 353 N/A OR2I1P_R1 354 58.13 OR2I1P_P1 355 67.43 NM_005228.3 EGFR EGFR_A1 EGFR_F1 311 62.20 EGFR_R1 312 62.13 EGFR_P1 313 70.85 NM_000662.7 NAT1 NAT1_A1 NAT1_F1 314 60.92 NAT1_R1 315 62.70 NAT1_P1 316 70.40 NM_014572.2 LATS2 LATS2_A1 LATS2_F1 317 60.44 LATS2_R1 318 60.54 LATS2_P1 319 71.63 NM_000767.4 CYP2B6 CYP2B6_A1 CYP2B6_F1 320 64.52 CYP2B6_R1 321 62.64 CYB2B6_P1 322 73.80 NM_001267798 PTPRC PTPRC_A1 PTPRC_F1 323 62.95 PTPRC_R1 324 62.81 PTPRC_P1 325 70.74 NM_006741.3 PPP1R1A PPP1R1A_A1 PPP1R1A_F1 326 62.77 PPP1R1A_R1 327 66.34 PPP1R1A_P1 328 69.55 NR_003366.2 AL137218.1 AL137218.1_A1 AL137218.1_F1 356 57.17 AL137218.1_R1 357 56.40 AL137218.1_P1 358 67.23 - It should be noted that the complement of each sequence described herein may be employed as appropriate (e.g. for designing hybridizing probes and/or primers, including primer pairs).
- Additional gene signatures representing selections of the 44 gene signature are described herein and are applicable to all aspects of the invention. The additional gene signatures are set forth in Tables 3-45, together with suitable weight and bias scores that may be adopted when calculating the final signature score (as further described herein). The k value for each signature can be set once the threshold for defining a positive signature score has been determined, as would be readily appreciated by the skilled person. Similarly, the rankings for each gene in the signature can readily be determined by reviewing the weightings attributed to each gene (where a larger weight indicates a higher ranking in the signature - see Tables 2A and 2B for the rank order in respect of the 40 and 44 gene signatures, respectively).
- Whilst Tables 3-45 provide an exemplary weight and bias for each gene in each signature, it will be appreciated that the gene signatures provided by these tables are not limited to the particular weights and biases given. Weight values may indicate the directionality of expression that is measured to indicate a positive signature score according to the invention. Thus, a positive weight indicates that an increase in gene expression contributes to a positive signature score/identification of DDRD biology and vice versa.
- Suitable probes and probesets to investigate the expression of the genes included in Tables 3-45 are provided in Table 2C and Table 2D. In addition, suitable PCR assays to investigate the expression of the genes included in Tables 3-45 are provided in Table 2E.
Table 3 - One gene signature Gene Names Weight Bias CXCL10 0.137044 2.03931 Table 4 - Two gene signature Gene Names Weight Bias CXCL10 0.081638 2.03931 MX1 0.080192 3.43549 Table 5 - Three gene signature Gene Names Weight Bias CXCL10 0.058512 2.03931 IDO1 0.055977 0.725702 MX1 0.057475 3.43549 Table 6 - Four gene signature Gene Names Weight Bias CXCL10 0.048331 2.03931 IDO1 0.046238 0.725702 IFI44L 0.0401 1.17581 MX1 0.047475 3.43549 Table 7 - Five gene signature Gene Names Weight Bias CD2 0.034275 4.09036 CXCL10 0.041595 2.03931 IDO1 0.039792 0.725702 IFI44L 0.034511 1.17581 MX1 0.040858 3.43549 Table 8 - Six gene signature Gene Names Weight Bias CD2 0.030041 4.09036 CXCL10 0.036456 2.03931 GBP5 0.028552 1.39771 IDO1 0.034877 0.725702 IFI44L 0.030247 1.17581 MX1 0.03581 3.43549 Table 9 - Seven gene signature Gene Names Weight Bias CD2 0.025059 4.09036 CXCL10 0.03041 2.03931 GBP5 0.023817 1.39771 IDO1 0.029093 0.725702 IFI44L 0.025231 1.17581 MX1 0.029872 3.43549 PRAME 0.023355 2.2499 Table 10 - Eight gene signature Gene Names Weight Bias CD2 0.02446 4.09036 CXCL10 0.029683 2.03931 GBP5 0.023247 1.39771 IDO1 0.028397 0.725702 IFI44L 0.024628 1.17581 ITGAL 0.022705 3.21615 MX1 0.029157 3.43549 PRAME 0.022796 2.2499 Table 11 - Nine gene signature Gene Names Weight Bias CD2 0.023997 4.09036 CXCL10 0.029122 2.03931 GBP5 0.022807 1.39771 IDO1 0.02786 0.725702 IFI44L 0.024162 1.17581 ITGAL 0.022275 3.21615 LRP4 -0.02008 0.306454 MX1 0.028606 3.43549 PRAME 0.022365 2.2499 Table 12 - Ten gene signature Gene Names Weight Bias APOL3 0.017969 2.20356 CD2 0.02255 4.09036 CXCL10 0.027366 2.03931 GBP5 0.021432 1.39771 IDO1 0.02618 0.725702 IFI44L 0.022705 1.17581 ITGAL 0.020932 3.21615 LRP4 -0.01887 0.306454 MX1 0.026881 3.43549 PRAME 0.021017 2.2499 Table 13 - Eleven gene signature Gene Names Weight Bias APOL3 0.018313 2.20356 CD2 0.022983 4.09036 CDR1 -0.01806 4.79794 CXCL10 0.027891 2.03931 GBP5 0.021844 1.39771 IDO1 0.026683 0.725702 IFI44L 0.023141 1.17581 ITGAL 0.021334 3.21615 LRP4 -0.01923 0.306454 MX1 0.027397 3.43549 PRAME 0.02142 2.2499 Table 14 - Twelve gene signature Gene Names Weight Bias APOL3 0.017235 2.20356 CD2 0.021629 4.09036 CDR1 -0.017 4.79794 CXCL10 0.026248 2.03931 FYB 0.016949 1.56179 GBP5 0.020557 1.39771 IDO1 0.025111 0.725702 IFI44L 0.021778 1.17581 ITGAL 0.020077 3.21615 LRP4 -0.0181 0.306454 MX1 0.025783 3.43549 PRAME 0.020158 2.2499 Table 15 - Thirteen gene signature Gene Names Weight Bias APOL3 0.017102 2.20356 CD2 0.021463 4.09036 CDR1 -0.01687 4.79794 CXCL10 0.026046 2.03931 FYB 0.016819 1.56179 GBP5 0.020399 1.39771 IDO1 0.024918 0.725702 IFI44L 0.02161 1.17581 ITGAL 0.019923 3.21615 LRP4 -0.01796 0.306454 MX1 0.025585 3.43549 PRAME 0.020003 2.2499 TSPAN7 -0.01675 1.65843 Table 16 - Fourteen gene signature Gene Names weight bias APOL3 0.016213 2.20356 CD2 0.020347 4.09036 CDR1 -0.01599 4.79794 CXCL10 0.024692 2.03931 FYB 0.015945 1.56179 GBP5 0.019338 1.39771 IDO1 0.023622 0.725702 IFI44L 0.020487 1.17581 ITGAL 0.018887 3.21615 LRP4 -0.01703 0.306454 MX1 0.024255 3.43549 PRAME 0.018963 2.2499 RAC2 0.01586 3.03644 TSPAN7 -0.01588 1.65843 Table 17 - Fifteen gene signature Gene Names Weight Bias APOL3 0.015496 2.20356 CD2 0.019447 4.09036 CDR1 -0.01528 4.79794 CXCL10 0.023599 2.03931 FYB 0.015239 1.56179 GBP5 0.018482 1.39771 IDO1 0.022577 0.725702 IFI44L 0.01958 1.17581 ITGAL 0.018051 3.21615 KLHDC7B 0.014303 1.43954 LRP4 -0.01627 0.306454 MX1 0.023181 3.43549 PRAME 0.018124 2.2499 RAC2 0.015158 3.03644 TSPAN7 -0.01518 1.65843 Table 18 - Sixteen gene signature Gene Names Weight Bias APOL3 0.016001 2.20356 CD2 0.020081 4.09036 CDR1 -0.01578 4.79794 CXCL10 0.024369 2.03931 FYB 0.015736 1.56179 GBP5 0.019085 1.39771 GRB14 0.014473 0.269629 IDO1 0.023313 0.725702 IFI44L 0.020219 1.17581 ITGAL 0.01864 3.21615 KLHDC7B 0.014769 1.43954 LRP4 -0.0168 0.306454 MX1 0.023937 3.43549 PRAME 0.018715 2.2499 RAC2 0.015653 3.03644 TSPAN7 -0.01567 1.65843 Table 19 - Seventeen gene signature Gene Names Weight Bias AC138128.1 -0.01406 1.4071 APOL3 0.015604 2.20356 CD2 0.019583 4.09036 CDR1 -0.01539 4.79794 CXCL10 0.023765 2.03931 FYB 0.015346 1.56179 GBP5 0.018612 1.39771 GRB14 0.014114 0.269629 IDO1 0.022735 0.725702 IFI44L 0.019718 1.17581 ITGAL 0.018178 3.21615 KLHDC7B 0.014403 1.43954 LRP4 -0.01639 0.306454 MX1 0.023344 3.43549 PRAME 0.018251 2.2499 RAC2 0.015265 3.03644 TSPAN7 -0.01528 1.65843 Table 20 - Eighteen gene signature Gene Names Weight Bias AC138128.1 -0.01401 1.4071 APOL3 0.015556 2.20356 CD2 0.019522 4.09036 CDR1 -0.01534 4.79794 CXCL10 0.023691 2.03931 FYB 0.015298 1.56179 GBP5 0.018554 1.39771 GRB14 0.01407 0.269629 IDO1 0.022665 0.725702 IFI44L 0.019656 1.17581 ITGAL 0.018121 3.21615 KIF26A -0.01397 2.05036 KLHDC7B 0.014359 1.43954 LRP4 -0.01634 0.306454 MX1 0.023271 3.43549 PRAME 0.018194 2.2499 RAC2 0.015217 3.03644 TSPAN7 -0.01524 1.65843 Table 21 - Nineteen gene signature Gene Names Weight Bias AC138128.1 -0.01338 1.4071 APOL3 0.014853 2.20356 CD2 0.01864 4.09036 CD274 0.013043 1.37297 CDR1 -0.01465 4.79794 CXCL10 0.02262 2.03931 FYB 0.014607 1.56179 GBP5 0.017716 1.39771 GRB14 0.013434 0.269629 IDO1 0.02164 0.725702 IFI44L 0.018768 1.17581 ITGAL 0.017302 3.21615 KIF26A -0.01334 2.05036 KLHDC7B 0.01371 1.43954 LRP4 -0.0156 0.306454 MX1 0.022219 3.43549 PRAME 0.017372 2.2499 RAC2 0.014529 3.03644 TSPAN7 -0.01455 1.65843 Table 22 - Twenty gene signature Gene Names Weight Bias AC138128.1 -0.0137 1.4071 APOL3 0.015205 2.20356 CD109 -0.01292 0.947671 CD2 0.019081 4.09036 CD274 0.013352 1.37297 CDR1 -0.015 4.79794 CXCL10 0.023156 2.03931 FYB 0.014953 1.56179 GBP5 0.018135 1.39771 GRB14 0.013752 0.269629 IDO1 0.022153 0.725702 IFI44L 0.019212 1.17581 ITGAL 0.017712 3.21615 KIF26A -0.01366 2.05036 KLHDC7B 0.014034 1.43954 LRP4 -0.01597 0.306454 MX1 0.022746 3.43549 PRAME 0.017783 2.2499 RAC2 0.014874 3.03644 TSPAN7 -0.01489 1.65843 Table 23 - Twenty one gene signature Gene Names Weight Bias AC138128.1 -0.01327 1.4071 APOL3 0.014725 2.20356 CD109 -0.01251 0.947671 CD2 0.018479 4.09036 CD274 0.012931 1.37297 CDR1 -0.01452 4.79794 CXCL10 0.022425 2.03931 ETV7 0.012047 1.46783 FYB 0.014481 1.56179 GBP5 0.017563 1.39771 GRB14 0.013318 0.269629 IDO1 0.021453 0.725702 IFI44L 0.018606 1.17581 ITGAL 0.017153 3.21615 KIF26A -0.01323 2.05036 KLHDC7B 0.013591 1.43954 LRP4 -0.01546 0.306454 MX1 0.022028 3.43549 PRAME 0.017222 2.2499 RAC2 0.014404 3.03644 TSPAN7 -0.01442 1.65843 Table 24 - Twenty two gene signature Gene Names Weight Bias AC138128.1 -0.01326 1.4071 APOL3 0.014714 2.20356 CD109 -0.0125 0.947671 CD2 0.018466 4.09036 CD274 0.012921 1.37297 CDR1 -0.01451 4.79794 CXCL10 0.022409 2.03931 ETV7 0.012038 1.46783 FYB 0.014471 1.56179 GBP5 0.01755 1.39771 GRB14 0.013309 0.269629 IDO1 0.021438 0.725702 IFI44L 0.018593 1.17581 ITGAL 0.017141 3.21615 KIF26A -0.01322 2.05036 KLHDC7B 0.013582 1.43954 LRP4 -0.01545 0.306454 MFAP5 -0.01172 2.69918 MX1 0.022012 3.43549 PRAME 0.01721 2.2499 RAC2 0.014394 3.03644 TSPAN7 -0.01441 1.65843 Table 25 - Twenty three gene signature Gene Names Weight Bias AC138128.1 -0.01361 1.4071 APOL3 0.015108 2.20356 CD109 -0.01284 0.947671 CD2 0.018961 4.09036 CD274 0.013268 1.37297 CDR1 -0.0149 4.79794 CXCL10 0.02301 2.03931 ETV7 0.012361 1.46783 FYB 0.014858 1.56179 GBP5 0.018021 1.39771 GRB14 0.013666 0.269629 IDO1 0.022013 0.725702 IFI44L 0.019091 1.17581 ITGAL 0.0176 3.21615 KIF26A -0.01357 2.05036 KLHDC7B 0.013946 1.43954 LRP4 -0.01587 0.306454 MFAP5 -0.01204 2.69918 MX1 0.022602 3.43549 OLFM4 -0.01167 0.636684 PRAME 0.017671 2.2499 RAC2 0.01478 3.03644 TSPAN7 -0.0148 1.65843 Table 26 - Twenty four gene signature Gene Names Weight Bias AC138128.1 -0.01365 1.4071 APOL3 0.015148 2.20356 CD109 -0.01287 0.947671 CD2 0.01901 4.09036 CD274 0.013302 1.37297 CDR1 -0.01494 4.79794 CXCL10 0.023069 2.03931 ETV7 0.012393 1.46783 FYB 0.014897 1.56179 GBP5 0.018068 1.39771 GRB14 0.013701 0.269629 IDO1 0.02207 0.725702 IFI44L 0.019141 1.17581 ITGAL 0.017646 3.21615 KIF26A -0.01361 2.05036 KLHDC7B 0.013982 1.43954 LRP4 -0.01591 0.306454 MFAP5 -0.01207 2.69918 MX1 0.022661 3.43549 OLFM4 -0.0117 0.636684 PI15 -0.01146 0.335476 PRAME 0.017717 2.2499 RAC2 0.014818 3.03644 TSPAN7 -0.01484 1.65843 Table 27 - Twenty five gene signature Gene Names Weight Bias AC138128.1 -0.01342 1.4071 APOL3 0.014899 2.20356 CD109 -0.01266 0.947671 CD2 0.018698 4.09036 CD274 0.013084 1.37297 CDR1 -0.0147 4.79794 CXCL10 0.022691 2.03931 ETV7 0.01219 1.46783 FOSB -0.01093 1.85886 FYB 0.014653 1.56179 GBP5 0.017771 1.39771 GRB14 0.013476 0.269629 IDO1 0.021708 0.725702 IFI44L 0.018827 1.17581 ITGAL 0.017357 3.21615 KIF26A -0.01338 2.05036 KLHDC7B 0.013753 1.43954 LRP4 -0.01565 0.306454 MFAP5 -0.01187 2.69918 MX1 0.022289 3.43549 OLFM4 -0.01151 0.636684 PI15 -0.01128 0.335476 PRAME 0.017426 2.2499 RAC2 0.014575 3.03644 TSPAN7 -0.01459 1.65843 Table 28 - Twenty six gene signature Gene Names Weight Bias AC138128.1 -0.01339 1.4071 APOL3 0.014858 2.20356 CD109 -0.01262 0.947671 CD2 0.018647 4.09036 CD274 0.013048 1.37297 CDR1 -0.01465 4.79794 CXCL10 0.022629 2.03931 ETV7 0.012157 1.46783 FAM19A5 -0.01083 0.413683 FOSB -0.0109 1.85886 FYB 0.014613 1.56179 GBP5 0.017723 1.39771 GRB14 0.013439 0.269629 IDO1 0.021649 0.725702 IFI44L 0.018775 1.17581 ITGAL 0.017309 3.21615 KIF26A -0.01335 2.05036 KLHDC7B 0.013715 1.43954 LRP4 -0.0156 0.306454 MFAP5 -0.01184 2.69918 MX1 0.022228 3.43549 OLFM4 -0.01148 0.636684 PI15 -0.01125 0.335476 PRAME 0.017379 2.2499 RAC2 0.014535 3.03644 TSPAN7 -0.01455 1.65843 Table 29 - Twenty seven gene signature Gene Names Weight Bias AC138128.1 -0.01316 1.4071 APOL3 0.014603 2.20356 CD109 -0.01241 0.947671 CD2 0.018326 4.09036 CD274 0.012824 1.37297 CDR1 -0.0144 4.79794 CXCL10 0.022239 2.03931 ETV7 0.011947 1.46783 FAM19A5 -0.01064 0.413683 FOSB -0.01071 1.85886 FYB 0.014361 1.56179 GBP5 0.017417 1.39771 GRB14 0.013208 0.269629 IDO1 0.021276 0.725702 IFI44L 0.018452 1.17581 ITGAL 0.017011 3.21615 KIF26A -0.01312 2.05036 KLHDC7B 0.013479 1.43954 LRP4 -0.01534 0.306454 MFAP5 -0.01164 2.69918 MX1 0.021845 3.43549 NLRC5 0.009724 2.26863 OLFM4 -0.01128 0.636684 PI15 -0.01105 0.335476 PRAME 0.017079 2.2499 RAC2 0.014285 3.03644 TSPAN7 -0.0143 1.65843 Table 30 - Twenty eight gene signature Gene Names Weight Bias AC138128.1 -0.01326 1.4071 APOL3 0.014712 2.20356 CD109 -0.0125 0.947671 CD2 0.018464 4.09036 CD274 0.01292 1.37297 CDR1 -0.01451 4.79794 CXCL10 0.022407 2.03931 ETV7 0.012037 1.46783 FAM19A5 -0.01072 0.413683 FOSB -0.01079 1.85886 FYB 0.014469 1.56179 GBP5 0.017548 1.39771 GRB14 0.013307 0.269629 IDO1 0.021436 0.725702 IFI44L 0.018591 1.17581 ITGAL 0.017139 3.21615 KIF26A -0.01322 2.05036 KLHDC7B 0.01358 1.43954 LRP4 -0.01545 0.306454 MFAP5 -0.01172 2.69918 MX1 0.02201 3.43549 NLRC5 0.009797 2.26863 OLFM4 -0.01137 0.636684 PI15 -0.01114 0.335476 PRAME 0.017208 2.2499 PRICKLE1 -0.00864 1.77018 RAC2 0.014392 3.03644 TSPAN7 -0.01441 1.65843 Table 31 - Twenty nine gene signature Gene Names Weight Bias AC138128.1 -0.01307 1.4071 APOL3 0.014506 2.20356 CD109 -0.01232 0.947671 CD2 0.018204 4.09036 CD274 0.012739 1.37297 CDR1 -0.01431 4.79794 CXCL10 0.022092 2.03931 EGR1 -0.00827 2.18651 ETV7 0.011868 1.46783 FAM19A5 -0.01057 0.413683 FOSB -0.01064 1.85886 FYB 0.014266 1.56179 GBP5 0.017302 1.39771 GRB14 0.01312 0.269629 IDO1 0.021135 0.725702 IFI44L 0.01833 1.17581 ITGAL 0.016898 3.21615 KIF26A -0.01303 2.05036 KLHDC7B 0.013389 1.43954 LRP4 -0.01523 0.306454 MFAP5 -0.01156 2.69918 MX1 0.021701 3.43549 NLRC5 0.009659 2.26863 OLFM4 -0.01121 0.636684 PI15 -0.01098 0.335476 PRAME 0.016966 2.2499 PRICKLE1 -0.00852 1.77018 RAC2 0.01419 3.03644 TSPAN7 -0.01421 1.65843 Table 32 - Thirty gene signature Gene Names Weight Bias AC138128.1 -0.01326 1.4071 APOL3 0.014722 2.20356 CD109 -0.01251 0.947671 CD2 0.018476 4.09036 CD274 0.012928 1.37297 CDR1 -0.01452 4.79794 CLDN10 -0.00834 -0.34464 CXCL10 0.022421 2.03931 EGR1 -0.00839 2.18651 ETV7 0.012045 1.46783 FAM19A5 -0.01073 0.413683 FOSB -0.0108 1.85886 FYB 0.014478 1.56179 GBP5 0.01756 1.39771 GRB14 0.013316 0.269629 IDO1 0.02145 0.725702 IFI44L 0.018603 1.17581 ITGAL 0.01715 3.21615 KIF26A -0.01323 2.05036 KLHDC7B 0.013589 1.43954 LRP4 -0.01546 0.306454 MFAP5 -0.01173 2.69918 MX1 0.022024 3.43549 NLRC5 0.009803 2.26863 OLFM4 -0.01137 0.636684 PI15 -0.01114 0.335476 PRAME 0.017219 2.2499 PRICKLE1 -0.00864 1.77018 RAC2 0.014402 3.03644 TSPAN7 -0.01442 1.65843 Table 33 - Thirty one gene signature Gene Names Weight Bias AC138128.1 -0.01339 1.4071 ADAMTS4 -0.00837 1.95693 APOL3 0.014864 2.20356 CD109 -0.01263 0.947671 CD2 0.018654 4.09036 CD274 0.013053 1.37297 CDR1 -0.01466 4.79794 CLDN10 -0.00842 -0.34464 CXCL10 0.022638 2.03931 EGR1 -0.00847 2.18651 ETV7 0.012161 1.46783 FAM19A5 -0.01083 0.413683 FOSB -0.0109 1.85886 FYB 0.014618 1.56179 GBP5 0.017729 1.39771 GRB14 0.013444 0.269629 IDO1 0.021657 0.725702 IFI44L 0.018782 1.17581 ITGAL 0.017316 3.21615 KIF26A -0.01335 2.05036 KLHDC7B 0.01372 1.43954 LRP4 -0.01561 0.306454 MFAP5 -0.01184 2.69918 MX1 0.022236 3.43549 NLRC5 0.009898 2.26863 OLFM4 -0.01148 0.636684 PI15 -0.01125 0.335476 PRAME 0.017385 2.2499 PRICKLE1 -0.00873 1.77018 RAC2 0.014541 3.03644 TSPAN7 -0.01456 1.65843 Table 34 - Thirty two gene signature Gene Names Weight Bias AC138128.1 -0.01332 1.4071 ADAMTS4 -0.00832 1.95693 APOL3 0.014789 2.20356 CD109 -0.01256 0.947671 CD2 0.01856 4.09036 CD274 0.012987 1.37297 CDR1 -0.01459 4.79794 CLDN10 -0.00838 -0.34464 CXCL10 0.022523 2.03931 EGR1 -0.00843 2.18651 ETV7 0.0121 1.46783 FAM19A5 -0.01078 0.413683 FOSB -0.01085 1.85886 FYB 0.014544 1.56179 GBP5 0.01764 1.39771 GRB14 0.013377 0.269629 IDO1 0.021548 0.725702 IFI44L 0.018688 1.17581 ITGAL 0.017228 3.21615 KIF26A -0.01329 2.05036 KLHDC7B 0.013651 1.43954 LRP4 -0.01553 0.306454 MFAP5 -0.01178 2.69918 MX1 0.022124 3.43549 NLRC5 0.009848 2.26863 OLFM4 -0.01143 0.636684 PI15 -0.01119 0.335476 PRAME 0.017298 2.2499 PRICKLE1 -0.00868 1.77018 RAC2 0.014467 3.03644 SP140L 0.00825 0.550538 TSPAN7 -0.01449 1.65843 Table 35 - Thirty three gene signature Gene Names Weight Bias AC138128.1 -0.01348 1.4071 ADAMTS4 -0.00842 1.95693 ANXA1 -0.0081 2.00146 APOL3 0.014961 2.20356 CD109 -0.01271 0.947671 CD2 0.018776 4.09036 CD274 0.013138 1.37297 CDR1 -0.01476 4.79794 CLDN10 -0.00848 -0.34464 CXCL10 0.022785 2.03931 EGR1 -0.00853 2.18651 ETV7 0.01224 1.46783 FAM19A5 -0.0109 0.413683 FOSB -0.01097 1.85886 FYB 0.014713 1.56179 GBP5 0.017845 1.39771 GRB14 0.013532 0.269629 IDO1 0.021798 0.725702 IFI44L 0.018905 1.17581 ITGAL 0.017428 3.21615 KIF26A -0.01344 2.05036 KLHDC7B 0.01381 1.43954 LRP4 -0.01571 0.306454 MFAP5 -0.01192 2.69918 MX1 0.022381 3.43549 NLRC5 0.009962 2.26863 OLFM4 -0.01156 0.636684 PI15 -0.01132 0.335476 PRAME 0.017498 2.2499 PRICKLE1 -0.00878 1.77018 RAC2 0.014635 3.03644 SP140L 0.008345 0.550538 TSPAN7 -0.01465 1.65843 Table 36 - Thirty four gene signature Gene Names Weight Bias AC138128.1 -0.01334 1.4071 ADAMTS4 -0.00834 1.95693 ANXA1 -0.00802 2.00146 APOL3 0.014812 2.20356 CD109 -0.01258 0.947671 CD2 0.018589 4.09036 CD274 0.013007 1.37297 CDR1 -0.01461 4.79794 CLDN10 -0.00839 -0.34464 CXCL10 0.022558 2.03931 EGR1 -0.00844 2.18651 ETV7 0.012118 1.46783 FAM19A5 -0.0108 0.413683 FOSB -0.01086 1.85886 FYB 0.014567 1.56179 GBP5 0.017667 1.39771 GRB14 0.013397 0.269629 IDO1 0.021581 0.725702 IFI44L 0.018716 1.17581 ITGAL 0.017255 3.21615 KIF26A -0.01331 2.05036 KLHDC7B 0.013672 1.43954 LRP4 -0.01556 0.306454 MFAP5 -0.0118 2.69918 MX1 0.022159 3.43549 NLRC5 0.009863 2.26863 OLFM4 -0.01144 0.636684 PI15 -0.01121 0.335476 PRAME 0.017324 2.2499 PRICKLE1 -0.0087 1.77018 RAC2 0.01449 3.03644 RSAD2 0.007894 1.44894 SP140L 0.008262 0.550538 TSPAN7 -0.01451 1.65843 Table 37 - Thirty five gene signature Gene Names Weight Bias AC138128.1 -0.0137 1.4071 ADAMTS4 -0.00856 1.95693 ANXA1 -0.00823 2.00146 APOL3 0.015208 2.20356 CD109 -0.01292 0.947671 CD2 0.019085 4.09036 CD274 0.013355 1.37297 CDR1 -0.015 4.79794 CLDN10 -0.00862 -0.34464 CXCL10 0.023161 2.03931 EGR1 -0.00867 2.18651 ESR1 0.007943 0.851213 ETV7 0.012442 1.46783 FAM19A5 -0.01108 0.413683 FOSB -0.01115 1.85886 FYB 0.014956 1.56179 GBP5 0.018139 1.39771 GRB14 0.013755 0.269629 IDO1 0.022157 0.725702 IFI44L 0.019216 1.17581 ITGAL 0.017716 3.21615 KIF26A -0.01366 2.05036 KLHDC7B 0.014037 1.43954 LRP4 -0.01597 0.306454 MFAP5 -0.01212 2.69918 MX1 0.022751 3.43549 NLRC5 0.010127 2.26863 OLFM4 -0.01175 0.636684 PI15 -0.01151 0.335476 PRAME 0.017787 2.2499 PRICKLE1 -0.00893 1.77018 RAC2 0.014877 3.03644 RSAD2 0.008105 1.44894 SP140L 0.008483 0.550538 TSPAN7 -0.0149 1.65843 Table 38 - Thirty six gene signature Gene Names Weight Bias AC138128.1 -0.01359 1.4071 ADAMTS4 -0.00849 1.95693 ANXA1 -0.00816 2.00146 APOL3 0.015081 2.20356 CD109 -0.01281 0.947671 CD2 0.018926 4.09036 CD274 0.013244 1.37297 CDR1 -0.01487 4.79794 CLDN10 -0.00855 -0.34464 CXCL10 0.022968 2.03931 EGR1 -0.0086 2.18651 ESR1 0.007876 0.851213 ETV7 0.012338 1.46783 FAM19A5 -0.01099 0.413683 FOSB -0.01106 1.85886 FYB 0.014831 1.56179 GBP5 0.017988 1.39771 GRB14 0.01364 0.269629 IDO1 0.021973 0.725702 IFI44L 0.019056 1.17581 IKZF3 0.007318 -0.58991 ITGAL 0.017568 3.21615 KIF26A -0.01355 2.05036 KLHDC7B 0.01392 1.43954 LRP4 -0.01584 0.306454 MFAP5 -0.01202 2.69918 MX1 0.022561 3.43549 NLRC5 0.010042 2.26863 OLFM4 -0.01165 0.636684 PI15 -0.01141 0.335476 PRAME 0.017639 2.2499 PRICKLE1 -0.00885 1.77018 RAC2 0.014753 3.03644 RSAD2 0.008038 1.44894 SP140L 0.008412 0.550538 TSPAN7 -0.01477 1.65843 Table 39 - Thirty seven gene signature Gene Names Weight Bias AC138128.1 -0.01342 1.4071 ADAMTS4 -0.00838 1.95693 ANXA1 -0.00806 2.00146 APOL3 0.014896 2.20356 CD109 -0.01265 0.947671 CD2 0.018694 4.09036 CD274 0.013081 1.37297 CDR1 -0.01469 4.79794 CLDN10 -0.00844 -0.34464 CXCL10 0.022686 2.03931 EGR1 -0.00849 2.18651 ESR1 0.00778 0.851213 ETV7 0.012187 1.46783 FAM19A5 -0.01086 0.413683 FOSB -0.01092 1.85886 FYB 0.014649 1.56179 GBP5 0.017767 1.39771 GRB14 0.013473 0.269629 IDO1 0.021703 0.725702 IFI44L 0.018823 1.17581 IKZF3 0.007228 -0.58991 ITGAL 0.017353 3.21615 KIF26A -0.01338 2.05036 KLHDC7B 0.01375 1.43954 LRP4 -0.01564 0.306454 MFAP5 -0.01187 2.69918 MX1 0.022284 3.43549 NLRC5 0.009919 2.26863 OLFM4 -0.01151 0.636684 OR2I1 P 0.00685 -1.30235 PI15 -0.01127 0.335476 PRAME 0.017422 2.2499 PRICKLE1 -0.00875 1.77018 RAC2 0.014572 3.03644 RSAD2 0.007939 1.44894 SP140L 0.008309 0.550538 TSPAN7 -0.01459 1.65843 Table 40 - Thirty eight gene signature Gene Names Weight Bias AC138128.1 -0.01345 1.4071 ADAMTS4 -0.0084 1.95693 ANXA1 -0.00808 2.00146 APOL3 0.014924 2.20356 CD109 -0.01268 0.947671 CD2 0.01873 4.09036 CD274 0.013106 1.37297 CDR1 -0.01472 4.79794 CLDN10 -0.00846 -0.34464 CXCL10 0.022729 2.03931 EGFR -0.00649 -0.17669 EGR1 -0.00851 2.18651 ESR1 0.007795 0.851213 ETV7 0.01221 1.46783 FAM19A5 -0.01088 0.413683 FOSB -0.01095 1.85886 FYB 0.014677 1.56179 GBP5 0.017801 1.39771 GRB14 0.013499 0.269629 IDO1 0.021745 0.725702 IFI44L 0.018858 1.17581 IKZF3 0.007242 -0.58991 ITGAL 0.017386 3.21615 K!F26A -0.01341 2.05036 KLHDC7B 0.013776 1.43954 LRP4 -0.01567 0.306454 MFAP5 -0.01189 2.69918 MX1 0.022327 3.43549 NLRC5 0.009938 2.26863 OLFM4 -0.01153 0.636684 OR2I1 P 0.006863 -1.30235 PI15 -0.0113 0.335476 PRAME 0.017456 2.2499 PRICKLE1 -0.00876 1.77018 RAC2 0.0146 3.03644 RSAD2 0.007954 1.44894 SP140L 0.008325 0.550538 TSPAN7 -0.01462 1.65843 Table 41 - Thirty nine gene signature Gene Names Weight Bias AC138128.1 -0.01356 1.4071 ADAMTS4 -0.00847 1.95693 ANXA1 -0.00815 2.00146 APOL3 0.015054 2.20356 CD109 -0.01279 0.947671 CD2 0.018892 4.09036 CD274 0.01322 1.37297 CDR1 -0.01485 4.79794 CLDN10 -0.00853 -0.34464 CXCL10 0.022926 2.03931 EGFR -0.00654 -0.17669 EGR1 -0.00858 2.18651 ESR1 0.007862 0.851213 ETV7 0.012316 1.46783 FAM19A5 -0.01097 0.413683 FOSB -0.01104 1.85886 FYB 0.014805 1.56179 GBP5 0.017955 1.39771 GRB14 0.013616 0.269629 IDO1 0.021933 0.725702 IFI44L 0.019022 1.17581 IKZF3 0.007305 -0.58991 ITGAL 0.017536 3.21615 KIF26A -0.01352 2.05036 KLHDC7B 0.013895 1.43954 LRP4 -0.01581 0.306454 MFAP5 -0.012 2.69918 MX1 0.02252 3.43549 NAT1 0.006442 -0.79732 NLRC5 0.010024 2.26863 OLFM4 -0.01163 0.636684 OR2I1 P 0.006922 -1.30235 PI15 -0.01139 0.335476 PRAME 0.017607 2.2499 PRICKLE1 -0.00884 1.77018 RAC2 0.014726 3.03644 RSAD2 0.008023 1.44894 SP140L 0.008397 0.550538 TSPAN7 -0.01474 1.65843 Table 42 - Forty gene signature Gene Names Weight Bias AC138128.1 -0.01357 1.4071 ADAMTS4 -0.00848 1.95693 ANXA1 -0.00815 2.00146 APOL3 0.015057 2.20356 CD109 -0.01279 0.947671 CD2 0.018896 4.09036 CD274 0.013223 1.37297 CDR1 -0.01485 4.79794 CLDN10 -0.00853 -0.34464 CXCL10 0.022931 2.03931 EGFR -0.00654 -0.17669 EGR1 -0.00858 2.18651 ESR1 0.007864 0.851213 ETV7 0.012319 1.46783 FAM19A5 -0.01097 0.413683 FOSB -0.01104 1.85886 FYB 0.014808 1.56179 GBP5 0.017959 1.39771 GRB14 0.013619 0.269629 IDO1 0.021938 0.725702 IFI44L 0.019026 1.17581 IKZF3 0.007306 -0.58991 ITGAL 0.01754 3.21615 KIF26A -0.01353 2.05036 KLHDC7B 0.013898 1.43954 LATS2 -0.00622 0.486251 LRP4 -0.01581 0.306454 MFAP5 -0.012 2.69918 MX1 0.022525 3.43549 NAT1 0.006444 -0.79732 NLRC5 0.010026 2.26863 OLFM4 -0.01163 0.636684 OR2I1 P 0.006924 -1.30235 PI15 -0.0114 0.335476 PRAME 0.017611 2.2499 PRICKLE1 -0.00884 1.77018 RAC2 0.014729 3.03644 RSAD2 0.008025 1.44894 SP140L 0.008399 0.550538 TSPAN7 -0.01475 1.65843 Table 43 - Forty one gene signature Gene Names Weight Bias AC138128.1 -0.01374 1.4071 ADAMTS4 -0.00859 1.95693 ANXA1 -0.00826 2.00146 APOL3 0.015253 2.20356 CD109 -0.01296 0.947671 CD2 0.019143 4.09036 CD274 0.013395 1.37297 CDR1 -0.01504 4.79794 CLDN10 -0.00864 -0.34464 CXCL10 0.02323 2.03931 CYP2B6 0.006181 0.921835 EGFR -0.00663 -0.17669 EGR1 -0.00869 2.18651 ESR1 0.007966 0.851213 ETV7 0.01248 1.46783 FAM19A5 -0.01112 0.413683 FOSB -0.01119 1.85886 FYB 0.015001 1.56179 GBP5 0.018194 1.39771 GRB14 0.013797 0.269629 IDO1 0.022224 0.725702 IFI44L 0.019274 1.17581 IKZF3 0.007402 -0.58991 ITGAL 0.017769 3.21615 KIF26A -0.0137 2.05036 KLHDC7B 0.014079 1.43954 LATS2 -0.0063 0.486251 LRP4 -0.01602 0.306454 MFAP5 -0.01215 2.69918 MX1 0.022819 3.43549 NAT1 0.006528 -0.79732 NLRC5 0.010157 2.26863 OLFM4 -0.01178 0.636684 OR2I1 P 0.007014 -1.30235 PI15 -0.01154 0.335476 PRAME 0.01784 2.2499 PRICKLE1 -0.00896 1.77018 RAC2 0.014921 3.03644 RSAD2 0.00813 1.44894 SP140L 0.008509 0.550538 TSPAN7 -0.01494 1.65843 Table 44 - Forty two gene signature Gene Names Weight Bias AC138128.1 -0.01365 1.4071 ADAMTS4 -0.00853 1.95693 ANXA1 -0.0082 2.00146 APOL3 0.015146 2.20356 CD109 -0.01287 0.947671 CD2 0.019008 4.09036 CD274 0.013301 1.37297 CDR1 -0.01494 4.79794 CLDN10 -0.00858 -0.34464 CXCL10 0.023067 2.03931 CYP2B6 0.006138 0.921835 EGFR -0.00658 -0.17669 EGR1 -0.00863 2.18651 ESR1 0.00791 0.851213 ETV7 0.012392 1.46783 FAM19A5 -0.01104 0.413683 FOSB -0.01111 1.85886 FYB 0.014895 1.56179 GBP5 0.018065 1.39771 GRB14 0.013699 0.269629 IDO1 0.022067 0.725702 IFI44L 0.019138 1.17581 IKZF3 0.00735 -0.58991 ITGAL 0.017644 3.21615 KIF26A -0.01361 2.05036 KLHDC7B 0.01398 1.43954 LATS2 -0.00626 0.486251 LRP4 -0.01591 0.306454 MFAP5 -0.01207 2.69918 MX1 0.022658 3.43549 NAT1 0.006482 -0.79732 NLRC5 0.010085 2.26863 OLFM4 -0.0117 0.636684 OR2I1 P 0.006965 -1.30235 PI15 -0.01146 0.335476 PRAME 0.017715 2.2499 PRICKLE1 -0.00889 1.77018 PTPRC 0.005152 -1.11824 RAC2 0.014816 3.03644 RSAD2 0.008072 1.44894 SP140L 0.008449 0.550538 TSPAN7 -0.01484 1.65843 Table 45 - Forty three gene signature Gene Names Weight Bias AC138128.1 -0.01364 1.4071 ADAMTS4 -0.00852 1.95693 ANXA1 -0.0082 2.00146 APOL3 0.015139 2.20356 CD109 -0.01286 0.947671 CD2 0.018999 4.09036 CD274 0.013295 1.37297 CDR1 -0.01493 4.79794 CLDN10 -0.00858 -0.34464 CXCL10 0.023056 2.03931 CYP2B6 0.006135 0.921835 EGFR -0.00658 -0.17669 EGR1 -0.00863 2.18651 ESR1 0.007907 0.851213 ETV7 0.012386 1.46783 FAM19A5 -0.01103 0.413683 FOSB -0.0111 1.85886 FYB 0.014889 1.56179 GBP5 0.018057 1.39771 GRB14 0.013693 0.269629 IDO1 0.022057 0.725702 IFI44L 0.01913 1.17581 IKZF3 0.007346 -0.58991 ITGAL 0.017636 3.21615 KIF26A -0.0136 2.05036 KLHDC7B 0.013974 1.43954 LATS2 -0.00625 0.486251 LRP4 -0.0159 0.306454 MFAP5 -0.01206 2.69918 MX1 0.022648 3.43549 NAT1 0.006479 -0.79732 NLRC5 0.010081 2.26863 OLFM4 -0.0117 0.636684 OR2I1 P 0.006962 -1.30235 PI15 -0.01146 0.335476 PPP1R1A -0.0041 1.76371 PRAME 0.017707 2.2499 PRICKLE1 -0.00889 1.77018 PTPRC 0.00515 -1.11824 RAC2 0.01481 3.03644 RSAD2 0.008069 1.44894 SP140L 0.008445 0.550538 TSPAN7 -0.01483 1.65843 - A variety of methods have been utilized in an attempt to identify biomarkers and diagnose disease. For protein-based markers, these include two-dimensional electrophoresis, mass spectrometry, and immunoassay methods. For nucleic acid markers, these include mRNA expression profiles, microRNA profiles, FISH, serial analysis of gene expression (SAGE), methylation profiles, and large-scale gene expression arrays.
- When a biomarker indicates or is a sign of an abnormal process, disease or other condition in an individual, that biomarker is generally described as being either over-expressed or under-expressed as compared to an expression level or value of the biomarker that indicates or is a sign of a normal process, an absence of a disease or other condition in an individual. "Up-regulation", "up-regulated", "over-expression", "over-expressed", and any variations thereof are used interchangeably to refer to a value or level of a biomarker in a biological sample that is greater than a value or level (or range of values or levels) of the biomarker that is typically detected in similar biological samples from healthy or normal individuals. The terms may also refer to a value or level of a biomarker in a biological sample that is greater than a value or level (or range of values or levels) of the biomarker that may be detected at a different stage of a particular disease.
- "Down-regulation", "down-regulated", "under-expression", "under-expressed", and any variations thereof are used interchangeably to refer to a value or level of a biomarker in a biological sample that is less than a value or level (or range of values or levels) of the biomarker that is typically detected in similar biological samples from healthy or normal individuals. The terms may also refer to a value or level of a biomarker in a biological sample that is less than a value or level (or range of values or levels) of the biomarker that may be detected at a different stage of a particular disease.
- Further, a biomarker that is either over-expressed or under-expressed can also be referred to as being "differentially expressed" or as having a "differential level" or "differential value" as compared to a "normal" expression level or value of the biomarker that indicates or is a sign of a normal process or an absence of a disease or other condition in an individual. Thus, "differential expression" of a biomarker can also be referred to as a variation from a "normal" expression level of the biomarker.
- The terms "differential biomarker expression" and "differential expression" are used interchangeably to refer to a biomarker whose expression is activated to a higher or lower level in a subject suffering from a specific disease, relative to its expression in a normal subject, or relative to its expression in a patient that responds differently to a particular therapy or has a different prognosis. The terms also include biomarkers whose expression is activated to a higher or lower level at different stages of the same disease. It is also understood that a differentially expressed biomarker may be either activated or inhibited at the nucleic acid level or protein level, or may be subject to alternative splicing to result in a different polypeptide product. Such differences may be evidenced by a variety of changes including mRNA levels, miRNA levels, antisense transcript levels, or protein surface expression, secretion or other partitioning of a polypeptide. Differential biomarker expression may include a comparison of expression between two or more genes or their gene products; or a comparison of the ratios of the expression between two or more genes or their gene products; or even a comparison of two differently processed products of the same gene, which differ between normal subjects and subjects suffering from a disease; or between various stages of the same disease. Differential expression includes both quantitative, as well as qualitative, differences in the temporal or cellular expression pattern in a biomarker among, for example, normal and diseased cells, or among cells which have undergone different disease events or disease stages.
- In certain embodiments, the expression profile obtained is a genomic or nucleic acid expression profile, where the amount or level of one or more nucleic acids in the sample is determined. In these embodiments, the sample that is assayed to generate the expression profile employed in the diagnostic or prognostic methods is one that is a nucleic acid sample. The nucleic acid sample includes a population of nucleic acids that includes the expression information of the phenotype determinative biomarkers of the cell or tissue being analyzed. The nucleic acid includes RNA nucleic acids, e.g., mRNA, cRNA, etc., so long as the sample retains the expression information of the host cell or tissue from which it is obtained. The sample may be prepared in a number of different ways, as is known in the art, e.g., by mRNA isolation from a cell, where the isolated mRNA is used as isolated, amplified, or employed to prepare cDNA, cRNA, etc., as is known in the field of differential gene expression. Accordingly, determining the level of mRNA in a sample includes preparing cDNA or cRNA from the mRNA and subsequently measuring the cDNA or cRNA. The sample is typically prepared from a cell or tissue harvested from a subject in need of treatment, e.g., via biopsy of tissue, using standard protocols, where cell types or tissues from which such nucleic acids may be generated include any tissue in which the expression pattern of the to be determined phenotype exists, including, but not limited to, disease cells or tissue, body fluids, etc.
- The expression profile may be generated from the initial nucleic acid sample using any convenient protocol. While a variety of different manners of generating expression profiles are known, such as those employed in the field of differential gene expression/biomarker analysis, one representative and convenient type of protocol for generating expression profiles is array-based gene expression profile generation protocols. Such applications are hybridization assays in which a nucleic acid that displays "probe" nucleic acids for each of the genes to be assayed/profiled in the profile to be generated is employed. In these assays, a sample of target nucleic acids is first prepared from the initial nucleic acid sample being assayed, where preparation may include labeling of the target nucleic acids with a label, e.g., a member of a signal producing system. Following target nucleic acid sample preparation, the sample is contacted with the array under hybridization conditions, whereby complexes are formed between target nucleic acids that are complementary to probe sequences attached to the array surface. The presence of hybridized complexes is then detected, either qualitatively or quantitatively. Specific hybridization technology which may be practiced to generate the expression profiles employed in the subject methods includes the technology described in
U.S. Pat. Nos. 5,143,854 ;5,288,644 ;5,324,633 ;5,432,049 ;5,470,710 ;5,492,806 ;5,503,980 ;5,510,270 ;5,525,464 ;5,547,839 ;5,580,732 ;5,661,028 ;5,800,992 ; as well asWO 95/21265 WO 96/31622 WO 97/10365 WO 97/27317 EP 373 203 EP 785 280 - In one embodiment, the relative expression levels of biomarkers in a cancer tissue are measured to form a gene expression profile. The gene expression profile of a set of biomarkers from a patient tissue sample is summarized in the form of a compound decision score and compared to a score threshold that is mathematically derived from a training set of patient data. The score threshold separates a patient group based on different characteristics such as, but not limited to, responsiveness/non-responsiveness to treatment. The patient training set data is preferably derived from cancer tissue samples having been characterized by prognosis, likelihood of recurrence, long term survival, clinical outcome, treatment response, diagnosis, cancer classification, or personalized genomics profile. Expression profiles, and corresponding decision scores from patient samples may be correlated with the characteristics of patient samples in the training set that are on the same side of the mathematically derived score decision threshold. The threshold of the linear classifier scalar output is optimized to maximize the sum of sensitivity and specificity under cross-validation as observed within the training dataset.
- The overall expression data for a given sample is normalized using methods known to those skilled in the art in order to correct for differing amounts of starting material, varying efficiencies of the extraction and amplification reactions, etc. Using a linear classifier on the normalized data to make a diagnostic or prognostic call (e.g. responsiveness or resistance to therapeutic agent) effectively means to split the data space, i.e. all possible combinations of expression values for all genes in the classifier, into two disjoint halves by means of a separating hyperplane. This split is empirically derived on a large set of training examples, for example from patients showing responsiveness or resistance to a therapeutic agent. Without loss of generality, one can assume a certain fixed set of values for all but one biomarker, which would automatically define a threshold value for this remaining biomarker where the decision would change from, for example, responsiveness or resistance to a therapeutic agent. Expression values above this dynamic threshold would then either indicate resistance (for a biomarker with a negative weight) or responsiveness (for a biomarker with a positive weight) to a therapeutic agent. The precise value of this threshold depends on the actual measured expression profile of all other biomarkers within the classifier, but the general indication of certain biomarkers remains fixed, i.e. high values or "relative over-expression" always contributes to either a responsiveness (genes with a positive weight) or resistance (genes with a negative weights). Therefore, in the context of the overall gene expression classifier, relative expression can indicate if either up- or down-regulation of a certain biomarker is indicative of responsiveness or resistance to a therapeutic agent.
- In one embodiment, the biomarker expression profile of a patient tissue sample is evaluated by a linear classifier. As used herein, a linear classifier refers to a weighted sum of the individual biomarker intensities into a compound decision score ("decision function"). The decision score is then compared to a pre-defined cut-off score threshold, corresponding to a certain set-point in terms of sensitivity and specificity which indicates if a sample is above the score threshold (decision function positive) or below (decision function negative).
- Effectively, this means that the data space, i.e. the set of all possible combinations of biomarker expression values, is split into two mutually exclusive halves corresponding to different clinical classifications or predictions, e.g. one corresponding to responsiveness to a therapeutic agent and the other to resistance. In the context of the overall classifier, relative over-expression of a certain biomarker can either increase the decision score (positive weight) or reduce it (negative weight) and thus contribute to an overall decision of, for example, responsiveness or resistance to a therapeutic agent.
- The term "area under the curve" or "AUC" refers to the area under the curve of a receiver operating characteristic (ROC) curve, both of which are well known in the art. AUC measures are useful for comparing the accuracy of a classifier across the complete data range. Classifiers with a greater AUC have a greater capacity to classify unknowns correctly between two groups of interest (e.g., ovarian cancer samples and normal or control samples). ROC curves are useful for plotting the performance of a particular feature (e.g., any of the biomarkers described herein and/or any item of additional biomedical information) in distinguishing between two populations (e.g., individuals responding and not responding to a therapeutic agent). Typically, the feature data across the entire population (e.g., the cases and controls) are sorted in ascending order based on the value of a single feature. Then, for each value for that feature, the true positive and false positive rates for the data are calculated. The true positive rate is determined by counting the number of cases above the value for that feature and then dividing by the total number of cases. The false positive rate is determined by counting the number of controls above the value for that feature and then dividing by the total number of controls. Although this definition refers to scenarios in which a feature is elevated in cases compared to controls, this definition also applies to scenarios in which a feature is lower in cases compared to the controls (in such a scenario, samples below the value for that feature would be counted). ROC curves can be generated for a single feature as well as for other single outputs, for example, a combination of two or more features can be mathematically combined (e.g., added, subtracted, multiplied, etc.) to provide a single sum value, and this single sum value can be plotted in a ROC curve. Additionally, any combination of multiple features, in which the combination derives a single output value, can be plotted in a ROC curve. These combinations of features may comprise a test. The ROC curve is the plot of the true positive rate (sensitivity) of a test against the false positive rate (1-specificity) of the test.
- The interpretation of this quantity, i.e. the cut-off threshold responsiveness or resistance to a therapeutic agent, is derived in the development phase ("training") from a set of patients with known outcome. The corresponding weights and the responsiveness/resistance cut-off threshold for the decision score are fixed a priori from training data by methods known to those skilled in the art. In a preferred embodiment of the present method, Partial Least Squares Discriminant Analysis (PLS-DA) is used for determining the weights. (L. Ståhle, S. Wold, J. Chemom. 1 (1987) 185-196; D. V. Nguyen, D.M. Rocke, Bioinformatics 18 (2002) 39-50). Other methods for performing the classification, known to those skilled in the art, may also be with the methods described herein when applied to the transcripts of a cancer classifier.
- Different methods can be used to convert quantitative data measured on these biomarkers into a prognosis or other predictive use. These methods include, but not limited to methods from the fields of pattern recognition (Duda et al. Pattern Classification, 2nd ed., John Wiley, New York 2001), machine learning (Schölkopf et al. Learning with Kernels, MIT Press, Cambridge 2002, Bishop, Neural Networks for Pattern Recognition, Clarendon Press, Oxford 1995), statistics (Hastie et al. The Elements of Statistical Learning, Springer, New York 2001), bioinformatics (Dudoit et al., 2002, J. Am. Statist. Assoc. 97:77-87, Tibshirani et al., 2002, Proc. Natl. Acad. Sci. USA 99:6567-6572) or chemometrics (Vandeginste, et al., Handbook of Chemometrics and Qualimetrics, Part B, Elsevier, Amsterdam 1998).
- In a training step, a set of patient samples for both responsiveness/resistance cases are measured and the prediction method is optimised using the inherent information from this training data to optimally predict the training set or a future sample set. In this training step, the used method is trained or parameterised to predict from a specific intensity pattern to a specific predictive call. Suitable transformation or pre-processing steps might be performed with the measured data before it is subjected to the prognostic method or algorithm.
- In a preferred embodiment of the invention, a weighted sum of the pre-processed intensity values for each transcript is formed and compared with a threshold value optimised on the training set (Duda et al. Pattern Classification, 2nd ed., John Wiley, New York 2001). The weights can be derived by a multitude of linear classification methods, including but not limited to Partial Least Squares (PLS, (Nguyen et al., 2002, Bioinformatics 18 (2002) 39-50)) or Support Vector Machines (SVM, (Schölkopf et al. Learning with Kernels, MIT Press, Cambridge 2002)).
- In another embodiment of the invention, the data is transformed non-linearly before applying a weighted sum as described above. This non-linear transformation might include increasing the dimensionality of the data. The non-linear transformation and weighted summation might also be performed implicitly, e.g. through the use of a kernel function. (Schölkopf et al. Learning with Kernels, MIT Press, Cambridge 2002).
- In another embodiment of the invention, a new data sample is compared with two or more class prototypes, being either real measured training samples or artificially created prototypes. This comparison is performed using suitable similarity measures, for example, but not limited to Euclidean distance (Duda et al. Pattern Classification, 2nd ed., John Wiley, New York 2001), correlation coefficient (Van't Veer, et al. 2002, Nature 415:530) etc. A new sample is then assigned to the prognostic group with the closest prototype or the highest number of prototypes in the vicinity.
- In another embodiment of the invention, decision trees (Hastie et al., The Elements of Statistical Learning, Springer, New York 2001) or random forests (Breiman, Random Forests, Machine Learning 45:5 2001) are used to make a prognostic call from the measured intensity data for the transcript set or their products.
- In another embodiment of the invention neural networks (Bishop, Neural Networks for Pattern Recognition, Clarendon Press, Oxford 1995) are used to make a prognostic call from the measured intensity data for the transcript set or their products.
- In another embodiment of the invention, discriminant analysis (Duda et al., Pattern Classification, 2nd ed., John Wiley, New York 2001), comprising but not limited to linear, diagonal linear, quadratic and logistic discriminant analysis, is used to make a prognostic call from the measured intensity data for the transcript set or their products.
- In another embodiment of the invention, Prediction Analysis for Microarrays (PAM, (Tibshirani et al., 2002, Proc. Natl. Acad. Sci. USA 99:6567-6572)) is used to make a prognostic call from the measured intensity data for the transcript set or their products.
- In another embodiment of the invention, Soft Independent Modelling of Class Analogy (SIMCA, (Wold, 1976, Pattern Recogn. 8:127-139)) is used to make a predictive call from the measured intensity data for the transcript set or their products.
- As described above, the methods described herein permit the classification of a patient as responsive or non-responsive to a therapeutic agent that targets tumors with increased immune signaling associated with abnormal DNA repair. In particular, the therapeutic agents may be immune checkpoint therapies, such as antagonists of an inhibitory immune checkpoint and/or agonists of a stimulatory immune checkpoint. In some embodiments, the inhibitory immune checkpoint is selected from A2AR, B7-H3 (CD276), B7-H4 (VTCN1), BTLA (CD272), CTLA-4 (CD152), IDO, KIR, LAG3, PD-1/PD-L1, TIM-3 and VISTA. In some embodiments, the inhibitory immune checkpoint is not PD-1/PD-L1. In some embodiments, the inhibitory immune checkpoint is IDO. In some embodiments, the antagonist of an inhibitory immune checkpoint is selected from an antibody and an inhibitory nucleic acid molecule as defined herein. In some embodiments, the antagonist of an inhibitory immune checkpoint is selected from MGA271 (targets B7-H3), ipilimumab (Yervoy - targets CTLA-4), indoximod (targets IDO pathway), NLG919 (targets IDO pathway), lirilumab (targets KIR), IMP321 (targets LAG3), BMS-986016 (targets LAG3), CT-011 (PD-1 blockade), nivolumab/BMS-936558 (PD-1 blockade), BMS-936559 (PDL1 blockade) and pembrolizumab (Keytruda - targets PD-1), optionally wherein the antagonist is not pembrolizumab. In some embodiments, the stimulatory immune checkpoint is selected from CD27, CD28, CD40, CD122, CD137, OX40, GITR and ICOS. In some embodiments, the agonist of a stimulatory immune checkpoint is selected from an antibody, a lipocalin and a cytokine, as defined herein. In some embodiments, the agonist of a stimulatory immune checkpoint is selected from CDX-1127 (agonist of CD27), NKTR-214 (agonist of CD122), BMS-663513 (agonist of CD137), TRX518 (agonist of GITR), CP-870893 (CD40 agonist), MEDI0562, MEDI6469 and MEDI6383 (OX40 agonists).
- In some embodiments, antagonists of an inhibitory immune checkpoint and/or agonists of a stimulatory immune checkpoint may be administered in combination with a "DNA-damage therapeutic agent". As used herein "DNA- damage therapeutic agent" includes agents known to damage DNA directly, agents that prevent DNA damage repair, agents that inhibit DNA damage signaling, agents that inhibit DNA damage induced cell cycle arrest, and agents that inhibit processes indirectly leading to DNA damage. Some current such therapeutics used to treat cancer include, but are not limited to, the following DNA-damage therapeutic agents.
- 1) DNA damaging agents:
- a. Alkylating agents (platinum containing agents such as cisplatin, carboplatin, and oxaliplatin; cyclophosphamide; busulphan).
- b. Topoisomerase I inhibitors (irinotecan; topotecan)
- c. Topisomerase II inhibitors (etoposide;anthracylcines such as doxorubicin and epirubicin)
- d. Ionising radiation
- 2) DNA repair targeted therapies
- a. Inhibitors of Non-homologous end-joining (DNA-PK inhibitors, Nu7441, NU7026)
- b. Inhibitors of homologous recombination
- c. Inhibitors of nucleotide excision repair
- d. Inhibitors of base excision repair (PARP inhibitors, AG014699, AZD2281, ABT-888, MK4827, BSI-201, INO-1001, TRC-102,
APEX 1 inhibitors,APEX 2 inhibitors, Ligase III inhibitors - e. Inhibitors of the Fanconi anemia pathway
- 3) Inhibitors of DNA damage signalling
- a. ATM inhibitors (CP466722, KU-55933)
- b.
CHK 1 inhibitors (XL-844,UCN-01, AZD7762, PF00477736) - c.
CHK 2 inhibitors (XL-844, AZD7762, PF00477736)
- 4) Inhibitors of DNA damage induced cell cycle arrest
- a. Wee1 kinase inhibitors
- b. CDC25a, b or c inhibitors
- 5) Inhibition of processes indirectly leading to DNA damage
- a. Histone deacetylase inhibitors
- b. Heat shock protein inhibitors (geldanamycin, AUY922),
- The predictive classifiers described herein are useful for determining responsiveness or resistance to a therapeutic agent for treating cancer. The biological pathway described herein is a feature of cancer itself, similar to grade and stage, and as such, is not limited to a single cancer disease type. Therefore, the collection of genes or gene products may be used to predict responsiveness of cancer therapeutics across different cancer types in different tissues. In one embodiment, this collection of genes or gene products is useful for evaluating both breast and ovarian cancer tumors.
- As used herein, cancer includes, but is not limited to, leukemia, brain cancer, prostate cancer, liver cancer, ovarian cancer, stomach cancer, colorectal cancer, throat cancer, breast cancer, skin cancer, melanoma, lung cancer, sarcoma, cervical cancer, testicular cancer, bladder cancer, endocrine cancer, endometrial cancer, esophageal cancer, glioma, lymphoma, neuroblastoma, osteosarcoma, pancreatic cancer, pituitary cancer, renal cancer, head and neck cancer and the like.
- In one embodiment, the methods described herein refer to cancers that are treated with antagonists of an inhibitory immune checkpoint and/or agonists of a stimulatory immune checkpoint, optionally in combination with DNA damaging agents, DNA repair target therapies, inhibitors of DNA damage signalling, inhibitors of DNA damage induced cell cycle arrest and inhibition of processes indirectly leading to DNA damage, (i.e. "DNA-damage therapeutic agent" as the term is used herein).
- "Biological sample", "sample", and "test sample" are used interchangeably herein to refer to any material, biological fluid, tissue, or cell obtained or otherwise derived from an individual. This includes blood (including whole blood, leukocytes, peripheral blood mononuclear cells, buffy coat, plasma, and serum), sputum, tears, mucus, nasal washes, nasal aspirate, breath, urine, semen, saliva, meningeal fluid, amniotic fluid, glandular fluid, lymph fluid, nipple aspirate, bronchial aspirate, synovial fluid, joint aspirate, ascites, cells, a cellular extract, and cerebrospinal fluid. This also includes experimentally separated fractions of all of the preceding. For example, a blood sample can be fractionated into serum or into fractions containing particular types of blood cells, such as red blood cells or white blood cells (leukocytes). If desired, a sample can be a combination of samples from an individual, such as a combination of a tissue and fluid sample. The term "biological sample" also includes materials containing homogenized solid material, such as from a stool sample, a tissue sample, or a tissue biopsy, for example. The term "biological sample" also includes materials derived from a tissue culture or a cell culture. Any suitable methods for obtaining a biological sample can be employed; exemplary methods include, e.g., phlebotomy, swab (e.g., buccal swab), and a fine needle aspirate biopsy procedure. Samples can also be collected, e.g., by micro dissection (e.g., laser capture micro dissection (LCM) or laser micro dissection (LMD)), bladder wash, smear (e.g., a PAP smear), or ductal lavage. A "biological sample" obtained or derived from an individual includes any such sample that has been processed in any suitable manner after being obtained from the individual.
- In such cases, the target cells may be tumor cells, for example colon cancer cells or stomach cancer cells. The target cells are derived from any tissue source, including human and animal tissue, such as, but not limited to, a newly obtained sample, a frozen sample, a biopsy sample, a sample of bodily fluid, a blood sample, preserved tissue such as a paraffin-embedded fixed tissue sample (i.e., a tissue block), or cell culture.
- Reagents, tools, and/or instructions for performing the methods described herein can be provided in a kit. For example, the kit can contain reagents, tools, and instructions for determining an appropriate therapy for a cancer patient. Such a kit can include reagents for collecting a tissue sample from a patient, such as by biopsy, and reagents for processing the tissue. The kit can also include one or more reagents for performing a biomarker expression analysis, such as reagents for performing RT-PCR, qPCR, northern blot, proteomic analysis, or immunohistochemistry to determine expression levels of biomarkers in a sample of a patient. For example, primers for performing RT-PCR, probes for performing northern blot analyses, and/or antibodies for performing proteomic analysis such as Western blot, immunohistochemistry and ELISA analyses can be included in such kits. Appropriate buffers for the assays can also be included. Detection reagents required for any of these assays can also be included. The appropriate reagents and methods are described in further detail below.
- The kits featured herein can also include an instruction sheet describing how to perform the assays for measuring biomarker expression. The instruction sheet can also include instructions for how to determine a reference cohort, including how to determine expression levels of biomarkers in the reference cohort and how to assemble the expression data to establish a reference for comparison to a test patient. The instruction sheet can also include instructions for assaying biomarker expression in a test patient and for comparing the expression level with the expression in the reference cohort to subsequently determine the appropriate chemotherapy for the test patient. Methods for determining the appropriate chemotherapy are described above and can be described in detail in the instruction sheet.
- Informational material included in the kits can be descriptive, instructional, marketing or other material that relates to the methods described herein and/or the use of the reagents for the methods described herein. For example, the informational material of the kit can contain contact information, e.g., a physical address, email address, website, or telephone number, where a user of the kit can obtain substantive information about performing a gene expression analysis and interpreting the results, particularly as they apply to a human's likelihood of having a positive response to a specific therapeutic agent.
- The kits featured herein can also contain software necessary to infer a patient's likelihood of having a positive response to a specific therapeutic agent from the biomarker expression.
- Measuring mRNA in a biological sample may be used as a surrogate for detection of the level of the corresponding protein in the biological sample. Thus, any of the biomarkers or biomarker panels described herein can also be detected by detecting the appropriate RNA. Methods of gene expression profiling include, but are not limited to, microarray, RT-PCT, qPCR, northern blots, SAGE, mass spectrometry.
- mRNA expression levels are measured by reverse transcription quantitative polymerase chain reaction (RT-PCR followed with qPCR). RT-PCR is used to create a cDNA from the mRNA. The cDNA may be used in a qPCR assay to produce fluorescence as the DNA amplification process progresses. By comparison to a standard curve, qPCR can produce an absolute measurement such as number of copies of mRNA per cell. Northern blots, microarrays, Invader assays, and RT-PCR combined with capillary electrophoresis have all been used to measure expression levels of mRNA in a sample. See Gene Expression Profiling: Methods and Protocols, Richard A. Shimkets, editor, Humana Press, 2004.
- miRNA molecules are small RNAs that are non-coding but may regulate gene expression. Any of the methods suited to the measurement of mRNA expression levels can also be used for the corresponding miRNA. Recently many laboratories have investigated the use of miRNAs as biomarkers for disease. Many diseases involve widespread transcriptional regulation, and it is not surprising that miRNAs might find a role as biomarkers. The connection between miRNA concentrations and disease is often even less clear than the connections between protein levels and disease, yet the value of miRNA biomarkers might be substantial. Of course, as with any RNA expressed differentially during disease, the problems facing the development of an in vitro diagnostic product will include the requirement that the miRNAs survive in the diseased cell and are easily extracted for analysis, or that the miRNAs are released into blood or other matrices where they must survive long enough to be measured. Protein biomarkers have similar requirements, although many potential protein biomarkers are secreted intentionally at the site of pathology and function, during disease, in a paracrine fashion. Many potential protein biomarkers are designed to function outside the cells within which those proteins are synthesized.
- Gene expression may also be evaluated using mass spectrometry methods. A variety of configurations of mass spectrometers can be used to detect biomarker values. Several types of mass spectrometers are available or can be produced with various configurations. In general, a mass spectrometer has the following major components: a sample inlet, an ion source, a mass analyzer, a detector, a vacuum system, and instrument-control system, and a data system. Difference in the sample inlet, ion source, and mass analyzer generally define the type of instrument and its capabilities. For example, an inlet can be a capillary-column liquid chromatography source or can be a direct probe or stage such as used in matrix-assisted laser desorption. Common ion sources are, for example, electrospray, including nanospray and microspray or matrix-assisted laser desorption. Common mass analyzers include a quadrupole mass filter, ion trap mass analyzer and time-of-flight mass analyzer. Additional mass spectrometry methods are well known in the art (see Burlingame et al., Anal. Chem. 70:647 R-716R (1998); Kinter and Sherman, New York (2000)).
- Protein biomarkers and biomarker values can be detected and measured by any of the following: electrospray ionization mass spectrometry (ESI-MS), ESI-MS/MS, ESI-MS/(MS)n, matrix-assisted laser desorption ionization time-of-flight mass spectrometry (MALDI-TOF-MS), surface-enhanced laser desorption/ionization time-of-flight mass spectrometry (SELDI-TOF-MS), desorption/ionization on silicon (DIOS), secondary ion mass spectrometry (SIMS), quadrupole time-of-flight (Q-TOF), tandem time-of-flight (TOF/TOF) technology, called ultraflex III TOF/TOF, atmospheric pressure chemical ionization mass spectrometry (APCI-MS), APCI-MS/MS, APCI-(MS).sup.N, atmospheric pressure photoionization mass spectrometry (APPI-MS), APPI-MS/MS, and APPI-(MS).sup.N, quadrupole mass spectrometry, Fourier transform mass spectrometry (FTMS), quantitative mass spectrometry, and ion trap mass spectrometry.
- Sample preparation strategies are used to label and enrich samples before mass spectroscopic characterization of protein biomarkers and determination biomarker values. Labeling methods include but are not limited to isobaric tag for relative and absolute quantitation (iTRAQ) and stable isotope labeling with amino acids in cell culture (SILAC). Capture reagents used to selectively enrich samples for candidate biomarker proteins prior to mass spectroscopic analysis include but are not limited to aptamers, antibodies, nucleic acid probes, chimeras, small molecules, an F(ab')2 fragment, a single chain antibody fragment, an Fv fragment, a single chain Fv fragment, a nucleic acid, a lectin, a ligand-binding receptor, affybodies, nanobodies, ankyrins, domain antibodies, alternative antibody scaffolds (e.g. diabodies etc) imprinted polymers, avimers, peptidomimetics, peptoids, peptide nucleic acids, threose nucleic acid, a hormone receptor, a cytokine receptor, and synthetic receptors, and modifications and fragments of these.
- The foregoing assays enable the detection of biomarker values that are useful in methods for predicting responsiveness of a cancer therapeutic agent, where the methods comprise detecting, in a biological sample from an individual, at least N biomarker values that each correspond to a biomarker selected from the group consisting of the biomarkers provided in Tables 1 or 2, wherein a classification, as described in detail below, using the biomarker values indicates whether the individual will be responsive to a therapeutic agent. While certain of the described predictive biomarkers are useful alone for predicting responsiveness to a therapeutic agent, methods are also described herein for the grouping of multiple subsets of the biomarkers that are each useful as a panel of two or more biomarkers. Thus, various embodiments of the instant application provide combinations comprising N biomarkers, wherein N is at least three biomarkers. It will be appreciated that N can be selected to be any number from any of the above-described ranges, as well as similar, but higher order, ranges. In accordance with any of the methods described herein, biomarker values can be detected and classified individually or they can be detected and classified collectively, as for example in a multiplex assay format.
- In one embodiment, the present invention makes use of "oligonucleotide arrays" (also called herein "microarrays"). Microarrays can be employed for analyzing the expression of biomarkers in a cell, and especially for measuring the expression of biomarkers of cancer tissues.
- In one embodiment, biomarker arrays are produced by hybridizing detectably labeled polynucleotides representing the mRNA transcripts present in a cell (e.g., fluorescently-labeled cDNA synthesized from total cell mRNA or labeled cRNA) to a microarray. A microarray is a surface with an ordered array of binding (e.g., hybridization) sites for products of many of the genes in the genome of a cell or organism, preferably most or almost all of the genes. Microarrays can be made in a number of ways known in the art. However produced, microarrays share certain characteristics. The arrays are reproducible, allowing multiple copies of a given array to be produced and easily compared with each other. Preferably the microarrays are small, usually smaller than 5 cm2, and they are made from materials that are stable under binding (e.g., nucleic acid hybridization) conditions. A given binding site or unique set of binding sites in the microarray will specifically bind the product of a single gene in the cell. In a specific embodiment, positionally addressable arrays containing affixed nucleic acids of known sequence at each location are used.
- It will be appreciated that when cDNA complementary to the RNA of a cell is made and hybridized to a microarray under suitable hybridization conditions, the level of hybridization to the site in the array corresponding to any particular gene will reflect the prevalence in the cell of mRNA transcribed from that gene/biomarker. For example, when detectably labeled (e.g., with a fluorophore) cDNA or cRNA complementary to the total cellular mRNA is hybridized to a microarray, the site on the array corresponding to a gene (i.e., capable of specifically binding the product of the gene) that is not transcribed in the cell will have little or no signal (e.g., fluorescent signal), and a gene for which the encoded mRNA is prevalent will have a relatively strong signal. Nucleic acid hybridization and wash conditions are chosen so that the probe "specifically binds" or "specifically hybridizes' to a specific array site, i.e., the probe hybridizes, duplexes or binds to a sequence array site with a complementary nucleic acid sequence but does not hybridize to a site with a non-complementary nucleic acid sequence. As used herein, one polynucleotide sequence is considered complementary to another when, if the shorter of the polynucleotides is less than or equal to 25 bases, there are no mismatches using standard base-pairing rules or, if the shorter of the polynucleotides is longer than 25 bases, there is no more than a 5% mismatch. Preferably, the polynucleotides are perfectly complementary (no mismatches). It can be demonstrated that specific hybridization conditions result in specific hybridization by carrying out a hybridization assay including negative controls using routine experimentation.
- Optimal hybridization conditions will depend on the length (e.g., oligomer vs. polynucleotide greater than 200 bases) and type (e.g., RNA, DNA, PNA) of labeled probe and immobilized polynucleotide or oligonucleotide. General parameters for specific (i.e., stringent) hybridization conditions for nucleic acids are described in Sambrook et al., supra, and in Ausubel et al., "Current Protocols in Molecular Biology", Greene Publishing and Wiley-interscience, NY (1987), which is incorporated in its entirety for all purposes. When the cDNA microarrays are used, typical hybridization conditions are hybridization in 5xSSC plus 0.2% SDS at 65C for 4 hours followed by washes at 25°C in low stringency wash buffer (1xSSC plus 0.2% SDS) followed by 10 minutes at 25°C in high stringency wash buffer (0.1SSC plus 0.2% SDS) (see Shena et al., Proc. Natl. Acad. Sci. USA, Vol. 93, p. 10614 (1996)). Useful hybridization conditions are also provided in, e.g., Tijessen, Hybridization With Nucleic Acid Probes", Elsevier Science Publishers B.V. (1993) and Kricka, "Nonisotopic DNA Probe Techniques", Academic Press, San Diego, Calif. (1992).
- Immunoassay methods are based on the reaction of an antibody to its corresponding target or analyte and can detect the analyte in a sample depending on the specific assay format. To improve specificity and sensitivity of an assay method based on immunoreactivity, monoclonal antibodies are often used because of their specific epitope recognition. Polyclonal antibodies have also been successfully used in various immunoassays because of their increased affinity for the target as compared to monoclonal antibodies Immunoassays have been designed for use with a wide range of biological sample matrices Immunoassay formats have been designed to provide qualitative, semi-quantitative, and quantitative results.
- Quantitative results may be generated through the use of a standard curve created with known concentrations of the specific analyte to be detected. The response or signal from an unknown sample is plotted onto the standard curve, and a quantity or value corresponding to the target in the unknown sample is established.
- Numerous immunoassay formats have been designed. ELISA or EIA can be quantitative for the detection of an analyte/biomarker. This method relies on attachment of a label to either the analyte or the antibody and the label component includes, either directly or indirectly, an enzyme. ELISA tests may be formatted for direct, indirect, competitive, or sandwich detection of the analyte. Other methods rely on labels such as, for example, radioisotopes (I125) or fluorescence. Additional techniques include, for example, agglutination, nephelometry, turbidimetry, Western blot, immunoprecipitation, immunocytochemistry, immunohistochemistry, flow cytometry, Luminex assay, and others (see ImmunoAssay: A Practical Guide, edited by Brian Law, published by Taylor & Francis, Ltd., 2005 edition).
- Exemplary assay formats include enzyme-linked immunosorbent assay (ELISA), radioimmunoassay, fluorescent, chemiluminescence, and fluorescence resonance energy transfer (FRET) or time resolved-FRET (TR-FRET) immunoassays. Examples of procedures for detecting biomarkers include biomarker immunoprecipitation followed by quantitative methods that allow size and peptide level discrimination, such as gel electrophoresis, capillary electrophoresis, planar electrochromatography, and the like.
- Methods of detecting and/or quantifying a detectable label or signal generating material depend on the nature of the label. The products of reactions catalyzed by appropriate enzymes (where the detectable label is an enzyme; see above) can be, without limitation, fluorescent, luminescent, or radioactive or they may absorb visible or ultraviolet light. Examples of detectors suitable for detecting such detectable labels include, without limitation, x-ray film, radioactivity counters, scintillation counters, spectrophotometers, colorimeters, fluorometers, luminometers, and densitometers.
- Any of the methods for detection can be performed in any format that allows for any suitable preparation, processing, and analysis of the reactions. This can be, for example, in multi-well assay plates (e.g., 96 wells or 384 wells) or using any suitable array or microarray. Stock solutions for various agents can be made manually or robotically, and all subsequent pipetting, diluting, mixing, distribution, washing, incubating, sample readout, data collection and analysis can be done robotically using commercially available analysis software, robotics, and detection instrumentation capable of detecting a detectable label.
- Gene expression may also be determined using sequencing methods, which include the various next generation sequencing technologies. In specific embodiments RNAseq may be utilized.
- In some embodiments, methods are provided for identifying and/or selecting a cancer patient who is responsive to a therapeutic regimen. In particular, the methods are directed to identifying or selecting a cancer patient who is responsive to a therapeutic regimen that includes administering immune checkpoint therapies, such as antagonists of an inhibitory immune checkpoint and/or agonists of a stimulatory immune checkpoint, optionally in combination with an agent that directly or indirectly damages DNA. Methods are also provided for identifying a patient who is non-responsive to a therapeutic regimen. These methods typically include determining the level of expression of a collection of predictive markers in a patient's tumor (primary, metastatic or other derivatives from the tumor such as, but not limited to, blood, or components in blood, urine, saliva and other bodily fluids)(e.g., a patient's cancer cells), comparing the level of expression to a reference expression level, and identifying whether expression in the sample includes a pattern or profile of expression of a selected predictive biomarker or biomarker set which corresponds to response or non-response to therapeutic agent.
- In some instances a method of predicting responsiveness of an individual to immune checkpoint therapies, such as antagonists of an inhibitory immune checkpoint and/or agonists of a stimulatory immune checkpoint, optionally in combination with a DNA-damage therapeutic agent, comprises the following steps: obtaining a test sample from the individual; measuring expression levels of one or more biomarkers in the test sample, wherein the one or more biomarkers are selected from the group consisting of CXCL10, MX1, IDO1, IF144L, CD2, GBP5, PRAME, ITGAL, LRP4, and APOL3; deriving a test score that captures the expression levels; providing a threshold score comprising information correlating the test score and responsiveness; and comparing the test score to the threshold score; wherein responsiveness is predicted when the test score exceeds the threshold score. One of ordinary skill in the art can determine an appropriate threshold score, and appropriate biomarker weightings, using the teachings provided herein including the teachings of Example 1.
- In other embodiments, the method of predicting responsiveness of an individual to antagonists of an inhibitory immune checkpoint and/or agonists of a stimulatory immune checkpoint, optionally in combination with a DNA-damage therapeutic agent comprises measuring the RNA expression levels of one or more biomarkers in the test sample, wherein the one or more biomarkers are selected from the group consisting of CXCL10, MX1, IDO1, IF144L, CD2, GBP5, PRAME, ITGAL, LRP4, APOL3, CDR1, FYB, TSPAN7, RAC2, KLHDC7B, GRB14, AC138128.1, KIF26A, CD274, CD109, ETV7, MFAP5, OLFM4, P115, FOSB, FAM19A5, NLRC5, PRICKLE1, EGR1, CLDN10, ADAMTS4, SP140L, ANXA1, RSAD2, ESR1, IKZF3, OR2I1P, EGFR, NAT1, LATS2, CYP2B6, PTPRC, PPP1R1A, and AL137218.1. The method may comprise deriving a test score that captures the RNA expression levels; providing a threshold score comprising information correlating the test score and responsiveness; and comparing the test score to the threshold score; wherein responsiveness is predicted when the test score exceeds the threshold score. Tables 2A and 2B provide exemplary gene signatures (or gene classifiers) wherein the biomarkers consist of 40 or 44 of the gene products listed therein, respectively, and wherein a threshold score is derived from the individual gene product weightings listed therein. In one of these embodiments wherein the biomarkers consist of the 44 gene products listed in Table 2B, and the biomarkers are associated with the weightings provided in Table 2B, a test score that exceeds a threshold score of 0.3681 indicates a likelihood that the individual will be responsive to immune checkpoint therapies, such as antagonists of an inhibitory immune checkpoint and/or agonists of a stimulatory immune checkpoint, optionally in combination with a DNA-damage therapeutic agent.
- A cancer is "responsive" to a therapeutic agent if its rate of growth is inhibited as a result of contact with the therapeutic agent, compared to its growth in the absence of contact with the therapeutic agent. Growth of a cancer can be measured in a variety of ways, for instance, the size of a tumor or the expression of tumor markers appropriate for that tumor type may be measured.
- A cancer is "non-responsive" to a therapeutic agent if its rate of growth is not inhibited, or inhibited to a very low degree, as a result of contact with the therapeutic agent when compared to its growth in the absence of contact with the therapeutic agent. As stated above, growth of a cancer can be measured in a variety of ways, for instance, the size of a tumor or the expression of tumor markers appropriate for that tumor type may be measured. The quality of being non-responsive to a therapeutic agent is a highly variable one, with different cancers exhibiting different levels of "non-responsiveness" to a given therapeutic agent, under different conditions. Still further, measures of non-responsiveness can be assessed using additional criteria beyond growth size of a tumor, including patient quality of life, degree of metastases, etc.
- An application of this test will predict end points including, but not limited to, overall survival, progression free survival, radiological response, as defined by RECIST, complete response, partial response, stable disease and serological markers such as, but not limited to, PSA, CEA, CA125, CA15-3 and CA19-9.
- Alternatively, non-array based methods for detection, quantification and qualification of RNA, DNA or protein within a sample of one or more nucleic acids or their biological derivatives such as encoded proteins may be employed, including quantitative PCR (QPCR), enzyme-linked immunosorbent assay (ELISA) or immunohistochemistry (IHC) and the like.
- After obtaining an expression profile from a sample being assayed, the expression profile is compared with a reference or control profile to make a diagnosis regarding the therapy responsive phenotype of the cell or tissue, and therefore host, from which the sample was obtained. The terms "reference" and "control" as used herein in relation to an expression profile mean a standardized pattern of gene or gene product expression or levels of expression of certain biomarkers to be used to interpret the expression classifier of a given patient and assign a prognostic or predictive class. The reference or control expression profile may be a profile that is obtained from a sample known to have the desired phenotype, e.g., responsive phenotype, and therefore may be a positive reference or control profile. In addition, the reference profile may be from a sample known to not have the desired phenotype, and therefore be a negative reference profile.
- If quantitative PCR is employed as the method of quantitating the levels of one or more nucleic acids, this method quantifies the PCR product accumulation through measurement of fluorescence released by a dual-labeled fluorogenic probe (i.e. TaqMan® probe).
- In certain embodiments, the obtained expression profile is compared to a single reference profile to obtain information regarding the phenotype of the sample being assayed. In yet other embodiments, the obtained expression profile is compared to two or more different reference profiles to obtain more in depth information regarding the phenotype of the assayed sample. For example, the obtained expression profile may be compared to a positive and negative reference profile to obtain confirmed information regarding whether the sample has the phenotype of interest.
- The comparison of the obtained expression profile and the one or more reference profiles may be performed using any convenient methodology, where a variety of methodologies are known to those of skill in the array art, e.g., by comparing digital images of the expression profiles, by comparing databases of expression data, etc. Patents describing ways of comparing expression profiles include, but are not limited to,
U.S. Pat. Nos. 6,308,170 and6,228,575 . - Methods of comparing expression profiles are also described above.
- The comparison step results in information regarding how similar or dissimilar the obtained expression profile is to the one or more reference profiles, which similarity information is employed to determine the phenotype of the sample being assayed. For example, similarity with a positive control indicates that the assayed sample has a responsive phenotype similar to the responsive reference sample. Likewise, similarity with a negative control indicates that the assayed sample has a non-responsive phenotype to the non-responsive reference sample.
- The level of expression of a biomarker can be further compared to different reference expression levels. For example, a reference expression level can be a predetermined standard reference level of expression in order to evaluate if expression of a biomarker or biomarker set is informative and make an assessment for determining whether the patient is responsive or non-responsive. Additionally, determining the level of expression of a biomarker can be compared to an internal reference marker level of expression which is measured at the same time as the biomarker in order to make an assessment for determining whether the patient is responsive or non-responsive. For example, expression of a distinct marker panel which is not comprised of biomarkers of the invention, but which is known to demonstrate a constant expression level can be assessed as an internal reference marker level, and the level of the biomarker expression is determined as compared to the reference. In an alternative example, expression of the selected biomarkers in a tissue sample which is a non-tumor sample can be assessed as an internal reference marker level. The level of expression of a biomarker may be determined as having increased expression in certain aspects. The level of expression of a biomarker may be determined as having decreased expression in other aspects. The level of expression may be determined as no informative change in expression as compared to a reference level. In still other aspects, the level of expression is determined against a pre-determined standard expression level as determined by the methods provided herein.
- The invention is also related to guiding conventional treatment of patients. Patients in which the diagnostics test reveals that they are responders to antagonists of an inhibitory immune checkpoint and/or agonists of a stimulatory immune checkpoint, optionally in combination with a DNA damage therapeutic agent, can be administered with that therapy and both patient and oncologist can be confident that the patient will benefit. Patients that are designated non-responders by the diagnostic test can be identified for alternative therapies which are more likely to offer benefit to them.
- The invention further relates to selecting patients for clinical trials with novel antagonists of an inhibitory immune checkpoint and/or agonists of a stimulatory immune checkpoint, optionally in combination with a DNA damage therapeutic agent. Enrichment of trial populations with potential responders will facilitate a more thorough evaluation of that drug under relevant criteria.
- Described herein are methods of diagnosing patients as having a cancer with increased innate immune response associated with a DNA damage response deficiency (DDRD). DDRD is defined herein as any condition wherein a cell or cells of the patient have a reduced ability to repair DNA damage, which reduced ability is a causative factor in the development or growth of a tumor. The DDRD diagnosis may be associated with a mutation in the Fanconi anemia/BRCA pathway. The DDRD diagnosis may also be associated with breast cancer or ovarian cancer. Described herein are methods of diagnosis comprising the steps of obtaining a test sample from the individual; measuring expression levels of one or more biomarkers in the test sample, wherein the one or more biomarkers are selected from Table 2B, 2A or 1A, including the group consisting of CXCL10, MX1, IDO1, IF144L, CD2, GBP5, PRAME, ITGAL, LRP4, and APOL3; deriving a test score that captures the expression levels; providing a threshold score comprising information correlating the test score and a diagnosis of the cancer; and comparing the test score to the threshold score; wherein the individual is determined to have the cancer when the test score exceeds the threshold score. One of ordinary skill in the art can determine an appropriate threshold score, and appropriate biomarker weightings, using the teachings provided herein including the teachings of Example 1.
- As described herein, the methods of diagnosing patients as having developing a cancer with increased innate immune response associated with DDRD comprise measuring RNA expression levels of one or more biomarkers in the test sample, wherein the one or more biomarkers are selected from the group consisting of CXCL10, MX1, IDO1, IF144L, CD2, GBP5, PRAME, ITGAL, LRP4, APOL3, CDR1, FYB, TSPAN7, RAC2, KLHDC7B, GRB14, AC138128.1, KIF26A, CD274, CD109, ETV7, MFAP5, OLFM4, P115, FOSB, FAM19A5, NLRC5, PRICKLE1, EGR1, CLDN10, ADAMTS4, SP140L, ANXA1, RSAD2, ESR1, IKZF3, OR2I1P, EGFR, NAT1, LATS2, CYP2B6, PTPRC, PPP1R1A, and AL137218.1. The method may comprise deriving a test score that captures the RNA expression levels; providing a threshold score comprising information correlating the test score and a diagnosis of the cancer; and comparing the test score to the threshold score; wherein the individual is determined to have the cancer when the test score exceeds the threshold score. Tables 2A and 2B provide exemplary gene signatures (or gene classifiers) wherein the biomarkers consist of 40 or 44 of the gene products listed therein, respectively, and wherein a threshold score is derived from the individual gene product weightings listed therein. In one of these instances wherein the biomarkers consist of the 44 gene products listed in Table 2B, and the biomarkers are associated with the weightings provided in Table 2B, a test score that exceeds a threshold score of 0.3681 indicates a diagnosis of cancer or of being susceptible to developing a cancer.
- The following examples are offered by way of illustration and not by way of limitation.
- The genes determined to be useful in the present methods (Table 2) were identified from gene expression analysis of a cohort of 107 macrodissected breast tumor FFPE tissue samples sourced from the Mayo Clinic Rochester. Ethical approval for this study was obtained from the Institutional Review Board and the Office of Research Ethics Northern Ireland.
- This cohort of samples can be further described as follows:
- ∘ 47 samples were wild-type for BRCA1 and BRCA2 i.e. expressed biologically functional BRCA1 and BRCA2 proteins. These samples shall henceforth be referred to as sporadic controls.
- ∘ 31 samples were BRCA1 mutant i.e. did not express biologically functional BRCA1 protein.
- ∘ 29 samples were BRCA2 mutant i.e. did not express biologically functional BRCA2 protein.
- Total RNA was extracted from the macrodissected FFPE tumor samples using the Roche High Pure RNA Paraffin Kit (Roche Diagnostics GmbH, Mannheim, Germany). Total RNA was amplified using the NuGEN WT-Ovation™ FFPE System (NuGEN Technologies Inc., San Carlos, CA, USA). The amplified single-stranded cDNA was then fragemented and biotin labeled using the FL-Ovation™ cDNA Biotin Module V2 (NuGEN Technologies Inc.). It was then hybridized to the Almac Breast Cancer DSA™. The Almac's Breast Cancer DSA™ research tool has been optimised for analysis of FFPE tissue samples, enabling the use of valuable archived tissue banks. The Almac Breast Cancer DSA™ research tool is an innovative microarray platform that represents the transcriptome in both normal and cancerous breast tissues. Consequently, the Breast Cancer DSA™ provides a comprehensive representation of the transcriptome within the breast disease and tissue setting, not available using generic microarray platforms. Arrays were scanned using the Affymentrix Genechip® Scanner 7G (Affymetrix Inc., Santa Clara, CA).
- Quality Control (QC) of profiled samples was carried out using MAS5 pre-processing algorithm. Different technical aspects were addressed: average noise and background homogeneity, percentage of present call (array quality), signal quality, RNA quality and hybridization quality. Distributions and Median Absolute Deviation of corresponding parameters were analyzed and used to identify possible outliers.
- Almac's Ovarian Cancer DSA™ contains probes that primarily target the area within 300 nucleotides from the 3' end of a polynucleotide. Therefore standard Affymetrix RNA quality measures were adapted - for housekeeping genes intensities of 3' end probesets along with ratios of 3' end probeset intensity to the average background intensity were used in addition to usual 3'/5' ratios. Hybridization controls were checked to ensure that their intensities and present calls conform to the requirements specified by Affymetrix.
- Tumor samples from the BRCA1/2 mutant and sporadic control training set were split into 2 datasets based on the transcript levels of ESR1 (Estrogen receptor 1). mRNA expression level E.avg for each sample was determined by the average expression of all ESR1 probe sets (BRAD.15436_s_at, BRAD.19080_s_at, BREM.1048_at, BRIH.10647C1n2_at, BRIH.5650C1n2_at, BRPD.10690C1n5_at, BRRS.81_at and BRRS.81-22_at). The mRNA median expression (E.med.all) was calculated for all samples. Samples were considered ER positive when E.avg - E.med.all> 0.5 and ER negative when E.avg - E.med.all < 0.5.
- Pre-processing was performed in expression console v1.1 with Robust Multi-array Analysis (RMA) (Irizarry et al., 2003) resulting in 2 data matrices of ER positive and ER negative samples composed of 56 and 51 samples respectively. An additional transformation was performed to remove the variance associated with array quality as described by Alter (Alter et al., 2000).
- A combined background & variance filter was applied to each data matrix to identify the most variable probesets. The background filter is based on the selection of probe sets with expression E and expression variance var E above the thresholds defined by background standard deviation σBg (from the Expression Console software) and quantile of the standard normal distribution zα at a specified significance a probesets were kept if:

- Hierarchical clustering techniques were applied to microarray data from 199 epithelial serous ovarian tumors analysed using the Ovarian Cancer DSA™ (disease specific array) platform (
FIG. 1 ). Raw expression data was preprocessed using the standard Robust Multichip Algorithm (RMA) procedure. Non-biological systematic variance in the data set was identified and removed. Those probesets whose expression levels varied significantly from tumor to tumor were identified. These probesets formed the intrinsic list. - 2-D cluster analysis (tumor, probeset) was performed to establish tumor relationships based on the intrinsic list. Hierarchical agglomerative clustering was applied (Pearson correlation distance and Ward's linkage). Optimal partition number was selected using the GAP index (Tibshirani et al., 2002, J. R. Stat. Soc., 63:411-423). All probesets available in the subclusters were mapped to genes names.
- To establish the functional significance of the probeset clusters, probesets were mapped to genes (Entrez gene ID) and an enrichment analysis, based on the hypergeometric function (False Discovery Rate applied (Benjamini and Hochberg, 1995, J. R. Stat. Soc. 57:289:300)), was performed.Over-representation of biological processes and pathways were analysed for each gene group generated by the hierarchical clustering for both ER-positive and ER-negative samples using Metacore™ single experiment analysis workflow from GeneGo®. Antisense probesets were excluded from the analysis. Hypergeometric p-values were assessed for each enriched functional entity class. Functional entity classes with the highest p-values were selected as representative of the group and a general functional category representing these functional entities was assigned to the gene clusters based on significance of representation (i.e. p-value).
- Genes in clusters enriched for the IFN/DD general functional terms were grouped into a DNA-damage response-deficiency (DDRD) sample group and used for the classifier generation. The sample clusters from ER-positive and ER-negative datasets represented by the IFN/DD general functional terms were selected for classification and labelled as DDRD. Those not represented by these functional terms were labelled as non-DDRD.
- Following the identification of a class of tumors that form the DDRD subgroup, computational classification of these tumors vs. all the others in the tumor cohort (non-DDRD) was performed, with reference to the functional DDRD gene list (Table 1), to identify a refined gene classification model that classifies the DDRD subgroup.This was evaluated using all combinations of the following options (a total of 18):
- Three sample sets
- ∘ Combined sample set of ER-negative and ER-positive samples (combined sample set)
- ∘ ER-negative samples alone
- ∘ ER-positive samples alone
- Two feature sets
- ∘ Full feature list with 75% variance/intensity filtering and forced inclusion of the DDRD list. Here 75% of the probesets with the lowest combined variance and intensity were removed, based on the average rank of both. When used, the term "Varlnt" refers to this option.
- ∘ DDRD list only. When used, the term "List only" refers to this option.
- Three classification algorithms
- ∘ PLS (Partial Least Squares) (de Jong, 1993)
- ∘ SDA (Shrinkage Discriminate Analysis)(Ahdesmaki and Strimmer, 2010)
- ∘ DSDA (Diagonal SDA)(Ahdesmaki and Strimmer, 2010)
- The AUC was used to assess the performance of the different models. Iterative Feature Elimination (IFE) was implemented throughout the development of each model, where the maximum AUC was the main criteria in selecting an optimal number of features over cross validation. In cases where there was no visible AUC difference across features, the minimum feature length was selected.
- To facilitate validation of the classifier across multiple array platforms, the selected probeset classifier was regenerated at the gene level. A redevelopment of the probeset classifier at a gene level required two separate steps:
- 1. The expression intensities of the unique genes in the probeset classifier were estimated from the median of the probesets mapping to each gene, excluding anti-sense probesets.
- 2. The classifier parameters used for classification were re-estimated
- Similarly the gene level defined expression intensities for the 10 top genes (or any number of features present in current 44 gene signature) could be used to re-develop the classifier based on only these 10 genes (or any number of features present in current 44 gene signature) by re-estimating classification parameters in cross-validation in the training data set as well as to re-establish the threshold by assessing and maximising the sensitivity and specificity obtained from all cross-validation predictions. The methodology would be similar to the method used when working from a larger feature set (described above) except there will be no feature selection involved: the features will remain the same but will be assigned new weights.
- The datasets used in for this analysis are namely: FAC1 [GEO accession number GSE20271, (Tabchy et al., 2010)], FAC2 [GEO accession number GSE22093, (Iwamoto et al., 2011)], FEC [GEO accession number GSE6861, (Bonnefoi et al., 2007)], T/FAC1 [http://bioinformatics.mdanderson.org/pubdata.html, (Hess et al., 2006)], T/FAC2 [GEO accession number GSE16716, (Lee et al., 2010)] and T/FAC3 [GEO accession number GSE20271, (Tabchy et al., 2010)]. It must be noted that there is an overlap in 31 samples between the FAC1 and FAC2 datasets. These samples were removed from the FAC2 dataset and as such were only included once in the combined analysis of the FAC1, FAC2 and FEC datasets. In addition, sample GSM508092 was removed from FAC1 as it is a metastatic lymph node sample.
- All datasets were pre-processed using RMA (Irizarry et al., 2003). For each validation set, the probesets that map to the classifier genes were determined, excluding anti-sense probesets (if applicable). Annotation for Affymetrix X3P and U133A arrays are available from the Affymetrix website. The median intensity over all probesets mapping to each gene in the classifier was calculated, resulting in a gene intensity matrix. The classifier was then applied to this data matrix to produce a classifier score/prediction for each sample.
- To calculate NPV and PPV, the prevalence of each end point (BRCA status/Response) was estimated using the proportions of each class in the corresponding data set.
- Univariate and multivariate analysis was carried out to assess respectively the association between the DDRD classifier and response, and to determine if the association, if any, was independent to known clinical predictors. The p-values presented Table 47, for univariate analysis were calculated using logistic regression in MATLAB. For the multivariate analysis we used step-wise logistic regression (Dupont, 2009), where the p-values represent the log-likelihood of the variable. The log-likelihood is a measure of the importance of the variable's fit to the model, thus highlighting it's independence as a predictor relative to the other predictors. In both univariate and multivariate analysis, a p-value < 0.05 was used as the criterion for significance. Furthermore, samples with unknown clinical factors were excluded in this assessment.
- The objective of this study was to characterize at a transcriptomic level a set of genes that would be capable of determining responsiveness or resistance of a pathogenic cell to DNA-damage therapeutic agents. With this in mind, those samples within the Almac breast cancer dataset that best represented this biology were to be selected and compared to the remaining samples for classifier generation (see next section). It was decided that the samples from sample cluster two within the ER-ve sample set were the most relevant samples for this selection as these showed the greatest proportion of BRCA mutant samples (64%) and they exhibited the most dominant biology (IFN/immune response). From within the ER+ve sample set, the samples from sample cluster two and three were selected as these sample clusters had 73% and 67% BRCA mutant tumors respectively. In addition, the most dominant biology within these clusters was related to cell cycle, DNA damage response and IFN/immune response. Immune signaling and cell-cycle pathways have been reported to be modulated in response to DNA-damage (Jackson, S. P., and Bartek, J., Nature 461, 1071-1078 (2009); Rodier, F., et al., ); Xu, Y.,Nat Rev Immunol6, 261-270 (2006), and these subgroups were combined to form a putative DDRD subgroup. Those samples within cluster two of the ER-ve sample set (described below) and clusters two and three of the ER+ve sample set (described below) were class labelled DDRD (DNA damage response deficient) (see
FIG. 1A ) whilst the samples within sample clusters one and three of the ER-ve sample set and sample clusters one, four, five and six of the ER+ve sample set were class labeled non-DDRD(seeFIG. 1B ). - ER-ve sample set: Within the ER-ve sample set, the hierarchical cluster analysis defined three sample clusters and six probeset cluster groups. Probeset cluster three was identified as the most significant biology within the ER-ve sample set and was enriched for interferon and immune response signaling.
- ER+ve sample set: Within the ER+ve sample set, the hierarchical analysis defined six sample groups and six probeset cluster groups. Probeset cluster five was identified as the most significant biology within the ER+ve sample set and was enriched for extracellular matrix remodeling. The next most significant probeset cluster within the ER+ve sample set is probeset cluster six and again was enriched for interferon and immune response signaling.
- Following the identification of a class of tumors, that form the DDRD subgroup, computational classification of these tumors vs. all others in the tumor cohort with reference to the functional DDRD (IFN/DNA damage) gene list was performed to identify a refined gene classification model, which classifies the DDRD subgroup.
- The classification pipeline was used to derive a model using the set of combined ER-ve and ER+ve breast cancer samples. The classification pipeline has been developed in accordance with commonly accepted good practice [MAQC Consortium, Nat Biotechnol 2010]. The process will, in parallel: 1) derive gene classification models from empirical data; and 2) assess the classification performance of the models, both under cross-validation. The performance and success of the classifier generation depends on a number of parameters that can be varied, for instance the choice of classification method or probe set filtering. Taking this into account, two feature sets were evaluated (i) the full feature list with 75% variance/intensity filtering (with forced inclusion of the DDRD (IFN/DNA damage) list, Table 1) and (ii) the DDRD (IFN/DNA damage) list only; and three classification algorithms were evaluated, namely PLS (Partial Least Squares); SDA (Shrinkage Discriminate Analysis) and DSDA (Diagonal SDA). Iterative Feature Elimination (IFE) was used throughout model development, which is an iterative procedure removing a fraction of the worst-ranked features at each iteration; stopping when only a minimum number of features remain. The Area under the Receiver Operating Characteristics Curve (AUC-ROC), denoted AUC, was used to assess the classification performance, as this measure is independent of cut-off between groups and prevalence rates in the data. It is also one of the recognized measurements of choice for classification performance. As such, the best number of features for each model was chosen based on the average AUC under cross-validation.
- A cross comparison of the models was made, by first selecting the best number of features for each model based on the highest average AUC, and then using box-plots to visualize the performance for each model. This is demonstrated in
FIG. 2 . From left to right, the first three plots represent the PLS, SDA and DSDA classifiers respectively that were developed using an initial filtering of probe sets to remove 75% with the lowest average variance and intensity (forcing the inclusion of the gene list). The next three plots respectively represent the PLS, SDA and DSDA classifiers developed using the DDRD (IFN/DNA damage) list only. - From
FIG. 2 , it is clear that the 'PLS Varlnt' classification model, comprising 53 probe sets, is the highest performing model, with a significantly higher AUC than the majority of the other 5 models. This model was then taken forward to the next phase for validation on independent external data sets, to assess the ability of the DDRD classification scores to stratify patients with respect to response and prognosis. - A non-orthodox approach to validating the classification model was taken, due to the fact that the validation data sets where either public or internal data with different array platforms. Commonly used approaches are not designed to be applicable to alternative array platforms, and as such a phased approach for classification model development and independent validation was followed:
- 1. Phase I - Model generation at the probe set level, selecting the best model under cross validation for classifying the DDRD subgroup (described previously)
- 2. Phase II - Transformation of the probe set level classification model to a gene level classification model
- 3. Phase III - Validation of re-developed gene classification model using external data sets
- Having selected a candidate model to progress to the validation stage, this model needed to be re-built at the gene level (Phase II). This involved mapping the probe sets in the classification model to the gene level and recalculating the weights for each gene. The 53 probe sets in the selected model mapped to 40 genes listed in Table 2A and subsequently mapped to 44 genes listed in Table 2B when the accuracy of the annotation pipeline was improved through further analysis.
- In the re-development of the gene classification model, to ensure that all information relating to the gene is used, the median intensity of all probe sets associated with each gene (Table 2C) is used as the gene expression value. This was calculated for all samples, resulting in a gene expression data matrix, as opposed to a probe set expression data matrix that was used in Phase I for model development and selection. To stabilize the intensities across different batches, the median of all probe sets for each sample was subtracted from the corresponding intensity of each gene for that sample.
- New weights were calculated for each gene using PLS regression, resulting in the final gene classifier models (40-gene and 44-gene classifier models) that may be used for validation on external data sets from different array platforms (Phase III).
- In Phase III, the validation of the classifier using data sets that may be from other array platforms, the following steps were taken:
- 1. The probe sets that map to the genes in the classifier are determined, excluding anti-sense probe sets (if applicable)
- 2. The median intensity over all probe sets relating to each gene in the classifier is calculated resulting in a reduced gene intensity matrix
- a. If no probe sets exist for the gene on the particular array platform, the observed average from the training data will be used as a replacement
- 3. The median value of all probe sets for each sample is calculated and subtracted from the reduced gene intensity matrix
- 4. The value for each gene is multiplied by the "weight" of that gene in the signature.
- 5. The values obtained in
point 4 for each of the genes in the signature are added together to produce a signature score for that sample. - 6. The classifier produces a score for each sample, which can then be used to stratify patients from say, more likely to respond to less likely to respond.
- The performance of the 44-gene DDRD classifier model was validated by the Area Under the ROC (Receiver Operator Characteristic) Curve (AUC) within the original Almac breast dataset and three independent datasets. The AUC is a statistic calculated on the observed disease scale and is a measure of the efficacy of prediction of a phenotype using a classifier model (Wray et. al., ). An AUC of 0.5 is typical of a random classifier, and an AUC of 1.0 would represent perfect separation of classes. Therefore, in order to determine if the 44-gene DDRD classifier model is capable of predicting response to, and selecting patients for, standard breast and ovarian cancer therapeutic drug classes, including DNA damage causing agents and DNA repair targeted therapies, the hypothesis is that the AUCs following application within these datasets should be above 0.5 with the lowest confidence interval also above 0.5.
- The classifier scores for predicting DDRD status were utilized to assess the ability of the model to separate BRCA mutant samples from sporadic samples. This analysis was performed to assess the relationships between the classifier model and BRCA mutation status. BRCA mutant tumors display a high degree of genomic instability due to a deficiency in DNA damage response by virtue of the loss of functional BRCA1/2. As such, the hypothesis is that the DDRD classifier models should be able to separate BRCA mutant samples from BRCA wildtype sporadic samples.
-
FIG. 3 shows that the 44-gene classifier models separate the BRCA mutants from the sporadic samples with an AUC of -0.68, where the lower confidence interval is ∼0.56 for both models (Table 46A); showing that the performance is significantly better than a random classifier. As such, this analysis confirms that the 44-gene DDRD classifier model is capable of identifying samples with high genomic instability due to an inability to repair DNA damage. - To assess the ability of the 44-gene DDRD classifier model to predict response to DNA-damaging chemotherapeutics, it was applied to data combined from three publicly available datasets. In each study, breast cancer patients were treated with neoadjuvant 5-fluorouracil, anthracycline, and cyclophosphamide-based regimens, drugs that directly damage DNA. The first (Tabchy et a/., 2010) and second (Iwamoto et al., 2011) datasets had response data for 87 and 50 ER-positive and ER-negative primary breast tumor samples respectively following neoadjuvant treatment with fluorouracil, doxorubicin and cyclophosphamide (FAC). The third dataset (Bonnefoi et al., )) had response data for 66 ER-negative primary breast tumor samples following neoadjuvant 5-fluorouracil, epirubicin and cyclophosphamide (FEC) treatment. Each study used pathological complete response (pCR) or residual disease (RD) as endpoints. As each dataset was relatively small, the data was combined to increase the power of the analysis.
- The analysis revealed that that the 44-gene DDRD classifier model was significantly associated with response to anthracycline-based chemotherapy (relative risk (RR) = 4.13, Cl = 1.94-9.87; AUC = 0.78, Cl = 0.70-0.85, P = 0.001; Table 46B,
FIG. 4 ). The negative predictive value (NPV) of the classifier was considerably higher than the positive predictive value (PPV) (0.90 versus 0.44, Table 46B), indicating that DDRD-negative tumors were unlikely to respond to DNA-damaging chemotherapy. - Stepwise logistic regression was used to determine the ability of the 44-gene DDRD classifier model to predict response in the combined datasets when adjusting for clinical variables (Table 47). The 44-gene DDRD classifier model was determined to be the most significant clinical variable in univariate analysis. Multivariate analysis confirmed that the 44-gene DDRD classifier model's predictive value was independent of stage, grade and notably ER status.
- Negativity for estrogen, progesterone and HER2 receptors has been suggested as a biomarker of abnormal DDR and thus response to DNA-damaging and DNA repair targeted therapies (Foulkes et al., 2010). However, this approach excludes the 20% of BRCA1 and the 40% of BRCA2 mutant tumors that are reported to be ER-positive (Foulkes et al., 2004; Tung et al., 2010). In contrast, by virtue of the analysis approach we adopted, the 44-gene DDRD classifier detects the DDRD subgroup in both ER-positive and ER-negative tumors, as validated by the multivariate analysis of the 44-gene DDRD classifier's predictive value within the combined analysis of FEC and FAC datasets, demonstrating its independence from ER status. Clinically, this is an important aspect of the translational application of the DDRD classifier as it suggests it can be applied to all breast cancer patients, irrespective of ER status, to determine their predicted responsiveness to DNA-damaging therapeutics.
- The ability of the 44-gene DDRD classifier model to predict response to chemotherapy regimens that contained non-DNA-damaging agents such as taxanes was assessed. Data was combined from 3 datasets with response data following neoadjuvant treatment with paclitaxel and FAC (T/FAC) for 321 primary breast cancer patients, where response was defined as pCR (Hess et al., 2006; Lee et al., 2010; Tabchy et al., 2010). Whilst the 44-gene DDRD classifier model was both associated with response (AUC = 0.61, Cl = ∼0.52-0.69, Table 46B,
FIG. 5 ), this performance was significantly reduced compared to that within the FAC/FEC only treated samples. In addition, multivariate analysis indicated the DDRD classifier was not independent from other clinical parameters (P = 0.21) in its ability to predict response to T/FAC (Table 47). This suggests that the subgroup detected by the DDRD classifier is more sensitive to DNA-damaging only regimens rather than regimens also containing anti-microtubule agents. - It was decided to explore the performance of the 44-gene DDRD classifier model in another disease area. As such, the performance of the classifier models was assessed within a set of 259 FFPE primary ovarian cancer samples with serous histology. These samples were from patients that received either adjuvant platinum treatment or adjuvant platinum and taxane treatment and were profiled on the Ovarian cancer DSA™. Response data was determined by RESIST and/or the serum marker CA125 levels. Applying the 44-gene DDRD classifier model to these samples proved to separate the responders from the non-responders significantly, with an AUC of ∼0.68 and a lower confidence limit of approx 0.59 (
FIG. 6 ). The 44-gene DDRD classifier model detects dysfunction of the Fanconi Anemia/BRCA pathway. - The Fanconi anemia/BRCA (FA/BRCA) pathway, which includes BRCA1 and BRCA2, plays an integral role in DNA repair and can be lost in breast cancer either due to mutation or epigenetic silencing (Kennedy and D'Andrea, 2006). It was therefore determined if the 44-gene DDRD classifier model could detect abrogation of members of this pathway in addition to BRCA1 and BRCA2. A public dataset was identified with microarray data generated from the bone marrow of 21 FA patients carrying a range of mutations in the FA/BRCA pathway and 11 healthy controls with a functional FA/BRCA pathway (Vanderwerf, S. M., et al., Blood 114, 5290-5298 (2009). The 44-gene DDRD classifier model significantly distinguished between the FA/BRCA mutant and normal samples with an AUC of 0.90 (Cl = 0.76-1.00, P<0.001,
FIG. 7 ), demonstrating a strong correlation between the DDRD classifier and dysfunction of the FA/BRCA pathway through multiple mechanisms. - The in silico validation of the 44-gene DDRD classifier model has shown the following:
- (a) The 44-gene DDRD classifier model is able to significantly separate BRCA mutant breast tumor samples from wildtype BRCA (sporadic) breast tumor samples. This implies that the DDRD classifier model is capable of detecting biology related to tumors with a high level of genomic instability, such as BRCA mutant tumors. These tumors typically respond better to DNA damaging chemotherapeutic regimens.
- (b) The 44-gene DDRD classifier model is able to significantly separate defined responders (those that demonstrated pCR) from the non-responders (those that did not demonstrate pCR) in a combination of three independent breast datasets following neoadjuvant treatment with FAC and FEC (Bonnefoi et al., 2007; Iwamoto et al., 2011; Tabchy et al., 2010) and T/FAC (Hess et al., 2006; Lee et al., 2010; Tabchy et al., 2010). The 44-gene DDRD classifier model was found to be independent of other clinical factors and the most significant independent predictor of response in the FAC/FEC combined analysis. These studies were carried out using fresh frozen (FF) samples and using two different microarray platforms, namely the Affymetrix X3P microarray and the Affymetrix U133A microarray. These results validate the performance of the 44-gene DDRD classifier model within independent breast datasets utilizing a different sample material (FF instead of FFPE) and utilizing microarray data from two different microarray platforms.
- (c) The 44-gene DDRD classifier model is able to significantly separate responders from non-responders within an independent Almac ovarian dataset following adjuvant treatment with platinum or platinum/taxane based therapy. This data was generated using FFPE samples profiled upon the Almac Ovarian DSA™.
- (d) The 44-gene DDRD classifier model is able to significantly distinguish between FA/BRCA mutant and normal samples using bone marrow tissue samples, demonstrating a strong correlation between the DDRD classifier and dysfunction of the FA/BRCA pathway through multiple mechanisms.
- In summary, the DDRD classifier model has been independently validated and demonstrated robustness in performance across three different disease areas (breast, ovarian and FA), demonstrated ability to separate responders from non-responders to four different chemotherapeutic regimens (FAC, FEC, T/FAC and platinum/taxane) in two different sample types (FFPE and FF) utilizing data from four different microarray platforms (Almac Breast DSA™ and Almac Ovarian DSA™, Affymetrix X3P microarray and Affymetrix U133A microarray). It has been demonstrated that the DDRD is an independent predictor of response to DNA-damage therapeutic agents and can predict mutations in the FA/BRCA pathways. This plasticity and repeatability of performance implies that the biology identified within the DDRD subgroup identified via the 44-gene classifier model is significantly and robustly related to predicting response to DNA damage causing agents and as such supports the claim of this invention which is to identify a subtype that can be used to predict response to, and select patients for, standard breast and ovarian cancer therapeutic drug classes, including drugs that damage DNA directly, damage DNA indirectly or inhibit normal DNA damage signaling and/or repair processes.
Table 46: Performance metrics and independence assessment of the 44-gene DDRD classifier model in breast datasets Numbers in brackets denote the 95% confidence limits from +/- 2SD from cross-validation (A) or bootstrapping with 1000 repeats (B). AUC=Area Under the Receiver Operating Characteristics Curve; ACC=Accuracy; SENS=Sensitivity; SPEC=Specificity; PPV=Positive Predictive value; NPV=Negative Predictive Value; RR=Relative Risk, pCR=pathological complete response, RD=residual disease. (A) Prediction of BRCA mutation status using the 44-gene DDRD classifier model Data set No. Treatment Clinical Outcom e AUC (Cl) ACC (Cl) SENS (Cl) SPEC (Cl) PPV (CI) NPV (Cl) RR (Cl) Training 107 N/A BRCA mutant V wildtype 0.68 (0.56-0.78 0.70 (0.57 - 0.76 0.58 (0.48-0.65 0.79 (0.64-0.86 0.78 (0.63-0.85 0.60 (0.49-0.65 1.93 (1.23-2.55 (B) Prediction of pCR using 44-gene DDRD classifier model Data set No. Treatment Clinical Outcome AUC (Cl) ACC (Cl) SENS (Cl) SPEC (Cl) PPV (Cl) NPV (Cl) RR (Cl) FAC1 FAC2 and FEC 203 FEC and FAC pCR V RD 0.78 (0.70-0.85) 0.76 (0.64-0.83) 0.82 (0.69-0.92) 0.58 (0.52-0.62) 0.44 (0.36-0.48) 0.90 (0.81-0.95) 4.13 (1.94-9.87) T/ FAC 321 T/FAC pCR V RD 0.61 (0.53-0.69) 0.53 (0.43-0.62) 0.49 (0.38-0.60) 0.67 (0.64-0.70) 0.29 (0.22-0.35) 0.83 (0.80-0.87) 1.72 (1.05-2.65 Table 47 Univariate and Multivariate Analysis of the 44-gene DDRD classifier model Comparison of the 44-gene DDRD classifier model to standard pathological parameters in independent validation sets. The predictive value of the DDRD classifier model as well as significant clinical parameters were evaluated in a univariate and multivariate analysis using logistic regression models with p-values coming from a log-likelihood test. Univariate and Multivariate Analysis of the 44-gene DDRD classifier model FAC1, FAC2 and FEC Univariate Multivariate Variable P value P value DDRD classifier 0.0000 0.0014 ER 0.0004 0.0249 Stage 0.0459 0.0492 Grade 0.0100 0.0468 T/FAC Univariate Multivariate Variable P value P value DDRD classifier 0.0129 0.2100 ER 0.0000 0.0000 Stage 0.3626 0.0359 Grade 0.0000 0.0115 - In order to assess the biology underlying the genes contained within the 44-gene classifier model, a number of studies were carried out in vitro using a panel of breast cell-lines.
- The HCC1937 parental, HCC1937-EV and HCC1937-BR cell-lines were kindly donated by Professor Paul Harkin from Queen's University College Belfast (QUB). The cell-lines were routinely maintained in RPMI-1640 medium supplemented with 50 U penicillin/ml, 50µg streptomycin/ml, 2mM glutamine, 1mM Sodium Pyruvate and 20% (v/v) fetal bovine serum (FBS). The HCC1937-EV and HCC937-BR cell-lines also required 0.2ml/mg geneticin. Cell-lines were cultured at 37°C with a humidified atmosphere of 5% CO2.
- For measurement of sensitivity to PARP-1 inhibitor (KU0058948), exponentially growing cells were seeded into 6-well plates. Twenty-four hours following seeding the cells were exposed to medium containing increasing doses of drug. Cell medium was replenished every 4-5 days. After 12-14 days the cells were fixed in methanol, stained with crystal violet and counted. The percentage survival of control for a given dose was calculated as the plating efficiencies for that dose divided by the plating efficiencies of vehicle-treated cells. Survival curves and half maximal inhibitory concentration (IC50) values were calculated using GraphPad Prism.
- For measurement of sensitivity to cisplatin, exponentially growing cells were seeded into 96-well plates. 24 hours following seeding the cells were exposed to medium containing increasing doses of cisplatin. Cells were incubated in the presence of drug for 96 hours following which time the viability of the cells was assessed using the Promega CellTitre-Glo luminescent cell viability assay. The sensitivity of the cells was calculated as the percentage of vehicle (DMSO) control. Survival curves and half maximal inhibitory concentration (IC50) values were calculated using GraphPad Prism.
- A preclinical model system was used to confirm that the 44-gene DDRD classifier was a measure of abnormal DDR. The HCC1937 breast cancer cell-line is DDRD due to a BRCA1 mutation (Tomlinson et al., 1998). The 44-gene classifier was applied to HCC1937 empty vector control cells (HCC1937-EV) and HCC1937 cells in which BRCA1 functionality was corrected (HCC1937-BR) (
FIG. 8A ). The DDRD 44-gene classifier score was found to be higher within HCC1937-EV relative to HCC1937-BR cells, with average scores of 0.5111 and 0.1516 respectively (FIG. 8B ). Consistent with the DDRD 44-gene classifier scores, the HCC1937 BRCA1 mutant cell-line was more sensitive to the PARP-1 inhibitor KU0058948 (FIG. 8C ) and cisplatin (FIG. 8D ) relative to the BRCA1 corrected cell-line. These preclinical data suggest that the DDRD 44-gene classifier measures immune signalling in DDRD-positive tumor cells and correlates with response to both a DNA-damaging agent (cisplatin) and a DNA repair targeted agent (PARP-1 inhibitor). - The Fanconi anemia/BRCA (FA/BRCA) pathway, which includes BRCA1 and BRCA2, plays an integral role in DNA repair and can be lost in breast cancer either due to mutation or epigenetic silencing (Kennedy, R. D., and D'Andrea, A. D., )). It was determined if the DDRD 44-gene classifier could detect abrogation of members of this pathway in addition to BRCA1 and BRCA2. A public dataset was identified with microarray data generated from the bone marrow of 21 FA patients carrying a range of mutations in the FA/BRCA pathway and 11 healthy controls with a functional FA/BRCA pathway (Vanderwerf et al., 2009). The DDRD 44-gene classifier significantly distinguished between the FA/BRCA mutant and normal samples with an AUC of 0.90 (CI = 0.76-1.00, P<0.001), demonstrating a strong correlation between the DDRD classifier and dysfunction of the FA/BRCA pathway through multiple mechanisms.
- The DDRD 44-gene classifier score was significantly higher in the BRCA1 mutant, and thus DDRD, HCC1937 breast cancer cell-line relative to an isogenic BRCA1 corrected cell-line. As the 44-gene classifier score correlates with DDR dysfunction within these cells, it demonstrates that the immune signalling detected by the DDRD classifier is intrinsic to the cell and not a function of lymphocytic infiltrate. BRCA1 and BRCA2 represent part of the FA/BRCA DDR network, which contains a number of other proteins that have been reported to be mutant or under-expressed in approximately 33% of breast cancer (Kennedy, R. D., and D'Andrea, A. D., ).As described previously, the DDRD 44-gene classifier significantly separated bone marrow samples from patients with FA mutations from normal controls. This suggests that the DDRD classifier is capable of detecting any abnormality within the pathway rather than specifically BRCA1 or BRCA2 dysfunction. It is possible that the DDRD 44-gene classifier may identify tumors with DDR-deficiency due to other mechanisms such as PTEN loss, cell-cycle checkpoint dysfunction or increased reactive oxygen species due to metabolic disturbance. Due to constitutive DNA-damage, these tumors are likely to respond to DNA repair targeted therapies such as PARP-1 or CHK1/2 inhibitors.
- All immunohistochemistry was using the Ventana Discovery®-XT Automated Stainer. Immunohistochemical application was performed on 4 µm sections taken from FFPE blocks. Sections for IHC were cut at 4 µm on a rotary microtome, dried at 37 °C overnight and then used for IHC assays. A Tissue MicroArray of a previously described cohort of 191 N0-N1 ER positive and ER negative FFPE breast tumour samples was scored in triplicate for immune expression analysis. CD4 (4B12, M7310, Dako) was diluted 1:50, and CD8 (C8/144B, M7103, Dako) was diluted 1:50 to enable visualisation of immune cell infiltrate. CD274 (PDL1) (Roche, SP142) was diluted 1:40 and an 8 minute amplification step using the OptiView Amplification Kit (Roche). A semi-quantitative scoring system was employed for CD4 and CD8 characterisation. Briefly, a score of 3 indicates strong CD4 or CD8 expression, 2 indicates moderate expression and 1 low or weak expression. If there was absence of CD4 or CD8 expression the
score 0 was applied. Scores were determined by two independent observers for both the stromal and intratumoral component of cores visualized on TMA. For CD274 (PDL1) previously published cut offs of >1% and >5% were used for scoring positive cores on TMA. CD274 (PDL1) staining was investigated in both the tumour and stroma of cores. - siRNA oligonucleotides (MWG Eurofins) were resuspended to a concentration of 100µM according to the manufacturer's instructions. The following sequences were used for siRNA:
STING_a 5' CAGCGGCUGUAUAUUCUCCUCCCUU 3' STING_b 5' GGUCAUAUUACAUCGGAUAUU 3' TBK1_a 5' GGAAAUAUCAUGCGUGUUAUU 3' TBK1_b 5' UGGUGCAGCUAGAGAAUUAUU 3' IRF3_a 5' CCUCUGAGAACCCACUGAAUU 3' IRF3_b 5' GGACAAUCCCACUCCCUUCUU 3' cGAS_a 5' AGAGAAAUGUUGCAGGAAAUU 3' cGAS_b 5' CAGCUUCUAAGAUGCUGUCAAAGUU 3' BRCA1_a 5' CCUAUCGGAAGAAGGCAAGUU 3' BRCA1_b 5' CAUACAGCUUCAUAAAUAAUU 3BRCA2_a 5' GGACACAAUUACAACUAAAUU 3' BRCA2_b 5' GGAGGAAUAUCGUAGGUAAUU 3' FancD2_a 5' GCAGAUUCAUGAAGAGAAAUU 3' FancD2_b 5' GGUUAAAGCACAUUGUAGAUU 3' - In a 6 well plate, 20 µl of 2 µM siRNA stock was resuspended in 500 µl 1:100 Optimem:Lipofectamine® RNAiMax (Life Technologies), incubated for 5 minutes at room temperature. This was then incubated for 20 minutes at room temperature, during which time cells were trypsinised and counted using a Countess Automated Cell Counter (Life Technologies). Cells were then resuspended in antibiotic free medium to a concentration determined to yield 50% confluency at 24 hours with 1.5ml of cell suspension added to each plate. Media was changed at 24 hours, and drug treatment added at this point if indicated. Cells were then incubated for a further 48 hours before harvesting RNA and protein.
- Reverse transcription was performed using the First Strand cDNA synthesis kit (Roche). 500 ng of RNA was reverse transcribed according to manufacturer's instructions. Exon-spanning qPCR primers were designed using Roche Universal Probe Library Assay Design Centre and were used at a concentration of 0.5 µM. The following primer sequences were used:
CXCL10 Forward 5' GGC CAT CAA GAA TTT ACT GAA AGC A 3' Reverse 5' TCT GTG TGG TCC ATC CTT GGA A 3' CCL5 Forward 5' TGC CCA CAT CAA GGA GTA TTT 3' Reverse 5' CTT TCG GGT GAC AAA GAC G 3' IDO1 Forward 5' CAT CTG CAA ATC GTG ACT AAG 3' Reverse 5' CAG TCG ACA CAT TAA CCT TCC TTC 3' PDL1 Forward 5' GGC ATC CAA GAT ACA AAC TCA AAG A 3' Reverse 5' AGT TCC AAT GCT GGA TTA CGT CT 3' PUM1 (Housekeeping gene) Forward 5' CCA GAA AGC TCT TGA GTT TAT TCC 3' Reverse 5' CAT CTA GTT CCC GAA CCA TCT C 3' - To preform absolute quantification from qPCR, we used a standard curve method. The efficiency of each primer set was derived from the standard curve using the following equation:

- The product of Reverse Transcription was diluted 1:10 in Nuclease Free Water (NFW). Each 10 µl PCR reaction, consisted of 0.5 µl of 10 µM Forward primer, 0.5µl of 10 µM Reverse primer, 5 µl of 2X LightCycler@ 480 SYBR Green I Master mix (Roche), 1.5 µl NFW and 2.5 µl diluted Reverse Transcription product. These 10 µl reactions were pipetted into wells of a LightCycler@ 480 multiwell 96 plate (Roche), the plate was then sealed using clear adhesive film (Roche). The plate was placed into the LightCycler@ 480 (Roche) and run with the following protocol. (95°C for 10 mins, 45 cycles of; 95°C for 15 secs, 55°C for 30 secs and 72°C for 30 secs, finishing with a melt curve for confirmation of primer specificity. All qPCR data was analysed using the LightCycler@ 480 software provided by Roche. For analysis, the Cp value from a technical duplicate was calculated and the relative amount of a gene was calculated Cp value to an in-run standard curve. Each mean value was then normalised to the mean concentration of the housekeeping gene PUM1 within the corresponding sample, by dividing the concentration of the target gene by the concentration of the house keeping gene. Relative expression refers to the gene expression levels that have been normalised to the housekeeping gene and made relative to the associated control samples. From these normalized values, the fold changes for each gene were calculated and the average of three individual fold changes were derived from three independent experimental triplicates. The unpaired, two-tailed students T-test available on GraphPad Prism 5.0 software was used to detect statistical significance.
- Adherent cells formed whole cell lysates suspended in RIPA buffer containing phosphatase and protease inhibitors (Roche Inhibitor cocktails, Germany). Lysates were then spun to eliminate cell debris. Protein was quantified using the BCA Assay (Pierce, Rockford, IL, USA) according to manufacturer's instructions using a plate reader. Equal amounts of protein per sample was prepared in mercaptoethanol protein loading buffer and separated by size using a gradient 4-12% Bolt® Tris-Bis plus polyacrylamide gel (Life Technologies, Thermo Fisher Scientific Inc.) or a gradient 3-8% NuPAGE® Novex® Tris-acetate gel (for BRCA1 only; Life Technologies, Thermo Fisher Scientific Inc.) and transferred to a PVDF 0.45 µm membrane (Immoblion-P, Millipore) by electroblotting. For investigation of PDL1 expression, the membranes were blocked in 3% BSA/TBST and probed overnight with ant-PDL1 antibody (catalogue no. #13684, Cell Signalling, Technology, MA, USA) diluted 1:500 in 3%BSA/TBST. For the investigation of BRCA1 (HPA034966, Sigma Aldrich), Lamin B1 (ab16048, Abcam), cGAS (HPA031700, Sigma Aldrich), Histone H3 (ab1791, Abcam), MHC class I/HLA A/HLA B (ab134189, Abcam), and HLA G (ab52455, Abcam), membranes were blocked in 3% non-fat milk/TBST and probed overnight with antibody diluted 1:1000 in 3% milk/TBST. For the investigation of IDO1 expression (catalogue no. #12006, Cell Signalling Technology), membranes were blocked in 5% BSA/TBST and probed overnight with antibody diluted 1:500 in 5% BSA/TBST. For loading controls, membranes were blocked in 3% Milk/TBST and probed with anti-β-actin (Sigma Aldrich) diluted 1:10,000 in 3% Milk/TBST or Vinculin (sc-73614, Santa Cruz) diluted 1:2000 in 3% Milk/TBST before the appropriate HRP-conjugated secondary was added. Results were then visualized and recorded using Luminata Crescendo Western HRP substrate (Millipore, UK) and an alpha imager.
- To test the invasive properties of cell secretions, conditioned media was collected from indicated cell lines with and without transfected knockdowns. Cells were seeded and/or treated on
day 0, media was changed to Optimem onday 1 and collected onday 3. Media was then centrifuged at 800 g for 5 minutes to remove cellular debris. Invasion assays were performed using Corning® Transwell® polycarbonate membrane 5µm 24 well cell culture inserts (Sigma, MO, USA). PBMCs were counted, and resuspended in Optimem 0.5% BSA at a density of 5 x 10⁶ cells/ml. 100 µl of cell suspension was placed in the top chamber of the transwell plate equating to 5 x 10⁵ cells. 600 µl of conditioned media was placed in the bottom chamber and the assay was incubated for 16 hours. After 16 hours, 100 µl of media from the bottom chamber was removed and a CellTiter-Glo® (Promega, PA, USA) assay was performed per manufacturer's instructions. Invaded cell numbers were derived from a standard curve generated with the CellTiter-Glo® assay and samples of cells counted with a countess (Life technologies, Paisley, UK). - The cytotoxic effects of lymphocytes on cancer cells was measured using LIVE/DEAD® Cell-Mediated Cytotoxicity Kit (Life technologies, Paisley, UK.) RKO parental and Fanc G cells were trypsinised, counted and stained with green-fluorescent membrane stain DiOC18 in PBS at a concentration of 2 µl of stain per ml. Cells were incubated with the stain for 20 minutes at 37 °C before being seeded into 12 well plates at a density of 1 x 10⁵ cells per well and left to adhere overnight. The next day PMBCs were counted and added to RKO cell cultures at the ratios indicated. For 1:1 ratio 1 x 10⁵ PBMCs were added, for 5:1 ratio 5 x 10⁵ PBMCs were added. The co-cultures were incubated for 4 hours before cells were collected for analysis by flow cytometry. A BD FACSCalibur™ (BD Biosciences, CA, USA) was used for the analysis of samples and Flow Jo software was used for data analysis. Cells were treated with interferon-γ at a concentration of 20 ng/ml for 16 hours. Cells were treated with LEAF purified anti-human CD274 (Clone 29E.2A3) antibody (BioLegend, CA, USA) at a concentration of 100 µg/ml for 16 hours prior to addition of PBMCs.
- For analysis of effects of ATM, ATR and DNAPK on cytokine expression, cells were seeded in six well plates at -60% confluency. Following incubation overnight, small molecule inhibitors of ATM (Ku60019, Selleck Chem) at a dose of 1 µm, ATR (ETP46464, Selleck Chem) at a dose of 5 µm and DNAPK (Nu7441, Selleck Chem) at a dose of 5 µm were added. At 24 hours, RNA and protein samples were obtained for analysis. For analysis of the effects of DNA damaging agents and paclitaxel on cytokine expression, cells were seeded in six well plates at -60% confluency. Following incubation overnight, IC50 doses of Cisplatin and Paclitaxel (obtained from fresh Pharmacy stock) and Hydroxyurea (Sigma Aldrich) were added for 24 hours to 48 hours. At the appropriate timepoint, RNA and protein samples were obtained for analysis.
- Cells were trypsinised and fixed in 70% ethanol, incubated with RNase A and propidium iodide (PI) and analysed using a BD FACSCalibur™ (BD Biosciences, CA, USA). Data was analysed using Flow Jo software to perform cell cycle analysis.
- Whole cell lysates were prepared and quantified as in the Western Blotting section. For immunoprecipitation, 500 µg of protein was rotated at 4 °C overnight with 2 µg of TBK1 (sc-52957, Santa Cruz Biotechnology) or IRF3 (Catalogue no. #4302, Cell Signalling Technology). Appropriate secondary anti-mouse or anti-rabbit Dynabeads® (Invitrogen) were pre-washed with RIPA buffer and equal amounts added to samples. Following rotation for 2 hours at 4 °C, samples were washed with RIPA, using the Dynamag Magnetic Rack. Samples were then boiled at 95 °C for 15 minutes in NuPAGE LDS sample buffer (Life Technologies) and NuPAGE Reducing Agent (Life Technologies). Equal amounts of reduced samples were separated by size using a gradient 4-12% Bolt® Tris-Bis plus polyacrylamide gel (Life Technologies, Thermo Fisher Scientific Inc). Western blotting procedure was followed as described previously. Membranes were blocked for 1 hour at room temperature in 5% BSA/TBST and probed with either pTBK1 (Ser172) (Catalogue no. #5483, Cell Signalling Technology) or plRF3 (Ser396) (Catalogue no. #4947, Cell Signalling Technology) overnight at 4 °C. Membranes were then probed with appropriate HRP-conjugated secondary (Anti-rabbit IgG, Catalogue no. #7074, Cell Signalling Technology for pTBK1; Anti-rabbit Light Chain Specific IgG, 211-032-171, Jackson ImmunoResearch Laboratories Inc. for pIRF3). Results were then visualized and recorded using Luminata Crescendo Western HRP substrate (Millipore, UK) and an alpha imager.
- Cells were fractionated using Buffer A (10mM Hepes pH7.4; 1.5 nM MgCl2, 10 mM NaCl, 0.1% NP-40, Protease and Phosphatase inhibitors) and Buffer C (10 mM Hepes pH7.4; 1.5 nM MgCI2, 420mM NaCl, 0.1% NP-40, Protease and Phosphatase inhibitors). Cells were cultured at ∼70% confluency. Cells were then removed in PBS using a cell scraper and transferred to an Eppendorf. Following centrifugation at 1000 rpm at 4 °C for 5 minutes, cell pellets were resuspended in 350 µl Buffer A. Cells were lysed on ice for twenty minutes, following which samples were centrifuged at 12000 rpm for 2 minutes. Supernatants were removed, and spun a further two times at 12000 rpm for 2 minutes. The supernatant (cytoplasmic fraction) was carefully removed and stored at -80 °C until quantification using the BCA Assay (Pierce, Rockford, IL, USA) according to manufacturer's instructions using a plate reader. The remaining pellet was washed x1 in Buffer A, then centrifuged at 12000 rpm for 2 minutes. The pellet was resuspended in Buffer C, lysed on ice for 10 minutes and sonicated at 20K cycles/second for 30 seconds. Samples were then centrifuged at 12000 rpm for two minutes to remove debris, and supernatant (nuclear fraction) stored at -80 °C until quantification as described above.
- Cytoplasmic fractions were prepared as described above. 500 µg of protein was rotated at 4 °C overnight with 2 µg of Histone H3 antibody (ab1791, Abcam) resuspended in Pierce IP Lysis Buffer (Thermo Scientific). Secondary anti-rabbit Dynabeads® (Invitrogen) were pre-washed with Pierce IP Lysis Buffer and equal amounts added to samples. Following rotation for 2 hours at 4 °C, samples were washed with Pierce IP Lysis Buffer, using the Dynamag Magnetic Rack. Samples were then boiled at 95 °C for 15 minutes in NuPAGE LDS sample buffer (Life Technologies) and NuPAGE Reducing Agent (Life Technologies). Equal amounts of reduced samples were separated by size using a gradient 4-12% Bolt® Tris-Bis plus polyacrylamide gel (Life Technologies, Thermo Fisher Scientific Inc). Western blotting procedure was followed as described previously. Membranes were blocked for 1 hour at room temperature in 5% BSA/TBST and probed with cGAS antibody (HPA031700, Sigma Aldrich) in 5% BSA/TBST at 4 °C overnight. Membranes were probed with HRP-conjugated secondary (Anti-rabbit IgG, Catalogue no. #7074, Cell Signalling Technology). Results were then visualized and recorded using Luminata Crescendo Western HRP substrate (Millipore, UK) and an alpha imager.
- As we had observed up-regulation of interferon-related genes including T-cell specific ligands in DDRD tumors , we asked if these were associated with a T cell immune response. The presence of intratumoral CD4+ and CD8+ T lymphocytes have previously been described as prognostic in breast cancer. The presence of intratumoral and stromal CD4+ and CD8+ T lymphocytes was assessed by IHC using a semi-quantitative score between 0-3 whereby a higher score represents a greater number of T lymphocytes present. A total cohort of 191 N0-N1 ER positive and ER negative breast scored as DDRD positive or negative using the DDRD assay. A significant association of both CD4+ and CD8+ intratumoral tumour infiltrating lymphocytes (iTILs) and stromal tumour infiltrating lymphocytes (sTILs) with DDRD positivity was identified (
Fig 9 ). This is demonstrated by the increased proportion of tumour sample cores with a greater IHC score within the DDRD positive CD8+ (DDRD pos CD8) and DDRD positive CD4+ (DDRD pos CD4) populations (p<0.0001) (Fig 9A ). The association between CD4+ and CD8+ T-lymphocytes and DDRD positivity was confirmed by the IHC images whereby an increased staining intensity is indicative of a greater presence of iTILs and sTILS within the tumours (Fig 9B ). - CXCL10 is the most discriminating gene in the DDRD assay, and has previously been reported as a prognostic factor in breast cancer1. CCL5 (RANTES) was identified as the top differentially expressed gene in DDRD positive ER negative tumours (Table 48). The majority of differentially expressed genes were identified as interferon responsive indicated by an area under curve (AUC) greater than 0.5. This is in keeping with a chemokine rich inflammatory tumour microenvironment (
Fig 10A ). Further interferome analysis of the differentially expressed genes showed that 53.1% of these genes were interferon driven with a predominant association with Type I interferons (Fig 10B ). The CXCL10/CXCR3 axis has been reported as key for the chemotaxis of CD4+ and CD8+ T lymphocytes to sites of inflammation2. CXCL10 and CCL5 overexpression are associated with the presence of CD8+ lymphocytes in melanoma, gastric and colorectal cancers3-5. We therefore sought to identify the mechanism of production of these key chemokines, CXCL10 and CCL5, in DNA damage repair deficient tumours.Table 48 - Differentially Expressed Genes in ER negative DDRD positive tumors (FC>3) Gene Symbol Gene ID Mean DDRD neg Mean DDRD pos p-value Fold-Change Fold-Change Description 1 IFI44L 10964 -0.41495 1.37672 6.11E-13 -3.46216 DDRD neg down vs DDRD pos 2 IDO1 3620 -0.260724 1.46939 2.18E-12 -3.31754 DDRD neg down vs DDRD pos 3 GBP5 115362 -0.313374 1.42788 2.96E-12 -3.34325 DDRD neg down vs DDRD pos 4 CCL5 6352 -0.460764 1.26706 1.71E-11 -3.31227 DDRD neg down vs DDRD pos 5 ART3 419 -0.40557 1.29577 4.67E-11 -3.25203 DDRD neg down vs DDRD pos 6 DDX60 55601 -0.199854 1.44622 5.19E-11 -3.12981 DDRD neg down vs DDRD pos 7 XAF1 54739 -0.274869 1.39532 5.75E-11 -3.18257 DDRD neg down vs DDRD pos 8 GBP5 115362 -0.33513 1.33699 1.03E-10 -3.18682 DDRD neg down vs DDRD pos 9 GBP5 115362 -0.358814 1.29533 2.59E-10 -3.14737 DDRD neg down vs DDRD pos 10 CD274 29126 -0.397379 1.26159 2.60E-10 -3.15791 DDRD neg down vs DDRD pos 11 GABBR1 /// UBD 2550 /// 10537 -0.372545 1.28096 2.88E-10 -3.14596 DDRD neg down vs DDRD pos 12 PSMB9 5698 -0.301324 1.33198 3.82E-10 -3.10222 DDRD neg down vs DDRD pos 13 TNFSF13B 10673 -0.260167 1.35947 4.29E-10 -3.07297 DDRD neg down vs DDRD pos 14 CCL5 6352 -0.507855 1.13341 5.06E-10 -3.11939 DDRD neg down vs DDRD pos 15 ISG15 9636 -0.30543 1.31872 5.71E-10 -3.0826 DDRD neg down vs DDRD pos 16 --- --- -0.343938 1.28446 6.48E-10 -3.0917 DDRD neg down vs DDRD pos 17 STAT1 6772 -0.388005 1.24196 7.59E-10 -3.09505 DDRD neg down vs DDRD pos 18 --- --- -0.222883 1.36652 9.16E-10 -3.00925 DDRD neg down vs DDRD pos 19 IFI44L 10964 -0.472957 1.14736 1.16E-09 -3.07443 DDRD neg down vs DDRD pos 20 STAT1 6772 -0.331983 1.27178 1.51E-09 -3.03936 DDRD neg down vs DDRD pos 21 PSMB9 5698 -0.312228 1.28678 1.57E-09 -3.02935 DDRD neg down vs DDRD pos 22 STAT1 6772 -0.397685 1.20857 1.83E-09 -3.04461 DDRD neg down vs DDRD pos 23 CD3G 917 -0.543926 1.05165 2.03E-09 -3.02216 DDRD neg down vs DDRD pos 24 STAT1 6772 -0.495509 1.10127 2.44E-09 -3.02466 DDRD neg down vs DDRD pos 25 GBP4 115361 -0.414399 1.18384 2.50E-09 -3.02774 DDRD neg down vs DDRD pos 26 SAMD9L 219285 -0.339994 1.25098 2.51E-09 -3.01252 DDRD neg down vs DDRD pos 27 EPSTI1 94240 -0.356971 1.23204 2.91E-09 -3.00843 DDRD neg down vs DDRD pos 28 PARP14 54625 -0.373931 1.21386 3.24E-09 -3.00589 DDRD neg down vs DDRD pos 29 OAS2 4939 -0.394501 1.1948 3.26E-09 -3.00904 DDRD neg down vs DDRD pos - We next asked if a loss in DNA damage response may result in the observed DDRD assay immune response. We inhibited BRCA1, BRCA2 and FANCD2 function using siRNA knockdown constructs in T47D cells to address the role of intrinsic DNA damage repair deficiency and therein DDRD biology in the chemokine production. CXCL10 and CCL5 were identified as significantly upregulated in response to loss of DNA repair proteins. The increased relative expression of CXCL10 and CCL5 upon inhibiting BRCA1 (using BRCA1_a/b siRNAs), BRCA2 (using BRCA2_c/d siRNAs) and FANCC (FancC_1/2 siRNAs) compared to the control scrambled sequence siRNA (AS) in T47D cells confirmed that DNA damage induced the expression of chemokines (
Fig 11 ). Using isogenic cell lines, HCC1937 EV (DDRD Pos) and HCC1937 + BRCA1 (DDRD Neg); and MDA-436 EV (DDRD Pos) and MDA-436 + BRCA1 (DDRD Neg), we again observed significant upregulation of CXCL10 and CCL5 in the DNA damage repair deficient cells compared to their repair-corrected line. ThereforeFigure 12A displays that upon correction of the DNA repair defect through the re-expression of BRCA1, the relative expression of both CXCL10 and CCL5 was significantly reduced (Fig 12A ). Western blotting confirms the protein expression of BRCA1 in both the corrected cell line models compared to the empty vector (EV) paired equivalent (Fig 12B ). To address if the upregulation of CXCL10 and CCL5 contributed to lymphocytic infiltration, we used a migration assay of activated peripheral blood mononuclear cells (PBMCs) with conditioned media from MDA436-EV and + BRCA1 cells (Fig 13A & B ). After co-culture for four hours, we observed a significant increase in the migration of PBMCs to conditioned media from the DNA damage repair deficient line. The MDA436-EV which are DDRD positive (DDRD +ve) displayed a greater fold change in cell invasion compared to the corrected cell line pair expressing BRCA1 which are DDRD negative (DDRD -ve) (Fig 13C ) (p<0.001). Therefore endogenous DNA damage repair deficiency causes chemokine production and the subsequent immune cell infiltration. The MDA436-EV which are DDRD positive (DDRD +ve) displayed a greater fold change in cell invasion compared to the corrected cell line pair expressing BRCA1 which are DDRD negative (DDRD -ve) (Fig 13D ) (p<0.001). Additionally, siRNA mediated knockdown of CXCL10 and CCL5 reduced PBMC migration, indicating their importance for lymphocytic infiltration (p<0.05;Fig 13E ). - HeLa, HCC1937 EV and MDA-MB-436 EV cells were treated with IC-50 doses of DNA damaging agents Cisplatin and Hydroxyurea, and the microtubule-stabilising agent Paclitaxel. As demonstrated by the increased relative expression compared to DMSO control, upregulation of CXCL10 and CCL5 expression was stimulated in all cell lines following treatment with cisplatin and hydroxyurea. However, CXCL10 and CCL5 expression was not significantly increased with Paclitaxel treatment in either cell line model (
Fig 14 ). Treatment with cisplatin and hydroxyurea resulted in an increased proportion of cells in S phase (Fig 14 ). However, treatment with a further anti-mitotic agent, Nocodazole caused an arrest in the M phase of cell cycle as observed by the reduced mRNA expression of CXCL10 (Fig 15A ). The block in M phase was confirmed by the changes in the cell cycle profile shown inFigure 15 (Fig 15B ). Together these data support an S-phase specific signal for activation of the immune response to DNA damage. - The kinases Ataxia Telangiectasia Mutated (ATM), ATM-and RAD3 related (ATR), and DNA-dependent protein kinase catalytic subunit (DNA-PKcs) are activated in response to DNA damage. Activation of ATM has previously been reported to result in the upregulation of immune genes suggesting that ATM may be required for chemokine production in response to DNA damage repair deficiency6. We treated DDRD positive cells (MDA-MB-436 EV) with small molecule inhibitors of ATM (Ku60019), ATR (ETP-46464) and DNAPK (Nu7440). No significant decreases in CXCL10 and CCL5 chemokine production were identified upon treatment with ATM inhibitors (ATMi), ATR inhibitors (ATRi) or DNAPK inhibitors (DNAPKi) compared to the DMSO control (
Fig 16 ). However, inhibition of DNAPK (DNAPKi) significantly increased CXCL10 and CCL5 chemokine expression levels compared to the DMSO control (Fig 16 ). Together these data indicate that these DNA damage response kinases are not required for the interferon response to endogenous DNA damage repair deficiency. - Next we performed a transcription factor analysis to identify those that could activate genes upregulated in DDRD tumours. IRFs (Interferon Regulatory Factors) gene targets were significantly enriched within this list. In addition, stimulation of the innate immune pathway STING/TBK1/IRF3 (
Fig 17A ) has been reported as a driver of CXCL10 expression7. IRF3 is recognised to be active in response to DNA damaging agents8, therefore we hypothesised that IRF3 would be active in DDRD positive cells. Supporting this we observed enhanced phosphorylation of IRF3 (pIRF3) from whole cell lysates of BRCA1-deficenct cells MDA-436 EV and HCC1937 EV compared to their BRCA1 corrected isogenic line (MDA-436 +BRCA1 and HCC1937 +BRCA1) (Fig 17B ). Similarly, TBK1 was constructively phosphorylation was observed in the repair deficient cells (EV) compared to the repair corrected DDRD negative cell lines (BRCA1) (Fig 17B ). Using siRNA mediated knockdown, we inhibited the function of STING (Sting_a/b), TBK1 (TBK1_a/b) and IRF3 (IRF3_a/b) in both MDA-436 and HCC1937 cells. When compared to the control (AS), the knockdown of STING, TBK1 and IRF3 significantly reduced the relative expression of both CXCL10 and CCL5 (Fig 17C ). - These data demonstrates the requirement of STING, TBK1 and IRF3 for the immune response to DNA damage response deficiency.
- The cytosolic DNA sensor cGAS has been described as the most potent activator of the STING pathway. We therefore asked if it cytosolic DNA was associated with observed immune response to S phase specific DNA damage9. Using co-immunoprecipitation (co-IP), we identified cGAS as bound to Histone H3 in the cytosolic fraction of DDRD positive cells MDA-436 EV and HCC1937 (
Fig 18A , top panel of blots). Binding of double stranded DNA to cGAS results in activation of STING via cGAMP, and immune gene expression. Additionally, in HeLa cells treated with Cisplatin (Cisp) or Hydroxyurea (HU), co-IP showed that cGAS was again bound to Histone H3. The binding of cGAS to Histone H3 was not observed in the DMSO treated control (Fig 18B , top panel of blots). Abrogation of cGAS function using siRNA mediated knockdown constructs (cGAS_a/b) in both MDA-436 and HCC1937 cells, resulted in significant reduction in both CXCL10 and CCL5 chemokine relative expression levels in the context of endogenous DDRD, and in response to DNA damaging agents (Fig 18C ). Therefore, cGAS is required for expression of chemokines from the tumour cell in response to DNA damage. - We probed cytosolic fractions of DDRD positive cells MDA-436-EV and +BRCA1, and HCC1937-EV and +BRCA1 cells for the presence of Histone H3, and found Histone H3 protein expression was increased in the repair deficient lines (EV) (
Fig 19A , top panel of blots). We also confirmed increased Histone H3 protein levels in response to DNA damage in HeLa cells treated with Cisplatin (Cisp) and Hydroxyurea (HU) compared to DMSO control treatment (Fig 19B , top panel of blots). PicoGreen fluorescent staining was used to detect double-stranded DNA (ds-DNA). HeLa cells treated with IC50 doses of DNA damaging agents Cisplatin (HeLa + Cisplatin IC50) and Hydroxyurea (HeLa + Hydroxyurea IC50) revealed increased cytosolic DNA when examined by confocal microscopy. This increase in cytosolic DNA was however not observed in response to treatment with Paclitaxel (HeLa + Paclitaxel IC50) (Fig 19C ). - The apparent paradox of upregulation of chemoattractants and subsequent lymphocytic infiltration in DDRD positive tumours is potentially explained by the upregulation of the immune checkpoint target PDL1. This target is known to cause lymphocyte exhaustion and effectively switches off the immune cytotoxic response to the cancer cells. Using the Roche SP142 antibody to PDL1 we performed IHC analysis on the original cohort of breast tumours previously scored for CD4+ and CD8+ T lymphocytic infiltration. Previously reported cut-offs of >1% and >5% were used to define PDL1 positivity, for both infiltrating tumour immune cell and tumour cell PDL1 expression10 (
Fig 20 ). Significant association of PDL1 expression at both the predefined cut offs was identified within DDRD positive tumours displayed by the 46.2% and 21.5% positivity for tumour populations positive for both DDRD (DDRD pos) and PDL1 (PDL1 pos) at >1% and >5% respectively (p<0.0001, p=0.0004) (Fig 20A , tumour). In addition, infiltrating immune cell PDL1 positivity was also associated with DDRD positivity as demonstrated by the 75.4% and 40% positivity for lymphocytes at both >1% and >5% respectively (p<0.0001) (Fig 20A , lymphocytes). Immunohistochemistry staining confirms strong PDL1 expression within the tumour, with additional PDL1 expression with lymphocytic infiltration as depicted by the staining patterns and intensities (Fig 20B ). In sum, both tumour cell PDL1 positivity and infiltrating immune cell PDL1 expression were significantly associated with DDRD positivity (Fig 20 ). - Additionally, the tumours were analysed based on their DDRD scores which assigns each tumour sample to a DDRD positive or DDRD negative subgroup based on the cut-off values within the defined gene signature. The DDRD scores of the PDL1 positive cohort (PDL1 pos) based on the aggregate tumour and lymphocyte staining using the predefined >1% and >5% cut offs demonstrated significantly higher DDRD scores than PDL1 negative cohort (PDL1 neg) (p<0.001) (
Fig 21 ). This data suggests that PDL1 protein expression is associated with a positive DDRD assay result and likewise PDL1 positive tumours have active DDRD signalling. - MDA-436 EV and MDA-436 + BRCA1 cells (repair corrected) were co-cultured with activated PBMCs. Within the co-culture, PDL1 relative expression levels were significantly upregulated in both repair deficient cells (436 EV + Act) (p=0.0001) and BRCA1 repair corrected MDA-436 cells (436 BRCA1 + Act) (p=0.0359). Moreover, the increased levels of PDL1 expression was more enhanced in DDRD positive cell models in co-culture (436 EV + Act) compared to the DDRD negative cells (436 BRCA1 + Act) (p=0.0033) (
Fig 22 ). Therefore, PDL1 expression is increased by co-culture with lymphocytes, specifically in DDRD positive models. - Treatment of HHC1937 EV, MDA-MB436 EV and HeLa cells treated with the DNA damaging Cisplatin (Cisp) or Hydroxyurea (HU) but not Paclitaxel induce expression of CD274 (PDL1) through Q-PCR analysis (
Fig 23A ). This effect was confirmed at the protein level through western blot analysis (Fig 23B ). - To determine the involvement of other potential immune checkpoint targets, we checked the protein expression of the alternative immune checkpoint target IDO1 in MDA-436 and HCC1937 isogenic cell line pairs. Accordingly DDRD positive cells (MDA-436 EV and HCC1937 EV) demonstrated increased IDO1 protein levels in comparison to corrected DDRD negative isogenic pairs (MDA-436 + BRCA1 and HCC1937 + BRCA1) (
Fig 24 , top panel of blot). Furthermore, within co-culture with lymphocytes, IDO1 relative expression levels were significantly upregulated in both repair deficient cells (436 EV + Act) (p=0.0002) and BRCA1 repair corrected MDA-436 cells (436 BRCA1 + Act) (p=0.0660). Moreover, the increased levels of IDO1 expression was more enhanced in DDRD positive cell models in co-culture (436 EV + Act) compared to the DDRD negative cells (436 BRCA1 + Act) (p=0.0013) (Fig 25 ). Therefore, similarly to PDL1, IDO1 expression is also increased by co-culture with lymphocytes, specifically in DDRD positive models. - PBMCs were co-cultured with RKO Parental and RKO FANCG-/- for 4 hours and labelled with 5-(6)-carboxyfluorescein diacetate succinimidyl ester (CFSE) to label the cancer cells, in combination with 7-AAD to label the dead cancer cells and PBMCs. The RKO FANCG-/- at both ratios (FANCG-/- 1:1 and FANCG-/- 5:1) demonstrated reduced lymphocyte mediated toxicity compared to the RKO Parental cells (Parental 1:1 and Parental 5:1), as shown by the lower percentage of cytotoxicity. This reduction in toxicity is consistent with the expression of PDL1 in these cells. It is apparent that DDRD positive cells exhibit protection against lymphocyte mediated toxicity (
Fig 26 ). Furthermore pre-treatment of the cancer cells with Interferon-γ (Fanc G IFN 5:1) extends the differential cytotoxicity between the RKO FANCG-/- and RKO Parental cells (p-value <0.05) (Fig 27A ). In addition, treatment of RKO cells with Interferon-γ significantly increases PDL1 gene expression levels, as demonstrated by the difference in fold change of RKO Par IFN, RKO Fanc C IFN and RKO Fanc G IFN (Fig 27B ). The enhanced PDL1 levels upon Interferon-γ pre-treatment were confirmed at the protein level by western blotting (RKO Par IFN and RKO Fanc G IFN) (Fig 27C , top panel). Taken together these data suggest that DDRD positive cells substantially overexpress PDL1 which protects the DDRD positive cells from lymphocyte mediated cell death. - To further assess the protective properties against lymphocyte mediated toxicity, a PDL1 blocking antibody was introduced to inhibit PDL1 function. Pre-treatment of RKO Parental cells and RKO FANCG-/- cells with Interferon-γ in combination with the PDL1 blocking antibody prior to cytotoxicity assays using PMBCs resulted in significantly more cytotoxicity in the DDRD positive RKO FANCG-/- . This was demonstrated by the enhanced percentage cytotoxicity of Fanc G treated with both Interferon-γ and PDL1 antibody (Fanc G IFN 5:1 + PDL1 AB) in comparison to Fanc G with Interferon-γ alone (Fanc G IFN 5:1) (p<0.01) (
Fig 28 ). Of note, no significant difference in cytotoxicity was observed between the Parental RKO treated with IFN (Par IFN 5:1) and the Parental RKO treated with a combination of IFN and PDL1 antibody (Par IFN 5:1 + PDL1 AB) (Fig 28 ). - To assess if other immune checkpoint targets were upregulated and therefore protected DDRD positive tumours from immune mediated cytotoxicity, we performed differential gene expression analysis of two breast cancer datasets11, a publically available colorectal cancer dataset12 and a melanoma dataset13. In each instance hierarchal clustering using DDRD genes identified from the breast cancer discovery cohort were used to define class labels. A number of additional immune checkpoint targets including PDL1, IDO1, LAG3, HAVCR2 and CTLA4 were upregulated in DDRD positive tumours when compared to DDRD negative tumours (Table 49). A number of these immune checkpoint genes have therapeutic targets identified towards them.
Table 49 - DDRD positive tumors have increased expression of multiple immune checkpoint targets Gene ID Alias BC Discovery ER Negative BC Discovery All samples BC Validation All samples CRC (E-GEOD-39582 Marisa) Melanoma (GSE19293_Augustine) CD274 PDL1 3.16 1.74 1.90 3.3 4.20 IDO1 3.32 3.04 3.58 4.62 2.82 LAG3 2.89 NA NA 1.82 2.98 HAVCR2 TIM-3 2.43 2.36 1.68 1.83 2.79 CD80 2.03 NA NA NA 1.78 CD86 2.52 1.57 NA 2.26 3.38 CTLA4 2.55 1.50 NA 1.65 3.54 MHC Class 1HLA-DRA 2.38 1.73 1.87 4.25 4.77 HLA-DPA1 2.25 1.75 1.74 3.91757 4.55 - To date the only known genetic stratification for response to PDL1 inhibition is Microsatellite Instability (MSI)14, which results from impaired DNA mismatch repair (MMR). We hypothesised that the DDRD biology would represent MSI cancers and could be used as an improved stratification tool. We performed semi-supervised clustering on a public gene expression dataset using an intrinsic DDRD biology derived from the breast cancer analysis (Mayo clinic data, Marisa dataset). This process identified a group of colorectal samples with activation of the DDRD biology and was highly enriched in MSI tumours (
Fig 29A , outlined within the box). Of this identified group, specifically 80% of the MSI tumours were present within the DDRD positive group as indicated by the percentage of cases with deficient MMR (dMMR) (Fig 29B ). Separately analysis of a cohort of stage II colorectal cancer samples which we have previously profiled15 demonstrated that samples with known MSI status (MSI-H) had significantly higher DDRD scores than microsatellite stable (MSS) samples (p>0.05) (Fig 29C ). - Our current model, intrinsic or extrinsic DNA damage causes an accumulation of cytosolic DNA, this leads to activation of the innate immune STING mediated pathway which is responsible for chemokine production resulting in an inflammatory microenvironment in DNA damage repair deficient breast tumors. Expression of PD-L1 is also associated with tumors deficient in DNA damage repair and prevents T cell mediated cytotoxicity (
Figure 30 ). - The DDRD molecular subtype represents tumours that have loss of function of the FA/BRCA pathway, the primary response mechanism to DNA damage and stalled DNA replication in the S-phase of the cell cycle. Our new data suggest that in the absence of a functional FA/BRCA pathway or as a result of exogenous S phase DNA damage, there is a mechanism through which an accumulation of cytosolic DNA activates the STING/TBK1/IRF3 innate immune response.
- Previous studies have suggested that genomic instability may activate immune signalling through the production of neoantigens3. Our model proposes cytosolic DNA as an important immune-stimulating factor in response to DNA damage in the S phase of the cell cycle. This immune signal arises from the epithelial component of the cell and does not require immune recognition of abnormal proteins. Although it is unclear why S-phase DNA damage should result in cytosolic DNA we hypothesize that this may be a by-product of replication fork processing. Indeed there is some evidence that the cell may actively export DNA fragments from the nucleus, possibly to prevent misincorporation into genomic DNA16. Normally cytosolic DNA is processed by cytoplasmic DNase II, however it may be that this mechanism is overwhelmed by a failure to respond to endogenous DNA damage or following exogenous DNA damage thereby triggering the cGAS-mediated innate immune response. Indeed, a similar activation of the STING pathway in response to an abnormal accumulation of cytosolic DNA has been observed in the disease Systemic Lupus Erythramatosis (SLE)17.
- Our DDRD gene assay contains 2 immune checkpointing genes that represent therapeutic targets, PD-L1 and IDO1. Inhibition of the PD1/PD-L1 axis has resulted in dramatic responses in a subset of patients with advanced solid tumors including melanoma and non-small cell lung cancer18. Importantly, our observation that DDRD positive tumours associate with PD-L1 expression provides a rationale for exploration of immune checkpoint treatments in this molecular subgroup. Using isolated lymphocytes we have demonstrated that blockade of PD-L1 causes significant increase in lymphoctyte mediated toxicity in DDRD positive tumours.
- In further support of this approach is the recent report for activity of PD-L1 inhibitors in mismatch repair deficient colorectal cancer (REF ASCO). Mismatch repair proteins have been reported to have a role in the response to S phase replication fork stalling19 that our study suggests should activate the STING/TBK/IRF3 pathway and upregulate PD-L1 expression. Importantly we have demonstrated that the DDRD assay is sensitive in detecting colorectal MSI tumours.
- The S phase specific nature of the immune signal also raises a potentially important issue around combination therapies with immune-checkpoint inhibitors. Interestingly direct activation of the STING pathway using synthetic cyclic dinucleotide molecules has been reported to enhance responses to PD1 antibodies, which is in keeping with our data20. Another logical combination may be an S phase specific DNA damaging agents such as cisplatin along with a PD-L1 inhibitor. Anti-microtubule agents, however, may antagonise PD-L1 inhibitors by causing cell cycle arrest in the mitotic phase thereby preventing the STING-mediated immune response. Additionally we also expect that these effects are not specific to PD-L1 as we have demonstrated activation of a number of additional immune checkpoint targets in DDRD positive tumours.
- In summary, we have identified the mechanism of immune response in breast tumours deficient in DNA repair. Activation of the innate immune STING mediated pathway is responsible for chemokine production in response to DNA damage in vitro, resulting in an inflammatory microenvironment in DNA damage repair deficient breast tumors. Expression of PD-L1 is associated with tumors deficient in DNA damage repair, and we provide a rationale for investigating the role of immune treatments in the context of endogenous or exogenous S-phase DNA damage.
-
- 1. Mulligan AM, Raitman I, Feeley L, et al. Tumoral lymphocytic infiltration and expression of the chemokine CXCL10 in breast cancers from the ontario familial breast cancer registry. Clin Cancer Res. 2013;19(2):336-346. doi: 10.1158/1078-0432.CCR-11-3314 [doi].
- 2. Groom JR, Luster AD. CXCR3 in T cell function. Exp Cell Res. 2011;317(5):620-631. doi: 10.1016/j.yexcr.2010.12.017 [doi].
- 3. Kunz M, Toksoy A, Goebeler M, Engelhardt E, Brocker E, Gillitzer R. Strong expression of the lymphoattractant C-X-C chemokine mig is associated with heavy infiltration of T cells in human malignant melanoma. J Pathol. 1999;189(4):552-558. doi: 10.1002/(SICI)1096-9896(199912)189:4<552::AID-PATH469>3.0.CO;2-I [pii].
- 4. Ohtani H, Jin Z, Takegawa S, Nakayama T, Yoshie O. Abundant expression of CXCL9 (MIG) by stromal cells that include dendritic cells and accumulation of CXCR3+ T cells in lymphocyte-rich gastric carcinoma. J Pathol. 2009;217(1):21-31. doi: 10.1002/path.2448 [doi].
- 5. Muthuswamy R, Berk E, Junecko BF, et al. NF-kappaB hyperactivation in tumor tissues allows tumor-selective reprogramming of the chemokine microenvironment to enhance the recruitment of cytolytic T effector cells. Cancer Res. 2012;72(15):3735-3743. doi: 10.1158/0008-5472.CAN-11-4136 [doi].
- 6. Brzostek-Racine S, Gordon C, Van Scoy S, Reich NC. The DNA damage response induces IFN. J Immunol. 2011;187(10):5336-5345. doi: 10.4049/jimmunol.1100040 [doi].
- 7. Motani K, Ito S, Nagata S. DNA-mediated cyclic GMP-AMP synthase-dependent and - independent regulation of innate immune responses. J Immunol. 2015;194(10):4914-4923. doi: 10.4049/jimmunol.1402705 [doi].
- 8. Kim T, Kim TY, Song YH, Min IM, Yim J, Kim TK. Activation of interferon .
- 9. Ablasser A, Goldeck M, Cavlar T, et al. cGAS produces a 2'-5'-linked cyclic dinucleotide second messenger that activates STING. Nature. 2013;498(7454):380-384. doi: 10.1038/nature12306 [doi].
- 10. Soria J, Gettinger S, Gordon MS, et al. Biomarkers associated wtih clinical activity of PD-L1 blockade in non-small cell lung carcinoma (NSCLC) patients (pts) in a phase I study of MPDL3280A. Annals of Oncology. 2014;25(Suppl 4):iv426-Abstract 1322 P.
- 11. Mulligan JM, Hill LA, Deharo S, et al. Identification and validation of an anthracycline/cyclophosphamide-based chemotherapy response assay in breast cancer. J Natl Cancer Inst. 2014;106(1):djt335. doi: 10.1093/jnci/djt335 [doi].
- 12. Gene Expression Classification of Colon Cancer into Molecular Subtypes: Characterization, Validation, and Prognostic Value. Laetitia Marisa, Aurélien de Reyniès, Alex Duval, Janick Selves, Marie Pierre Gaub, Laure Vescovo, Marie-Christine Etienne-Grimaldi, Renaud Schiappa, Dominique Guenot, Mira Ayadi, Sylvain Kirzin, Maurice Chazal, Jean-François Fléjou, Daniel Benchimol, Anne Berger, Arnaud Lagarde, Erwan Pencreach, Françoise Piard, Dominique Elias, Yann Parc, Sylviane Olschwang, Gerard Milano, Pierre Laurent-Puig , Valérie Boige PLoS Med.2013;10(5):e1001453. doi: 10.1371/journal.pmed.1001453. Epub 2013 May 21.
- 13. Gene expression signatures as a guide to treatment strategies for in-transit metastatic melanoma. Augustine CK, Jung SH, Sohn I, Yoo JS et al, Mol Cancer Ther 2010 Apr;9(4):779-90. PMID: 20371714
- 14. Dung T. Le, Jennifer N. Uram, Hao Wang, Bjarne Bartlett, Holly Kemberling, Aleksandra Eyring, Andrew Skora, Nilofer Saba Azad, Daniel A. Laheru, Ross C. Donehower, Brandon Luber, Todd S. Crocenzi, George A. Fisher, Steve M Duffy, James J. Lee, Minori Koshiji, James R. Eshleman, Robert A Anders, Bert Vogelstein, Luis A. Diaz PD-1 blockade in tumors with mismatch repair deficiency. J Clin Oncol 33, 2015 (suppl; abstr LBA100).
- 15. Development and independent validation of a prognostic assay for stage II colon cancer using formalin-fixed paraffin-embedded tissue. Kennedy RD, Bylesjo M, Kerr P, Davison T, Black JM, Kay EW, Holt RJ, Proutski V, Ahdesmaki M, Farztdinov V, Goffard N, Hey P, McDyer F, Mulligan K, Mussen J, O'Brien E, Oliver G, Walker SM, Mulligan JM, Wilson C, Winter A, O'Donoghue D, Mulcahy H, O'Sullivan J, Sheahan K, Hyland J, Dhir R, Bathe OF, Winqvist O, Manne U, Shanmugam C, Ramaswamy S, Leon EJ, Smith WI Jr, McDermott U, Wilson RH, Longley D, Marshall J, Cummins R, Sargent DJ, Johnston PG, Harkin DP. J Clin Oncol. 2011 . Epub 2011
Nov 7. - 16 Dnase2a deficiency uncovers lysosomal clearance of damaged nuclear DNA via autophagy. Lan YY, Londoño D, Bouley R, Rooney MS, Hacohen N. Cell Rep. 2014 .
- 17 STING manifests self DNA-dependent inflammatory disease. Ahn J1, Gutman D, Saijo S, Barber GN. Proc Natl Acad Sci U S A. 2012 .
- 18 Safety and activity of anti-PD-L1 antibody in patients with advanced cancer. Brahmer JR, Tykodi SS, Chow LQ, Hwu WJ, Topalian SL, Hwu P, Drake CG, Camacho LH, Kauh J, Odunsi K, Pitot HC, Hamid O, Bhatia S, Martins R, Eaton K, Chen S, Salay TM, Alaparthy S, Grosso JF, Korman AJ, Parker SM, Agrawal S, Goldberg SM, Pardoll DM, Gupta A, Wigginton JM. N Engl J Med. 2012 .
- 19 Mammalian BTBD12/SLX4 assembles a Holliday junction resolvase and is required for DNA repair. Svendsen JM1, Smogorzewska A, Sowa ME, O'Connell BC, Gygi SP, Elledge SJ, Harper JW. Cell. 2009 .
- 20 STING agonist formulated cancer vaccines can cure established tumors resistant to PD-1 blockade. Fu J, Kanne DB, Leong M, Glickman LH, McWhirter SM, Lemmens E, Mechette K, Leong JJ, Lauer P, Liu W, Sivick KE, Zeng Q, Soares KC, Zheng L, Portnoy DA, Woodward JJ, Pardoll DM, Dubensky TW Jr, Kim Y. Sci Transl Med. 2015 .
- Recursive feature elimination was performed on the 44 gene signature to define subsets of signatures comprising a single gene up to 43 genes.
- The DDRD training set comprising 107 samples with known DDRD status were used for this analysis.
- The DDRD signature of length 44 was used as a starting point for this analysis, where the absolute weight of the 44 genes was considered as a means for ranking the individual genes. The lowest ranked gene, i.e. the gene with the lowest absolute weight, was removed from the signature and the model parameters were re-trained using partial least squares (PLS) regression with the 43 gene expression data against the DDRD class labels. The weighting parameters of the 43 gene signature were used to reduce the signature by one gene as previously described, and this process was repeated until only one gene remained. Leave one out cross validation was used to enable performance estimates to be calculated for each signature length evaluated. The performance of the signature was measured using area under the receiver operating characteristic curve (AUC), which assess the ability of the signature to discriminate between the DDRD positive and DDRD negative samples at each feature length considered. Details of each of the sub-signatures are provided in Table 3-45.
- Table 50 shows the AUC performance for predicting the subtype using a minimum of one gene up to 43 genes (see Tables 3-45 for details of the sub signatures). At a minimum of one gene, the AUC performance is significantly greater than 0.5, therefore it is possible to predict the DDRD molecular subgroup significantly better than by chance with a minimum of one gene.
Table 50 - AUC performance for predicting the subtype using sub signatures of 1 to 43 genes Sub signature size AUC (leave-one-out CV) 1 0.7694 2 0.7925 3 0.7847 4 0.7866 5 0.7910 6 0.7899 7 0.7746 8 0.7873 9 0.8000 10 0.8026 11 0.8190 12 0.8172 13 0.8276 14 0.8265 15 0.8265 16 0.8377 17 0.8459 19 0.8496 20 0.8642 21 0.8612 22 0.8679 23 0.8813 24 0.8847 25 0.8899 26 0.8948 27 0.8937 28 0.8996 28 0.8526 29 0.9000 30 0.9049 31 0.9101 32 0.9108 33 0.9157 34 0.9149 35 0.9231 36 0.9231 37 0.9216 38 0.9228 39 0.9257 40 0.9269 41 0.9310 42 0.9306 43 0.9317 - This study analysed RNAseq gene expression data from a TCGA cohort of 474 patients with skin cutaneous melanoma.
Level 3 normalised gene expression data was downloaded from the TCGA data portal and the data matrix reduced to include only the DDRD genes. To remove zero counts in the data matrix, a constant value of 0.01 was added to all gene expression values and the resulting data matrix log transformed (using natural log). - DDRD assay scores were generated (as described in Mulligan et al. 2014) and dichotomized such that 75% of samples (with highest DDRD scores) were classified as DDRD-positive and 25% of samples (with lowest DDRD scores) were classified as DDRD-negative.
- Patients who had received an immune based therapy (immune checkpoint modulator such as Ipilimumab or pembrolizumab) and/or a DNA damaging agent were subsequently analysed for differences in survival outcome based on their DDRD classification. Kaplan Meier plots were used to visualise differences in survival probability for DDRD positive vs DDRD negative and the Logrank test used to assess if the survival curves differ significantly. A hazard ratio was also calculated for the DDRD assay to estimate the relative risk of an event occurring in the DDRD positive compared to the DDRD negative group. The endpoints used for this analysis were time to local recurrence, time to distant recurrence, time to death (overall survival).
-
Figures 31, 32 and33 respectively are the Kaplan Meier survival graphs illustrating the difference in survival probability by DDRD status, for time to local recurrence (Figure 31 ), time to distant recurrence (Figure 32 ) and overall survival time (Figure 33 ). The resulting analyses of each endpoint demonstrated that, in a cohort treated with an immune based therapy (immune checkpoint modulator such as Ipilimumab or pembrolizumab) and/or a DNA damaging agent, patients in the DDRD positive group have a significantly lower risk of an event occurring after treatment compared to patients in the DDRD negative group: - Time to local recurrence: HR = 0.39 [95% Cl: 0.18-0.84], p = 0.0008
- Time to distant recurrence: HR = 0.44 [95% Cl: 0.19-0.99], p = 0.0095
- Time to overall survival: HR = 0.31 [95% Cl: 0.12-0.81], p = 0.0006
- This data demonstrates that the DDRD assay identifies a group of Melanoma patients that have significantly improved survival following treatment with an immune based therapy (immune checkpoint modulator such as Ipilimumab or pembrolizumab) and/or a DNA damaging agent which have been licensed for use in Melanoma.
- Mulligan JM, Hill LA, Deharo S, et al. Identification and validation of an anthracycline/cyclophosphamide-based chemotherapy response assay in breast cancer. J Natl Cancer Inst. 2014;106(1):djt335. doi: 10.1093/jnci/djt335 [doi].
-


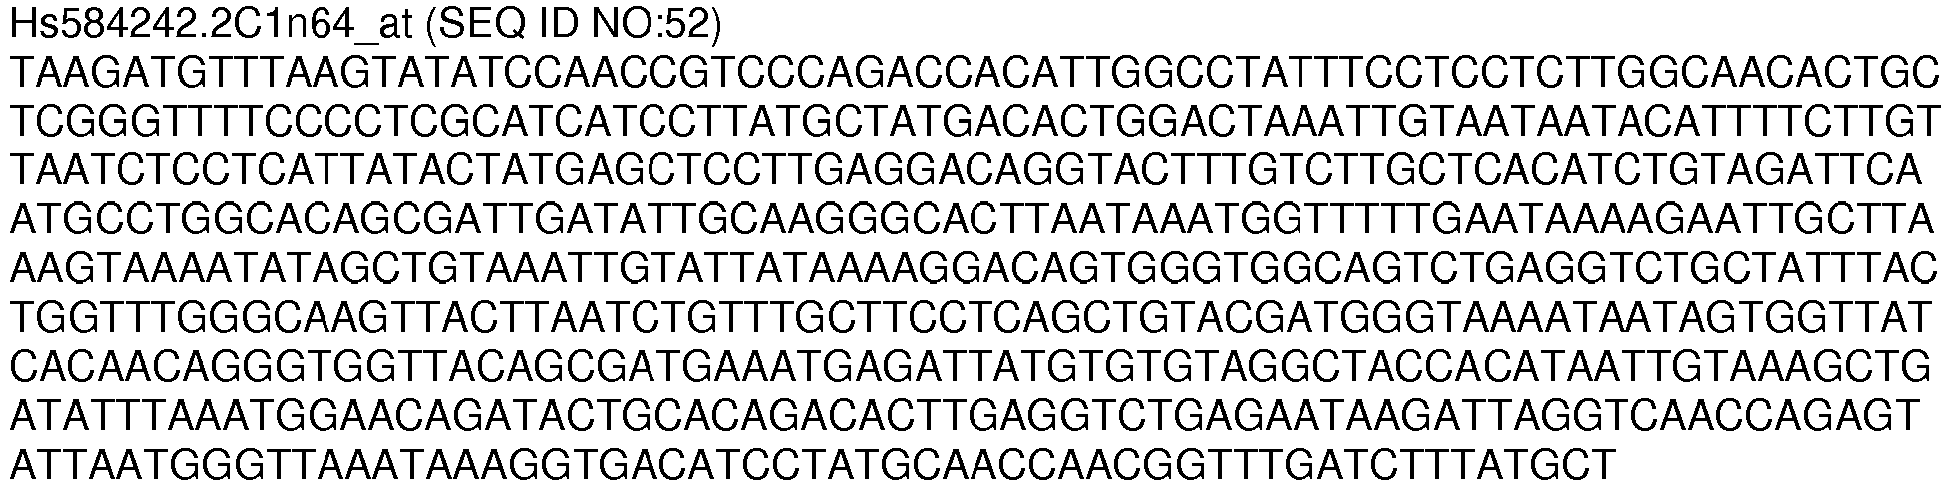


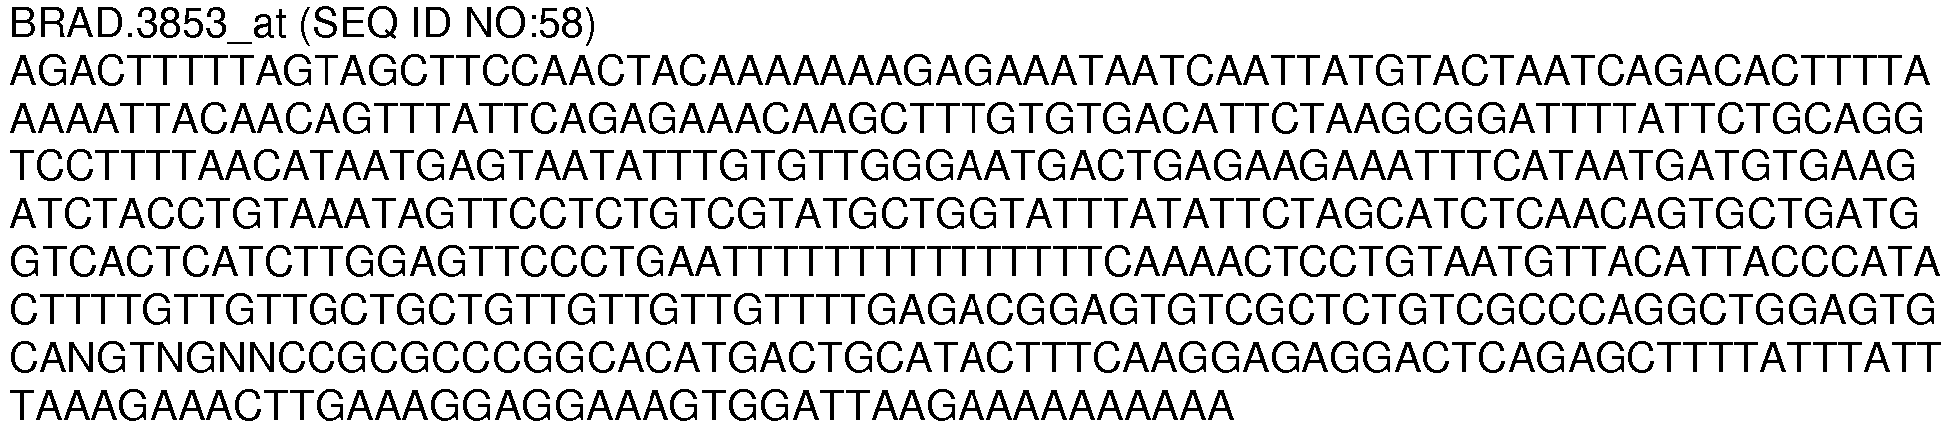


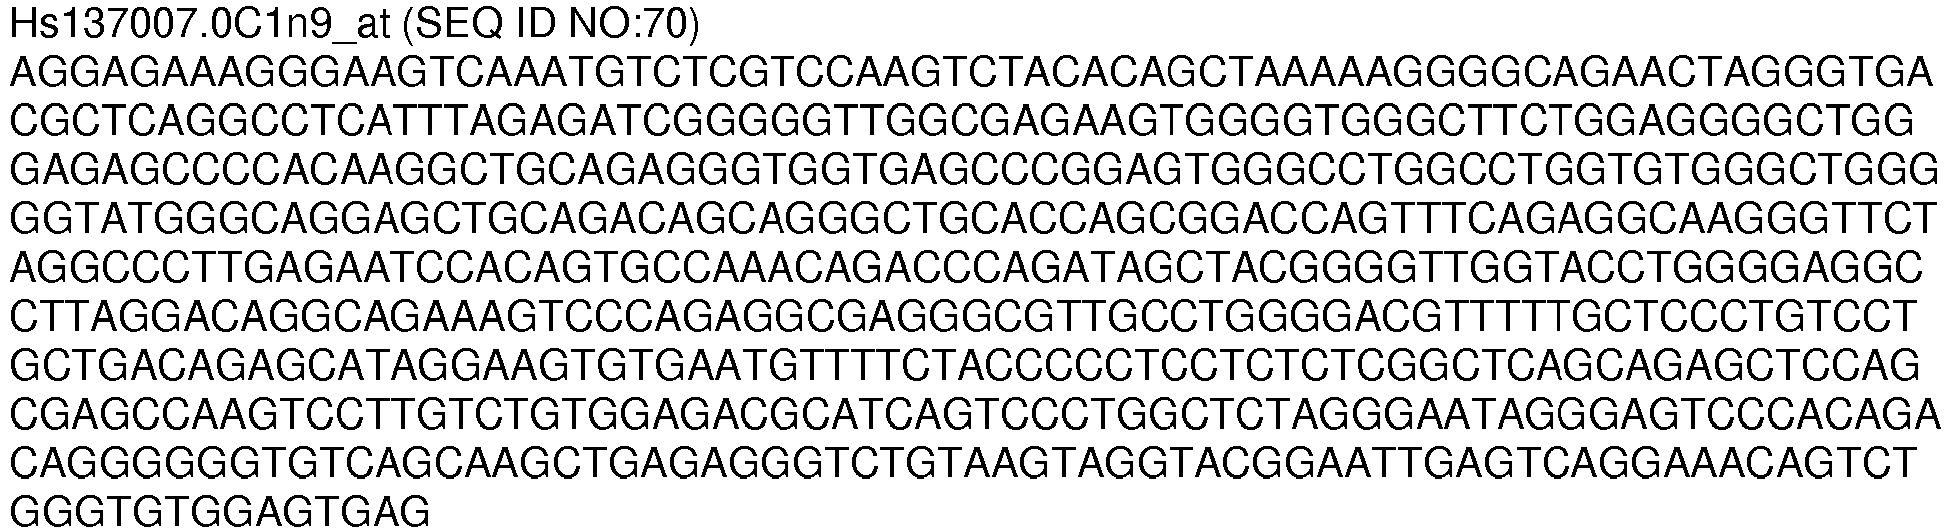





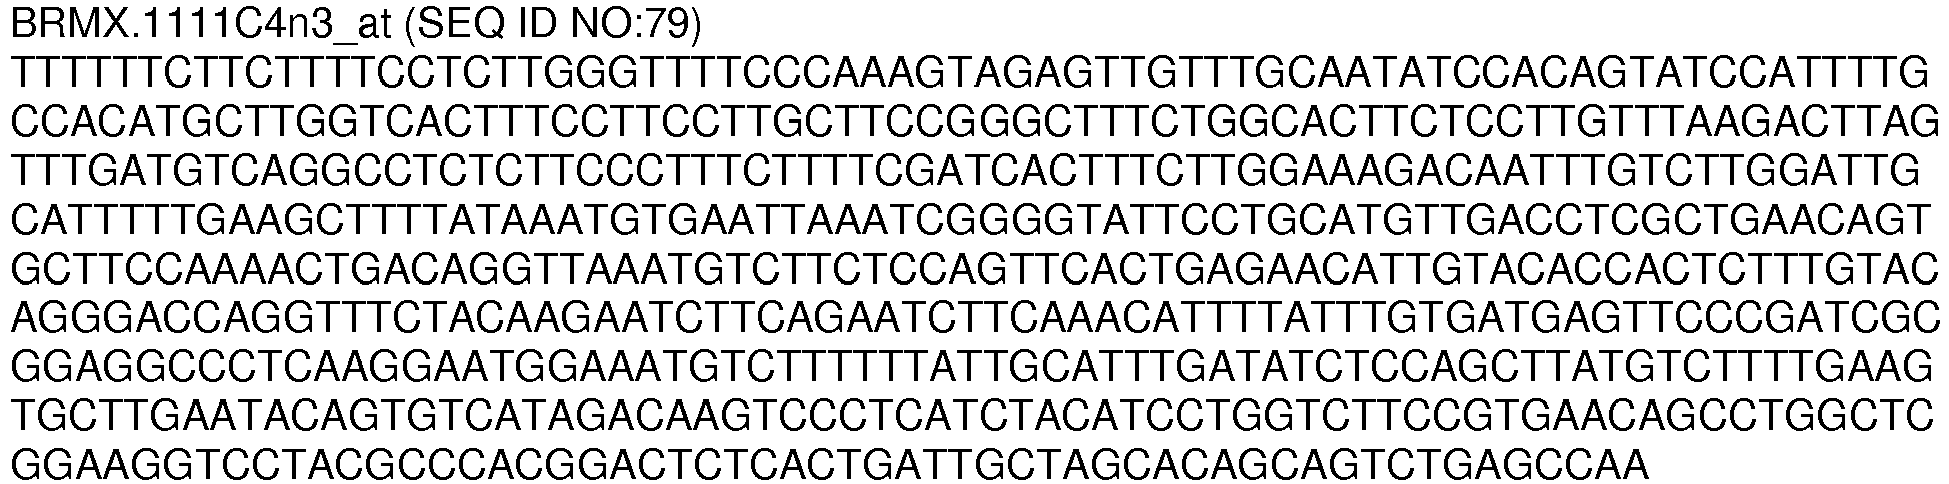




































- IDO_F1 (SEQ ID NO:203)
AGAGACATCTGTATGCATTCCTG - IDO_R1 (SEQ ID NO:204)
GGTATTTTGAGGTCTTTTGTATTGC - IDO_P1 (SEQ ID NO:205)
ACCCATTGTAACAGAGCCACAAACT - CD2_F1 (SEQ ID NO:206)
TCTCAGGTCATGTGTAGATGCG - CD2_R1 (SEQ ID NO:207)
CTCCAGAGTCTCTTAAGCAGATAGG - CD2_P1 (SEQ ID NO:208)
AGACCCAGGCACACCAATCACTTGA - GBP5_F1 (SEQ ID NO:209)
AACAACAGATGCAGGAACAGG - GBP5_R1 (SEQ ID NO:210)
AGTCCTCTGGGCGTGCTG - GBP5_P1 (SEQ ID NO:211)
CACAGCTCAGCACAACATTCCAAGC - PRAME_F1 (SEQ ID NO:212)
CTGCATACTTGGACACTAAAGCC - PRAME_R1 (SEQ ID NO:213)
ATGTTTTCCTCACTCACACTGAAC - PRAME_P1 (SEQ ID NO:214)
AGCAACAAAGCAGCCACAGTTTCAG - ITGAL_F1 (SEQ ID NO:215)
ACAGAAAGACTGAGCTCAAGGTG - ITGAL_R1 (SEQ ID NO:216)
TGCAGGCACTGTGCTTGG - ITGAL_P1 (SEQ ID NO:217)
AACCACGTCTGCTAACTTGGAGCCC - LRP4_F1 (SEQ ID NO:218)
TGTAAAAAGCAAAATCTCTCTGTCC - LRP4_R1 (SEQ ID NO:219)
AGTCCAATCTCTCCAGTGAGTAAC - LRP4_P1 (SEQ ID NO:220)
AATGGAAGCGATTCTCCCATGCTCA - APOL3_F1 (SEQ ID NO:221)
GACCAGGTGTCTCTAAAAACCC - APOL3_R1 (SEQ ID NO:222)
TTGCCTGCTGTATATGAGTAATGAG - APOL3_P1 (SEQ ID NO:223)
CCTGGAGAGTATGCGAGAACCTACC - CDR1_F1 (SEQ ID NO:224)
GAAGACGTGGATTTTCCTGGAAG - CDR1_R1 (SEQ ID NO:225)
TCCAAGTCTTCCAGTAAATCAAGTC - CDR1_P1 (SEQ ID NO:226)
TCCAGCAAATCCAGTCTTCCAGCAA - FYB_F1 (SEQ ID NO:227)
AACAAATCATCAACTTCCACTGGTC - FYB_R1 (SEQ ID NO:228)
TGGAGGGAATCTTTGGAGATTAGTG - FYB_P1 (SEQ ID NO:229)
TCTAATCTTGGGGCCTCAGACACCC - TSPAN7_F1 (SEQ ID NO:230)
GACATTGAGGACCTCATCCAAAC - TSPAN7_R1 (SEQ ID NO:231)
GACAGAGGCATTACTTTTGAAGATC - TSPAN7_P1 (SEQ ID NO:232)
TTGACTTGTTCCCCCTTCACACTCA - RAC2_F1 (SEQ ID NO:233)
CTCAGTTCTCCTCTTTTGGAACAAC - RAC2_R1 (SEQ ID NO:234)
TTGAACCCAGATTTTCCATTGGC - RAC2_P1 (SEQ ID NO:235)
TCTACGCCTCTGGGGATATCTGCTC - KLHDC7B_F1 (SEQ ID NO:236)
TGGCACTGTGGATTCTCAAGG - KLHDC7B_R1 (SEQ ID NO:237)
CTGGGGGTATGGGCAGGAG - KLHDC7B_P1 (SEQ ID NO:238)
CACCAGCGGACCAGTTTCAGAGGCA - GRB14_F1 (SEQ ID NO:239)
CTAATACAGCTGGTGGAGTTCTATC - GRB14_R1 (SEQ ID NO:240)
AGCAATCCTAGCACAATAATGTTTC - GRB14_P1 (SEQ ID NO:241)
ACTCAATAAGGGCGTTCTTCCTTGC - KIF26A_F1 (SEQ ID NO:242)
AGGAATTTTTACCAAAACCACAAGC - KIF26A_R1 (SEQ ID NO:243)
AACAGAACCTTTACAAAACCCTACC - KIF26A_P1 (SEQ ID NO:244)
AACAGACCACCACGACCAACAACA - CD274_F1 (SEQ ID NO:245)
TTGGTGTGACAGTGTTCTTTGTG - CD274_R1 (SEQ ID NO:246)
AGGAGGAGTTAGGACTTAGGAATAG - CD274_P1 (SEQ ID NO:247)
TGCCTTGCTCAGCCACAATTCTTGC - CD109_F1 (SEQ ID NO:248)
TGTGGATTTGAATGTGTGTACAAGC - CD109_R1 (SEQ ID NO:249)
GGCACCATAAAGCCACTTAATAGG - CD109_P1 (SEQ ID NO:250)
AAGAGCCATGCCACTCCTACCCGG - ETV7_F1 (SEQ ID NO:251)
CCCTCACTGAGCCTCAGATTTC - ETV7_R1 (SEQ ID NO:252)
GCCGCCTGGAAGCACTAAC - ETV7_P1 (SEQ ID NO:253)
TCCCATTTCCTGCCTCAGCCCATTT - MFAP5_F1 (SEQ ID NO:254)
GGCTGGTCTGCCCCCTAG - MFAP5_R1 (SEQ ID NO:255)
ACCATTGGGTCTCTGCAAATCC - MFAP5_P1 (SEQ ID NO:256)
ACTCCGTCGCTCCAATTACTTCCGA - OLFM4_F1 (SEQ ID NO:257)
AGGACGAGCTATAGAAAAGCTATTG - OLFM4_R1 (SEQ ID NO:258)
CATTCAAAAGCACAGAAGCACATC - OLFM4_P1 (SEQ ID NO:259)
CACCAGCAAGGTTTCCAACTACTGC - PI15_F1 (SEQ ID NO:260)
TTTTCCAGGCTAAAGCAAATGAAAG - PI15_R1 (SEQ ID NO:261)
CTATCCTAGCACCATTGTTGCATG - PI15_P1 (SEQ ID NO:262)
TTGCTGGTATCAACACAGCCTGCCA - FOSB_F1 (SEQ ID NO:263)
TGAGTGAGACTGAGGGATCGTAG - FOSB_R1 (SEQ ID NO:264)
GTGGTTGGCAGGAGCAAGC - FOSB_P1 (SEQ ID NO:265)
CACACTCTCACACTCGCACCCAGAA - CXCL10_F1 (SEQ ID NO:266)
ACCAGAGGGGAGCAAAATCGA - CXCL10_R1 (SEQ ID NO:267)
TGCCTCTCCCATCACTTCCC - CXCL10_P1 (SEQ ID NO:268)
CCTCTGTGTGGTCCATCCTTGGAAGCA - MX1_F1 (SEQ ID NO:269)
CAGCACCTGATGGCCTATCAC - MX1_R1 (SEQ ID NO:270)
CAGTTCTTCATGCTCCAGACGTAC - MX1_P1 (SEQ ID NO:271)
CGCATCTCCAGCCACATCCCTTTGA - IFI44L_F1 (SEQ ID NO:272)
CCTCTTGAGGAAACTGGTGCAATTG - IF144L_R1 (SEQ ID NO:273)
TGATTCTGACATTTGGCCCAGC - IFI44L_P1 (SEQ ID NO:274)
TCTCAAATGCAGGGCTGTAACGCTCTC - AC138128.1_F1 (SEQ ID NO:275)
GCTAGAGCAGGACTTCGTCTCC - AC138128.1_R1 (SEQ ID NO:276)
GAGAAGATCTGGCCTTATGCCCA - AC138128.1_P1 (SEQ ID NO:277)
TCTCTGGAACAGCTCATCGCCGCAT - FAM19A5_F1 (SEQ ID NO:278)
GGAAGGCTGCGACTTGTTAATCAA - FAM19A5_R1 (SEQ ID NO:279)
CTCCTGACAAACACAGCCCC - FAM19A5_P1 (SEQ ID NO:280)
CCGTGGTGGTCTTTATCCTCCCGCC - NLRC5_F1 (SEQ ID NO:281)
GAGAGTGGACCTGGAGAAGAATCAG - NLRC5_R1 (SEQ ID NO:282)
TAGCATCCAAGTCATCCGCCT - NLRC5_P1 (SEQ ID NO:283)
AGTCCTTCAGCCAGGAGCCAGGC - PRICKLE1_F1 (SEQ ID NO:284)
GTTCGGGATTCGATGGATTCTTTGG - PRICKLE1_R1 (SEQ ID NO:285)
CCAAGGCCATCATTGTATTCTCTGC - PRICKLE1_P1 (SEQ ID NO:286)
TCTCCATCCACCGAAGCCCCTGT - EGR1_F1 (SEQ ID NO:287)
GCAGCACCTTCAACCCTCAG - EGR1_R1 (SEQ ID NO:288)
TCTCTGAACAACGAGAAGGTGCT - EGR1_P1 (SEQ ID NO:289)
CCTACGAGCACCTGACCGCAGAGT - CLDN10_F1 (SEQ ID NO:290)
AGCCGCTCTGTTTATTGGATGG - CLDN10_R1 (SEQ ID NO:291)
TCTGACAACAACAAAACACCCAGA - CLDN10_P1 (SEQ ID NO:292)
ACACCACCAATTATGCACAGTGAGGCT - ADAMTS4_F1 (SEQ ID NO:293)
TGGCTCCAAGAAGAAGTTTGACAAG - ADAMTS4_R1 (SEQ ID NO:294)
TCCTTCAGGAAATTCAGGTACGGAT - ADAMTS4_P1 (SEQ ID NO:295)
CCTGACTGCTTGCTGCAACCAGAACC - SP140L_F1 (SEQ ID NO:296)
AGTGGAGGGGTTTGTACAAGACA - SP140L_R1 (SEQ ID NO:297)
CAAATGGGACTTAGACTGGAGGCT - SP140L_P1 (SEQ ID NO:298)
CGCCTCATCTTCCAGAACCACAGGG - ANXA_F1 (SEQ ID NO:299)
CCACAAGCAAACCAGCTTTCTTTG - ANXA_R1 (SEQ ID NO:300)
TGATCAGGATTATGGTTTCCCGTTC - ANXA_P1 (SEQ ID NO:301)
TGGCGAGTTCCAACACCTTTCATGGC - RSAD2_F1 (SEQ ID NO:302)
GGAAGAGGACATGACGGAACAGA - RSAD2_R1 (SEQ ID NO:303)
GTGTTCCAGTGCCTCTTAATTGAGG - RSAD2_P1 (SEQ ID NO:304)
CAAAGCACTAAACCCTGTCCGCTGGAA - ESR1_F1 (SEQ ID NO:305)
CTGCAGCAGCAGCACCAG - ESR1_R1 (SEQ ID NO:306)
CATCAGGCACATGAGTAACAAAGGC - ESR1_P1 (SEQ ID NO:307)
CCCAGCTCCTCCTCATCCTCTCCC - IKZF3_F1 (SEQ ID NO:308)
GCAGAGATGGGAAGTGAAAGAGC - IKZF3_R1 (SEQ ID NO:309)
TCAATGCCTCAGAAATTCATTGGTG - IKZF3_P1 (SEQ ID NO:310)
TGCCACATTGCTTGCTAATCTGTCCAG - EGFR_F1 (SEQ ID NO:311)
GACAGCTTCTTGCAGCGATACAG - EGFR_R1 (SEQ ID NO:312)
CCTTCCTCCCAGTGCCTGA - EGFR_P1 (SEQ ID NO:313)
TCGTCTATGCTGTCCTCAGTCAAGGCG - NAT1_F1 (SEQ ID NO:314)
AGAGCACTTCCTCATAGACCTTGG - NAT1_R1 (SEQ ID NO:315)
TTCAAGCCAGGAAGAAGCAGC - NAT1_P1 (SEQ ID NO:316)
TGCATTCAGTCTAGTTCCTGGTTGCCG - LATS2_F1 (SEQ ID NO:317)
GCAAGATGGGCTACCTGGAC - LATS2_R1 (SEQ ID NO:318)
TTAAGCAGACCTCCCCAGGA - LATS2_P1 (SEQ ID NO:319)
ACCCGCACAATCTGCTCATTCCTCG - CYP2B6_F1 (SEQ ID NO:320)
TCTCCTTAGGGAAGCGGATTTGTC - CYP2B6_R1 (SEQ ID NO:321)
TTCTTCACCACCATCCTCCAGA - CYB2B6_P1 (SEQ ID NO:322)
CATCGCCCGTGCGGAATTGTTCCT - PTPRC_F1 (SEQ ID NO:323)
CTGGCCATCTGCAAGCTGAG - PTPRC_R1 (SEQ ID NO:324)
CAGTTCAGCCTTCAGTTGGTGG - PTPRC_P1 (SEQ ID NO:325)
AGCAAGGAAGCCAATCCAAGTCACCAA - PPP1R1A_F1 (SEQ ID NO:326)
ACCCATATACCACCACTGGATTCC - PPP1R1A_R1 (SEQ ID NO:327)
CAGTTTGGGAATGCATGGACACC - PPP1R1A_P1 (SEQ ID NO:328)
ACCTCCTCCTCTCTCAGACCGAGTTGG - STING_a (SEQ ID:329)
CAGCGGCUGUAUAUUCUCCUCCCUU - STING_b (SEQ ID:330)
GGUCAUAUUACAUCGGAUAUU - TBK1_a (SEQ ID:331)
GGAAAUAUCAUGCGUGUUAUU - TBK1_b (SEQ ID:332)
UGGUGCAGCUAGAGAAUUAUU - IRF3_a (SEQ ID:333)
CCUCUGAGAACCCACUGAAUU - IRF3_b (SEQ ID:334)
GGACAAUCCCACUCCCUUCUU - cGAS_a (SEQ ID:335)
AGAGAAAUGUUGCAGGAAAUU - cGAS_b (SEQ ID:336)
CAGCUUCUAAGAUGCUGUCAAAGUU - BRCA1_a (SEQ ID:337)
CCUAUCGGAAGAAGGCAAGUU - BRCA1_b (SEQ ID:338)
CAUACAGCUUCAUAAAUAAUU - BRCA2_a (SEQ ID:339)
GGACACAAUUACAACUAAAUU - BRCA2_b (SEQ ID:340)
GGAGGAAUAUCGUAGGUAAUU - FancD2_a (SEQ ID:341)
GCAGAUUCAUGAAGAGAAAUU - FancD2_b (SEQ ID:342)
GGUUAAAGCACAUUGUAGAUU - CXCL10 Forward (SEQ ID NO:343)
GGCCATCAAGAATTTACTGAAAGCA - CXCL10 Reverse (SEQ ID NO:344)
TCTGTGTGGTCCATCCTTGGAA - CCL5 Forward (SEQ ID NO:345)
TGCCCACATCAAGGAGTATTT - CCL5 Reverse (SEQ ID NO:346)
CTTTCGGGTGACAAAGACG - IDO1 Forward (SEQ ID NO:347)
CATCTGCAAATCGTGACTAAG - IDO1 Reverse (SEQ ID NO:348)
CAGTCGACACATTAACCTTCCTTC - PDL1 Forward (SEQ ID NO:349)
GGCATCCAAGATACAAACTCAAAGA - PDL1 Reverse (SEQ ID NO:350)
AGTTCCAATGCTGGATTACGTCT - PUM1 (Housekeeping gene) Forward (SEQ ID NO:351)
CCAGAAAGCTCTTGAGTTTATTCC - PUM1 (Housekeeping gene) Reverse (SEQ ID NO:352)
CATCTAGTTCCCGAACCATCTC - OR2I1P F1 (SEQ ID NO:353)
CTCAACCCGCTCATCTACAC - OR211 P R1 (SEQ ID NO:354)
TCCTTGGGTTCTGGCTTAATAC - OR2I1P P1 (SEQ ID NO:355)
TCGCTGCCCCCTTCACTTTCTTATT - AL137218.1 F1 (SEQ ID NO:356)
TGCTTCATGTTAGTCCCCAG - AL137218.1 R1 (SEQ ID NO:357)
GGGTCTCACTATATTGCTCTGG - AL137218.1 P1 (SEQ ID NO:358)
CCTCAGCCTTCCAAAACCAGGTGT -
- <110> Almac Diagnostics Limited
- <120> Molecular Diagnostic Test for Cancer
- <130> P131269WO00
- <160> 358
- <170> PatentIn version 3.5
- <210> 1
<211> 541
<212> DNA
<213> Homo sapiens - <400> 1

- <210> 2
<211> 600
<212> DNA
<213> Homo sapiens - <400> 2


- <210> 3
<211> 600
<212> DNA
<213> Homo sapiens - <400> 3

- <210> 4
<211> 600
<212> DNA
<213> Homo sapiens - <400> 4

- <210> 5
<211> 600
<212> DNA
<213> Homo sapiens - <400> 5

- <210> 6
<211> 600
<212> DNA
<213> Homo sapiens - <400> 6

- <210> 7
<211> 600
<212> DNA
<213> Homo sapiens - <400> 7

- <210> 8
<211> 600
<212> DNA
<213> Homo sapiens - <220>
<221> misc_feature
<222> (1)..(5)
<223> n is a, c, g, or t - <220>
<221> misc_feature
<222> (356)..(364)
<223> n is a, c, g, or t - <400> 8

- <210> 9
<211> 394
<212> DNA
<213> Homo sapiens - <220>
<221> misc_feature
<222> (2)..(2)
<223> n is a, c, g, or t - <220>
<221> misc_feature
<222> (5)..(5)
<223> n is a, c, g, or t - <220>
<221> misc_feature
<222> (7)..(7)
<223> n is a, c, g, or t - <220>
<221> misc_feature
<222> (32)..(32)
<223> n is a, c, g, or t - <220>
<221> misc_feature
<222> (201)..(223)
<223> n is a, c, g, or t - <220>
<221> misc_feature
<222> (226)..(227)
<223> n is a, c, g, or t - <220>
<221> misc_feature
<222> (229)..(232)
<223> n is a, c, g, or t - <400> 9

- <210> 10
<211> 600
<212> DNA
<213> Homo sapiens - <400> 10


- <210> 11
<211> 600
<212> DNA
<213> Homo sapiens - <400> 11

- <210> 12
<211> 600
<212> DNA
<213> Homo sapiens - <400> 12

- <210> 13
<211> 600
<212> DNA
<213> Homo sapiens - <400> 13

- <210> 14
<211> 600
<212> DNA
<213> Homo sapiens - <400> 14

- <210> 15
<211> 600
<212> DNA
<213> Homo sapiens - <400> 15


- <210> 16
<211> 600
<212> DNA
<213> Homo sapiens - <400> 16

- <210> 17
<211> 600
<212> DNA
<213> Homo sapiens - <400> 17


- <210> 18
<211> 600
<212> DNA
<213> Homo sapiens - <400> 18
- <210> 19
<211> 600
<212> DNA
<213> Homo sapiens - <400> 19

- <210> 20
<211> 600
<212> DNA
<213> Homo sapiens - <400> 20

- <210> 21
<211> 600
<212> DNA
<213> Homo sapiens - <220>
<221> misc_feature
<222> (1)..(107)
<223> n is a, c, g, or t - <400> 21

- <210> 22
<211> 477
<212> DNA
<213> Homo sapiens - <400> 22

- <210> 23
<211> 600
<212> DNA
<213> Homo sapiens - <220>
<221> misc_feature
<222> (229)..(316)
<223> n is a, c, g, or t - <220>
<221> misc_feature
<222> (572)..(572)
<223> n is a, c, g, or t - <400> 23

- <210> 24
<211> 429
<212> DNA
<213> Homo sapiens - <400> 24

- <210> 25
<211> 600
<212> DNA
<213> Homo sapiens - <400> 25

- <210> 26
<211> 600
<212> DNA
<213> Homo sapiens - <400> 26


- <210> 27
<211> 600
<212> DNA
<213> Homo sapiens - <400> 27

- <210> 28
<211> 600
<212> DNA
<213> Homo sapiens - <220>
<221> misc_feature
<222> (302)..(302)
<223> n is a, c, g, or t - <220>
<221> misc_feature
<222> (570)..(570)
<223> n is a, c, g, or t - <400> 28


- <210> 29
<211> 600
<212> DNA
<213> Homo sapiens - <400> 29

- <210> 30
<211> 600
<212> DNA
<213> Homo sapiens - <400> 30

- <210> 31
<211> 600
<212> DNA
<213> Homo sapiens - <400> 31

- <210> 32
<211> 600
<212> DNA
<213> Homo sapiens - <400> 32

- <210> 33
<211> 600
<212> DNA
<213> Homo sapiens - <400> 33


- <210> 34
<211> 600
<212> DNA
<213> Homo sapiens - <400> 34

- <210> 35
<211> 600
<212> DNA
<213> Homo sapiens - <400> 35


- <210> 36
<211> 600
<212> DNA
<213> Homo sapiens - <400> 36

- <210> 37
<211> 420
<212> DNA
<213> Homo sapiens - <400> 37

- <210> 38
<211> 600
<212> DNA
<213> Homo sapiens - <220>
<221> misc_feature
<222> (187)..(187)
<223> n is a, c, g, or t - <220>
<221> misc_feature
<222> (514)..(515)
<223> n is a, c, g, or t - <220>
<221> misc_feature
<222> (517)..(517)
<223> n is a, c, g, or t - <220>
<221> misc_feature
<222> (521)..(521)
<223> n is a, c, g, or t - <220>
<221> misc_feature
<222> (523)..(524)
<223> n is a, c, g, or t - <220>
<221> misc_feature
<222> (526)..(527)
<223> n is a, c, g, or t - <220>
<221> misc_feature
<222> (583)..(585)
<223> n is a, c, g, or t - <400> 38

- <210> 39
<211> 523
<212> DNA
<213> Homo sapiens - <400> 39

- <210> 40
<211> 600
<212> DNA
<213> Homo sapiens - <400> 40

- <210> 41
<211> 513
<212> DNA
<213> Homo sapiens - <400> 41


- <210> 42
<211> 600
<212> DNA
<213> Homo sapiens - <400> 42

- <210> 43
<211> 600
<212> DNA
<213> Homo sapiens - <220>
<221> misc_feature
<222> (102)..(104)
<223> n is a, c, g, or t - <220>
<221> misc_feature
<222> (106)..(106)
<223> n is a, c, g, or t - <220>
<221> misc_feature
<222> (108)..(108)
<223> n is a, c, g, or t - <220>
<221> misc_feature
<222> (126)..(126)
<223> n is a, c, g, or t - <220>
<221> misc_feature
<222> (387)..(387)
<223> n is a, c, g, or t - <220>
<221> misc_feature
<222> (389)..(390)
<223> n is a, c, g, or t - <220>
<221> misc_feature
<222> (418)..(418)
<223> n is a, c, g, or t - <220>
<221> misc_feature
<222> (420)..(420)
<223> n is a, c, g, or t - <220>
<221> misc_feature
<222> (428)..(428)
<223> n is a, c, g, or t - <220>
<221> misc_feature
<222> (433)..(433)
<223> n is a, c, g, or t - <220>
<221> misc_feature
<222> (439)..(439)
<223> n is a, c, g, or t - <220>
<221> misc_feature
<222> (441)..(442)
<223> n is a, c, g, or t - <220>
<221> misc_feature
<222> (444)..(445)
<223> n is a, c, g, or t - <220>
<221> misc_feature
<222> (544)..(544)
<223> n is a, c, g, or t - <400> 43


- <210> 44
<211> 600
<212> DNA
<213> Homo sapiens - <220>
<221> misc_feature
<222> (166)..(166)
<223> n is a, c, g, or t - <400> 44

- <210> 45
<211> 497
<212> DNA
<213> Homo sapiens - <220>
<221> misc_feature
<222> (383)..(384)
<223> n is a, c, g, or t - <220>
<221> misc_feature
<222> (464)..(466)
<223> n is a, c, g, or t - <220>
<221> misc_feature
<222> (469)..(469)
<223> n is a, c, g, or t - <400> 45

- <210> 46
<211> 600
<212> DNA
<213> Homo sapiens - <400> 46

- <210> 47
<211> 600
<212> DNA
<213> Homo sapiens - <400> 47


- <210> 48
<211> 491
<212> DNA
<213> Homo sapiens - <400> 48

- <210> 49
<211> 600
<212> DNA
<213> Homo sapiens - <400> 49

- <210> 50
<211> 600
<212> DNA
<213> Homo sapiens - <400> 50

- <210> 51
<211> 600
<212> DNA
<213> Homo sapiens - <220>
<221> misc_feature
<222> (38)..(38)
<223> n is a, c, g, or t - <220>
<221> misc_feature
<222> (40)..(40)
<223> n is a, c, g, or t - <220>
<221> misc_feature
<222> (44)..(44)
<223> n is a, c, g, or t - <220>
<221> misc_feature
<222> (58)..(58)
<223> n is a, c, g, or t - <220>
<221> misc_feature
<222> (60)..(60)
<223> n is a, c, g, or t - <220>
<221> misc_feature
<222> (67)..(67)
<223> n is a, c, g, or t - <220>
<221> misc_feature
<222> (74)..(74)
<223> n is a, c, g, or t - <220>
<221> misc_feature
<222> (79)..(79)
<223> n is a, c, g, or t - <220>
<221> misc_feature
<222> (87)..(87)
<223> n is a, c, g, or t - <220>
<221> misc_feature
<222> (89)..(89)
<223> n is a, c, g, or t - <220>
<221> misc_feature
<222> (102)..(102)
<223> n is a, c, g, or t - <220>
<221> misc_feature
<222> (109)..(109)
<223> n is a, c, g, or t - <220>
<221> misc_feature
<222> (111)..(111)
<223> n is a, c, g, or t - <220>
<221> misc_feature
<222> (116)..(116)
<223> n is a, c, g, or t - <220>
<221> misc_feature
<222> (120)..(120)
<223> n is a, c, g, or t - <220>
<221> misc_feature
<222> (134)..(134)
<223> n is a, c, g, or t - <220>
<221> misc_feature
<222> (141)..(141)
<223> n is a, c, g, or t - <220>
<221> misc_feature
<222> (152)..(152)
<223> n is a, c, g, or t - <220>
<221> misc_feature
<222> (185)..(185)
<223> n is a, c, g, or t - <400> 51

- <210> 52
<211> 600
<212> DNA
<213> Homo sapiens - <400> 52

- <210> 53
<211> 600
<212> DNA
<213> Homo sapiens - <400> 53


- <210> 54
<211> 600
<212> DNA
<213> Homo sapiens - <400> 54

- <210> 55
<211> 600
<212> DNA
<213> Homo sapiens - <400> 55


- <210> 56
<211> 600
<212> DNA
<213> Homo sapiens - <400> 56

- <210> 57
<211> 340
<212> DNA
<213> Homo sapiens - <220>
<221> misc_feature
<222> (55)..(55)
<223> n is a, c, g, or t - <220>
<221> misc_feature
<222> (95)..(95)
<223> n is a, c, g, or t - <400> 57

- <210> 58
<211> 520
<212> DNA
<213> Homo sapiens - <220>
<221> misc_feature
<222> (413)..(413)
<223> n is a, c, g, or t - <220>
<221> misc_feature
<222> (416)..(416)
<223> n is a, c, g, or t - <220>
<221> misc_feature
<222> (418)..(419)
<223> n is a, c, g, or t - <400> 58

- <210> 59
<211> 600
<212> DNA
<213> Homo sapiens - <400> 59


- <210> 60
<211> 463
<212> DNA
<213> Homo sapiens - <220>
<221> misc_feature
<222> (302)..(302)
<223> n is a, c, g, or t - <220>
<221> misc_feature
<222> (362)..(362)
<223> n is a, c, g, or t - <220>
<221> misc_feature
<222> (419)..(419)
<223> n is a, c, g, or t - <220>
<221> misc_feature
<222> (439)..(439)
<223> n is a, c, g, or t - <400> 60

- <210> 61
<211> 600
<212> DNA
<213> Homo sapiens - <400> 61

- <210> 62
<211> 600
<212> DNA
<213> Homo sapiens - <400> 62

- <210> 63
<211> 600
<212> DNA
<213> Homo sapiens - <400> 63


- <210> 64
<211> 600
<212> DNA
<213> Homo sapiens - <400> 64

- <210> 65
<211> 427
<212> DNA
<213> Homo sapiens - <400> 65

- <210> 66
<211> 600
<212> DNA
<213> Homo sapiens - <400> 66


- <210> 67
<211> 600
<212> DNA
<213> Homo sapiens - <400> 67

- <210> 68
<211> 577
<212> DNA
<213> Homo sapiens - <400> 68


- <210> 69
<211> 600
<212> DNA
<213> Homo sapiens - <400> 69

- <210> 70
<211> 600
<212> DNA
<213> Homo sapiens - <400> 70

- <210> 71
<211> 600
<212> DNA
<213> Homo sapiens - <220>
<221> misc_feature
<222> (65)..(83)
<223> n is a, c, g, or t - <220>
<221> misc_feature
<222> (132)..(144)
<223> n is a, c, g, or t - <400> 71

- <210> 72
<211> 600
<212> DNA
<213> Homo sapiens - <400> 72

- <210> 73
<211> 600
<212> DNA
<213> Homo sapiens - <220>
<221> misc_feature
<222> (1)..(261)
<223> n is a, c, g, or t - <220>
<221> misc_feature
<222> (522)..(549)
<223> n is a, c, g, or t - <400> 73

- <210> 74
<211> 600
<212> DNA
<213> Homo sapiens - <220>
<221> misc_feature
<222> (1)..(44)
<223> n is a, c, g, or t - <220>
<221> misc_feature
<222> (95)..(121)
<223> n is a, c, g, or t - <220>
<221> misc_feature
<222> (144)..(172)
<223> n is a, c, g, or t - <400> 74


- <210> 75
<211> 600
<212> DNA
<213> Homo sapiens - <400> 75

- <210> 76
<211> 600
<212> DNA
<213> Homo sapiens - <400> 76


- <210> 77
<211> 600
<212> DNA
<213> Homo sapiens - <400> 77
- <210> 78
<211> 475
<212> DNA
<213> Homo sapiens - <220>
<221> misc_feature
<222> (14)..(14)
<223> n is a, c, g, or t - <400> 78


- <210> 79
<211> 600
<212> DNA
<213> Homo sapiens - <400> 79

- <210> 80
<211> 600
<212> DNA
<213> Homo sapiens - <400> 80

- <210> 81
<211> 600
<212> DNA
<213> Homo sapiens - <220>
<221> misc_feature
<222> (445)..(456)
<223> n is a, c, g, or t - <400> 81
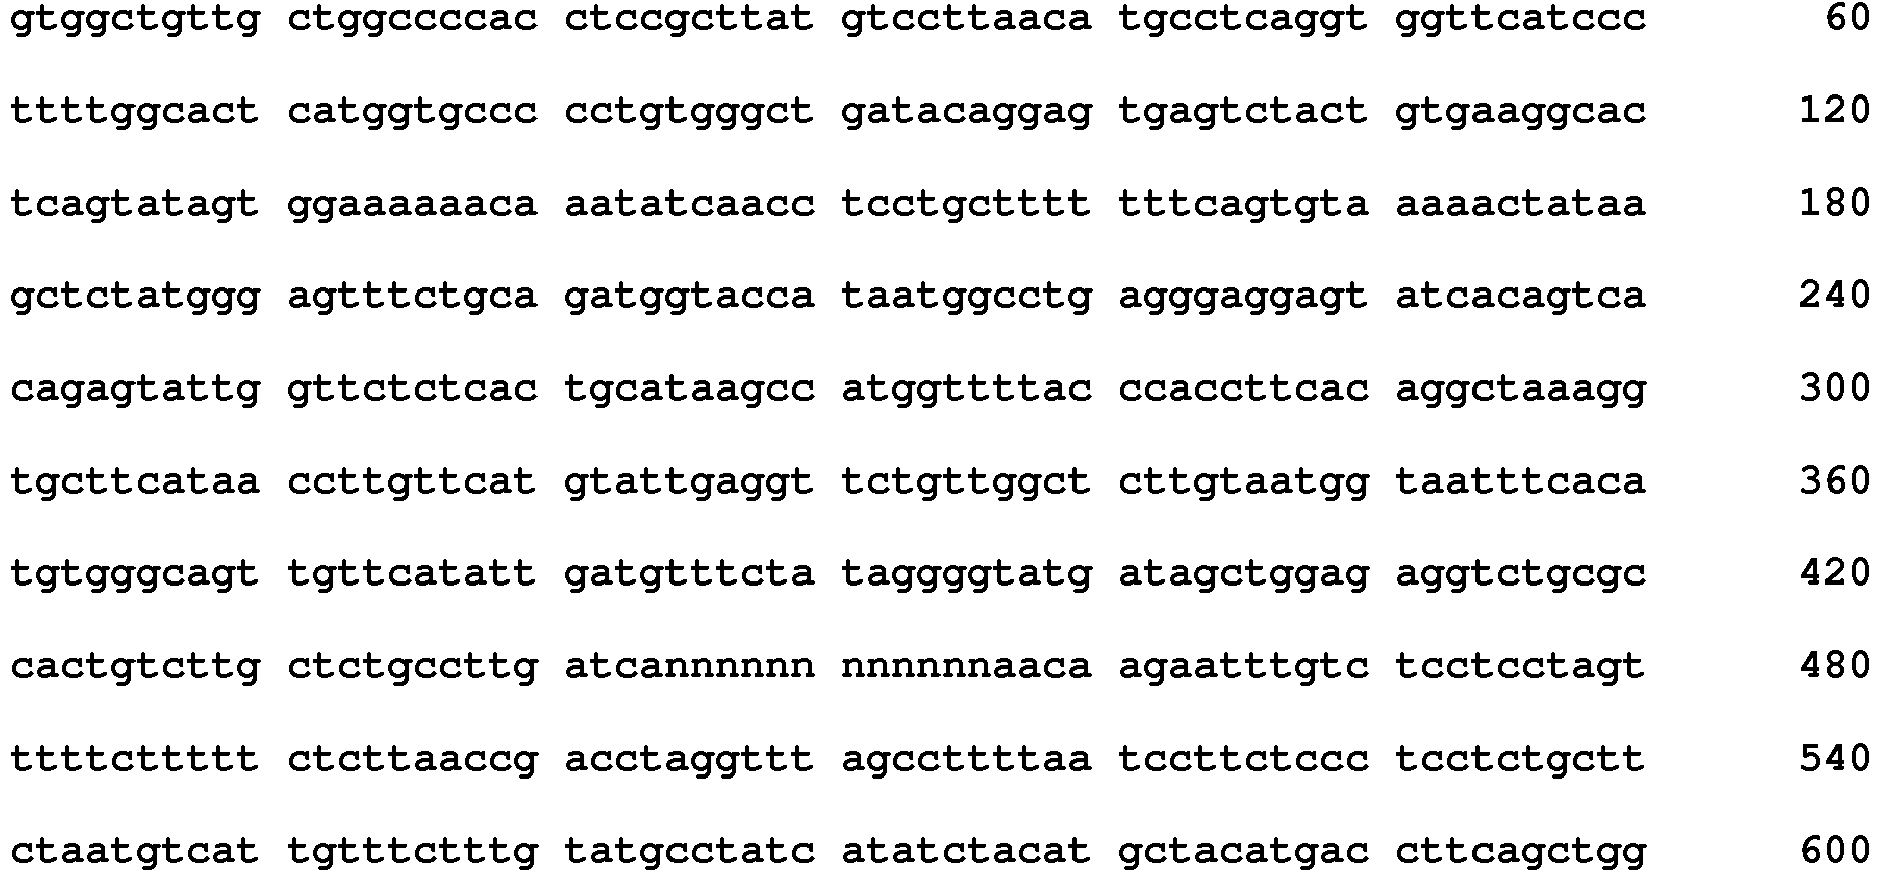
- <210> 82
<211> 600
<212> DNA
<213> Homo sapiens - <400> 82

- <210> 83
<211> 276
<212> DNA
<213> Homo sapiens - <400> 83


- <210> 84
<211> 184
<212> DNA
<213> Homo sapiens - <400> 84

- <210> 85
<211> 206
<212> DNA
<213> Homo sapiens - <400> 85

- <210> 86
<211> 268
<212> DNA
<213> Homo sapiens - <400> 86

- <210> 87
<211> 234
<212> DNA
<213> Homo sapiens - <400> 87


- <210> 88
<211> 231
<212> DNA
<213> Homo sapiens - <400> 88

- <210> 89
<211> 241
<212> DNA
<213> Homo sapiens - <400> 89

- <210> 90
<211> 199
<212> DNA
<213> Homo sapiens - <400> 90

- <210> 91
<211> 210
<212> DNA
<213> Homo sapiens - <220>
<221> misc_feature
<222> (70)..(70)
<223> n is a, c, g, or t - <400> 91

- <210> 92
<211> 148
<212> DNA
<213> Homo sapiens - <400> 92

- <210> 93
<211> 227
<212> DNA
<213> Homo sapiens - <400> 93

- <210> 94
<211> 245
<212> DNA
<213> Homo sapiens - <400> 94

- <210> 95
<211> 221
<212> DNA
<213> Homo sapiens - <400> 95

- <210> 96
<211> 176
<212> DNA
<213> Homo sapiens - <400> 96

- <210> 97
<211> 219
<212> DNA
<213> Homo sapiens - <400> 97

- <210> 98
<211> 171
<212> DNA
<213> Homo sapiens - <400> 98

- <210> 99
<211> 262
<212> DNA
<213> Homo sapiens - <400> 99


- <210> 100
<211> 248
<212> DNA
<213> Homo sapiens - <400> 100

- <210> 101
<211> 252
<212> DNA
<213> Homo sapiens - <220>
<221> misc_feature
<222> (123)..(124)
<223> n is a, c, g, or t - <400> 101

- <210> 102
<211> 224
<212> DNA
<213> Homo sapiens - <400> 102

- <210> 103
<211> 266
<212> DNA
<213> Homo sapiens - <400> 103

- <210> 104
<211> 251
<212> DNA
<213> Homo sapiens - <400> 104

- <210> 105
<211> 247
<212> DNA
<213> Homo sapiens - <220>
<221> misc_feature
<222> (55)..(57)
<223> n is a, c, g, or t - <220>
<221> misc_feature
<222> (60)..(60)
<223> n is a, c, g, or t - <220>
<221> misc_feature
<222> (105)..(105)
<223> n is a, c, g, or t - <220>
<221> misc_feature
<222> (109)..(109)
<223> n is a, c, g, or t - <220>
<221> misc_feature
<222> (115)..(115)
<223> n is a, c, g, or t - <220>
<221> misc_feature
<222> (120)..(120)
<223> n is a, c, g, or t - <220>
<221> misc_feature
<222> (122)..(122)
<223> n is a, c, g, or t - <220>
<221> misc_feature
<222> (133)..(133)
<223> n is a, c, g, or t - <220>
<221> misc_feature
<222> (139)..(141)
<223> n is a, c, g, or t - <400> 105

- <210> 106
<211> 211
<212> DNA
<213> Homo sapiens - <400> 106

- <210> 107
<211> 187
<212> DNA
<213> Homo sapiens - <220>
<221> misc_feature
<222> (146)..(146)
<223> n is a, c, g, or t - <400> 107


- <210> 108
<211> 234
<212> DNA
<213> Homo sapiens - <220>
<221> misc_feature
<222> (120)..(120)
<223> n is a, c, g, or t - <220>
<221> misc_feature
<222> (148)..(148)
<223> n is a, c, g, or t - <220>
<221> misc_feature
<222> (194)..(194)
<223> n is a, c, g, or t - <400> 108

- <210> 109
<211> 248
<212> DNA
<213> Homo sapiens - <400> 109

- <210> 110
<211> 277
<212> DNA
<213> Homo sapiens - <400> 110


- <210> 111
<211> 245
<212> DNA
<213> Homo sapiens - <400> 111

- <210> 112
<211> 284
<212> DNA
<213> Homo sapiens - <400> 112

- <210> 113
<211> 290
<212> DNA
<213> Homo sapiens - <400> 113

- <210> 114
<211> 270
<212> DNA
<213> Homo sapiens - <400> 114


- <210> 115
<211> 230
<212> DNA
<213> Homo sapiens - <400> 115

- <210> 116
<211> 283
<212> DNA
<213> Homo sapiens - <400> 116

- <210> 117
<211> 111
<212> DNA
<213> Homo sapiens - <400> 117

- <210> 118
<211> 238
<212> DNA
<213> Homo sapiens - <400> 118


- <210> 119
<211> 299
<212> DNA
<213> Homo sapiens - <400> 119

- <210> 120
<211> 294
<212> DNA
<213> Homo sapiens - <400> 120

- <210> 121
<211> 269
<212> DNA
<213> Homo sapiens - <400> 121

- <210> 122
<211> 287
<212> DNA
<213> Homo sapiens - <400> 122


- <210> 123
<211> 275
<212> DNA
<213> Homo sapiens - <400> 123

- <210> 124
<211> 276
<212> DNA
<213> Homo sapiens - <400> 124

- <210> 125
<211> 292
<212> DNA
<213> Homo sapiens - <400> 125

- <210> 126
<211> 237
<212> DNA
<213> Homo sapiens - <400> 126

- <210> 127
<211> 285
<212> DNA
<213> Homo sapiens - <400> 127

- <210> 128
<211> 233
<212> DNA
<213> Homo sapiens - <400> 128

- <210> 129
<211> 270
<212> DNA
<213> Homo sapiens - <400> 129

- <210> 130
<211> 79
<212> DNA
<213> Homo sapiens - <400> 130

- <210> 131
<211> 256
<212> DNA
<213> Homo sapiens - <400> 131

- <210> 132
<211> 94
<212> DNA
<213> Homo sapiens - <400> 132

- <210> 133
<211> 254
<212> DNA
<213> Homo sapiens - <400> 133

- <210> 134
<211> 298
<212> DNA
<213> Homo sapiens - <400> 134


- <210> 135
<211> 292
<212> DNA
<213> Homo sapiens - <400> 135

- <210> 136
<211> 180
<212> DNA
<213> Homo sapiens - <400> 136

- <210> 137
<211> 141
<212> DNA
<213> Homo sapiens - <400> 137

- <210> 138
<211> 248
<212> DNA
<213> Homo sapiens - <220>
<221> misc_feature
<222> (161)..(200)
<223> n is a, c, g, or t - <400> 138

- <210> 139
<211> 259
<212> DNA
<213> Homo sapiens - <400> 139

- <210> 140
<211> 199
<212> DNA
<213> Homo sapiens - <400> 140

- <210> 141
<211> 279
<212> DNA
<213> Homo sapiens - <400> 141

- <210> 142
<211> 198
<212> DNA
<213> Homo sapiens - <400> 142

- <210> 143
<211> 183
<212> DNA
<213> Homo sapiens - <400> 143

- <210> 144
<211> 294
<212> DNA
<213> Homo sapiens - <400> 144

- <210> 145
<211> 231
<212> DNA
<213> Homo sapiens - <400> 145

- <210> 146
<211> 175
<212> DNA
<213> Homo sapiens - <400> 146

- <210> 147
<211> 192
<212> DNA
<213> Homo sapiens - <400> 147

- <210> 148
<211> 187
<212> DNA
<213> Homo sapiens - <400> 148

- <210> 149
<211> 254
<212> DNA
<213> Homo sapiens - <400> 149

- <210> 150
<211> 192
<212> DNA
<213> Homo sapiens - <400> 150

- <210> 151
<211> 157
<212> DNA
<213> Homo sapiens - <400> 151

- <210> 152
<211> 187
<212> DNA
<213> Homo sapiens - <400> 152

- <210> 153
<211> 102
<212> DNA
<213> Homo sapiens - <400> 153

- <210> 154
<211> 203
<212> DNA
<213> Homo sapiens - <400> 154

- <210> 155
<211> 273
<212> DNA
<213> Homo sapiens - <400> 155

- <210> 156
<211> 135
<212> DNA
<213> Homo sapiens - <400> 156

- <210> 157
<211> 218
<212> DNA
<213> Homo sapiens - <400> 157

- <210> 158
<211> 132
<212> DNA
<213> Homo sapiens - <400> 158

- <210> 159
<211> 129
<212> DNA
<213> Homo sapiens - <400> 159

- <210> 160
<211> 229
<212> DNA
<213> Homo sapiens - <400> 160

- <210> 161
<211> 181
<212> DNA
<213> Homo sapiens - <400> 161

- <210> 162
<211> 280
<212> DNA
<213> Homo sapiens - <400> 162

- <210> 163
<211> 166
<212> DNA
<213> Homo sapiens - <400> 163


- <210> 164
<211> 136
<212> DNA
<213> Homo sapiens - <400> 164

- <210> 165
<211> 237
<212> DNA
<213> Homo sapiens - <400> 165

- <210> 166
<211> 86
<212> DNA
<213> Homo sapiens - <400> 166

- <210> 167
<211> 159
<212> DNA
<213> Homo sapiens - <400> 167

- <210> 168
<211> 175
<212> DNA
<213> Homo sapiens - <400> 168

- <210> 169
<211> 191
<212> DNA
<213> Homo sapiens - <400> 169

- <210> 170
<211> 172
<212> DNA
<213> Homo sapiens - <400> 170

- <210> 171
<211> 239
<212> DNA
<213> Homo sapiens - <400> 171

- <210> 172
<211> 255
<212> DNA
<213> Homo sapiens - <400> 172


- <210> 173
<211> 238
<212> DNA
<213> Homo sapiens - <400> 173

- <210> 174
<211> 230
<212> DNA
<213> Homo sapiens - <400> 174

- <210> 175
<211> 166
<212> DNA
<213> Homo sapiens - <400> 175

- <210> 176
<211> 137
<212> DNA
<213> Homo sapiens - <400> 176

- <210> 177
<211> 227
<212> DNA
<213> Homo sapiens - <400> 177

- <210> 178
<211> 218
<212> DNA
<213> Homo sapiens - <400> 178

- <210> 179
<211> 243
<212> DNA
<213> Homo sapiens - <400> 179

- <210> 180
<211> 267
<212> DNA
<213> Homo sapiens - <400> 180

- <210> 181
<211> 267
<212> DNA
<213> Homo sapiens - <400> 181

- <210> 182
<211> 206
<212> DNA
<213> Homo sapiens - <400> 182

- <210> 183
<211> 264
<212> DNA
<213> Homo sapiens - <400> 183

- <210> 184
<211> 226
<212> DNA
<213> Homo sapiens - <400> 184

- <210> 185
<211> 275
<212> DNA
<213> Homo sapiens - <400> 185

- <210> 186
<211> 275
<212> DNA
<213> Homo sapiens - <400> 186

- <210> 187
<211> 114
<212> DNA
<213> Homo sapiens - <400> 187

- <210> 188
<211> 205
<212> DNA
<213> Homo sapiens - <400> 188

- <210> 189
<211> 158
<212> DNA
<213> Homo sapiens - <400> 189

- <210> 190
<211> 254
<212> DNA
<213> Homo sapiens - <400> 190

- <210> 191
<211> 235
<212> DNA
<213> Homo sapiens - <400> 191

- <210> 192
<211> 296
<212> DNA
<213> Homo sapiens - <400> 192

- <210> 193
<211> 290
<212> DNA
<213> Homo sapiens - <400> 193

- <210> 194
<211> 269
<212> DNA
<213> Homo sapiens - <400> 194

- <210> 195
<211> 215
<212> DNA
<213> Homo sapiens - <400> 195

- <210> 196
<211> 269
<212> DNA
<213> Homo sapiens - <400> 196

- <210> 197
<211> 268
<212> DNA
<213> Homo sapiens - <400> 197

- <210> 198
<211> 258
<212> DNA
<213> Homo sapiens - <400> 198

- <210> 199
<211> 147
<212> DNA
<213> Homo sapiens - <400> 199

- <210> 200
<211> 274
<212> DNA
<213> Homo sapiens - <400> 200

- <210> 201
<211> 155
<212> DNA
<213> Homo sapiens - <400> 201

- <210> 202
<211> 275
<212> DNA
<213> Homo sapiens - <400> 202

- <210> 203
<211> 23
<212> DNA
<213> Homo sapiens - <400> 203
agagacatct gtatgcattc ctg 23 - <210> 204
<211> 25
<212> DNA
<213> Homo sapiens - <400> 204
ggtattttga ggtcttttgt attgc 25 - <210> 205
<211> 25
<212> DNA
<213> Homo sapiens - <400> 205
acccattgta acagagccac aaact 25 - <210> 206
<211> 22
<212> DNA
<213> Homo sapiens - <400> 206
tctcaggtca tgtgtagatg cg 22 - <210> 207
<211> 25
<212> DNA
<213> Homo sapiens - <400> 207
ctccagagtc tcttaagcag atagg 25 - <210> 208
<211> 25
<212> DNA
<213> Homo sapiens - <400> 208
agacccaggc acaccaatca cttga 25 - <210> 209
<211> 21
<212> DNA
<213> Homo sapiens - <400> 209
aacaacagat gcaggaacagg 21 - <210> 210
<211> 18
<212> DNA
<213> Homo sapiens - <400> 210
agtcctctgg gcgtgctg 18 - <210> 211
<211> 25
<212> DNA
<213> Homo sapiens - <400> 211
cacagctcag cacaacattc caagc 25 - <210> 212
<211> 23
<212> DNA
<213> Homo sapiens - <400> 212
ctgcatactt ggacactaaa gcc 23 - <210> 213
<211> 24
<212> DNA
<213> Homo sapiens - <400> 213
atgttttcct cactcacact gaac 24 - <210> 214
<211> 25
<212> DNA
<213> Homo sapiens - <400> 214
agcaacaaag cagccacagt ttcag 25 - <210> 215
<211> 23
<212> DNA
<213> Homo sapiens - <400> 215
acagaaagac tgagctcaag gtg 23 - <210> 216
<211> 18
<212> DNA
<213> Homo sapiens - <400> 216
tgcaggcact gtgcttgg 18 - <210> 217
<211> 25
<212> DNA
<213> Homo sapiens - <400> 217
aaccacgtct gctaacttgg agccc 25 - <210> 218
<211> 25
<212> DNA
<213> Homo sapiens - <400> 218
tgtaaaaagc aaaatctctc tgtcc 25 - <210> 219
<211> 24
<212> DNA
<213> Homo sapiens - <400> 219
agtccaatct ctccagtgag taac 24 - <210> 220
<211> 25
<212> DNA
<213> Homo sapiens - <400> 220
aatggaagcg attctcccat gctca 25 - <210> 221
<211> 22
<212> DNA
<213> Homo sapiens - <400> 221
gaccaggtgt ctctaaaaaccc 22 - <210> 222
<211> 25
<212> DNA
<213> Homo sapiens - <400> 222
ttgcctgctg tatatgagta atgag 25 - <210> 223
<211> 25
<212> DNA
<213> Homo sapiens - <400> 223
cctggagagt atgcgagaac ctacc 25 - <210> 224
<211> 23
<212> DNA
<213> Homo sapiens - <400> 224
gaagacgtgg attttcctgg aag 23 - <210> 225
<211> 25
<212> DNA
<213> Homo sapiens - <400> 225
tccaagtctt ccagtaaatc aagtc 25 - <210> 226
<211> 25
<212> DNA
<213> Homo sapiens - <400> 226
tccagcaaat ccagtcttcc agcaa 25 - <210> 227
<211> 25
<212> DNA
<213> Homo sapiens - <400> 227
aacaaatcat caacttccac tggtc 25 - <210> 228
<211> 25
<212> DNA
<213> Homo sapiens - <400> 228
tggagggaat ctttggagat tagtg 25 - <210> 229
<211> 25
<212> DNA
<213> Homo sapiens - <400> 229
tctaatcttg gggcctcaga caccc 25 - <210> 230
<211> 23
<212> DNA
<213> Homo sapiens - <400> 230
gacattgagg acctcatcca aac 23 - <210> 231
<211> 25
<212> DNA
<213> Homo sapiens - <400> 231
gacagaggca ttacttttga agatc 25 - <210> 232
<211> 25
<212> DNA
<213> Homo sapiens - <400> 232
ttgacttgtt cccccttcac actca 25 - <210> 233
<211> 25
<212> DNA
<213> Homo sapiens - <400> 233
ctcagttctc ctcttttgga acaac 25 - <210> 234
<211> 23
<212> DNA
<213> Homo sapiens - <400> 234
ttgaacccag attttccatt ggc 23 - <210> 235
<211> 25
<212> DNA
<213> Homo sapiens - <400> 235
tctacgcctc tggggatatc tgctc 25 - <210> 236
<211> 21
<212> DNA
<213> Homo sapiens - <400> 236
tggcactgtg gattctcaagg 21 - <210> 237
<211> 19
<212> DNA
<213> Homo sapiens - <400> 237
ctgggggtat gggcaggag 19 - <210> 238
<211> 25
<212> DNA
<213> Homo sapiens - <400> 238
caccagcgga ccagtttcag aggca 25 - <210> 239
<211> 25
<212> DNA
<213> Homo sapiens - <400> 239
ctaatacagc tggtggagtt ctatc 25 - <210> 240
<211> 25
<212> DNA
<213> Homo sapiens - <400> 240
agcaatccta gcacaataat gtttc 25 - <210> 241
<211> 25
<212> DNA
<213> Homo sapiens - <400> 241
actcaataag ggcgttcttc cttgc 25 - <210> 242
<211> 25
<212> DNA
<213> Homo sapiens - <400> 242
aggaattttt accaaaacca caagc 25 - <210> 243
<211> 25
<212> DNA
<213> Homo sapiens - <400> 243
aacagaacct ttacaaaacc ctacc 25 - <210> 244
<211> 24
<212> DNA
<213> Homo sapiens - <400> 244
aacagaccac cacgaccaac aaca 24 - <210> 245
<211> 23
<212> DNA
<213> Homo sapiens - <400> 245
ttggtgtgac agtgttcttt gtg 23 - <210> 246
<211> 25
<212> DNA
<213> Homo sapiens - <400> 246
aggaggagtt aggacttagg aatag 25 - <210> 247
<211> 25
<212> DNA
<213> Homo sapiens - <400> 247
tgccttgctc agccacaatt cttgc 25 - <210> 248
<211> 25
<212> DNA
<213> Homo sapiens - <400> 248
tgtggatttg aatgtgtgta caagc 25 - <210> 249
<211> 24
<212> DNA
<213> Homo sapiens - <400> 249
ggcaccataa agccacttaatagg 24 - <210> 250
<211> 24
<212> DNA
<213> Homo sapiens - <400> 250
aagagccatg ccactcctac ccgg 24 - <210> 251
<211> 22
<212> DNA
<213> Homo sapiens - <400> 251
ccctcactga gcctcagatt tc 22 - <210> 252
<211> 19
<212> DNA
<213> Homo sapiens - <400> 252
gccgcctgga agcactaac 19 - <210> 253
<211> 25
<212> DNA
<213> Homo sapiens - <400> 253
tcccatttcc tgcctcagcc cattt 25 - <210> 254
<211> 18
<212> DNA
<213> Homo sapiens - <400> 254
ggctggtctg ccccctag 18 - <210> 255
<211> 22
<212> DNA
<213> Homo sapiens - <400> 255
accattgggt ctctgcaaatcc 22 - <210> 256
<211> 25
<212> DNA
<213> Homo sapiens - <400> 256
actccgtcgc tccaattact tccga 25 - <210> 257
<211> 25
<212> DNA
<213> Homo sapiens - <400> 257
aggacgagct atagaaaagc tattg 25 - <210> 258
<211> 24
<212> DNA
<213> Homo sapiens - <400> 258
cattcaaaag cacagaagca catc 24 - <210> 259
<211> 25
<212> DNA
<213> Homo sapiens - <400> 259
caccagcaag gtttccaact actgc 25 - <210> 260
<211> 25
<212> DNA
<213> Homo sapiens - <400> 260
ttttccaggc taaagcaaat gaaag 25 - <210> 261
<211> 24
<212> DNA
<213> Homo sapiens - <400> 261
ctatcctagc accattgttg catg 24 - <210> 262
<211> 25
<212> DNA
<213> Homo sapiens - <400> 262
ttgctggtat caacacagcc tgcca 25 - <210> 263
<211> 23
<212> DNA
<213> Homo sapiens - <400> 263
tgagtgagac tgagggatcg tag 23 - <210> 264
<211> 19
<212> DNA
<213> Homo sapiens - <400> 264
gtggttggca ggagcaagc 19 - <210> 265
<211> 25
<212> DNA
<213> Homo sapiens - <400> 265
cacactctca cactcgcacc cagaa 25 - <210> 266
<211> 21
<212> DNA
<213> Homo sapiens - <400> 266
accagagggg agcaaaatcg a 21 - <210> 267
<211> 20
<212> DNA
<213> Homo sapiens - <400> 267
tgcctctccc atcacttccc 20 - <210> 268
<211> 27
<212> DNA
<213> Homo sapiens - <400> 268
cctctgtgtg gtccatcctt ggaagca 27 - <210> 269
<211> 21
<212> DNA
<213> Homo sapiens - <400> 269
cagcacctga tggcctatcac 21 - <210> 270
<211> 24
<212> DNA
<213> Homo sapiens - <400> 270
cagttcttca tgctccagac gtac 24 - <210> 271
<211> 25
<212> DNA
<213> Homo sapiens - <400> 271
cgcatctcca gccacatccc tttga 25 - <210> 272
<211> 25
<212> DNA
<213> Homo sapiens - <400> 272
cctcttgagg aaactggtgc aattg 25 - <210> 273
<211> 22
<212> DNA
<213> Homo sapiens - <400> 273
tgattctgac atttggccca gc 22 - <210> 274
<211> 27
<212> DNA
<213> Homo sapiens - <400> 274
tctcaaatgc agggctgtaa cgctctc 27 - <210> 275
<211> 22
<212> DNA
<213> Homo sapiens - <400> 275
gctagagcag gacttcgtctcc 22 - <210> 276
<211> 23
<212> DNA
<213> Homo sapiens - <400> 276
gagaagatct ggccttatgc cca 23 - <210> 277
<211> 25
<212> DNA
<213> Homo sapiens - <400> 277
tctctggaac agctcatcgc cgcat 25 - <210> 278
<211> 24
<212> DNA
<213> Homo sapiens - <400> 278
ggaaggctgc gacttgttaa tcaa 24 - <210> 279
<211> 20
<212> DNA
<213> Homo sapiens - <400> 279
ctcctgacaa acacagcccc 20 - <210> 280
<211> 25
<212> DNA
<213> Homo sapiens - <400> 280
ccgtggtggt ctttatcctc ccgcc 25 - <210> 281
<211> 25
<212> DNA
<213> Homo sapiens - <400> 281
gagagtggac ctggagaaga atcag 25 - <210> 282
<211> 21
<212> DNA
<213> Homo sapiens - <400> 282
tagcatccaa gtcatccgcct 21 - <210> 283
<211> 23
<212> DNA
<213> Homo sapiens - <400> 283
agtccttcag ccaggagcca ggc 23 - <210> 284
<211> 25
<212> DNA
<213> Homo sapiens - <400> 284
gttcgggatt cgatggattc tttgg 25 - <210> 285
<211> 25
<212> DNA
<213> Homo sapiens - <400> 285
ccaaggccat cattgtattc tctgc 25 - <210> 286
<211> 23
<212> DNA
<213> Homo sapiens - <400> 286
tctccatcca ccgaagcccc tgt 23 - <210> 287
<211> 20
<212> DNA
<213> Homo sapiens - <400> 287
gcagcacctt caaccctcag 20 - <210> 288
<211> 23
<212> DNA
<213> Homo sapiens - <400> 288
tctctgaaca acgagaaggt get 23 - <210> 289
<211> 24
<212> DNA
<213> Homo sapiens - <400> 289
cctacgagca cctgaccgca gagt 24 - <210> 290
<211> 22
<212> DNA
<213> Homo sapiens - <400> 290
agccgctctg tttattggat gg 22 - <210> 291
<211> 24
<212> DNA
<213> Homo sapiens - <400> 291
tctgacaaca acaaaacacc caga 24 - <210> 292
<211> 27
<212> DNA
<213> Homo sapiens - <400> 292
acaccaccaa ttatgcacag tgaggct 27 - <210> 293
<211> 25
<212> DNA
<213> Homo sapiens - <400> 993
tggctccaag aagaagtttg acaag 25 - <210> 294
<211> 25
<212> DNA
<213> Homo sapiens - <400> 294
tccttcagga aattcaggta cggat 25 - <210> 295
<211> 26
<212> DNA
<213> Homo sapiens - <400> 295
cctgactgct tgctgcaacc agaacc 26 - <210> 296
<211> 23
<212> DNA
<213> Homo sapiens - <400> 296
agtggagggg tttgtacaag aca 23 - <210> 297
<211> 24
<212> DNA
<213> Homo sapiens - <400> 297
caaatgggac ttagactgga ggct 24 - <210> 298
<211> 25
<212> DNA
<213> Homo sapiens - <400> 298
cgcctcatct tccagaacca caggg 25 - <210> 299
<211> 24
<212> DNA
<213> Homo sapiens - <400> 299
ccacaagcaa accagctttc tttg 24 - <210> 300
<211> 25
<212> DNA
<213> Homo sapiens - <400> 300
tgatcaggat tatggtttcc cgttc 25 - <210> 301
<211> 26
<212> DNA
<213> Homo sapiens - <400> 301
tggcgagttc caacaccttt catggc 26 - <210> 302
<211> 23
<212> DNA
<213> Homo sapiens - <400> 302
ggaagaggac atgacggaac aga 23 - <210> 303
<211> 25
<212> DNA
<213> Homo sapiens - <400> 303
gtgttccagt gcctcttaat tgagg 25 - <210> 304
<211> 27
<212> DNA
<213> Homo sapiens - <400> 304
caaagcacta aaccctgtcc gctggaa 27 - <210> 305
<211> 18
<212> DNA
<213> Homo sapiens - <400> 305
ctgcagcagc agcaccag 18 - <210> 306
<211> 25
<212> DNA
<213> Homo sapiens - <400> 306
catcaggcac atgagtaaca aaggc 25 - <210> 307
<211> 24
<212> DNA
<213> Homo sapiens - <400> 307
cccagctcct cctcatcctc tccc 24 - <210> 308
<211> 23
<212> DNA
<213> Homo sapiens - <400> 308
gcagagatgg gaagtgaaag age 23 - <210> 309
<211> 25
<212> DNA
<213> Homo sapiens - <400> 309
tcaatgcctc agaaattcat tggtg 25 - <210> 310
<211> 27
<212> DNA
<213> Homo sapiens - <400> 310
tgccacattg cttgctaatc tgtccag 27 - <210> 311
<211> 23
<212> DNA
<213> Homo sapiens - <400> 311
gacagcttct tgcagcgata cag 23 - <210> 312
<211> 19
<212> DNA
<213> Homo sapiens - <400> 312
ccttcctccc agtgcctga 19 - <210> 313
<211> 27
<212> DNA
<213> Homo sapiens - <400> 313
tcgtctatgc tgtcctcagt caaggcg 27 - <210> 314
<211> 24
<212> DNA
<213> Homo sapiens - <400> 314
agagcacttc ctcatagacc ttgg 24 - <210> 315
<211> 21
<212> DNA
<213> Homo sapiens - <400> 315
ttcaagccag gaagaagcagc 21 - <210> 316
<211> 27
<212> DNA
<213> Homo sapiens - <400> 316
tgcattcagt ctagttcctg gttgccg 27 - <210> 317
<211> 20
<212> DNA
<213> Homo sapiens - <400> 317
gcaagatggg ctacctggac 20 - <210> 318
<211> 20
<212> DNA
<213> Homo sapiens - <400> 318
ttaagcagac ctccccagga 20 - <210> 319
<211> 25
<212> DNA
<213> Homo sapiens - <400> 319
acccgcacaa tctgctcatt cctcg 25 - <210> 320
<211> 24
<212> DNA
<213> Homo sapiens - <400> 320
tctccttagg gaagcggatt tgtc 24 - <210> 321
<211> 22
<212> DNA
<213> Homo sapiens - <400> 321
ttcttcacca ccatcctccaga 22 - <210> 322
<211> 24
<212> DNA
<213> Homo sapiens - <400> 322
catcgcccgt gcggaattgt tcct 24 - <210> 323
<211> 20
<212> DNA
<213> Homo sapiens - <400> 323
ctggccatct gcaagctgag 20 - <210> 324
<211> 22
<212> DNA
<213> Homo sapiens - <400> 324
cagttcagcc ttcagttggt gg 22 - <210> 325
<211> 27
<212> DNA
<213> Homo sapiens - <400> 325
agcaaggaag ccaatccaag tcaccaa 27 - <210> 326
<211> 24
<212> DNA
<213> Homo sapiens - <400> 326
acccatatac caccactgga ttcc 24 - <210> 327
<211> 23
<212> DNA
<213> Homo sapiens - <400> 327
cagtttggga atgcatggac acc 23 - <210> 328
<211> 27
<212> DNA
<213> Homo sapiens - <400> 328
acctcctcct ctctcagacc gagttgg 27 - <210> 329
<211> 25
<212> RNA
<213> Homo sapiens - <400> 329
cagcggcugu auauucuccu cccuu 25 - <210> 330
<211> 21
<212> RNA
<213> Homo sapiens - <400> 330
ggucauauua caucggauauu 21 - <210> 331
<211> 21
<212> RNA
<213> Homo sapiens - <400> 331
ggaaauauca ugcguguuauu 21 - <210> 332
<211> 21
<212> RNA
<213> Homo sapiens - <400> 332
uggugcagcu agagaauuauu 21 - <210> 333
<211> 21
<212> RNA
<213> Homo sapiens - <400> 333
ccucugagaa cccacugaauu 21 - <210> 334
<211> 21
<212> RNA
<213> Homo sapiens - <400> 334
ggacaauccc acucccuucuu 21 - <210> 335
<211> 21
<212> RNA
<213> Homo sapiens - <400> 335
agagaaaugu ugcaggaaauu 21 - <210> 336
<211> 25
<212> RNA
<213> Homo sapiens - <400> 336
cagcuucuaa gaugcuguca aaguu 25 - <210> 337
<211> 21
<212> RNA
<213> Homo sapiens - <400> 337
ccuaucggaa gaaggcaaguu 21 - <210> 338
<211> 21
<212> RNA
<213> Homo sapiens - <400> 338
cauacagcuu cauaaauaauu 21 - <210> 339
<211> 21
<212> RNA
<213> Homo sapiens - <400> 339
ggacacaauu acaacuaaauu 21 - <210> 340
<211> 21
<212> RNA
<213> Homo sapiens - <400> 340
ggaggaauau cguagguaauu 21 - <210> 341
<211> 21
<212> RNA
<213> Homo sapiens - <400> 341
gcagauucau gaagagaaauu 21 - <210> 342
<211> 21
<212> RNA
<213> Homo sapiens - <400> 342
gguuaaagca cauuguagauu 21 - <210> 343
<211> 25
<212> DNA
<213> Homo sapiens - <400> 343
ggccatcaag aatttactga aagca 25 - <210> 344
<211> 22
<212> DNA
<213> Homo sapiens - <400> 344
tctgtgtggt ccatccttggaa 22 - <210> 345
<211> 21
<212> DNA
<213> Homo sapiens - <400> 345
tgcccacatc aaggagtattt 21 - <210> 346
<211> 19
<212> DNA
<213> Homo sapiens - <400> 346
ctttcgggtg acaaagacg 19 - <210> 347
<211> 21
<212> DNA
<213> Homo sapiens - <400> 347
catctgcaaa tcgtgactaag 21 - <210> 348
<211> 24
<212> DNA
<213> Homo sapiens - <400> 348
cagtcgacac attaaccttc cttc 24 - <210> 349
<211> 25
<212> DNA
<213> Homo sapiens - <400> 349
ggcatccaag atacaaactc aaaga 25 - <210> 350
<211> 23
<212> DNA
<213> Homo sapiens - <400> 350
agttccaatg ctggattacg tct 23 - <210> 351
<211> 24
<212> DNA
<213> Homo sapiens - <400> 351
ccagaaagct cttgagttta ttcc 24 - <210> 352
<211> 22
<212> DNA
<213> Homo sapiens - <400> 352
catctagttc ccgaaccatctc 22 - <210> 353
<211> 20
<212> DNA
<213> Homo sapiens - <400> 353
ctcaacccgc tcatctacac 20 - <210> 354
<211> 22
<212> DNA
<213> Homo sapiens - <400> 354
tccttgggtt ctggcttaatac 22 - <210> 355
<211> 25
<212> DNA
<213> Homo sapiens - <400> 355
tcgctgcccc cttcactttc ttatt 25 - <210> 356
<211> 20
<212> DNA
<213> Homo sapiens - <400> 356
tgcttcatgt tagtccccag 20 - <210> 357
<211> 22
<212> DNA
<213> Homo sapiens - <400> 357
gggtctcact atattgctct gg 22 - <210> 358
<211> 24
<212> DNA
<213> Homo sapiens - <400> 358
cctcagcctt ccaaaaccag gtgt 24
Claims (23)
- A method for predicting responsiveness to an antagonist of an inhibitory immune checkpoint and/or an agonist of a stimulatory immune checkpoint comprising:
determining the RNA expression level of at least one gene selected from Table 2B in a sample comprising cancer cells or nucleic acids derived therefrom from the subject wherein the determined RNA expression level is used to identify the subject as having a cancer in which the STING/TBK1/IRF3 pathway is activated due to a deficiency in DNA damage repair and thereby predict responsiveness to an antagonist of an inhibitory immune checkpoint and/or an agonist of a stimulatory immune checkpoint. - A method for predicting responsiveness to an antagonist of an inhibitory immune checkpoint and/or an agonist of a stimulatory immune checkpoint in combination with a DNA damage therapeutic agent comprising:
determining the RNA expression level of at least one gene selected from Table 2B in a sample comprising cancer cells or nucleic acids derived therefrom from the subject wherein the determined RNA expression level is used to identify the subject as having a cancer in which the STING/TBK1/IRF3 pathway is activated due to a deficiency in DNA damage repair and thereby predict responsiveness to an antagonist of an inhibitory immune checkpoint and/or an agonist of a stimulatory immune checkpoint in combination with a DNA damage therapeutic agent. - A method for identifying a cancer that can be effectively treated with an antagonist of an inhibitory immune checkpoint and/or an agonist of a stimulatory immune checkpoint comprising:
determining the RNA expression level of at least one gene selected from Table 2B in a sample comprising cancer cells or nucleic acids derived therefrom from the subject wherein the determined RNA expression level is used to identify the subject as having a cancer in which the STING/TBK1/IRF3 pathway is activated due to a deficiency in DNA damage repair and thereby identify a cancer that can be effectively treated with an antagonist of an inhibitory immune checkpoint and/or an agonist of a stimulatory immune checkpoint. - A method for identifying a cancer that can be effectively treated with an antagonist of an inhibitory immune checkpoint and/or an agonist of a stimulatory immune checkpoint in combination with a DNA damage therapeutic agent comprising:
determining the RNA expression level of at least one gene selected from Table 2B in a sample comprising cancer cells or nucleic acids derived therefrom from the subject wherein the determined RNA expression level is used to identify the subject as having a cancer in which the STING/TBK1/IRF3 pathway is activated due to a deficiency in DNA damage repair and thereby identify a cancer that can be effectively treated with an antagonist of an inhibitory immune checkpoint and/or an agonist of a stimulatory immune checkpoint in combination with a DNA damage therapeutic agent. - A method for selecting treatment for a cancer comprising:
determining the RNA expression level of at least one gene selected from Table 2B in a sample comprising cancer cells or nucleic acids derived therefrom from the subject wherein the determined RNA expression level is used to identify the subject as having a cancer in which the STING/TBK1/IRF3 pathway is activated due to a deficiency in DNA damage repair and thereby select an antagonist of an inhibitory immune checkpoint and/or an agonist of a stimulatory immune checkpoint for use in treatment of the cancer. - A method for selecting treatment for a cancer comprising:
determining the RNA expression level of at least one gene selected from Table 2B in a sample comprising cancer cells or nucleic acids derived therefrom from the subject wherein the determined RNA expression level is used to identify the subject as having a cancer in which the STING/TBK1/IRF3 pathway is activated due to a deficiency in DNA damage repair and thereby select an antagonist of an inhibitory immune checkpoint and/or an agonist of a stimulatory immune checkpoint, in combination with a DNA damage therapeutic agent, for use in treatment of the cancer. - The method of any one of claims 1 to 6 wherein an increased RNA expression level of the at least one gene:(a) predicts responsiveness to an antagonist of an inhibitory immune checkpoint and/or an agonist of a stimulatory immune checkpoint when the method is performed according to claim 1; or(b) predicts responsiveness to an antagonist of an inhibitory immune checkpoint and/or an agonist of a stimulatory immune checkpoint in combination with a DNA damage therapeutic agent when the method is performed according to claim 2; or(c) identifies a cancer that can be effectively treated with an antagonist of an inhibitory immune checkpoint and/or an agonist of a stimulatory immune checkpoint when the method is performed according to claim 3; or(d) identifies a cancer that can be effectively treated with an antagonist of an inhibitory immune checkpoint and/or an agonist of a stimulatory immune checkpoint in combination with a DNA damage therapeutic agent when the method is performed according to claim 4; or(e) is used to select an antagonist of an inhibitory immune checkpoint and/or an agonist of a stimulatory immune checkpoint for use in treatment of the cancer when the method is performed according to claim 5; or(f) is used to select an antagonist of an inhibitory immune checkpoint and/or an agonist of a stimulatory immune checkpoint, in combination with a DNA damage therapeutic agent, for use in treatment of the cancer when the method is performed according to claim 6.
- The method of any one of claims 1 to 7 which comprises determining the RNA expression level of at least 2 of the genes and the determined RNA expression levels are used to generate a combined test score, wherein a positive combined test score (generally above threshold, but may be equal to or above threshold):(a) predicts responsiveness to an antagonist of an inhibitory immune checkpoint and/or an agonist of a stimulatory immune checkpoint when the method is performed according to claim 1; or(b) predicts responsiveness to an antagonist of an inhibitory immune checkpoint and/or an agonist of a stimulatory immune checkpoint in combination with a DNA damage therapeutic agent when the method is performed according to claim 2; or(c) identifies a cancer that can be effectively treated with an antagonist of an inhibitory immune checkpoint and/or an agonist of a stimulatory immune checkpoint when the method is performed according to claim 3; or(d) identifies a cancer that can be effectively treated with an antagonist of an inhibitory immune checkpoint and/or an agonist of a stimulatory immune checkpoint in combination with a DNA damage therapeutic agent when the method is performed according to claim 4; or(e) is used to select an antagonist of an inhibitory immune checkpoint and/or an agonist of a stimulatory immune checkpoint for use in treatment of the cancer agent when the method is performed according to claim 5; or(f) is used to select an antagonist of an inhibitory immune checkpoint and/or an agonist of a stimulatory immune checkpoint, in combination with a DNA damage therapeutic agent, for use in treatment of the cancer when the method is performed according to claim 6.
- The method of any of claims 1 to 8 which comprises:(i) deriving a combined test score that captures the RNA expression levels;(ii) providing a threshold score comprising information correlating the combined test score and responsiveness;(iii) and comparing the combined test score to the threshold score; wherein(a) when the method is performed according to claim 1 or claim 2 responsiveness is predicted when the combined test score exceeds the threshold score; or(b) when the method is performed according to claim 3 or claim 4 a cancer that can be effectively treated is identified when the combined test score exceeds the threshold score; or(c) when the method is performed according to claim 5 an antagonist of an inhibitory immune checkpoint and/or an agonist of a stimulatory immune checkpoint is selected for use when the combined test score exceeds the threshold score; or(d) when the method is performed according to claim 6 an antagonist of an inhibitory immune checkpoint and/or an agonist of a stimulatory immune checkpoint in combination with a DNA damage therapeutic agent is selected for use when the combined test score exceeds the threshold score.
- The method of any preceding claim which comprises determining the RNA expression level of:(a) at least 6 genes selected from CXCL10, MX1, IDO1, IFI44L, CD2, GBP5, PRAME, ITGAL, LRP4, APOL3, CDR1, FYB, TSPAN7, RAC2, KLHDC7B, GRB14, AC138128.1, KIF26A, CD274, CD109, ETV7, MFAP5, OLFM4, PI15, FOSB, FAM19A5, NLRC5, PRICKLE1, EGR1, CLDN10, ADAMTS4, SP140L, ANXA1, RSAD2, ESR1, IKZF3, OR2I1P, EGFR, NAT1, LATS2, CYP2B6, PTPRC, PPP1R1A, and AL137218.1; or(b) at least 1 gene selected from CD2, ITGAL, PTPRC, CXCL10 and IDO1, together with at least one further gene selected from MX1, IFI44L, GBP5, PRAME, LRP4, APOL3, CDR1, FYB, TSPAN7, RAC2, KLHDC7B, GRB14, AC138128.1, KIF26A, CD274, CD109, ETV7, MFAP5, OLFM4, PI15, FOSB, FAM19A5, NLRC5, PRICKLE1, EGR1, CLDN10, ADAMTS4, SP140L, ANXA1, RSAD2, ESR1, IKZF3, OR2I1P, EGFR, NAT1, LATS2, CYP2B6, PPP1R1A, and AL137218.1; or(c) at least 1 gene selected from CD2, ITGAL, PTPRC, CXCL10, IDO1, CD3D, HLA-DPB1, CXCL9, CCL5, STAT1, IL2RG, CD3E, IRF1, IKZF3 and IGJ together with at least one further gene from the (remaining genes in) Table 2B (the 44 gene panel); or(d) each of CXCL10, MX1, IDO1, IFI44L, CD2, GBP5, PRAME, ITGAL, LRP4, APOL3, CDR1, FYB, TSPAN7, RAC2, KLHDC7B, GRB14, AC138128.1, KIF26A, CD274, CD109, ETV7, MFAP5, OLFM4, PI15, FOSB, FAM19A5, NLRC5, PRICKLE1, EGR1, CLDN10, ADAMTS4, SP140L, ANXA1, RSAD2, ESR1, IKZF3, OR2I1P, EGFR, NAT1, LATS2, CYP2B6, PTPRC, PPP1R1A, and AL137218.1.
- The method of any preceding claim which comprises determining the RNA expression level of(a) each of the genes from any one of Tables 4 to 45; or(b) at least one, up to all, of CCL5, CXCL9 and CXCL10 together with at least one further gene from the (remaining genes in) Table 2B (the 44 gene panel).
- The method of any preceding claim wherein determining the RNA expression level employs at least one primer or primer pair from Table 2E and/or at least one probe from Table 2E.
- The method of any preceding claim wherein the combined test score (or "signature score") is derived according to the formula:

optionally, wherein the weight values for each gene are as set out in Table 2B, or wherein the weight and/or bias values for each gene are as set out in any one of Tables 3 to 45. - An antagonist of an inhibitory immune checkpoint and/or an agonist of a stimulatory immune checkpoint for use in the treatment of cancer in a subject wherein, prior to administration of the antagonist and/or agonist, a sample comprising cancer cells or nucleic acids derived therefrom from the subject displays:(a) a positive combined test score derived from the determined RNA expression levels of at least 2 genes from Table 2B, wherein the positive combined test score is above or is equal to or above a threshold score; or(b) an increased level of RNA expression of at least 1 gene from Table 2B;
which identifies the subject as having a cancer in which the STING/TBK1/IRF3 pathway is activated due to a deficiency in DNA damage repair, wherein:(i) the antagonist of an inhibitory immune checkpoint is selected from an antibody and an inhibitory nucleic acid molecule; and(ii) the agonist of a stimulatory immune checkpoint is selected from an antibody, a lipocalin and a cytokine. - An antagonist of an inhibitory immune checkpoint and/or an agonist of a stimulatory immune checkpoint for use in the treatment of cancer in a subject wherein, prior to administration of the antagonist and/or agonist, a sample comprising cancer cells or nucleic acids derived therefrom from the subject displays:(a) a positive combined test score derived from the determined RNA expression levels of at least 2 genes from Table 2B, wherein the positive combined test score is above or is equal to or above a threshold score; or(b) an increased level of RNA expression of at least 1 gene from Table 2B;
which identifies the subject as having a cancer in which the STING/TBK1/IRF3 pathway is activated due to a deficiency in DNA damage repair and wherein the antagonist and/or agonist is administered in combination with a DNA damage therapeutic agent, wherein:(i) the antagonist of an inhibitory immune checkpoint is selected from an antibody and an inhibitory nucleic acid molecule;(ii) the agonist of a stimulatory immune checkpoint is selected from an antibody, a lipocalin and a cytokine; and(iii) the DNA damage therapeutic agent is selected from a DNA damaging agent, a DNA repair targeted therapy, an inhibitor of DNA damage signalling, an inhibitor of DNA damage induced cell cycle arrest and an inhibitor of a process indirectly leading to DNA damage. - An antagonist of an inhibitory immune checkpoint in combination with a DNA damage therapeutic agent and/or an agonist of a stimulatory immune checkpoint in combination with a DNA damage therapeutic agent for use in the treatment of cancer in a subject wherein, prior to administration of the antagonist and/or agonist and DNA damage therapeutic agent, a sample comprising cancer cells or nucleic acids derived therefrom from the subject displays:(a) a positive combined test score derived from the determined RNA expression levels of at least 2 genes from Table 2B, wherein the positive combined test score is above or is equal to or above a threshold score; or(b) an increased level of RNA expression of at least 1 gene from Table 2B;
which identifies the subject as having a cancer in which the STING/TBK1/IRF3 pathway is activated due to a deficiency in DNA damage repair, wherein:(i) the antagonist of an inhibitory immune checkpoint is selected from an antibody and an inhibitory nucleic acid molecule;(ii) the agonist of a stimulatory immune checkpoint is selected from an antibody, a lipocalin and a cytokine; and(iii) the DNA damage therapeutic agent is selected from a DNA damaging agent, a DNA repair targeted therapy, an inhibitor of DNA damage signalling, an inhibitor of DNA damage induced cell cycle arrest and an inhibitor of a process indirectly leading to DNA damage. - The antagonist and/or agonist for use of any of claims 14 to 16, wherein the combined test score is derived:(i) from the RNA expression level of the genes specified in any one of claims 10 to 12; and/or(ii) according to the formula in claim 13.
- The antagonist and/or agonist for use of any of claims 14 to 17, wherein the subject is selected for treatment according to a method as claimed in any one of claims 1 to 13 .
- The method of any of claims 1 to 13 , or the antagonist and/or agonist for use of any of claims 14 to 18, wherein the sample comprises cancer cells; and/or wherein the sample is a tissue sample; optionally wherein the tissue sample is a fixed and embedded tissue sample.
- The method of any of claims 1 to 13 or 19, or the antagonist and/or agonist for use of any of claims 14 to 19, wherein the cancer is selected from leukemia, brain cancer, prostate cancer, liver cancer, ovarian cancer, stomach cancer, colorectal cancer, throat cancer, breast cancer, skin cancer, melanoma, lung cancer, sarcoma, cervical cancer, testicular cancer, bladder cancer, endocrine cancer, endometrial cancer, esophageal cancer, glioma, lymphoma, neuroblastoma, osteosarcoma, pancreatic cancer, pituitary cancer, renal cancer or head and neck cancer.
- The method of any of claims 1 to 13 or 19 or 20, or the antagonist and/or agonist for use of any of claims 14 to 20, wherein the inhibitory immune checkpoint is selected from A2AR, B7-H3 (CD276), B7-H4 (VTCN1), BTLA (CD272), CTLA-4 (CD152), IDO, KIR, LAG3, PD-1/PD-L1, TIM-3 and VISTA, optionally wherein the inhibitory immune checkpoint is not PD-1/PD-L1; and/or wherein the antagonist of an inhibitory immune checkpoint is selected from:
MGA271 (targets B7-H3), ipilimumab (Yervoy - targets CTLA-4), indoximod (targets IDO pathway), NLG919 (targets IDO pathway), lirilumab (targets KIR), IMP321 (targets LAG3), BMS-986016 (targets LAG3), CT-011 (PD-1 blockade), nivolumab/BMS-936558 (PD-1 blockade), BMS-936559 (PDL1 blockade) and pembrolizumab (Keytruda - targets PD-1), optionally wherein the antagonist is not pembrolizumab; and/or wherein the antagonist of an inhibitory immune checkpoint is selected from MGB453 (targets TIM-3), LAG525 (targets LAG-3) and PDR001 (PD1 Blockade). - The method of any of claims 1 to 13 or 19 to 21, or the antagonist and/or agonist for use of any of claims 14 to 21, wherein the stimulatory immune checkpoint is selected from CD27, CD28, CD40, CD122, CD137, OX40, GITR and ICOS; and/or wherein the agonist of a stimulatory immune checkpoint is selected from:
CDX-1127 (agonist of CD27), NKTR-214 (agonist of CD122), BMS-663513 (agonist of CD137), TRX518 (agonist of GITR), CP-870893 (CD40 agonist), MEDI0562, MEDI6469 and MEDI6383 (OX40 agonists). - The method of any of claims 1 to 13 or 19 to 22, or the antagonist and/or agonist for use of any of claims 14 to 22, wherein:(a) the DNA damaging agent is selected from an alkylating agent, a topoisomerase inhibitor and radiation; optionally wherein:(i) the alkylating agent is selected from a platinum containing agent, cyclophosphamide and busulphan; optionally wherein the platinum containing agent is selected from cisplatin, carboplatin and oxaliplatin;(ii) the topoisomerase inhibitor is selected from a topoisomerase I inhibitor and a topoisomerase II inhibitor; optionally wherein(A) the topoisomerase I inhibitor is selected from irinotecan and topotecan; and/or(B) the topisomerase II inhibitor is selected from etoposide and an anthracycline; optionally wherein the anthracycline is selected from doxorubicin and epirubicin;(iii) the radiation is ionising radiation; and/or(b) the DNA repair targeted therapy is selected from an inhibitor of Non-homologous end-joining, an inhibitor of homologous recombination, an inhibitors of nucleotide excision repair, an inhibitor of base excision repair and an inhibitor of the Fanconi anemia pathway; optionally wherein(i) the inhibitor of Non-homologous end-joining is selected from a DNA-PK inhibitor, Nu7441 and NU7026;(ii) the inhibitor of base excision repair is selected from a PARP inhibitor, AG014699, AZD2281, ABT-888, MK4827, BSI-201, INO-1001, TRC-102, an APEX 1 inhibitor, an APEX 2 inhibitor and a Ligase III inhibitor;(iii) the inhibitor of DNA damage signalling is selected from an ATM inhibitor, a CHK 1 inhibitor and a CHK 2 inhibitor; optionally wherein(A) the ATM inhibitor is selected from CP466722 and KU-55933;(B) the CHK 1 inhibitor is selected from XL-844, UCN-01, AZD7762 and PF00477736;(C) the CHK 2 inhibitor is selected from XL-844, AZD7762 and PF00477736; and/or(c) the inhibitor of DNA damage induced cell cycle arrest is selected from a Wee1 kinase inhibitor and a CDC25a, b or c inhibitor; and/or(d) the inhibitor of a process indirectly leading to DNA damage is selected from a histone deacetylase inhibitor and a heat shock protein inhibitor; optionally wherein the heat shock protein inhibitor is selected from geldanamycin and AUY922.
Applications Claiming Priority (3)
| Application Number | Priority Date | Filing Date | Title |
|---|---|---|---|
| GBGB1512869.7A GB201512869D0 (en) | 2015-07-21 | 2015-07-21 | Gene signature for minute therapies |
| US201562237497P | 2015-10-05 | 2015-10-05 | |
| PCT/GB2016/052213 WO2017013436A1 (en) | 2015-07-21 | 2016-07-21 | Gene signature for immune therapies in cancer |
Publications (2)
| Publication Number | Publication Date |
|---|---|
| EP3325653A1 EP3325653A1 (en) | 2018-05-30 |
| EP3325653B1 true EP3325653B1 (en) | 2020-07-15 |
Family
ID=54064732
Family Applications (1)
| Application Number | Title | Priority Date | Filing Date |
|---|---|---|---|
| EP16745140.0A Active EP3325653B1 (en) | 2015-07-21 | 2016-07-21 | Gene signature for immune therapies in cancer |
Country Status (8)
| Country | Link |
|---|---|
| US (1) | US11254986B2 (en) |
| EP (1) | EP3325653B1 (en) |
| JP (1) | JP2018524990A (en) |
| CN (1) | CN108138236A (en) |
| AU (1) | AU2016295347A1 (en) |
| CA (1) | CA2993142A1 (en) |
| GB (1) | GB201512869D0 (en) |
| WO (1) | WO2017013436A1 (en) |
Cited By (1)
| Publication number | Priority date | Publication date | Assignee | Title |
|---|---|---|---|---|
| EP4443162A1 (en) | 2023-04-03 | 2024-10-09 | Fundación Para La Investigación Biomédica Del Hospital Clínico San Carlos | Genetic signature for predicting the response to immunotherapies in a subject |
Families Citing this family (40)
| Publication number | Priority date | Publication date | Assignee | Title |
|---|---|---|---|---|
| US10478494B2 (en) | 2015-04-03 | 2019-11-19 | Astex Therapeutics Ltd | FGFR/PD-1 combination therapy for the treatment of cancer |
| US11149312B2 (en) | 2016-04-15 | 2021-10-19 | University Health Network | Hybrid-capture sequencing for determining immune cell clonality |
| TWI794171B (en) | 2016-05-11 | 2023-03-01 | 美商滬亞生物國際有限公司 | Combination therapies of hdac inhibitors and pd-l1 inhibitors |
| TWI808055B (en) | 2016-05-11 | 2023-07-11 | 美商滬亞生物國際有限公司 | Combination therapies of hdac inhibitors and pd-1 inhibitors |
| US20190360051A1 (en) * | 2017-02-17 | 2019-11-28 | Stichting Vumc | Swarm intelligence-enhanced diagnosis and therapy selection for cancer using tumor- educated platelets |
| US20200108074A1 (en) | 2017-03-31 | 2020-04-09 | Seattle Genetics, Inc. | Combinations of chk1- and wee1- inhibitors |
| WO2018218332A1 (en) | 2017-05-30 | 2018-12-06 | Of Health Network University | Hybrid-capture sequencing for determining immune cell clonality |
| KR102721137B1 (en) | 2017-05-30 | 2024-10-25 | 브리스톨-마이어스 스큅 컴퍼니 | Composition comprising anti-LAG-3 antibody or anti-LAG-3 antibody and anti-PD-1 or anti-PD-L1 antibody |
| CA3060984A1 (en) | 2017-05-30 | 2018-12-06 | Bristol-Myers Squibb Company | Treatment of lag-3 positive tumors |
| US11322226B2 (en) | 2017-06-13 | 2022-05-03 | Bostongene Corporation | Systems and methods for generating, visualizing and classifying molecular functional profiles |
| JP7076059B2 (en) | 2017-06-27 | 2022-05-27 | ニューラクル サイエンス カンパニー リミテッド | Anti-FAM19A5 antibody and its uses |
| CN111344011B (en) * | 2017-06-27 | 2024-01-26 | 纽洛可科学有限公司 | Use of anti-FAM19A5 antibodies to treat fibrosis |
| CA3067416A1 (en) * | 2017-06-27 | 2019-01-03 | Neuracle Science Co., Ltd. | Use of anti-fam19a5 antibodies for treating cancers |
| US12266426B2 (en) * | 2017-12-01 | 2025-04-01 | Illumina, Inc. | Method for administering a cancer treatment |
| US11043305B1 (en) | 2018-02-02 | 2021-06-22 | Immuneering Corporation | Systems and methods for rapid gene set enrichment analysis |
| CN109295208A (en) * | 2018-10-26 | 2019-02-01 | 德阳市人民医院 | Application of the PI15 as osteoarthritis marker |
| WO2020198066A1 (en) * | 2019-03-22 | 2020-10-01 | Duke University | Compositions and methods for enhancing cancer immune checkpoint therapy |
| JP7315181B2 (en) * | 2019-04-09 | 2023-07-26 | Genomedia株式会社 | Search method and information processing system |
| CN112386701B (en) * | 2019-08-02 | 2022-11-22 | 邵兰 | Anti-tumor combined medicine for inhibiting expression of PD-L1 and application thereof |
| WO2021107452A1 (en) * | 2019-11-29 | 2021-06-03 | 의료법인 성광의료재단 | Biomarker for predicting therapeutic responsiveness to immune cell therapeutic agent |
| KR20260043144A (en) * | 2019-12-02 | 2026-03-31 | 캐리스 엠피아이, 아이엔씨. | Pan-cancer platinum response predictor |
| CN111260638B (en) * | 2020-01-19 | 2023-05-23 | 陕西未来健康科技有限公司 | Automatic detection and counting method and system for cerebrospinal fluid cells and pathogens based on convolutional neural network |
| TW202140568A (en) | 2020-03-19 | 2021-11-01 | 日商中外製藥股份有限公司 | Biomarkers for predicting the response to checkpoint inhibitors |
| US20230348954A1 (en) * | 2020-03-26 | 2023-11-02 | Roche Sequencing Solutions, Inc. | Devices and methods for sample analysis |
| CN111755073B (en) * | 2020-05-31 | 2022-11-15 | 复旦大学 | Transcriptome-Based PD-1 Therapy Effect Prediction System |
| US20230250173A1 (en) * | 2020-07-01 | 2023-08-10 | Pfizer Inc. | Biomarkers for pd-1 axis binding antagonist therapy |
| JP2023536636A (en) * | 2020-08-03 | 2023-08-28 | オンコサイト・コーポレイション | Tumor classification and responsiveness prediction |
| EP4214334A1 (en) * | 2020-09-16 | 2023-07-26 | Novigenix SA | Biomarkers for immune checkpoint inhibitors treatment |
| EP3971909A1 (en) * | 2020-09-21 | 2022-03-23 | Thorsten Kaiser | Method for predicting markers which are characteristic for at least one medical sample and/or for a patient |
| US20240101666A1 (en) | 2020-10-23 | 2024-03-28 | Bristol-Myers Squibb Company | Lag-3 antagonist therapy for lung cancer |
| US20220136070A1 (en) * | 2020-10-30 | 2022-05-05 | Omniseq, Inc. | Methods and systems for characterizing tumor response to immunotherapy using an immunogenic profile |
| CN112280862B (en) * | 2020-11-05 | 2022-04-26 | 中山大学肿瘤防治中心(中山大学附属肿瘤医院、中山大学肿瘤研究所) | Marker panel and application for predicting the efficacy of immunotherapy in nasopharyngeal carcinoma |
| US12551584B1 (en) | 2020-12-07 | 2026-02-17 | Actinium Pharmaceuticals, Inc. | Lewis Y radioimmunotherapy for the treatment of cancer |
| US20240335465A1 (en) * | 2021-02-22 | 2024-10-10 | University Of Virginia Patent Foundation | A non-canonical signaling activity of cgamp triggers dna damage response signaling |
| WO2022211620A1 (en) * | 2021-04-01 | 2022-10-06 | Stichting Het Nederlands Kanker Instituut-Antoni van Leeuwenhoek Ziekenhuis | Cd4/il-2 biomarker. |
| CN117940586A (en) * | 2021-07-22 | 2024-04-26 | 阿西利亚诊断公司 | Biomarkers for post-immunotherapy therapy response |
| MX2024001948A (en) * | 2021-08-13 | 2024-05-17 | Inovio Pharmaceuticals Inc | COMBINED THERAPY TO TREAT BRAIN CANCER. |
| CN115575636B (en) * | 2022-11-22 | 2023-04-04 | 杭州广科安德生物科技有限公司 | Biomarker for lung cancer detection and system thereof |
| WO2024234348A1 (en) * | 2023-05-17 | 2024-11-21 | Yanjun Wang | Biomarker for immune checkpoint blockade therapy in nsclc |
| WO2024243224A2 (en) * | 2023-05-24 | 2024-11-28 | Oklahoma Medical Research Foundation | Multi-omic approach for assessing systemic lupus erythematosus heterogeneity in treatment response |
Family Cites Families (24)
| Publication number | Priority date | Publication date | Assignee | Title |
|---|---|---|---|---|
| US5525464A (en) | 1987-04-01 | 1996-06-11 | Hyseq, Inc. | Method of sequencing by hybridization of oligonucleotide probes |
| US5202231A (en) | 1987-04-01 | 1993-04-13 | Drmanac Radoje T | Method of sequencing of genomes by hybridization of oligonucleotide probes |
| GB8810400D0 (en) | 1988-05-03 | 1988-06-08 | Southern E | Analysing polynucleotide sequences |
| US5547839A (en) | 1989-06-07 | 1996-08-20 | Affymax Technologies N.V. | Sequencing of surface immobilized polymers utilizing microflourescence detection |
| US5800992A (en) | 1989-06-07 | 1998-09-01 | Fodor; Stephen P.A. | Method of detecting nucleic acids |
| US6040138A (en) | 1995-09-15 | 2000-03-21 | Affymetrix, Inc. | Expression monitoring by hybridization to high density oligonucleotide arrays |
| US5143854A (en) | 1989-06-07 | 1992-09-01 | Affymax Technologies N.V. | Large scale photolithographic solid phase synthesis of polypeptides and receptor binding screening thereof |
| EP0430881A3 (en) | 1989-11-29 | 1991-10-23 | Ciba-Geigy Ag | Photochromic compounds, process for their preparation and their use |
| US5288644A (en) | 1990-04-04 | 1994-02-22 | The Rockefeller University | Instrument and method for the sequencing of genome |
| US5324633A (en) | 1991-11-22 | 1994-06-28 | Affymax Technologies N.V. | Method and apparatus for measuring binding affinity |
| DE69322266T2 (en) | 1992-04-03 | 1999-06-02 | Perkin-Elmer Corp., Foster City, Calif. | SAMPLES COMPOSITION AND METHOD |
| US5503980A (en) | 1992-11-06 | 1996-04-02 | Trustees Of Boston University | Positional sequencing by hybridization |
| US5858659A (en) | 1995-11-29 | 1999-01-12 | Affymetrix, Inc. | Polymorphism detection |
| US5470710A (en) | 1993-10-22 | 1995-11-28 | University Of Utah | Automated hybridization/imaging device for fluorescent multiplex DNA sequencing |
| GB9401833D0 (en) | 1994-02-01 | 1994-03-30 | Isis Innovation | Method for discovering ligands |
| GB9507238D0 (en) | 1995-04-07 | 1995-05-31 | Isis Innovation | Detecting dna sequence variations |
| US5661028A (en) | 1995-09-29 | 1997-08-26 | Lockheed Martin Energy Systems, Inc. | Large scale DNA microsequencing device |
| JP2002515738A (en) | 1996-01-23 | 2002-05-28 | アフィメトリックス,インコーポレイティド | Nucleic acid analysis |
| WO1997029212A1 (en) | 1996-02-08 | 1997-08-14 | Affymetrix, Inc. | Chip-based speciation and phenotypic characterization of microorganisms |
| WO1999005574A1 (en) | 1997-07-25 | 1999-02-04 | Affymetrix, Inc. | Method and system for providing a probe array chip design database |
| US20100284915A1 (en) * | 2006-06-30 | 2010-11-11 | Hongyue Dai | Genes associated with chemotherapy response and uses thereof |
| EA201390370A1 (en) | 2010-09-15 | 2013-07-30 | Олмак Дайэгностикс Лимитед | MOLECULAR DIAGNOSTIC TEST FOR DETERMINATION OF ONCOLOGICAL DISEASE |
| CA2835179A1 (en) * | 2011-05-06 | 2012-11-15 | Xentech | Markers for cancer prognosis and therapy and methods of use |
| AR090263A1 (en) * | 2012-03-08 | 2014-10-29 | Hoffmann La Roche | COMBINED ANTIBODY THERAPY AGAINST HUMAN CSF-1R AND USES OF THE SAME |
-
2015
- 2015-07-21 GB GBGB1512869.7A patent/GB201512869D0/en not_active Ceased
-
2016
- 2016-07-21 JP JP2018502758A patent/JP2018524990A/en active Pending
- 2016-07-21 WO PCT/GB2016/052213 patent/WO2017013436A1/en not_active Ceased
- 2016-07-21 AU AU2016295347A patent/AU2016295347A1/en not_active Abandoned
- 2016-07-21 US US15/746,097 patent/US11254986B2/en active Active
- 2016-07-21 CN CN201680052646.1A patent/CN108138236A/en active Pending
- 2016-07-21 EP EP16745140.0A patent/EP3325653B1/en active Active
- 2016-07-21 CA CA2993142A patent/CA2993142A1/en not_active Abandoned
Non-Patent Citations (1)
| Title |
|---|
| None * |
Cited By (2)
| Publication number | Priority date | Publication date | Assignee | Title |
|---|---|---|---|---|
| EP4443162A1 (en) | 2023-04-03 | 2024-10-09 | Fundación Para La Investigación Biomédica Del Hospital Clínico San Carlos | Genetic signature for predicting the response to immunotherapies in a subject |
| WO2024208833A1 (en) | 2023-04-03 | 2024-10-10 | Fundación Para La Investigación Biomédica Del Hospital Clínico San Carlos | Genetic signature for predicting the response of a subject to immunotherapies |
Also Published As
| Publication number | Publication date |
|---|---|
| JP2018524990A (en) | 2018-09-06 |
| US11254986B2 (en) | 2022-02-22 |
| GB201512869D0 (en) | 2015-09-02 |
| CN108138236A (en) | 2018-06-08 |
| WO2017013436A1 (en) | 2017-01-26 |
| CA2993142A1 (en) | 2017-01-26 |
| US20190316203A1 (en) | 2019-10-17 |
| AU2016295347A1 (en) | 2018-02-22 |
| EP3325653A1 (en) | 2018-05-30 |
Similar Documents
| Publication | Publication Date | Title |
|---|---|---|
| US11254986B2 (en) | Gene signature for immune therapies in cancer | |
| US10378066B2 (en) | Molecular diagnostic test for cancer | |
| EP2715348B1 (en) | Molecular diagnostic test for cancer | |
| US11091809B2 (en) | Molecular diagnostic test for cancer | |
| US10280468B2 (en) | Molecular diagnostic test for predicting response to anti-angiogenic drugs and prognosis of cancer | |
| US20160222459A1 (en) | Molecular diagnostic test for lung cancer | |
| US20160222460A1 (en) | Molecular diagnostic test for oesophageal cancer |
Legal Events
| Date | Code | Title | Description |
|---|---|---|---|
| STAA | Information on the status of an ep patent application or granted ep patent |
Free format text: STATUS: THE INTERNATIONAL PUBLICATION HAS BEEN MADE |
|
| PUAI | Public reference made under article 153(3) epc to a published international application that has entered the european phase |
Free format text: ORIGINAL CODE: 0009012 |
|
| STAA | Information on the status of an ep patent application or granted ep patent |
Free format text: STATUS: REQUEST FOR EXAMINATION WAS MADE |
|
| 17P | Request for examination filed |
Effective date: 20180220 |
|
| AK | Designated contracting states |
Kind code of ref document: A1 Designated state(s): AL AT BE BG CH CY CZ DE DK EE ES FI FR GB GR HR HU IE IS IT LI LT LU LV MC MK MT NL NO PL PT RO RS SE SI SK SM TR |
|
| AX | Request for extension of the european patent |
Extension state: BA ME |
|
| DAV | Request for validation of the european patent (deleted) | ||
| DAX | Request for extension of the european patent (deleted) | ||
| RAP1 | Party data changed (applicant data changed or rights of an application transferred) |
Owner name: ALMAC DIAGNOSTIC SERVICES LIMITED |
|
| STAA | Information on the status of an ep patent application or granted ep patent |
Free format text: STATUS: EXAMINATION IS IN PROGRESS |
|
| 17Q | First examination report despatched |
Effective date: 20190329 |
|
| GRAP | Despatch of communication of intention to grant a patent |
Free format text: ORIGINAL CODE: EPIDOSNIGR1 |
|
| STAA | Information on the status of an ep patent application or granted ep patent |
Free format text: STATUS: GRANT OF PATENT IS INTENDED |
|
| INTG | Intention to grant announced |
Effective date: 20200205 |
|
| GRAS | Grant fee paid |
Free format text: ORIGINAL CODE: EPIDOSNIGR3 |
|
| GRAA | (expected) grant |
Free format text: ORIGINAL CODE: 0009210 |
|
| STAA | Information on the status of an ep patent application or granted ep patent |
Free format text: STATUS: THE PATENT HAS BEEN GRANTED |
|
| AK | Designated contracting states |
Kind code of ref document: B1 Designated state(s): AL AT BE BG CH CY CZ DE DK EE ES FI FR GB GR HR HU IE IS IT LI LT LU LV MC MK MT NL NO PL PT RO RS SE SI SK SM TR |
|
| REG | Reference to a national code |
Ref country code: CH Ref legal event code: EP Ref country code: GB Ref legal event code: FG4D |
|
| REG | Reference to a national code |
Ref country code: IE Ref legal event code: FG4D |
|
| REG | Reference to a national code |
Ref country code: DE Ref legal event code: R096 Ref document number: 602016039972 Country of ref document: DE |
|
| REG | Reference to a national code |
Ref country code: AT Ref legal event code: REF Ref document number: 1291103 Country of ref document: AT Kind code of ref document: T Effective date: 20200815 |
|
| REG | Reference to a national code |
Ref country code: LT Ref legal event code: MG4D |
|
| REG | Reference to a national code |
Ref country code: AT Ref legal event code: MK05 Ref document number: 1291103 Country of ref document: AT Kind code of ref document: T Effective date: 20200715 |
|
| REG | Reference to a national code |
Ref country code: NL Ref legal event code: MP Effective date: 20200715 |
|
| PG25 | Lapsed in a contracting state [announced via postgrant information from national office to epo] |
Ref country code: AT Free format text: LAPSE BECAUSE OF FAILURE TO SUBMIT A TRANSLATION OF THE DESCRIPTION OR TO PAY THE FEE WITHIN THE PRESCRIBED TIME-LIMIT Effective date: 20200715 Ref country code: BG Free format text: LAPSE BECAUSE OF FAILURE TO SUBMIT A TRANSLATION OF THE DESCRIPTION OR TO PAY THE FEE WITHIN THE PRESCRIBED TIME-LIMIT Effective date: 20201015 Ref country code: SE Free format text: LAPSE BECAUSE OF FAILURE TO SUBMIT A TRANSLATION OF THE DESCRIPTION OR TO PAY THE FEE WITHIN THE PRESCRIBED TIME-LIMIT Effective date: 20200715 Ref country code: PT Free format text: LAPSE BECAUSE OF FAILURE TO SUBMIT A TRANSLATION OF THE DESCRIPTION OR TO PAY THE FEE WITHIN THE PRESCRIBED TIME-LIMIT Effective date: 20201116 Ref country code: ES Free format text: LAPSE BECAUSE OF FAILURE TO SUBMIT A TRANSLATION OF THE DESCRIPTION OR TO PAY THE FEE WITHIN THE PRESCRIBED TIME-LIMIT Effective date: 20200715 Ref country code: NO Free format text: LAPSE BECAUSE OF FAILURE TO SUBMIT A TRANSLATION OF THE DESCRIPTION OR TO PAY THE FEE WITHIN THE PRESCRIBED TIME-LIMIT Effective date: 20201015 Ref country code: LT Free format text: LAPSE BECAUSE OF FAILURE TO SUBMIT A TRANSLATION OF THE DESCRIPTION OR TO PAY THE FEE WITHIN THE PRESCRIBED TIME-LIMIT Effective date: 20200715 Ref country code: GR Free format text: LAPSE BECAUSE OF FAILURE TO SUBMIT A TRANSLATION OF THE DESCRIPTION OR TO PAY THE FEE WITHIN THE PRESCRIBED TIME-LIMIT Effective date: 20201016 Ref country code: HR Free format text: LAPSE BECAUSE OF FAILURE TO SUBMIT A TRANSLATION OF THE DESCRIPTION OR TO PAY THE FEE WITHIN THE PRESCRIBED TIME-LIMIT Effective date: 20200715 Ref country code: FI Free format text: LAPSE BECAUSE OF FAILURE TO SUBMIT A TRANSLATION OF THE DESCRIPTION OR TO PAY THE FEE WITHIN THE PRESCRIBED TIME-LIMIT Effective date: 20200715 |
|
| PG25 | Lapsed in a contracting state [announced via postgrant information from national office to epo] |
Ref country code: LV Free format text: LAPSE BECAUSE OF FAILURE TO SUBMIT A TRANSLATION OF THE DESCRIPTION OR TO PAY THE FEE WITHIN THE PRESCRIBED TIME-LIMIT Effective date: 20200715 Ref country code: PL Free format text: LAPSE BECAUSE OF FAILURE TO SUBMIT A TRANSLATION OF THE DESCRIPTION OR TO PAY THE FEE WITHIN THE PRESCRIBED TIME-LIMIT Effective date: 20200715 Ref country code: RS Free format text: LAPSE BECAUSE OF FAILURE TO SUBMIT A TRANSLATION OF THE DESCRIPTION OR TO PAY THE FEE WITHIN THE PRESCRIBED TIME-LIMIT Effective date: 20200715 Ref country code: IS Free format text: LAPSE BECAUSE OF FAILURE TO SUBMIT A TRANSLATION OF THE DESCRIPTION OR TO PAY THE FEE WITHIN THE PRESCRIBED TIME-LIMIT Effective date: 20201115 |
|
| REG | Reference to a national code |
Ref country code: CH Ref legal event code: PL |
|
| PG25 | Lapsed in a contracting state [announced via postgrant information from national office to epo] |
Ref country code: NL Free format text: LAPSE BECAUSE OF FAILURE TO SUBMIT A TRANSLATION OF THE DESCRIPTION OR TO PAY THE FEE WITHIN THE PRESCRIBED TIME-LIMIT Effective date: 20200715 |
|
| REG | Reference to a national code |
Ref country code: DE Ref legal event code: R097 Ref document number: 602016039972 Country of ref document: DE |
|
| REG | Reference to a national code |
Ref country code: BE Ref legal event code: MM Effective date: 20200731 |
|
| PG25 | Lapsed in a contracting state [announced via postgrant information from national office to epo] |
Ref country code: LU Free format text: LAPSE BECAUSE OF NON-PAYMENT OF DUE FEES Effective date: 20200721 Ref country code: LI Free format text: LAPSE BECAUSE OF NON-PAYMENT OF DUE FEES Effective date: 20200731 Ref country code: CH Free format text: LAPSE BECAUSE OF NON-PAYMENT OF DUE FEES Effective date: 20200731 Ref country code: CZ Free format text: LAPSE BECAUSE OF FAILURE TO SUBMIT A TRANSLATION OF THE DESCRIPTION OR TO PAY THE FEE WITHIN THE PRESCRIBED TIME-LIMIT Effective date: 20200715 Ref country code: DK Free format text: LAPSE BECAUSE OF FAILURE TO SUBMIT A TRANSLATION OF THE DESCRIPTION OR TO PAY THE FEE WITHIN THE PRESCRIBED TIME-LIMIT Effective date: 20200715 Ref country code: RO Free format text: LAPSE BECAUSE OF FAILURE TO SUBMIT A TRANSLATION OF THE DESCRIPTION OR TO PAY THE FEE WITHIN THE PRESCRIBED TIME-LIMIT Effective date: 20200715 Ref country code: SM Free format text: LAPSE BECAUSE OF FAILURE TO SUBMIT A TRANSLATION OF THE DESCRIPTION OR TO PAY THE FEE WITHIN THE PRESCRIBED TIME-LIMIT Effective date: 20200715 Ref country code: IT Free format text: LAPSE BECAUSE OF FAILURE TO SUBMIT A TRANSLATION OF THE DESCRIPTION OR TO PAY THE FEE WITHIN THE PRESCRIBED TIME-LIMIT Effective date: 20200715 Ref country code: EE Free format text: LAPSE BECAUSE OF FAILURE TO SUBMIT A TRANSLATION OF THE DESCRIPTION OR TO PAY THE FEE WITHIN THE PRESCRIBED TIME-LIMIT Effective date: 20200715 |
|
| PLBE | No opposition filed within time limit |
Free format text: ORIGINAL CODE: 0009261 |
|
| STAA | Information on the status of an ep patent application or granted ep patent |
Free format text: STATUS: NO OPPOSITION FILED WITHIN TIME LIMIT |
|
| PG25 | Lapsed in a contracting state [announced via postgrant information from national office to epo] |
Ref country code: AL Free format text: LAPSE BECAUSE OF FAILURE TO SUBMIT A TRANSLATION OF THE DESCRIPTION OR TO PAY THE FEE WITHIN THE PRESCRIBED TIME-LIMIT Effective date: 20200715 Ref country code: BE Free format text: LAPSE BECAUSE OF NON-PAYMENT OF DUE FEES Effective date: 20200731 |
|
| 26N | No opposition filed |
Effective date: 20210416 |
|
| PG25 | Lapsed in a contracting state [announced via postgrant information from national office to epo] |
Ref country code: SK Free format text: LAPSE BECAUSE OF FAILURE TO SUBMIT A TRANSLATION OF THE DESCRIPTION OR TO PAY THE FEE WITHIN THE PRESCRIBED TIME-LIMIT Effective date: 20200715 |
|
| PG25 | Lapsed in a contracting state [announced via postgrant information from national office to epo] |
Ref country code: SI Free format text: LAPSE BECAUSE OF FAILURE TO SUBMIT A TRANSLATION OF THE DESCRIPTION OR TO PAY THE FEE WITHIN THE PRESCRIBED TIME-LIMIT Effective date: 20200715 Ref country code: IE Free format text: LAPSE BECAUSE OF NON-PAYMENT OF DUE FEES Effective date: 20200721 |
|
| PG25 | Lapsed in a contracting state [announced via postgrant information from national office to epo] |
Ref country code: TR Free format text: LAPSE BECAUSE OF FAILURE TO SUBMIT A TRANSLATION OF THE DESCRIPTION OR TO PAY THE FEE WITHIN THE PRESCRIBED TIME-LIMIT Effective date: 20200715 Ref country code: MT Free format text: LAPSE BECAUSE OF FAILURE TO SUBMIT A TRANSLATION OF THE DESCRIPTION OR TO PAY THE FEE WITHIN THE PRESCRIBED TIME-LIMIT Effective date: 20200715 Ref country code: CY Free format text: LAPSE BECAUSE OF FAILURE TO SUBMIT A TRANSLATION OF THE DESCRIPTION OR TO PAY THE FEE WITHIN THE PRESCRIBED TIME-LIMIT Effective date: 20200715 |
|
| PG25 | Lapsed in a contracting state [announced via postgrant information from national office to epo] |
Ref country code: MK Free format text: LAPSE BECAUSE OF FAILURE TO SUBMIT A TRANSLATION OF THE DESCRIPTION OR TO PAY THE FEE WITHIN THE PRESCRIBED TIME-LIMIT Effective date: 20200715 Ref country code: MC Free format text: LAPSE BECAUSE OF FAILURE TO SUBMIT A TRANSLATION OF THE DESCRIPTION OR TO PAY THE FEE WITHIN THE PRESCRIBED TIME-LIMIT Effective date: 20200715 |
|
| P01 | Opt-out of the competence of the unified patent court (upc) registered |
Effective date: 20230516 |
|
| PGFP | Annual fee paid to national office [announced via postgrant information from national office to epo] |
Ref country code: DE Payment date: 20250721 Year of fee payment: 10 |
|
| PGFP | Annual fee paid to national office [announced via postgrant information from national office to epo] |
Ref country code: GB Payment date: 20250718 Year of fee payment: 10 |
|
| PGFP | Annual fee paid to national office [announced via postgrant information from national office to epo] |
Ref country code: FR Payment date: 20250716 Year of fee payment: 10 |