EP3320332B1 - Methods for generating ph/ionic concentration gradient near electrode surfaces for bubble detection using electrodes - Google Patents
Methods for generating ph/ionic concentration gradient near electrode surfaces for bubble detection using electrodes Download PDFInfo
- Publication number
- EP3320332B1 EP3320332B1 EP16735625.2A EP16735625A EP3320332B1 EP 3320332 B1 EP3320332 B1 EP 3320332B1 EP 16735625 A EP16735625 A EP 16735625A EP 3320332 B1 EP3320332 B1 EP 3320332B1
- Authority
- EP
- European Patent Office
- Prior art keywords
- electrodes
- solution
- biosensor
- electrode
- immobilized
- Prior art date
- Legal status (The legal status is an assumption and is not a legal conclusion. Google has not performed a legal analysis and makes no representation as to the accuracy of the status listed.)
- Active
Links
- 238000000034 method Methods 0.000 title claims description 110
- 238000001514 detection method Methods 0.000 title description 54
- 238000012360 testing method Methods 0.000 claims description 113
- 239000000523 sample Substances 0.000 claims description 72
- 150000002500 ions Chemical class 0.000 claims description 39
- 108091006047 fluorescent proteins Proteins 0.000 claims description 37
- 102000034287 fluorescent proteins Human genes 0.000 claims description 37
- 239000013543 active substance Substances 0.000 claims description 32
- 108010043121 Green Fluorescent Proteins Proteins 0.000 claims description 9
- 102000004144 Green Fluorescent Proteins Human genes 0.000 claims description 9
- 239000005090 green fluorescent protein Substances 0.000 claims description 9
- 230000001590 oxidative effect Effects 0.000 claims description 6
- 239000000243 solution Substances 0.000 description 151
- 239000010410 layer Substances 0.000 description 64
- 238000005259 measurement Methods 0.000 description 53
- 239000012491 analyte Substances 0.000 description 48
- 230000008859 change Effects 0.000 description 46
- AZQWKYJCGOJGHM-UHFFFAOYSA-N 1,4-benzoquinone Chemical compound O=C1C=CC(=O)C=C1 AZQWKYJCGOJGHM-UHFFFAOYSA-N 0.000 description 42
- 239000007864 aqueous solution Substances 0.000 description 42
- 150000004059 quinone derivatives Chemical class 0.000 description 40
- 239000000758 substrate Substances 0.000 description 37
- -1 poly(aniline) Polymers 0.000 description 34
- 238000012545 processing Methods 0.000 description 33
- 108090000790 Enzymes Proteins 0.000 description 32
- 102000004190 Enzymes Human genes 0.000 description 32
- 229940088598 enzyme Drugs 0.000 description 32
- 150000004053 quinones Chemical class 0.000 description 30
- XEKOWRVHYACXOJ-UHFFFAOYSA-N Ethyl acetate Chemical compound CCOC(C)=O XEKOWRVHYACXOJ-UHFFFAOYSA-N 0.000 description 29
- XLYOFNOQVPJJNP-UHFFFAOYSA-N water Substances O XLYOFNOQVPJJNP-UHFFFAOYSA-N 0.000 description 29
- 238000000576 coating method Methods 0.000 description 28
- 102000004169 proteins and genes Human genes 0.000 description 28
- 239000011248 coating agent Substances 0.000 description 27
- 108090000623 proteins and genes Proteins 0.000 description 27
- 239000012038 nucleophile Substances 0.000 description 24
- 229920000767 polyaniline Polymers 0.000 description 24
- 230000027455 binding Effects 0.000 description 23
- 239000011521 glass Substances 0.000 description 23
- 239000001257 hydrogen Substances 0.000 description 23
- 229910052739 hydrogen Inorganic materials 0.000 description 23
- 239000000203 mixture Substances 0.000 description 23
- 238000007254 oxidation reaction Methods 0.000 description 23
- 230000006870 function Effects 0.000 description 22
- 230000003647 oxidation Effects 0.000 description 22
- VYPSYNLAJGMNEJ-UHFFFAOYSA-N Silicium dioxide Chemical compound O=[Si]=O VYPSYNLAJGMNEJ-UHFFFAOYSA-N 0.000 description 21
- 239000007787 solid Substances 0.000 description 21
- 239000000872 buffer Substances 0.000 description 20
- 239000012472 biological sample Substances 0.000 description 19
- QIGBRXMKCJKVMJ-UHFFFAOYSA-N Hydroquinone Chemical compound OC1=CC=C(O)C=C1 QIGBRXMKCJKVMJ-UHFFFAOYSA-N 0.000 description 18
- 229920001223 polyethylene glycol Polymers 0.000 description 18
- 239000003112 inhibitor Substances 0.000 description 17
- 239000000126 substance Substances 0.000 description 17
- CIWBSHSKHKDKBQ-JLAZNSOCSA-N Ascorbic acid Chemical compound OC[C@H](O)[C@H]1OC(=O)C(O)=C1O CIWBSHSKHKDKBQ-JLAZNSOCSA-N 0.000 description 16
- 238000009792 diffusion process Methods 0.000 description 16
- 239000000463 material Substances 0.000 description 16
- VLKZOEOYAKHREP-UHFFFAOYSA-N n-Hexane Chemical class CCCCCC VLKZOEOYAKHREP-UHFFFAOYSA-N 0.000 description 16
- 230000009257 reactivity Effects 0.000 description 16
- 238000006722 reduction reaction Methods 0.000 description 16
- 239000002202 Polyethylene glycol Substances 0.000 description 15
- 230000004044 response Effects 0.000 description 15
- 239000012085 test solution Substances 0.000 description 15
- 238000006243 chemical reaction Methods 0.000 description 14
- 238000002474 experimental method Methods 0.000 description 13
- BASFCYQUMIYNBI-UHFFFAOYSA-N platinum Substances [Pt] BASFCYQUMIYNBI-UHFFFAOYSA-N 0.000 description 13
- 230000009467 reduction Effects 0.000 description 13
- 230000002829 reductive effect Effects 0.000 description 13
- WEVYAHXRMPXWCK-UHFFFAOYSA-N Acetonitrile Chemical compound CC#N WEVYAHXRMPXWCK-UHFFFAOYSA-N 0.000 description 12
- IAZDPXIOMUYVGZ-UHFFFAOYSA-N Dimethylsulphoxide Chemical compound CS(C)=O IAZDPXIOMUYVGZ-UHFFFAOYSA-N 0.000 description 12
- ZMXDDKWLCZADIW-UHFFFAOYSA-N N,N-Dimethylformamide Chemical compound CN(C)C=O ZMXDDKWLCZADIW-UHFFFAOYSA-N 0.000 description 12
- 230000001276 controlling effect Effects 0.000 description 12
- 235000019439 ethyl acetate Nutrition 0.000 description 12
- 108090000765 processed proteins & peptides Proteins 0.000 description 12
- 238000004458 analytical method Methods 0.000 description 11
- 230000000875 corresponding effect Effects 0.000 description 11
- 230000009977 dual effect Effects 0.000 description 11
- AMGQUBHHOARCQH-UHFFFAOYSA-N indium;oxotin Chemical compound [In].[Sn]=O AMGQUBHHOARCQH-UHFFFAOYSA-N 0.000 description 11
- 125000001424 substituent group Chemical group 0.000 description 11
- 239000000427 antigen Substances 0.000 description 10
- 210000004027 cell Anatomy 0.000 description 10
- 239000003795 chemical substances by application Substances 0.000 description 10
- 238000013461 design Methods 0.000 description 10
- 239000000377 silicon dioxide Substances 0.000 description 10
- 102000036639 antigens Human genes 0.000 description 9
- 108091007433 antigens Proteins 0.000 description 9
- 150000004054 benzoquinones Chemical class 0.000 description 9
- 238000003487 electrochemical reaction Methods 0.000 description 9
- PCHJSUWPFVWCPO-UHFFFAOYSA-N gold Chemical compound [Au] PCHJSUWPFVWCPO-UHFFFAOYSA-N 0.000 description 9
- 229910052737 gold Inorganic materials 0.000 description 9
- 239000010931 gold Substances 0.000 description 9
- 239000008363 phosphate buffer Substances 0.000 description 9
- 238000012546 transfer Methods 0.000 description 9
- CSNNHWWHGAXBCP-UHFFFAOYSA-L Magnesium sulfate Chemical compound [Mg+2].[O-][S+2]([O-])([O-])[O-] CSNNHWWHGAXBCP-UHFFFAOYSA-L 0.000 description 8
- 229910006069 SO3H Inorganic materials 0.000 description 8
- BQCADISMDOOEFD-UHFFFAOYSA-N Silver Chemical compound [Ag] BQCADISMDOOEFD-UHFFFAOYSA-N 0.000 description 8
- 229910021607 Silver chloride Inorganic materials 0.000 description 8
- 235000010323 ascorbic acid Nutrition 0.000 description 8
- 229960005070 ascorbic acid Drugs 0.000 description 8
- 239000011668 ascorbic acid Substances 0.000 description 8
- 230000003993 interaction Effects 0.000 description 8
- 230000008569 process Effects 0.000 description 8
- 102000004196 processed proteins & peptides Human genes 0.000 description 8
- 230000035945 sensitivity Effects 0.000 description 8
- 229910052709 silver Inorganic materials 0.000 description 8
- 239000004332 silver Substances 0.000 description 8
- HKZLPVFGJNLROG-UHFFFAOYSA-M silver monochloride Chemical compound [Cl-].[Ag+] HKZLPVFGJNLROG-UHFFFAOYSA-M 0.000 description 8
- 150000005208 1,4-dihydroxybenzenes Chemical class 0.000 description 7
- QTBSBXVTEAMEQO-UHFFFAOYSA-N Acetic acid Chemical compound CC(O)=O QTBSBXVTEAMEQO-UHFFFAOYSA-N 0.000 description 7
- UFHFLCQGNIYNRP-UHFFFAOYSA-N Hydrogen Chemical compound [H][H] UFHFLCQGNIYNRP-UHFFFAOYSA-N 0.000 description 7
- 108091034117 Oligonucleotide Proteins 0.000 description 7
- 150000001413 amino acids Chemical class 0.000 description 7
- 230000000694 effects Effects 0.000 description 7
- 239000002105 nanoparticle Substances 0.000 description 7
- OKTJSMMVPCPJKN-UHFFFAOYSA-N Carbon Chemical compound [C] OKTJSMMVPCPJKN-UHFFFAOYSA-N 0.000 description 6
- PMZURENOXWZQFD-UHFFFAOYSA-L Sodium Sulfate Chemical compound [Na+].[Na+].[O-]S([O-])(=O)=O PMZURENOXWZQFD-UHFFFAOYSA-L 0.000 description 6
- 230000002378 acidificating effect Effects 0.000 description 6
- 239000008364 bulk solution Substances 0.000 description 6
- 230000007423 decrease Effects 0.000 description 6
- 238000005516 engineering process Methods 0.000 description 6
- RWSXRVCMGQZWBV-WDSKDSINSA-N glutathione Chemical compound OC(=O)[C@@H](N)CCC(=O)N[C@@H](CS)C(=O)NCC(O)=O RWSXRVCMGQZWBV-WDSKDSINSA-N 0.000 description 6
- 239000011859 microparticle Substances 0.000 description 6
- 229910052697 platinum Inorganic materials 0.000 description 6
- 238000006479 redox reaction Methods 0.000 description 6
- 229910052938 sodium sulfate Inorganic materials 0.000 description 6
- 241000894007 species Species 0.000 description 6
- 238000006467 substitution reaction Methods 0.000 description 6
- 235000000346 sugar Nutrition 0.000 description 6
- DGAQECJNVWCQMB-PUAWFVPOSA-M Ilexoside XXIX Chemical compound C[C@@H]1CC[C@@]2(CC[C@@]3(C(=CC[C@H]4[C@]3(CC[C@@H]5[C@@]4(CC[C@@H](C5(C)C)OS(=O)(=O)[O-])C)C)[C@@H]2[C@]1(C)O)C)C(=O)O[C@H]6[C@@H]([C@H]([C@@H]([C@H](O6)CO)O)O)O.[Na+] DGAQECJNVWCQMB-PUAWFVPOSA-M 0.000 description 5
- QVGXLLKOCUKJST-UHFFFAOYSA-N atomic oxygen Chemical group [O] QVGXLLKOCUKJST-UHFFFAOYSA-N 0.000 description 5
- 239000006177 biological buffer Substances 0.000 description 5
- HTXDPTMKBJXEOW-UHFFFAOYSA-N dioxoiridium Chemical compound O=[Ir]=O HTXDPTMKBJXEOW-UHFFFAOYSA-N 0.000 description 5
- 239000007772 electrode material Substances 0.000 description 5
- 238000006056 electrooxidation reaction Methods 0.000 description 5
- 229910021397 glassy carbon Inorganic materials 0.000 description 5
- 229910021389 graphene Inorganic materials 0.000 description 5
- 150000004820 halides Chemical group 0.000 description 5
- 229910010272 inorganic material Inorganic materials 0.000 description 5
- 239000011147 inorganic material Substances 0.000 description 5
- 229910000457 iridium oxide Inorganic materials 0.000 description 5
- 239000007788 liquid Substances 0.000 description 5
- 229910052751 metal Inorganic materials 0.000 description 5
- 239000002184 metal Substances 0.000 description 5
- 229910044991 metal oxide Inorganic materials 0.000 description 5
- 150000004706 metal oxides Chemical class 0.000 description 5
- 238000002493 microarray Methods 0.000 description 5
- 239000001301 oxygen Substances 0.000 description 5
- 229910052760 oxygen Inorganic materials 0.000 description 5
- 229920000128 polypyrrole Polymers 0.000 description 5
- 239000011541 reaction mixture Substances 0.000 description 5
- YBJHBAHKTGYVGT-ZKWXMUAHSA-N (+)-Biotin Chemical compound N1C(=O)N[C@@H]2[C@H](CCCCC(=O)O)SC[C@@H]21 YBJHBAHKTGYVGT-ZKWXMUAHSA-N 0.000 description 4
- XKRFYHLGVUSROY-UHFFFAOYSA-N Argon Chemical compound [Ar] XKRFYHLGVUSROY-UHFFFAOYSA-N 0.000 description 4
- FXHOOIRPVKKKFG-UHFFFAOYSA-N N,N-Dimethylacetamide Chemical compound CN(C)C(C)=O FXHOOIRPVKKKFG-UHFFFAOYSA-N 0.000 description 4
- 239000007832 Na2SO4 Substances 0.000 description 4
- HEDRZPFGACZZDS-MICDWDOJSA-N Trichloro(2H)methane Chemical compound [2H]C(Cl)(Cl)Cl HEDRZPFGACZZDS-MICDWDOJSA-N 0.000 description 4
- 238000000137 annealing Methods 0.000 description 4
- 238000003556 assay Methods 0.000 description 4
- 230000003139 buffering effect Effects 0.000 description 4
- 235000019846 buffering salt Nutrition 0.000 description 4
- 125000003178 carboxy group Chemical group [H]OC(*)=O 0.000 description 4
- 230000009260 cross reactivity Effects 0.000 description 4
- 230000001419 dependent effect Effects 0.000 description 4
- ZOMNIUBKTOKEHS-UHFFFAOYSA-L dimercury dichloride Chemical class Cl[Hg][Hg]Cl ZOMNIUBKTOKEHS-UHFFFAOYSA-L 0.000 description 4
- 239000003792 electrolyte Substances 0.000 description 4
- 238000006911 enzymatic reaction Methods 0.000 description 4
- 150000002431 hydrogen Chemical class 0.000 description 4
- 230000002452 interceptive effect Effects 0.000 description 4
- 238000004020 luminiscence type Methods 0.000 description 4
- 229910052943 magnesium sulfate Inorganic materials 0.000 description 4
- QSHDDOUJBYECFT-UHFFFAOYSA-N mercury Chemical compound [Hg] QSHDDOUJBYECFT-UHFFFAOYSA-N 0.000 description 4
- 229910052753 mercury Inorganic materials 0.000 description 4
- 238000012544 monitoring process Methods 0.000 description 4
- 150000002791 naphthoquinones Chemical class 0.000 description 4
- 230000007935 neutral effect Effects 0.000 description 4
- 108020004707 nucleic acids Proteins 0.000 description 4
- 102000039446 nucleic acids Human genes 0.000 description 4
- 150000007523 nucleic acids Chemical class 0.000 description 4
- 239000011368 organic material Substances 0.000 description 4
- 238000001139 pH measurement Methods 0.000 description 4
- 229920000642 polymer Polymers 0.000 description 4
- 239000000843 powder Substances 0.000 description 4
- 150000008163 sugars Chemical class 0.000 description 4
- 125000000020 sulfo group Chemical group O=S(=O)([*])O[H] 0.000 description 4
- 239000010409 thin film Substances 0.000 description 4
- 230000001960 triggered effect Effects 0.000 description 4
- 150000005206 1,2-dihydroxybenzenes Chemical class 0.000 description 3
- 238000005160 1H NMR spectroscopy Methods 0.000 description 3
- 230000006820 DNA synthesis Effects 0.000 description 3
- YMWUJEATGCHHMB-UHFFFAOYSA-N Dichloromethane Chemical compound ClCCl YMWUJEATGCHHMB-UHFFFAOYSA-N 0.000 description 3
- RTZKZFJDLAIYFH-UHFFFAOYSA-N Diethyl ether Chemical compound CCOCC RTZKZFJDLAIYFH-UHFFFAOYSA-N 0.000 description 3
- 108010024636 Glutathione Proteins 0.000 description 3
- MHAJPDPJQMAIIY-UHFFFAOYSA-N Hydrogen peroxide Chemical compound OO MHAJPDPJQMAIIY-UHFFFAOYSA-N 0.000 description 3
- OKKJLVBELUTLKV-UHFFFAOYSA-N Methanol Chemical compound OC OKKJLVBELUTLKV-UHFFFAOYSA-N 0.000 description 3
- 108090000854 Oxidoreductases Proteins 0.000 description 3
- 102000004316 Oxidoreductases Human genes 0.000 description 3
- HEMHJVSKTPXQMS-UHFFFAOYSA-M Sodium hydroxide Chemical compound [OH-].[Na+] HEMHJVSKTPXQMS-UHFFFAOYSA-M 0.000 description 3
- 239000000654 additive Substances 0.000 description 3
- 239000000853 adhesive Substances 0.000 description 3
- 230000001070 adhesive effect Effects 0.000 description 3
- 150000001412 amines Chemical class 0.000 description 3
- PYKYMHQGRFAEBM-UHFFFAOYSA-N anthraquinone Natural products CCC(=O)c1c(O)c2C(=O)C3C(C=CC=C3O)C(=O)c2cc1CC(=O)OC PYKYMHQGRFAEBM-UHFFFAOYSA-N 0.000 description 3
- 238000011948 assay development Methods 0.000 description 3
- 230000004888 barrier function Effects 0.000 description 3
- 230000008901 benefit Effects 0.000 description 3
- 230000005540 biological transmission Effects 0.000 description 3
- 239000000090 biomarker Substances 0.000 description 3
- 230000015572 biosynthetic process Effects 0.000 description 3
- 229910052794 bromium Inorganic materials 0.000 description 3
- 239000003990 capacitor Substances 0.000 description 3
- 150000001768 cations Chemical class 0.000 description 3
- XMPZTFVPEKAKFH-UHFFFAOYSA-P ceric ammonium nitrate Chemical compound [NH4+].[NH4+].[Ce+4].[O-][N+]([O-])=O.[O-][N+]([O-])=O.[O-][N+]([O-])=O.[O-][N+]([O-])=O.[O-][N+]([O-])=O.[O-][N+]([O-])=O XMPZTFVPEKAKFH-UHFFFAOYSA-P 0.000 description 3
- 239000003638 chemical reducing agent Substances 0.000 description 3
- 229910052801 chlorine Inorganic materials 0.000 description 3
- 238000004440 column chromatography Methods 0.000 description 3
- 150000001875 compounds Chemical class 0.000 description 3
- 230000008878 coupling Effects 0.000 description 3
- 238000010168 coupling process Methods 0.000 description 3
- 238000005859 coupling reaction Methods 0.000 description 3
- 238000001914 filtration Methods 0.000 description 3
- 229910052731 fluorine Inorganic materials 0.000 description 3
- 229960003180 glutathione Drugs 0.000 description 3
- 125000002887 hydroxy group Chemical group [H]O* 0.000 description 3
- 238000011534 incubation Methods 0.000 description 3
- 230000006698 induction Effects 0.000 description 3
- 230000002401 inhibitory effect Effects 0.000 description 3
- 229910052740 iodine Inorganic materials 0.000 description 3
- 239000012044 organic layer Substances 0.000 description 3
- 239000003960 organic solvent Substances 0.000 description 3
- 229920003023 plastic Polymers 0.000 description 3
- 239000004033 plastic Substances 0.000 description 3
- NLKNQRATVPKPDG-UHFFFAOYSA-M potassium iodide Chemical compound [K+].[I-] NLKNQRATVPKPDG-UHFFFAOYSA-M 0.000 description 3
- 239000011734 sodium Substances 0.000 description 3
- CSMWJXBSXGUPGY-UHFFFAOYSA-L sodium dithionate Chemical compound [Na+].[Na+].[O-]S(=O)(=O)S([O-])(=O)=O CSMWJXBSXGUPGY-UHFFFAOYSA-L 0.000 description 3
- 229940075931 sodium dithionate Drugs 0.000 description 3
- 239000007858 starting material Substances 0.000 description 3
- 238000003786 synthesis reaction Methods 0.000 description 3
- 150000003573 thiols Chemical class 0.000 description 3
- KETQAJRQOHHATG-UHFFFAOYSA-N 1,2-naphthoquinone Chemical compound C1=CC=C2C(=O)C(=O)C=CC2=C1 KETQAJRQOHHATG-UHFFFAOYSA-N 0.000 description 2
- OHBQPCCCRFSCAX-UHFFFAOYSA-N 1,4-Dimethoxybenzene Chemical compound COC1=CC=C(OC)C=C1 OHBQPCCCRFSCAX-UHFFFAOYSA-N 0.000 description 2
- 150000004057 1,4-benzoquinones Chemical class 0.000 description 2
- YONSJCAXAJEYGM-UHFFFAOYSA-N 1,4-bis(bromomethyl)-2,5-dimethoxybenzene Chemical compound COC1=CC(CBr)=C(OC)C=C1CBr YONSJCAXAJEYGM-UHFFFAOYSA-N 0.000 description 2
- FRASJONUBLZVQX-UHFFFAOYSA-N 1,4-naphthoquinone Chemical compound C1=CC=C2C(=O)C=CC(=O)C2=C1 FRASJONUBLZVQX-UHFFFAOYSA-N 0.000 description 2
- QFSYADJLNBHAKO-UHFFFAOYSA-N 2,5-dihydroxy-1,4-benzoquinone Chemical compound OC1=CC(=O)C(O)=CC1=O QFSYADJLNBHAKO-UHFFFAOYSA-N 0.000 description 2
- CDAWCLOXVUBKRW-UHFFFAOYSA-N 2-aminophenol Chemical compound NC1=CC=CC=C1O CDAWCLOXVUBKRW-UHFFFAOYSA-N 0.000 description 2
- PBVAJRFEEOIAGW-UHFFFAOYSA-N 3-[bis(2-carboxyethyl)phosphanyl]propanoic acid;hydrochloride Chemical compound Cl.OC(=O)CCP(CCC(O)=O)CCC(O)=O PBVAJRFEEOIAGW-UHFFFAOYSA-N 0.000 description 2
- IJGRMHOSHXDMSA-UHFFFAOYSA-N Atomic nitrogen Chemical compound N#N IJGRMHOSHXDMSA-UHFFFAOYSA-N 0.000 description 2
- 0 CC1*C*(C)(*)C*1 Chemical compound CC1*C*(C)(*)C*1 0.000 description 2
- HEDRZPFGACZZDS-UHFFFAOYSA-N Chloroform Chemical compound ClC(Cl)Cl HEDRZPFGACZZDS-UHFFFAOYSA-N 0.000 description 2
- 108020005199 Dehydrogenases Proteins 0.000 description 2
- 238000012286 ELISA Assay Methods 0.000 description 2
- WQZGKKKJIJFFOK-GASJEMHNSA-N Glucose Natural products OC[C@H]1OC(O)[C@H](O)[C@@H](O)[C@@H]1O WQZGKKKJIJFFOK-GASJEMHNSA-N 0.000 description 2
- 108010015776 Glucose oxidase Proteins 0.000 description 2
- 239000004366 Glucose oxidase Substances 0.000 description 2
- 102000003886 Glycoproteins Human genes 0.000 description 2
- 108090000288 Glycoproteins Proteins 0.000 description 2
- OAKJQQAXSVQMHS-UHFFFAOYSA-N Hydrazine Chemical compound NN OAKJQQAXSVQMHS-UHFFFAOYSA-N 0.000 description 2
- CPELXLSAUQHCOX-UHFFFAOYSA-N Hydrogen bromide Chemical compound Br CPELXLSAUQHCOX-UHFFFAOYSA-N 0.000 description 2
- 108010093096 Immobilized Enzymes Proteins 0.000 description 2
- 238000006845 Michael addition reaction Methods 0.000 description 2
- 229930192627 Naphthoquinone Natural products 0.000 description 2
- 229920002518 Polyallylamine hydrochloride Polymers 0.000 description 2
- 229920002873 Polyethylenimine Polymers 0.000 description 2
- WCUXLLCKKVVCTQ-UHFFFAOYSA-M Potassium chloride Chemical compound [Cl-].[K+] WCUXLLCKKVVCTQ-UHFFFAOYSA-M 0.000 description 2
- 229910052581 Si3N4 Inorganic materials 0.000 description 2
- GWEVSGVZZGPLCZ-UHFFFAOYSA-N Titan oxide Chemical compound O=[Ti]=O GWEVSGVZZGPLCZ-UHFFFAOYSA-N 0.000 description 2
- 108010046334 Urease Proteins 0.000 description 2
- XLOMVQKBTHCTTD-UHFFFAOYSA-N Zinc monoxide Chemical compound [Zn]=O XLOMVQKBTHCTTD-UHFFFAOYSA-N 0.000 description 2
- 229960000583 acetic acid Drugs 0.000 description 2
- 230000002411 adverse Effects 0.000 description 2
- PNEYBMLMFCGWSK-UHFFFAOYSA-N aluminium oxide Inorganic materials [O-2].[O-2].[O-2].[Al+3].[Al+3] PNEYBMLMFCGWSK-UHFFFAOYSA-N 0.000 description 2
- 150000004056 anthraquinones Chemical class 0.000 description 2
- 229910052786 argon Inorganic materials 0.000 description 2
- 125000004429 atom Chemical group 0.000 description 2
- WQZGKKKJIJFFOK-VFUOTHLCSA-N beta-D-glucose Chemical compound OC[C@H]1O[C@@H](O)[C@H](O)[C@@H](O)[C@@H]1O WQZGKKKJIJFFOK-VFUOTHLCSA-N 0.000 description 2
- 229960002685 biotin Drugs 0.000 description 2
- 235000020958 biotin Nutrition 0.000 description 2
- 239000011616 biotin Substances 0.000 description 2
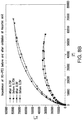
- 238000011088 calibration curve Methods 0.000 description 2
- YCIMNLLNPGFGHC-UHFFFAOYSA-N catechol Chemical compound OC1=CC=CC=C1O YCIMNLLNPGFGHC-UHFFFAOYSA-N 0.000 description 2
- 238000004113 cell culture Methods 0.000 description 2
- 210000000170 cell membrane Anatomy 0.000 description 2
- 239000003153 chemical reaction reagent Substances 0.000 description 2
- 239000003086 colorant Substances 0.000 description 2
- 238000004891 communication Methods 0.000 description 2
- 230000001268 conjugating effect Effects 0.000 description 2
- 238000001816 cooling Methods 0.000 description 2
- 239000006184 cosolvent Substances 0.000 description 2
- 239000013078 crystal Substances 0.000 description 2
- 238000004925 denaturation Methods 0.000 description 2
- 230000036425 denaturation Effects 0.000 description 2
- 238000011161 development Methods 0.000 description 2
- 201000010099 disease Diseases 0.000 description 2
- 208000037265 diseases, disorders, signs and symptoms Diseases 0.000 description 2
- 230000005684 electric field Effects 0.000 description 2
- 238000002848 electrochemical method Methods 0.000 description 2
- 230000005518 electrochemistry Effects 0.000 description 2
- 238000001962 electrophoresis Methods 0.000 description 2
- 239000011888 foil Substances 0.000 description 2
- 239000008103 glucose Substances 0.000 description 2
- 229940116332 glucose oxidase Drugs 0.000 description 2
- 235000019420 glucose oxidase Nutrition 0.000 description 2
- 239000012433 hydrogen halide Substances 0.000 description 2
- 229910000039 hydrogen halide Inorganic materials 0.000 description 2
- GPRLSGONYQIRFK-UHFFFAOYSA-N hydron Chemical compound [H+] GPRLSGONYQIRFK-UHFFFAOYSA-N 0.000 description 2
- XLYOFNOQVPJJNP-UHFFFAOYSA-M hydroxide Chemical compound [OH-] XLYOFNOQVPJJNP-UHFFFAOYSA-M 0.000 description 2
- CBOIHMRHGLHBPB-UHFFFAOYSA-N hydroxymethyl Chemical compound O[CH2] CBOIHMRHGLHBPB-UHFFFAOYSA-N 0.000 description 2
- 238000010348 incorporation Methods 0.000 description 2
- PNDPGZBMCMUPRI-UHFFFAOYSA-N iodine Chemical compound II PNDPGZBMCMUPRI-UHFFFAOYSA-N 0.000 description 2
- 238000003475 lamination Methods 0.000 description 2
- 239000003446 ligand Substances 0.000 description 2
- 238000004518 low pressure chemical vapour deposition Methods 0.000 description 2
- 238000004519 manufacturing process Methods 0.000 description 2
- 230000007246 mechanism Effects 0.000 description 2
- 125000001064 morpholinomethyl group Chemical group [H]C([H])(*)N1C([H])([H])C([H])([H])OC([H])([H])C1([H])[H] 0.000 description 2
- RQNVIKXOOKXAJQ-UHFFFAOYSA-N naphthazarin Chemical compound O=C1C=CC(=O)C2=C1C(O)=CC=C2O RQNVIKXOOKXAJQ-UHFFFAOYSA-N 0.000 description 2
- 230000000269 nucleophilic effect Effects 0.000 description 2
- 239000007800 oxidant agent Substances 0.000 description 2
- 238000002161 passivation Methods 0.000 description 2
- 230000002093 peripheral effect Effects 0.000 description 2
- 239000012071 phase Substances 0.000 description 2
- 239000002953 phosphate buffered saline Substances 0.000 description 2
- 238000000623 plasma-assisted chemical vapour deposition Methods 0.000 description 2
- 229920000075 poly(4-vinylpyridine) Polymers 0.000 description 2
- 229920000371 poly(diallyldimethylammonium chloride) polymer Polymers 0.000 description 2
- IOLCXVTUBQKXJR-UHFFFAOYSA-M potassium bromide Chemical compound [K+].[Br-] IOLCXVTUBQKXJR-UHFFFAOYSA-M 0.000 description 2
- BWHMMNNQKKPAPP-UHFFFAOYSA-L potassium carbonate Chemical compound [K+].[K+].[O-]C([O-])=O BWHMMNNQKKPAPP-UHFFFAOYSA-L 0.000 description 2
- FGIUAXJPYTZDNR-UHFFFAOYSA-N potassium nitrate Chemical compound [K+].[O-][N+]([O-])=O FGIUAXJPYTZDNR-UHFFFAOYSA-N 0.000 description 2
- 230000027756 respiratory electron transport chain Effects 0.000 description 2
- 230000002441 reversible effect Effects 0.000 description 2
- 210000002966 serum Anatomy 0.000 description 2
- 238000007493 shaping process Methods 0.000 description 2
- HQVNEWCFYHHQES-UHFFFAOYSA-N silicon nitride Chemical compound N12[Si]34N5[Si]62N3[Si]51N64 HQVNEWCFYHHQES-UHFFFAOYSA-N 0.000 description 2
- 235000015424 sodium Nutrition 0.000 description 2
- FVAUCKIRQBBSSJ-UHFFFAOYSA-M sodium iodide Inorganic materials [Na+].[I-] FVAUCKIRQBBSSJ-UHFFFAOYSA-M 0.000 description 2
- 235000011152 sodium sulphate Nutrition 0.000 description 2
- 230000000638 stimulation Effects 0.000 description 2
- 239000004094 surface-active agent Substances 0.000 description 2
- 125000005207 tetraalkylammonium group Chemical group 0.000 description 2
- 238000002366 time-of-flight method Methods 0.000 description 2
- 230000009466 transformation Effects 0.000 description 2
- 230000000007 visual effect Effects 0.000 description 2
- 238000005406 washing Methods 0.000 description 2
- WOAHJDHKFWSLKE-UHFFFAOYSA-N 1,2-benzoquinone Chemical compound O=C1C=CC=CC1=O WOAHJDHKFWSLKE-UHFFFAOYSA-N 0.000 description 1
- 150000004055 1,2-benzoquinones Chemical class 0.000 description 1
- 229940005561 1,4-benzoquinone Drugs 0.000 description 1
- CEGOOGROFAHQDS-UHFFFAOYSA-N 1,4-dimethoxy-2,5-bis(methoxymethyl)benzene Chemical compound COC1=C(C=C(C(=C1)COC)OC)COC CEGOOGROFAHQDS-UHFFFAOYSA-N 0.000 description 1
- 238000001644 13C nuclear magnetic resonance spectroscopy Methods 0.000 description 1
- YHUMTHWQGWPJOQ-UHFFFAOYSA-N 2,6-dichloro-4-chloroiminocyclohexa-2,5-dien-1-one Chemical compound ClN=C1C=C(Cl)C(=O)C(Cl)=C1 YHUMTHWQGWPJOQ-UHFFFAOYSA-N 0.000 description 1
- VTWDKFNVVLAELH-UHFFFAOYSA-N 2-methylcyclohexa-2,5-diene-1,4-dione Chemical class CC1=CC(=O)C=CC1=O VTWDKFNVVLAELH-UHFFFAOYSA-N 0.000 description 1
- ICNFHJVPAJKPHW-UHFFFAOYSA-N 4,4'-Thiodianiline Chemical group C1=CC(N)=CC=C1SC1=CC=C(N)C=C1 ICNFHJVPAJKPHW-UHFFFAOYSA-N 0.000 description 1
- 125000001292 4,6-dihydroxy-1,3-phenylene group Chemical group OC1=C(C=C(C(=C1)O)*)* 0.000 description 1
- RZVHIXYEVGDQDX-UHFFFAOYSA-N 9,10-anthraquinone Chemical compound C1=CC=C2C(=O)C3=CC=CC=C3C(=O)C2=C1 RZVHIXYEVGDQDX-UHFFFAOYSA-N 0.000 description 1
- 229940076442 9,10-anthraquinone Drugs 0.000 description 1
- CPELXLSAUQHCOX-UHFFFAOYSA-M Bromide Chemical compound [Br-] CPELXLSAUQHCOX-UHFFFAOYSA-M 0.000 description 1
- WKBOTKDWSSQWDR-UHFFFAOYSA-N Bromine atom Chemical class [Br] WKBOTKDWSSQWDR-UHFFFAOYSA-N 0.000 description 1
- 102000014914 Carrier Proteins Human genes 0.000 description 1
- 239000004971 Cross linker Substances 0.000 description 1
- RGHNJXZEOKUKBD-SQOUGZDYSA-N D-gluconic acid Chemical compound OC[C@@H](O)[C@@H](O)[C@H](O)[C@@H](O)C(O)=O RGHNJXZEOKUKBD-SQOUGZDYSA-N 0.000 description 1
- 238000000018 DNA microarray Methods 0.000 description 1
- 238000001712 DNA sequencing Methods 0.000 description 1
- MYMOFIZGZYHOMD-UHFFFAOYSA-N Dioxygen Chemical compound O=O MYMOFIZGZYHOMD-UHFFFAOYSA-N 0.000 description 1
- CTENFNNZBMHDDG-UHFFFAOYSA-N Dopamine hydrochloride Chemical compound Cl.NCCC1=CC=C(O)C(O)=C1 CTENFNNZBMHDDG-UHFFFAOYSA-N 0.000 description 1
- GYHNNYVSQQEPJS-UHFFFAOYSA-N Gallium Chemical compound [Ga] GYHNNYVSQQEPJS-UHFFFAOYSA-N 0.000 description 1
- 229930186217 Glycolipid Natural products 0.000 description 1
- 102000003839 Human Proteins Human genes 0.000 description 1
- 108090000144 Human Proteins Proteins 0.000 description 1
- 102000008394 Immunoglobulin Fragments Human genes 0.000 description 1
- 108010021625 Immunoglobulin Fragments Proteins 0.000 description 1
- 102000004856 Lectins Human genes 0.000 description 1
- 108090001090 Lectins Proteins 0.000 description 1
- PEEHTFAAVSWFBL-UHFFFAOYSA-N Maleimide Chemical group O=C1NC(=O)C=C1 PEEHTFAAVSWFBL-UHFFFAOYSA-N 0.000 description 1
- 238000005481 NMR spectroscopy Methods 0.000 description 1
- 108091005461 Nucleic proteins Proteins 0.000 description 1
- 229910019142 PO4 Inorganic materials 0.000 description 1
- 229930040373 Paraformaldehyde Natural products 0.000 description 1
- ZLMJMSJWJFRBEC-UHFFFAOYSA-N Potassium Chemical compound [K] ZLMJMSJWJFRBEC-UHFFFAOYSA-N 0.000 description 1
- CZPWVGJYEJSRLH-UHFFFAOYSA-N Pyrimidine Chemical compound C1=CN=CN=C1 CZPWVGJYEJSRLH-UHFFFAOYSA-N 0.000 description 1
- BLRPTPMANUNPDV-UHFFFAOYSA-N Silane Chemical compound [SiH4] BLRPTPMANUNPDV-UHFFFAOYSA-N 0.000 description 1
- 108010090804 Streptavidin Chemical group 0.000 description 1
- BJNJOYZVNBYAJL-UHFFFAOYSA-N [4-(hydroxymethyl)-2,5-dimethoxyphenyl]methanol Chemical compound COC1=CC(CO)=C(OC)C=C1CO BJNJOYZVNBYAJL-UHFFFAOYSA-N 0.000 description 1
- ZBIKORITPGTTGI-UHFFFAOYSA-N [acetyloxy(phenyl)-$l^{3}-iodanyl] acetate Chemical compound CC(=O)OI(OC(C)=O)C1=CC=CC=C1 ZBIKORITPGTTGI-UHFFFAOYSA-N 0.000 description 1
- 230000009471 action Effects 0.000 description 1
- 230000000996 additive effect Effects 0.000 description 1
- 239000000556 agonist Substances 0.000 description 1
- 150000001299 aldehydes Chemical class 0.000 description 1
- 150000001345 alkine derivatives Chemical group 0.000 description 1
- 125000003545 alkoxy group Chemical group 0.000 description 1
- 125000000217 alkyl group Chemical group 0.000 description 1
- 125000003277 amino group Chemical group 0.000 description 1
- MDFFNEOEWAXZRQ-UHFFFAOYSA-N aminyl Chemical compound [NH2] MDFFNEOEWAXZRQ-UHFFFAOYSA-N 0.000 description 1
- 229910021417 amorphous silicon Inorganic materials 0.000 description 1
- 239000005557 antagonist Substances 0.000 description 1
- 230000003373 anti-fouling effect Effects 0.000 description 1
- 229940027987 antiseptic and disinfectant phenol and derivative Drugs 0.000 description 1
- 239000012062 aqueous buffer Substances 0.000 description 1
- 150000001491 aromatic compounds Chemical class 0.000 description 1
- 238000007836 assay cartridge Methods 0.000 description 1
- 150000001540 azides Chemical group 0.000 description 1
- 235000008452 baby food Nutrition 0.000 description 1
- 235000019539 baby water Nutrition 0.000 description 1
- 239000002585 base Substances 0.000 description 1
- 108091008324 binding proteins Proteins 0.000 description 1
- 230000003851 biochemical process Effects 0.000 description 1
- 210000004369 blood Anatomy 0.000 description 1
- 239000008280 blood Substances 0.000 description 1
- 210000001124 body fluid Anatomy 0.000 description 1
- 239000010839 body fluid Substances 0.000 description 1
- 239000012267 brine Substances 0.000 description 1
- 239000000337 buffer salt Substances 0.000 description 1
- 239000008366 buffered solution Substances 0.000 description 1
- 239000006172 buffering agent Substances 0.000 description 1
- 238000004364 calculation method Methods 0.000 description 1
- 150000001720 carbohydrates Chemical class 0.000 description 1
- 235000014633 carbohydrates Nutrition 0.000 description 1
- 229910052799 carbon Inorganic materials 0.000 description 1
- HJMZMZRCABDKKV-UHFFFAOYSA-N carbonocyanidic acid Chemical group OC(=O)C#N HJMZMZRCABDKKV-UHFFFAOYSA-N 0.000 description 1
- 150000001733 carboxylic acid esters Chemical group 0.000 description 1
- 230000015556 catabolic process Effects 0.000 description 1
- 230000010261 cell growth Effects 0.000 description 1
- 238000002038 chemiluminescence detection Methods 0.000 description 1
- 125000001309 chloro group Chemical group Cl* 0.000 description 1
- 238000004737 colorimetric analysis Methods 0.000 description 1
- 239000002131 composite material Substances 0.000 description 1
- 239000004020 conductor Substances 0.000 description 1
- 239000000470 constituent Substances 0.000 description 1
- 230000002596 correlated effect Effects 0.000 description 1
- 239000002577 cryoprotective agent Substances 0.000 description 1
- 108010082025 cyan fluorescent protein Proteins 0.000 description 1
- 125000004122 cyclic group Chemical group 0.000 description 1
- 238000002484 cyclic voltammetry Methods 0.000 description 1
- 230000001351 cycling effect Effects 0.000 description 1
- JVXNCJLLOUQYBF-UHFFFAOYSA-N cyclohex-4-ene-1,3-dione Chemical compound O=C1CC=CC(=O)C1 JVXNCJLLOUQYBF-UHFFFAOYSA-N 0.000 description 1
- QDXSUIQGHSQXLF-UHFFFAOYSA-N cyclohexa-2,5-diene-1,4-dione decane-1-thiol Chemical class O=C1C=CC(=O)C=C1.CCCCCCCCCCS QDXSUIQGHSQXLF-UHFFFAOYSA-N 0.000 description 1
- 238000007405 data analysis Methods 0.000 description 1
- 238000013144 data compression Methods 0.000 description 1
- 238000006731 degradation reaction Methods 0.000 description 1
- 230000001066 destructive effect Effects 0.000 description 1
- 238000002405 diagnostic procedure Methods 0.000 description 1
- 238000010586 diagram Methods 0.000 description 1
- 229910003460 diamond Inorganic materials 0.000 description 1
- 239000010432 diamond Substances 0.000 description 1
- 229910001882 dioxygen Inorganic materials 0.000 description 1
- LOKCTEFSRHRXRJ-UHFFFAOYSA-I dipotassium trisodium dihydrogen phosphate hydrogen phosphate dichloride Chemical compound P(=O)(O)(O)[O-].[K+].P(=O)(O)([O-])[O-].[Na+].[Na+].[Cl-].[K+].[Cl-].[Na+] LOKCTEFSRHRXRJ-UHFFFAOYSA-I 0.000 description 1
- JICJOAMNCDEKAO-UHFFFAOYSA-L dipotassium;9,10-dioxoanthracene-2,6-disulfonate Chemical compound [K+].[K+].[O-]S(=O)(=O)C1=CC=C2C(=O)C3=CC(S(=O)(=O)[O-])=CC=C3C(=O)C2=C1 JICJOAMNCDEKAO-UHFFFAOYSA-L 0.000 description 1
- AXZAYXJCENRGIM-UHFFFAOYSA-J dipotassium;tetrabromoplatinum(2-) Chemical compound [K+].[K+].[Br-].[Br-].[Br-].[Br-].[Pt+2] AXZAYXJCENRGIM-UHFFFAOYSA-J 0.000 description 1
- 238000004090 dissolution Methods 0.000 description 1
- VHJLVAABSRFDPM-QWWZWVQMSA-N dithiothreitol Chemical compound SC[C@@H](O)[C@H](O)CS VHJLVAABSRFDPM-QWWZWVQMSA-N 0.000 description 1
- 229960001149 dopamine hydrochloride Drugs 0.000 description 1
- 239000003814 drug Substances 0.000 description 1
- 239000000975 dye Substances 0.000 description 1
- 238000002593 electrical impedance tomography Methods 0.000 description 1
- 239000012777 electrically insulating material Substances 0.000 description 1
- 239000011263 electroactive material Substances 0.000 description 1
- 238000005868 electrolysis reaction Methods 0.000 description 1
- 125000006575 electron-withdrawing group Chemical group 0.000 description 1
- 230000008030 elimination Effects 0.000 description 1
- 238000003379 elimination reaction Methods 0.000 description 1
- 230000002255 enzymatic effect Effects 0.000 description 1
- DNJIEGIFACGWOD-UHFFFAOYSA-N ethyl mercaptane Natural products CCS DNJIEGIFACGWOD-UHFFFAOYSA-N 0.000 description 1
- 238000011156 evaluation Methods 0.000 description 1
- 230000008713 feedback mechanism Effects 0.000 description 1
- 239000010408 film Substances 0.000 description 1
- 238000007667 floating Methods 0.000 description 1
- 238000001917 fluorescence detection Methods 0.000 description 1
- 125000000524 functional group Chemical group 0.000 description 1
- 229910052733 gallium Inorganic materials 0.000 description 1
- 239000007789 gas Substances 0.000 description 1
- 238000007429 general method Methods 0.000 description 1
- 239000012362 glacial acetic acid Substances 0.000 description 1
- 125000002791 glucosyl group Chemical group C1([C@H](O)[C@@H](O)[C@H](O)[C@H](O1)CO)* 0.000 description 1
- 150000002343 gold Chemical class 0.000 description 1
- XLYOFNOQVPJJNP-ZSJDYOACSA-N heavy water Substances [2H]O[2H] XLYOFNOQVPJJNP-ZSJDYOACSA-N 0.000 description 1
- 150000002429 hydrazines Chemical class 0.000 description 1
- XMBWDFGMSWQBCA-UHFFFAOYSA-N hydrogen iodide Chemical compound I XMBWDFGMSWQBCA-UHFFFAOYSA-N 0.000 description 1
- 230000007062 hydrolysis Effects 0.000 description 1
- 238000006460 hydrolysis reaction Methods 0.000 description 1
- 230000003100 immobilizing effect Effects 0.000 description 1
- 238000003018 immunoassay Methods 0.000 description 1
- 229910052738 indium Inorganic materials 0.000 description 1
- APFVFJFRJDLVQX-UHFFFAOYSA-N indium atom Chemical compound [In] APFVFJFRJDLVQX-UHFFFAOYSA-N 0.000 description 1
- 229910003437 indium oxide Inorganic materials 0.000 description 1
- RHZWSUVWRRXEJF-UHFFFAOYSA-N indium tin Chemical compound [In].[Sn] RHZWSUVWRRXEJF-UHFFFAOYSA-N 0.000 description 1
- PJXISJQVUVHSOJ-UHFFFAOYSA-N indium(iii) oxide Chemical compound [O-2].[O-2].[O-2].[In+3].[In+3] PJXISJQVUVHSOJ-UHFFFAOYSA-N 0.000 description 1
- 238000001155 isoelectric focusing Methods 0.000 description 1
- 238000007273 lactonization reaction Methods 0.000 description 1
- CSFWPUWCSPOLJW-UHFFFAOYSA-N lawsone Chemical compound C1=CC=C2C(=O)C(O)=CC(=O)C2=C1 CSFWPUWCSPOLJW-UHFFFAOYSA-N 0.000 description 1
- 239000002523 lectin Substances 0.000 description 1
- 230000000670 limiting effect Effects 0.000 description 1
- 150000002632 lipids Chemical class 0.000 description 1
- 239000004973 liquid crystal related substance Substances 0.000 description 1
- 238000003374 lysate array Methods 0.000 description 1
- 229920002521 macromolecule Polymers 0.000 description 1
- 230000014759 maintenance of location Effects 0.000 description 1
- 150000002739 metals Chemical class 0.000 description 1
- 125000000956 methoxy group Chemical group [H]C([H])([H])O* 0.000 description 1
- 125000004184 methoxymethyl group Chemical group [H]C([H])([H])OC([H])([H])* 0.000 description 1
- 238000000386 microscopy Methods 0.000 description 1
- 235000013336 milk Nutrition 0.000 description 1
- 239000008267 milk Substances 0.000 description 1
- 210000004080 milk Anatomy 0.000 description 1
- 238000002156 mixing Methods 0.000 description 1
- 150000004767 nitrides Chemical class 0.000 description 1
- 229910052757 nitrogen Inorganic materials 0.000 description 1
- 230000009871 nonspecific binding Effects 0.000 description 1
- 238000010606 normalization Methods 0.000 description 1
- 238000000655 nuclear magnetic resonance spectrum Methods 0.000 description 1
- 239000002777 nucleoside Substances 0.000 description 1
- 125000003835 nucleoside group Chemical group 0.000 description 1
- 239000002773 nucleotide Substances 0.000 description 1
- 125000003729 nucleotide group Chemical group 0.000 description 1
- 230000003287 optical effect Effects 0.000 description 1
- 150000007530 organic bases Chemical class 0.000 description 1
- 239000012074 organic phase Substances 0.000 description 1
- 229920002866 paraformaldehyde Polymers 0.000 description 1
- NBIIXXVUZAFLBC-UHFFFAOYSA-K phosphate Chemical compound [O-]P([O-])([O-])=O NBIIXXVUZAFLBC-UHFFFAOYSA-K 0.000 description 1
- 239000010452 phosphate Substances 0.000 description 1
- 238000004375 physisorption Methods 0.000 description 1
- 229910021420 polycrystalline silicon Inorganic materials 0.000 description 1
- 229920005591 polysilicon Polymers 0.000 description 1
- 238000012805 post-processing Methods 0.000 description 1
- 239000011591 potassium Substances 0.000 description 1
- 229910052700 potassium Inorganic materials 0.000 description 1
- 229910000027 potassium carbonate Inorganic materials 0.000 description 1
- 239000001103 potassium chloride Substances 0.000 description 1
- 235000011164 potassium chloride Nutrition 0.000 description 1
- 239000004323 potassium nitrate Substances 0.000 description 1
- 235000010333 potassium nitrate Nutrition 0.000 description 1
- 229910001487 potassium perchlorate Inorganic materials 0.000 description 1
- WZEGLRXCWYMIDO-UHFFFAOYSA-M potassium;1,4-dioxonaphthalene-2-sulfonate Chemical compound [K+].C1=CC=C2C(=O)C(S(=O)(=O)[O-])=CC(=O)C2=C1 WZEGLRXCWYMIDO-UHFFFAOYSA-M 0.000 description 1
- 239000003755 preservative agent Substances 0.000 description 1
- 230000002335 preservative effect Effects 0.000 description 1
- 125000002924 primary amino group Chemical group [H]N([H])* 0.000 description 1
- 238000003498 protein array Methods 0.000 description 1
- 238000002331 protein detection Methods 0.000 description 1
- 230000006916 protein interaction Effects 0.000 description 1
- 230000004850 protein–protein interaction Effects 0.000 description 1
- 238000013139 quantization Methods 0.000 description 1
- 238000010992 reflux Methods 0.000 description 1
- 238000004153 renaturation Methods 0.000 description 1
- 238000011160 research Methods 0.000 description 1
- 238000012552 review Methods 0.000 description 1
- 230000000630 rising effect Effects 0.000 description 1
- 238000002390 rotary evaporation Methods 0.000 description 1
- 210000003296 saliva Anatomy 0.000 description 1
- 150000003839 salts Chemical class 0.000 description 1
- 238000001338 self-assembly Methods 0.000 description 1
- 239000004065 semiconductor Substances 0.000 description 1
- 238000005389 semiconductor device fabrication Methods 0.000 description 1
- 229910000077 silane Inorganic materials 0.000 description 1
- 239000005368 silicate glass Substances 0.000 description 1
- 229910052710 silicon Inorganic materials 0.000 description 1
- 239000010703 silicon Substances 0.000 description 1
- 235000012239 silicon dioxide Nutrition 0.000 description 1
- 239000002356 single layer Substances 0.000 description 1
- 150000003384 small molecules Chemical class 0.000 description 1
- 229910052708 sodium Inorganic materials 0.000 description 1
- JHJLBTNAGRQEKS-UHFFFAOYSA-M sodium bromide Inorganic materials [Na+].[Br-] JHJLBTNAGRQEKS-UHFFFAOYSA-M 0.000 description 1
- 239000011780 sodium chloride Substances 0.000 description 1
- FAPWRFPIFSIZLT-UHFFFAOYSA-M sodium chloride Inorganic materials [Na+].[Cl-] FAPWRFPIFSIZLT-UHFFFAOYSA-M 0.000 description 1
- JVBXVOWTABLYPX-UHFFFAOYSA-L sodium dithionite Chemical compound [Na+].[Na+].[O-]S(=O)S([O-])=O JVBXVOWTABLYPX-UHFFFAOYSA-L 0.000 description 1
- 235000009518 sodium iodide Nutrition 0.000 description 1
- 235000010344 sodium nitrate Nutrition 0.000 description 1
- 239000004317 sodium nitrate Substances 0.000 description 1
- VWDWKYIASSYTQR-UHFFFAOYSA-N sodium nitrate Inorganic materials [Na+].[O-][N+]([O-])=O VWDWKYIASSYTQR-UHFFFAOYSA-N 0.000 description 1
- 229910001488 sodium perchlorate Inorganic materials 0.000 description 1
- QDTSDFGUQJIRMI-UHFFFAOYSA-M sodium;9,10-dioxoanthracene-2-carboxylate Chemical compound [Na+].C1=CC=C2C(=O)C3=CC(C(=O)[O-])=CC=C3C(=O)C2=C1 QDTSDFGUQJIRMI-UHFFFAOYSA-M 0.000 description 1
- HPALAKNZSZLMCH-UHFFFAOYSA-M sodium;chloride;hydrate Chemical compound O.[Na+].[Cl-] HPALAKNZSZLMCH-UHFFFAOYSA-M 0.000 description 1
- 239000002904 solvent Substances 0.000 description 1
- 238000001179 sorption measurement Methods 0.000 description 1
- 238000001228 spectrum Methods 0.000 description 1
- 230000002269 spontaneous effect Effects 0.000 description 1
- 238000000141 square-wave voltammogram Methods 0.000 description 1
- 238000003860 storage Methods 0.000 description 1
- 239000007785 strong electrolyte Substances 0.000 description 1
- 125000004434 sulfur atom Chemical group 0.000 description 1
- 239000002344 surface layer Substances 0.000 description 1
- 230000002194 synthesizing effect Effects 0.000 description 1
- 230000002123 temporal effect Effects 0.000 description 1
- DGQOCLATAPFASR-UHFFFAOYSA-N tetrahydroxy-1,4-benzoquinone Chemical compound OC1=C(O)C(=O)C(O)=C(O)C1=O DGQOCLATAPFASR-UHFFFAOYSA-N 0.000 description 1
- 229910001887 tin oxide Inorganic materials 0.000 description 1
- ZDHXKXAHOVTTAH-UHFFFAOYSA-N trichlorosilane Chemical compound Cl[SiH](Cl)Cl ZDHXKXAHOVTTAH-UHFFFAOYSA-N 0.000 description 1
- 239000005052 trichlorosilane Substances 0.000 description 1
- 210000002700 urine Anatomy 0.000 description 1
- 238000004832 voltammetry Methods 0.000 description 1
- 108091005957 yellow fluorescent proteins Proteins 0.000 description 1
- 239000011787 zinc oxide Substances 0.000 description 1
- DGVVWUTYPXICAM-UHFFFAOYSA-N β‐Mercaptoethanol Chemical compound OCCS DGVVWUTYPXICAM-UHFFFAOYSA-N 0.000 description 1
Images


Classifications
-
- G—PHYSICS
- G01—MEASURING; TESTING
- G01N—INVESTIGATING OR ANALYSING MATERIALS BY DETERMINING THEIR CHEMICAL OR PHYSICAL PROPERTIES
- G01N27/00—Investigating or analysing materials by the use of electric, electrochemical, or magnetic means
- G01N27/26—Investigating or analysing materials by the use of electric, electrochemical, or magnetic means by investigating electrochemical variables; by using electrolysis or electrophoresis
- G01N27/28—Electrolytic cell components
- G01N27/30—Electrodes, e.g. test electrodes; Half-cells
- G01N27/327—Biochemical electrodes, e.g. electrical or mechanical details for in vitro measurements
- G01N27/3271—Amperometric enzyme electrodes for analytes in body fluids, e.g. glucose in blood
- G01N27/3274—Corrective measures, e.g. error detection, compensation for temperature or hematocrit, calibration
-
- G—PHYSICS
- G01—MEASURING; TESTING
- G01N—INVESTIGATING OR ANALYSING MATERIALS BY DETERMINING THEIR CHEMICAL OR PHYSICAL PROPERTIES
- G01N27/00—Investigating or analysing materials by the use of electric, electrochemical, or magnetic means
- G01N27/02—Investigating or analysing materials by the use of electric, electrochemical, or magnetic means by investigating impedance
- G01N27/22—Investigating or analysing materials by the use of electric, electrochemical, or magnetic means by investigating impedance by investigating capacitance
- G01N27/226—Construction of measuring vessels; Electrodes therefor
-
- G—PHYSICS
- G01—MEASURING; TESTING
- G01N—INVESTIGATING OR ANALYSING MATERIALS BY DETERMINING THEIR CHEMICAL OR PHYSICAL PROPERTIES
- G01N27/00—Investigating or analysing materials by the use of electric, electrochemical, or magnetic means
- G01N27/26—Investigating or analysing materials by the use of electric, electrochemical, or magnetic means by investigating electrochemical variables; by using electrolysis or electrophoresis
- G01N27/28—Electrolytic cell components
- G01N27/30—Electrodes, e.g. test electrodes; Half-cells
- G01N27/327—Biochemical electrodes, e.g. electrical or mechanical details for in vitro measurements
- G01N27/3271—Amperometric enzyme electrodes for analytes in body fluids, e.g. glucose in blood
- G01N27/3272—Test elements therefor, i.e. disposable laminated substrates with electrodes, reagent and channels
-
- G—PHYSICS
- G01—MEASURING; TESTING
- G01N—INVESTIGATING OR ANALYSING MATERIALS BY DETERMINING THEIR CHEMICAL OR PHYSICAL PROPERTIES
- G01N27/00—Investigating or analysing materials by the use of electric, electrochemical, or magnetic means
- G01N27/02—Investigating or analysing materials by the use of electric, electrochemical, or magnetic means by investigating impedance
- G01N27/22—Investigating or analysing materials by the use of electric, electrochemical, or magnetic means by investigating impedance by investigating capacitance
- G01N27/228—Circuits therefor
-
- G—PHYSICS
- G01—MEASURING; TESTING
- G01N—INVESTIGATING OR ANALYSING MATERIALS BY DETERMINING THEIR CHEMICAL OR PHYSICAL PROPERTIES
- G01N27/00—Investigating or analysing materials by the use of electric, electrochemical, or magnetic means
- G01N27/26—Investigating or analysing materials by the use of electric, electrochemical, or magnetic means by investigating electrochemical variables; by using electrolysis or electrophoresis
- G01N27/28—Electrolytic cell components
- G01N27/30—Electrodes, e.g. test electrodes; Half-cells
- G01N27/327—Biochemical electrodes, e.g. electrical or mechanical details for in vitro measurements
- G01N27/3275—Sensing specific biomolecules, e.g. nucleic acid strands, based on an electrode surface reaction
- G01N27/3276—Sensing specific biomolecules, e.g. nucleic acid strands, based on an electrode surface reaction being a hybridisation with immobilised receptors
Definitions
- the invention relates to a method and corresponding biosensor devices for detecting the presence of bubbles in an aqueous solution.
- the two main limitations in a detection assay include sensitivity and cross-reactivity. Both of these factors affect the minimum detectable concentration and therefore the diagnostic error rate.
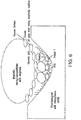
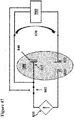
- the sensitivity in such tests is generally limited by label detection accuracy, association factor of the probe-analyte pair (for example an antibody-antigen pair), and the effective density of probe molecule (for example probe antibody) on the surface (as shown in Figure 1 ).
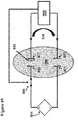
- Other molecules in the biological sample can also affect the minimum detectable concentration by binding to the probe molecule (for example the primary antibody), or by physisorption of the analyte to the surface at the test site (as shown in Figure 2 ).
- the detection agent for example a secondary antibody
- Solving the cross-reactivity and background problem can take a significant amount of time in the assay development of a new test and increases the cost and complexity of the overall test.
- the assay is typically optimized by finding the best reagents and conditions and also by manufacturing the most specific probe molecule (for example antibody). This results in a long development time, the infeasibility of tests in some cases, and a higher manufacturing cost. For example a typical development of an ELISA assay requires several scientists working for more than a year finding the correct antibody as part of the assay development. Cross-reactivity of the proteins may be the source of the failure of such an effort.
- a biosensor providing a multiple site testing platform was thought to provide a solution to some of the above described limitations in assay development.
- U.S. Patent Nos. 9,927,435 and 9,063,138 describe such biosensors having multiple sites that could be subjected to different reaction conditions to modulate the binding of the biomolecular analyte (for example proteins) to the probe molecule.
- the signal detected in a biosensor having four sites also can have several components, e.g. four.
- Variations in the modulation of the local pH due to repeated use of the biosensor and variations between subsequent measurements may decrease the accuracy of the determination of the biomolecular analyte of interest by such biosensor.
- the modulation of the pH at each site of the multisite array of the biosensor needs to be accurately controlled and variations in such pH modulation need to be corrected. Therefore, there is a need for a biosensor in which the pH can be accurately, reliably, and reproducibly controlled at each of the multisite array test sites.
- 9,075,041 describes a biosensor capable of modulating the pH or ionic concentration gradient near electrodes in the biosensor in order to modulate the binding interactions of biological samples of interest.
- U.S. Patent No. 9,810,688 describes an improved biosensor with increased accuracy, reliability, and reproducibility.
- Electrochemically triggered release of biotin from a modified gold electrode surface via reduction and subsequent lactonization of quinone tether was demonstrated ( Hodneland et al., "Biomolecular surfaces that release ligands under electrochemical control," J. Am. Chem. Soc. 122, pp. 4235-36 (2000 )). Electrochemical control of self-assembly and release of antibodies from the surface into solution was achieved by reduction and oxidation of n-decanethiol-benzoquinones (Artzy-Schnirman et al., " Artzy-Schnirman et al., Nano Lett.
- Electrochemical pH modulation in biological solutions presents a significant challenge due to complex nature of the system.
- the limitations include: presence of buffer components that restrict pH changes, limitations on co-solvents that can be used, presence of strong nucleophiles, such as amines and thiols, and presence of interfering electrochemically active components, such as DNA bases, ascorbic acid and glutathione.
- Quinones are one of the most widely studied classes of electrochemically active molecules (See Thomas Finley, "Quinones,” Kirk-Othmer Encyclopedia of Chemical Technology, 1-35 (2005 ). See also, Chambers, J. Q. Chem. Quinonoid Compd. 1974, Pt. 2:737-91 ; Chambers, J. Q. Chem. Quinonoid Compd. 1988, 2:719-57 ; Evans, D. H. Encycl. Electrochem. Elem. 1978, 12: 1-259 ). Hydroquinone/benzoquinone transformation has been used as a model system to produce proton gradients at electrode surface ( Cannan et al., Electrochem. Communications 2002, 4:886-92 ).
- the open circuit potential of an electrode surface is a function of the ionic concentration in a solution, including the H + concentration in the solution, and therefore of the pH of the solution ( Yin et al., "Study of indium tin oxide thin film for separative extended gate ISFET,” Mat. Chem. Phys. 70(1), pp. 12-16 (2001 )).
- the redox reaction rates of electrochemical species are also pH dependent ( Quan et al., "Voltammetry of quinones in unbuffered aqueous solution: reassessing the roles of proton transfer and hydrogen bonding in the aqueous electrochemistry of quinones,” J. Am. Chem. Soc. 129(42), pp.
- Glass slides are used as a substrate for performing experiments.
- glass slides include protein microarrays, lysate arrays, DNA microarrays and cell culture platforms.
- One use of a protein microarray is to analyze biological substances (e.g., blood serum) from patients with a specific disease in comparison to corresponding substances from healthy or control subjects.
- the biological substances are applied to a microarray containing many (often thousands of) human proteins.
- Antibodies in diseased substances may react (bind) with certain antigens in the microarray, thereby identifying the antigens as disease-specific biomarkers.
- other types of detection such as colorimetric, chemiluminescence and fluorescence detection are also possible with glass slides.
- the experiments are performed under aqueous conditions, in which a substance-of-interest is combined with water or a water-containing liquid and placed onto a slide for analysis.
- a substance-of-interest is combined with water or a water-containing liquid and placed onto a slide for analysis.
- bubbles formed of air or other gases
- the presence of bubbles disturbs the experiment, adversely affecting the results.
- One example of an adverse effect is when a bubble causes the test solution to dry out. This can create a false binding event where the substance-of-interest (e.g., a biomolecular analyte) fails to bind with a molecule with which the biomolecular analyte is supposed to interact.
- the bubbles change the effective flow rate of the test solution and the flow rate is being measured as part of the experiment. Therefore, it is desirable to detect bubbles and to output an indication of their presence, so that experiment results can be interpreted correctly.
- the pH sensitive probe is a fluorescent protein or a green fluorescent protein.
- a first area of the biomolecule interface layer covers at least one area of the support not covered by the two or more electrodes and a second area of the biomolecule interface layer covers at least one area of the two or more electrodes, wherein the pH sensitive probe is immobilized on the first area and second area of the biomolecule interface layer, and wherein the pH sensitive probe is a fluorescent protein.
- the method further comprises determining the pH of the solution near the two or more electrodes using a fluorescence intensity of the immobilized pH sensitive fluorescent protein immobilized on the second area of the biomolecule interface layer.
- the method further comprises normalizing a fluorescence intensity of the immobilized pH sensitive fluorescent protein immobilized on the second area of the biomolecule interface layer with respect to a fluorescence intensity of the immobilized pH sensitive fluorescent protein immobilized on the first area of the biomolecule interface layer, and the pH is determined using the normalized fluorescence intensity.
- the method further comprises measuring the pH using a sense electrode wherein the two or more electrodes comprise the sense electrode.
- the biosensor comprises a multisite array of test sites with each test site having the support in the solution and one or more test condition for each test site can be independently varied, and wherein the pH of the solution close to the two or more electrodes in each test site is independently controlled.
- the method further comprises collecting signals from the biosensor to obtain a collection of varied signals, wherein the collection of varied signals includes varied signals from the multisite array of test sites.
- control unit is configured to independently detect a presence of a bubble in each test site and if the presence of a bubble is detected store the location of the test site in the multisite array having the bubble.
- the pH sensitive probe is a fluorescent protein and optionally a green fluorescent protein.
- a first area of the biomolecule interface layer covers at least one area of the support not covered by the two or more electrodes and a second area of the biomolecule interface layer covers at least one area of the two or more electrodes, and wherein the pH sensitive probe is immobilized on the first area and second area of the biomolecule interface layer.
- the biosensor is configured to determine the pH of the solution near the two or more electrodes using a fluorescence intensity of the immobilized pH sensitive fluorescent protein immobilized on the second area of the biomolecule interface layer.
- the biosensor is configured to normalize the fluorescence intensity of the immobilized pH sensitive fluorescent protein immobilized on the second area of the biomolecule interface layer with respect to the fluorescence intensity of the immobilized pH sensitive fluorescent protein immobilized on the first area of the biomolecule interface layer, and the biosensor is configured to determine the pH using the normalized fluorescence intensity.
- the two or more electrodes comprise a sense electrode and the biosensor is configured to measure the pH using the sense electrode.
- the biosensor comprises a multisite array of test sites with each test site having the support in the solution and one or more test condition for each test site can be independently varied, and wherein the pH of the solution close to the two or more electrodes in each test site is independently controlled.
- control unit is configured to independently detect a presence of a bubble in each test site and if the presence of a bubble is detected store the location of the test site in the multisite array having the bubble.
- the biosensor is configured to obtain a collection of varied signals including varied signals from the multisite array of test sites.
- a method of modulating the pH or ionic concentration in a biosensor comprises the steps of:
- a local pH or ionic concentration gradient can be obtained in the various test sites in a multisite array biosensor.
- the variation of the local pH and/or ionic concentration gradient at the electrode, and in particular in the vicinity of the (biomolecular) probe in a biomolecular interface layer, over subsets of the multisite array of the biosensor, allows for modulating the binding efficiency of the (biomolecular) probe and an analyte to be tested from a biological sample.
- the analyte of interest when bound to the (biomolecular) probe, can be then detected using a detection agent, such as for example a labeled secondary antibody.
- the modulation of binding efficiencies in a subset of a multisite array provides a method for the accurate determination of such analyte of interest.
- the biosensor preferably comprises a multisite array of test sites as for example is described in US 2011/0091870 .
- Such multisite array preferably includes a number of different subarrays/subsets of test sites.
- Each test sites represents a site for performing an analysis of a (biomolecular) analyte from a biological sample through the detection of the (biomolecular) analyte using a (biomolecular) probe.
- the analytical conditions in each test site in each of the subarrays/subsets may be varied to obtain a collection of varied signals that will result in multiple equations and multiple unknowns from which the concentration of the (biomolecular) analyte can be determined in order to obtain an accurate measurement of the (biomolecular) analyte.
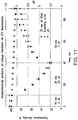
- the multiple unknowns in the obtained varied signals each includes a term that is proportional to a binding efficiency factor, ⁇ ij , and the concentrations of the various molecules in the biological sample binding that are detected at the test site.
- the multiple equations with multiple unknowns may be represented for example as follows, where C an corresponds to the targeted biomolecular analyte concentration and C j1 , C j2 , C j3 correspond to the total concentration of molecules which result in different terms in background signal, from which collection of multiple equations the concentration of the targeted biomolecular analyte can be determined.
- the number of subarrays/subsets, as well as the number of test sites within each subarray/subset may be varied, as needed to obtain such accurate measurement of the analyte.
- Some of these analytical conditions include parameters such as for example temperature, shear stress, and pressure.
- the temperature of the aqueous solution in which the biomolecular probe and analyte of interest in the biological sample interact can be varied using the electromagnetic heat at the test site.
- Another important condition for the interaction between the biomolecular probe and the analyte of interest is the pH or ionic concentration. The method described herein modulates this pH or ionic concentration in the local environment of the biomolecular probe in order to affect the binding efficiency in the vicinity of the biomolecular probe.
- Each test site in the subarray/subset of the multiplesite array comprises a support onto which one or more electrodes are placed and onto which solid surface the biomolecular probe(s) are immobilized or bound.
- This immobilization of biomolecular probes to a solid surface or support assists in reducing the amount of probe needed for the analytical method and also localizes the detection area to make accurate measurements.
- the biomolecular probes are therefore attached to solid surfaces of the support and/or electrodes such as those of silicon, glass, metal and semiconductor materials (as shown in Figure 4 ).
- the biomolecular probe is attached or immobilized onto the support and/or electrode(s) within a biomolecular interface layer (as shown in Figure 4 ).
- the biomolecular layer includes a layer of immobilized polymers, preferably a silane immobilized polyethylene glycol (PEG).
- PEG silane immobilized polyethylene glycol
- Surface-immobilized polyethylene glycol (PEG) can be used to prevent non-specific adsorption of biomolecular analytes onto surfaces.
- At least a portion of the surface-immobilized PEG can comprise terminal functional groups such as N-hydroxysuccinimide (NHS) ester, maleimide, alkynes, azides, streptavidin or biotin that are capable of conjugating.
- NHS N-hydroxysuccinimide
- the biomolecular probe may be immobilized by conjugating with the surface-immobilized PEG. It is important that the method used to change the pH does not impair the covalent binding of for example the PEG onto the surface of a solid support, or the linker that conjugated the biomolecular probe to the PEG (as shown in Figure 5 ).
- the method of modulating the pH or ionic concentration as described herein can protect these surface chemistries, while affecting a pH/ionic concentration change in the environment of the biomolecular probe.
- a suitable biomolecular probe can be a carbohydrate, a protein, a glycoprotein, a glycoconjugate, a nucleic acid, a cell, or a ligand for which the analyte of interest has a specific affinity.
- Such probe can for example be an antibody, an antibody fragment, a peptide, an oligonucleotide, a DNA oligonucleotide, a RNA oligonucleotide, a lipid, a lectin that binds with glycoproteins and glycolipids on the surface of a cell, a sugar, an agonist, or antagonist.
- the biomolecular probe is a protein antibody which interacts with an antigen that is present for example in a biological sample, the antigen being a biomolecular analyte of interest.
- the analyte of interest in a biological sample can be for example a protein, such as an antigen or enzyme or peptide, a whole cell, components of a cell membrane, a nucleic acid, such as DNA or RNA, or a DNA oligonucleotide, or a RNA oligonucleotide.
- a biosensor comprising the device provided herein can be used in an analytical method for determining a biomolecular analyte of interest in a biological sample, which can be for example a protein, such as an antigen or enzyme or peptide, a whole cell, components of a cell membrane, a nucleic acid, such as DNA or RNA, or a DNA oligonucleotide, or a RNA oligonucleotide.
- a protein such as an antigen or enzyme or peptide
- a whole cell components of a cell membrane
- a nucleic acid such as DNA or RNA, or a DNA oligonucleotide, or a RNA oligonucleotide.
- a local pH or ionic concentration gradient can be obtained at various test sites in a multisite array biosensor.
- the variation of the local pH and/or ionic concentration gradient at the electrode, and in particular in the vicinity of the (biomolecular) probe in a biomolecular interface layer, over subsets of the multisite array of the biosensor, allows for modulating the binding efficiency of the (biomolecular) probe and an analyte to be tested from a biological sample.
- the analyte of interest when bound to the (biomolecular) probe, can be then detected using a detection agent, such as for example a labeled secondary antibody.
- the modulation of binding efficiencies in a subset of a multisite array provides a method for the accurate determination of such analyte of interest.
- the electrodes can be any electrode suitable in a biosensor for example indium tin oxide (ITO), gold, or silver electrodes.
- ITO indium tin oxide
- the electrodes in the biosensor in the method described herein are indium tin oxide (ITO) electrodes.
- an analytical method of using the device described herein in a biosensor to determine the presence and/or concentration of a biomolecular analyte of interest in a biological sample which is not comprised by the present invention.
- This analytical method comprises
- the biomolecular analyte can be detected using any suitable detection method.
- Known detection methods of such analyte include luminescence, fluorescence, colorimetric methods, electrochemical methods, impedance measurements, or magnetic induction measurements.
- the analyte binds to the immobilized biomolecular probe and a detection agent such as for example a secondary labeled probe that specifically binds to the analyte, bound to the immobilized probe, is introduced.
- This detection agent or secondary labeled probe gives rise to a detectable signal such as for example luminescence or fluorescence.
- the pH of the solution surrounding the immobilize biomolecular probe has been known to influence the binding/activity between the probe and the analyte to a great extent. Concentration of other ions on surrounding proteins can also heavily influence the binding/activity.
- methods to modulate the pH and/or ionic concentration in the vicinity of the biomolecular probe immobilized close to a surface are provided. The modulation of the pH near these solid surfaces also affect the non-specific interactions of the analyte to other molecules than the biomolecular probe and the interactions of other molecules in the solution of the biological sample with the biomolecular probe or analyte.
- the modulation of pH or ionic concentration should not impair any of the surface chemistries, such as those that immobilize the biomolecular probe to its solid support in a test site of a multisite array in the biosensor.
- the method of modulating the pH or ionic concentration as described herein can protect these surface chemistries, while affecting a pH/ionic concentration change in the environment of the biomolecular probe.
- pH change is caused by changes in hydrogen ion or hydroxyl ion concentrations.
- a variety of chemical reactions taken place at electrode-liquid, electrode-cross linker, cross linker-protein, and protein-protein interfaces as shown in Fig 5 can also become a hindrance to pH changes happening near the solid surfaces to reach the proteins on top of them. They can simply act as diffusion barriers for the ions and hinder the pH changes around the biomolecular probes and analytes.
- These methods of modulating the pH or ionic concentration described herein helps in maximizing the changes in hydrogen or hydroxyl ion concentration so that they can overcome any diffusion barrier imposed by the surface chemistry.
- the buffering effect can be large enough that the pH change at the interface would never reach the biomolecular probes that are immobilized away from it.
- the distance can vary based on the biomolecular interface layer deposited on top of the solid interface.
- Such biomolecular interface layer may have a thickness of 300 nm or less, preferable between 1-150 nm, even more preferably between 5-100 nm.
- the distance between the solid interface and the biomolecular probe within the biomolecular interface layer can range between 0.1-300nm.
- Use of buffer inhibitors in the solution or on the surface that extend the pH change on the electrode interface to reach the interacting probe-analyte pair may contribute to modulating the pH or ionic concentration in the vicinity of the biomolecular probe.
- 7,948,015 describes the use of such inhibitors for applications in which measuring small local pH changes is of interest (e.g., in DNA sequencing).
- similar inhibitors can be used in order to extend the local pH changes further away from the electrode-liquid interface; and 4) the redistribution of preexisting ions near the electrode surface due to electrostatic forces.
- a method for modulating the pH or ionic concentration in a biosensor as described herein, which is not comprised by the present invention wherein an electrochemically active agent is added to the aqueous solution at a test site in a multisite array, and wherein the test site has a biomolecular interface layer comprising a biomolecular probe or detection agent and oxidizing or reducing the electrochemically active agent.
- the electrochemically active agent may be added at a concentration of 1 nM to 100 mM, preferably at a concentration between 10 nM and 10 mM, more preferably at a concentration of 100 nM and 5 mM.
- the electrochemically active agent may be electro-oxidized or electro-reduced at an electrode potential in the range of -2V to +2V (vs. Ag/AgCl reference electrode).
- the electrode potential is in the range of -1V to +1V, even more preferably the electrode potential is in the range of -0.5V to +0.5V.
- the voltage required to drive the redox reaction can be used as a real time feedback method to monitor pH that is produced at the electrode surface.
- the device provided herein and used in a biosensor comprises such array of multiple test sites in solution in order to modulate the pH at each test site and to determine the presence and concentration of a biomolecular analyte of interest in a biological sample.
- the device is in contact with an aqueous solution comprising a phosphate buffer, preferably a diluted phosphate buffer which preferably has a concentration of 0.1mM to 100mM.
- the pH of the diluted phosphate buffer can be between 5 and 8, preferably between 7 and 8, and more preferably between 7 and 7.5.
- Modulation of the pH or ionic concentration on a device in a biosensor described herein by electrochemical reaction at the one or more electrode may be carried out in a galvanostatic mode or potentiostatic mode.
- any type of electrical pulse may be applied on the electrodes of the device in the method for modulating the pH.
- Such pulse may be in the form of an annealing pulse and may vary by pulse frequency, pulse width, and pulse shape.
- a sufficient voltage is applied to change the pH to such that non-covently bound molecules from the biological sample are removed from the device in the biosensor.
- Such annealing pulse eliminates or reduces the need for washing the substrate following first contact with a sample in order to remove non-covalently bound material.
- Another advantage is that the annealing pulse may be more efficient to remove such non-covalently bound material from the device than a simple washing.
- a preferred pulse width for modulating the pH is in the range of 1 nanosecond to 60 minutes.
- the aqueous solution may further comprise one or more additional electrolytes, such as for example sodium sulfate, or any other suitable strong electrolyte.
- the additional electrolyte is selected from sodium sulfate, sodium or potassium chloride, sodium or potassium bromide, sodium or potassium iodide, sodium or potassium perchlorate, sodium or potassium nitrate, tetraalkylammonium bromide and tetraalkylammonium iodide .
- Buffer-inhibitors may also be used in the aqueous solution.
- Suitable buffer inhibitors may be selected from poly(allylamine hydrochloride), poly (diallyldimethyl ammonium chloride), poly(vinylpyrroldone), poly(ethyleneimine), poly(vinylamine), poly(4-vinylpyridine) and tris(2-carboxyethyl)phosphine hydrochloride.
- poly(allylamine hydrochloride) poly (diallyldimethyl ammonium chloride), poly(vinylpyrroldone), poly(ethyleneimine), poly(vinylamine), poly(4-vinylpyridine) and tris(2-carboxyethyl)phosphine hydrochloride.
- the aqueous solution preferably also comprises a water-miscible organic co-solvent selected from the groups consisting of acetonitrile, dimethyl sulfoxide (DMSO), dimethyl formamide (DMF), N,N-dimethyl acetamide (DMAc), and mixtures thereof.
- a water-miscible organic co-solvent selected from the groups consisting of acetonitrile, dimethyl sulfoxide (DMSO), dimethyl formamide (DMF), N,N-dimethyl acetamide (DMAc), and mixtures thereof.
- Suitable electrochemically active agents include dopamine hydrochloride, ascorbic acid, phenol and derivatives, benzoquinones and derivatives, for example, 2,5-dihydroxy-1,4-benzoquinone, 2,3,5,6-tetrahydroxy-1,4-benzoquinone and 2,6-dichloroquinone-4-chloroimide; naphthoquinones and derivatives, for example, hydroxy-1,4-naphthoquinone, 5,8-dihydroxy-1,4-naphthoquinone, and potassium 1,4-naphthoquinone-2-sulfonate; and 9,10-anthraquinone and derivatives, for example, sodium anthraquinone-2-carboxylate, potassium 9,10-anthraquinone-2,6-disulfonate.
- concentration of the electrochemically active agent in the aqueous solution is from 1nM to 100mM.
- An enzyme substrate is then added to the aqueous solution at a test site in a multisite array, wherein the test site has the biomolecular interface layer and enzymatically oxidizing the enzyme substrate.
- the method of modulating the pH or ionic concentration in a biosensor comprises:
- the concentration of the electrochemically active agent in the aqueous solution is preferably from 1nM to 100mM.
- Suitable enzymes for immobilization in the biomolecular interface layer or onto the magnetic micro- or nano-particles include for example oxidases, ureases, or dehydrogenases.
- immobilized oxidase is for example a glucose oxidase and the enzyme substrate is glucose.
- the amounts of immobilized enzyme and enzyme substrate added can be varied in the different test sites in each of the subsets of the multisite array so as to provide a pH or ionic concentration gradient in the such subset of the multisite array.
- the enzyme is not immobilized onto a solid surface such as in the above methods being immobilized into a biomolecular interface layer or onto a magnetic micro- or nano-particle but is added to the aqueous solution in the test sites of subsets of a multisite array.
- electrolysis the enzyme undergoes a redox reaction at the electrode surface and perturbs the local pH.
- the pH or ionic concentration can be further modulated by adding a buffer inhibitor to the aqueous solution.
- a buffer inhibitor either assists in diffusing the produced ions of interest to the location of the biomolecular probe or detection agent or inhibits the interaction of such produced ions with buffering salts.
- the buffer inhibitor is added to the aqueous solution of the test site of subsets of a multisite array in the absence of an electrochemical active agent or immobilized enzyme.
- the buffer inhibitor is added to the aqueous solution, and facilitates the diffusion of H + ions or OH - ions that are produced at the electrodes in the test site or inhibits the interaction between H + ions or OH - ions and buffering salts.
- Suitable buffer inhibitors include soluble polymers selected from poly(allylamine hydrochloride), poly (diallyldimethyl ammonium chloride), poly(vinylpyrrolidone), poly(ethyleneimine), poly(vinylamine), poly(4-vinylpyridine) and tris(2-carboxyethyl)phosphine hydrochloride.
- the amounts of buffer inhibitor added can be varied in the different test sites in each of the subsets of the multisite array so as to provide a pH or ionic concentration gradient in the such subset of the multisite array.
- the accuracy, reliability and reproducibility of the modulation of the pH at each test site is important.
- the modulation of the pH at each test site may vary between subsequent uses.
- the pH at each test site needs to be accurately modulated or controlled.
- the device provided herein allows for accurate determination and control of the pH at each test site in such biosensor, the device comprising:
- the immobilized pH sensitive fluorescent protein allows for sensing the pH at an electrode once the electrode (working electrode) causes modulation of the pH at a particular test site such as a test site in a multisite array.
- the fluorescence intensity of the fluorescent protein changes due to modulation of the pH.
- the change in fluorescence intensity of the fluorescent protein is proportional to the change in the pH (there is a linear relationship between the pH and the fluorescence intensity). Therefore, as is also shown in Figure 10 , the pH value at each location at any time when the biosensor is in use can be readily obtained by correlating the fluorescence intensity of the fluorescent protein with the pH. An accurate calibration of the correlation between pH and fluorescence intensity may be carried out before or during use of the biosensor.
- test sites within a multisite array may be dedicated to calibration of the fluorescence intensity to pH correlation.
- the pH is no longer modulated at such test site by the electrode (working electrode) the fluorescence intensity of the immobilized fluorescent protein reverts back to its intensity before a current was applied through the electrode.
- the immobilized fluorescent protein is selected from an immobilized green fluorescent protein, an immobilized yellow fluorescent protein, and an immobilized cyan fluorescent protein.
- the immobilized fluorescent protein is immobilized Green Fluorescent Protein (GFP).
- GFP Green Fluorescent Protein
- immobilized pH sensitive dyes may be used on the support substrate instead of an immobilized pH sensitive fluorescent protein.
- immobilized pH sensitive binding proteins may be used on the substrate instead of an immobilized pH sensitive fluorescent protein.
- a multisite array of test sites in a biosensor the immobilized fluorescent protein covers on the substrate an area that is also covered by an electrode and an area that is not covered with an electrode.
- the electrode covered by the immobilized fluorescent protein is either a working electrode or a counter electrode.
- the immobilized fluorescent protein is applied onto the substrate as distinct spots, wherein each spot overlaps with only one test site and an area not covered by an electrode as shown in Figure 12A .
- the presence of fluorescent protein on an area that is not covered by an electrode allows for the determination, within the biosensor, of fluorescence intensity when the pH is not modulated by the electrode.
- This fluorescence intensity can be used as a standard and control in determining whether, after ceasing modulation of the pH by an electrode the fluorescence intensity will revert back to its original intensity.
- the fluorescent protein not located on or near an electrode can be used as an internal reference for signal normalization.
- the device includes one or more counter electrodes and one or more working electrodes.
- one or more electrodes can be arranged in a multisite array, each site of the multisite array comprising a working electrode and/or counter electrode.
- the electrodes can be any electrode suitable in a biosensor for example indium tin oxide (ITO), gold, or silver electrodes.
- ITO indium tin oxide
- the electrodes in the device are indium tin oxide (ITO) electrodes.
- the working electrode is an indium tin oxide electrode and the counter electrode(s) is selected from an indium oxide electrode, a gold electrode, a platinum electrode, a silver electrode, and a carbon electrode.
- the electrodes in the device may be used either for modulating the pH or as sensing electrodes or both.
- the one or more electrodes are connected to an electronic board via pogo-pins, a chip on foil via z-axis adhesive, or a chip on the substrate.
- the electronic board or chip are powered by a printed battery, a small battery bound to the substrate, a magnetically coupled power transfer using coils on the substrate, or a rf-coupled power transfer using coils on the substrate.
- FIG 9 shows a side view of a part of the device which includes a substrate (1) for example glass or plastic.
- a substrate (1) for example glass or plastic.
- One or more electrodes (2) are covered onto the substrate (1) which is also covered with a biomolecular interface layer (10).
- the biomolecular interface layer (10) comprises immobilized PEG (3), immobilized probe (4) and immobilized pH sensitive fluorescent protein in the form of Green Fluorescent Protein spots (5).
- the GFP spots (5) overlap with an electrode (2) and an area that is not covered by an electrode.
- the electrodes (2) and the GFP spots (5) are arranged in a multisite array so as to provide multiple test sites on the device.
- the location of luminescence signals generated luminescent molecules can be controlled by directly controlling the location of the luminescent molecules themselves. This includes for example immobilizing the luminescent molecule. However, by incorporating the ability to control the pH of a solution near an electrode with pH sensitive luminescent molecules the location of luminescence signals generated by free floating luminescent molecules can also be controlled.
- Example instances of the present disclosure related to a system and method for detecting bubbles in an aqueous solution.
- the solution is placed onto a measurement area of a slide, the measurement area containing a plurality of electrodes configured to measure capacitance.
- the slide is configured to support measurements of at least one additional type of data in connection with an experiment involving a substance-of-interest contained in the solution. This allows the slide to be used for conventional testing purposes in addition to bubble detection.
- one or more electrodes are configured for dual functioning so that the one or more electrodes help facilitate both the conventional testing function and the bubble detection.
- the slide may include a control unit that measures capacitance values associated with individual ones of the electrodes and/or pairs of the electrodes.
- the control unit captures the capacitance value(s) for subsequent processing and allows for capturing of bubble detection relevant data, obviating the need to manually check the slide for bubbles.
- the system and method include analyzing measured capacitances to identify a location of a bubble in the solution.
- bubbles are detected based on comparing the value of the capacitances to a threshold value or to other measured capacitances. This allows the location of the bubbles to be determined without user input.
- the system and method involve displaying bubble locations graphically, preferably as a three-dimensional graph. This allows a user to quickly determine where bubbles are located, without having to manually interpret the measured capacitance values. The user can then determine, based on the bubble indications, whether to keep or discard additional data that is being measured as part of the experiment. In an example, the additional data is automatically invalidated by a computer processor in response to bubble detection, to further reduce user burden.
- the system and method involve using the slide to adjust the pH level of the solution using at least some of the same electrodes that are used for measuring capacitance in connection with bubble detection. This allows for more efficient usage of the electrodes and provides an additional level of functionality to the slide.
- Example embodiments of the present invention relate to the detection of bubbles in glass slides, on which slides an aqueous solution is placed for analysis. However, the example embodiments may also be applied towards other applications in which it is desirable to detect the presence of bubbles.
- the capacitance based detection techniques are described herein in connection with the capacitive properties of water, these techniques may also be applied to other liquids for which the capacitive properties are known.
- Figure 14 shows an example system 100 for detecting bubbles according to an example embodiment of the present invention.
- the system 100 includes a slide 30 that includes an area 10 in which a test solution containing a substance-of-interest is placed for analysis, a control unit 12 and a power source 14.
- the slide 30 can be formed of any electrically insulating material.
- glass would typically be used for this purpose and to serve as a substrate, on top of which the area 10, control unit 12 and power source 14 are formed.
- the glass can be formed, for example, of silicon dioxide (SiO 2 ), possibly with additives. Alternatively, other types of silicate glasses may be used.
- the area 10 includes an array of electrodes used for bubble detection. At least some of the electrodes in the area 10 are used for adjusting (also referred to herein as modulating) a pH level of the test solution. These pH modulating electrodes can be dedicated exclusively to adjusting the pH level or, alternatively, switched between pH modulating and bubble detecting modes of operation, as will subsequently be explained. (For example, U.S. Pat. App. Ser. No. 13/543,300 , mentioned earlier, describes the use of electrodes for pH modulation in a biosensor, which modulation can be performed using the electrodes discussed herein.)
- Figure 15 shows a top view of an example electrode array, in which a set of column electrodes X01 to X12 are arranged at regularly spaced distances from each other. A set of row electrodes Y01 to Y09 are also arranged at regularly spaced distances and are separated from the column electrodes X01 to X12, e.g., by an intervening layer of glass.
- Each electrode includes one or more contact pads 31, 32 for use in bubble detection and/or pH modulation. The shape of the pads is variable and is substantially square.
- Figure 16 shows a close-up view of example square-shaped pads.
- Figure 17 shows an alternative in which the pads form an interdigitated structure, and are therefore frame-shaped.
- control unit 12 is electrically connected to the electrode array 10 and controls the array 10 to perform bubble detection and pH modulation.
- the control unit 12 can be, for example, a microprocessor or an application specific integrated circuit (ASIC).
- the control unit 12 is located on an electronic circuit board that is detachably connected to the slide 30, e.g., using pogo pins.
- the control unit 12 can be located within a packaged chip bonded directly to a rigid glass substrate, e.g., using a chip-on-glass process.
- the slide 30 is formed of a flexible foil-type substrate and the control unit 12 is glued to the slide 30 using a z-axis adhesive to form a chip-on-foil, in a manner similar to how chips are bonded in certain liquid crystal displays.
- the control unit 12 can include, for example, a non-transitory computer readable storage medium containing program code that implements the example bubble detection and pH modulation techniques described herein.
- the control unit 12 can control the electrodes to perform other types of sensing or to control other sensing structures, as is known in the art of biosensors.
- control unit 12 transmits control signals that cause input pulses to be applied at specified electrodes. Capacitance values can be measured at the control unit 12 based on the responses of the electrodes to the input pulses. The measurement of capacitance is known in the art of touch screen displays, which utilize measurements of self-capacitance (e.g., a single electrode) or mutual capacitance (e.g., between two electrodes). To support bubble detection, the control unit 12 has a capacitance detection range that is greater than that of typical control units that measure capacitance in life science experiments. Control signals can also be used to apply input pulses for pH modulation.
- Control signals for pH modulation can be initiated by the control unit 12, e.g., in accordance with a predefined program sequence designed for pH modulation.
- the control signals for pH modulation is initiated externally, e.g., in response to a command from a data processing unit 50.
- the control unit 12 includes hardware and/or software components that perform preliminary signal processing on the measured capacitance values, including converting the measurements from analog to digital format and/or filtering the measurements.
- the processed measurements are then output as raw data to the data acquisition unit 40.
- the power source 14 provides power to the control unit 12 and to the electrode array 10.
- the power source 14 is a battery such as a coin-cell or a printed battery.
- the slide 30 is designed for one-time use and is disposable, the battery therefore being provided with a small energy capacity, e.g., sufficient for a single measurement, and the battery can be permanently attached to the slide, e.g., bonded or glued to the glass surface. When the slide 30 is reusable, the battery can be rechargeable or user replaceable. Other forms of electric power delivery may alternatively be used. Electrical power is delivered wirelessly through magnetic coupling between an external power supply (e.g., the data acquisition unit 40) and one or more resonant coils in the slide. As an alternative to magnetic coupling, but also using wireless power transfer, the external power supply may couple to the resonant coil using radio-frequency (RF) signals.
- RF radio-frequency
- the data acquisition unit 40 is a device that communicates with the slide 30 to receive the measured capacitance values from the control unit 12, in the form of raw data.
- the data acquisition unit 40 includes a wired communication interface 20 to a corresponding interface in the slide 30.
- the raw data is output from the control unit 12 in parallel.
- the control unit 12 includes a plurality of output channels, with data from a single row or a single column being output on a corresponding channel.
- the interface 20 converts the parallel data into a format suitable for transmission to the data processing unit 50. The conversion may involve parallel-to-serial conversion using a Universal Asynchronous Receiver/Transmitter (UART) or other conventional data conversion apparatus.
- UART Universal Asynchronous Receiver/Transmitter
- the interface 20 communicates wirelessly with the slide 30, e.g., using RF signals.
- the data processing unit 50 receives the raw data from an output interface 22 of the data acquisition unit 40, e.g., from a transmitter portion of the UART.
- the output interface 22 can be a wired, serial interface such as a Universal Serial Bus (USB) interface.
- the output interface 22 can be wireless, e.g., a Bluetooth or WiFi interface.
- the interface is a Bluetooth low energy (LE) interface.
- the data processing unit 50 can be, for example, a general purpose computer in the form of a desktop, a laptop or tablet, and includes, for example, a processor and a memory storing instructions for further processing of the raw data.
- the further processing includes normalizing the raw data to a predefined scale and using the normalized data to generate output images, such as two or three-dimensional graphs, for display at the display device 60.
- the display device 60 can be integrated into a housing of the data processing unit 50 as a single unit.
- the display device 60 may alternatively be externally connected, e.g., where the data processing unit 50 is a desktop.
- the output images may be combined to form a video that shows changes in the data over time
- the output images, which represent the measured capacitance values, are displayed together with additional output images corresponding to other measured data.
- the output images and the additional output images may be displayed in different portions of the same display screen or overlaid (superimposed) on the same portion of the display screen.
- the data processing unit 50 is also configured to issue commands to the control unit 12 for pH modulation.
- the commands may be automatically generated, e.g., when a processor of the data processing unit 50 determines that the pH level of the test solution should be adjusted. Alternatively or additionally, the commands may be user-initiated.
- the slide 30 may include a layered structure in which one or more electrode layers are located on top of a glass substrate.
- the layered structure can be formed, for example, using a lamination technique in which two or more layers are formed separately and then laminated together, e.g., using adhesive or bonding.
- the layered structure can be monolithically formed as a single unit, using techniques known in the art of semiconductor device fabrication.
- the layered structure may include one or more passivating layers formed, e.g., of SiO 2 (also referred to as oxide).
- the composition and size of passivating layers can vary, e.g., from an atomic layer of SiO 2 to several micrometers of SiO 2 and formed using various techniques such as low pressure chemical vapor deposition (LPCVD) or plasma-enhanced chemical vapor deposition (PECVD).
- LPCVD low pressure chemical vapor deposition
- PECVD plasma-enhanced chemical vapor deposition
- Si 3 N 4 Silicon nitride
- the passivating layer can be formed as a thin film that is laminated.
- FIG. 18 shows a simplified electrical model of a slide including electrodes (ITOs 81 to 84) in an SiO 2 layer 73.
- the ITOs 81 and 82 represent electrode pads in a first layer, e.g., row electrode pads.
- the ITOs 83 and 84 represent electrode pads in a second layer beneath the first layer, e.g., column electrode pads.
- the ITOs 81 to 84 are formed above a glass substrate 79, with an optional ITO layer 89 that serves as a bottommost, passivating layer. For simplicity, the portion of the electrode array used for pH modulation is not shown.
- the capacitance of the test solution is assumed to be equivalent to the capacitance of water (CW) since the test solution is, in practice, mostly water.
- CW capacitance of water
- the solution is in contact with the SiO 2 layer 73 and contributes to a series capacitance between ITOs 81 and 82.
- the SiO 2 layer 73 also contributes to the series capacitance, as represented by two capacitances CSiO 2 .
- the pH modulating portion of the electrode array has been omitted for the sake of simplicity.
- One way to perform pH modulation is to separate the pads of adjacent electrodes so as to form channels that collect the test solution.
- the channels allow the test solution to come into contact with the electrodes, so that the pH level of the solution can be adjusted by sending a current between the adjacent electrodes.
- the electrodes may be formed of any suitable conductive material, but are preferably indium tin oxide (ITO) because ITO is transparent and relatively colorless, making it suitable for experiments that involve optical measurements. This allows the entire measurement area 10 to be transparent.
- An oxide layer may be used as a passivating layer to cover the electrodes, similar to how the SiO 2 layer 73 covers the electrodes in Figure 18 and Figure 19 .
- the same oxide layer may be used over the electrodes in both the bubble detecting and the pH modulation portions of the electrode array.
- the oxide layer does not completely fill the channels, but instead a lateral portion of the electrodes is left exposed to allow for contact with the test solution.
- Figure 19 shows additional details regarding the electrical model of Figure 18 .
- the series capacitances are collectively represented as a mutual capacitance CL1,L1 between ITOs 81 and 82. Additionally, there exists a mutual capacitance between ITOs 81 and 83. Bubbles are detected as a change in capacitance (e.g., in either of these mutual capacitances or in a self-capacitance) that results when the test solution is displaced by a bubble, which is typically formed of air. Since air has a much lower capacitance (the dielectric strength of air is approximately eighty times less than water), it is possible to detect a drop in capacitance associated with the presence of a bubble.
- each pad may be sized as small as possible while balancing performance parameters such as power consumption and maintaining inter-operative compatibility with the control unit 12.
- the pads are less than 2 millimeters wide, preferably 1 millimeter or less. This is substantially smaller than the size of electrodes typically used for conventional touch-screen applications or conventional bio-sensor applications.
- Figure 20 is a simulated graph of self-capacitance along the x direction (from the top surface of the slide towards the glass substrate) when water covers a pad.
- the graph of Figure 20 was generated based on a square pad of size 1 mm x 1 mm. As shown, the capacitance decreases continuously from a value of approximately 2 x 10 -11 Farads at 10 -6 meters down to approximately 7 x 10 -14 Farads at 10 -3 meters.
- Figure 21 is a simulated graph of self-capacitance along the x direction when a bubble having a diameter of 1 millimeter is present on a 1 mm x 1 mm pad.
- the capacitance values are substantially smaller than the corresponding capacitance values from Figure 20 between 10 -6 and 10 -3 meters. Specifically, the capacitance starts at approximately 7.6 x 10 -14 Farads and drops beginning around 3 x 10 -5 meters to approximately 5 x 10 -14 Farads. Therefore, the capacitance with water is several orders of magnitude greater for the majority of points between 10 -6 and 10 -3 meters.
- one way to detect bubbles is based on an evaluation of the value or the magnitude of a capacitance at any given pad, e.g., by comparing the value or magnitude to a predefined threshold value. A bubble would then correspond to a capacitance that is less than the threshold.
- Another way to detect bubbles is based on the percentage change in capacitance from water to a bubble.
- the simulated graph in Figure 22 whose values were calculated using the values from Figure 20 and Figure 21 , shows this difference.
- the percentage change is initially small, but starts to increase at around 10 -5 meters. Therefore, detection may be based on the percentage change if the pads are suitably located, e.g., at a distance of 10 -5 meters or more from the top surface of the slide.
- detection can be based on a comparison of capacitance values associated with a plurality of pads. For example, capacitance values from a group of neighboring pads are compared to determine whether any of the capacitance values is unusually small relative to the other capacitance values. This comparison is advantageous because it does not require the use of a threshold value, which may need to be adjusted based on the design of the slide, e.g., parameters such as pad size, shape or location.
- Figure 23 is a graph showing actual test results from a prototype slide.
- the graph shows mutual capacitance values between a column electrode and a row electrode.
- a bubble was manually introduced at the intersection of these electrodes, beginning at around 50 seconds.
- the bubble was then removed and another bubble introduced at around 75 seconds. This process was repeated again, with another bubble at around 90 seconds. Each time a bubble was introduced, the capacitance dropped substantially.
- Control units exist for acquiring capacitance measurements in connection with touch-screen applications. However, these control units are generally unsuitable for use with the bubble detection according to the example embodiments of the present invention. These conventional control units are unsuitable because they tend to have a narrower detection range and lower sensitivity than what is required for the example embodiments. In contrast, bubble detection according to the example embodiments requires the ability to capture large capacitance swings (e.g., a 400 pF change in going from water to bubble) in addition to a high resolution in order to capture the low capacitance values associated with bubbles. A typical capacitance value range for when a bubble exists could be between 20 fF to 40 ⁇ F.
- the large range is due to the fact that many choices are available as to the size of the electrodes and the thickness of the passivation layer on top of the electrodes (e.g., SiO 2 , TiO 2 , nitride, or no passivation layer at all).
- the passivation layer on top of the electrodes e.g., SiO 2 , TiO 2 , nitride, or no passivation layer at all.
- Figure 24 is a flowchart of a method 200 for detecting bubbles. The method 200 is performed using the system 100.
- a capacitance (self or mutual) is measured at an electrode or between two electrodes to measure a capacitance value and the value is output as raw data.
- the measurement is performed by outputting a control signal from the control unit 12, which control signal results in the application of an input pulse to an electrode being measured.
- the control unit 12 senses the electrical response of the electrode, e.g., by measuring a voltage or a current across the electrode, or between the electrode and another electrode, and calculates the capacitance as a function of this response.
- the calculation of self and mutual capacitances is known in the art of touch screen displays.
- Each measured capacitance can be output as a raw data value to the data processing unit 50 using the data acquisition unit 40.
- FIG 25 is a simplified schematic of a circuit 201 for measuring capacitance provided in support of the method 200.
- the circuit 201 includes a decoder 220, which may be included in the control unit 12 of Figure 14 .
- the decoder 220 is connected via a plurality of driving lines 203, over which the decoder 220 sends signals to activate switches 240.
- the switches 240 may be implemented as thin-film transistors (TFTs) and are switched to connect to respective electrodes 242 that form the electrode array.
- the switches 240 are controlled by the decoder 220 to perform the capacitance measurements, e.g., by driving a specific line 203 simultaneously with an adjacent line 203.
- the switches 240 are further connected to sensing lines 205, which in this example, form the columns of the array.
- Each sensing line 205 is connected to a respective amplifier 230.
- the amplifiers 230 are in a negative feedback configuration with a sensing line 205 and a capacitor 99 being connected to a negative amplifier input, which is also connected to ground via a current source 235.
- a positive input of each amplifier 230 is connected to reference voltage 233, which may also be ground.
- the voltages on the sensing lines 205 are influenced by the capacitances at the electrodes, which capacitances depend on whether a bubble is present. Thus, the voltage outputs of the amplifiers 230 correspond to measured capacitances.
- the measured capacitance is compared to a threshold value.
- the threshold value may vary depending on factors such as pad size, shape or location. However, given the design specifications of the slide, and in view of the above discussion on the bubble detection principles, one of ordinary skill in the art would be able to compute a suitable threshold value.
- the measured capacitance is compared to other measured capacitances, e.g., from a group of neighboring electrodes or the entire set of electrodes in the array, to detect unusually low capacitances.
- the results of the comparisons are evaluated at the data processing unit 60 to determine, based on the bubble detection principles described earlier, whether any bubbles exist, and if so, where the bubbles are located.
- the results are output for display at the display device 60.
- Raw data values are displayed in the form of a two-dimensional table. Each table entry corresponds to a measured capacitance value obtained from a corresponding electrode pad.
- the raw data may be displayed as a three-dimensional graph, e.g., a 3-D mesh where the x and y values correspond to electrode locations and the z values correspond to measured capacitance values.
- the graph is color coded, e.g., using a gradient scheme, e.g., a gray scale scheme or a heat map in which the color gradually changes until a bubble location is reached, at which point the color is changed to a color that contrasts the color(s) of non-bubble locations.
- Color coding is used to show bubble locations on a two-dimensional graph in which the capacitance values are represented using changes in color.
- the data processing unit 60 processes the raw data by normalizing it to a predefined scale.
- the above described graphs can be displayed alone or together with additional values from other parameters that are the subject of the experiment, e.g., pH value and flow rate.
- the additional values are displayed on the same graph, e.g., using a different color scheme and superimposed onto the capacitance values.
- the graphical display of the capacitance values allows a user to quickly determine where bubbles are located, and to take appropriate corrective action in response to the presence of bubbles.
- the user may decide, for example, to keep those additional values (corresponding to one or more parameters being measured by the experiment) which are not associated with the locations of detected bubbles, while discarding values associated with bubble locations.
- the user may decide that the entire set of data should be discarded because there are too many bubbles, thus making the additional values unreliable as a whole.
- the capacitance values are superimposed onto additional measurement data, which additional data is stored in association with layout data representing the physical configuration of the measurement area.
- the layout data may be stored in an electronic file in the form of an image (e.g., a scanned image of the measurement area) or text (e.g., a configuration file for a microarray spotter used to fabricate the array, or a GenePix Array List (GAL) file).
- the additional measurement data may also be image or text (e.g., measured pH values stored in a GAL file or measured pH values rendered in grayscale on a scanned image of the measurement area).
- a composite display may be generated in step 218, which display shows a graphical representation of the array together with the capacitance values superimposed onto the additional measurement values at corresponding locations in the array.
- the superimposition can be rendered as text-on-text, text-on-image or image-on-image.
- An example of text-on-text is displaying a capacitance value in one half of an array location and additional measurement data in the other half.
- An example of text-on-image is displaying the capacitances using a heat map while representing the additional measurement data as numerical values on the heat map.
- An example of image-on-image is displaying the capacitances using a heat map while representing the additional measurement data using a 3-D mesh.
- Superimposed data may be stored in the electronic layout file, prior to or in conjunction with the superimposed display.
- a processor on the slide or on an external computer is configured to automatically invalidate the additional measurement data (e.g., by replacing measurement values with null values) in response to detecting bubbles.
- the processor on the slide may detect bubble locations and output an indication of where the bubbles are located to the external computer, which then performs the invalidating based on the indicated locations. This spares the user from having to manually review the capacitance values to decide whether to keep the additional measurement data.
- Figure 26 is a flowchart of a method 300 for pH modulation. The method 300 may be performed using the system 100.
- a pair of electrodes that are not currently being used for bubble detection are switched to a pH modulation mode of operation by applying an input signal, e.g., a pulsed current between the electrodes.
- the switches that control the mode of operation of the electrodes are implemented using TFTs, e.g., formed using amorphous silicon, polysilicon or indium gallium zinc oxide (IgZo).
- TFTs e.g., formed using amorphous silicon, polysilicon or indium gallium zinc oxide (IgZo).
- an input pulse can be applied, for example, to a single electrode.
- the input pulse for bubble detection may, but need not be identical in shape, magnitude or duration to the input pulse used for pH modulation. Changes in capacitance between water contact and bubble contact are detected by observing the electric response of the same electrode or in the case of mutual capacitance, the response of another electrode.
- the input signal applied at step 310 for pH modulation may be applied during a time in which the input pulse for the bubble detection is not being applied.
- the input pulse for pH modulation is applied between a pair of electrodes. This produces a current that, through oxidation and reduction of buffer components (e.g., quinones), changes the pH level of a test solution situated between the electrodes.
- buffer components e.g., quinones
- the input signal is ended before the electrodes are to be used again for bubble detection.
- the pH level of the test solution is measured to determine whether additional adjustment is required.
- the pH level can be calculated at the control unit 12.
- the pH level can be measured using a separate testing device.
- the input signal is reapplied by the control unit 12 in response to determining that further adjustment of the pH level is required.
- the control unit 12 is configured to apply the input signal multiple times, as a plurality of pH modulating pulses, before determining whether further adjustment is required.
- the plurality of pH modulating pulses can be applied to the same pair of electrodes or to a different electrode pair.
- the input signal may be reapplied at step 316 to the same or a different pair of electrodes.
- the pH modulating pulses may be applied to different electrode pairs in a sequential manner so that the entire electrode array is triggered over time to perform pH modulation.
- the electrodes can be used to perform functions in addition to bubble detection and pH modulation.
- electrodes can be used for temperature modulation.
- the capacitance measurements can be used to estimate the dielectric constant of the test solution, which dielectric constant is then correlated to a rate of cell growth or a rate with which the substance-on-interest binds to a biomolecule.
- the electrodes may be arranged in two layers ( Figure 18 and Figure 19 ). However, it will be understood that the number of layers can be more or less. In fact, a single layer may be sufficient for both pH modulation and bubble detection. Additionally, not every electrode layer needs to be used for pH modulation or bubble detection. Instead, further electrode layers can be used for other purposes, in accordance with the usage of electrodes in conventional biosensors.
- FIG 27 shows a slide 400.
- the slide 400 includes a measurement area 405, a power source 410 and a processing circuit 420.
- the measurement area 405 may be formed of TFTs (for the switches) together with ITO (for the electrodes). Alternatively, the measurement area 405 may be formed using only ITO or ITO in combination with other metals.
- the power source 410 is analogous to the power source 14 in Figure 14 and may be a battery or a passive power source powered, e.g., using magnetic or RF coupling.
- the processing circuit 420 is analogous to the control unit 12 in Figure 14 and may perform preliminary signal processing. Additionally, the processing circuit 420 may perform some of the functions described earlier with respect to the data processing unit 50 (e.g., normalizing or scaling capacitance values or controlling pH modulation).
- the processing circuit 420 may include a processor (e.g., one or more CMOS chips) that processes the raw data obtained from measurement area 405.
- the processing circuit 420 may further include a memory storing instructions or data, used by the processor to process the raw data.
- the processing circuit 420 may be configured to arrange the raw data into a suitable format for output to an external computer, or to perform preliminary data analysis (e.g., bubble detection and invalidating data associated with bubbles).
- the processor may control the sensing operation of the measurement area 405 (e.g., driving and reading data out of the array), perform data compression, and perform wired or wireless transmission of the preliminarily processed data to an external computer. Post-processing and output of the data for display may be performed at the external computer.
- Figure 28 shows a slide 500.
- the components 505, 510 and 520 are analogous to and perform the same functions as the components 405, 410 and 420, respectively, in Figure 27 .
- the power source 510 and the processing circuit 520 are externally connected, e.g., on a peripheral circuit board 515 that fits into a hardware interface of the slide 500.
- Figure 29 shows a slide 600.
- the components 605, 610 and 620 are analogous to and perform the same functions as the components 405, 410 and 420, respectively, in Figure 27 .
- the power source 610 and the processing circuit are externally connected, similar to Figure 28 .
- the circuit board 615 includes a serial port connector for transmission of data and power between the board 615 and the external computer.
- the serial port may be used to transfer measurement data to the external computer, and to supply power for operating the measurement area 605 or for recharging the power source 610.
- processors which can be implemented using any conventional processing circuit and device or combination thereof, e.g., a Central Processing Unit (CPU) of a Personal Computer (PC) or other workstation processor, to execute code provided, e.g., on a non-transitory hardware computer-readable medium including any conventional memory device, to perform any of the methods described herein, alone or in combination, e.g., to output any one or more of the described graphical user interfaces.
- the memory device can include any conventional permanent and/or temporary memory circuits or combination thereof, a non-exhaustive list of which includes Random Access Memory (RAM), Read Only Memory (ROM), Compact Disks (CD), Digital Versatile Disk (DVD), flash memory, and magnetic tape.
- RAM Random Access Memory
- ROM Read Only Memory
- CD Compact Disks
- DVD Digital Versatile Disk
- flash memory and magnetic tape.
- a method for changing the pH of a solution by electronic control which is not comprised by the present invention and includes providing an amount of electric input to the solution using two or more electrodes to electrochemically generate and/or consume hydrogen ions in the solution.
- the generation and/or consumption of the hydrogen ions are achieved by an electrochemical reaction of one or more redox active species in the solution.
- the one or more redox active species is selected from the following: quinones, catechols, aminophenols hydrazines, and derivatives thereof. More preferably, the one or more redox active species is a quinone (See Thomas Finley, "Quinones," Kirk-Othmer Encyclopedia of Chemical Technology, 1-35 (2005 )).
- the one or more redox active species is selected from the following: hydroquinone, benzoquinone, naphthoquinonenaphthoquinone. Most preferably, the one or more redox active species is a quinone derivative, further defined below.
- the two or more electrodes comprise a sense electrode and a reference electrode (RE).
- the sense electrode can also function as a working electrode.
- the two or more electrodes can include a counter electrode and/or a working electrode.
- the two or more electrodes can each be independently made of metal oxide, gold, glassy carbon, graphene, silver, platinum, silver chloride, normal hydrogen, mercury drop, or saturated calomel.
- the solution can be buffered, unbuffered, aqueous, organic, or a mixture thereof.
- the amount of electric input can be provided by providing an amount of electric current.
- An electric source waveform can be selected based on the amount of electric input to be provided.
- the electric source waveform is a galvanostatic waveform or a potentiostatic waveform. More preferably, the electric source waveform is selected from a predetermined map that maps electric input amounts to respective solution pH values.
- OCP can be obtained by measuring the OCP of the two or more electrodes in the solution or calculated from a known or measured initial pH.
- the method can also include determining the pH of the solution based on the OCP of the two or more electrodes in solution.
- the method can also include selecting an electric source waveform based on the amount of electric input and the amount of electric input is provided according to the selected electric source waveform.
- the method can further include determining the pH of the solution based on a measured OCP of the two or more electrodes in the solution.
- the amount of electric input can be selected based on the determined pH.
- a method for monitoring the pH of a solution using a sense electrode, a reference electrode, and a working electrode includes selecting a target open circuit potential (OCP), characterizing an OCP of the solution between the reference electrode and the sense electrode while no electric input is being applied to the working electrode, and iteratively performing the following steps: selecting an amount of electric input to be applied to the working electrode in order to minimize a difference between the OCP of the solution and the target OCP; and applying the amount of electric input to the working electrode to adjust the OCP of the solution.
- OCP target open circuit potential
- the target OCP can be a fixed value or a variable value.
- the target OCP can be a range with an upper bound and a lower bound or is a single value.
- the target OCP is selected based on a target pH.
- the target pH is user defined.
- the sense electrode can also function as the working electrode.
- the sense electrode and the working electrode can be distinct electrodes.
- the distance between the sense electrode and the working electrode is 0 cm to 1cm.
- the electric input may be provided as an electric current or as an electric potential.
- the amount of electric input is provided by applying an electric potential to the working electrode. More preferably, the electric potential is provided according to an electric source waveform.
- the electric source waveform is a galvanostatic waveform or a potentiostatic waveform. Even more preferably, the electric source waveform is selected from a predetermined map that maps electric input amounts to respective solution pH values.
- the sense electrode is coated with a pH sensitive coating and the OCP of the sense electrode and the pH sensitive coating is dominated by the H + ion concentration.
- the pH sensitive coating can be an organic material or an inorganic material.
- the pH sensitive coating is made from a material that is selected from the group consisting of polyaniline, polypyrrole, and iridium oxide.
- a redox reaction is the reaction of quinone derivatives.
- quinone derivatives There are many different derivatives of quinone, each with specific oxidative and reductive peaks and the redox reaction rate has been shown to be dependent on the pH of the solution.
- OCP has been previously demonstrated to be dependent on the pH of the solution.
- a device for controlling the pH of a solution includes a controller, two or more electrodes, and a solution containing one or more redox active species.
- the device is configured to measure the OCP between the two or more electrodes in the solution to generate a measured OCP data and send the measured OCP data to the controller.
- the controller is configured to iteratively perform the following steps: select an amount of current or an electric source waveform based on a difference between the target OCP data and the measured OCP data, apply the selected amount of current to the solution by providing an electric current or an electric potential, according to the electric potential waveform, to one or more of the two or more electrodes, and send a request to the device for another measurement of the OCP.
- the one or more redox active species in the solution generates and/or consumes hydrogen ions through an electrochemical reaction induced by the electric current or the electric potential applied to the solution.
- the one or more redox active species is selected from the following: quinone, catechol, aminophenol, hydrazine, and derivatives thereof. More preferably, the one or more redox active species is a quinone. (See, Thomas Finley, "Quinones," Kirk-Othmer Encyclopedia of Chemical Technology, 1-35 (2005 )). Even more preferably, the quinone is selected from the following: hydroquinone, benzoquinone, naphthoquinone, and derivatives thereof.
- the one or more redox active species is a quinone derivative.
- the solution can be buffered, unbuffered aqueous, organic, or a mixture thereof.
- the electric source waveform can be a galvanostatic waveform or a potentiostatic waveform.
- the electric source waveform is selected from a predetermined map that maps electric inputs to respective solution pH values.
- the two or more electrodes can be made of metal oxide, glassy carbon, graphene, gold, silver, or platinum.
- the two or more electrodes include a reference electrode and a sense electrode. More preferably, the two or more electrodes further include a working electrode and/or a counter electrode.
- Each of the two of more electrodes is respectively made of metal oxide, gold, glassy carbon, graphene, silver, platinum, silver chloride, normal hydrogen, mercury drop, or saturated calomel.
- the sense electrode can also function as a working electrode.
- the sense electrode is coated with a pH sensitive coating and the OCP of the sense electrode and the pH sensitive coating is dominated by the H+ ion concentration.
- the pH sensitive coating can be an organic or an inorganic material.
- the pH sensitive coating is made from a material that is selected the group consisting of polyaniline, polypyrrole, and iridium oxide.
- quinone derivatives that can be added to solutions and are suitable for electrochemical pH modulation in biological buffers, electrochemically active compositions comprising the quinone derivatives, methods of making the derivatives and/or compositions, which are not comprised by the present invention.
- the electrochemically active composition can comprise a quinone derivative, where the reactivity between a nucleophile and the quinone derivative is reduced compared to a reactivity between the nucleophile and an unsubstituted quinone from which the quinone derivative is derived, and the composition is configured such that the pH of the composition is electrochemically modulated via the quinone derivative. More preferably, the reactivity between the nucleophile and the quinone derivative is reduced by at least 50% compared to the reactivity between the nucleophile and the unsubstituted quinone from which the quinone derivative is derived.
- the quinone derivative is defined by a chemical formula selected from the group consisting of:
- each R group is independently selected from the group consisting of: H, C n H 2n+1 , Cl, F, I, Br, OM, NO 2 , OH, OC n H 2n , OC n H 2n OH, O(C n H 2n O) y OH, O(C n H 2n O) y OC n H 2n+1 , O(C n H 2n O) y COOH, O(C n H 2n O) y COOM, COOH, COOM, COOC n H 2n+1 , CONHC n H 2n+1 , CON(C n H 2n+1 ) 2 , SO 3 H, SO 3 M, NH 2 , NHC n H 2n+1 , N(C n H 2n+1 ) 2 , NHC n H 2n OH, NHC n H 2n OH, NHC n H 2n
- the composition is an aqueous solution.
- the composition can further comprise an additive selected from the group consisting of: an aqueous buffer, an organic solvent, an electrolyte, a buffer salt, a bioreagent, a biomolecule, a surfactant, a preservative, a cryoprotectant, and combinations thereof.
- the one or more nucleophiles are selected from the group consisting of: amines, thiols, amino acids, peptides, proteins, and combinations thereof.
- the reactivity between the nucleophile and the quinone derivative is reduced compared to the reactivity between the nucleophile and the unsubstituted quinone from which the quinone derivative is derived due to: (i) increased steric hindrance of a nucleophile binding site by one or more of the R groups; (ii) elimination of the nucleophile binding site by covalent bonding between the nucleophile binding site and one of the R groups.
- the reactivity between the nucleophile and the quinone derivative is reduced compared to the reactivity between the nucleophile and the unsubstituted quinone from which the quinone derivative is derived due both (i) and (ii).
- Also provided are methods comprising modifying a quinone having one or more R groups by substituting one or more of the R groups with a substituent to provide a quinone derivative, where the quinone derivative has a reduced reactivity with a nucleophile compared to a reactivity between the quinone and the nucleophile; and the substituent is independently selected from the group consisting of: H, C n H 2n+1 , Cl, F, I, Br, OM, NO 2 , OH, OC n H 2n , OC n H 2n OH, O(C n H 2n O) y OH, O(C n H 2n O)yOC n H 2n+1 , O(C n H 2n O) y COOH, O(C n H 2n O) y COOM, COOH, COOM, COOC n H 2n+1 , CONHC n H 2n+1 , CON(C n H 2n+1 ) 2 , SO 3 H,
- the one or more R groups can be substituted with a polar.
- the polar group has atoms containing lone pair electrons.
- the polar group is capable of forming hydrogen bonds with water.
- the polar group contains at least one of oxygen, nitrogen, and sulfur atoms. More preferably, the polar group is selected from the group consisting of: OH, CH 2 OH, OCH 3 , COOH, SO 3 H, NH 2 , NH 3 Cl, ONa, a sugar, an amino acid, and a peptide.
- Also provided are methods of synthesizing substituted methyl quinone comprising: (i) a halide substitution step of reacting a starting material with a hydrogen halide in the presence of acetic acid and an aldehyde; (ii) reacting a material produced by step (i) with a nucleophile of structure R-X; (iii) reacting a material produced by step (ii) with an oxidizing agent; and (iv) reacting a material produced by step (iii) with a reducing agent, where R is selected from the group consisting of: H, C n H 2n+1 , Cl, F, I, Br, OM, NO 2 , OH, OC n H 2n , OC n H 2n OH, O(C n H 2n O) y OH, O(C n H 2n O) y OC n H 2n+1 , O(C n H 2n O) y COOH, O(C n H 2
- the starting material can be dialkoxybenzene and the result of the halide substitution step is an ortho -quinon, para -quinone, or a combination thereof.
- the number of halide groups per molecule of the ortho -quinone or para -quinone is 1, 2, 3, or 4.
- the starting material can be dialkoxynaphthalene and the result of the halide substitution step is an ortho- naphthoquinone, para -naphthoquinone, or a combination thereof.
- the number of halide groups per molecule of the ortho -naphthoquinone or para -naphthoquinone is 1 or 2.
- the hydrogen halide is selected from the group consisting of: HCl, HBr, HI, and combinations thereof.
- the oxidizing agent is selected from the group consisting of: cerium ammonium nitrate, iodine, hydrogen peroxide, hypervalent iodine, iodobenzene diacetate, bromine compounds, and combinations thereof.
- the reducing agent is selected from the group consisting of: sodium borohydrate, potassium borohydrate, sodium hydrosulfite, trichlorosilane, and combinations thereof.
- the pH of the solution before electrochemically reacting the quinone derivative using the one or more electrodes is 1 to 14.
- the pH of the solution after electrochemically reacting the quinone derivative using the one or more electrodes is 1 to 14.
- the solution contains one or more nucleophiles.
- the one or more nucleophiles are selected from the group consisting of: amines, thiols, amino acids, peptides, proteins, and combinations thereof.
- the solution can contain a reduced quinone derivative and electrochemically reacting the quinone derivative results in an electrochemical oxidation reaction of the reduced quinone derivative to make the pH of the solution more acidic.
- the concentration of the reduced quinone derivative is 0 to 1M.
- the solution can contain an oxidized quinone derivative and electrochemically reacting the quinone derivative results in an electrochemical reduction reaction of the oxidized quinone derivative to make the pH of the solution more basic.
- the concentration of the oxidized quinone derivative is 0 to 1M.
- the solution contains one or more buffer components provided in a concentration that is 0 to 1M.
- the one or more buffer components are selected from the group consisting of: organic solvents, electrolytes, bioreagents, biomolecules, surfactants, and combinations thereof.
- the method can further comprise measuring the pH of the solution.
- the pH is measured continuously.
- the quinone derivative is electrochemically reacted by providing an amount of electric current.
- the pH is measured before providing the amount of electric current.
- the amount of electric current is selected based on the measured pH.
- Quinones are herein defined as unsubstituted quinones.
- the chemical structures I - XII would represent quinones if all of the R groups were hydrogen.
- Quinone derivatives are herein defined as compounds that are structurally similar to quinones except that at least one hydrogen is replaced by a substituent. In cases where more than one hydrogen is replaced by a substituent, the identity of the substituents may be independently selected but are not required to be unique.
- the instant quinone derivatives have reduced reactivity with nucleophiles and the pH of the biological buffer containing the quinone derivatives is able to be electrochemically modulated.
- OCP open circuit potential
- generation and/or consumption of the hydrogen ions are achieved by an electrochemical reaction of one or more redox active species in the solution.
- the one or more redox active species is selected from the group consisting of: quinones, catechols, aminophenols, hydrazines, derivatives thereof, and combinations thereof.
- the one or more redox active species is a quinone selected from the following: hydroquinone, benzoquinone, naphthaquinone, derivatives thereof, and combinations thereof.
- the two or more electrodes comprise a sense electrode and a reference electrode.
- the sense electrode can be configured to also function as a working electrode.
- the two or more electrodes also comprise a counter electrode and/or a working electrode.
- the two or more electrodes are each independently made of a material selected from the group consisting of: metal oxide, gold, glassy carbon, graphene, silver, platinum, silver chloride, normal hydrogen, mercury drop, saturated calomel, and combinations thereof.
- the solution is buffered, unbuffered, aqueous, organic, or a mixture thereof.
- the method further comprises determining the pH of the solution based on the measured OCP of the two or more electrodes in the solution.
- selection of an electrical waveform is based on the determined pH.
- the method further comprises selecting an electrical waveform and providing the electrical waveform to the solution.
- the electrical waveform is either a galvanostatic waveform or a potentiostatic waveform.
- the electrical waveform is selected from a predetermined map that maps respective current amounts to respective electrical waveforms.
- a biosensor system comprising a support that includes an a sense electrode, a reference electrode, and a working electrode; an electrochemically active agent, which is not comprised by the present invention, wherein the biosensor is configured to control a change of a redox state of the electrochemically active agent, and the biosensor is configured to iteratively perform the following: selecting an amount of current to be applied to the working electrode in order to minimize a difference between the OCP of the solution and the target OCP; applying the selected amount of current to the working electrode to adjust the OCP of the solution; and measuring the OCP of the solution.
- the solution is an aqueous solution.
- the sense electrode can also function as the working electrode.
- the sense electrode and the working electrode can be distinct electrodes and a distance between the sense electrode and the working electrode is 0 cm to 1cm.
- the amount of current applied to the working electrode is provided by applying an electrical waveform.
- the electrical waveform is a galvanostatic waveform or a potentiostatic waveform.
- the electrical waveform is selected from a predetermined map that maps respective current amounts to respective electrical waveforms.
- the sense electrode is coated with a pH sensitive coating.
- the pH sensitive coating is an organic material or an inorganic material.
- the pH sensitive coating is made from a material selected from the group consisting of: polyaniline, polypyrrole, iridium oxide, and a combination thereof.
- the solution is an aqueous solution.
- the target pH is set by incorporating an electro-chemical delta-sigma-modulator. More preferably, the output-signal of the electro-chemical delta-sigma-modulator is digitally filtered to get a digital representation of the charge needed to create the target pH.
- the target OCP is a range with an upper bound and a lower bound. More preferably, the target pH is a single target value.
- the sense electrode can also function as the working electrode. The sense electrode and the working electrode can be distinct electrodes and a distance between the sense electrode and the working electrode is 0 cm to 1cm.
- the amount of current applied to the working electrode is provided by applying an electrical waveform.
- the electrical waveform is a galvanostatic waveform or a potentiostatic waveform.
- the electrical waveform is selected from a predetermined map that maps respective current amounts to respective electrical waveforms.
- the sense electrode is coated with a pH sensitive coating.
- the pH sensitive coating is an organic material or an inorganic material.
- the pH sensitive coating is made from a material selected from the group consisting of: polyaniline, polypyrrole, iridium oxide, and combinations thereof.
- a device for controlling a pH of a solution comprising: a controller; two or more electrodes; and a solution containing one or more redox active species, wherein the device is configured to iteratively perform the following: measure an open circuit potential (OCP) between the two or more electrodes in the solution to generate a measured OCP data; select, using the controller, an amount of current or an electric potential waveform based on a difference between target OCP data and the measured OCP data; and apply, using the controller, the selected amount of current or the selected electric potential waveform to the solution via one or more of the two or more electrodes.
- OCP open circuit potential
- the solution is an aqueous solution.
- the one or more redox active species generates or consumes hydrogen ions through an electrochemical reaction induced by the electric current or the electric potential applied to the solution.
- the one or more redox active species is selected from the following: quinones, catechols, aminophenols hydrazines, derivatives thereof, and combinations thereof.
- the one or more redox active species is a quinone selected from the following: hydroquinone, benzoquinone, naphthaquinone, derivatives thereof, and combinations thereof.
- the solution is buffered, unbuffered aqueous, organic, or a mixture thereof.
- the electric potential waveform is a galvanostatic waveform or a potentiostatic waveform. More preferably, the electric potential waveform is selected from a predetermined map that maps respective current amounts to respective electric potential waveforms.
- the two or more electrodes comprise two or more of a reference electrode, working electrode, counter electrode, or sense electrode that is made of a material independently selected from the group consisting of: metal oxide, gold, glassy carbon, graphene, silver, platinum, silver chloride, normal hydrogen, mercury drop, saturated calomel, and combinations thereof.
- the sense electrode can also function as a working electrode.
- the sense electrode is coated with a pH sensitive coating.
- the pH sensitive coating is an organic material or an inorganic material.
- the pH sensitive coating is made from a material selected from the group consisting of: polyaniline, polypyrrole, iridium oxide, and combinations thereof.
- FIG. 30 A drawing of a system having electrochemically active agent in solution is presented in Figure 30 .
- the electrochemically active agent was attached to the electrode surface and not in solution.
- the system provides an anode electrode and an electrochemically active agent in solution. Applying a current to the electrode induces the electrochemically active agent to undergo an electrochemical redox reaction which makes the pH of the solution near the electrode more acidic. Having the electrochemically active agent in solution rather than attached to the electrode surface has many advantages.
- a more significant change can be inflicted on the surrounding environment if the amount of electrochemically active agent is not limited by the density of the surface layer, thereby increasing capacity of the device; fresh electrochemically active agent can be supplied to the electrode surface via diffusion from bulk solution, thereby allowing for cycling capability; and universal electrochemistry can be applied to all types of electrodes, which will not interfere with other surface chemistries such as attachment of anti-fouling reagents or biomolecules.
- the structure of the quinones were modified to satisfy the requirements for use in biological solutions.
- a molecule In order to be useful for pH modulation in biological buffers, a molecule should satisfy the following requirements: release or consume protons through electrochemical reaction upon electronic stimulation, sufficient water solubility, reduction and oxidation potential should be lower than the potential of water hydrolysis or other redox active species within the solution, stability in solution in the absence of electronic stimulation (i.e., no autooxidation/reduction), low reactivity towards nucleophiles, compatibility with biological samples (for example: proteins, peptides, cells, DNA, and enzymes).
- Figure 31 shows quinone derivatives that can be used for pH modulation in aqueous solutions.
- Example 1- Electrochemical generation of H+ or OH- ions at electrode surfaces.
- Electrode material used The electrode material was indium tin oxide. This is a semiconducting electrode surface with very large potential window in an aqueous solution.
- Electro-oxidation of species to produce H + ions Oxidation of ascorbic acid at the electrode surfaces produced H + ions and changed the electrode surface pH to a more acidic state: AH 2 ⁇ A + 2H + + 2e - , where AH 2 is ascorbic acid (C 6 H 6 O 6 ) (as shown in Figure 5 ).
- the electrode potential at which it oxidizes was less than 0.5V for Indium tin oxide material vs Ag/AgCl reference electrode (as shown in Figure 7 ). This potential was less than the voltages needed for the oxygen evolution reaction in aqueous solution. Higher electrode potential (e.g > IV for ITO electrodes in just phosphate buffer) can damage the PEG layer (as shown in Figure 8 ).
- the ascorbic acid also acted as a sacrificial species to prevent electrochemical degradation of the surface chemistry.
- Electro-reduction of species to produce OH- ions Reduction of benzoquinone (C 6 H 4 O 2 ) into Hydroquinone (C 6 H 6 O 2 ) can produce OH - ions at -0.1V: BQ + 2e- + 2H 2 O ⁇ HQ + 2OH - This reduction reaction increased the pH at the electrode interface.
- the amount of H + or OH - ions generated will depend on the concentration of species present in solution (nM-mM range), potential applied (-2V to +2V), type of waveform (pulse, constant, sawtooth, sinusoidal, square wave at different frequencies and duty cycles), and diffusion of the species (can be varied due to additives in the solution). These parameters can be optimized to get different pHs at the each of the electrode element present in the multisite biosensor.
- Enzymes such as oxidases, ureases or dehydrogenases have been known to consume or generate hydrogen during the reaction.
- Oxidation of glucose in the presence of glucose oxidase can produce H + ions that are used to change the pH near the proteins of interest.
- Example 3 Co-immobilization of enzymes along with biomolecular probes in a biomolecular interface layer
- Proteins are attached to micro/nanocavities of a solid surface on an electromagnet.
- the enzymes are separately attached to magnetic micro/nanoparticles in the solution. Controlling the electromagnet that is fabricated/placed underneath controls the local pH values. Then the enzymatic reaction is triggered by introducing the corresponding enzyme substrate (as shown in Figure 6 ). Alternatively electrochemically active enzymes are used. The pH change is localized on the cavities and the protein interactions are modulated.
- Example 5 Electrochemical modulation of pH as monitored by fluorescence intensity with Green Fluorescence Protein (GFP)
- Electrode material used The electrode material was indium tin oxide.
- the fluorescent protein used is GFP immobilized on a glass substrate which includes an array of electrodes. The GFP is applied as spots, each spot covers an area that overlaps with one electrode and an area that is not overlapping with an electrode.
- current 50 microamps
- Figure 10 is used as calibration curve to assess the pH values. After current was turned off, the pH recovered to neutral value within 50 seconds (as shown in Figures 11 and 12B ).
- Para-benzoquinones and ortho-benzoquinones are susceptible to nucleophilic attack at the double bond of the ring (positions 2, 3, 5 and 6 in structure 2 of Figure 31 , positions 3, 4, 5 and 6 in structure 4 of Figure 31 , and positions 2 and 3 in structure 6 of Figure 31 ). Introducing substituents at some or all of those positions can mitigate the problem of nucleophilic attack.
- 1,4-benzoquinone structure 2 in Figure 31 , where R1, R2, R3 and R4 are H
- undergoes Michael addition reaction with amino groups of proteins Loomis et al., Phytochemistry, 5, 423, (1966 ) and US6753312 B2 ).
- 2,5-disubstituted 1,4-benzoquinones do not show susceptibility to Michael addition reaction in the presence of proteins and are more suitable for use in biological buffers.
- Figure 32 demonstrates the effect of substitution on protein stability in the presence of benzoquinones. Fluorescence intensity of Green Fluorescent Protein (GFP) was measured after incubation with three different benzoquinones in phosphate buffered saline for 30 min (concentration of benzoquinones was 0.5mM). The difference in fluorescence intensity indicates the varied effect that the different substitutions in benzoquinones have on the stability of GFP.
- GFP Green Fluorescent Protein
- Fluorescence intensity of GFP is indicative of its structural integrity. Losses in fluorescence intensity usually indicate loss of its tertiary structure (protein denaturation) ( Yin D. X., Zhu L., Schimke R. T. Anal. Biochem. 1996, 235:195-201 ). As shown in Figure 32 , GFP retains 100% of its fluorescence intensity after incubation with di-substituted benzoquinone for 30 min, while incubation with unsubstituted benzoquinone and mono-substituted benzoquinone causes 25% and 7% loss in fluorescence intensity, respectively.
- Water solubility of aromatic compounds can be improved by introducing charged groups or atoms with lone pair electrons that can participate in hydrogen bonding.
- groups are, for example, - OH, - CH 2 OH, - OCH 3 , - COOH, - SO 3 H, - NH 2 , - NH 3 Cl, - ONa.
- Sugars, amino acids, and peptides can also improve water solubility of quinones.
- Synthetic macromolecules such as polyethyleneglycoles can be used as substituents as well.
- Reduction/oxidation potential of quinones can be tuned to fit the needs of specific application.
- electron-donating groups such as alkyl, hydroxyl, alkoxy, methoxymethyl, morpholinomethyl, amino and chloro substituents
- electron-withdrawing groups such as nirto, cyano, carboxylic acid or carboxylic ester groups
- the mechanism of oxidation of hydroquinones in aqueous solutions can involve two steps: transfer of electrons and transfer of protons. Introducing electron-withdrawing or electron-donating substituents addresses the first step of the process. Oxidation potential of hydroquinones can also be lowered by introducing substituents that are capable of forming intramolecular hydrogen bonds with hydroxyl groups of hydroquinone. Such hydrogen bonding weakens the bond between hydrogen and oxygen of hydroxyl group, therefore lowering an overall energy barrier for oxidation reaction. Examples of such R groups are CH 2 OH, CH 2 OCH 3 , morpholinomethyl, and COOCH 3 .
- benzoquinones with low enough reduction potentials should be chosen for systems where reducing agents, like mercaptoethanol, glutathione, and dithiothreitol are present in solution. Examples of such applications are DNA synthesis, electrophoresis, and immunoassays.
- Scheme 1 shown in Figure 34 is a representation of a synthesis of substituted quinone.
- Paraformaldehyde (Aldrich, 4.27 g, 144.75 mmol) and HBr/AcOH (Fluka, 33%, 30 mL) were added slowly to a stirred solution of 1,4-dimethoxybenzene (Aldrich, 10.00 g, 72.37 mmol) in glacial acetic acid (Fisher, 50 mL). The mixture was stirred at 50°C for one hour, allowed to cool to room temperature, and then hydrolyzed in water (200 mL). The white solid was collected by filtration, suspended in CHCl 3 (50 mL), and refluxed for 10 min.
- a method termed open loop pH control, involves using electric current or electric potential shaping to maintain a desired pH of a solution close to the electrode.
- the method relies on an understanding of the electrochemical components of the system, the major constituents being the reduction/oxidation properties of the quinone, the starting pH of the solution, the electron transfer coefficient of the electrode material, the redox molecule concentration, the salt concentration, and the buffer composition and concentration. All these components impact how the electrochemical reaction changes the pH close to the electrode. With this understanding and by incorporating experimental data, a series of models can be used to define the waveforms to change the pH as required.
- Figure 35 shows an outcome from an open loop waveform experiment designed to hold the pH of the solution close to the electrode at pH 6.5 over 15 minutes.
- the stepped trace approximately extending between current values 3.12e -6 and 3.50e -6 correlates with the current applied to the system (right axis).
- the approximately straight trace correlates with the observed pH close to the electrode surface, which is measured by analyzing the pH dependent fluorescence of green fluorescent protein bound to the surface (left axis).
- Figure 36 shows four different examples of waveforms (A-E) usable to shape and control the pH of the solution.
- the black line is the current/potential driven input and the grey line is the resultant pH change in the solution close to the electrode surface plotted over time.
- the method can be implemented using various electrode systems, schematics of example setups are shown in Figure 40A-B .
- the method requires a minimum of 2 electrodes 815, 820.
- the open circuit potential of the solution close to the electrode 700 can be measured by applying zero current between the 2 electrodes 815, 820.
- one electrode acts as the sense electrode (SE) 815 and the second acts as a reference electrode (RE) 820.
- a current 800 Figure 40A
- an electric potential 804 Figure 40B
- one electrode 815 acts as a working electrode (WE) and the second electrode 820 acts as a counter electrode (CE).
- WE working electrode
- CE counter electrode
- a method termed closed loop pH control, uses the open circuit potential as a feedback measurement to control the current or potential.
- FIG 38A illustrates a controlled OCP on the SE by using a closed loop feedback method with a single OCP V TARGET .
- the system is driven to apply a current from a current source 800 to increase the H + concentration in solution 700 until the V in 830 detected by the SE 817 reaches a single OCP V TARGET value.
- current source 800 is shut off using switch 802 and diffusion of the H + ions away from the SE 817 results in reduction of the H + concentration in solution 700.
- the system can be set to drive a decrease in the H + concentration until a OCP V TARGET value is reached and then diffusion of the H + ions towards the SE results in increase of the H + concentration (not shown).
- positive 800 and negative 802 current sources are used so that the system does not need to rely on diffusion to facilitate the change of pH.
- This system can actively change the pH in both a positive and negative direction.
- the system is driven to apply a positive current from a current source 800 to increase the H + concentration until the V in 830 reaches a single OCP V TARGET value and a changeover switch 803 is used to connect a negative current source 801 to the WE 816 to apply a negative current and drive the setup in reverse to reduce the H + concentration.
- a changeover switch 803 is used to connect a negative current source 801 to the WE 816 to apply a negative current and drive the setup in reverse to reduce the H + concentration.
- FIG 38B shows experimental data of the OCP between the SE 817 and RE 822, which changes as current is applied to the WE 816.
- an upper and a lower target are pre-set via controller 900 for the value of the OCP on the SE 817.
- the feedback activates current driven pH change when the potential is below the lower bound and switch 802 cuts the current when above the upper bound.
- the data shows the OCP rising until the upper target is reached.
- the feedback then switches off the WE 816, which leads to a drop in the OCP as the buffer from the bulk starts to restore the local pH of solution 700.
- the current is re-initiated using switch 802 to increase the OCP again.
- This feedback mechanism allows a defined pH for solution 700 to be maintained close to the WE 816.
- the feedback can be activated to continuously change the OCP so that a positive current is applied to actively increase the OCP until the upper bound is reached and then a negative current in applied in reverse to actively decrease the OCP until a lower bound is reached. This way, the system does not rely on passive diffusion but actively monitors and adjusts the pH by electronic control.
- Figure 39 shows experimental results of the open circuit potential voltage measured on a sense electrode adjacent to a working electrode with applied current.
- the working electrode is in a closed loop feedback with the sense electrode.
- the open circuit potential (OCP) of the working electrode as detected by the sense electrode is analogous to the pH of the solution near the working electrode.
- the feedback has been set to apply current to the WE only when the sense electrode open circuit potential is below 0.2V.
- the feedback is then bound between 0.19V and 0.2V (target OCP), switching the potential on the working electrode ON below 0.19 and OFF above 0.2V.
- the shift at time 560s is a disruption caused by pipetting the bulk solution into the working electrode. This perturbs the pH gradient that was generated by the current applied to the working electrode causing the pH of the solution to immediately return to the pH of the bulk solution.
- the closed loop feedback system is able to restore and then maintain the target OCP.
- Figures 41-56 show schematics for a closed loop feedback setup, where the OCP between the sense electrode (SE) 816 and reference electrode (RE) 822 is provided as input to a controller 900 that regulates the current source(s) 800-801 or potential source(s) 804-805 through one or more switches 802-803, 806-810.
- the system can be triggered on and off to increase or decrease the electrochemial generation/consumption of H + ions to balance the increase or decrease with the rate of diff-usion of buffering ions from bulk solution to achieve a specific pH value as defined by a target OCP (V TARGET ) between the SE 816 and RE 822.
- V TARGET target OCP
- Example 20 Use of a pH sensitive coating
- improved pH sensitivity can be incorporated by the addition of a pH sensitive coating 840 on the working and/or sense electrode 815, 816, 817.
- a pH sensitive coating 840 is PANI, which has been shown to have exceptional pH sensitivity.
- PANI contains charged groups that interact with the hydrogen ions and change the conductivity of the polymer.
- the response of PANI as a function of pH is close to the Nernstian limit of pH detection (59mV/pH).
- the change in open circuit potential of PANI is highly selective for H + ions, unlike just a bare electrode surface that is sensitive to other ions in solution other than just H + .
- Figure 37 shows a response of the open circuit potential (OCP) as a function of pH where the surface of the electrode is coated with a pH sensitive PANI coating.
- OCP open circuit potential
- the response of the OCP as a function of pH is shown by the slope of the line to be approximately 60mV/pH which is close to the Nernstian limit.
- Figure 40 shows example schematics of device designs utilizing the open loop method.
- a controlled current source is used while in part B a controlled voltage source is used.
- FIGS 41 , 43 , 45 , 47 , 49 , 51 , and 53 show various designs for the closed loop method with a single controlled current source 800
- Figures 42 , 44 , 46 , 48 , 50 , 52 , and 54-56 show alternative designs using a dual controlled current source 800, 801.
- the closed loop method can also be implemented on designs with a PANI coated 840 sense electrode 817 ( Figures 43 , 44 , 47-50 , and 53-56 ).
- the WE and SE may also be combined into a single electrode 815 that is able to function as both the sense and working electrodes ( Figures 45-48 ).
- switches 802-803, 806-810 are used to connect and disconnect the current 800-801 and voltage sources 804-805.
- Figures 41 , 43 , 45 , and 47 shows a simple switch 802 for connecting and disconnecting the current source 800.
- Figure 49 shows a similar switch 806 for connecting and disconnecting the voltage source 804.
- Figure 42 , 44 , 46 , and 48 shows a changeover switch 803 for switching between the positive current source 800 and negative current source 801.
- Figure 51 shows a similar changeover switch for switching between positive voltage source 804 and negative voltage source 805.
- switches 808-810 operate in conjunction with clock phases Phil and Phi2.
- Switches 808 and 810 operate in conjunction with clock phase Phil and switch 809 in conjunction with Phi2.
- the various switches which are controlled by the controller 900 based on feedback to allow for additional levels of control over the WE potential input and SE measurement output.
- FIG 55 schematically shows the system architecture with a closed loop controller.
- This system controls the pH with only one target value V TARGET 907.
- the same architecture can be applied to electrochemical cells with systems which use electric voltages instead of electric currents to modulate pH.
- the controller can work as follows.
- the input voltage (V in ) 830 is sampled 901 and compared 902 to a target voltage V TARGET 907 and the difference is amplified 903 and processed by a loop filter 904.
- a loop filter 904 is a PID-controller with a proportional part (P), an integrating part (I) and a differentiating part (D).
- the output signal of the loop filter 904 is compared with a fixed threshold by a comparator 905.
- the output of the comparator 905 can be positive or negative. This is equivalent to a digital representation.
- This digital signal is then stored in a clocked module 906 like a flip-flop or a latch.
- the frequency of the clock 908 can be much higher than the frequency which is determined by the inverse of the diffusion time constant of H + ions.
- the output signal of the flip-flop determines if a positive or negative unity current is applied to the WE 816.
- This scheme can also be applied to a system with only one current source 800 or to a system with voltage sources 804, 805 instead of current sources 800, 801.
- the system works as an "electrochemical delta-sigma-modulator," where the quantization error of the unity current sources is "shaped" by the transfer functions of the electrochemical cell and the transfer function of the electronic loop filter 904 and is distributed over a wide frequency spectrum determined by the frequency of the clock CLK 908.
- the one-bit-output of the comparator can be filtered by a digital filter 909, as shown in Figure 55 . This results in a digital representation of what the system has to apply to electrochemical cell in order to keep the pH at the target value.
- FIG 56 shows a second controller architecture where the main difference from that of Figure 55 being the way how the target value for pH is set.
- the target pH is set by an analog voltage V TARGET 907.
- This V TARGET 907 could be generated by a digital-to-analog converter (DAC).
- the input voltage V in 830 is digitized by an analog-to-digital converter (ADC) 911 and then compared 912 with a digital target value 910.
- ADC analog-to-digital converter
- the electronics is clocked at a frequency 908 much higher than the inverse of the diffusion time constant of the H + ions.
- the controllers in Figure 56 can also be used to "measure” using the closed loop method the electric current or voltage that is needed to set a certain target pH. This information can be used to characterize the system and derive stimuli for an open loop system.
- One example where this might be very useful is an array-structure of many sites where one site is used to "measure” the correct values using the closed loop, and those values are then applied according to the open-loop to many other "mirrored" sites.
- Figure 57 shows an illustration of example electrode configurations (routing not shown) for pH sensing.
- An illustration of the geometry of the working electrode and sense electrode includes: (A) sense electrode located adjacent to the working electrode, (B) sense electrodes located within the working electrode, (C) multiple sense electrodes for a single working electrode, and (D) interdigitated working and sense electrodes.
- the incorporation of the PANI surface is advantageous for improving the accuracy of closed loop pH control.
- the working electrode and sense electrode can also be one and the same by switching between active and passive/measuring step.
Description
- The invention relates to a method and corresponding biosensor devices for detecting the presence of bubbles in an aqueous solution.
- Recently there has been an increased interest in predictive, preventative, and particularly personalized medicine which requires diagnostic tests with higher fidelity, e.g., sensitivity and specificity. Multiplexed measurement platforms, e.g., protein arrays currently used in research, are among the promising diagnostics technologies for the near future. The samples in these tests can be human body fluids such as blood, serum, saliva, biological cells, urine, or other biomolecules but can also be consumables such as milk, baby food, or water. Within this field there is a growing need for low-cost, multiplexed tests for biomolecules such as nucleic acids, proteins, and also small molecules. Achieving the sensitivity and specificity needed in such tests is not without difficult challenges. Combining these tests with integrated electronics and using CMOS technology has provided solutions to some of the challenges.
- The two main limitations in a detection assay include sensitivity and cross-reactivity. Both of these factors affect the minimum detectable concentration and therefore the diagnostic error rate. The sensitivity in such tests is generally limited by label detection accuracy, association factor of the probe-analyte pair (for example an antibody-antigen pair), and the effective density of probe molecule (for example probe antibody) on the surface (as shown in
Figure 1 ). Other molecules in the biological sample can also affect the minimum detectable concentration by binding to the probe molecule (for example the primary antibody), or by physisorption of the analyte to the surface at the test site (as shown inFigure 2 ). The detection agent (for example a secondary antibody) may also physisorb to the surface causing an increase in the background signal (as shown inFigure 2 ). Solving the cross-reactivity and background problem can take a significant amount of time in the assay development of a new test and increases the cost and complexity of the overall test. The assay is typically optimized by finding the best reagents and conditions and also by manufacturing the most specific probe molecule (for example antibody). This results in a long development time, the infeasibility of tests in some cases, and a higher manufacturing cost. For example a typical development of an ELISA assay requires several scientists working for more than a year finding the correct antibody as part of the assay development. Cross-reactivity of the proteins may be the source of the failure of such an effort. - A biosensor providing a multiple site testing platform was thought to provide a solution to some of the above described limitations in assay development.
U.S. Patent Nos. 9,927,435 9,063,138 - Accurate and precise control of the assay conditions at different sites to generate large changes in the binding efficiency factors is important in the performance of such biosensor as a detection system for a biomolecular analyte of interest. In
U.S. Patent No. 9,075,041 - General methods for measuring and controlling pH are known in the art. (Durst et al., "Hydrogen-Ion Activity," Kirk-Othmer Encyclopedia of Chemical Technology, pp. 1-15 (2009)). Active pH control of a solution in contact with an electrode surface has potential applications in protein-protein interactions, isoelectric focusing, electrophoresis, combinatorial pH studies of chemical and biochemical processes, DNA denaturation and renaturation, controlling enzymatic processes, cell manipulations, as a means for accelerating or inhibiting chemical reactions with high spatial and temporal resolution, or in other processes involving pH as a variable. For example,
U.S. Patent No. 9,075,041 U.S. Patent No. 9,810,688 - Attempts to control solution properties through electrochemical agents attached to the surface have been described. Electrochemically triggered release of biotin from a modified gold electrode surface via reduction and subsequent lactonization of quinone tether was demonstrated (Hodneland et al., "Biomolecular surfaces that release ligands under electrochemical control," J. Am. Chem. Soc. 122, pp. 4235-36 (2000)). Electrochemical control of self-assembly and release of antibodies from the surface into solution was achieved by reduction and oxidation of n-decanethiol-benzoquinones (Artzy-Schnirman et al., "Artzy-Schnirman et al., Nano Lett. 2008, 8:3398-3403," Nano Lett. 8, pp. 3398-3403 (2008)). Release of protons from a 3D layer of electroactive material was demonstrated by Frasconi et al. using materials composed of gold nanoparticles and thioanilines (Frasconi et al., "Electrochemically Stimulated pH Changes: A Route To Control Chemical Reactivity," J. Am. Chem. Soc. 132(6), pp. 2029-36 (2010)). Electrochemical oxidation of thioaniline groups produced protons that diffused from electrode surface into the surrounding solution, thus altering its pH.
- Electrochemical pH modulation in biological solutions presents a significant challenge due to complex nature of the system. The limitations include: presence of buffer components that restrict pH changes, limitations on co-solvents that can be used, presence of strong nucleophiles, such as amines and thiols, and presence of interfering electrochemically active components, such as DNA bases, ascorbic acid and glutathione.
- Quinones are one of the most widely studied classes of electrochemically active molecules (See Thomas Finley, "Quinones," Kirk-Othmer Encyclopedia of Chemical Technology, 1-35 (2005). See also, Chambers, J. Q. Chem. Quinonoid Compd. 1974, Pt. 2:737-91; Chambers, J. Q. Chem. Quinonoid Compd. 1988, 2:719-57; Evans, D. H. Encycl. Electrochem. Elem. 1978, 12: 1-259). Hydroquinone/benzoquinone transformation has been used as a model system to produce proton gradients at electrode surface (Cannan et al., Electrochem. Communications 2002, 4:886-92). A combination of para-hydroquinone and anthraquinone was used for generation of acidic pH in organic solution as a first step of DNA synthesis, and organic base was added to the solution in order to confine the acidic pH to electrode surface (Maurer, PLOS One 2006, 1:e34). However, those systems cannot be adopted for use in biological solutions due to reactivity of benzoquinone (the product of hydroquinone oxidation) towards nucleophiles that are often present in biological systems, such as peptides, proteins and glutathione (Amaro et al., Chem Res Toxicol 1996, 9(3):623-629); and further due to the insufficient solubility of unsubstituted anthraquinone in water.
- Electrochemical time of flight measurements have demonstrated that H+ ions generated on electrodes will diffuse out (Slowinska et al., "An electrochemical time-of-flight technique with galvanostatic generation and potentiometric sensing," J. Electroanal. Chem. Vol. 554-555, pp. 61-69 (2003); Eisen et al., "Determination of the capacitance of solid-state potentiometric sensors: An electrochemical time-of-flight method," Anal. Chem. 78(18), pp. 6356-63 (2006)). It has also been shown that the open circuit potential of an electrode surface is a function of the ionic concentration in a solution, including the H+ concentration in the solution, and therefore of the pH of the solution (Yin et al., "Study of indium tin oxide thin film for separative extended gate ISFET," Mat. Chem. Phys. 70(1), pp. 12-16 (2001)). Similarly, the redox reaction rates of electrochemical species are also pH dependent (Quan et al., "Voltammetry of quinones in unbuffered aqueous solution: reassessing the roles of proton transfer and hydrogen bonding in the aqueous electrochemistry of quinones," J. Am. Chem. Soc. 129(42), pp. 12847-56 (2007)). There has also been work done on improving the pH sensitivity of an electrode by incorporation of novel pH sensitive coatings to improve the accuracy of pH sensing (Ge et al., "pH-sensing properties of poly(aniline) ultrathin films self-assembled on indium-tin oxide," Anal. Chem. 79(4), pp. 1401-10 (2007)).
- Many life science applications (proteomics, genomics, microfluidics, cell culture, etc.) use glass slides as a substrate for performing experiments. Examples of glass slides include protein microarrays, lysate arrays, DNA microarrays and cell culture platforms. One use of a protein microarray is to analyze biological substances (e.g., blood serum) from patients with a specific disease in comparison to corresponding substances from healthy or control subjects. The biological substances are applied to a microarray containing many (often thousands of) human proteins. Antibodies in diseased substances may react (bind) with certain antigens in the microarray, thereby identifying the antigens as disease-specific biomarkers. In addition to protein detection, other types of detection such as colorimetric, chemiluminescence and fluorescence detection are also possible with glass slides.
- Often the experiments are performed under aqueous conditions, in which a substance-of-interest is combined with water or a water-containing liquid and placed onto a slide for analysis. In many cases the presence of bubbles (formed of air or other gases) disturbs the experiment, adversely affecting the results. One example of an adverse effect is when a bubble causes the test solution to dry out. This can create a false binding event where the substance-of-interest (e.g., a biomolecular analyte) fails to bind with a molecule with which the biomolecular analyte is supposed to interact. Another example is where the bubbles change the effective flow rate of the test solution and the flow rate is being measured as part of the experiment. Therefore, it is desirable to detect bubbles and to output an indication of their presence, so that experiment results can be interpreted correctly.
- One way to detect bubbles is to manually check each slide under a microscope. However, microscopy is not always practical because the field of view is typically limited to a small area of the slide, so that checking the entire slide is time-consuming. Additionally, the use of light to illuminate the slide under the microscope can sometimes have a destructive effect on the substance-of-interest. Published PCT Application
WO 2004/061418 - Herein provided are a method for detecting bubbles in an aqueous solution with the features of
claim 1 and a biosensor for detecting bubbles in an aqueous solution with the features ofclaim 10. - According to example embodiments, the pH sensitive probe is a fluorescent protein or a green fluorescent protein.
- According to example embodiments, a first area of the biomolecule interface layer covers at least one area of the support not covered by the two or more electrodes and a second area of the biomolecule interface layer covers at least one area of the two or more electrodes, wherein the pH sensitive probe is immobilized on the first area and second area of the biomolecule interface layer, and wherein the pH sensitive probe is a fluorescent protein.
- According to example embodiments, the method further comprises determining the pH of the solution near the two or more electrodes using a fluorescence intensity of the immobilized pH sensitive fluorescent protein immobilized on the second area of the biomolecule interface layer.
- According to example embodiments, the method further comprises normalizing a fluorescence intensity of the immobilized pH sensitive fluorescent protein immobilized on the second area of the biomolecule interface layer with respect to a fluorescence intensity of the immobilized pH sensitive fluorescent protein immobilized on the first area of the biomolecule interface layer, and the pH is determined using the normalized fluorescence intensity.
- According to example embodiments, the method further comprises measuring the pH using a sense electrode wherein the two or more electrodes comprise the sense electrode.
- According to example embodiments, the biosensor comprises a multisite array of test sites with each test site having the support in the solution and one or more test condition for each test site can be independently varied, and wherein the pH of the solution close to the two or more electrodes in each test site is independently controlled.
- According to example embodiments, the method further comprises collecting signals from the biosensor to obtain a collection of varied signals, wherein the collection of varied signals includes varied signals from the multisite array of test sites.
- According to example embodiments, the control unit is configured to independently detect a presence of a bubble in each test site and if the presence of a bubble is detected store the location of the test site in the multisite array having the bubble.
- According to example embodiments, the pH sensitive probe is a fluorescent protein and optionally a green fluorescent protein.
- According to example embodiments, a first area of the biomolecule interface layer covers at least one area of the support not covered by the two or more electrodes and a second area of the biomolecule interface layer covers at least one area of the two or more electrodes, and wherein the pH sensitive probe is immobilized on the first area and second area of the biomolecule interface layer.
- According to example embodiments, the biosensor is configured to determine the pH of the solution near the two or more electrodes using a fluorescence intensity of the immobilized pH sensitive fluorescent protein immobilized on the second area of the biomolecule interface layer.
- According to example embodiments, the biosensor is configured to normalize the fluorescence intensity of the immobilized pH sensitive fluorescent protein immobilized on the second area of the biomolecule interface layer with respect to the fluorescence intensity of the immobilized pH sensitive fluorescent protein immobilized on the first area of the biomolecule interface layer, and the biosensor is configured to determine the pH using the normalized fluorescence intensity.
- According to example embodiments, the two or more electrodes comprise a sense electrode and the biosensor is configured to measure the pH using the sense electrode.
- According to example embodiments, the biosensor comprises a multisite array of test sites with each test site having the support in the solution and one or more test condition for each test site can be independently varied, and wherein the pH of the solution close to the two or more electrodes in each test site is independently controlled.
- According to example embodiments, the control unit is configured to independently detect a presence of a bubble in each test site and if the presence of a bubble is detected store the location of the test site in the multisite array having the bubble.
- According to example embodiments, the biosensor is configured to obtain a collection of varied signals including varied signals from the multisite array of test sites.
-
-
Figure 1 : Illustration of the steps of a typical and well known ELISA assay according to the prior art: a) Sample introduced to immobilized primary antibody on a blocked surface and incubated, b) Sample washed, and c) labeled secondary antibody is added. The number of labels is proportional to the concentration of target antigen. -
Figure 2 : Illustration of the undesired cross-reactivity according to the prior art. Molecules other than the antigen of interest (diamond) can bind to primary antibody or the surface and either create incorrect signal or prevent the antigen in forming a sandwich. -
Figure 3 : Illustration of a multisite sensor according to the prior art and the components in its detected signal. The two schematics on the bottom correspond to two of the sites. -
Figure 4 : Illustration of the composition of a sensor test site in a multisite sensor, which is not comprised by the present invention. -
Figure 5 : Schematic of the pH change on an electrode surface using an electrochemical method which is not comprised by the present invention. -
Figure 6 : Illustration of pH change by enzymatic reactions when they are brought close to the protein surface using magnetic micro/ nanoparticles. The micro/nano cavity helps in localizing the pH change. -
Figure 7A : Cyclic voltammograms of Indium Tin Oxide (ITO) electrodes in PBS only. The region where pH change can occur is where there is oxygen evolution more than IV in respect to Ag/AgCl reference electrode. -
Figure 7B : Cyclic voltammetric study of the oxidation of Ascorbic acid test in ITO electrodes. -
Figure 8A : Application of IV on the ITO-PEG surface in Phosphate buffer. Impedance changes before and after application of 1V indicates the changes or removal of PEG from electrode. -
Figure 8B : Oxidation of ascorbic acid at 0.5V and 0.75V at ITO-PEG surface. No change in impedance during ascorbic acid oxidation indicates PEG layers do not undergo any change. -
Figure 9 : Illustration of a substrate (glass or plastic), which is not comprised by the present invention, (1) with an array of electrodes (2) onto which a biomolecular interface layer (10) is applied which include fluorescence protein (such as Green Fluorescence Protein (GFP)) spots (5), and immobilized probes (4), immobilized using a polyethylene glycol (PEG) linker (3). -
Figure 10 : shows the change in the fluorescence intensity of GFP covalently bound to the PEG-coated ITO in response to the change in solution pH. The solution pH was adjusted by adding HCl to a dilute phosphate buffer (pH 7.4). -
Figure 11 : shows the pH change at the surface of ITO working electrode generated via current-driven oxidation of a redox active molecule, 2-methyl-1,4-dihydroquinone, in diluted phosphate buffer (pH = 7.4) containing 0.1M Na2SO4. After 10 seconds of induction, current (50 microamps) was applied for 30 second, which resulted in a drop of solution pH to 5.5, as was observed by a change in GFP fluorescence intensity (Figure 10 is used as calibration curve to assess the pH values). After current was turned off, the pH recovered to neutral value within 50 seconds. -
Figure 12 : illustrates the visual changes in the GFP spot before, during and after pH modulation experiment. A, the profile of fluorescence intensity across the spot is shown. B, the changes in the GFP spot fluorescence intensity are shown before (0 sec), during (40 sec), and after (110 sec) applying a current through an electrode. -
Figure 13 : shows a glass slide with an ASIC chip interfaced to transparent ITO electrodes. -
Figure 14 : is a block diagram of a system for bubble detection, according to an example embodiment of the present invention. -
Figure 15 : is a top view of an example electrode array, which is not comprised by the present invention. -
Figure 16 and Figure 17 : show different electrode shapes, which are not comprised by the present invention. -
Figure 18 and Figure 19 : show a simplified electrical model of a slide that provides bubble detection, which is not comprised by the present invention. -
Figure 20 to Figure 22 : are graphs showing simulated capacitance values with and without the presence of a bubble. -
Figure 23 : is a graph showing actual measured capacitance values with and without the presence of a bubble. -
Figure 24 : is a flowchart of a method for detecting bubbles, according to an example embodiment of the present invention. -
Figure 25 : is a simplified schematic of a circuit for calculating capacitance, which is not comprised by the present invention. -
Figure 26 : is a flowchart of a method for pH modulation, which is not comprised by the present invention. -
Figure 27 to Figure 29 : each show a slide with data processing capability, which is not comprised by the present invention. -
Figure 30 : shows a graphic representation of a system for electrochemical pH generation comprising a biological buffer with an electrochemically active agent dissolved in bulk solution over an electrode, which is not comprised by the present invention, where the change in pH is confined to the vicinity of the electrode surface through the buffering action of bulk solution. -
Figure 31 : provides structures of hydroquinones and benzoquinones that can be used for pH generation in biological solutions. -
Figure 32 : demonstrates an effect of substitution in benzoquinones on the stability of proteins. -
Figure 33 : shows square wave voltammograms of substituted quinones in buffered solution (vs. Ag/AgCl). -
Figure 34 : shows steps for the synthesis of substituted hydroquinones and benzoquinones. -
Figure 35 : illustrates an open loop waveform used to maintain the pH of a solution close to an electrode. -
Figure 36 : illustrates examples of waveform shaping for pH control. -
Figure 37 : illustrates a response of the open circuit potential for a PANI coated surface as a function of pH, where the 60mV/pH is close to the Nernstian limit. -
Figure 38 : illustrates, in part A, a controlled OCP on a sense electrode (SE) by using a closed loop feedback method with a single OCP VTARGET, and illustrates, in part B, experimental results of a controlled OCP on the SE by using a closed loop feedback with defined upper and lower OCP VTARGET values. -
Figure 39 : shows experimental results of a closed look feedback method for controlling the pH of the solution as represented by the open circuit potential voltage measured by the sense electrode (SE) by applying a potential to the working electrode (WE). -
Figure 40 : illustrates open loop schematics, which are not comprised by the present invention, wherein in part A, a controlled current source is used, while in part B, a controlled voltage source is used. -
Figure 41 : illustrates a closed loop single controlled current source, which is not comprised by the present invention. -
Figure 42 : illustrates a closed loop dual controlled current source, which is not comprised by the present invention. -
Figure 43 : illustrates a closed loop single controlled current source with a PANI coated sense electrode, which is not comprised by the present invention. -
Figure 44 : illustrates a closed loop dual controlled current source with a PANI coated sense electrode, which is not comprised by the present invention. -
Figure 45 : illustrates a closed loop single controlled current source with a combined working and sense electrode, which is not comprised by the present invention. -
Figure 46 : illustrates a closed loop dual controlled current source with a combined working and sense electrode, which is not comprised by the present invention. -
Figure 47 : illustrates a closed loop single controlled current source with a combined working and sense electrode with PANI coating, which is not comprised by the present invention. -
Figure 48 : illustrates a closed loop dual controlled current source with a combined working and sense electrode with PANI coating, which is not comprised by the present invention. -
Figure 49 : illustrates a closed loop single controlled potential source with a PANI coated sense electrode, which is not comprised by the present invention. -
Figure 50 : illustrates a closed loop dual controlled potential source with a PANI coated sense electrode, which is not comprised by the present invention. -
Figure 51 : illustrates a closed loop single controlled potential source with a combined working and sense electrode, which is not comprised by the present invention, where feedback controlled Phi1 and Phi2 switches are for WE potential input and SE measurement output. -
Figure 52 : illustrates a closed loop dual controlled potential source with a combined working and sense electrode, which is not comprised by the present invention, where feedback controlled Phi1 and Phi2 switches are for WE potential input and SE measurement output. -
Figure 53 : illustrates a closed loop single controlled potential source with a combined working and sense electrode with PANI coating, which is not comprised by the present invention, where feedback controlled Phi1 and Phi2 switches are for WE potential input and SE measurement output. -
Figure 54 : illustrates a closed loop dual controlled potential source with a combined working and sense electrode with PANI coating, which is not comprised by the present invention, where feedback controlled Phi1 and Phi2 switches are for WE potential input and SE measurement output. -
Figure 55 : illustrates a closed loop dual controlled current source with separate working and sense electrode with PANI coating and an analog controller architecture, which is not comprised by the present invention. -
Figure 56 : illustrates a closed loop dual controlled current source with separate working and sense electrode with PANI coating and a digital controller architecture, which is not comprised by the present invention. Also shown is a controller architecture design with, in part A, analog signal processing for closed loop feedback control, and, in part B, digital signal processing for closed loop feedback control, the architecture being applicable to the controller schematics designated inFigures 41-54 . -
Figure 57 : illustrates potential electrode configurations (routing not shown) for pH sensing, which is not comprised by the present invention. - In order to vary the pH or ionic concentration gradient in a multisite array of test sites in a biosensor, a method of modulating the pH or ionic concentration in a biosensor, which is not comprised by the present invention, comprises the steps of:
- a) providing a biosensor comprising a multisite array of test sites in which the conditions for interacting with a biomolecule analyte can be varied independently, each test site comprising a support in an aqueous solution, the support comprising one or more electrodes or an electromagnet, and a biomolecular interface layer having one or more immobilized probes thereon;
- b) adding an electrochemically active agent, an enzyme, an enzyme substrate, a buffer inhibitor, or a combination thereof to the aqueous solution; and
- c) reacting the electrochemically active agent, the enzyme, the enzyme substrate, or a combination thereof in the aqueous solution to produce H+ ion or OH- ions, or increasing the diffusion of H+ ion or OH- ions with the buffering agent or inhibiting the interaction between H+ ions or OH- ions and buffering salts with the buffer inhibitor.
- In the above described method a local pH or ionic concentration gradient can be obtained in the various test sites in a multisite array biosensor. The variation of the local pH and/or ionic concentration gradient at the electrode, and in particular in the vicinity of the (biomolecular) probe in a biomolecular interface layer, over subsets of the multisite array of the biosensor, allows for modulating the binding efficiency of the (biomolecular) probe and an analyte to be tested from a biological sample. The analyte of interest, when bound to the (biomolecular) probe, can be then detected using a detection agent, such as for example a labeled secondary antibody. The modulation of binding efficiencies in a subset of a multisite array provides a method for the accurate determination of such analyte of interest.
- The biosensor preferably comprises a multisite array of test sites as for example is described in
US 2011/0091870 . Such multisite array preferably includes a number of different subarrays/subsets of test sites. Each test sites represents a site for performing an analysis of a (biomolecular) analyte from a biological sample through the detection of the (biomolecular) analyte using a (biomolecular) probe. The analytical conditions in each test site in each of the subarrays/subsets may be varied to obtain a collection of varied signals that will result in multiple equations and multiple unknowns from which the concentration of the (biomolecular) analyte can be determined in order to obtain an accurate measurement of the (biomolecular) analyte. - The multiple unknowns in the obtained varied signals each includes a term that is proportional to a binding efficiency factor, αij, and the concentrations of the various molecules in the biological sample binding that are detected at the test site. The multiple equations with multiple unknowns may be represented for example as follows,

- The number of subarrays/subsets, as well as the number of test sites within each subarray/subset may be varied, as needed to obtain such accurate measurement of the analyte. Some of these analytical conditions include parameters such as for example temperature, shear stress, and pressure. For example the temperature of the aqueous solution in which the biomolecular probe and analyte of interest in the biological sample interact can be varied using the electromagnetic heat at the test site. Another important condition for the interaction between the biomolecular probe and the analyte of interest is the pH or ionic concentration. The method described herein modulates this pH or ionic concentration in the local environment of the biomolecular probe in order to affect the binding efficiency in the vicinity of the biomolecular probe.
- Each test site in the subarray/subset of the multiplesite array comprises a support onto which one or more electrodes are placed and onto which solid surface the biomolecular probe(s) are immobilized or bound. This immobilization of biomolecular probes to a solid surface or support assists in reducing the amount of probe needed for the analytical method and also localizes the detection area to make accurate measurements. The biomolecular probes are therefore attached to solid surfaces of the support and/or electrodes such as those of silicon, glass, metal and semiconductor materials (as shown in
Figure 4 ). - The biomolecular probe is attached or immobilized onto the support and/or electrode(s) within a biomolecular interface layer (as shown in
Figure 4 ). The biomolecular layer includes a layer of immobilized polymers, preferably a silane immobilized polyethylene glycol (PEG). Surface-immobilized polyethylene glycol (PEG) can be used to prevent non-specific adsorption of biomolecular analytes onto surfaces. At least a portion of the surface-immobilized PEG can comprise terminal functional groups such as N-hydroxysuccinimide (NHS) ester, maleimide, alkynes, azides, streptavidin or biotin that are capable of conjugating. The biomolecular probe may be immobilized by conjugating with the surface-immobilized PEG. It is important that the method used to change the pH does not impair the covalent binding of for example the PEG onto the surface of a solid support, or the linker that conjugated the biomolecular probe to the PEG (as shown inFigure 5 ). The method of modulating the pH or ionic concentration as described herein can protect these surface chemistries, while affecting a pH/ionic concentration change in the environment of the biomolecular probe. - A suitable biomolecular probe can be a carbohydrate, a protein, a glycoprotein, a glycoconjugate, a nucleic acid, a cell, or a ligand for which the analyte of interest has a specific affinity. Such probe can for example be an antibody, an antibody fragment, a peptide, an oligonucleotide, a DNA oligonucleotide, a RNA oligonucleotide, a lipid, a lectin that binds with glycoproteins and glycolipids on the surface of a cell, a sugar, an agonist, or antagonist. In a specific example, the biomolecular probe is a protein antibody which interacts with an antigen that is present for example in a biological sample, the antigen being a biomolecular analyte of interest.
- In the analytical method described herein the analyte of interest in a biological sample can be for example a protein, such as an antigen or enzyme or peptide, a whole cell, components of a cell membrane, a nucleic acid, such as DNA or RNA, or a DNA oligonucleotide, or a RNA oligonucleotide.
- A biosensor comprising the device provided herein can be used in an analytical method for determining a biomolecular analyte of interest in a biological sample, which can be for example a protein, such as an antigen or enzyme or peptide, a whole cell, components of a cell membrane, a nucleic acid, such as DNA or RNA, or a DNA oligonucleotide, or a RNA oligonucleotide.
- In such method a local pH or ionic concentration gradient can be obtained at various test sites in a multisite array biosensor. The variation of the local pH and/or ionic concentration gradient at the electrode, and in particular in the vicinity of the (biomolecular) probe in a biomolecular interface layer, over subsets of the multisite array of the biosensor, allows for modulating the binding efficiency of the (biomolecular) probe and an analyte to be tested from a biological sample. The analyte of interest, when bound to the (biomolecular) probe, can be then detected using a detection agent, such as for example a labeled secondary antibody. The modulation of binding efficiencies in a subset of a multisite array provides a method for the accurate determination of such analyte of interest.
- The electrodes can be any electrode suitable in a biosensor for example indium tin oxide (ITO), gold, or silver electrodes. Preferably the electrodes in the biosensor in the method described herein are indium tin oxide (ITO) electrodes.
- Also provided is a method using a biosensor for detecting a biomolecule analyte in a biological sample, which is not comprised by the present invention, which comprises the steps of:
- a) providing a biosensor comprising a multisite array of test sites in which the conditions for interacting with a biomolecule analyte can be varied independently, each test site comprising a support in an aqueous solution, the support comprising one or more electrodes or an electromagnet, and a biomolecular interface layer having one or more immobilized detection agents thereon;
- b) adding in each test site an electrochemically active agent, an enzyme, an enzyme substrate, a buffer inhibitor, or a combination thereof to the aqueous solution;
- c) reacting the electrochemically active agent, the enzyme, the enzyme substrate, or combination thereof in the aqueous solution to produce H+ ion or OH- ions, or increasing the diffusion of H+ ions or OH- ions with the buffer inhibitor, or inhibiting the interaction between H+ ions or OH- ions and buffering salts with the buffer inhibitor;
- d) adding a biological sample to each test site; and
- e) detecting the biomolecule analyte in each test site,
- Also is provided an analytical method of using the device described herein in a biosensor to determine the presence and/or concentration of a biomolecular analyte of interest in a biological sample, which is not comprised by the present invention. This analytical method comprises
- a) providing a biosensor comprising a multisite array of test sites in which the conditions for interacting with a biomolecule analyte can be varied independently, the biosensor having a device comprising a support substrate supporting one or more electrodes and a biomolecular interface layer having immobilized pH sensitive Fluorescent Protein and one or more immobilized probes thereon, and at each test site having an aqueous solution comprising a dilute phosphate buffer and an electrochemically active agent;
- b) at each test site electrochemically reacting the electrochemically active agent in an aqueous solution to produce H+ ion or OH- ions, thereby modulating and controlling the pH at each test site;
- c) adding a biological sample to each test site; and
- d) detecting the biomolecule analyte in each test site,
- The biomolecular analyte can be detected using any suitable detection method. Known detection methods of such analyte include luminescence, fluorescence, colorimetric methods, electrochemical methods, impedance measurements, or magnetic induction measurements. In various of such methods the analyte binds to the immobilized biomolecular probe and a detection agent such as for example a secondary labeled probe that specifically binds to the analyte, bound to the immobilized probe, is introduced. This detection agent or secondary labeled probe gives rise to a detectable signal such as for example luminescence or fluorescence.
- In such analytical method the pH of the solution surrounding the immobilize biomolecular probe has been known to influence the binding/activity between the probe and the analyte to a great extent. Concentration of other ions on surrounding proteins can also heavily influence the binding/activity. Herein are provided methods to modulate the pH and/or ionic concentration in the vicinity of the biomolecular probe immobilized close to a surface. The modulation of the pH near these solid surfaces also affect the non-specific interactions of the analyte to other molecules than the biomolecular probe and the interactions of other molecules in the solution of the biological sample with the biomolecular probe or analyte. The modulation of pH or ionic concentration however should not impair any of the surface chemistries, such as those that immobilize the biomolecular probe to its solid support in a test site of a multisite array in the biosensor. The method of modulating the pH or ionic concentration as described herein can protect these surface chemistries, while affecting a pH/ionic concentration change in the environment of the biomolecular probe.
- Surface chemistry compatibility is an important consideration that should be noted when the methods described herein are practiced. pH change is caused by changes in hydrogen ion or hydroxyl ion concentrations. A variety of chemical reactions taken place at electrode-liquid, electrode-cross linker, cross linker-protein, and protein-protein interfaces as shown in
Fig 5 can also become a hindrance to pH changes happening near the solid surfaces to reach the proteins on top of them. They can simply act as diffusion barriers for the ions and hinder the pH changes around the biomolecular probes and analytes. These methods of modulating the pH or ionic concentration described herein helps in maximizing the changes in hydrogen or hydroxyl ion concentration so that they can overcome any diffusion barrier imposed by the surface chemistry. - Another important aspect is the buffering capacity of the solution in contact with the solid interface. The buffering effect can be large enough that the pH change at the interface would never reach the biomolecular probes that are immobilized away from it. The distance can vary based on the biomolecular interface layer deposited on top of the solid interface. Such biomolecular interface layer may have a thickness of 300 nm or less, preferable between 1-150 nm, even more preferably between 5-100 nm. As such the distance between the solid interface and the biomolecular probe within the biomolecular interface layer can range between 0.1-300nm. Use of buffer inhibitors in the solution or on the surface that extend the pH change on the electrode interface to reach the interacting probe-analyte pair may contribute to modulating the pH or ionic concentration in the vicinity of the biomolecular probe.
- Following are examples of methods for modulating the pH/ionic concentration at the solid-liquid interfaces, which are not comprised by the present invention. These include: 1) the electrochemical generation of ions at electrode surfaces by adding an electrochemically active species to the solution which generates ions of interest (e.g., H+, Mg+, OH-) upon electrochemical oxidation/reduction; 2) bringing enzymes close to the site of interest, which release such ions of interest from an enzyme substrate that is reacted with the enzyme; 3) the introduction of buffer inhibitors, for example, by mixing polymers that selectively reduce the diffusion rate of ions in the solution (e.g., phosphate).
U.S. Patent No. 7,948,015 describes the use of such inhibitors for applications in which measuring small local pH changes is of interest (e.g., in DNA sequencing). However in the methods of locally modulating the pH similar inhibitors can be used in order to extend the local pH changes further away from the electrode-liquid interface; and 4) the redistribution of preexisting ions near the electrode surface due to electrostatic forces. - Also provided is a method for modulating the pH or ionic concentration in a biosensor as described herein, which is not comprised by the present invention, wherein an electrochemically active agent is added to the aqueous solution at a test site in a multisite array, and wherein the test site has a biomolecular interface layer comprising a biomolecular probe or detection agent and oxidizing or reducing the electrochemically active agent. The electrochemically active agent may be added at a concentration of 1 nM to 100 mM, preferably at a concentration between 10 nM and 10 mM, more preferably at a concentration of 100 nM and 5 mM. The electrochemically active agent may be electro-oxidized or electro-reduced at an electrode potential in the range of -2V to +2V (vs. Ag/AgCl reference electrode). Preferably the electrode potential is in the range of -1V to +1V, even more preferably the electrode potential is in the range of -0.5V to +0.5V. The voltage required to drive the redox reaction can be used as a real time feedback method to monitor pH that is produced at the electrode surface.
- The device provided herein and used in a biosensor comprises such array of multiple test sites in solution in order to modulate the pH at each test site and to determine the presence and concentration of a biomolecular analyte of interest in a biological sample. In such use the device is in contact with an aqueous solution comprising a phosphate buffer, preferably a diluted phosphate buffer which preferably has a concentration of 0.1mM to 100mM. The pH of the diluted phosphate buffer can be between 5 and 8, preferably between 7 and 8, and more preferably between 7 and 7.5.
- Modulation of the pH or ionic concentration on a device in a biosensor described herein by electrochemical reaction at the one or more electrode may be carried out in a galvanostatic mode or potentiostatic mode. In addition, any type of electrical pulse may be applied on the electrodes of the device in the method for modulating the pH. Such pulse may be in the form of an annealing pulse and may vary by pulse frequency, pulse width, and pulse shape. In an annealing pulse a sufficient voltage is applied to change the pH to such that non-covently bound molecules from the biological sample are removed from the device in the biosensor. Such annealing pulse eliminates or reduces the need for washing the substrate following first contact with a sample in order to remove non-covalently bound material. Another advantage is that the annealing pulse may be more efficient to remove such non-covalently bound material from the device than a simple washing. A preferred pulse width for modulating the pH is in the range of 1 nanosecond to 60 minutes.
- The aqueous solution may further comprise one or more additional electrolytes, such as for example sodium sulfate, or any other suitable strong electrolyte. Preferably, the additional electrolyte is selected from sodium sulfate, sodium or potassium chloride, sodium or potassium bromide, sodium or potassium iodide, sodium or potassium perchlorate, sodium or potassium nitrate, tetraalkylammonium bromide and tetraalkylammonium iodide . Buffer-inhibitors may also be used in the aqueous solution. Suitable buffer inhibitors may be selected from poly(allylamine hydrochloride), poly (diallyldimethyl ammonium chloride), poly(vinylpyrroldone), poly(ethyleneimine), poly(vinylamine), poly(4-vinylpyridine) and tris(2-carboxyethyl)phosphine hydrochloride. When used in a method to modulate the pH such as described in
U.S. Patent No. 9,075,041 - Suitable electrochemically active agents include dopamine hydrochloride, ascorbic acid, phenol and derivatives, benzoquinones and derivatives, for example, 2,5-dihydroxy-1,4-benzoquinone, 2,3,5,6-tetrahydroxy-1,4-benzoquinone and 2,6-dichloroquinone-4-chloroimide; naphthoquinones and derivatives, for example, hydroxy-1,4-naphthoquinone, 5,8-dihydroxy-1,4-naphthoquinone, and
potassium 1,4-naphthoquinone-2-sulfonate; and 9,10-anthraquinone and derivatives, for example, sodium anthraquinone-2-carboxylate, potassium 9,10-anthraquinone-2,6-disulfonate. Preferably the concentration of the electrochemically active agent in the aqueous solution is from 1nM to 100mM. - Also provided is a method for modulating the pH or ionic concentration in a biosensor, wherein an enzyme is immobilized in a biomolecular interface layer also having one or more immobilized biomolecular probers. An enzyme substrate is then added to the aqueous solution at a test site in a multisite array, wherein the test site has the biomolecular interface layer and enzymatically oxidizing the enzyme substrate.
- Describes in also a method of modulating the pH using the device in a biosensor, which is not comprised by the present invention. The method of modulating the pH or ionic concentration in a biosensor comprises:
- a) providing a biosensor including one or more devices as described herein comprising a multisite array of test sites in which the conditions for interacting with a biomolecule analyte can be varied independently; and
- b) reacting at the one or more electrodes an electrochemically active agent in an aqueous solution to produce H+ ion or OH- ions.
- In the method the concentration of the electrochemically active agent in the aqueous solution is preferably from 1nM to 100mM.
- Also described is a method which is not comprised by the present invention and that comprises:
- a) providing a biosensor comprising an electromagnet in an aqueous solution and a biomolecular interface layer having one or more immobilized detection agents;
- b) adding one or more enzymes immobilized onto magnetic micro- or nano-particles to the aqueous solution;
- c) adding an enzyme substrate to the aqueous solution; and
- d) enzymatically oxidizing the enzyme substrate.
- Suitable enzymes for immobilization in the biomolecular interface layer or onto the magnetic micro- or nano-particles include for example oxidases, ureases, or dehydrogenases. Such immobilized oxidase is for example a glucose oxidase and the enzyme substrate is glucose. The amounts of immobilized enzyme and enzyme substrate added can be varied in the different test sites in each of the subsets of the multisite array so as to provide a pH or ionic concentration gradient in the such subset of the multisite array.
- Alternatively the enzyme is not immobilized onto a solid surface such as in the above methods being immobilized into a biomolecular interface layer or onto a magnetic micro- or nano-particle but is added to the aqueous solution in the test sites of subsets of a multisite array. Through electrolysis the enzyme undergoes a redox reaction at the electrode surface and perturbs the local pH.
- In each of these the pH or ionic concentration can be further modulated by adding a buffer inhibitor to the aqueous solution. Such addition of a buffer inhibitor either assists in diffusing the produced ions of interest to the location of the biomolecular probe or detection agent or inhibits the interaction of such produced ions with buffering salts. Alternatively, in the method of modulating the pH or ionic concentration in a biosensor as described herein, the buffer inhibitor is added to the aqueous solution of the test site of subsets of a multisite array in the absence of an electrochemical active agent or immobilized enzyme. The buffer inhibitor is added to the aqueous solution, and facilitates the diffusion of H+ ions or OH- ions that are produced at the electrodes in the test site or inhibits the interaction between H+ ions or OH- ions and buffering salts.
- Suitable buffer inhibitors include soluble polymers selected from poly(allylamine hydrochloride), poly (diallyldimethyl ammonium chloride), poly(vinylpyrrolidone), poly(ethyleneimine), poly(vinylamine), poly(4-vinylpyridine) and tris(2-carboxyethyl)phosphine hydrochloride. The amounts of buffer inhibitor added can be varied in the different test sites in each of the subsets of the multisite array so as to provide a pH or ionic concentration gradient in the such subset of the multisite array.
- When methods for modulating the pH in a biosensor having a multisite array of test sites are used in a biosensor the accuracy, reliability and reproducibility of the modulation of the pH at each test site is important. However the modulation of the pH at each test site may vary between subsequent uses. In order to accurately determine the amount of a biomolecular analyte of interest in a sample using the biosensor and method described above the pH at each test site needs to be accurately modulated or controlled. The device provided herein allows for accurate determination and control of the pH at each test site in such biosensor, the device comprising:
- (a) a support substrate supporting one or more electrodes; and
- (b) a biomolecular interface layer having immobilized pH sensitive Fluorescent Protein and one or more immobilized probes thereon.
- The immobilized pH sensitive fluorescent protein allows for sensing the pH at an electrode once the electrode (working electrode) causes modulation of the pH at a particular test site such as a test site in a multisite array. The fluorescence intensity of the fluorescent protein changes due to modulation of the pH. The change in fluorescence intensity of the fluorescent protein is proportional to the change in the pH (there is a linear relationship between the pH and the fluorescence intensity). Therefore, as is also shown in
Figure 10 , the pH value at each location at any time when the biosensor is in use can be readily obtained by correlating the fluorescence intensity of the fluorescent protein with the pH. An accurate calibration of the correlation between pH and fluorescence intensity may be carried out before or during use of the biosensor. When the calibration is carried out during use of the biosensor one or more test sites within a multisite array may be dedicated to calibration of the fluorescence intensity to pH correlation. When the pH is no longer modulated at such test site by the electrode (working electrode) the fluorescence intensity of the immobilized fluorescent protein reverts back to its intensity before a current was applied through the electrode. - Preferably, the immobilized fluorescent protein is selected from an immobilized green fluorescent protein, an immobilized yellow fluorescent protein, and an immobilized cyan fluorescent protein. The immobilized fluorescent protein is immobilized Green Fluorescent Protein (GFP). Alternatively immobilized pH sensitive dyes may be used on the support substrate instead of an immobilized pH sensitive fluorescent protein. Alternatively immobilized pH sensitive binding proteins may be used on the substrate instead of an immobilized pH sensitive fluorescent protein. Alternatively, a multisite array of test sites in a biosensor the immobilized fluorescent protein covers on the substrate an area that is also covered by an electrode and an area that is not covered with an electrode. The electrode covered by the immobilized fluorescent protein is either a working electrode or a counter electrode. Preferably, the immobilized fluorescent protein is applied onto the substrate as distinct spots, wherein each spot overlaps with only one test site and an area not covered by an electrode as shown in
Figure 12A . The presence of fluorescent protein on an area that is not covered by an electrode allows for the determination, within the biosensor, of fluorescence intensity when the pH is not modulated by the electrode. This fluorescence intensity can be used as a standard and control in determining whether, after ceasing modulation of the pH by an electrode the fluorescence intensity will revert back to its original intensity. Accordingly, in a method for detecting a biomolecular analyte in a biological using the device, the fluorescent protein not located on or near an electrode can be used as an internal reference for signal normalization. - The device includes one or more counter electrodes and one or more working electrodes. In the device one or more electrodes can be arranged in a multisite array, each site of the multisite array comprising a working electrode and/or counter electrode. The electrodes can be any electrode suitable in a biosensor for example indium tin oxide (ITO), gold, or silver electrodes. Preferably the electrodes in the device are indium tin oxide (ITO) electrodes. Alternatively the working electrode is an indium tin oxide electrode and the counter electrode(s) is selected from an indium oxide electrode, a gold electrode, a platinum electrode, a silver electrode, and a carbon electrode.
- The electrodes in the device may be used either for modulating the pH or as sensing electrodes or both. In the device or biosensor using the device, the one or more electrodes are connected to an electronic board via pogo-pins, a chip on foil via z-axis adhesive, or a chip on the substrate. The electronic board or chip are powered by a printed battery, a small battery bound to the substrate, a magnetically coupled power transfer using coils on the substrate, or a rf-coupled power transfer using coils on the substrate.
-
Figure 9 , shows a side view of a part of the device which includes a substrate (1) for example glass or plastic. One or more electrodes (2) are covered onto the substrate (1) which is also covered with a biomolecular interface layer (10). The biomolecular interface layer (10) comprises immobilized PEG (3), immobilized probe (4) and immobilized pH sensitive fluorescent protein in the form of Green Fluorescent Protein spots (5). The GFP spots (5) overlap with an electrode (2) and an area that is not covered by an electrode. The electrodes (2) and the GFP spots (5) are arranged in a multisite array so as to provide multiple test sites on the device. - The location of luminescence signals generated luminescent molecules can be controlled by directly controlling the location of the luminescent molecules themselves. This includes for example immobilizing the luminescent molecule. However, by incorporating the ability to control the pH of a solution near an electrode with pH sensitive luminescent molecules the location of luminescence signals generated by free floating luminescent molecules can also be controlled.
- Example instances of the present disclosure related to a system and method for detecting bubbles in an aqueous solution. The solution is placed onto a measurement area of a slide, the measurement area containing a plurality of electrodes configured to measure capacitance. According to example instances, the slide is configured to support measurements of at least one additional type of data in connection with an experiment involving a substance-of-interest contained in the solution. This allows the slide to be used for conventional testing purposes in addition to bubble detection. According to an example isntances one or more electrodes are configured for dual functioning so that the one or more electrodes help facilitate both the conventional testing function and the bubble detection.
- The slide may include a control unit that measures capacitance values associated with individual ones of the electrodes and/or pairs of the electrodes. The control unit captures the capacitance value(s) for subsequent processing and allows for capturing of bubble detection relevant data, obviating the need to manually check the slide for bubbles.
- According to example embodiments, the system and method include analyzing measured capacitances to identify a location of a bubble in the solution. In an example, bubbles are detected based on comparing the value of the capacitances to a threshold value or to other measured capacitances. This allows the location of the bubbles to be determined without user input.
- According to example embodiments, the system and method involve displaying bubble locations graphically, preferably as a three-dimensional graph. This allows a user to quickly determine where bubbles are located, without having to manually interpret the measured capacitance values. The user can then determine, based on the bubble indications, whether to keep or discard additional data that is being measured as part of the experiment. In an example, the additional data is automatically invalidated by a computer processor in response to bubble detection, to further reduce user burden.
- According to example embodiments, the system and method involve using the slide to adjust the pH level of the solution using at least some of the same electrodes that are used for measuring capacitance in connection with bubble detection. This allows for more efficient usage of the electrodes and provides an additional level of functionality to the slide.
- Example embodiments of the present invention relate to the detection of bubbles in glass slides, on which slides an aqueous solution is placed for analysis. However, the example embodiments may also be applied towards other applications in which it is desirable to detect the presence of bubbles. In particular, although the capacitance based detection techniques are described herein in connection with the capacitive properties of water, these techniques may also be applied to other liquids for which the capacitive properties are known.
-
Figure 14 shows anexample system 100 for detecting bubbles according to an example embodiment of the present invention. In the example shown inFigure 14 , thesystem 100 includes aslide 30 that includes anarea 10 in which a test solution containing a substance-of-interest is placed for analysis, acontrol unit 12 and apower source 14. Theslide 30 can be formed of any electrically insulating material. For example, glass would typically be used for this purpose and to serve as a substrate, on top of which thearea 10,control unit 12 andpower source 14 are formed. The glass can be formed, for example, of silicon dioxide (SiO2), possibly with additives. Alternatively, other types of silicate glasses may be used. - The
area 10 includes an array of electrodes used for bubble detection. At least some of the electrodes in thearea 10 are used for adjusting (also referred to herein as modulating) a pH level of the test solution. These pH modulating electrodes can be dedicated exclusively to adjusting the pH level or, alternatively, switched between pH modulating and bubble detecting modes of operation, as will subsequently be explained. (For example,U.S. Pat. App. Ser. No. 13/543,300 , mentioned earlier, describes the use of electrodes for pH modulation in a biosensor, which modulation can be performed using the electrodes discussed herein.) -
Figure 15 shows a top view of an example electrode array, in which a set of column electrodes X01 to X12 are arranged at regularly spaced distances from each other. A set of row electrodes Y01 to Y09 are also arranged at regularly spaced distances and are separated from the column electrodes X01 to X12, e.g., by an intervening layer of glass. Each electrode includes one ormore contact pads Figure 16 shows a close-up view of example square-shaped pads.Figure 17 shows an alternative in which the pads form an interdigitated structure, and are therefore frame-shaped. - In the example illustrated in
Figure 14 , thecontrol unit 12 is electrically connected to theelectrode array 10 and controls thearray 10 to perform bubble detection and pH modulation. Thecontrol unit 12 can be, for example, a microprocessor or an application specific integrated circuit (ASIC). In an example embodiment, thecontrol unit 12 is located on an electronic circuit board that is detachably connected to theslide 30, e.g., using pogo pins. Thecontrol unit 12 can be located within a packaged chip bonded directly to a rigid glass substrate, e.g., using a chip-on-glass process. In an alternative example embodiment, theslide 30 is formed of a flexible foil-type substrate and thecontrol unit 12 is glued to theslide 30 using a z-axis adhesive to form a chip-on-foil, in a manner similar to how chips are bonded in certain liquid crystal displays. Thecontrol unit 12 can include, for example, a non-transitory computer readable storage medium containing program code that implements the example bubble detection and pH modulation techniques described herein. In addition to bubble detection, thecontrol unit 12 can control the electrodes to perform other types of sensing or to control other sensing structures, as is known in the art of biosensors. - In an example embodiment, the
control unit 12 transmits control signals that cause input pulses to be applied at specified electrodes. Capacitance values can be measured at thecontrol unit 12 based on the responses of the electrodes to the input pulses. The measurement of capacitance is known in the art of touch screen displays, which utilize measurements of self-capacitance (e.g., a single electrode) or mutual capacitance (e.g., between two electrodes). To support bubble detection, thecontrol unit 12 has a capacitance detection range that is greater than that of typical control units that measure capacitance in life science experiments. Control signals can also be used to apply input pulses for pH modulation. Control signals for pH modulation can be initiated by thecontrol unit 12, e.g., in accordance with a predefined program sequence designed for pH modulation. Alternatively, the control signals for pH modulation is initiated externally, e.g., in response to a command from adata processing unit 50. In an example, thecontrol unit 12 includes hardware and/or software components that perform preliminary signal processing on the measured capacitance values, including converting the measurements from analog to digital format and/or filtering the measurements. In an example, the processed measurements are then output as raw data to thedata acquisition unit 40. - The
power source 14 provides power to thecontrol unit 12 and to theelectrode array 10. For example, thepower source 14 is a battery such as a coin-cell or a printed battery. Theslide 30 is designed for one-time use and is disposable, the battery therefore being provided with a small energy capacity, e.g., sufficient for a single measurement, and the battery can be permanently attached to the slide, e.g., bonded or glued to the glass surface. When theslide 30 is reusable, the battery can be rechargeable or user replaceable. Other forms of electric power delivery may alternatively be used. Electrical power is delivered wirelessly through magnetic coupling between an external power supply (e.g., the data acquisition unit 40) and one or more resonant coils in the slide. As an alternative to magnetic coupling, but also using wireless power transfer, the external power supply may couple to the resonant coil using radio-frequency (RF) signals. Theslide 30 receives power through a wired connection to thedata acquisition unit 40. - In an example, the
data acquisition unit 40 is a device that communicates with theslide 30 to receive the measured capacitance values from thecontrol unit 12, in the form of raw data. For example, in an example, thedata acquisition unit 40 includes a wiredcommunication interface 20 to a corresponding interface in theslide 30. The raw data is output from thecontrol unit 12 in parallel. For example, thecontrol unit 12 includes a plurality of output channels, with data from a single row or a single column being output on a corresponding channel. For example, theinterface 20 converts the parallel data into a format suitable for transmission to thedata processing unit 50. The conversion may involve parallel-to-serial conversion using a Universal Asynchronous Receiver/Transmitter (UART) or other conventional data conversion apparatus. Alternatively, theinterface 20 communicates wirelessly with theslide 30, e.g., using RF signals. - The
data processing unit 50 receives the raw data from anoutput interface 22 of thedata acquisition unit 40, e.g., from a transmitter portion of the UART. Theoutput interface 22 can be a wired, serial interface such as a Universal Serial Bus (USB) interface. Alternatively, theoutput interface 22 can be wireless, e.g., a Bluetooth or WiFi interface. In an example, the interface is a Bluetooth low energy (LE) interface. Thedata processing unit 50 can be, for example, a general purpose computer in the form of a desktop, a laptop or tablet, and includes, for example, a processor and a memory storing instructions for further processing of the raw data. For example, the further processing includes normalizing the raw data to a predefined scale and using the normalized data to generate output images, such as two or three-dimensional graphs, for display at thedisplay device 60. Where thedata processing unit 50 is a laptop or tablet, thedisplay device 60 can be integrated into a housing of thedata processing unit 50 as a single unit. Thedisplay device 60 may alternatively be externally connected, e.g., where thedata processing unit 50 is a desktop. The output images may be combined to form a video that shows changes in the data over time The output images, which represent the measured capacitance values, are displayed together with additional output images corresponding to other measured data. For example, the output images and the additional output images may be displayed in different portions of the same display screen or overlaid (superimposed) on the same portion of the display screen. - The
data processing unit 50 is also configured to issue commands to thecontrol unit 12 for pH modulation. The commands may be automatically generated, e.g., when a processor of thedata processing unit 50 determines that the pH level of the test solution should be adjusted. Alternatively or additionally, the commands may be user-initiated. - The
slide 30 may include a layered structure in which one or more electrode layers are located on top of a glass substrate. The layered structure can be formed, for example, using a lamination technique in which two or more layers are formed separately and then laminated together, e.g., using adhesive or bonding. Alternatively, the layered structure can be monolithically formed as a single unit, using techniques known in the art of semiconductor device fabrication. The layered structure may include one or more passivating layers formed, e.g., of SiO2 (also referred to as oxide). However, it will be understood that the composition and size of passivating layers can vary, e.g., from an atomic layer of SiO2 to several micrometers of SiO2 and formed using various techniques such as low pressure chemical vapor deposition (LPCVD) or plasma-enhanced chemical vapor deposition (PECVD). Silicon nitride (Si3N4) is another example passivating material. Where the layered structure is formed using lamination, the passivating layer can be formed as a thin film that is laminated. - The capacitance based bubble detection principles will now be described with reference to
Figure 18 to Figure 23 .Figure 18 shows a simplified electrical model of a slide including electrodes (ITOs 81 to 84) in an SiO2 layer 73. The ITOs 81 and 82 represent electrode pads in a first layer, e.g., row electrode pads. The ITOs 83 and 84 represent electrode pads in a second layer beneath the first layer, e.g., column electrode pads. The ITOs 81 to 84 are formed above aglass substrate 79, with anoptional ITO layer 89 that serves as a bottommost, passivating layer. For simplicity, the portion of the electrode array used for pH modulation is not shown. In this simplified model, the capacitance of the test solution is assumed to be equivalent to the capacitance of water (CW) since the test solution is, in practice, mostly water. When there is no bubble over the electrodes, the solution is in contact with the SiO2 layer 73 and contributes to a series capacitance betweenITOs - The pH modulating portion of the electrode array has been omitted for the sake of simplicity. One way to perform pH modulation is to separate the pads of adjacent electrodes so as to form channels that collect the test solution. The channels allow the test solution to come into contact with the electrodes, so that the pH level of the solution can be adjusted by sending a current between the adjacent electrodes. The electrodes may be formed of any suitable conductive material, but are preferably indium tin oxide (ITO) because ITO is transparent and relatively colorless, making it suitable for experiments that involve optical measurements. This allows the
entire measurement area 10 to be transparent. An oxide layer may be used as a passivating layer to cover the electrodes, similar to how the SiO2 layer 73 covers the electrodes inFigure 18 and Figure 19 . In fact, the same oxide layer may be used over the electrodes in both the bubble detecting and the pH modulation portions of the electrode array. Where the pH modulation is implemented using channels, the oxide layer does not completely fill the channels, but instead a lateral portion of the electrodes is left exposed to allow for contact with the test solution. -
Figure 19 shows additional details regarding the electrical model ofFigure 18 . InFigure 19 , the series capacitances are collectively represented as a mutual capacitance CL1,L1 betweenITOs ITOs control unit 12. The pads are less than 2 millimeters wide, preferably 1 millimeter or less. This is substantially smaller than the size of electrodes typically used for conventional touch-screen applications or conventional bio-sensor applications. -
Figure 20 is a simulated graph of self-capacitance along the x direction (from the top surface of the slide towards the glass substrate) when water covers a pad. The graph ofFigure 20 was generated based on a square pad ofsize 1 mm x 1 mm. As shown, the capacitance decreases continuously from a value of approximately 2 x 10-11 Farads at 10-6 meters down to approximately 7 x 10-14 Farads at 10-3 meters. -
Figure 21 is a simulated graph of self-capacitance along the x direction when a bubble having a diameter of 1 millimeter is present on a 1 mm x 1 mm pad. As shown, the capacitance values are substantially smaller than the corresponding capacitance values fromFigure 20 between 10-6 and 10-3 meters. Specifically, the capacitance starts at approximately 7.6 x 10⁻¹⁴ Farads and drops beginning around 3 x 10⁻⁵ meters to approximately 5 x 10-14 Farads. Therefore, the capacitance with water is several orders of magnitude greater for the majority of points between 10-6 and 10-3 meters. Accordingly, one way to detect bubbles is based on an evaluation of the value or the magnitude of a capacitance at any given pad, e.g., by comparing the value or magnitude to a predefined threshold value. A bubble would then correspond to a capacitance that is less than the threshold. Another way to detect bubbles is based on the percentage change in capacitance from water to a bubble. The simulated graph inFigure 22 , whose values were calculated using the values fromFigure 20 andFigure 21 , shows this difference. InFigure 22 , the percentage change is initially small, but starts to increase at around 10-5 meters. Therefore, detection may be based on the percentage change if the pads are suitably located, e.g., at a distance of 10-5 meters or more from the top surface of the slide. - In addition or as an alternative to evaluating the capacitance on an individual basis (e.g., for each pad when evaluating self-capacitance or for a pair of pads when evaluating mutual-capacitance), detection can be based on a comparison of capacitance values associated with a plurality of pads. For example, capacitance values from a group of neighboring pads are compared to determine whether any of the capacitance values is unusually small relative to the other capacitance values. This comparison is advantageous because it does not require the use of a threshold value, which may need to be adjusted based on the design of the slide, e.g., parameters such as pad size, shape or location.
-
Figure 23 is a graph showing actual test results from a prototype slide. The graph shows mutual capacitance values between a column electrode and a row electrode. A bubble was manually introduced at the intersection of these electrodes, beginning at around 50 seconds. The bubble was then removed and another bubble introduced at around 75 seconds. This process was repeated again, with another bubble at around 90 seconds. Each time a bubble was introduced, the capacitance dropped substantially. - Control units exist for acquiring capacitance measurements in connection with touch-screen applications. However, these control units are generally unsuitable for use with the bubble detection according to the example embodiments of the present invention. These conventional control units are unsuitable because they tend to have a narrower detection range and lower sensitivity than what is required for the example embodiments. In contrast, bubble detection according to the example embodiments requires the ability to capture large capacitance swings (e.g., a 400 pF change in going from water to bubble) in addition to a high resolution in order to capture the low capacitance values associated with bubbles. A typical capacitance value range for when a bubble exists could be between 20 fF to 40 µF. The large range is due to the fact that many choices are available as to the size of the electrodes and the thickness of the passivation layer on top of the electrodes (e.g., SiO2, TiO2, nitride, or no passivation layer at all).
-
Figure 24 is a flowchart of amethod 200 for detecting bubbles. Themethod 200 is performed using thesystem 100. - At
step 210, a capacitance (self or mutual) is measured at an electrode or between two electrodes to measure a capacitance value and the value is output as raw data. For example, the measurement is performed by outputting a control signal from thecontrol unit 12, which control signal results in the application of an input pulse to an electrode being measured. Thecontrol unit 12 senses the electrical response of the electrode, e.g., by measuring a voltage or a current across the electrode, or between the electrode and another electrode, and calculates the capacitance as a function of this response. The calculation of self and mutual capacitances is known in the art of touch screen displays. Each measured capacitance can be output as a raw data value to thedata processing unit 50 using thedata acquisition unit 40. -
Figure 25 is a simplified schematic of acircuit 201 for measuring capacitance provided in support of themethod 200. Thecircuit 201 includes adecoder 220, which may be included in thecontrol unit 12 ofFigure 14 . Thedecoder 220 is connected via a plurality of drivinglines 203, over which thedecoder 220 sends signals to activateswitches 240. Theswitches 240 may be implemented as thin-film transistors (TFTs) and are switched to connect torespective electrodes 242 that form the electrode array. Theswitches 240 are controlled by thedecoder 220 to perform the capacitance measurements, e.g., by driving aspecific line 203 simultaneously with anadjacent line 203. Theswitches 240 are further connected to sensinglines 205, which in this example, form the columns of the array. Eachsensing line 205 is connected to arespective amplifier 230. Theamplifiers 230 are in a negative feedback configuration with asensing line 205 and acapacitor 99 being connected to a negative amplifier input, which is also connected to ground via acurrent source 235. A positive input of eachamplifier 230 is connected toreference voltage 233, which may also be ground. The voltages on thesensing lines 205 are influenced by the capacitances at the electrodes, which capacitances depend on whether a bubble is present. Thus, the voltage outputs of theamplifiers 230 correspond to measured capacitances. - Returning to
Figure 24 , atstep 212, the measured capacitance is compared to a threshold value. As mentioned above, the threshold value may vary depending on factors such as pad size, shape or location. However, given the design specifications of the slide, and in view of the above discussion on the bubble detection principles, one of ordinary skill in the art would be able to compute a suitable threshold value. - Alternatively or additionally, at
step 214 the measured capacitance is compared to other measured capacitances, e.g., from a group of neighboring electrodes or the entire set of electrodes in the array, to detect unusually low capacitances. - At
step 216, the results of the comparisons are evaluated at thedata processing unit 60 to determine, based on the bubble detection principles described earlier, whether any bubbles exist, and if so, where the bubbles are located. - At
step 218, the results are output for display at thedisplay device 60. Raw data values are displayed in the form of a two-dimensional table. Each table entry corresponds to a measured capacitance value obtained from a corresponding electrode pad. The raw data may be displayed as a three-dimensional graph, e.g., a 3-D mesh where the x and y values correspond to electrode locations and the z values correspond to measured capacitance values. To facilitate visual recognition, the graph is color coded, e.g., using a gradient scheme, e.g., a gray scale scheme or a heat map in which the color gradually changes until a bubble location is reached, at which point the color is changed to a color that contrasts the color(s) of non-bubble locations. Color coding is used to show bubble locations on a two-dimensional graph in which the capacitance values are represented using changes in color. Alternatively or additionally to the display of raw data, thedata processing unit 60, according to an example embodiment, processes the raw data by normalizing it to a predefined scale. The above described graphs can be displayed alone or together with additional values from other parameters that are the subject of the experiment, e.g., pH value and flow rate. The additional values are displayed on the same graph, e.g., using a different color scheme and superimposed onto the capacitance values. - Advantageously, the graphical display of the capacitance values allows a user to quickly determine where bubbles are located, and to take appropriate corrective action in response to the presence of bubbles. The user may decide, for example, to keep those additional values (corresponding to one or more parameters being measured by the experiment) which are not associated with the locations of detected bubbles, while discarding values associated with bubble locations. Alternatively, the user may decide that the entire set of data should be discarded because there are too many bubbles, thus making the additional values unreliable as a whole.
- The capacitance values are superimposed onto additional measurement data, which additional data is stored in association with layout data representing the physical configuration of the measurement area. The layout data may be stored in an electronic file in the form of an image (e.g., a scanned image of the measurement area) or text (e.g., a configuration file for a microarray spotter used to fabricate the array, or a GenePix Array List (GAL) file). The additional measurement data may also be image or text (e.g., measured pH values stored in a GAL file or measured pH values rendered in grayscale on a scanned image of the measurement area).
- When the capacitance values are superimposed, a composite display may be generated in
step 218, which display shows a graphical representation of the array together with the capacitance values superimposed onto the additional measurement values at corresponding locations in the array. The superimposition can be rendered as text-on-text, text-on-image or image-on-image. An example of text-on-text is displaying a capacitance value in one half of an array location and additional measurement data in the other half. An example of text-on-image is displaying the capacitances using a heat map while representing the additional measurement data as numerical values on the heat map. An example of image-on-image is displaying the capacitances using a heat map while representing the additional measurement data using a 3-D mesh. Superimposed data may be stored in the electronic layout file, prior to or in conjunction with the superimposed display. - A processor on the slide or on an external computer is configured to automatically invalidate the additional measurement data (e.g., by replacing measurement values with null values) in response to detecting bubbles. For example, the processor on the slide may detect bubble locations and output an indication of where the bubbles are located to the external computer, which then performs the invalidating based on the indicated locations. This spares the user from having to manually review the capacitance values to decide whether to keep the additional measurement data.
- For example , bubble detection is combined with pH modulation.
Figure 26 is a flowchart of amethod 300 for pH modulation. Themethod 300 may be performed using thesystem 100. - At
step 310, a pair of electrodes that are not currently being used for bubble detection are switched to a pH modulation mode of operation by applying an input signal, e.g., a pulsed current between the electrodes. Preferably, the switches that control the mode of operation of the electrodes are implemented using TFTs, e.g., formed using amorphous silicon, polysilicon or indium gallium zinc oxide (IgZo). An advantage to using thin-film transistors is that the total capacitance of each electrode and its corresponding circuitry is reduced, thereby increasing the speed of measurement in addition to circumventing the need for thick oxides on the electrodes. - To perform bubble detection, an input pulse can be applied, for example, to a single electrode. The input pulse for bubble detection may, but need not be identical in shape, magnitude or duration to the input pulse used for pH modulation. Changes in capacitance between water contact and bubble contact are detected by observing the electric response of the same electrode or in the case of mutual capacitance, the response of another electrode.
- The input signal applied at
step 310 for pH modulation may be applied during a time in which the input pulse for the bubble detection is not being applied. As mentioned above, the input pulse for pH modulation is applied between a pair of electrodes. This produces a current that, through oxidation and reduction of buffer components (e.g., quinones), changes the pH level of a test solution situated between the electrodes. - At
step 312, the input signal is ended before the electrodes are to be used again for bubble detection. - At
step 314, the pH level of the test solution is measured to determine whether additional adjustment is required. Where the slide is configured for pH level measurement, the pH level can be calculated at thecontrol unit 12. Alternatively, the pH level can be measured using a separate testing device. - At
step 316, the input signal is reapplied by thecontrol unit 12 in response to determining that further adjustment of the pH level is required. Thecontrol unit 12 is configured to apply the input signal multiple times, as a plurality of pH modulating pulses, before determining whether further adjustment is required. The plurality of pH modulating pulses can be applied to the same pair of electrodes or to a different electrode pair. Similarly, the input signal may be reapplied atstep 316 to the same or a different pair of electrodes. For example, the pH modulating pulses may be applied to different electrode pairs in a sequential manner so that the entire electrode array is triggered over time to perform pH modulation. - The electrodes can be used to perform functions in addition to bubble detection and pH modulation. For example, electrodes can be used for temperature modulation. As another example, the capacitance measurements can be used to estimate the dielectric constant of the test solution, which dielectric constant is then correlated to a rate of cell growth or a rate with which the substance-on-interest binds to a biomolecule.
- The electrodes may be arranged in two layers (
Figure 18 and Figure 19 ). However, it will be understood that the number of layers can be more or less. In fact, a single layer may be sufficient for both pH modulation and bubble detection. Additionally, not every electrode layer needs to be used for pH modulation or bubble detection. Instead, further electrode layers can be used for other purposes, in accordance with the usage of electrodes in conventional biosensors. - Further described are glass slides with at least some of the processing of measurement data being performed on the slide itself or on a peripheral device connected to a body of the slide, rather than at an external computer responsible for displaying the processed data. Such slides are referred to herein as an instrument-on-glass.
Figure 27 to Figure 29 each show an example of an instrument-on-glass. -
Figure 27 shows aslide 400. Theslide 400 includes ameasurement area 405, apower source 410 and aprocessing circuit 420. Themeasurement area 405 may be formed of TFTs (for the switches) together with ITO (for the electrodes). Alternatively, themeasurement area 405 may be formed using only ITO or ITO in combination with other metals. Thepower source 410 is analogous to thepower source 14 inFigure 14 and may be a battery or a passive power source powered, e.g., using magnetic or RF coupling. - The
processing circuit 420 is analogous to thecontrol unit 12 inFigure 14 and may perform preliminary signal processing. Additionally, theprocessing circuit 420 may perform some of the functions described earlier with respect to the data processing unit 50 (e.g., normalizing or scaling capacitance values or controlling pH modulation). Theprocessing circuit 420 may include a processor (e.g., one or more CMOS chips) that processes the raw data obtained frommeasurement area 405. Theprocessing circuit 420 may further include a memory storing instructions or data, used by the processor to process the raw data. Theprocessing circuit 420 may be configured to arrange the raw data into a suitable format for output to an external computer, or to perform preliminary data analysis (e.g., bubble detection and invalidating data associated with bubbles). The processor may control the sensing operation of the measurement area 405 (e.g., driving and reading data out of the array), perform data compression, and perform wired or wireless transmission of the preliminarily processed data to an external computer. Post-processing and output of the data for display may be performed at the external computer. -
Figure 28 shows aslide 500. Thecomponents components Figure 27 . However, instead of being located on the body of theslide 500, thepower source 510 and theprocessing circuit 520 are externally connected, e.g., on aperipheral circuit board 515 that fits into a hardware interface of theslide 500. -
Figure 29 shows aslide 600. Thecomponents components Figure 27 . InFigure 29 , thepower source 610 and the processing circuit are externally connected, similar toFigure 28 . However, thecircuit board 615 includes a serial port connector for transmission of data and power between theboard 615 and the external computer. Specifically, the serial port may be used to transfer measurement data to the external computer, and to supply power for operating themeasurement area 605 or for recharging thepower source 610. - Also provided are one or more processors, which can be implemented using any conventional processing circuit and device or combination thereof, e.g., a Central Processing Unit (CPU) of a Personal Computer (PC) or other workstation processor, to execute code provided, e.g., on a non-transitory hardware computer-readable medium including any conventional memory device, to perform any of the methods described herein, alone or in combination, e.g., to output any one or more of the described graphical user interfaces. The memory device can include any conventional permanent and/or temporary memory circuits or combination thereof, a non-exhaustive list of which includes Random Access Memory (RAM), Read Only Memory (ROM), Compact Disks (CD), Digital Versatile Disk (DVD), flash memory, and magnetic tape.
- Also provided is a method for changing the pH of a solution by electronic control which is not comprised by the present invention and includes providing an amount of electric input to the solution using two or more electrodes to electrochemically generate and/or consume hydrogen ions in the solution. The generation and/or consumption of the hydrogen ions are achieved by an electrochemical reaction of one or more redox active species in the solution. Preferably, the one or more redox active species is selected from the following: quinones, catechols, aminophenols hydrazines, and derivatives thereof. More preferably, the one or more redox active species is a quinone (See Thomas Finley, "Quinones," Kirk-Othmer Encyclopedia of Chemical Technology, 1-35 (2005)). Even more preferably, the one or more redox active species is selected from the following: hydroquinone, benzoquinone, naphthoquinonenaphthoquinone. Most preferably, the one or more redox active species is a quinone derivative, further defined below.
- Preferably, the two or more electrodes comprise a sense electrode and a reference electrode (RE). The sense electrode can also function as a working electrode. The two or more electrodes can include a counter electrode and/or a working electrode. The two or more electrodes can each be independently made of metal oxide, gold, glassy carbon, graphene, silver, platinum, silver chloride, normal hydrogen, mercury drop, or saturated calomel. The solution can be buffered, unbuffered, aqueous, organic, or a mixture thereof. The amount of electric input can be provided by providing an amount of electric current. An electric source waveform can be selected based on the amount of electric input to be provided. Preferably, the electric source waveform is a galvanostatic waveform or a potentiostatic waveform. More preferably, the electric source waveform is selected from a predetermined map that maps electric input amounts to respective solution pH values.
- Also provided is a method for controlling the pH of a solution, which is not comprised by the present invention, using two or more electrodes includes obtaining the open circuit potential (OCP) of two or more electrodes in the solution while no electric input is being applied between the two or more electrodes, selecting an amount of electric input based on the OCP, and providing the amount of electric input to the solution between the two or more electrodes to change the pH of the solution. The OCP can be obtained by measuring the OCP of the two or more electrodes in the solution or calculated from a known or measured initial pH. The method can also include determining the pH of the solution based on the OCP of the two or more electrodes in solution. The method can also include selecting an electric source waveform based on the amount of electric input and the amount of electric input is provided according to the selected electric source waveform.
- The method can further include determining the pH of the solution based on a measured OCP of the two or more electrodes in the solution. The amount of electric input can be selected based on the determined pH.
- Also provided is a method for monitoring the pH of a solution using a sense electrode, a reference electrode, and a working electrode includes selecting a target open circuit potential (OCP), characterizing an OCP of the solution between the reference electrode and the sense electrode while no electric input is being applied to the working electrode, and iteratively performing the following steps: selecting an amount of electric input to be applied to the working electrode in order to minimize a difference between the OCP of the solution and the target OCP; and applying the amount of electric input to the working electrode to adjust the OCP of the solution.
- The target OCP can be a fixed value or a variable value. The target OCP can be a range with an upper bound and a lower bound or is a single value. Preferably, the target OCP is selected based on a target pH. Preferably, the target pH is user defined. The sense electrode can also function as the working electrode. The sense electrode and the working electrode can be distinct electrodes. Preferably, the distance between the sense electrode and the working electrode is 0 cm to 1cm. The electric input may be provided as an electric current or as an electric potential. Preferably, the amount of electric input is provided by applying an electric potential to the working electrode. More preferably, the electric potential is provided according to an electric source waveform. The electric source waveform is a galvanostatic waveform or a potentiostatic waveform. Even more preferably, the electric source waveform is selected from a predetermined map that maps electric input amounts to respective solution pH values. Preferably, the sense electrode is coated with a pH sensitive coating and the OCP of the sense electrode and the pH sensitive coating is dominated by the H+ ion concentration. The pH sensitive coating can be an organic material or an inorganic material. Preferably, the pH sensitive coating is made from a material that is selected from the group consisting of polyaniline, polypyrrole, and iridium oxide.
- These examples involve monitoring and/or characterizing electrochemical parameters and using a detected signal as a feedback control to generate a desired pH waveform for a specific length of time. All the described methods involve the use of a redox couple to release H+ ions, lowering pH, upon oxidation, and to consume H+ ions, increasing pH, upon reduction based on the formula:
RH2 ⇆ R + 2H+ + 2e-
- An example of a redox reaction is the reaction of quinone derivatives. There are many different derivatives of quinone, each with specific oxidative and reductive peaks and the redox reaction rate has been shown to be dependent on the pH of the solution. The electrochemical properties of the electrode, including the electron transfer coefficient and the open circuit potential (OCP) in relation to a reference electrode, are also important. The OCP has been previously demonstrated to be dependent on the pH of the solution.
- Also provided is a device for controlling the pH of a solution includes a controller, two or more electrodes, and a solution containing one or more redox active species. The device is configured to measure the OCP between the two or more electrodes in the solution to generate a measured OCP data and send the measured OCP data to the controller. The controller is configured to iteratively perform the following steps: select an amount of current or an electric source waveform based on a difference between the target OCP data and the measured OCP data, apply the selected amount of current to the solution by providing an electric current or an electric potential, according to the electric potential waveform, to one or more of the two or more electrodes, and send a request to the device for another measurement of the OCP.
- Preferably, the one or more redox active species in the solution generates and/or consumes hydrogen ions through an electrochemical reaction induced by the electric current or the electric potential applied to the solution. Preferably, the one or more redox active species is selected from the following: quinone, catechol, aminophenol, hydrazine, and derivatives thereof. More preferably, the one or more redox active species is a quinone. (See, Thomas Finley, "Quinones," Kirk-Othmer Encyclopedia of Chemical Technology, 1-35 (2005)). Even more preferably, the quinone is selected from the following: hydroquinone, benzoquinone, naphthoquinone, and derivatives thereof. Most preferably the one or more redox active species is a quinone derivative. The solution can be buffered, unbuffered aqueous, organic, or a mixture thereof. The electric source waveform can be a galvanostatic waveform or a potentiostatic waveform. Preferably, the electric source waveform is selected from a predetermined map that maps electric inputs to respective solution pH values. The two or more electrodes can be made of metal oxide, glassy carbon, graphene, gold, silver, or platinum. Preferably, the two or more electrodes include a reference electrode and a sense electrode. More preferably, the two or more electrodes further include a working electrode and/or a counter electrode. Each of the two of more electrodes is respectively made of metal oxide, gold, glassy carbon, graphene, silver, platinum, silver chloride, normal hydrogen, mercury drop, or saturated calomel. The sense electrode can also function as a working electrode. Preferably, the sense electrode is coated with a pH sensitive coating and the OCP of the sense electrode and the pH sensitive coating is dominated by the H+ ion concentration. The pH sensitive coating can be an organic or an inorganic material. Preferably, the pH sensitive coating is made from a material that is selected the group consisting of polyaniline, polypyrrole, and iridium oxide.
- Also provided are quinone derivatives that can be added to solutions and are suitable for electrochemical pH modulation in biological buffers, electrochemically active compositions comprising the quinone derivatives, methods of making the derivatives and/or compositions, which are not comprised by the present invention.
- The electrochemically active composition can comprise a quinone derivative, where the reactivity between a nucleophile and the quinone derivative is reduced compared to a reactivity between the nucleophile and an unsubstituted quinone from which the quinone derivative is derived, and the composition is configured such that the pH of the composition is electrochemically modulated via the quinone derivative. More preferably, the reactivity between the nucleophile and the quinone derivative is reduced by at least 50% compared to the reactivity between the nucleophile and the unsubstituted quinone from which the quinone derivative is derived. Preferably, the quinone derivative is defined by a chemical formula selected from the group consisting of:


- All of the R groups of the quinone derivative can be different from each other. Two or more of the R groups of the quinone derivative can be the same. Preferably, the composition is an aqueous solution. The composition can further comprise an additive selected from the group consisting of: an aqueous buffer, an organic solvent, an electrolyte, a buffer salt, a bioreagent, a biomolecule, a surfactant, a preservative, a cryoprotectant, and combinations thereof. Preferably the one or more nucleophiles are selected from the group consisting of: amines, thiols, amino acids, peptides, proteins, and combinations thereof. The reactivity between the nucleophile and the quinone derivative is reduced compared to the reactivity between the nucleophile and the unsubstituted quinone from which the quinone derivative is derived due to: (i) increased steric hindrance of a nucleophile binding site by one or more of the R groups; (ii) elimination of the nucleophile binding site by covalent bonding between the nucleophile binding site and one of the R groups. Preferably the reactivity between the nucleophile and the quinone derivative is reduced compared to the reactivity between the nucleophile and the unsubstituted quinone from which the quinone derivative is derived due both (i) and (ii).
- Also provided are methods comprising modifying a quinone having one or more R groups by substituting one or more of the R groups with a substituent to provide a quinone derivative, where the quinone derivative has a reduced reactivity with a nucleophile compared to a reactivity between the quinone and the nucleophile; and the substituent is independently selected from the group consisting of: H, CnH2n+1, Cl, F, I, Br, OM, NO2, OH, OCnH2n, OCnH2nOH, O(CnH2nO)yOH, O(CnH2nO)yOCnH2n+1, O(CnH2nO)yCOOH, O(CnH2nO)yCOOM, COOH, COOM, COOCnH2n+1, CONHCnH2n+1, CON(CnH2n+1)2, SO3H, SO3M, NH2, NHCnH2n+1, N(CnH2n+)2, NHCnH2nOH, NHCnH2nNH2, N(CnH2nOH)2, N(CnH2nNH)2, NHCOCnH2n+1, NCnH2n+1COCnH2n+1, NCnH2n+1COCnH2nOH, NCnH2n+1COCnH2nNH2, NCnH2n+1COCnH2nSH, SH, SCnH2n, SCnH2nOH, S(CnH2nO)yOH, S(CnH2nO)yOCnH2n+1, S(CnH2nO)yCOOH, S(CnH2nO)yCOOM, OCnH2nSH, O(CnH2nO)ySH, O(CnH2nO)ySCnH2n+1, CnH2n, CnH2nOCnH2n, CnH2nSCnH2n, CnH2nNHCnH2n, CnH2nN(CnH2n+1)CnH2n, CnH2n+1, CnH2n+1OH, CnH2n+1OCnH2n, CnH2n+1OCnH2nOH, CnH2n+1O(CnH2nO)yCOOH, CnH2n+1O(CnH2nO)yCOOM, CnH2n+1COOH, CnH2n+1COOM, CnH2n+1COOCnH2n+1, CnH2n+1CONHCnH2n+1, CnH2n+1CONH(CnH2n+1)2, CnH2n+1SO3H, CnH2n+1SO3M, CnH2n+1NH2, CnH2n+1NHCnH2n+1, CnH2n+1N(CnH2n+1)2, CnH2n+1NHCnH2nOH, CnH2n+1NHCnH2nNH2, CnH2n+1N(CnH2nOH)2, CnH2n+1N(CnH2nNH2)2, CnH2n+1NHCOCnH2n+1, CnH2n+1NCnH2n+1COCnH2nOH, CnH2n+1NCnH2n+1COCnH2nNH2, CnH2n+1NCnH2n+1COCnH2nSH, CnH2n+1SH, CnH2n+1SCnH2n, CnH2n+1SCnH2nOH, CnH2n+1S(CnH2n+1O)yOH, CnH2n+1S(CnH2nO)yOCnH2n+1, CnH2n+1S(CnH2nO)yCOOH, CnH2n+1S(CnH2nO)yCOOM, sugars, peptides, and amino acids; M is any metal cation or NH4 +; n is an integer from 1 to 109; and y is an integer from 1 to 109. The one or more R groups can be substituted with a polar. Preferably the polar group has atoms containing lone pair electrons. Preferably, the polar group is capable of forming hydrogen bonds with water. Preferably, the polar group contains at least one of oxygen, nitrogen, and sulfur atoms. More preferably, the polar group is selected from the group consisting of: OH, CH2OH, OCH3, COOH, SO3H, NH2, NH3Cl, ONa, a sugar, an amino acid, and a peptide.
- Also provided are methods of synthesizing substituted methyl quinone comprising: (i) a halide substitution step of reacting a starting material with a hydrogen halide in the presence of acetic acid and an aldehyde; (ii) reacting a material produced by step (i) with a nucleophile of structure R-X; (iii) reacting a material produced by step (ii) with an oxidizing agent; and (iv) reacting a material produced by step (iii) with a reducing agent, where R is selected from the group consisting of: H, CnH2n+1, Cl, F, I, Br, OM, NO2, OH, OCnH2n, OCnH2nOH, O(CnH2nO)yOH, O(CnH2nO)yOCnH2n+1, O(CnH2nO)yCOOH, O(CnH2nO)yCOOM, COOH, COOM, COOCnH2n+1, CONHCnH2n+1, CON(CnH2n+1)2, SO3H, SO3M, NH2, NHCnH2n+1, N(CnH2n+1)2, NHCnH2nOH, NHCnH2nNH2, N(CnH2nOH)2, N(CnH2nNH)2, NHCOCnH2n+1, NCnH2n+1COCnH2n+1, NCnH2n+1COCnH2nOH, NCnH2n+1COCnH2nNH2, NCnH2n+1COCnH2nSH, SH, SCnH2n, SCnH2nOH, S(CnH2nO)yOH, S(CnH2nO)yOCnH2n+1, S(CnH2nO)yCOOH, S(CnH2nO)yCOOM, OCnH2nSH, O(CnH2nO)ySH, O(CnH2nO)ySCnH2n+1, CnH2n, CnH2nOCnH2n, CnH2nSCnH2n, CnH2nNHCnH2n, CnH2nN(CnH2n+1)CnH2n, CnH2n+1, CnH2n+1OH, CnH2n+1OCnH2n, CnH2n+1OCnH2nOH, CnH2n+1O(CnH2nO)yCOOH, CnH2n+1O(CnH2nO)yCOOM, CnH2n+1COOH, CnH2n+1COOM, CnH2n+1COOCnH2n+1, CnH2n+1CONHCnH2n+1, CnH2n+1CONH(CnH2n+1)2, CnH2n+1SO3H, CnH2n+1SO3M, CnH2n+1NH2, CnH2n+1NHCnH2n+1, CnH2n+1N(CnH2n+1)2, CnH2n+1NHCnH2nOH, CnH2n+1NHCnH2nNH2, CnH2n+1N(CnH2nOH)2, CnH2n+1N(CnH2nNH2)2, CnH2n+1NHCOCnH2n+1, CnH2n+1NCnH2n+1COCnH2nOH, CnH2n+1NCnH2n+1COCnH2nNH2, CnH2n+1NCnH2n+1COCnH2nSH, CnH2n+1SH, CnH2n+1SCnH2n, CnH2n+1SCnH2nOH, CnH2n+1S(CnH2n+1O)yOH, CnH2n+1S(CnH2nO)yOCnH2n+1, CnH2n+1S(CnH2nO)yCOOH, CnH2n+1S(CnH2nO)yCOOM, sugars, peptides, and amino acids; M is any metal cation or NH4 +; n is an integer from 1 to 109; y is an integer from 1 to 109; and X is either OH, NH2, NHR, SH, O-, or S-.
- The starting material can be dialkoxybenzene and the result of the halide substitution step is an ortho-quinon, para-quinone, or a combination thereof. Preferably, the number of halide groups per molecule of the ortho-quinone or para-quinone is 1, 2, 3, or 4. The starting material can be dialkoxynaphthalene and the result of the halide substitution step is an ortho-naphthoquinone, para-naphthoquinone, or a combination thereof. Preferably, the number of halide groups per molecule of the ortho-naphthoquinone or para-naphthoquinone is 1 or 2. Preferably, the hydrogen halide is selected from the group consisting of: HCl, HBr, HI, and combinations thereof. Preferably, the oxidizing agent is selected from the group consisting of: cerium ammonium nitrate, iodine, hydrogen peroxide, hypervalent iodine, iodobenzene diacetate, bromine compounds, and combinations thereof. Preferably, the reducing agent is selected from the group consisting of: sodium borohydrate, potassium borohydrate, sodium hydrosulfite, trichlorosilane, and combinations thereof.
- Also provided are methods, which are not comprised by the present invention, comprising: providing a biosensor comprising a support in an solution, the support comprising one or more electrodes and a biomolecule interface layer having one or more immobilized probes thereon, and the solution comprising a quinone derivative; adding a biomolecule analyte to the solution; electrochemically reacting the quinone derivative using the one or more electrodes to produce an amount of H+ ions and/or an amount of OH- ions, wherein the pH of the solution close to the one or more electrodes is controlled by the amount of H+ ions and/or the amount of OH- ions produced; collecting signals from the biosensor, where a reactivity between a nucleophile and the quinone derivative is reduced compared to a reactivity between the nucleophile and an unsubstituted quinone from which the quinone derivative is derived
- Preferably, the pH of the solution before electrochemically reacting the quinone derivative using the one or more electrodes is 1 to 14. Preferably, the pH of the solution after electrochemically reacting the quinone derivative using the one or more electrodes is 1 to 14. Preferably, the solution contains one or more nucleophiles. Preferably, the one or more nucleophiles are selected from the group consisting of: amines, thiols, amino acids, peptides, proteins, and combinations thereof. The solution can contain a reduced quinone derivative and electrochemically reacting the quinone derivative results in an electrochemical oxidation reaction of the reduced quinone derivative to make the pH of the solution more acidic. Preferably, the concentration of the reduced quinone derivative is 0 to 1M. The solution can contain an oxidized quinone derivative and electrochemically reacting the quinone derivative results in an electrochemical reduction reaction of the oxidized quinone derivative to make the pH of the solution more basic. Preferably, the concentration of the oxidized quinone derivative is 0 to 1M. Preferably, the solution contains one or more buffer components provided in a concentration that is 0 to 1M. Preferably, the one or more buffer components are selected from the group consisting of: organic solvents, electrolytes, bioreagents, biomolecules, surfactants, and combinations thereof. The method can further comprise measuring the pH of the solution. Preferably, the pH is measured continuously. Preferably, the quinone derivative is electrochemically reacted by providing an amount of electric current. Preferably, the pH is measured before providing the amount of electric current. Preferably, the amount of electric current is selected based on the measured pH.
- Quinones are herein defined as unsubstituted quinones. For example, the chemical structures I - XII would represent quinones if all of the R groups were hydrogen. Quinone derivatives are herein defined as compounds that are structurally similar to quinones except that at least one hydrogen is replaced by a substituent. In cases where more than one hydrogen is replaced by a substituent, the identity of the substituents may be independently selected but are not required to be unique. Compared to their unsubstituted counterparts the instant quinone derivatives have reduced reactivity with nucleophiles and the pH of the biological buffer containing the quinone derivatives is able to be electrochemically modulated.
- Also provided are methods for controlling a pH of a solution using two or more electrodes, which are not comprised by the present invention, the methods comprising measuring an open circuit potential (OCP) of the two or more electrodes in the solution while no current is being applied between the two or more electrodes, selecting an amount of current based on the measured OCP, and providing the selected amount of current to the solution, thereby changing the pH of the solution by at least one electrochemically generating or consuming hydrogen ions. Preferably, generation and/or consumption of the hydrogen ions are achieved by an electrochemical reaction of one or more redox active species in the solution. Preferably, the one or more redox active species is selected from the group consisting of: quinones, catechols, aminophenols, hydrazines, derivatives thereof, and combinations thereof. Preferably, the one or more redox active species is a quinone selected from the following: hydroquinone, benzoquinone, naphthaquinone, derivatives thereof, and combinations thereof. Preferably, the two or more electrodes comprise a sense electrode and a reference electrode. The sense electrode can be configured to also function as a working electrode. Preferably, the two or more electrodes also comprise a counter electrode and/or a working electrode. Preferably, the two or more electrodes are each independently made of a material selected from the group consisting of: metal oxide, gold, glassy carbon, graphene, silver, platinum, silver chloride, normal hydrogen, mercury drop, saturated calomel, and combinations thereof. Preferably, the solution is buffered, unbuffered, aqueous, organic, or a mixture thereof. Preferably, the method further comprises determining the pH of the solution based on the measured OCP of the two or more electrodes in the solution. Preferably, selection of an electrical waveform is based on the determined pH. Preferably, the method further comprises selecting an electrical waveform and providing the electrical waveform to the solution. The electrical waveform is either a galvanostatic waveform or a potentiostatic waveform. Preferably, the electrical waveform is selected from a predetermined map that maps respective current amounts to respective electrical waveforms.
- Also provided is a biosensor system comprising a support that includes an a sense electrode, a reference electrode, and a working electrode; an electrochemically active agent, which is not comprised by the present invention, wherein the biosensor is configured to control a change of a redox state of the electrochemically active agent, and the biosensor is configured to iteratively perform the following: selecting an amount of current to be applied to the working electrode in order to minimize a difference between the OCP of the solution and the target OCP; applying the selected amount of current to the working electrode to adjust the OCP of the solution; and measuring the OCP of the solution. Preferably, the solution is an aqueous solution. The sense electrode can also function as the working electrode. The sense electrode and the working electrode can be distinct electrodes and a distance between the sense electrode and the working electrode is 0 cm to 1cm. Preferably, the amount of current applied to the working electrode is provided by applying an electrical waveform. The electrical waveform is a galvanostatic waveform or a potentiostatic waveform. Preferably, the electrical waveform is selected from a predetermined map that maps respective current amounts to respective electrical waveforms. Preferably, the sense electrode is coated with a pH sensitive coating. The pH sensitive coating is an organic material or an inorganic material. Preferably, the pH sensitive coating is made from a material selected from the group consisting of: polyaniline, polypyrrole, iridium oxide, and a combination thereof.
- Also provided are methods for monitoring pH of a solution using a sense electrode, a reference electrode, and a working electrode, which are not comprised by the present invention, the methods comprising selecting a target open circuit potential (OCP) based on a target pH for the solution; characterizing an OCP of the solution between the reference electrode and the sense electrode while no current is being applied to the working electrode; and iteratively performing the following: selecting an amount of current to be applied to the working electrode in order to minimize a difference between the OCP of the solution and the target OCP; applying the selected amount of current to the working electrode to adjust the OCP of the solution; and measuring the OCP of the solution. Preferably, the solution is an aqueous solution. Preferably, the target pH is set by incorporating an electro-chemical delta-sigma-modulator. More preferably, the output-signal of the electro-chemical delta-sigma-modulator is digitally filtered to get a digital representation of the charge needed to create the target pH. Preferably, the target OCP is a range with an upper bound and a lower bound. More preferably, the target pH is a single target value. The sense electrode can also function as the working electrode. The sense electrode and the working electrode can be distinct electrodes and a distance between the sense electrode and the working electrode is 0 cm to 1cm. Preferably, the amount of current applied to the working electrode is provided by applying an electrical waveform. The electrical waveform is a galvanostatic waveform or a potentiostatic waveform. Preferably, the electrical waveform is selected from a predetermined map that maps respective current amounts to respective electrical waveforms. Preferably, the sense electrode is coated with a pH sensitive coating. The pH sensitive coating is an organic material or an inorganic material. Preferably, the pH sensitive coating is made from a material selected from the group consisting of: polyaniline, polypyrrole, iridium oxide, and combinations thereof.
- Also provided is a device for controlling a pH of a solution, which is not comprised by the present invention, comprising: a controller; two or more electrodes; and a solution containing one or more redox active species, wherein the device is configured to iteratively perform the following: measure an open circuit potential (OCP) between the two or more electrodes in the solution to generate a measured OCP data; select, using the controller, an amount of current or an electric potential waveform based on a difference between target OCP data and the measured OCP data; and apply, using the controller, the selected amount of current or the selected electric potential waveform to the solution via one or more of the two or more electrodes. Preferably, the solution is an aqueous solution. Preferably, the one or more redox active species generates or consumes hydrogen ions through an electrochemical reaction induced by the electric current or the electric potential applied to the solution. Preferably, the one or more redox active species is selected from the following: quinones, catechols, aminophenols hydrazines, derivatives thereof, and combinations thereof. Preferably, the one or more redox active species is a quinone selected from the following: hydroquinone, benzoquinone, naphthaquinone, derivatives thereof, and combinations thereof. Preferably, the solution is buffered, unbuffered aqueous, organic, or a mixture thereof. Preferably, the electric potential waveform is a galvanostatic waveform or a potentiostatic waveform. More preferably, the electric potential waveform is selected from a predetermined map that maps respective current amounts to respective electric potential waveforms. Preferably, the two or more electrodes comprise two or more of a reference electrode, working electrode, counter electrode, or sense electrode that is made of a material independently selected from the group consisting of: metal oxide, gold, glassy carbon, graphene, silver, platinum, silver chloride, normal hydrogen, mercury drop, saturated calomel, and combinations thereof. The sense electrode can also function as a working electrode. Preferably, the sense electrode is coated with a pH sensitive coating. The pH sensitive coating is an organic material or an inorganic material. Preferably, the pH sensitive coating is made from a material selected from the group consisting of: polyaniline, polypyrrole, iridium oxide, and combinations thereof.
- A drawing of a system having electrochemically active agent in solution is presented in
Figure 30 . In previously described systems, the electrochemically active agent was attached to the electrode surface and not in solution. As shown inFigure 30 , the system provides an anode electrode and an electrochemically active agent in solution. Applying a current to the electrode induces the electrochemically active agent to undergo an electrochemical redox reaction which makes the pH of the solution near the electrode more acidic. Having the electrochemically active agent in solution rather than attached to the electrode surface has many advantages. For example, a more significant change can be inflicted on the surrounding environment if the amount of electrochemically active agent is not limited by the density of the surface layer, thereby increasing capacity of the device; fresh electrochemically active agent can be supplied to the electrode surface via diffusion from bulk solution, thereby allowing for cycling capability; and universal electrochemistry can be applied to all types of electrodes, which will not interfere with other surface chemistries such as attachment of anti-fouling reagents or biomolecules. Furthermore, in order to make use of quinones as electrochemically active agents for pH generation in biological solutions, the structure of the quinones were modified to satisfy the requirements for use in biological solutions. In order to be useful for pH modulation in biological buffers, a molecule should satisfy the following requirements: release or consume protons through electrochemical reaction upon electronic stimulation, sufficient water solubility, reduction and oxidation potential should be lower than the potential of water hydrolysis or other redox active species within the solution, stability in solution in the absence of electronic stimulation (i.e., no autooxidation/reduction), low reactivity towards nucleophiles, compatibility with biological samples (for example: proteins, peptides, cells, DNA, and enzymes). -
Figure 31 shows quinone derivatives that can be used for pH modulation in aqueous solutions. - The following are examples which illustrate specific methods without the intention to be limiting in any manner. The examples may be modified within the scope of the description as would be understood from the prevailing knowledge.
- Electrode material used: The electrode material was indium tin oxide. This is a semiconducting electrode surface with very large potential window in an aqueous solution.
- Electro-oxidation of species to produce H + ions. Oxidation of ascorbic acid at the electrode surfaces produced H+ ions and changed the electrode surface pH to a more acidic state:
AH2 → A + 2H+ + 2e-,
where AH2 is ascorbic acid (C6H6O6) (as shown inFigure 5 ). The electrode potential at which it oxidizes was less than 0.5V for Indium tin oxide material vs Ag/AgCl reference electrode (as shown inFigure 7 ). This potential was less than the voltages needed for the oxygen evolution reaction in aqueous solution. Higher electrode potential (e.g > IV for ITO electrodes in just phosphate buffer) can damage the PEG layer (as shown inFigure 8 ). The ascorbic acid also acted as a sacrificial species to prevent electrochemical degradation of the surface chemistry. - Electro-reduction of species to produce OH- ions. Reduction of benzoquinone (C6H4O2) into Hydroquinone (C6H6O2) can produce OH- ions at -0.1V:
BQ + 2e- + 2H2O → HQ + 2OH-
This reduction reaction increased the pH at the electrode interface. - In the above examples the amount of H+ or OH- ions generated will depend on the concentration of species present in solution (nM-mM range), potential applied (-2V to +2V), type of waveform (pulse, constant, sawtooth, sinusoidal, square wave at different frequencies and duty cycles), and diffusion of the species (can be varied due to additives in the solution). These parameters can be optimized to get different pHs at the each of the electrode element present in the multisite biosensor.
- Enzymes such as oxidases, ureases or dehydrogenases have been known to consume or generate hydrogen during the reaction. For example:
β-d-glucose + O2 → d-glucose-δ-lactone + H2O2
d-glitcose-δ-lactone + H2O → d-gluconate + H +
Oxidation of glucose in the presence of glucose oxidase can produce H+ ions that are used to change the pH near the proteins of interest. - The enzymes when co-immobilized on the surface along with proteins brings them in close proximity so the H+ produced by the enzymatic reaction will lead to a localized pH change that can affect protein binding (for example antigen-antibody binding and non-specific binding).
- Proteins are attached to micro/nanocavities of a solid surface on an electromagnet. The enzymes are separately attached to magnetic micro/nanoparticles in the solution. Controlling the electromagnet that is fabricated/placed underneath controls the local pH values. Then the enzymatic reaction is triggered by introducing the corresponding enzyme substrate (as shown in
Figure 6 ). Alternatively electrochemically active enzymes are used. The pH change is localized on the cavities and the protein interactions are modulated. - Electrode material used: The electrode material was indium tin oxide. The fluorescent protein used is GFP immobilized on a glass substrate which includes an array of electrodes. The GFP is applied as spots, each spot covers an area that overlaps with one electrode and an area that is not overlapping with an electrode.
- The pH change at the surface of ITO working electrode is generated via current-driven oxidation of a redox active molecule, 2-methyl-1,4-dihydroquinone, in diluted phosphate buffer (pH = 7.4) containing 0.1M Na2SO4. After 10 seconds of induction, current (50 microamps) was applied for 30 second, which resulted in a drop of solution pH to 5.5, as was observed by a change in GFP fluorescence intensity.
Figure 10 is used as calibration curve to assess the pH values. After current was turned off, the pH recovered to neutral value within 50 seconds (as shown inFigures 11 and12B ). - Para-benzoquinones and ortho-benzoquinones (compounds 2, 4, 6, and 9 in
Figure 31 ) are susceptible to nucleophilic attack at the double bond of the ring (positions structure 2 ofFigure 31 ,positions structure 4 ofFigure 31 , andpositions structure 6 ofFigure 31 ). Introducing substituents at some or all of those positions can mitigate the problem of nucleophilic attack. For example, 1,4-benzoquinone (structure 2 inFigure 31 , where R1, R2, R3 and R4 are H) undergoes Michael addition reaction with amino groups of proteins (Loomis et al., Phytochemistry, 5, 423, (1966) andUS6753312 B2 ). On the other hand, 2,5-disubstituted 1,4-benzoquinones (structure 2 inFigure 30 , where R1 and R3 are H, and R2 and R4 are groups other than H) do not show susceptibility to Michael addition reaction in the presence of proteins and are more suitable for use in biological buffers.Figure 32 demonstrates the effect of substitution on protein stability in the presence of benzoquinones. Fluorescence intensity of Green Fluorescent Protein (GFP) was measured after incubation with three different benzoquinones in phosphate buffered saline for 30 min (concentration of benzoquinones was 0.5mM). The difference in fluorescence intensity indicates the varied effect that the different substitutions in benzoquinones have on the stability of GFP. Fluorescence intensity of GFP is indicative of its structural integrity. Losses in fluorescence intensity usually indicate loss of its tertiary structure (protein denaturation) (Yin D. X., Zhu L., Schimke R. T. Anal. Biochem. 1996, 235:195-201). As shown inFigure 32 , GFP retains 100% of its fluorescence intensity after incubation with di-substituted benzoquinone for 30 min, while incubation with unsubstituted benzoquinone and mono-substituted benzoquinone causes 25% and 7% loss in fluorescence intensity, respectively. - Water solubility of aromatic compounds can be improved by introducing charged groups or atoms with lone pair electrons that can participate in hydrogen bonding. Such groups are, for example, - OH, - CH2OH, - OCH3, - COOH, - SO3H, - NH2, - NH3Cl, - ONa. Sugars, amino acids, and peptides can also improve water solubility of quinones. Synthetic macromolecules such as polyethyleneglycoles can be used as substituents as well.
- Reduction/oxidation potential of quinones can be tuned to fit the needs of specific application. By introducing electron-donating groups (such as alkyl, hydroxyl, alkoxy, methoxymethyl, morpholinomethyl, amino and chloro substituents) redox potential can be pushed towards higher voltage. Conversely, electron-withdrawing groups (such as nirto, cyano, carboxylic acid or carboxylic ester groups) will push redox potential towards lower voltage.
- The mechanism of oxidation of hydroquinones in aqueous solutions can involve two steps: transfer of electrons and transfer of protons. Introducing electron-withdrawing or electron-donating substituents addresses the first step of the process. Oxidation potential of hydroquinones can also be lowered by introducing substituents that are capable of forming intramolecular hydrogen bonds with hydroxyl groups of hydroquinone. Such hydrogen bonding weakens the bond between hydrogen and oxygen of hydroxyl group, therefore lowering an overall energy barrier for oxidation reaction. Examples of such R groups are CH2OH, CH2OCH3, morpholinomethyl, and COOCH3.
- Having the ability to select molecules which undergo electrochemical transformation through the same mechanism, but at different potentials enables one to accommodate different pH conditions and avoid undesirable electrochemical reactions involving other redox active components in the system. For example, for applications involving DNA synthesis, it is important to keep the voltage below the reduction potentials of pyrimidine bases, nucleosides, and nucleotides (1V vs. NHE in aqueous solution pH ∼8) (Steenken, S. J Am Chem Soc, 1992, 114: 4701-09).
- Autooxidation of hydroquinones is another issue. In order to avoid oxidation, a quinone derivative with high enough electrochemical oxidation potential that is resistant to spontaneous chemical oxidation by molecular oxygen can be used.
- Conversely, benzoquinones with low enough reduction potentials should be chosen for systems where reducing agents, like mercaptoethanol, glutathione, and dithiothreitol are present in solution. Examples of such applications are DNA synthesis, electrophoresis, and immunoassays.
- The redox potential of quinones is affected by the pH of the solution. It is easier to oxidize hydroquinones in more basic pH, whereas more acidic pH will require higher oxidation potentials. This, in turn, affects stability of hydroquinones towards autooxidation by oxygen in air. Therefore, if one needs to work in basic pH, using a quinone with higher oxidation potential will improve the stability of electrochemical system.
Figure 33 shows that there are different oxidation potentials for different substituents in quinones (Fig. 33A-D ), and therefore, the oxidations potential can be tuned by varying the substituents in quinones. -
Scheme 1 shown inFigure 34 is a representation of a synthesis of substituted quinone. -

- Sodium dithionate (18.7g, 107.3 mmol, 7.3 equiv) was dissolved in 20 mL H2O and loaded into a separatory funnel. Next, a solution of benzoquinone (2 g, 14.7 mmol, 1 equiv) in 75 mL diethyl ether was added. The diphasic mix was stirred vigorously for 30 minutes and the organic layer changed color from orange to pale yellow. Organic phase was washed with brine, dried over MgSO4, and concentrated to yield a white solid (1.69 g, 83%).
-

- Paraformaldehyde (Aldrich, 4.27 g, 144.75 mmol) and HBr/AcOH (Fluka, 33%, 30 mL) were added slowly to a stirred solution of 1,4-dimethoxybenzene (Aldrich, 10.00 g, 72.37 mmol) in glacial acetic acid (Fisher, 50 mL). The mixture was stirred at 50°C for one hour, allowed to cool to room temperature, and then hydrolyzed in water (200 mL). The white solid was collected by filtration, suspended in CHCl3 (50 mL), and refluxed for 10 min. After cooling to room temperature, the white solid was again collected by filtration and washed with water (15.75 g, 67%). NMR spectra were obtained experimentally to confirm the chemical structure of the resulting compound and its purity. NMR results were as follows: 1H NMR (300 MHz, CDCl3) δ: 6.88 (s, 2H), 4.54 (s, 4H), 3.87 (s, 6H) ppm.
-

- A dry round bottom flask was charged with 2,5-dibromomethyl-1,4-dimethoxybenzene (3g, 9.26 mmol, 1.0 equiv), anhydrous K2CO3 (25.6 g, 185 mmol, 20 equiv), and dry methanol (200 mL). The reaction mixture was heated to reflux for 30 min, then cooled to ambient temperature, filtered, and concentrated to a crude white solid. The solid was resuspended in water and extracted with ethyl acetate, dried over MgSO4, and concentrated. The residue was recrystallized in hexanes as a pale yellow powder (1.2 g, 57%). Retention factor (Rf) (50% EtOAc/hexanes) = 0.65.
-

- A solution of 1,4-dimethoxy-2,5-dimethoxymethylbenzene (1.2 g, 5.24 mmol, 1.0 equiv) in acetonitrile (0.1 M, 52 mL) was treated with a solution of cerium ammonium nitrate (5.8 g, 10.6 mmol, 2.02 equiv) in water (8 mL). The reaction mixture was stirred under argon at ambient temperature for 30 minutes, then diluted with water, and extracted with dichloromethane. The combined organic layers were washed with water, dried over Na2SO4, and concentrated to an orange solid. The crude mix was purified by column chromatography on deactivated silica gel (0-5% ethyl acetate/hexanes) to yield yellow crystals (300 mg, 67%). Rf (50% EtOAc/hexanes) = 0.7; 1H NMR (300 MHz, CDCl3) δ: ppm; UV-Vis = 268 nm.
-

- The benzoquinone obtained according to the reaction of Example 13 (200 mg, 1.02 mmol, 1.0 equiv) in 2.5 mL EtOAc was treated with a solution of sodium dithionate (1.3 g, 7.44 mmol, 7.3 equiv) in 2 mL H2O. The diphasic mix was stirred vigorously for 30 minutes and the solution changed colors from bright to pale yellow. The mixture was diluted with water, extracted with ethyl acetate, dried over MgSO4, and concentrated to a white powder (96 mg, 48%).
-

- A dry round bottom flask was charged with 2,5-dibromomethyl-1,4-dimethoxybenzene (5g, 15.4 mmol, 1.0 equiv) and NaOH (77 mL of 1.0 M solution, 77 mmol, 5.0 equiv), 12 mL H2O, and 38 mL THF. The reaction mixture was sealed and heated to 80°C for 6 h. After cooling, the reaction mixture was concentrated by rotary evaporation to a crude solid that was recrystallized in hexanes to a white powder (3 g, 60%). Rf (80% EtOAc/hexanes) = 0.2.
-

- A solution of 1,4-dimethoxy-2,5-dihydroxymethylbenzene (1.0 g, 5.04 mmol, 1.0 equiv) in acetonitrile (0.2 M, 25 mL) was treated with a solution of cerium ammonium nitrate (5.5 g, 10.1 mmol, 2.0 equiv) in water (33 mL) at 0 °C. The reaction mixture was stirred under argon at ambient temperature for 30 min, and then extracted with EtOAc. The combined organic layers were dried over Na2SO4 and concentrated to an orange-red solid. The crude mix was purified by column chromatography on deactivated neutral alumina (0-100% ethyl acetate/hexanes) to yield yellow crystals (300 mg, 67%). Rf (80% EtOAc/hexanes) = 0.4; 1H NMR (DMSO, 500 MHz): 6.6 (s, 2H), 5.3 (s, 2H), 4.3 (s, 4H), ppm; 13C NMR (DMSO, 125 MHz): 187.4, 149.1, 129.8, 57.0 ppm; UV-Vis = 260 nm.
-

- The benzoquinone obtained according to the reaction of Example 16 (60 mg, 0.36 mmol, 1.0 equiv) in 0.6 mL EtOAc was treated with a solution of sodium dithionate (453 mg, 2.6 mmol, 7.3 equiv) in 0.7 mL H2O. The diphasic mix was stirred vigorously for 30 minutes and the solution changed colors from bright to pale yellow. The mixture was diluted with water, extracted with ethyl acetate, dried over MgSO4, and concentrated to a crude solid that was purified by column chromatography on deactivated neutral alumina under Ar to yield a white powder (26 mg, 30%). UV-Vis = 297 nm.
- A method, termed open loop pH control, involves using electric current or electric potential shaping to maintain a desired pH of a solution close to the electrode. The method relies on an understanding of the electrochemical components of the system, the major constituents being the reduction/oxidation properties of the quinone, the starting pH of the solution, the electron transfer coefficient of the electrode material, the redox molecule concentration, the salt concentration, and the buffer composition and concentration. All these components impact how the electrochemical reaction changes the pH close to the electrode. With this understanding and by incorporating experimental data, a series of models can be used to define the waveforms to change the pH as required.
-
Figure 35 shows an outcome from an open loop waveform experiment designed to hold the pH of the solution close to the electrode at pH 6.5 over 15 minutes. The stepped trace approximately extending between current values 3.12e-6 and 3.50e-6 correlates with the current applied to the system (right axis). The approximately straight trace correlates with the observed pH close to the electrode surface, which is measured by analyzing the pH dependent fluorescence of green fluorescent protein bound to the surface (left axis). -
Figure 36 shows four different examples of waveforms (A-E) usable to shape and control the pH of the solution. The black line is the current/potential driven input and the grey line is the resultant pH change in the solution close to the electrode surface plotted over time. - If the relevant electrochemical components of a system remain fixed, these waveforms can be used to reproducibly generate the same pH change profile of the solution on demand without additional complexity. The method can be implemented using various electrode systems, schematics of example setups are shown in
Figure 40A-B . The method requires a minimum of 2electrodes electrode 700 can be measured by applying zero current between the 2electrodes Figure 40A ) or an electric potential 804 (Figure 40B ) is applied to theelectrodes electrode 815 acts as a working electrode (WE) and thesecond electrode 820 acts as a counter electrode (CE). This is the simplest case in that the conditions of the system must remain fixed, but to improve accuracy, a method for continuous feedback of the system state is preferred. - A method, termed closed loop pH control, uses the open circuit potential as a feedback measurement to control the current or potential.
-
Figure 38A , illustrates a controlled OCP on the SE by using a closed loop feedback method with a single OCP VTARGET. In one setup (shown inFigure 41 ), the system is driven to apply a current from acurrent source 800 to increase the H+ concentration insolution 700 until theV in 830 detected by theSE 817 reaches a single OCP VTARGET value. Thencurrent source 800 is shut off usingswitch 802 and diffusion of the H+ ions away from theSE 817 results in reduction of the H+ concentration insolution 700. Similarly, the system can be set to drive a decrease in the H+ concentration until a OCP VTARGET value is reached and then diffusion of the H+ ions towards the SE results in increase of the H+ concentration (not shown). In another setup (shown inFigure 42 ), positive 800 and negative 802 current sources are used so that the system does not need to rely on diffusion to facilitate the change of pH. This system can actively change the pH in both a positive and negative direction. In this setup the system is driven to apply a positive current from acurrent source 800 to increase the H+ concentration until theV in 830 reaches a single OCP VTARGET value and achangeover switch 803 is used to connect a negativecurrent source 801 to theWE 816 to apply a negative current and drive the setup in reverse to reduce the H+ concentration. This way, the system does not rely on passive diffusion but actively monitors and adjusts the pH by electronic control. -
Figure 38B shows experimental data of the OCP between theSE 817 andRE 822, which changes as current is applied to theWE 816. In this setup (shown inFigure 41 ), an upper and a lower target are pre-set viacontroller 900 for the value of the OCP on theSE 817. The feedback activates current driven pH change when the potential is below the lower bound and switch 802 cuts the current when above the upper bound. The data shows the OCP rising until the upper target is reached. The feedback then switches off theWE 816, which leads to a drop in the OCP as the buffer from the bulk starts to restore the local pH ofsolution 700. When the OCP reaches the lower target, the current is re-initiated usingswitch 802 to increase the OCP again. This feedback mechanism allows a defined pH forsolution 700 to be maintained close to theWE 816. In another setup (shown inFigure 42 ), the feedback can be activated to continuously change the OCP so that a positive current is applied to actively increase the OCP until the upper bound is reached and then a negative current in applied in reverse to actively decrease the OCP until a lower bound is reached. This way, the system does not rely on passive diffusion but actively monitors and adjusts the pH by electronic control. - Further,
Figure 39 shows experimental results of the open circuit potential voltage measured on a sense electrode adjacent to a working electrode with applied current. The working electrode is in a closed loop feedback with the sense electrode. The open circuit potential (OCP) of the working electrode as detected by the sense electrode is analogous to the pH of the solution near the working electrode. The feedback has been set to apply current to the WE only when the sense electrode open circuit potential is below 0.2V. The feedback is then bound between 0.19V and 0.2V (target OCP), switching the potential on the working electrode ON below 0.19 and OFF above 0.2V. The shift at time 560s is a disruption caused by pipetting the bulk solution into the working electrode. This perturbs the pH gradient that was generated by the current applied to the working electrode causing the pH of the solution to immediately return to the pH of the bulk solution. After pipetting is stopped, the closed loop feedback system is able to restore and then maintain the target OCP. -
Figures 41-56 show schematics for a closed loop feedback setup, where the OCP between the sense electrode (SE) 816 and reference electrode (RE) 822 is provided as input to acontroller 900 that regulates the current source(s) 800-801 or potential source(s) 804-805 through one or more switches 802-803, 806-810. In this way, the system can be triggered on and off to increase or decrease the electrochemial generation/consumption of H+ ions to balance the increase or decrease with the rate of diff-usion of buffering ions from bulk solution to achieve a specific pH value as defined by a target OCP (VTARGET) between theSE 816 andRE 822. - To further improve the closed loop pH control method, improved pH sensitivity can be incorporated by the addition of a pH
sensitive coating 840 on the working and/orsense electrode Figure 37 shows a response of the open circuit potential (OCP) as a function of pH where the surface of the electrode is coated with a pH sensitive PANI coating. The response of the OCP as a function of pH is shown by the slope of the line to be approximately 60mV/pH which is close to the Nernstian limit. -
Figure 40 shows example schematics of device designs utilizing the open loop method. In part A, a controlled current source is used while in part B a controlled voltage source is used. - Various designs can be used in conjunction with the closed loop method.
Figures 41 ,43 ,45 ,47 ,49 ,51 , and53 show various designs for the closed loop method with a single controlledcurrent source 800, andFigures 42 ,44 ,46 ,48 ,50 ,52 , and54-56 show alternative designs using a dual controlledcurrent source Figures 43 ,44 ,47-50 , and53-56 ). The WE and SE may also be combined into asingle electrode 815 that is able to function as both the sense and working electrodes (Figures 45-48 ). Various switches 802-803, 806-810 are used to connect and disconnect the current 800-801 and voltage sources 804-805.Figures 41 ,43 ,45 , and47 shows asimple switch 802 for connecting and disconnecting thecurrent source 800.Figure 49 shows asimilar switch 806 for connecting and disconnecting thevoltage source 804.Figure 42 ,44 ,46 , and48 shows achangeover switch 803 for switching between the positivecurrent source 800 and negativecurrent source 801.Figure 51 shows a similar changeover switch for switching betweenpositive voltage source 804 andnegative voltage source 805. InFigures 51-54 , switches 808-810 operate in conjunction with clock phases Phil and Phi2.Switches controller 900 based on feedback to allow for additional levels of control over the WE potential input and SE measurement output. -
Figure 55 schematically shows the system architecture with a closed loop controller. This system controls the pH with only onetarget value V TARGET 907. The same architecture can be applied to electrochemical cells with systems which use electric voltages instead of electric currents to modulate pH. The controller can work as follows. The input voltage (Vin) 830 is sampled 901 and compared 902 to atarget voltage V TARGET 907 and the difference is amplified 903 and processed by aloop filter 904. This could also be part of the loop filter and also be realized in different ways, e.g., as a switched capacitor amplifiers or a switched-capacitor loop filter. One example for aloop filter 904 is a PID-controller with a proportional part (P), an integrating part (I) and a differentiating part (D). The output signal of theloop filter 904 is compared with a fixed threshold by acomparator 905. The output of thecomparator 905 can be positive or negative. This is equivalent to a digital representation. This digital signal is then stored in a clockedmodule 906 like a flip-flop or a latch. The frequency of theclock 908 can be much higher than the frequency which is determined by the inverse of the diffusion time constant of H+ ions. The output signal of the flip-flop then determines if a positive or negative unity current is applied to theWE 816. This scheme can also be applied to a system with only onecurrent source 800 or to a system withvoltage sources current sources electronic loop filter 904 and is distributed over a wide frequency spectrum determined by the frequency of theclock CLK 908. The one-bit-output of the comparator can be filtered by adigital filter 909, as shown inFigure 55 . This results in a digital representation of what the system has to apply to electrochemical cell in order to keep the pH at the target value. - There is flexibility in the controller architecture design in that an analog controller, a digital controller, or a controller using both analog and digital signal processing can be used.
Figure 56 shows a second controller architecture where the main difference from that ofFigure 55 being the way how the target value for pH is set. InFigure 55 , the target pH is set by ananalog voltage V TARGET 907. ThisV TARGET 907 could be generated by a digital-to-analog converter (DAC). InFigure 56 , theinput voltage V in 830 is digitized by an analog-to-digital converter (ADC) 911 and then compared 912 with adigital target value 910. As noted above, the electronics is clocked at afrequency 908 much higher than the inverse of the diffusion time constant of the H+ ions. - The controllers in
Figure 56 can also be used to "measure" using the closed loop method the electric current or voltage that is needed to set a certain target pH. This information can be used to characterize the system and derive stimuli for an open loop system. One example where this might be very useful is an array-structure of many sites where one site is used to "measure" the correct values using the closed loop, and those values are then applied according to the open-loop to many other "mirrored" sites. -
Figure 57 shows an illustration of example electrode configurations (routing not shown) for pH sensing. An illustration of the geometry of the working electrode and sense electrode includes: (A) sense electrode located adjacent to the working electrode, (B) sense electrodes located within the working electrode, (C) multiple sense electrodes for a single working electrode, and (D) interdigitated working and sense electrodes. The incorporation of the PANI surface is advantageous for improving the accuracy of closed loop pH control. There are many different methods to incorporate a sense electrode for monitoring pH. For example, in still another alternative, the working electrode and sense electrode can also be one and the same by switching between active and passive/measuring step.
Claims (18)
- A method comprising:a. providing a biosensor comprising a control unit and a support in a solution, wherein:
the solution comprises an electrochemically active agent, and the support comprises two or more electrodes and a biomolecule interface layer having an immobilized pH sensitive probe thereon;b. modifying the pH of the solution near at least one of the two or more electrodes by electrochemically oxidizing or reducing the electrochemically active agent to produce H+ ions or OH- ions;c. measuring capacitance values associated with at least two of the two or more electrodes; andd. determining based on the measured capacitance values whether a bubble is present in the solution. - The method of claim 1, wherein the pH sensitive probe is a fluorescent protein or a green fluorescent protein.
- The method of claim 1, wherein a first area of the biomolecule interface layer covers at least one area of the support not covered by the two or more electrodes and a second area of the biomolecule interface layer covers at least one area of the two or more electrodes, wherein the pH sensitive probe is immobilized on the first area and second area of the biomolecule interface layer, and wherein the pH sensitive probe is a fluorescent protein.
- The method of claim 3, further comprising determining the pH of the solution near the two or more electrodes using a fluorescence intensity of the immobilized pH sensitive fluorescent protein immobilized on the second area of the biomolecule interface layer.
- The method of claim 3, further comprising normalizing a fluorescence intensity of the immobilized pH sensitive fluorescent protein immobilized on the second area of the biomolecule interface layer with respect to a fluorescence intensity of the immobilized pH sensitive fluorescent protein immobilized on the first area of the biomolecule interface layer, and the pH is determined using the normalized fluorescence intensity.
- The method of claim 1, further comprising measuring the pH using a sense electrode wherein the two or more electrodes comprise the sense electrode.
- The method of claim 1, wherein the biosensor comprises a multisite array of test sites with each test site having the support in the solution and one or more test condition for each test site can be independently varied, and wherein the pH of the solution close to the two or more electrodes in each test site is independently controlled.
- The method of claim 7, further comprising collecting signals from the biosensor to obtain a collection of varied signals, wherein the collection of varied signals includes varied signals from the multisite array of test sites.
- The method of claim 7, wherein the control unit is configured to independently detect a presence of a bubble in each test site and if the presence of a bubble is detected store the location of the test site in the multisite array having the bubble.
- A biosensor comprising:a. a support in a solution,i. the solution comprising an electrochemically active agent,ii. the support comprising two or more electrodes, and a biomolecule interface layer having an immobilized pH sensitive probe thereon; andb. a control unit;wherein the biosensor is configured to modify the pH of the solution near at least one of the two or more electrodes by electrochemically oxidizing or reducing the electrochemically active agent to produce H+ ions or OH- ions, and the control unit is configured to measure capacitance values associated with at least two of the two or more electrodes and determine based on the measured capacitance values whether a bubble is present in the solution.
- The biosensor of claim 10, wherein the pH sensitive probe is a fluorescent protein and optionally a green fluorescent protein.
- The biosensor of claim 10, wherein a first area of the biomolecule interface layer covers at least one area of the support not covered by the two or more electrodes and a second area of the biomolecule interface layer covers at least one area of the two or more electrodes, and wherein the pH sensitive probe is immobilized on the first area and second area of the biomolecule interface layer.
- The biosensor of claim 12, wherein the biosensor is configured to determine the pH of the solution near the two or more electrodes using a fluorescence intensity of the immobilized pH sensitive fluorescent protein immobilized on the second area of the biomolecule interface layer.
- The biosensor of claim 12, wherein the biosensor is configured to normalize the fluorescence intensity of the immobilized pH sensitive fluorescent protein immobilized on the second area of the biomolecule interface layer with respect to the fluorescence intensity of the immobilized pH sensitive fluorescent protein immobilized on the first area of the biomolecule interface layer, and the biosensor is configured to determine the pH using the normalized fluorescence intensity.
- The biosensor of claim 10, wherein the two or more electrodes comprise a sense electrode and the biosensor is configured to measure the pH using the sense electrode.
- The biosensor of claim 10, wherein the biosensor comprises a multisite array of test sites with each test site having the support in the solution and one or more test condition for each test site can be independently varied, and wherein the pH of the solution close to the two or more electrodes in each test site is independently controlled.
- The biosensor of claim 16, wherein the control unit is configured to independently detect a presence of a bubble in each test site and if the presence of a bubble is detected store the location of the test site in the multisite array having the bubble.
- The biosensor of claim 16, wherein the biosensor is configured to obtain a collection of varied signals including varied signals from the multisite array of test sites.
Applications Claiming Priority (2)
| Application Number | Priority Date | Filing Date | Title |
|---|---|---|---|
| US14/792,530 US9766197B2 (en) | 2014-02-13 | 2015-07-06 | Methods for generating pH/ionic concentration gradient near electrode surfaces for modulating biomolecular interactions, and bubble detection using electrodes |
| PCT/EP2016/065505 WO2017005626A1 (en) | 2014-02-13 | 2016-07-01 | METHODS FOR GENERATING pH/IONIC CONCENTRATION GRADIENT NEAR ELECTRODE SURFACES FOR MODULATING BIOMOLECULAR INTERACTIONS, AND BUBBLE DETECTION USING ELECTRODES |
Publications (2)
| Publication Number | Publication Date |
|---|---|
| EP3320332A1 EP3320332A1 (en) | 2018-05-16 |
| EP3320332B1 true EP3320332B1 (en) | 2021-03-03 |
Family
ID=61874460
Family Applications (1)
| Application Number | Title | Priority Date | Filing Date |
|---|---|---|---|
| EP16735625.2A Active EP3320332B1 (en) | 2015-07-06 | 2016-07-01 | Methods for generating ph/ionic concentration gradient near electrode surfaces for bubble detection using electrodes |
Country Status (1)
| Country | Link |
|---|---|
| EP (1) | EP3320332B1 (en) |
-
2016
- 2016-07-01 EP EP16735625.2A patent/EP3320332B1/en active Active
Non-Patent Citations (1)
| Title |
|---|
| None * |
Also Published As
| Publication number | Publication date |
|---|---|
| EP3320332A1 (en) | 2018-05-16 |
Similar Documents
| Publication | Publication Date | Title |
|---|---|---|
| US11561198B2 (en) | Electronic control of the pH of a solution close to an electrode surface | |
| US10942146B2 (en) | Electrochemically active agents for pH modulation in biological buffers | |
| US9910008B2 (en) | Methods for generating pH/ionic concentration gradient near electrode surfaces for modulating biomolecular interactions | |
| US9874538B2 (en) | Methods for generating pH/ionic concentration gradient near electrode surfaces for modulating biomolecular interactions | |
| US9766197B2 (en) | Methods for generating pH/ionic concentration gradient near electrode surfaces for modulating biomolecular interactions, and bubble detection using electrodes | |
| US10379117B2 (en) | Smart glass slide for microarrays | |
| Crespo et al. | Electrogenerated chemiluminescence for potentiometric sensors | |
| EP3779436A2 (en) | Methods for generating ph/ionic concentration gradient near electrode surfaces for modulating biomolecular interactions using dopamine hydrochloride | |
| Qi et al. | Increasing electrochemiluminescence intensity of a wireless electrode array chip by thousands of times using a diode for sensitive visual detection by a digital camera | |
| US20180318834A1 (en) | Integration of electrochecmical ph modulation with lab on a chip technologies | |
| US11867660B2 (en) | Electronic control of the pH of a solution close to an electrode surface | |
| EP3320332B1 (en) | Methods for generating ph/ionic concentration gradient near electrode surfaces for bubble detection using electrodes | |
| EP3320340A1 (en) | METHODS FOR GENERATING pH/IONIC CONCENTRATION GRADIENT NEAR ELECTRODE SURFACES FOR MODULATING BIOMOLECULAR INTERACTIONS | |
| WO2017005638A1 (en) | METHODS FOR GENERATING pH/IONIC CONCENTRATION GRADIENT NEAR ELECTRODE SURFACES FOR MODULATING BIOMOLECULAR INTERACTIONS | |
| WO2022016087A1 (en) | Electronic control of the ph of a solution close to an electrode surface |
Legal Events
| Date | Code | Title | Description |
|---|---|---|---|
| STAA | Information on the status of an ep patent application or granted ep patent |
Free format text: STATUS: THE INTERNATIONAL PUBLICATION HAS BEEN MADE |
|
| PUAI | Public reference made under article 153(3) epc to a published international application that has entered the european phase |
Free format text: ORIGINAL CODE: 0009012 |
|
| STAA | Information on the status of an ep patent application or granted ep patent |
Free format text: STATUS: REQUEST FOR EXAMINATION WAS MADE |
|
| 17P | Request for examination filed |
Effective date: 20180206 |
|
| AK | Designated contracting states |
Kind code of ref document: A1 Designated state(s): AL AT BE BG CH CY CZ DE DK EE ES FI FR GB GR HR HU IE IS IT LI LT LU LV MC MK MT NL NO PL PT RO RS SE SI SK SM TR |
|
| AX | Request for extension of the european patent |
Extension state: BA ME |
|
| DAV | Request for validation of the european patent (deleted) | ||
| DAX | Request for extension of the european patent (deleted) | ||
| STAA | Information on the status of an ep patent application or granted ep patent |
Free format text: STATUS: EXAMINATION IS IN PROGRESS |
|
| 17Q | First examination report despatched |
Effective date: 20190221 |
|
| RAP1 | Party data changed (applicant data changed or rights of an application transferred) |
Owner name: ROBERT BOSCH GMBH |
|
| GRAP | Despatch of communication of intention to grant a patent |
Free format text: ORIGINAL CODE: EPIDOSNIGR1 |
|
| STAA | Information on the status of an ep patent application or granted ep patent |
Free format text: STATUS: GRANT OF PATENT IS INTENDED |
|
| INTG | Intention to grant announced |
Effective date: 20200922 |
|
| GRAS | Grant fee paid |
Free format text: ORIGINAL CODE: EPIDOSNIGR3 |
|
| STAA | Information on the status of an ep patent application or granted ep patent |
Free format text: STATUS: GRANT OF PATENT IS INTENDED |
|
| GRAA | (expected) grant |
Free format text: ORIGINAL CODE: 0009210 |
|
| STAA | Information on the status of an ep patent application or granted ep patent |
Free format text: STATUS: THE PATENT HAS BEEN GRANTED |
|
| AK | Designated contracting states |
Kind code of ref document: B1 Designated state(s): AL AT BE BG CH CY CZ DE DK EE ES FI FR GB GR HR HU IE IS IT LI LT LU LV MC MK MT NL NO PL PT RO RS SE SI SK SM TR |
|
| REG | Reference to a national code |
Ref country code: GB Ref legal event code: FG4D |
|
| REG | Reference to a national code |
Ref country code: AT Ref legal event code: REF Ref document number: 1367745 Country of ref document: AT Kind code of ref document: T Effective date: 20210315 Ref country code: CH Ref legal event code: EP |
|
| REG | Reference to a national code |
Ref country code: DE Ref legal event code: R096 Ref document number: 602016053554 Country of ref document: DE |
|
| REG | Reference to a national code |
Ref country code: IE Ref legal event code: FG4D |
|
| REG | Reference to a national code |
Ref country code: LT Ref legal event code: MG9D |
|
| PG25 | Lapsed in a contracting state [announced via postgrant information from national office to epo] |
Ref country code: LT Free format text: LAPSE BECAUSE OF FAILURE TO SUBMIT A TRANSLATION OF THE DESCRIPTION OR TO PAY THE FEE WITHIN THE PRESCRIBED TIME-LIMIT Effective date: 20210303 Ref country code: BG Free format text: LAPSE BECAUSE OF FAILURE TO SUBMIT A TRANSLATION OF THE DESCRIPTION OR TO PAY THE FEE WITHIN THE PRESCRIBED TIME-LIMIT Effective date: 20210603 Ref country code: NO Free format text: LAPSE BECAUSE OF FAILURE TO SUBMIT A TRANSLATION OF THE DESCRIPTION OR TO PAY THE FEE WITHIN THE PRESCRIBED TIME-LIMIT Effective date: 20210603 Ref country code: HR Free format text: LAPSE BECAUSE OF FAILURE TO SUBMIT A TRANSLATION OF THE DESCRIPTION OR TO PAY THE FEE WITHIN THE PRESCRIBED TIME-LIMIT Effective date: 20210303 Ref country code: GR Free format text: LAPSE BECAUSE OF FAILURE TO SUBMIT A TRANSLATION OF THE DESCRIPTION OR TO PAY THE FEE WITHIN THE PRESCRIBED TIME-LIMIT Effective date: 20210604 Ref country code: FI Free format text: LAPSE BECAUSE OF FAILURE TO SUBMIT A TRANSLATION OF THE DESCRIPTION OR TO PAY THE FEE WITHIN THE PRESCRIBED TIME-LIMIT Effective date: 20210303 |
|
| REG | Reference to a national code |
Ref country code: NL Ref legal event code: MP Effective date: 20210303 |
|
| REG | Reference to a national code |
Ref country code: AT Ref legal event code: MK05 Ref document number: 1367745 Country of ref document: AT Kind code of ref document: T Effective date: 20210303 |
|
| PG25 | Lapsed in a contracting state [announced via postgrant information from national office to epo] |
Ref country code: LV Free format text: LAPSE BECAUSE OF FAILURE TO SUBMIT A TRANSLATION OF THE DESCRIPTION OR TO PAY THE FEE WITHIN THE PRESCRIBED TIME-LIMIT Effective date: 20210303 Ref country code: RS Free format text: LAPSE BECAUSE OF FAILURE TO SUBMIT A TRANSLATION OF THE DESCRIPTION OR TO PAY THE FEE WITHIN THE PRESCRIBED TIME-LIMIT Effective date: 20210303 Ref country code: PL Free format text: LAPSE BECAUSE OF FAILURE TO SUBMIT A TRANSLATION OF THE DESCRIPTION OR TO PAY THE FEE WITHIN THE PRESCRIBED TIME-LIMIT Effective date: 20210303 Ref country code: SE Free format text: LAPSE BECAUSE OF FAILURE TO SUBMIT A TRANSLATION OF THE DESCRIPTION OR TO PAY THE FEE WITHIN THE PRESCRIBED TIME-LIMIT Effective date: 20210303 |
|
| PG25 | Lapsed in a contracting state [announced via postgrant information from national office to epo] |
Ref country code: NL Free format text: LAPSE BECAUSE OF FAILURE TO SUBMIT A TRANSLATION OF THE DESCRIPTION OR TO PAY THE FEE WITHIN THE PRESCRIBED TIME-LIMIT Effective date: 20210303 |
|
| PG25 | Lapsed in a contracting state [announced via postgrant information from national office to epo] |
Ref country code: CZ Free format text: LAPSE BECAUSE OF FAILURE TO SUBMIT A TRANSLATION OF THE DESCRIPTION OR TO PAY THE FEE WITHIN THE PRESCRIBED TIME-LIMIT Effective date: 20210303 Ref country code: EE Free format text: LAPSE BECAUSE OF FAILURE TO SUBMIT A TRANSLATION OF THE DESCRIPTION OR TO PAY THE FEE WITHIN THE PRESCRIBED TIME-LIMIT Effective date: 20210303 Ref country code: AT Free format text: LAPSE BECAUSE OF FAILURE TO SUBMIT A TRANSLATION OF THE DESCRIPTION OR TO PAY THE FEE WITHIN THE PRESCRIBED TIME-LIMIT Effective date: 20210303 Ref country code: SM Free format text: LAPSE BECAUSE OF FAILURE TO SUBMIT A TRANSLATION OF THE DESCRIPTION OR TO PAY THE FEE WITHIN THE PRESCRIBED TIME-LIMIT Effective date: 20210303 |
|
| PG25 | Lapsed in a contracting state [announced via postgrant information from national office to epo] |
Ref country code: PT Free format text: LAPSE BECAUSE OF FAILURE TO SUBMIT A TRANSLATION OF THE DESCRIPTION OR TO PAY THE FEE WITHIN THE PRESCRIBED TIME-LIMIT Effective date: 20210705 Ref country code: SK Free format text: LAPSE BECAUSE OF FAILURE TO SUBMIT A TRANSLATION OF THE DESCRIPTION OR TO PAY THE FEE WITHIN THE PRESCRIBED TIME-LIMIT Effective date: 20210303 Ref country code: RO Free format text: LAPSE BECAUSE OF FAILURE TO SUBMIT A TRANSLATION OF THE DESCRIPTION OR TO PAY THE FEE WITHIN THE PRESCRIBED TIME-LIMIT Effective date: 20210303 Ref country code: IS Free format text: LAPSE BECAUSE OF FAILURE TO SUBMIT A TRANSLATION OF THE DESCRIPTION OR TO PAY THE FEE WITHIN THE PRESCRIBED TIME-LIMIT Effective date: 20210703 |
|
| REG | Reference to a national code |
Ref country code: DE Ref legal event code: R097 Ref document number: 602016053554 Country of ref document: DE |
|
| PLBE | No opposition filed within time limit |
Free format text: ORIGINAL CODE: 0009261 |
|
| STAA | Information on the status of an ep patent application or granted ep patent |
Free format text: STATUS: NO OPPOSITION FILED WITHIN TIME LIMIT |
|
| PG25 | Lapsed in a contracting state [announced via postgrant information from national office to epo] |
Ref country code: ES Free format text: LAPSE BECAUSE OF FAILURE TO SUBMIT A TRANSLATION OF THE DESCRIPTION OR TO PAY THE FEE WITHIN THE PRESCRIBED TIME-LIMIT Effective date: 20210303 Ref country code: AL Free format text: LAPSE BECAUSE OF FAILURE TO SUBMIT A TRANSLATION OF THE DESCRIPTION OR TO PAY THE FEE WITHIN THE PRESCRIBED TIME-LIMIT Effective date: 20210303 Ref country code: DK Free format text: LAPSE BECAUSE OF FAILURE TO SUBMIT A TRANSLATION OF THE DESCRIPTION OR TO PAY THE FEE WITHIN THE PRESCRIBED TIME-LIMIT Effective date: 20210303 |
|
| 26N | No opposition filed |
Effective date: 20211206 |
|
| PG25 | Lapsed in a contracting state [announced via postgrant information from national office to epo] |
Ref country code: SI Free format text: LAPSE BECAUSE OF FAILURE TO SUBMIT A TRANSLATION OF THE DESCRIPTION OR TO PAY THE FEE WITHIN THE PRESCRIBED TIME-LIMIT Effective date: 20210303 |
|
| REG | Reference to a national code |
Ref country code: CH Ref legal event code: PL |
|
| PG25 | Lapsed in a contracting state [announced via postgrant information from national office to epo] |
Ref country code: MC Free format text: LAPSE BECAUSE OF FAILURE TO SUBMIT A TRANSLATION OF THE DESCRIPTION OR TO PAY THE FEE WITHIN THE PRESCRIBED TIME-LIMIT Effective date: 20210303 |
|
| REG | Reference to a national code |
Ref country code: BE Ref legal event code: MM Effective date: 20210731 |
|
| PG25 | Lapsed in a contracting state [announced via postgrant information from national office to epo] |
Ref country code: LI Free format text: LAPSE BECAUSE OF NON-PAYMENT OF DUE FEES Effective date: 20210731 Ref country code: IT Free format text: LAPSE BECAUSE OF FAILURE TO SUBMIT A TRANSLATION OF THE DESCRIPTION OR TO PAY THE FEE WITHIN THE PRESCRIBED TIME-LIMIT Effective date: 20210303 Ref country code: CH Free format text: LAPSE BECAUSE OF NON-PAYMENT OF DUE FEES Effective date: 20210731 |
|
| PG25 | Lapsed in a contracting state [announced via postgrant information from national office to epo] |
Ref country code: IS Free format text: LAPSE BECAUSE OF FAILURE TO SUBMIT A TRANSLATION OF THE DESCRIPTION OR TO PAY THE FEE WITHIN THE PRESCRIBED TIME-LIMIT Effective date: 20210703 Ref country code: LU Free format text: LAPSE BECAUSE OF NON-PAYMENT OF DUE FEES Effective date: 20210701 |
|
| PG25 | Lapsed in a contracting state [announced via postgrant information from national office to epo] |
Ref country code: IE Free format text: LAPSE BECAUSE OF NON-PAYMENT OF DUE FEES Effective date: 20210701 Ref country code: BE Free format text: LAPSE BECAUSE OF NON-PAYMENT OF DUE FEES Effective date: 20210731 |
|
| PG25 | Lapsed in a contracting state [announced via postgrant information from national office to epo] |
Ref country code: HU Free format text: LAPSE BECAUSE OF FAILURE TO SUBMIT A TRANSLATION OF THE DESCRIPTION OR TO PAY THE FEE WITHIN THE PRESCRIBED TIME-LIMIT; INVALID AB INITIO Effective date: 20160701 |
|
| PG25 | Lapsed in a contracting state [announced via postgrant information from national office to epo] |
Ref country code: CY Free format text: LAPSE BECAUSE OF FAILURE TO SUBMIT A TRANSLATION OF THE DESCRIPTION OR TO PAY THE FEE WITHIN THE PRESCRIBED TIME-LIMIT Effective date: 20210303 |
|
| PGFP | Annual fee paid to national office [announced via postgrant information from national office to epo] |
Ref country code: GB Payment date: 20230724 Year of fee payment: 8 |
|
| PGFP | Annual fee paid to national office [announced via postgrant information from national office to epo] |
Ref country code: FR Payment date: 20230724 Year of fee payment: 8 Ref country code: DE Payment date: 20230922 Year of fee payment: 8 |