EP3320325B1 - Differential viscometer with solvent compressibility correction - Google Patents
Differential viscometer with solvent compressibility correction Download PDFInfo
- Publication number
- EP3320325B1 EP3320325B1 EP16822077.0A EP16822077A EP3320325B1 EP 3320325 B1 EP3320325 B1 EP 3320325B1 EP 16822077 A EP16822077 A EP 16822077A EP 3320325 B1 EP3320325 B1 EP 3320325B1
- Authority
- EP
- European Patent Office
- Prior art keywords
- arm
- volume
- capillary
- bridge
- capillaries
- Prior art date
- Legal status (The legal status is an assumption and is not a legal conclusion. Google has not performed a legal analysis and makes no representation as to the accuracy of the status listed.)
- Active
Links
- 239000002904 solvent Substances 0.000 title claims description 24
- 230000001629 suppression Effects 0.000 claims description 23
- 239000012530 fluid Substances 0.000 claims description 16
- 239000004696 Poly ether ether ketone Substances 0.000 claims description 8
- 229920002530 polyetherether ketone Polymers 0.000 claims description 8
- 239000011324 bead Substances 0.000 claims description 6
- 229910001220 stainless steel Inorganic materials 0.000 claims description 5
- 239000010935 stainless steel Substances 0.000 claims description 5
- 230000003071 parasitic effect Effects 0.000 claims description 3
- 239000000843 powder Substances 0.000 claims description 2
- JUPQTSLXMOCDHR-UHFFFAOYSA-N benzene-1,4-diol;bis(4-fluorophenyl)methanone Chemical compound OC1=CC=C(O)C=C1.C1=CC(F)=CC=C1C(=O)C1=CC=C(F)C=C1 JUPQTSLXMOCDHR-UHFFFAOYSA-N 0.000 claims 1
- 238000005259 measurement Methods 0.000 description 12
- 230000008859 change Effects 0.000 description 11
- 230000000694 effects Effects 0.000 description 8
- 238000004587 chromatography analysis Methods 0.000 description 7
- 238000013461 design Methods 0.000 description 7
- 238000005516 engineering process Methods 0.000 description 6
- 230000035945 sensitivity Effects 0.000 description 6
- 230000002596 correlated effect Effects 0.000 description 5
- 238000010828 elution Methods 0.000 description 5
- 238000002474 experimental method Methods 0.000 description 5
- 230000004044 response Effects 0.000 description 4
- YXFVVABEGXRONW-UHFFFAOYSA-N Toluene Chemical compound CC1=CC=CC=C1 YXFVVABEGXRONW-UHFFFAOYSA-N 0.000 description 3
- 230000008901 benefit Effects 0.000 description 3
- 238000001914 filtration Methods 0.000 description 3
- 230000004048 modification Effects 0.000 description 3
- 238000012986 modification Methods 0.000 description 3
- XLYOFNOQVPJJNP-UHFFFAOYSA-N water Substances O XLYOFNOQVPJJNP-UHFFFAOYSA-N 0.000 description 3
- 230000006872 improvement Effects 0.000 description 2
- 230000010355 oscillation Effects 0.000 description 2
- 239000002953 phosphate buffered saline Substances 0.000 description 2
- 241000283690 Bos taurus Species 0.000 description 1
- 108091003079 Bovine Serum Albumin Proteins 0.000 description 1
- 238000004458 analytical method Methods 0.000 description 1
- 239000007864 aqueous solution Substances 0.000 description 1
- 230000015572 biosynthetic process Effects 0.000 description 1
- 229940098773 bovine serum albumin Drugs 0.000 description 1
- 238000004364 calculation method Methods 0.000 description 1
- 238000012512 characterization method Methods 0.000 description 1
- 238000013375 chromatographic separation Methods 0.000 description 1
- 230000001419 dependent effect Effects 0.000 description 1
- LOKCTEFSRHRXRJ-UHFFFAOYSA-I dipotassium trisodium dihydrogen phosphate hydrogen phosphate dichloride Chemical compound P(=O)(O)(O)[O-].[K+].P(=O)(O)([O-])[O-].[Na+].[Na+].[Cl-].[K+].[Cl-].[Na+] LOKCTEFSRHRXRJ-UHFFFAOYSA-I 0.000 description 1
- 230000007717 exclusion Effects 0.000 description 1
- 230000003631 expected effect Effects 0.000 description 1
- 230000007246 mechanism Effects 0.000 description 1
- 238000000034 method Methods 0.000 description 1
- 239000000203 mixture Substances 0.000 description 1
- 230000002085 persistent effect Effects 0.000 description 1
- 229920000642 polymer Polymers 0.000 description 1
- 230000009290 primary effect Effects 0.000 description 1
- 102000004169 proteins and genes Human genes 0.000 description 1
- 108090000623 proteins and genes Proteins 0.000 description 1
- 230000009467 reduction Effects 0.000 description 1
- 238000001542 size-exclusion chromatography Methods 0.000 description 1
- 238000012360 testing method Methods 0.000 description 1
- 238000000196 viscometry Methods 0.000 description 1
Images


Classifications
-
- G—PHYSICS
- G01—MEASURING; TESTING
- G01N—INVESTIGATING OR ANALYSING MATERIALS BY DETERMINING THEIR CHEMICAL OR PHYSICAL PROPERTIES
- G01N11/00—Investigating flow properties of materials, e.g. viscosity, plasticity; Analysing materials by determining flow properties
- G01N11/02—Investigating flow properties of materials, e.g. viscosity, plasticity; Analysing materials by determining flow properties by measuring flow of the material
- G01N11/04—Investigating flow properties of materials, e.g. viscosity, plasticity; Analysing materials by determining flow properties by measuring flow of the material through a restricted passage, e.g. tube, aperture
- G01N11/08—Investigating flow properties of materials, e.g. viscosity, plasticity; Analysing materials by determining flow properties by measuring flow of the material through a restricted passage, e.g. tube, aperture by measuring pressure required to produce a known flow
-
- G—PHYSICS
- G01—MEASURING; TESTING
- G01N—INVESTIGATING OR ANALYSING MATERIALS BY DETERMINING THEIR CHEMICAL OR PHYSICAL PROPERTIES
- G01N30/00—Investigating or analysing materials by separation into components using adsorption, absorption or similar phenomena or using ion-exchange, e.g. chromatography or field flow fractionation
- G01N30/02—Column chromatography
- G01N30/62—Detectors specially adapted therefor
-
- G—PHYSICS
- G01—MEASURING; TESTING
- G01N—INVESTIGATING OR ANALYSING MATERIALS BY DETERMINING THEIR CHEMICAL OR PHYSICAL PROPERTIES
- G01N30/00—Investigating or analysing materials by separation into components using adsorption, absorption or similar phenomena or using ion-exchange, e.g. chromatography or field flow fractionation
- G01N30/02—Column chromatography
- G01N30/26—Conditioning of the fluid carrier; Flow patterns
- G01N30/28—Control of physical parameters of the fluid carrier
- G01N30/32—Control of physical parameters of the fluid carrier of pressure or speed
-
- G—PHYSICS
- G01—MEASURING; TESTING
- G01N—INVESTIGATING OR ANALYSING MATERIALS BY DETERMINING THEIR CHEMICAL OR PHYSICAL PROPERTIES
- G01N30/00—Investigating or analysing materials by separation into components using adsorption, absorption or similar phenomena or using ion-exchange, e.g. chromatography or field flow fractionation
- G01N30/02—Column chromatography
- G01N30/62—Detectors specially adapted therefor
- G01N30/64—Electrical detectors
-
- G—PHYSICS
- G01—MEASURING; TESTING
- G01N—INVESTIGATING OR ANALYSING MATERIALS BY DETERMINING THEIR CHEMICAL OR PHYSICAL PROPERTIES
- G01N30/00—Investigating or analysing materials by separation into components using adsorption, absorption or similar phenomena or using ion-exchange, e.g. chromatography or field flow fractionation
- G01N30/02—Column chromatography
- G01N30/62—Detectors specially adapted therefor
- G01N2030/621—Detectors specially adapted therefor signal-to-noise ratio
- G01N2030/625—Detectors specially adapted therefor signal-to-noise ratio by measuring reference material, e.g. carrier without sample
-
- G—PHYSICS
- G01—MEASURING; TESTING
- G01N—INVESTIGATING OR ANALYSING MATERIALS BY DETERMINING THEIR CHEMICAL OR PHYSICAL PROPERTIES
- G01N30/00—Investigating or analysing materials by separation into components using adsorption, absorption or similar phenomena or using ion-exchange, e.g. chromatography or field flow fractionation
- G01N30/02—Column chromatography
- G01N30/62—Detectors specially adapted therefor
- G01N2030/626—Detectors specially adapted therefor calibration, baseline
-
- G—PHYSICS
- G01—MEASURING; TESTING
- G01N—INVESTIGATING OR ANALYSING MATERIALS BY DETERMINING THEIR CHEMICAL OR PHYSICAL PROPERTIES
- G01N30/00—Investigating or analysing materials by separation into components using adsorption, absorption or similar phenomena or using ion-exchange, e.g. chromatography or field flow fractionation
- G01N30/02—Column chromatography
- G01N30/26—Conditioning of the fluid carrier; Flow patterns
Definitions
- a pump 101 draws fluid from a reservoir 102 and passes it through a sensing capillary 103.
- a differential transducer 104 measures the pressure across the capillary. The measured pressure is proportional to the flow rate and the sample viscosity.
- a problem arising from such a flowing system is that if the pump is not perfectly stable, pressure pulses appear identical to changes in the sample viscosity. Since the output of the conventional viscometer is directly proportional to the pressure, the sensitivity of such a device is limited by the quality of the pump used. High quality chromatography solvent delivery systems commonly provide solvent with pressure pulses less than 0.1 %, so the ability to measure specific viscosity is limited to this level.
- capillary bridge viscometer such as that described by Haney in 1982 in U.S. Patent No. 4,463,598 .
- the capillary bridge viscometer is a fluid analog of the classical Wheatstone bridge electrical circuit in which four capillaries are connected in a bridge formation along with a large fluid reservoir in one of the lower bridge arms.
- the delay volume insures that the bridge will go out of balance when a sample is introduced to the bridge. Data can be taken until the sample emerges from the delay column at which time one must wait for the column to refill with solvent before another sample may be injected.
- the out-of balance pressure is measured by a differential pressure transducer (DP), and the pressure from top to bottom of the bridge is measured by a separate transducer (IP).
- DP differential pressure transducer
- IP separate transducer
- the IP transducer experiences no such cancellation.
- the bridge appears to be two series capillaries of impedance R (the left side of the bridge) in parallel with two series capillaries of impedance R (the right side of the bridge).
- the resulting circuit as seen by the IP transducer is simply a single capillary of impedance R. Therefore the IP transducer acts, for all intents and purposes, as a single capillary viscometer, with all of the problems of pump pulse pickup.
- Figure 4 presents data from a single capillary viscometer taken from a chromatographic elution of Bovine Serum Albumin (BSA) fractionated by a size exclusion column.
- BSA Bovine Serum Albumin
- the DP signal 401 is nearly free of pump pulses, whereas the IP signal 402 is not.
- the primary problem with the strong pump pulse reduction seen in Fig. 4 is that much of the benefit seen is not due to bridge cancellation. Instead pump pulses are suppressed because the DP sensor has a very slow time constant ( ⁇ 9 seconds) and is acting as a low pass filter, thus not offering the advantage of high resolution one expects from a high quality viscometer.
- the time constant of the sensors in the system can be determined by performing a simple experiment.
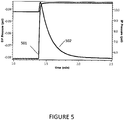
- Figure 5 shows the response of the instrument to a rapid change in the applied flow rate from 0.5ml/min to 1.0 ml/min.
- the IP signal 501 jumps from 5.5psi to 1 1psi as expected, and equilibrates to the new valve with a time constant around 0.5 seconds.
- the DP signal 502 in contrast, has an initial perturbation and equilibrates to a new equilibrium value with a 9 second time constant.
- the low pass filtering that occurs from slow sensors works well to eliminate pulses when the pressure oscillations are much faster than the characteristic time scale of the underlying peak.
- a standard ViscoStar® II viscometer (Wyatt Technology Corporation, Santa Barbara, California) equipped with a Validyne pressure transducer (Validyne Engineering, Northridge, California) was used to measure a sample peak.
- the peak consisted of 100 ⁇ l of 2mg/ml BSA injected directly into the viscometer.
- the flow rate was 0.6667ml/min.
- the viscometer was configured with only the short delay column to reduce the sample runs to only a few minutes.
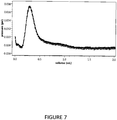
- FIG. 7 shows data taken with the same system configured with DP86 transducers (Measurement Specialties, Fremont, California). Measurements showed that these transducers have a time constant around 0.2 seconds in this system. As seen in Fig. 7 , the pump pulses are very obvious. Therefore it can be deduced that the pulses were always present, but the Validyne transducers, because of their slow response, were suppressing them.
- Max A. Haney "The differential viscometer. II. On-line viscosity detector for size-exclusion chromatography", Journal of Applied Polymer Science, July 1985 (1985-07), pages 3037-3049, XP055554766 , discloses a capillary bridge viscometer comprising a holdup reservoir (A) located to a position out of the flow stream and that acts as a compensation volume so that any temperature fluctuations cause equal volume changes on each side of the differential pressure transducer.
- A holdup reservoir
- a capillary bridge viscometer as defined in claim 1.
- a novel modification to conventional viscometric measurement systems can correct the time constant mismatch that is inherent to conventional capillary bridge designs.
- An additional volume is added to the system which compensates for the pump pulses which traditionally limit the possible sensitivity of measurements.
- the amplitude suppression ratio is defined as: .. (3) where IPA is the amplitude of the pump pulses as measured by the IP transducer, and DPA is the amplitude of pulses measured by DP transducer.
- FIG 9 shows the IP 901 signal plotted on the right axis and the DP signal 902 plotted on the left axis.
- the solvent was PBS flowing at 0.6667ml/min pumped by a Shimadzu LC-20AD solvent delivery module (Shimadzu Corporation, Kyoto, Japan).
- the pump was stabilized by flowing the solvent through 10ft of 0.005"ID polyether ether ketone (PEEK) tubing before it flowed into the viscometer. This creates about 1000psi back-pressure on the pump.
- PEEK polyether ether ketone
- SR ⁇ IP ⁇ / DP ⁇
- IP ( ⁇ ) and DP ( ⁇ ) are the Fourier Transforms of IP ( t ) and DP ( t ) respectively.
- SR ( ⁇ 0 ) the fundamental pump frequency
- the delay columns are designed to have a large internal volume, but a vanishingly small flow impedance. This is accomplished by filling columns with large diameter beads. Because the interstices are large, the flow impedance is very low.
- the ViscoStar viscometer (Wyatt Technology Corporation, Santa Barbara, California), for example, uses 0.4mm diameter ZrSiO2 beads. The open space accessible to the sample fluid is 8.1ml. This can be compared to the individual capillaries, which are 0.25mm ID and 660 mm long with an internal volume of 33 ⁇ l. The pressure drop across the delay volume is less than 1% of the pressure drop across the measurement capillaries.
- the bridge is balanced with the columns installed so that the pressure drop across the DP transducer is adjusted to nearly zero when there is pure solvent flowing.
- the pressure drop across the column has a negligible effect on the calculation of the specific viscosity, although as will be argued below the delay volume plays an unexpected role in limiting the ability of the bridge to cancel pump pulses.
- the bridge is essentially symmetric. Both sides of the DP transducer should see pump pulses equally. Since DP is a differential sensor, any common mode signal, such as the pump pulses, will cancel and the suppression ratio should diverge. The actual suppression ratio is around 17. So the question must be asked, why are pump pulses not better cancelled?
- the pump pulses are positively correlated with the signal seen by the IP transducer.
- the IP signal is high, the DP signal is also high.
- the bridge were truly symmetric, there would be nothing to distinguish the DP+ side from the DP- side.
- One would expect any given realization of the bridge would sometimes be positively correlated and sometimes negatively correlated, but this is not the case; they are always positively correlated.
- the DP transducer is reversed (with the + and - sides ports switched) the effect reverses. This implies that the side that is opposite of the delay column is correlated with the IP.
- the effect is persistent showing that the effect is not somehow being generated inside the transducer.
- Fig. 10 shows the change in the baseline when the flow rate is abruptly changed from 0.5ml/min to 0.6667ml/min.
- the IP transducer signal 1001 increases smoothly from around 5.4psi to 7.2psi.
- the time scale for this change is presumably from a combination of how quickly the pump was able to change the flow rate, and the time constant of the transducer. More interesting is what happens to the DP signal 1002.
- the baseline changes from 0.051psi to 0.060psi. If the four bridge capillaries were perfectly matched, the baseline would be zero for all flow rates. If this system is slightly out of balance, as is the case here, the change in the baseline is proportional to the applied flow rate. However the salient point is that the signal overshoots the new baseline. Consider the implications that this has for flow in the bridge.
- Figure 11 presents a simple model of the pressure change on either side of the DP transducer 1101.
- the absolute pressure on both sides of the DP transducer 1101 must increase.
- DP _ ( t ) 1102 the pressure on the positive side as DP + ( t ) 1103.
- DP ( t ) DP + ( t ) -DP_ ( t ) is larger than its final equilibrium value. Therefore the pressure on the positive 1103 side of the transducer is higher than on the negative side 1102.
- the implication therefore is that the pressure difference, and therefore the flow rate, on the upper left capillary 1104 is higher than on the upper right capillary 1105.
- Fig. 11 This is denoted in Fig. 11 by the thickness of the lined arrows.
- the flow through the lower left capillary 1106 after the delay volume 1107 is lower than through the lower right capillary 1108.
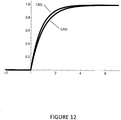
- Fig. 12 Schematically the pressure of the two sides of the bridge are shown in Fig. 12 by the traces of DP +( t ) 1201 and DP - ( t ) 1202.
- the difference between the two signals shown in Fig. 12 has an overshoot that is shown in Fig. 13 .
- the data shown in Fig. 10 can be fit a model including an offset to represent the imperfect bridge balance.
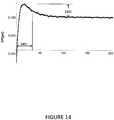
- the result is shown in Fig. 14 .
- the time scale of the overshoot 1401 is approximately 3 seconds and the amplitude 1402 is 0.004psi.
- ⁇ v is the change in volume
- ⁇ p is the change in pressure
- d is the inner diameter of the tube
- T is the wall thickness
- E Young's Modulus
- v Poisson's ratio
- the pulse compensation (PC) volume 1501 cannot be put in series with the measurement capillaries or it would affect the viscosity measurement. By putting it between DP+ 1502 and the T-union 1503 connecting R2 and R4, none of the sample passes through it. It simply transmits the pressure to the sensor. One can adjust the volume in PC until it matches that from the delay columns 1504. When the valves V2 and V3 are actuated (DP Purge), the PC volume 1501 is flushed along with the interior of the DP transducer. One does not have to put the PC in series with the transducer; one could equally well put it on a separate T connection between R2 and R4, but in this location it would require an additional valve to flush it and eliminate bubbles and trapped fluid.
- the PC could take the form of a delay column like that in the left arm but since the sample never flows through PC a long length of capillary works as well. Indeed using a long length of capillary tubing is less expensive and more compact.
- Figure 16 shows the effect of varying the length of 0.050" ID capillary tubing used as the PC volume.
- the suppression ratio grows until it reaches a maximum around 23ft, at which point the volume of the PC is 8.4mL.
- the delay columns on the lower left side of the bridge have an aggregate interior volume of 22.5mL, but they are filled with a packed powder of spherical beads.
- the peak suppression ratio occurs when the PC volume matches the open space in the delay volumes.
- the peak suppression ratio is nearly two orders of magnitude higher than the standard bridge, and the parasitic noise from pump pulses is essentially eliminated. This is a primary goal of this invention.
- the improved design increases the system sensitivity while simultaneously allowing for the use of less expensive pumps.
- FIG. 17 shows the result of measuring the suppression ratio as a function of tubing length in aqueous solutions. The peak in the curve corresponds to a 17ft length of 0.030" ID PEEK tubing. The interior volume is 2.4mL compared to 8.4mL that was required when using stainless steel capillary. As expected when one uses softer tubing, the solvent compressibility is balanced with a much lower volume.
- the four capillary bridge viscometer has been used for years as an on-line chromatography detector. However many researchers have suffered with limited sensitivity due to pick-up from pump pulses and other parasitic noise sources. Until now, the fundamental promise of the bridge design to reject pump pulses has only partially been realized. With this innovative and inexpensive improvement to the bridge design, one can enhance the sensitivity to low concentration, low viscosity samples and continue to achieve high quality data even when using inexpensive pumps.
Landscapes
- Physics & Mathematics (AREA)
- Health & Medical Sciences (AREA)
- Life Sciences & Earth Sciences (AREA)
- Chemical & Material Sciences (AREA)
- Analytical Chemistry (AREA)
- Biochemistry (AREA)
- General Health & Medical Sciences (AREA)
- General Physics & Mathematics (AREA)
- Immunology (AREA)
- Pathology (AREA)
- Treatment Of Liquids With Adsorbents In General (AREA)
- Measuring Fluid Pressure (AREA)
- Sampling And Sample Adjustment (AREA)
Description
- To understand the role that pump pulses play in the measurement of specific viscosity it is instructive to first consider the single capillary viscometer as shown in
Fig. 1 . Apump 101 draws fluid from areservoir 102 and passes it through asensing capillary 103. Adifferential transducer 104 measures the pressure across the capillary. The measured pressure is proportional to the flow rate and the sample viscosity. If one first flows solvent through the capillary and measures the pressure P 0, and subsequently injects a sample, the specific viscosity is simply
- A problem arising from such a flowing system is that if the pump is not perfectly stable, pressure pulses appear identical to changes in the sample viscosity. Since the output of the conventional viscometer is directly proportional to the pressure, the sensitivity of such a device is limited by the quality of the pump used. High quality chromatography solvent delivery systems commonly provide solvent with pressure pulses less than 0.1 %, so the ability to measure specific viscosity is limited to this level. However, high quality viscometers, such as the ViscoStar® (Wyatt Technology Corporation, Santa Barbara, California) are able to routinely measures specific viscosity down to 1E-6, which is three orders of magnitude smaller, and therefore the improved sensitivity of measurements from high quality viscometers such as these is lost in the noise of the pump pulses from chromatography systems employing even the finest pumps available..
- As an example of the output of a single capillary viscometer consider the chromatographic elution shown in
Fig. 2 . Two mg of Bovine Serium Albumen (BSA) was injected on a protein column (Wyatt Technology, Santa Barbara, California) at a flow rate of 0.6667ml/min, and the solvent was phosphate buffered saline. The pump was an Agilent® 1100 series pump (Agilent Technologies, Santa Clara, California). As the detector is positioned after the column, the pump pulses are further dampened. In line following the viscometer was a Optilab® rEX concentration detector (Wyatt Technology Corporation, Santa Barbara, California) that measured the differentialrefractive index 201 of the resulting elution. In spite of the fact that a high quality chromatography pump was used, the pump pulses limit the performance as is evident in theviscometry data 202. - One way to ameliorate the problem of pump pulses masquerading as sample peaks is to use a capillary bridge viscometer such as that described by
Haney in 1982 in U.S. Patent No. 4,463,598 . The capillary bridge viscometer is a fluid analog of the classical Wheatstone bridge electrical circuit in which four capillaries are connected in a bridge formation along with a large fluid reservoir in one of the lower bridge arms. The delay volume insures that the bridge will go out of balance when a sample is introduced to the bridge. Data can be taken until the sample emerges from the delay column at which time one must wait for the column to refill with solvent before another sample may be injected. The out-of balance pressure is measured by a differential pressure transducer (DP), and the pressure from top to bottom of the bridge is measured by a separate transducer (IP). These two signals can be combined to determine the specific viscosity, ηsp , through the relation
- By contrast, the IP transducer experiences no such cancellation. This is clear if one considers the Thévenin equivalent circuit associated with the bridge, as shown in
Fig. 3 . The bridge appears to be two series capillaries of impedance R (the left side of the bridge) in parallel with two series capillaries of impedance R (the right side of the bridge). The resulting circuit as seen by the IP transducer is simply a single capillary of impedance R. Therefore the IP transducer acts, for all intents and purposes, as a single capillary viscometer, with all of the problems of pump pulse pickup. -
Figure 4 presents data from a single capillary viscometer taken from a chromatographic elution of Bovine Serum Albumin (BSA) fractionated by a size exclusion column. TheDP signal 401 is nearly free of pump pulses, whereas theIP signal 402 is not. The primary problem with the strong pump pulse reduction seen inFig. 4 is that much of the benefit seen is not due to bridge cancellation. Instead pump pulses are suppressed because the DP sensor has a very slow time constant (∼9 seconds) and is acting as a low pass filter, thus not offering the advantage of high resolution one expects from a high quality viscometer. - The time constant of the sensors in the system can be determined by performing a simple experiment.
Figure 5 shows the response of the instrument to a rapid change in the applied flow rate from 0.5ml/min to 1.0 ml/min. TheIP signal 501 jumps from 5.5psi to 1 1psi as expected, and equilibrates to the new valve with a time constant around 0.5 seconds. TheDP signal 502, in contrast, has an initial perturbation and equilibrates to a new equilibrium value with a 9 second time constant. - The low pass filtering that occurs from slow sensors works well to eliminate pulses when the pressure oscillations are much faster than the characteristic time scale of the underlying peak. In the example shown in
Fig. 6 , a standard ViscoStar® II viscometer (Wyatt Technology Corporation, Santa Barbara, California) equipped with a Validyne pressure transducer (Validyne Engineering, Northridge, California) was used to measure a sample peak. The peak consisted of 100µl of 2mg/ml BSA injected directly into the viscometer. The flow rate was 0.6667ml/min. The viscometer was configured with only the short delay column to reduce the sample runs to only a few minutes. The Validyne transducer has a time constant of around 9 seconds, and the pump pulses at this flow rate have a fundamental period of 1.85 seconds (frequency = 0.54Hz). The peak width is 30 seconds. Since the pump pulses are much faster than the sensor time constant it is undeniably effective at suppressing them. - Consider the difference in performance between using a slow sensor and a fast one.
Figure 7 shows data taken with the same system configured with DP86 transducers (Measurement Specialties, Fremont, California). Measurements showed that these transducers have a time constant around 0.2 seconds in this system. As seen inFig. 7 , the pump pulses are very obvious. Therefore it can be deduced that the pulses were always present, but the Validyne transducers, because of their slow response, were suppressing them. - The problem with suppressing pump pulses by using a slow sensor or a low pass filter is that the sample peak is also distorted. To make this clear the data in
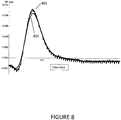
Fig. 7 subjected to a 9 second moving average filter to simulate the effect of a slow transducer. The results are shown inFig. 8 . Contrast theraw signal 801 with the filtereddata 802. As expected, the filtered data is nearly free from pump pulses, but the underlying peak is distorted. This will negatively impact the accuracy of any results derived from the distorted data. Moreover, recent trends in the chromatography industry have been working towards the improvement of peak resolution and shorten run times. New generations of uPLC chromatography systems have peaks that are only 10 seconds wide (or less). As peaks become narrower, the measured signals become progressively more distorted. Clearly using slow sensors to suppress pump pulses does not scale well.
Max A. Haney: "The differential viscometer. II. On-line viscosity detector for size-exclusion chromatography", Journal of Applied Polymer Science, July 1985 (1985-07), pages 3037-3049, XP055554766, discloses a capillary bridge viscometer comprising a holdup reservoir (A) located to a position out of the flow stream and that acts as a compensation volume so that any temperature fluctuations cause equal volume changes on each side of the differential pressure transducer. -
-
Figure 1 Shows a single capillary viscometer. Sample is injected between the pump and the viscometer and the pressure drop across the capillary is measured with a differential pressure transducer. -
Figure 2 is a comparison of differential refractive index and single capillary viscometer measurements. Pump pulses cause the high frequency oscillations in the pressure. -
Figure 3 shows a Thévenin equivalent circuit of the capillary bridge. The four impedances look to the IP transducer like a single capillary with an impedance of R. -
Figure 4 shows data collected for IP and DP signals from BSA elution. -
Figure 5 shows the results of changing flow rate from 0.5ml/min to 1.0 ml/min. The IP settles to a new value with a 0.5 second time constant, whereas the DP signal, after the initial perturbation, settles to a new value with a 9 second time constant. -
Figure 6 is a simulated sample peak measured by a standard viscometer equipped with a short delay column. Pickup of pump pulses is not evident. -
Figure 7 shows data from the same configuration as that used to generate the data fromFig. 6 , but with DP86 transducers that have a time constant of approximately 0.2 seconds. Pump pulses are very obvious. -
Figure 8 shows the effect of a low pass filter at removing pump pulses. Low pass filtering strongly suppresses the pulses but at the expense of distorted peaks. -
Figure 9 explains, in graphical terms, the definition of IPA and DPA. -
Figure 10 shows an experiment in which the flow rate was changed abruptly from 0.5 ml/min to 0.6667 ml/min. The IP pressure is on the right axis. The DP pressure is on the left axis. IP changes smoothly between the 5.4psi and 7.2psi. The DP sensor overshoots its final pressure. -
Figure 11 illustrates the flow rate changes during an overshoot event. The arrows denote the relative magnitude of the flow in various parts of the bridge. -
Figure 12 an illustration of the absolute pressure on both sides of the DP transducer during a flow rate step. Both the right and left sides of the bridge increase at different rates. Note: this illustration assumes that the bridge is perfectly balanced so that DP + and DP - reach the same final value. For an imperfectly balanced bridge, the overall results are the same but with a small offset in the final values. -
Figure 13 shows the difference of two signals of the example shown inFig. 12 . -
Figure 14 is the actual overshoot data from the experiment ofFig. 10 fit to the difference of exponential model above. The points are the data and the overlaying line is the fit. -
Figure 15 illustrates an embodiment of the invention, showing a novel modification of the 4 capillary bridge design to include Pulse Compensation (PC). -
Figure 16 shows the suppression ratio as a function of the PC tubing length for 0.050" ID stainless steel tubing. -
Figure 17 shows the suppression ratio as a function of length of the PC for 0.030" ID PEEK tubing. - According to the invention there is provided a capillary bridge viscometer as defined in
claim 1. A novel modification to conventional viscometric measurement systems can correct the time constant mismatch that is inherent to conventional capillary bridge designs. An additional volume is added to the system which compensates for the pump pulses which traditionally limit the possible sensitivity of measurements. - Rather than relying on slow transducers or low pass filtering to suppress pump pulses, it is much better to understand what limits the bridge's ability to prevent them in the first place. In order to quantify the effectiveness of the pump pulse cancellation the following metric will be used. The amplitude suppression ratio is defined as:
.. (3) where IPA is the amplitude of the pump pulses as measured by the IP transducer, and DPA is the amplitude of pulses measured by DP transducer. -
Figure 9 shows theIP 901 signal plotted on the right axis and the DP signal 902 plotted on the left axis. The solvent was PBS flowing at 0.6667ml/min pumped by a Shimadzu LC-20AD solvent delivery module (Shimadzu Corporation, Kyoto, Japan). The pump was stabilized by flowing the solvent through 10ft of 0.005"ID polyether ether ketone (PEEK) tubing before it flowed into the viscometer. This creates about 1000psi back-pressure on the pump. The combination of back-pressure and expansion of the PEEK tubing acts as a simple pulse dampener. - Defining the suppression ratio in this way gives a quantitative measure of how effectively the bridge suppresses pump pulses. If the bridge were working perfectly, the suppression ratio would be infinite. In the example shown in
Fig. 9 , IPA=6E-3psi 903 and DPA=8E-4psi 904, so the suppression ratio is 7.5, meaning that pump pulses as seen by the DP transducer are 7.5 smaller than those seen by the IP transducer. - Although the amplitude suppression ratio measures the peak-to-peak excursions, is worth noting that the suppression is a function of frequency. The frequency dependent suppression ratio is defined as

- For the Shimadzu pump used in these experiments, running at 0.6667ml/min, the fundamental frequency is ω 0 = 0.54Hz. For the data in
Fig. 9 , SR(0.54Hz) = 17, which means that the bridge suppresses pump pulses by this amount at the fundamental frequency of the pump. The reason that the suppression ratio at the pump frequency is higher than the amplitude suppression ratio is that higher frequency harmonics are not suppressed as strongly as the fundamental. For the rest of the discussion all data was taken at 0.667ml/min and SR will refer to SR(ω 0). - One key feature of the bridge design is that the delay columns are designed to have a large internal volume, but a vanishingly small flow impedance. This is accomplished by filling columns with large diameter beads. Because the interstices are large, the flow impedance is very low. The ViscoStar viscometer (Wyatt Technology Corporation, Santa Barbara, California), for example, uses 0.4mm diameter ZrSiO2 beads. The open space accessible to the sample fluid is 8.1ml. This can be compared to the individual capillaries, which are 0.25mm ID and 660 mm long with an internal volume of 33µl. The pressure drop across the delay volume is less than 1% of the pressure drop across the measurement capillaries. The bridge is balanced with the columns installed so that the pressure drop across the DP transducer is adjusted to nearly zero when there is pure solvent flowing. The pressure drop across the column has a negligible effect on the calculation of the specific viscosity, although as will be argued below the delay volume plays an unexpected role in limiting the ability of the bridge to cancel pump pulses.
- If the column is ignored in the analysis, the bridge is essentially symmetric. Both sides of the DP transducer should see pump pulses equally. Since DP is a differential sensor, any common mode signal, such as the pump pulses, will cancel and the suppression ratio should diverge. The actual suppression ratio is around 17. So the question must be asked, why are pump pulses not better cancelled?
- Of course the presence of the delay column in the left side of the bridge breaks the symmetry. One of the main goals of this disclosure is to understand how this affects the data and how it can be corrected. One could imagine several possible mechanisms whereby breaking the left-right symmetry of the bridge will spoil the pump pulse cancellation. Consider the following observations that help shed light on this question.
- First is that the pump pulses are positively correlated with the signal seen by the IP transducer. When the IP signal is high, the DP signal is also high. However if the bridge were truly symmetric, there would be nothing to distinguish the DP+ side from the DP- side. One would expect any given realization of the bridge would sometimes be positively correlated and sometimes negatively correlated, but this is not the case; they are always positively correlated. When the DP transducer is reversed (with the + and - sides ports switched) the effect reverses. This implies that the side that is opposite of the delay column is correlated with the IP. When transducers from different vendors are used, the effect is persistent showing that the effect is not somehow being generated inside the transducer.
- The next observation is that if one puts in a smaller delay column, the suppression ratio increases. This is not surprising since by making the delay volume smaller, the system becomes more symmetric. In the limit where the delay volume is eliminated, the suppression ratio rises by over an order of magnitude. However, this is of academic interest since delay volume is required for the system to be used to measure specific viscosity.
- The final observation is to consider what happens when the flow rate is changed abruptly.
Fig. 10 shows the change in the baseline when the flow rate is abruptly changed from 0.5ml/min to 0.6667ml/min. TheIP transducer signal 1001 increases smoothly from around 5.4psi to 7.2psi. The time scale for this change is presumably from a combination of how quickly the pump was able to change the flow rate, and the time constant of the transducer. More interesting is what happens to theDP signal 1002. The baseline changes from 0.051psi to 0.060psi. If the four bridge capillaries were perfectly matched, the baseline would be zero for all flow rates. If this system is slightly out of balance, as is the case here, the change in the baseline is proportional to the applied flow rate. However the salient point is that the signal overshoots the new baseline. Consider the implications that this has for flow in the bridge. -
Figure 11 presents a simple model of the pressure change on either side of theDP transducer 1101. As the flow rate is stepped the absolute pressure on both sides of theDP transducer 1101 must increase. We will denote the pressure on the negative side as DP_ (t) 1102 and the pressure on the positive side as DP +(t) 1103. During the overshoot event we know that DP(t) = DP +(t)-DP_(t) is larger than its final equilibrium value. Therefore the pressure on the positive 1103 side of the transducer is higher than on thenegative side 1102. The implication therefore is that the pressure difference, and therefore the flow rate, on the upperleft capillary 1104 is higher than on the upperright capillary 1105. This is denoted inFig. 11 by the thickness of the lined arrows. Similarly the flow through the lowerleft capillary 1106 after thedelay volume 1107 is lower than through the lowerright capillary 1108. Schematically the pressure of the two sides of the bridge are shown inFig. 12 by the traces of DP+(t) 1201 and DP- (t) 1202. The difference between the two signals shown inFig. 12 has an overshoot that is shown inFig. 13 . - The data shown in
Fig. 10 can be fit a model including an offset to represent the imperfect bridge balance. The result is shown inFig. 14 . The time scale of theovershoot 1401 is approximately 3 seconds and theamplitude 1402 is 0.004psi. The measured pressure data are overlaid with the fit to the model
- This model assumes that the flow rate in the upper left capillary is higher than that in the lower left capillary. Since the two capillaries are in series, this appears to be a contradiction. However the fit to the model suggests that this is true.
- It is not a contradiction if we assume that during the overshoot event, fluid accumulates in the delay volume. There are two possible scenarios whereby this could happen. The first scenario is if the volume inside delay column is changing in response to the increased pressure. The second scenario is if the fluid is compressing in response to the changing pressure. In order to evaluate the relative magnitude of these two hypotheses, we can estimate how much fluid is accumulated by looking at the size of the overshoot shown in
Fig. 14 . The volume of the accumulated fluid is roughly Δv = QtΔp / p where Q is the volume flow rate through the capillary (∼0.25ml/min), t is time (∼3 sec), Δp is the amplitude of the overshoot (∼0.004psi) and p is the local pressure (∼2.5psi). Putting all of this together gives a rough estimate of Δv ≈ 20nL. - The change in volume of the delay columns can be determined by the well-known formula for the expansion of a pressurized cylinder

- Similarly one can evaluate how much the solvent compresses. Water has a very low compressibility of 4.6×10⁻¹⁰ Pa -1. The delay column has an internal volume of approximately 8.1mL and the pressure change is around 0.85psi (= 6kPa), so that the resulting change in volume is approximately ΔV ∼ 20nL, which is consistent with the expected size of the effect. The conclusion is that the overshoot is due to a mismatch in the time constant for pressure changes to equilibrate on the two sides of the DP transducer. The source of this time constant mismatch is a combination of solvent compressibility and tubing expansion.
- Fortunately this time constant mismatch can be corrected with a modification of the capillary bridge design. Consider the bridge shown in
Fig. 15 , which represents an embodiment of the invention within a capillary bridge viscometer system with the novel addition of an additionalpulse compensation volume 1501. This is a large volume of fluid that is intended to balance the compressibility of the fluid in the delay columns. - The pulse compensation (PC)
volume 1501 cannot be put in series with the measurement capillaries or it would affect the viscosity measurement. By putting it betweenDP+ 1502 and the T-union 1503 connecting R2 and R4, none of the sample passes through it. It simply transmits the pressure to the sensor. One can adjust the volume in PC until it matches that from thedelay columns 1504. When the valves V2 and V3 are actuated (DP Purge), thePC volume 1501 is flushed along with the interior of the DP transducer. One does not have to put the PC in series with the transducer; one could equally well put it on a separate T connection between R2 and R4, but in this location it would require an additional valve to flush it and eliminate bubbles and trapped fluid. The PC could take the form of a delay column like that in the left arm but since the sample never flows through PC a long length of capillary works as well. Indeed using a long length of capillary tubing is less expensive and more compact. -
Figure 16 shows the effect of varying the length of 0.050" ID capillary tubing used as the PC volume. As the length of the capillary increases, the suppression ratio grows until it reaches a maximum around 23ft, at which point the volume of the PC is 8.4mL. The delay columns on the lower left side of the bridge have an aggregate interior volume of 22.5mL, but they are filled with a packed powder of spherical beads. The space accessible by the fluid depends on how tightly the beads are packed, but an optimal random close pack of spheres fills 64%, leaving 36% open to the fluid. Therefore the total volume in the delay columns is approximately 22.5mL ∗ 0.36 = 8.1mL. This represents a lower bound. If the beads are not perfectly packed, the actual volume may be slightly higher. Therefore the peak suppression ratio occurs when the PC volume matches the open space in the delay volumes. The peak suppression ratio is nearly two orders of magnitude higher than the standard bridge, and the parasitic noise from pump pulses is essentially eliminated. This is a primary goal of this invention. The improved design increases the system sensitivity while simultaneously allowing for the use of less expensive pumps. - The data presented in the previous section argue strongly that the pulse compensation tubing balances the compressibility of the solvent, and to a lesser extent the volume expansion of the delay volume tubing. Another way to test this hypothesis is by switching to a solvent that has a different compressibility to see if the system is remains balanced. If, as the argument above suggests, the primary effect is due to solvent compressibility and not expansion of the delay volume and capillaries, the system will remain balanced when the solvent is changed. To that end, the solvent was switched from water to toluene, and the suppression ratio was re-measured. The data was taken at the same flow rate (0.6667ml/min) but a different pump system was used. The fundamental pulse frequency, which is set by the pump, was 0.384Hz. Even so, at the pump frequency that suppression ratio was 648, which is close to that value measured in water. This supports the idea that the PC volume is compensating for the solvent compressibility, and that the expansion of the tubing plays a minor role. This also means that the system does not need to be retuned for each solvent.
- To investigate whether tubing expansion ever plays a role in the pickup of pump pulses a series of experiments were performed using PEEK capillary tubing for the PC volume. Since PEEK has a much lower Young's modulus than stainless steel, it expands much more than equivalent stainless steel tubing. One expects that expansion of the tubing will play a role in addition to that from the solvent compressibility. The prediction therefore is that a smaller volume in the PC would be required to balance the system.
Figure 17 shows the result of measuring the suppression ratio as a function of tubing length in aqueous solutions. The peak in the curve corresponds to a 17ft length of 0.030" ID PEEK tubing. The interior volume is 2.4mL compared to 8.4mL that was required when using stainless steel capillary. As expected when one uses softer tubing, the solvent compressibility is balanced with a much lower volume. - The four capillary bridge viscometer has been used for years as an on-line chromatography detector. However many researchers have suffered with limited sensitivity due to pick-up from pump pulses and other parasitic noise sources. Until now, the fundamental promise of the bridge design to reject pump pulses has only partially been realized. With this innovative and inexpensive improvement to the bridge design, one can enhance the sensitivity to low concentration, low viscosity samples and continue to achieve high quality data even when using inexpensive pumps.
- As will be evident to those skilled in the arts of viscometric measurements, macromolecular characterization, and chromatography, there are many obvious variations of the methods and devices of my invention that do not depart from the scope of the claims.
Claims (6)
- A capillary bridge viscometer comprisingA) a bridge for receiving a solvent comprisinga. a first arm comprising a first pair of series connected sensing capillaries (R2, R4); andb. a second arm comprising a second pair of series connected sensing capillaries (R1, R3), said second arm connected in parallel with said first arm of said bridge, and said second arm further comprising a delay volume (1504) connected in series between said second pair of series connected sensing capillaries (R1, R3);c. a first differential pressure transducer (1502) connected across said first and second arms, such that the connection to said first arm is at a junction between each of said first series connected sensing capillaries (R2, R4), and to the second arm at a junction between one of said second series connected sensing capillary and said delay volume (1504);d. a pressure compensation volume (1501) connected between said sensing capillaries (R2, R4) of said first arm and said first differential pressure transducer (1502), the pressure compensation volume being connected at a point between each of said first pair of series connected sensing capillaries (R2, R4) said first arm; andB) a second differential pressure transducer connected in parallel with said first and second pair of series connected fluid tubing arms; characterized in that
said delay volume (1504) is filled with a packed powder of spherical beads; and
said pressure compensation volume (1501) is a long capillary tubing, of length optimized to correspond to a maximum peak suppression ratio where parasitic noise from pump pulses is essentially eliminated. - The capillary bridge viscometer of Claim 1 wherein said length of tubing is made of stainless steel.
- The capillary bridge viscometer of Claim 1 wherein said length of tubing is made of PEEK.
- The capillary bridge viscometer of Claim 1 wherein said pressure compensation volume (1501) is connected in series between said sensing capillaries of said first arm (R2, R4) and said first differential pressure transducer (1502).
- The capillary bridge viscometer of Claim 1 wherein one end of said pressure compensation volume (1501) is connected via a T union (1503) at a point between said sensing capillaries of said first arm (R2, R4).
- The capillary bridge viscometer of Claim 5 further comprising a valve connected to said pressure compensation volume (1501) permitting said volume thereby, to be flushed by fluid passing through said first arm.
Applications Claiming Priority (2)
| Application Number | Priority Date | Filing Date | Title |
|---|---|---|---|
| US201562190171P | 2015-07-08 | 2015-07-08 | |
| PCT/US2016/041649 WO2017008062A1 (en) | 2015-07-08 | 2016-07-08 | Differential viscometer with solvent compressibility correction |
Publications (3)
| Publication Number | Publication Date |
|---|---|
| EP3320325A1 EP3320325A1 (en) | 2018-05-16 |
| EP3320325A4 EP3320325A4 (en) | 2019-03-20 |
| EP3320325B1 true EP3320325B1 (en) | 2021-03-24 |
Family
ID=57685891
Family Applications (1)
| Application Number | Title | Priority Date | Filing Date |
|---|---|---|---|
| EP16822077.0A Active EP3320325B1 (en) | 2015-07-08 | 2016-07-08 | Differential viscometer with solvent compressibility correction |
Country Status (5)
| Country | Link |
|---|---|
| US (2) | US10697878B2 (en) |
| EP (1) | EP3320325B1 (en) |
| JP (1) | JP6887413B2 (en) |
| CN (1) | CN107709963B (en) |
| WO (1) | WO2017008062A1 (en) |
Families Citing this family (2)
| Publication number | Priority date | Publication date | Assignee | Title |
|---|---|---|---|---|
| US10712321B2 (en) | 2016-11-02 | 2020-07-14 | Wyatt Technology Corporation | Method to eliminate periodic noise from data collected with a chromatography system |
| CN111665168B (en) * | 2019-03-07 | 2023-05-23 | 中国石油化工股份有限公司 | Device and method for detecting viscosity of fluid under pressure pulse condition |
Family Cites Families (12)
| Publication number | Priority date | Publication date | Assignee | Title |
|---|---|---|---|---|
| US3808877A (en) * | 1972-09-18 | 1974-05-07 | Du Pont | Capillary viscometer |
| GB1566154A (en) * | 1976-03-27 | 1980-04-30 | Weber G | Method of measuring the fluidity of liquids for medical and pharmaceutical pruposes and apparatus for performing the method |
| US4463598A (en) * | 1982-12-10 | 1984-08-07 | Haney Max A | Capillary bridge viscometer |
| JPH06100525B2 (en) * | 1985-10-18 | 1994-12-12 | 東洋紡績株式会社 | Capillary viscometer |
| US20030203504A1 (en) * | 2002-04-26 | 2003-10-30 | John Hefti | Diffusion-based system and method for detecting and monitoring activity of biologic and chemical species |
| US7213439B2 (en) * | 2005-03-28 | 2007-05-08 | Wyatt Technology Corporation | Automatic bridge balancing means and method for a capillary bridge viscometer |
| US7331218B2 (en) * | 2005-09-23 | 2008-02-19 | Wyatt Technology Corporation | Capillary bridge viscometer and method for measuring specific viscosity |
| US7594428B2 (en) | 2005-10-12 | 2009-09-29 | Viscotek Corporation | Apparatus and method for eliminating the breakthrough peak in differential detectors |
| US7334457B2 (en) * | 2005-10-12 | 2008-02-26 | Viscotek Corporation | Multi-capillary viscometer system and method |
| JP5200507B2 (en) * | 2007-11-30 | 2013-06-05 | 東ソー株式会社 | Viscometer for liquid chromatograph |
| US9759644B2 (en) * | 2010-09-23 | 2017-09-12 | Malvern Instruments Incorporated | Balanced capillary bridge viscometer |
| US8997555B2 (en) * | 2013-01-07 | 2015-04-07 | Flowpro Well Technology a.s. | System and method for generating a change in pressure proportional to fluid viscosity |
-
2016
- 2016-07-08 JP JP2018500442A patent/JP6887413B2/en active Active
- 2016-07-08 EP EP16822077.0A patent/EP3320325B1/en active Active
- 2016-07-08 CN CN201680037147.5A patent/CN107709963B/en active Active
- 2016-07-08 US US15/736,291 patent/US10697878B2/en active Active
- 2016-07-08 WO PCT/US2016/041649 patent/WO2017008062A1/en active Application Filing
-
2020
- 2020-06-30 US US16/917,831 patent/US11674873B2/en active Active
Non-Patent Citations (1)
| Title |
|---|
| None * |
Also Published As
| Publication number | Publication date |
|---|---|
| CN107709963B (en) | 2021-04-30 |
| JP2018519529A (en) | 2018-07-19 |
| US10697878B2 (en) | 2020-06-30 |
| WO2017008062A1 (en) | 2017-01-12 |
| US20200333231A1 (en) | 2020-10-22 |
| EP3320325A1 (en) | 2018-05-16 |
| US20180188146A1 (en) | 2018-07-05 |
| JP6887413B2 (en) | 2021-06-16 |
| CN107709963A (en) | 2018-02-16 |
| EP3320325A4 (en) | 2019-03-20 |
| US11674873B2 (en) | 2023-06-13 |
Similar Documents
| Publication | Publication Date | Title |
|---|---|---|
| US11674873B2 (en) | Differential viscometer with solvent compressibility correction | |
| US7406387B2 (en) | Apparatus and method for detecting blockage of impulse lines | |
| WO2007044954B1 (en) | Improved multi-capillary viscometer apparatus and method | |
| NO20060885L (en) | Device and method for compensating a Coriolis painter | |
| EP1707958B1 (en) | Device and method for solvent supply with correction of piston movement | |
| EP0827096A2 (en) | Self-validating sensors | |
| KR101399753B1 (en) | System and method for diagnosing clogging of lead pipe | |
| NO334153B1 (en) | Down-hole densitometer | |
| US10228414B2 (en) | Capacitive sensor testing | |
| US9335250B2 (en) | Bubble suppressing system for optical measurement cells | |
| US7878050B2 (en) | Method and system for testing a fuel injector | |
| CN101836090A (en) | Triple redundancy vortex flowmeter system | |
| US9897506B2 (en) | Systems and methods for liquid dynamic pressure testing | |
| US8910524B2 (en) | Linked bridge pressure transducer assemblies | |
| RU2758193C1 (en) | Method and apparatus for adjusting the measurement of the phase fraction and concentration of the flow meter | |
| US7260496B2 (en) | Pressure detector and method of diagnosing blockage of impulse lines | |
| Wang et al. | Static and dynamic vehicle load identification with lane detection from measured bridge acceleration and inclination responses | |
| DE10335665A1 (en) | Mass Flow Meter | |
| US20220364842A1 (en) | Bridge displacement calculating apparatus, bridge displacement measuring apparatus, bridge displacement calculating method, bridge displacement measuring method, and non-transitory computer-readable recording medium | |
| Han et al. | Velocity, density and modulus of hydrocarbon fluids—Data measurement | |
| JP4491834B2 (en) | Pressure detector and clogging diagnosis method for pressure detector | |
| JPH08101158A (en) | Flow potential measuring method | |
| SU1430511A1 (en) | Apparatus for locating water-oil interface in wells | |
| JP2023006238A (en) | Measuring method, measuring device, measuring system, and measuring program | |
| CN111665168A (en) | Device and method for detecting fluid viscosity under pressure pulse condition |
Legal Events
| Date | Code | Title | Description |
|---|---|---|---|
| STAA | Information on the status of an ep patent application or granted ep patent |
Free format text: STATUS: THE INTERNATIONAL PUBLICATION HAS BEEN MADE |
|
| TPAC | Observations filed by third parties |
Free format text: ORIGINAL CODE: EPIDOSNTIPA |
|
| PUAI | Public reference made under article 153(3) epc to a published international application that has entered the european phase |
Free format text: ORIGINAL CODE: 0009012 |
|
| STAA | Information on the status of an ep patent application or granted ep patent |
Free format text: STATUS: REQUEST FOR EXAMINATION WAS MADE |
|
| 17P | Request for examination filed |
Effective date: 20180208 |
|
| AK | Designated contracting states |
Kind code of ref document: A1 Designated state(s): AL AT BE BG CH CY CZ DE DK EE ES FI FR GB GR HR HU IE IS IT LI LT LU LV MC MK MT NL NO PL PT RO RS SE SI SK SM TR |
|
| AX | Request for extension of the european patent |
Extension state: BA ME |
|
| DAV | Request for validation of the european patent (deleted) | ||
| DAX | Request for extension of the european patent (deleted) | ||
| RIN1 | Information on inventor provided before grant (corrected) |
Inventor name: TRAINOFF, STEVEN |
|
| A4 | Supplementary search report drawn up and despatched |
Effective date: 20190220 |
|
| RIC1 | Information provided on ipc code assigned before grant |
Ipc: G01N 11/04 20060101AFI20190214BHEP Ipc: G01N 30/62 20060101ALI20190214BHEP Ipc: G01N 21/41 20060101ALI20190214BHEP Ipc: G01N 30/02 20060101ALI20190214BHEP Ipc: G01N 11/08 20060101ALI20190214BHEP |
|
| GRAP | Despatch of communication of intention to grant a patent |
Free format text: ORIGINAL CODE: EPIDOSNIGR1 |
|
| STAA | Information on the status of an ep patent application or granted ep patent |
Free format text: STATUS: GRANT OF PATENT IS INTENDED |
|
| INTG | Intention to grant announced |
Effective date: 20201007 |
|
| GRAS | Grant fee paid |
Free format text: ORIGINAL CODE: EPIDOSNIGR3 |
|
| GRAA | (expected) grant |
Free format text: ORIGINAL CODE: 0009210 |
|
| STAA | Information on the status of an ep patent application or granted ep patent |
Free format text: STATUS: THE PATENT HAS BEEN GRANTED |
|
| AK | Designated contracting states |
Kind code of ref document: B1 Designated state(s): AL AT BE BG CH CY CZ DE DK EE ES FI FR GB GR HR HU IE IS IT LI LT LU LV MC MK MT NL NO PL PT RO RS SE SI SK SM TR |
|
| REG | Reference to a national code |
Ref country code: GB Ref legal event code: FG4D |
|
| REG | Reference to a national code |
Ref country code: CH Ref legal event code: EP |
|
| REG | Reference to a national code |
Ref country code: IE Ref legal event code: FG4D |
|
| REG | Reference to a national code |
Ref country code: AT Ref legal event code: REF Ref document number: 1374993 Country of ref document: AT Kind code of ref document: T Effective date: 20210415 Ref country code: DE Ref legal event code: R096 Ref document number: 602016054940 Country of ref document: DE |
|
| REG | Reference to a national code |
Ref country code: LT Ref legal event code: MG9D |
|
| PG25 | Lapsed in a contracting state [announced via postgrant information from national office to epo] |
Ref country code: NO Free format text: LAPSE BECAUSE OF FAILURE TO SUBMIT A TRANSLATION OF THE DESCRIPTION OR TO PAY THE FEE WITHIN THE PRESCRIBED TIME-LIMIT Effective date: 20210624 Ref country code: HR Free format text: LAPSE BECAUSE OF FAILURE TO SUBMIT A TRANSLATION OF THE DESCRIPTION OR TO PAY THE FEE WITHIN THE PRESCRIBED TIME-LIMIT Effective date: 20210324 Ref country code: GR Free format text: LAPSE BECAUSE OF FAILURE TO SUBMIT A TRANSLATION OF THE DESCRIPTION OR TO PAY THE FEE WITHIN THE PRESCRIBED TIME-LIMIT Effective date: 20210625 Ref country code: FI Free format text: LAPSE BECAUSE OF FAILURE TO SUBMIT A TRANSLATION OF THE DESCRIPTION OR TO PAY THE FEE WITHIN THE PRESCRIBED TIME-LIMIT Effective date: 20210324 Ref country code: BG Free format text: LAPSE BECAUSE OF FAILURE TO SUBMIT A TRANSLATION OF THE DESCRIPTION OR TO PAY THE FEE WITHIN THE PRESCRIBED TIME-LIMIT Effective date: 20210624 |
|
| PG25 | Lapsed in a contracting state [announced via postgrant information from national office to epo] |
Ref country code: SE Free format text: LAPSE BECAUSE OF FAILURE TO SUBMIT A TRANSLATION OF THE DESCRIPTION OR TO PAY THE FEE WITHIN THE PRESCRIBED TIME-LIMIT Effective date: 20210324 Ref country code: RS Free format text: LAPSE BECAUSE OF FAILURE TO SUBMIT A TRANSLATION OF THE DESCRIPTION OR TO PAY THE FEE WITHIN THE PRESCRIBED TIME-LIMIT Effective date: 20210324 Ref country code: LV Free format text: LAPSE BECAUSE OF FAILURE TO SUBMIT A TRANSLATION OF THE DESCRIPTION OR TO PAY THE FEE WITHIN THE PRESCRIBED TIME-LIMIT Effective date: 20210324 |
|
| REG | Reference to a national code |
Ref country code: NL Ref legal event code: MP Effective date: 20210324 |
|
| REG | Reference to a national code |
Ref country code: AT Ref legal event code: MK05 Ref document number: 1374993 Country of ref document: AT Kind code of ref document: T Effective date: 20210324 |
|
| PG25 | Lapsed in a contracting state [announced via postgrant information from national office to epo] |
Ref country code: NL Free format text: LAPSE BECAUSE OF FAILURE TO SUBMIT A TRANSLATION OF THE DESCRIPTION OR TO PAY THE FEE WITHIN THE PRESCRIBED TIME-LIMIT Effective date: 20210324 |
|
| PG25 | Lapsed in a contracting state [announced via postgrant information from national office to epo] |
Ref country code: LT Free format text: LAPSE BECAUSE OF FAILURE TO SUBMIT A TRANSLATION OF THE DESCRIPTION OR TO PAY THE FEE WITHIN THE PRESCRIBED TIME-LIMIT Effective date: 20210324 Ref country code: EE Free format text: LAPSE BECAUSE OF FAILURE TO SUBMIT A TRANSLATION OF THE DESCRIPTION OR TO PAY THE FEE WITHIN THE PRESCRIBED TIME-LIMIT Effective date: 20210324 Ref country code: CZ Free format text: LAPSE BECAUSE OF FAILURE TO SUBMIT A TRANSLATION OF THE DESCRIPTION OR TO PAY THE FEE WITHIN THE PRESCRIBED TIME-LIMIT Effective date: 20210324 Ref country code: AT Free format text: LAPSE BECAUSE OF FAILURE TO SUBMIT A TRANSLATION OF THE DESCRIPTION OR TO PAY THE FEE WITHIN THE PRESCRIBED TIME-LIMIT Effective date: 20210324 Ref country code: SM Free format text: LAPSE BECAUSE OF FAILURE TO SUBMIT A TRANSLATION OF THE DESCRIPTION OR TO PAY THE FEE WITHIN THE PRESCRIBED TIME-LIMIT Effective date: 20210324 |
|
| PG25 | Lapsed in a contracting state [announced via postgrant information from national office to epo] |
Ref country code: PT Free format text: LAPSE BECAUSE OF FAILURE TO SUBMIT A TRANSLATION OF THE DESCRIPTION OR TO PAY THE FEE WITHIN THE PRESCRIBED TIME-LIMIT Effective date: 20210726 Ref country code: PL Free format text: LAPSE BECAUSE OF FAILURE TO SUBMIT A TRANSLATION OF THE DESCRIPTION OR TO PAY THE FEE WITHIN THE PRESCRIBED TIME-LIMIT Effective date: 20210324 Ref country code: RO Free format text: LAPSE BECAUSE OF FAILURE TO SUBMIT A TRANSLATION OF THE DESCRIPTION OR TO PAY THE FEE WITHIN THE PRESCRIBED TIME-LIMIT Effective date: 20210324 Ref country code: SK Free format text: LAPSE BECAUSE OF FAILURE TO SUBMIT A TRANSLATION OF THE DESCRIPTION OR TO PAY THE FEE WITHIN THE PRESCRIBED TIME-LIMIT Effective date: 20210324 Ref country code: IS Free format text: LAPSE BECAUSE OF FAILURE TO SUBMIT A TRANSLATION OF THE DESCRIPTION OR TO PAY THE FEE WITHIN THE PRESCRIBED TIME-LIMIT Effective date: 20210724 |
|
| REG | Reference to a national code |
Ref country code: DE Ref legal event code: R097 Ref document number: 602016054940 Country of ref document: DE |
|
| PG25 | Lapsed in a contracting state [announced via postgrant information from national office to epo] |
Ref country code: AL Free format text: LAPSE BECAUSE OF FAILURE TO SUBMIT A TRANSLATION OF THE DESCRIPTION OR TO PAY THE FEE WITHIN THE PRESCRIBED TIME-LIMIT Effective date: 20210324 Ref country code: DK Free format text: LAPSE BECAUSE OF FAILURE TO SUBMIT A TRANSLATION OF THE DESCRIPTION OR TO PAY THE FEE WITHIN THE PRESCRIBED TIME-LIMIT Effective date: 20210324 Ref country code: ES Free format text: LAPSE BECAUSE OF FAILURE TO SUBMIT A TRANSLATION OF THE DESCRIPTION OR TO PAY THE FEE WITHIN THE PRESCRIBED TIME-LIMIT Effective date: 20210324 |
|
| PLBE | No opposition filed within time limit |
Free format text: ORIGINAL CODE: 0009261 |
|
| STAA | Information on the status of an ep patent application or granted ep patent |
Free format text: STATUS: NO OPPOSITION FILED WITHIN TIME LIMIT |
|
| PG25 | Lapsed in a contracting state [announced via postgrant information from national office to epo] |
Ref country code: SI Free format text: LAPSE BECAUSE OF FAILURE TO SUBMIT A TRANSLATION OF THE DESCRIPTION OR TO PAY THE FEE WITHIN THE PRESCRIBED TIME-LIMIT Effective date: 20210324 |
|
| REG | Reference to a national code |
Ref country code: CH Ref legal event code: PL |
|
| 26N | No opposition filed |
Effective date: 20220104 |
|
| PG25 | Lapsed in a contracting state [announced via postgrant information from national office to epo] |
Ref country code: MC Free format text: LAPSE BECAUSE OF FAILURE TO SUBMIT A TRANSLATION OF THE DESCRIPTION OR TO PAY THE FEE WITHIN THE PRESCRIBED TIME-LIMIT Effective date: 20210324 |
|
| REG | Reference to a national code |
Ref country code: BE Ref legal event code: MM Effective date: 20210731 |
|
| PG25 | Lapsed in a contracting state [announced via postgrant information from national office to epo] |
Ref country code: LI Free format text: LAPSE BECAUSE OF NON-PAYMENT OF DUE FEES Effective date: 20210731 Ref country code: CH Free format text: LAPSE BECAUSE OF NON-PAYMENT OF DUE FEES Effective date: 20210731 |
|
| PG25 | Lapsed in a contracting state [announced via postgrant information from national office to epo] |
Ref country code: IS Free format text: LAPSE BECAUSE OF FAILURE TO SUBMIT A TRANSLATION OF THE DESCRIPTION OR TO PAY THE FEE WITHIN THE PRESCRIBED TIME-LIMIT Effective date: 20210724 Ref country code: LU Free format text: LAPSE BECAUSE OF NON-PAYMENT OF DUE FEES Effective date: 20210708 |
|
| PG25 | Lapsed in a contracting state [announced via postgrant information from national office to epo] |
Ref country code: IE Free format text: LAPSE BECAUSE OF NON-PAYMENT OF DUE FEES Effective date: 20210708 Ref country code: BE Free format text: LAPSE BECAUSE OF NON-PAYMENT OF DUE FEES Effective date: 20210731 |
|
| PG25 | Lapsed in a contracting state [announced via postgrant information from national office to epo] |
Ref country code: IT Free format text: LAPSE BECAUSE OF FAILURE TO SUBMIT A TRANSLATION OF THE DESCRIPTION OR TO PAY THE FEE WITHIN THE PRESCRIBED TIME-LIMIT Effective date: 20210324 |
|
| PG25 | Lapsed in a contracting state [announced via postgrant information from national office to epo] |
Ref country code: HU Free format text: LAPSE BECAUSE OF FAILURE TO SUBMIT A TRANSLATION OF THE DESCRIPTION OR TO PAY THE FEE WITHIN THE PRESCRIBED TIME-LIMIT; INVALID AB INITIO Effective date: 20160708 |
|
| PG25 | Lapsed in a contracting state [announced via postgrant information from national office to epo] |
Ref country code: CY Free format text: LAPSE BECAUSE OF FAILURE TO SUBMIT A TRANSLATION OF THE DESCRIPTION OR TO PAY THE FEE WITHIN THE PRESCRIBED TIME-LIMIT Effective date: 20210324 |
|
| P01 | Opt-out of the competence of the unified patent court (upc) registered |
Effective date: 20230526 |
|
| PGFP | Annual fee paid to national office [announced via postgrant information from national office to epo] |
Ref country code: DE Payment date: 20230727 Year of fee payment: 8 |
|
| PG25 | Lapsed in a contracting state [announced via postgrant information from national office to epo] |
Ref country code: MK Free format text: LAPSE BECAUSE OF FAILURE TO SUBMIT A TRANSLATION OF THE DESCRIPTION OR TO PAY THE FEE WITHIN THE PRESCRIBED TIME-LIMIT Effective date: 20210324 |
|
| PGFP | Annual fee paid to national office [announced via postgrant information from national office to epo] |
Ref country code: GB Payment date: 20240620 Year of fee payment: 9 |
|
| PGFP | Annual fee paid to national office [announced via postgrant information from national office to epo] |
Ref country code: FR Payment date: 20240619 Year of fee payment: 9 |