EP3319065A1 - Route prediction device - Google Patents
Route prediction device Download PDFInfo
- Publication number
- EP3319065A1 EP3319065A1 EP16817551.1A EP16817551A EP3319065A1 EP 3319065 A1 EP3319065 A1 EP 3319065A1 EP 16817551 A EP16817551 A EP 16817551A EP 3319065 A1 EP3319065 A1 EP 3319065A1
- Authority
- EP
- European Patent Office
- Prior art keywords
- unit
- predicted
- route
- likelihood
- surrounding vehicles
- Prior art date
- Legal status (The legal status is an assumption and is not a legal conclusion. Google has not performed a legal analysis and makes no representation as to the accuracy of the status listed.)
- Granted
Links
- 238000004364 calculation method Methods 0.000 claims abstract description 72
- 238000001514 detection method Methods 0.000 claims abstract description 54
- 238000012545 processing Methods 0.000 claims description 56
- 230000001133 acceleration Effects 0.000 claims description 16
- 238000005259 measurement Methods 0.000 abstract 1
- 238000005070 sampling Methods 0.000 description 24
- 230000006870 function Effects 0.000 description 17
- 238000000034 method Methods 0.000 description 14
- 238000010586 diagram Methods 0.000 description 12
- 230000033001 locomotion Effects 0.000 description 10
- 238000011156 evaluation Methods 0.000 description 9
- 239000011159 matrix material Substances 0.000 description 8
- 238000009826 distribution Methods 0.000 description 6
- 230000008859 change Effects 0.000 description 4
- 230000003287 optical effect Effects 0.000 description 3
- 238000004891 communication Methods 0.000 description 2
- 230000000694 effects Effects 0.000 description 2
- XKJMBINCVNINCA-UHFFFAOYSA-N Alfalone Chemical compound CON(C)C(=O)NC1=CC=C(Cl)C(Cl)=C1 XKJMBINCVNINCA-UHFFFAOYSA-N 0.000 description 1
- 230000008094 contradictory effect Effects 0.000 description 1
- 230000007812 deficiency Effects 0.000 description 1
- 238000013461 design Methods 0.000 description 1
- 230000005484 gravity Effects 0.000 description 1
- 230000003993 interaction Effects 0.000 description 1
- 230000001788 irregular Effects 0.000 description 1
- 230000009467 reduction Effects 0.000 description 1
- 239000004065 semiconductor Substances 0.000 description 1
- 230000007704 transition Effects 0.000 description 1
- 230000000007 visual effect Effects 0.000 description 1
Images


Classifications
-
- G—PHYSICS
- G08—SIGNALLING
- G08G—TRAFFIC CONTROL SYSTEMS
- G08G1/00—Traffic control systems for road vehicles
- G08G1/16—Anti-collision systems
- G08G1/166—Anti-collision systems for active traffic, e.g. moving vehicles, pedestrians, bikes
-
- B—PERFORMING OPERATIONS; TRANSPORTING
- B60—VEHICLES IN GENERAL
- B60W—CONJOINT CONTROL OF VEHICLE SUB-UNITS OF DIFFERENT TYPE OR DIFFERENT FUNCTION; CONTROL SYSTEMS SPECIALLY ADAPTED FOR HYBRID VEHICLES; ROAD VEHICLE DRIVE CONTROL SYSTEMS FOR PURPOSES NOT RELATED TO THE CONTROL OF A PARTICULAR SUB-UNIT
- B60W30/00—Purposes of road vehicle drive control systems not related to the control of a particular sub-unit, e.g. of systems using conjoint control of vehicle sub-units, or advanced driver assistance systems for ensuring comfort, stability and safety or drive control systems for propelling or retarding the vehicle
- B60W30/08—Active safety systems predicting or avoiding probable or impending collision or attempting to minimise its consequences
- B60W30/095—Predicting travel path or likelihood of collision
-
- B—PERFORMING OPERATIONS; TRANSPORTING
- B60—VEHICLES IN GENERAL
- B60W—CONJOINT CONTROL OF VEHICLE SUB-UNITS OF DIFFERENT TYPE OR DIFFERENT FUNCTION; CONTROL SYSTEMS SPECIALLY ADAPTED FOR HYBRID VEHICLES; ROAD VEHICLE DRIVE CONTROL SYSTEMS FOR PURPOSES NOT RELATED TO THE CONTROL OF A PARTICULAR SUB-UNIT
- B60W60/00—Drive control systems specially adapted for autonomous road vehicles
- B60W60/001—Planning or execution of driving tasks
- B60W60/0027—Planning or execution of driving tasks using trajectory prediction for other traffic participants
- B60W60/00276—Planning or execution of driving tasks using trajectory prediction for other traffic participants for two or more other traffic participants
-
- G—PHYSICS
- G08—SIGNALLING
- G08G—TRAFFIC CONTROL SYSTEMS
- G08G1/00—Traffic control systems for road vehicles
- G08G1/123—Traffic control systems for road vehicles indicating the position of vehicles, e.g. scheduled vehicles; Managing passenger vehicles circulating according to a fixed timetable, e.g. buses, trains, trams
- G08G1/133—Traffic control systems for road vehicles indicating the position of vehicles, e.g. scheduled vehicles; Managing passenger vehicles circulating according to a fixed timetable, e.g. buses, trains, trams within the vehicle ; Indicators inside the vehicles or at stops
-
- G—PHYSICS
- G08—SIGNALLING
- G08G—TRAFFIC CONTROL SYSTEMS
- G08G1/00—Traffic control systems for road vehicles
- G08G1/16—Anti-collision systems
-
- G—PHYSICS
- G08—SIGNALLING
- G08G—TRAFFIC CONTROL SYSTEMS
- G08G1/00—Traffic control systems for road vehicles
- G08G1/16—Anti-collision systems
- G08G1/164—Centralised systems, e.g. external to vehicles
-
- G—PHYSICS
- G08—SIGNALLING
- G08G—TRAFFIC CONTROL SYSTEMS
- G08G1/00—Traffic control systems for road vehicles
- G08G1/16—Anti-collision systems
- G08G1/167—Driving aids for lane monitoring, lane changing, e.g. blind spot detection
-
- H—ELECTRICITY
- H04—ELECTRIC COMMUNICATION TECHNIQUE
- H04W—WIRELESS COMMUNICATION NETWORKS
- H04W4/00—Services specially adapted for wireless communication networks; Facilities therefor
- H04W4/30—Services specially adapted for particular environments, situations or purposes
- H04W4/40—Services specially adapted for particular environments, situations or purposes for vehicles, e.g. vehicle-to-pedestrians [V2P]
- H04W4/44—Services specially adapted for particular environments, situations or purposes for vehicles, e.g. vehicle-to-pedestrians [V2P] for communication between vehicles and infrastructures, e.g. vehicle-to-cloud [V2C] or vehicle-to-home [V2H]
Definitions
- the present invention relates to a route prediction system that predicts traveling routes of a moving body.
- vehicle driving support systems For example, such a technique is developed that acquires positions of obstacles, such as vehicles and still objects around a host vehicle, by sensors installed in the host vehicle such as a millimeter wave radar, a laser radar, and a camera, determines collision risks from relative distances and relative speeds between the host vehicle and the obstacles, and then controls the host vehicle to prevent collisions.
- sensors installed in the host vehicle such as a millimeter wave radar, a laser radar, and a camera
- determines collision risks from relative distances and relative speeds between the host vehicle and the obstacles and then controls the host vehicle to prevent collisions.
- an automatic driving technique is being developed that recognizes surrounding environment by such sensors, automatically operates a steering wheel, a brake, or the like, without driver's operation, to reach the destination.
- Patent document 1 discloses a method of generating routes and evaluating control variables of the host vehicle in consideration of interaction between plural vehicles.
- the optimum predicted route is calculated on the basis of predetermined control rules, if there is a surrounding vehicle that does not follow the predetermined control rules, the predicated route may be erroneous.
- sensor errors are not considered when positions of surrounding vehicles are observed, if the sensor errors are influential, the predicted route may be erroneous.
- there are many parameters to be set such as a predicted speed of each of the surrounding vehicles given as a parameter; this leads to a concern that the design is complicated.
- Patent document 2 discloses a method where plural predicted routes of vehicles are generated in advance, with respect to the generated predicted routes, degrees of interference of the predicted routes between the host vehicle and each of the surrounding vehicles are calculated, and thereby the route that best meets a predetermined selection criterion is selected.
- it is necessary to calculate the degree of interference for one predicted route of a surrounding vehicle considering all predicted routes of the other surrounding vehicles; this leads to a concern that the calculation load may be enormous.
- only a method of calculating predicted routes of the host vehicle is disclosed, while no method of calculating the predicted routes of the surrounding vehicles is disclosed or suggested.
- Such a conventional route prediction system predicts a route of a surrounding vehicle by calculating the degree of interference for the predicted route of the surrounding vehicle considering all predicted routes of the other surrounding vehicles. Further, routes of surrounding vehicles are predicted individually. However, the conventional route prediction system does not calculate the degree of interference for a combination of a predicted route of a surrounding vehicle and predicted routes of other surrounding vehicles; thus, mutual movements of plural surrounding vehicles are not considered for a route prediction. As a result, contradictions, such as overlapping of predicted routes of plural surrounding vehicles, sometimes occur; thus, mutual routes of the plural surrounding vehicles cannot be predicted accurately. Since the degree of interference for a predicted route of a surrounding vehicle is calculated considering all predicted routes of the other surrounding vehicles, the calculation load is large.
- the present invention is made to solve the above problems, and aims to calculate, in a case where plural vehicles may collide in future, predicted routes of the plural vehicles without contradiction while reducing calculation load.
- the route prediction system includes an observation unit to observe a position of a host vehicle and positions and speeds of vehicles surrounding the host vehicle, a vehicle detection unit to detect the host vehicle and at least two of the surrounding vehicles having collision possibilities on the basis of observation results observed by the observation unit, a hypothesis generation unit to generate plural hypotheses for the at least two of the surrounding vehicles detected by the vehicle detection unit to avoid collision, a likelihood calculation unit to calculate a likelihood indicating probability of occurrence of each of the plural hypotheses generated by the hypothesis generation unit, and a predicted route analysis unit to analyze, on the basis of the likelihood calculated by the likelihood calculation unit, predicted routes of the at least two of the surrounding vehicles, and output the analysis result.
- predicted routes of the plural vehicles can be calculated without contradiction while reducing calculation load.
- Fig. 1 is a configuration diagram illustrating a route prediction system 100 according to Embodiment 1.
- the route prediction system 100 includes an observation unit 1, a vehicle detection unit 2, a hypothesis generation unit 3, a likelihood calculation unit 4, and a predicted route analysis unit 10.
- the observation unit 1 measures a position of a host vehicle and positions and speeds of surrounding vehicles and pedestrians using, for example, sensors, such as a millimeter wave radar, a laser radar, an optical camera, and an infrared camera, and a communication device that receives GPS positions of the surrounding vehicles and the pedestrians.
- the vehicle detection unit 2 has a function of detecting the host vehicle and at least two surrounding vehicles having collision possibilities on the basis of the observation results observed by the observation unit 1, and includes a lane detection unit 5, a tracking processing unit 6, and a collision detection unit 7.
- the hypothesis generation unit 3 has a function of generating plural hypotheses for the two surrounding vehicles detected by the vehicle detection unit 2 to avoid collisions.
- the likelihood calculation unit 4 has a function of calculating a likelihood indicating probability of occurrence of each hypothesis generated by the hypothesis generation unit 3, and includes a route prediction unit 8 and a hypothesis likelihood calculation unit 9.
- the predicted route analysis unit 10 has a function of analyzing an appropriate predicted route on the basis of the likelihood calculated by the likelihood calculation unit 4.
- Processing circuitry embodies each function of the observation unit 1, the vehicle detection unit 2, the hypothesis generation unit 3, the likelihood calculation unit 4, the lane detection unit 5, the tracking processing unit 6, the collision detection unit 7, the route prediction unit 8, the hypothesis likelihood calculation unit 9, and the predicted route analysis unit 10 in the route prediction system 100 described in Embodiment 1.
- the processing circuitry may be dedicated hardware or a CPU (also referred to as a central processing unit, a processing unit, a computation unit, a microprocessor, a microcomputer, a processor, or a DSP) that executes a program stored in a memory.
- the route prediction system 100 includes, as illustrated in Fig. 2 , a reception device 201 including the observation unit 1, and processing circuitry 202.
- the processing circuitry 202 corresponds to, for example, a single circuit, multiple circuits, a programmed processor, multiple programmed processors, an Application Specific Integrated Circuit (ASIC), a Field Programmable Gate Array (FPGA), or a combination thereof.
- ASIC Application Specific Integrated Circuit
- FPGA Field Programmable Gate Array
- Each function of the observation unit 1, the vehicle detection unit 2, the hypothesis generation unit 3, the likelihood calculation unit 4, the lane detection unit 5, the tracking processing unit 6, the collision detection unit 7, the route prediction unit 8, the hypothesis likelihood calculation unit 9, and the predicted route analysis unit 10 may be embodied by corresponding processing circuitry, or may be embodied by integrated processing circuitry.
- the route prediction system 100 includes, as illustrated in Fig. 3 , a reception device 203, processing circuitry 204, and a memory 205.
- the functions of the observation unit 1, the vehicle detection unit 2, the hypothesis generation unit 3, the likelihood calculation unit 4, the lane detection unit 5, the tracking processing unit 6, the collision detection unit 7, the route prediction unit 8, the hypothesis likelihood calculation unit 9, and the predicted route analysis unit 10 are embodied by software, firmware, or a combination of software and firmware.
- the software and the firmware are written as programs, and stored in the memory.
- the processing circuitry 204 reads out and executes the programs to embody the function of each unit. An example of the programs can be represented by steps S101 to S108 illustrated in Fig. 4 to be described later.
- the programs make a computer to execute procedures and methods of the observation unit 1, the vehicle detection unit 2, the hypothesis generation unit 3, the likelihood calculation unit 4, the lane detection unit 5, the tracking processing unit 6, the collision detection unit 7, the route prediction unit 8, the hypothesis likelihood calculation unit 9, and the predicted route analysis unit 10.
- the memory 205 corresponds to, for example, a nonvolatile or volatile semiconductor memory such as a RAM, a ROM, a flash memory, an EPROM, and an EEPROM, and a magnetic disk, a flexible disk, an optical disk, a compact disk, a mini disk, and a DVD.
- the functions of the observation unit 1, the vehicle detection unit 2, the hypothesis generation unit 3, the likelihood calculation unit 4, the lane detection unit 5, the tracking processing unit 6, the collision detection unit 7, the route prediction unit 8, the hypothesis likelihood calculation unit 9, and the predicted route analysis unit 10 may be embodied partly by dedicated hardware, and partly by software or firmware.
- the function of the observation unit 1 may be embodied by processing circuitry as dedicated hardware
- the functions of the vehicle detection unit 2, the hypothesis generation unit 3, the likelihood calculation unit 4, the lane detection unit 5, the tracking processing unit 6, the collision detection unit 7, the route prediction unit 8, the hypothesis likelihood calculation unit 9, and the predicted route analysis unit 10 may be embodied by processing circuitry that reads out and executes the programs stored in the memory.
- the processing circuitry can embody the above-described functions by means of hardware, software, firmware, or a combination thereof.
- Fig. 4 is a flowchart illustrating processing in the route prediction system 100 according to Embodiment 1 of the invention.
- the operation of the route prediction system 100 will be described referring to Fig. 4 .
- the observation unit 1 in the route prediction system 100 in Fig. 1 observes an area including the host vehicle and other moving vehicles to measure the positions and speeds of surrounding vehicles and pedestrians, using sensors such as a millimeter wave radar, a laser radar, an optical camera, and an infrared camera, and a communication device or the like that receives GPS positions of surrounding vehicles and pedestrians (S101).
- the lane detection unit 5 in the vehicle detection unit 2 recognizes white lines in a camera image or the like to obtain information on the lane where the host vehicle is located (S102).
- the tracking processing unit 6 in the vehicle detection unit 2 calculates, on the basis of the positions and speeds obtained by the sensors, and through tracking processing, estimated values of the positons and speeds of the surrounding vehicles, and estimated error covariance matrixes of the positions and speeds (S103).
- the collision detection unit 7 in the vehicle detection unit 2 detects surrounding vehicles that may collide with each other (S104).
- the detection may be performed on the basis of the concept of a Time To Collision (TTC), for example.
- TTC Time To Collision
- a TTC is defined by Equation (1), and vehicles with a TTC equal to or less than a threshold value are detected as vehicles having collision possibilities.
- a vehicle i is running on the same lane as a vehicle j
- the vehicle i is a preceding vehicle of the surrounding vehicle j .
- TTC y ⁇ s , k i ⁇ y ⁇ s , k j y ⁇ ⁇ s , k i ⁇ y ⁇ ⁇ s , k j y ⁇ s , k i : estimated position of surrounding vehicle i in longitudinal direction at sampling time k .
- y ⁇ ⁇ s , k i estimated speed of surrounding vehicle i in longitudinal direction at sampling time k .
- y ⁇ s , k j estimated position of surrounding vehicle j in longitudinal direction at sampling time k .
- y ⁇ ⁇ s , k j estimated speed of surrounding vehicle i in longitudinal direction at sampling time k .
- Equation (2) An alternative method may be applied where a predetermined region is set around the host vehicle and a vehicle whose predicted position after one to N steps is in the predetermined region is detected and regarded as a target vehicle.
- N predicted positions up to N steps ahead are calculated as in Equation (2).
- Equations (2) to (5) are prediction equations based on a motion model (hereinafter, a constant speed motion model) where a vehicle runs at a constant current speed.
- the prediction may be based on a constant acceleration motion model depending on a driving situation.
- the hypothesis generation unit 3 When the collision detection unit 7 detects plural collision possibilities and at least two surrounding vehicles having collision possibilities, the hypothesis generation unit 3 performs the following processing. First, the hypothesis generation unit 3 selects at least two surrounding vehicles (hereinafter, avoiding vehicles) having collision possibilities that will take avoiding actions to avoid the plural collision possibilities mentioned above. Then, a predicted scene (hereinafter, referred to as a hypothesis) is generated with reference to combinations of collision avoidance models that the at least two avoiding vehicles can take (S105). For example, as in Fig. 5 , in a case where the host vehicle and vehicles A to E exist, the vehicles A and B collide, and the vehicles C and E collide, in order to avoid the collisions, the following vehicles A and C will take avoiding actions in accordance with the collision avoidance models.
- a hypothesis a predicted scene
- a braking avoidance model As the collision avoidance models, a braking avoidance model, a left steering avoidance model, and a right steering avoidance model may be defined, for example.
- the braking avoidance model is a model in which collision is avoided by breaking while the lane is kept
- the left/right steering avoidance model is a model in which collision is avoided by inputting a steering amount for lane change to the left/right.
- the braking amount or the steering amount is set so as not to exceed a predetermined limit value. Since there are two driving lanes in Fig. 5 , four hypotheses are generated from the combinations of the collision avoidance models of the vehicle A and the vehicle C as illustrated in Fig. 6 . Since there are two driving lanes in Fig.
- the prior arts describe no example of generating a combination of avoidance models of at least two surrounding vehicles having collision possibilities, and calculate the degree of interference for each surrounding vehicle with the other surrounding vehicles; thus, the degree of interference needs to be calculated even for such a contradictory state where the routes of plural surrounding vehicles overlap each other.
- a combination of avoidance models of at least two surrounding vehicles is used; thus, it is possible to generate a hypothesis that is limited only to combinations of routes that the at least two of the surrounding vehicles can mutually take. Consequently, calculation processing is performed only for combinations of necessary routes without causing contradiction such as overlapping of the routes that the at least two surrounding vehicles can take; this enables reduction in the amount of the calculation processing.
- the route prediction unit 8 in the likelihood calculation unit 4 calculates, for each hypothesis illustrated in Fig. 6 , predicted positions of the avoiding vehicles up to N steps ahead, on the basis of the collision avoidance models, as their predicted future positions (S106). It also calculates predicted positions of vehicles other than the avoiding vehicles up to N steps ahead as their predicted future positions, assuming that the vehicles move at constant speeds as described for the collision detection unit 7. However, there is no need to recalculate the predicted position that has been calculated by the collision detection unit 7. For example, a predicted position calculation method based on a collision avoidance model will be described. Temporary routes (predicted positions up to N steps ahead) are calculated as in Equation (6) on the basis of braking acceleration of the braking avoidance model.
- Temporary routes can also be calculated for the left/right steering avoidance model. Since a predicted position of a vehicle responding to steering depends on vehicle parameters such as the vehicle weight, the position of the center of gravity of the vehicle body, and the yaw moment of inertia, if some vehicle parameters are known, they are set in advance to calculate the predicted position. If there is an unknown vehicle parameter, a parameter estimated by a known learning algorithm or the like may be used.
- the hypothesis likelihood calculation unit 9 in the likelihood calculation unit 4 calculates a hypothesis likelihood for each hypothesis on the basis of the temporary routes calculated by the route prediction unit 8 (S107).
- likelihood evaluation is performed using, for example, a collision time.
- Equation (9) defines a prediction step number n min ( i, j ) at which vehicles i and j are closest, and Equation (10) defines a distance R min ( i , j ) between the vehicles i and j.
- T c i , j T f ⁇ T f ⁇ ⁇ ⁇ T ⁇ N
- Equation (13) The left side of the equation (13) is the likelihood of the m-th hypothesis ⁇ m , and Z( k ) is a sensor observation value at the latest sampling time k. Equation (13) means that the sum of the collision times for all combinations of the surrounding vehicles is calculated. The combinations may be limited only to the two closest vehicles, or may be limited only to the vehicles that are predicted to enter the same lane. P Z k
- ⁇ m ⁇ i , j ⁇ N vel T c i , j
- the likelihood evaluation may be performed considering sensor errors or errors after tracking processing.
- a collision risk level is calculated on the basis of an estimated error covariance matrix of a position and estimated values of positons and speeds, which are outputted from the tracking processing unit 6.
- Equation (17) defines a prediction step number n min ( i , j ) that minimizes the Mahalanobis squared distance between the vehicles i and j
- Equation (18) defines the minimum Mahalanobis squared distance ⁇ min ( i , j ) between the vehicles i and j.
- Equation (19) The right side of Equation (19) means that the sum of the Mahalanobis squared distances for all combinations of the vehicles is calculated. The combinations may be limited only to the two closest vehicles, or may be limited only to the vehicles that are predicted to enter the same lane.
- ⁇ m ⁇ i , j ⁇ N vel ⁇ min i , j
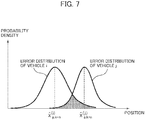
- the probability distributions of the vehicles i and j are expressed as in Fig. 7 with the horizontal axis as a position and the vertical axis as a probability density function based on error distributions.
- the magnitude of the overlap corresponds to the range where the error distributions of the vehicles overlap each other in Fig. 7 (the shaded area in Fig. 7 ). Note that, in Fig.
- the overlapping range is an area because the position is represented by one dimension for convenience of explanation, but it is a volume in a two-dimensional plane.
- the likelihood evaluation value may be defined by Equation (20), letting D( i , j ) be the magnitude of the overlap of the predicted error distributions of the vehicles i and j , and using the reciprocal of D max ( i, j ) that is the magnitude of the overlap at the prediction step number that makes D( i, j ) maximum.
- ⁇ m ⁇ i , j ⁇ N vel 1 D max i , j
- the output of the hypothesis likelihood calculation unit 9 is the hypothesis likelihood of each hypothesis. Fig.
- FIG. 8 is a diagram illustrating examples of output by the hypothesis likelihood calculation. As illustrated in Fig. 8 , the following results are obtained.
- the vehicles A and C collide in the hypothesis 1, the vehicles C and D collide in the hypothesis 2, and the vehicles C and D collide in the hypothesis 4; thus, the hypothesis likelihoods thereof are low.
- the predicted route analysis unit 10 first calculates a hypothesis confidence level using Equation (21). P ⁇ m
- Z k P Z k
- ⁇ m ⁇ m 1 M P Z k
- the predicted route confidence level corresponding to each hypothesis can be understood.
- the predicted route analysis unit 10 can output analysis results of predicted routes in various formats. For example, the predicted routes with the maximum confidence level can selectively be outputted, by selecting predicted routes of surrounding vehicles included in the hypothesis ⁇ m having the maximum hypothesis confidence level (S108).
- the predicted route analysis unit 10 can also output another format using the confidence level information.
- the hypothesis 3 has the maximum hypothesis confidence level; thus, the vehicle A selects a predicted route based on steering avoidance, and the vehicle C selects a route based on braking avoidance.
- the route prediction system 100 includes the observation unit 1 to observe positions and speeds of a host vehicle and vehicles surrounding the host vehicle, the vehicle detection unit 2 to detect the host vehicle and at least two of the surrounding vehicles having collision possibilities on the basis of observation results observed by the observation unit 1, the hypothesis generation unit 3 to generate plural hypotheses for the at least two of the surrounding vehicles detected by the vehicle detection unit 2 to avoid collision, the likelihood calculation unit 4 to calculate a likelihood indicating probability of occurrence of each of the plural hypotheses generated by the hypothesis generation unit 3, and the predicted route analysis unit 10 to analyze predicted routes of the at least two of the surrounding vehicles, on the basis of the likelihood calculated by the likelihood calculation unit 4, and output the analysis result.
- the vehicle detection unit 2 includes the lane detection unit 5 to detect a lane where the host vehicle is located, on the basis of the observation results observed by the observation unit 1, the tracking processing unit 6 to track the vehicles surrounding the host vehicle on the basis of the observation results observed by the observation unit 1, and the collision detection unit 7 to detect, among the surrounding vehicles tracked by the tracking processing unit 6, the at least two of the surrounding vehicles having collision possibilities.
- the likelihood calculation unit 4 includes the route prediction unit 8 to predict future positions of the at least two of the surrounding vehicles for each of the hypotheses generated by the hypothesis generation unit 3, and the hypothesis likelihood calculation unit 9 to calculate the likelihood indicating the probability of occurrence of each of the plural hypotheses generated by the hypothesis generation unit 3, on the basis of the future positions of the at least two of the surrounding vehicles predicted by the route prediction unit 8.
- the predicted route analysis unit 10 selects and outputs the predicted routes of the at least two of the vehicles on the basis of the likelihood calculated by the hypothesis likelihood calculation unit 9. With such a configuration, the predicted routes with the highest possibility of occurrence can be expressed as the prediction result of the route prediction system 100.
- Embodiment 1 a format in which the predicted route having the maximum confidence level is selectively outputted from the predicted route analysis unit 10 is disclosed, but it is also possible to output the analysis result in other formats.
- Embodiment 2 a case of outputting an analysis result different from that in Embodiment 1 will be described.
- Fig. 9 is a configuration diagram illustrating a route prediction system 100 according to Embodiment 2.
- the route prediction system 100 includes the observation unit 1, the lane detection unit 5, the tracking processing unit 6, the collision detection unit 7, the hypothesis generation unit 3, the route prediction unit 8, the hypothesis likelihood calculation unit 9, the predicted route analysis unit 10, and a predicted route confidence level calculation unit 11 provided in the predicted route analysis unit 10.
- a hardware configuration that embodies the function of each unit in the route prediction system 100 illustrated in Fig. 9 is expressed by the configuration in Fig. 2 or Fig. 3 as in Embodiment 1.
- the predicted route confidence level calculation unit 11 calculates an index representing probability of occurrence of the predicted route of each vehicle as a predicted route confidence level. For example, the confidence level that a vehicle i takes a predicted route based on a collision avoidance model j is calculated by Equation (22). The left side of Equation (22) is the confidence level that the vehicle i takes the predicted route based on the collision avoidance model j .
- a value obtained by normalizing the predicted route based on the collision avoidance model j for the vehicle i with the confidence level of all collision avoidance models may be a replacement as the predicted route confidence level.
- Z k P l i , j
- the predicted route analysis unit 10 includes the predicted route confidence level calculation unit 11 to calculate, on the basis of the likelihood calculated by the likelihood calculation unit 4, a predicted route confidence level indicating probability of occurrence of each of the predicted routes of at least two surrounding vehicles for each of the predicted routes.
- a quantitative value indicating probability of occurrence of the predicted route is outputted; this allows a user to understand intuitively. This makes it easier for other systems to use the invention.
- Fig. 10 is a configuration diagram illustrating a route prediction system 100 according to Embodiment 3.
- the route prediction system 100 according to Embodiment 3 includes the observation unit 1, a signal processing unit 20, and a display unit 30; the signal processing unit 20 includes the vehicle detection unit 2, the hypothesis generation unit 3, the likelihood calculation unit 4, and the predicted route analysis unit 10, which are described in Embodiments 1 and 2.
- a hardware configuration that embodies the function of each unit in the route prediction system 100 illustrated in Fig. 10 is expressed, as in Embodiment 1, by the configuration in Fig. 2 or Fig. 3 .
- the route prediction system 100 includes the observation unit 1 to observe, as in Embodiments 1 and 2, an area including a host vehicle and other moving vehicles, the signal processing unit 20 to generate, as in Embodiments 1 and 2, on the basis of the observation results, plural hypotheses that express collision avoidance models for at least two surrounding vehicles having collision possibilities, calculate predicted route confidence levels of the predicted routes corresponding to each of the hypotheses, and output the predicted route confidence levels, and the display unit 30 to display on a display screen the predicted routes that at least two surrounding vehicles can take and the confidence level corresponding to each of the predicted routes.
- the observation unit 1 to observe a position of a host vehicle and positions and speeds of vehicles surrounding the host vehicle, the signal processing unit 20 to generate, on the basis of the observation results observed by the observation unit 1, plural hypotheses expressing collision avoidance models for at least two detected surrounding vehicle having collision possibilities, and calculate predicted route confidence levels of the predicted routes of the at least two surrounding vehicles corresponding to each of the plural hypotheses, and the display unit 30 to display the predicted routes and the predicted route confidence levels of the at least two surrounding vehicles on the basis of the predicted route confidence levels calculated by the signal processing unit 20.
- the route prediction system 100 enables visual understanding of a predicted route of a surrounding vehicle. Further, by displaying the predicted route with a color corresponding to predicted route confidence level, a user can more accurately recognize the predicted route having a high predicted route confidence level.
- Embodiments 1 and 2 there is no function of modifying the analysis result of a predicted route when irregular vehicle motion occurs; however, it is also possible to have a format in which a confidence level of a hypothesis, a confidence level of a predicted route, and the like are modified using values such as an estimated speed and an accelerations of a surrounding vehicle estimated by the tracking processing.
- the analysis result of a predicted route is outputted independently for each time; however, it is also possible to analyze the predicted route considering the continuity in the time direction.
- Embodiment 4 a case of outputting analysis results different from those in Embodiments 1 and 2 will be described.
- Fig. 13 is a configuration diagram illustrating a route prediction system 100 according to Embodiment 4.
- the route prediction system 100 includes the observation unit 1, the lane detection unit 5, the tracking processing unit 6, the collision detection unit 7, the hypothesis generation unit 3, the route prediction unit 8, the hypothesis likelihood calculation unit 9, the predicted route analysis unit 10, the predicted route confidence level calculation unit 11 provided in the predicted route analysis unit 10, and a confidence level memory 12.
- a hardware configuration that embodies the function of each unit in the route prediction system 100 illustrated in Fig. 13 is expressed by the configuration in Fig. 2 or Fig. 3 as in Embodiment 1.
- the hypothesis likelihood calculation unit 9 in the likelihood calculation unit 4 calculates a hypothesis likelihood for each hypothesis on the basis of the temporary routes calculated by the route prediction unit 8.
- the hypothesis likelihood is calculated by the following equation, where the likelihood evaluation value P(Z( k )
- Equation (25) A method of calculating the likelihood evaluation value regarding the avoidance trajectory in Equation (25) will be described below.
- a method of calculating the likelihood regarding the avoidance trajectory by the right steering will be described below.
- a speed is generated in the right direction with respect to the straight traveling direction.
- the likelihood of the right steering avoidance trajectory is calculated by Equation (26) using the lateral speed.
- Equation (28) may be used, in which the likelihood is higher as the lateral position is closer to the center line of the right adjacent lane.
- Equation (28) may be used, in which the likelihood is higher as the lateral position is closer to the center line of the right adjacent lane.
- Equation (28) may be used, in which the likelihood is higher as the lateral position is closer to the center line of the right adjacent lane.
- Equation (28) may be used, in which the likelihood is higher as the lateral position is closer to the center line of the right adjacent lane.
- the estimated longitudinal acceleration and the standard deviation of the estimated longitudinal acceleration error can be calculated by the tracking processing based on the constant acceleration motion model.
- L i y ⁇ ⁇ s , k i ⁇ y ⁇ ⁇ s , k ⁇ n i 2 ⁇ vy , k 2
- y ⁇ ⁇ s , k i Estimated longitudinal speed at sampling time k y ⁇ ⁇ s , k ⁇ n i : Estimated longitudinal speed at sampling time ( k-n ) ⁇ vy,k : Standard deviation of estimated longitudinal speed error
- Equation (32) for all vehicles included in the hypothesis ⁇ m , the sum of the likelihoods based on respective collision avoidance models is calculated.
- ⁇ m ⁇ i ⁇ I L i
- I means a set of vehicle numbers
- i means a vehicle number
- j means a collision avoidance model number.
- the predicted route analysis unit 10 calculates, with Equation (33), the hypothesis confidence level at the current sampling time k .
- Z k P ' Z k
- Z k ⁇ 1 ⁇ m 1 M P ' Z k
- ⁇ m k -1 ) in the numerator of Equation (33) represents the transition probability of the hypothesis from the sampling time ( k -1) to the sampling time k , and it is set as a parameter unless prior information is given. Normally, it may be set to one.
- the third term is the hypothesis confidence level at the preceding sampling time ( k -1), which is stored in the confidence level memory
- the predicted route confidence level calculation unit 11 calculates, as the predicted route confidence level, an index representing the probability of occurrence of the predicted route of each vehicle. For example, the confidence level that the vehicle i takes the predicted route based on the collision avoidance model j is calculated by Equation (34). The left side of Equation (34) is the confidence level that the vehicle i takes the predicted route based on the collision avoidance model j .
- a value obtained by normalizing the predicted route based on the collision avoidance model j for the vehicle i with the confidence level of all collision avoidance models may be a replacement as the predicted route confidence level. Since the other processing is the same as that in Embodiments 1 and 2, the description thereof will be omitted.
- the likelihood calculation unit 4 calculates a hypothesis likelihood on the basis of the estimated value and the estimated error covariance matrix outputted from the tracking processing unit 6, and the predicted route analysis unit 10 includes the predicted route confidence level calculation unit 11 that calculates, on the basis of the likelihood calculated by the likelihood calculation unit 4 and the hypothesis confidence level at the preceding sampling time, the predicted route confidence level indicating probability of occurrence of predicted routes of at least two surrounding vehicles for each predicted route.
- the likelihood of the predicted route of each vehicle is modified according to the change in the motion of each vehicle, and the confidence level with continuity in the time direction is calculated; thus, in addition to the effects of Embodiments 1 and 2, more accurate information can be provided to a user.
- Embodiment 4 the description of the same processing as in Embodiments 1 and 2 is omitted, but any combinations of Embodiment 1 and Embodiments 1 and 2 are included in the present invention.
Abstract
Description
- The present invention relates to a route prediction system that predicts traveling routes of a moving body.
- Recently, techniques for predicting safe routes to avoid collisions between moving bodies have been required in various fields including vehicle driving support systems and air traffic controls. With respect to vehicle driving support systems, for example, such a technique is developed that acquires positions of obstacles, such as vehicles and still objects around a host vehicle, by sensors installed in the host vehicle such as a millimeter wave radar, a laser radar, and a camera, determines collision risks from relative distances and relative speeds between the host vehicle and the obstacles, and then controls the host vehicle to prevent collisions. Further, as a more advanced technique, an automatic driving technique is being developed that recognizes surrounding environment by such sensors, automatically operates a steering wheel, a brake, or the like, without driver's operation, to reach the destination.
-
Patent document 1 discloses a method of generating routes and evaluating control variables of the host vehicle in consideration of interaction between plural vehicles. However, because the optimum predicted route is calculated on the basis of predetermined control rules, if there is a surrounding vehicle that does not follow the predetermined control rules, the predicated route may be erroneous. In addition, because sensor errors are not considered when positions of surrounding vehicles are observed, if the sensor errors are influential, the predicted route may be erroneous. Furthermore, there are many parameters to be set, such as a predicted speed of each of the surrounding vehicles given as a parameter; this leads to a concern that the design is complicated. -
Patent document 2 discloses a method where plural predicted routes of vehicles are generated in advance, with respect to the generated predicted routes, degrees of interference of the predicted routes between the host vehicle and each of the surrounding vehicles are calculated, and thereby the route that best meets a predetermined selection criterion is selected. However, when calculating predicted routes of all surrounding vehicles, it is necessary to calculate the degree of interference for one predicted route of a surrounding vehicle considering all predicted routes of the other surrounding vehicles; this leads to a concern that the calculation load may be enormous. Further, only a method of calculating predicted routes of the host vehicle is disclosed, while no method of calculating the predicted routes of the surrounding vehicles is disclosed or suggested. - A more specific description will be given of the problem in calculating a predicted route under the circumstances where plural surrounding vehicles are in proximity. As illustrated in
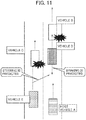
Fig. 11 , it is assumed that vehicles E and D collide with preceding vehicles C and B, respectively. It is also assumed that the vehicle E has a high probability of moving to the right lane by steering to avoid the collision with the vehicle C, while the vehicle D, having no space on the left lane to move to, has a high probability of avoiding the collision by braking. However, as illustrated inFig. 12 , if the routes are predicted where the vehicle E steers and the vehicle D brakes to avoid the collision with respective preceding vehicles, possibility of collision between the vehicle D and the vehicle E arises. In this case, even if the collision between the vehicles D and E is avoided by re-prediction, another collision possibility arises, so that no predicted route that avoids all possible collisions can be calculated. -
- Patent Document 1: Japanese Patent No.
3714258 - Patent Document 2: Japanese Patent No.
4353192 - Such a conventional route prediction system predicts a route of a surrounding vehicle by calculating the degree of interference for the predicted route of the surrounding vehicle considering all predicted routes of the other surrounding vehicles. Further, routes of surrounding vehicles are predicted individually. However, the conventional route prediction system does not calculate the degree of interference for a combination of a predicted route of a surrounding vehicle and predicted routes of other surrounding vehicles; thus, mutual movements of plural surrounding vehicles are not considered for a route prediction. As a result, contradictions, such as overlapping of predicted routes of plural surrounding vehicles, sometimes occur; thus, mutual routes of the plural surrounding vehicles cannot be predicted accurately. Since the degree of interference for a predicted route of a surrounding vehicle is calculated considering all predicted routes of the other surrounding vehicles, the calculation load is large.
- The present invention is made to solve the above problems, and aims to calculate, in a case where plural vehicles may collide in future, predicted routes of the plural vehicles without contradiction while reducing calculation load.
- The route prediction system according to the invention includes an observation unit to observe a position of a host vehicle and positions and speeds of vehicles surrounding the host vehicle, a vehicle detection unit to detect the host vehicle and at least two of the surrounding vehicles having collision possibilities on the basis of observation results observed by the observation unit, a hypothesis generation unit to generate plural hypotheses for the at least two of the surrounding vehicles detected by the vehicle detection unit to avoid collision, a likelihood calculation unit to calculate a likelihood indicating probability of occurrence of each of the plural hypotheses generated by the hypothesis generation unit, and a predicted route analysis unit to analyze, on the basis of the likelihood calculated by the likelihood calculation unit, predicted routes of the at least two of the surrounding vehicles, and output the analysis result.
- According to the invention, in a case where plural surrounding vehicles may collide in future, predicted routes of the plural vehicles can be calculated without contradiction while reducing calculation load.
-
-
Fig. 1 is a diagram illustrating a configuration of aroute prediction system 100 according toEmbodiment 1 of the invention. -
Fig. 2 is a diagram illustrating an example of hardware configuration of theroute prediction system 100 according toEmbodiment 1 of the invention. -
Fig. 3 is a diagram illustrating another example of hardware configuration of theroute prediction system 100 according toEmbodiment 1 of the invention. -
Fig. 4 is a flowchart illustrating processing in theroute prediction system 100 according toEmbodiment 1 of the invention. -
Fig. 5 is an example of vehicle situations dealt with in ahypothesis generation unit 3 according toEmbodiment 1 of the invention. -
Fig. 6 is a set of hypotheses of collision avoidance dealt with in thehypothesis generation unit 3 according toEmbodiment 1 of the invention. -
Fig. 7 is probability distributions of vehicles according toEmbodiment 1 of the invention. -
Fig. 8 is a diagram illustrating hypothesis likelihood for each hypothesis according toEmbodiment 1 of the present invention. -
Fig. 9 is a diagram illustrating a configuration of aroute prediction system 100 according toEmbodiment 2 of the invention. -
Fig. 10 is a diagram illustrating a configuration of aroute prediction system 100 according toEmbodiment 3 of the invention. -
Fig. 11 is an example of a road situation where plural vehicles coexist according to a prior art. -
Fig. 12 is an example of an erroneous prediction in a case where avoidance by the plural vehicles is performed according to the prior art. -
Fig. 13 is a diagram illustrating a configuration of aroute prediction system 100 according toEmbodiment 4 of the invention. - An embodiment of the invention will be described below.
-
Fig. 1 is a configuration diagram illustrating aroute prediction system 100 according toEmbodiment 1. As illustrated inFig. 1 , theroute prediction system 100 according to the embodiment includes anobservation unit 1, avehicle detection unit 2, ahypothesis generation unit 3, alikelihood calculation unit 4, and a predictedroute analysis unit 10. Theobservation unit 1 measures a position of a host vehicle and positions and speeds of surrounding vehicles and pedestrians using, for example, sensors, such as a millimeter wave radar, a laser radar, an optical camera, and an infrared camera, and a communication device that receives GPS positions of the surrounding vehicles and the pedestrians. Thevehicle detection unit 2 has a function of detecting the host vehicle and at least two surrounding vehicles having collision possibilities on the basis of the observation results observed by theobservation unit 1, and includes alane detection unit 5, atracking processing unit 6, and acollision detection unit 7. Thehypothesis generation unit 3 has a function of generating plural hypotheses for the two surrounding vehicles detected by thevehicle detection unit 2 to avoid collisions. Thelikelihood calculation unit 4 has a function of calculating a likelihood indicating probability of occurrence of each hypothesis generated by thehypothesis generation unit 3, and includes aroute prediction unit 8 and a hypothesislikelihood calculation unit 9. The predictedroute analysis unit 10 has a function of analyzing an appropriate predicted route on the basis of the likelihood calculated by thelikelihood calculation unit 4. - Processing circuitry embodies each function of the
observation unit 1, thevehicle detection unit 2, thehypothesis generation unit 3, thelikelihood calculation unit 4, thelane detection unit 5, thetracking processing unit 6, thecollision detection unit 7, theroute prediction unit 8, the hypothesislikelihood calculation unit 9, and the predictedroute analysis unit 10 in theroute prediction system 100 described inEmbodiment 1. The processing circuitry may be dedicated hardware or a CPU (also referred to as a central processing unit, a processing unit, a computation unit, a microprocessor, a microcomputer, a processor, or a DSP) that executes a program stored in a memory. - In a case where the processing circuitry is dedicated hardware, the
route prediction system 100 includes, as illustrated inFig. 2 , areception device 201 including theobservation unit 1, andprocessing circuitry 202. Theprocessing circuitry 202 corresponds to, for example, a single circuit, multiple circuits, a programmed processor, multiple programmed processors, an Application Specific Integrated Circuit (ASIC), a Field Programmable Gate Array (FPGA), or a combination thereof. Each function of theobservation unit 1, thevehicle detection unit 2, thehypothesis generation unit 3, thelikelihood calculation unit 4, thelane detection unit 5, thetracking processing unit 6, thecollision detection unit 7, theroute prediction unit 8, the hypothesislikelihood calculation unit 9, and the predictedroute analysis unit 10 may be embodied by corresponding processing circuitry, or may be embodied by integrated processing circuitry. - In a case where the processing circuitry is a CPU, the
route prediction system 100 includes, as illustrated inFig. 3 , areception device 203,processing circuitry 204, and amemory 205. The functions of theobservation unit 1, thevehicle detection unit 2, thehypothesis generation unit 3, thelikelihood calculation unit 4, thelane detection unit 5, thetracking processing unit 6, thecollision detection unit 7, theroute prediction unit 8, the hypothesislikelihood calculation unit 9, and the predictedroute analysis unit 10 are embodied by software, firmware, or a combination of software and firmware. The software and the firmware are written as programs, and stored in the memory. Theprocessing circuitry 204 reads out and executes the programs to embody the function of each unit. An example of the programs can be represented by steps S101 to S108 illustrated inFig. 4 to be described later. In other words, the programs make a computer to execute procedures and methods of theobservation unit 1, thevehicle detection unit 2, thehypothesis generation unit 3, thelikelihood calculation unit 4, thelane detection unit 5, thetracking processing unit 6, thecollision detection unit 7, theroute prediction unit 8, the hypothesislikelihood calculation unit 9, and the predictedroute analysis unit 10. Here, thememory 205 corresponds to, for example, a nonvolatile or volatile semiconductor memory such as a RAM, a ROM, a flash memory, an EPROM, and an EEPROM, and a magnetic disk, a flexible disk, an optical disk, a compact disk, a mini disk, and a DVD. - Note that the functions of the
observation unit 1, thevehicle detection unit 2, thehypothesis generation unit 3, thelikelihood calculation unit 4, thelane detection unit 5, thetracking processing unit 6, thecollision detection unit 7, theroute prediction unit 8, the hypothesislikelihood calculation unit 9, and the predictedroute analysis unit 10 may be embodied partly by dedicated hardware, and partly by software or firmware. For example, the function of theobservation unit 1 may be embodied by processing circuitry as dedicated hardware, and the functions of thevehicle detection unit 2, thehypothesis generation unit 3, thelikelihood calculation unit 4, thelane detection unit 5, thetracking processing unit 6, thecollision detection unit 7, theroute prediction unit 8, the hypothesislikelihood calculation unit 9, and the predictedroute analysis unit 10 may be embodied by processing circuitry that reads out and executes the programs stored in the memory. - In this manner, the processing circuitry can embody the above-described functions by means of hardware, software, firmware, or a combination thereof.
-
Fig. 4 is a flowchart illustrating processing in theroute prediction system 100 according toEmbodiment 1 of the invention. The operation of theroute prediction system 100 will be described referring toFig. 4 . Theobservation unit 1 in theroute prediction system 100 inFig. 1 observes an area including the host vehicle and other moving vehicles to measure the positions and speeds of surrounding vehicles and pedestrians, using sensors such as a millimeter wave radar, a laser radar, an optical camera, and an infrared camera, and a communication device or the like that receives GPS positions of surrounding vehicles and pedestrians (S101). Thelane detection unit 5 in thevehicle detection unit 2 recognizes white lines in a camera image or the like to obtain information on the lane where the host vehicle is located (S102). Thetracking processing unit 6 in thevehicle detection unit 2 calculates, on the basis of the positions and speeds obtained by the sensors, and through tracking processing, estimated values of the positons and speeds of the surrounding vehicles, and estimated error covariance matrixes of the positions and speeds (S103). - The
collision detection unit 7 in thevehicle detection unit 2 detects surrounding vehicles that may collide with each other (S104). The detection may be performed on the basis of the concept of a Time To Collision (TTC), for example. A TTC is defined by Equation (1), and vehicles with a TTC equal to or less than a threshold value are detected as vehicles having collision possibilities. Here, a vehicle i is running on the same lane as a vehicle j, and the vehicle i is a preceding vehicle of the surrounding vehicle j.


- An alternative method may be applied where a predetermined region is set around the host vehicle and a vehicle whose predicted position after one to N steps is in the predetermined region is detected and regarded as a target vehicle. Here, N predicted positions up to N steps ahead are calculated as in Equation (2). Equations (2) to (5) are prediction equations based on a motion model (hereinafter, a constant speed motion model) where a vehicle runs at a constant current speed. However, not limited to the constant speed motion model, the prediction may be based on a constant acceleration motion model depending on a driving situation.


ΔT : Step duration
ILXL : Unit matrix of L rows and L columns - When the
collision detection unit 7 detects plural collision possibilities and at least two surrounding vehicles having collision possibilities, thehypothesis generation unit 3 performs the following processing. First, thehypothesis generation unit 3 selects at least two surrounding vehicles (hereinafter, avoiding vehicles) having collision possibilities that will take avoiding actions to avoid the plural collision possibilities mentioned above. Then, a predicted scene (hereinafter, referred to as a hypothesis) is generated with reference to combinations of collision avoidance models that the at least two avoiding vehicles can take (S105). For example, as inFig. 5 , in a case where the host vehicle and vehicles A to E exist, the vehicles A and B collide, and the vehicles C and E collide, in order to avoid the collisions, the following vehicles A and C will take avoiding actions in accordance with the collision avoidance models. As the collision avoidance models, a braking avoidance model, a left steering avoidance model, and a right steering avoidance model may be defined, for example. The braking avoidance model is a model in which collision is avoided by breaking while the lane is kept, and the left/right steering avoidance model is a model in which collision is avoided by inputting a steering amount for lane change to the left/right. In the models, the braking amount or the steering amount is set so as not to exceed a predetermined limit value. Since there are two driving lanes inFig. 5 , four hypotheses are generated from the combinations of the collision avoidance models of the vehicle A and the vehicle C as illustrated inFig. 6 . Since there are two driving lanes inFig. 6 , for the vehicle A, only the right steering model and the braking model are dealt with; the left steering model is not dealt with because it contradicts the actual routes. For the vehicle C, only the left steering model and the braking model are dealt with, and the right steering model is not dealt with because it contradicts the actual routes. In this way, the models that contradict the actual routes are excluded, and only the models without contradiction are dealt with. InFig. 6 , all combinations of the models used for the vehicles A and C are dealt with; if a combination of the models dealt with for the vehicles A and C contradicts with the actual routes, the combination can be excluded. Consequently, in the present embodiment, combinations of models that the vehicles A and C can take can be dealt with as possible predicted scenes (hypotheses). By storing hypotheses in a memory or the like in advance, a hypothesis suitable for an arrangement pattern of the avoiding vehicles can be retrieved by reading it out from the memory. - The prior arts describe no example of generating a combination of avoidance models of at least two surrounding vehicles having collision possibilities, and calculate the degree of interference for each surrounding vehicle with the other surrounding vehicles; thus, the degree of interference needs to be calculated even for such a contradictory state where the routes of plural surrounding vehicles overlap each other. In the embodiment, however, a combination of avoidance models of at least two surrounding vehicles is used; thus, it is possible to generate a hypothesis that is limited only to combinations of routes that the at least two of the surrounding vehicles can mutually take. Consequently, calculation processing is performed only for combinations of necessary routes without causing contradiction such as overlapping of the routes that the at least two surrounding vehicles can take; this enables reduction in the amount of the calculation processing.
- The
route prediction unit 8 in thelikelihood calculation unit 4 calculates, for each hypothesis illustrated inFig. 6 , predicted positions of the avoiding vehicles up to N steps ahead, on the basis of the collision avoidance models, as their predicted future positions (S106). It also calculates predicted positions of vehicles other than the avoiding vehicles up to N steps ahead as their predicted future positions, assuming that the vehicles move at constant speeds as described for thecollision detection unit 7. However, there is no need to recalculate the predicted position that has been calculated by thecollision detection unit 7. For example, a predicted position calculation method based on a collision avoidance model will be described. Temporary routes (predicted positions up to N steps ahead) are calculated as in Equation (6) on the basis of braking acceleration of the braking avoidance model.


- Temporary routes can also be calculated for the left/right steering avoidance model. Since a predicted position of a vehicle responding to steering depends on vehicle parameters such as the vehicle weight, the position of the center of gravity of the vehicle body, and the yaw moment of inertia, if some vehicle parameters are known, they are set in advance to calculate the predicted position. If there is an unknown vehicle parameter, a parameter estimated by a known learning algorithm or the like may be used.
- The hypothesis
likelihood calculation unit 9 in thelikelihood calculation unit 4 calculates a hypothesis likelihood for each hypothesis on the basis of the temporary routes calculated by the route prediction unit 8 (S107). In the calculation of the hypothesis likelihood, likelihood evaluation is performed using, for example, a collision time. Equation (9) defines a prediction step number nmin (i, j) at which vehicles i and j are closest, and Equation (10) defines a distance Rmin (i, j) between the vehicles i and j.

- If the distance Rmin (i, j) between the vehicles i and j is a threshold value or smaller, the vehicles i and j are deemed to collide, and the collision time is calculated.


- Next, the likelihood evaluation value is defined by Equation (13). The left side of the equation (13) is the likelihood of the m-th hypothesis Φm, and Z(k) is a sensor observation value at the latest sampling time k. Equation (13) means that the sum of the collision times for all combinations of the surrounding vehicles is calculated. The combinations may be limited only to the two closest vehicles, or may be limited only to the vehicles that are predicted to enter the same lane.

- In the calculation of the hypothesis likelihood, the likelihood evaluation may be performed considering sensor errors or errors after tracking processing. First, a collision risk level is calculated on the basis of an estimated error covariance matrix of a position and estimated values of positons and speeds, which are outputted from the
tracking processing unit 6. As in Equation (14), a value obtained by normalizing the difference between the predicted positions of the vehicles i and j after n (n = 1, ..., N) steps at the sampling time k with the estimated error covariance matrix, that is, a Mahalanobis squared distance ε k+n , is calculated.


- Equation (17) defines a prediction step number nmin(i, j) that minimizes the Mahalanobis squared distance between the vehicles i and j, and Equation (18) defines the minimum Mahalanobis squared distance ε min(i, j) between the vehicles i and j.


- Next, the likelihood evaluation value is defined by Equation (19). The right side of Equation (19) means that the sum of the Mahalanobis squared distances for all combinations of the vehicles is calculated. The combinations may be limited only to the two closest vehicles, or may be limited only to the vehicles that are predicted to enter the same lane.

- Further, in the calculation of the hypothesis likelihood, it is also allowed, with regard to the predicted error covariance matrix after n steps, to set an overlap of the predicted error distributions of the vehicles as an index, and use the reciprocal of the magnitude of the overlap. For example, the probability distributions of the vehicles i and j are expressed as in
Fig. 7 with the horizontal axis as a position and the vertical axis as a probability density function based on error distributions. As shown inFig. 7 , the magnitude of the overlap corresponds to the range where the error distributions of the vehicles overlap each other inFig. 7 (the shaded area inFig. 7 ). Note that, inFig. 7 , the overlapping range is an area because the position is represented by one dimension for convenience of explanation, but it is a volume in a two-dimensional plane. Here, the likelihood evaluation value may be defined by Equation (20), letting D(i, j) be the magnitude of the overlap of the predicted error distributions of the vehicles i and j, and using the reciprocal of Dmax(i, j) that is the magnitude of the overlap at the prediction step number that makes D(i, j) maximum.
likelihood calculation unit 9 is the hypothesis likelihood of each hypothesis.Fig. 8 is a diagram illustrating examples of output by the hypothesis likelihood calculation. As illustrated inFig. 8 , the following results are obtained. The vehicles A and C collide in thehypothesis 1, the vehicles C and D collide in thehypothesis 2, and the vehicles C and D collide in thehypothesis 4; thus, the hypothesis likelihoods thereof are low. No collision occurs in thehypothesis 3; thus, the hypothesis likelihood thereof is high. - The predicted
route analysis unit 10 first calculates a hypothesis confidence level using Equation (21).
route analysis unit 10 can output analysis results of predicted routes in various formats. For example, the predicted routes with the maximum confidence level can selectively be outputted, by selecting predicted routes of surrounding vehicles included in the hypothesis Φm having the maximum hypothesis confidence level (S108). The predictedroute analysis unit 10 can also output another format using the confidence level information. In a case of outputting the predicted routes with the maximum confidence level, in the example shown inFig. 8 , thehypothesis 3 has the maximum hypothesis confidence level; thus, the vehicle A selects a predicted route based on steering avoidance, and the vehicle C selects a route based on braking avoidance. - According to
Embodiment 1 described above, theroute prediction system 100 includes theobservation unit 1 to observe positions and speeds of a host vehicle and vehicles surrounding the host vehicle, thevehicle detection unit 2 to detect the host vehicle and at least two of the surrounding vehicles having collision possibilities on the basis of observation results observed by theobservation unit 1, thehypothesis generation unit 3 to generate plural hypotheses for the at least two of the surrounding vehicles detected by thevehicle detection unit 2 to avoid collision, thelikelihood calculation unit 4 to calculate a likelihood indicating probability of occurrence of each of the plural hypotheses generated by thehypothesis generation unit 3, and the predictedroute analysis unit 10 to analyze predicted routes of the at least two of the surrounding vehicles, on the basis of the likelihood calculated by thelikelihood calculation unit 4, and output the analysis result. With such a configuration, in a case where plural surrounding vehicles may collide in future, predicted scenes based on the vehicle motions are generated; thus, scenes assumed in reality can be covered without excess or deficiency, and the predicted routes of the plural vehicles can be calculated without contradiction; this improves performance on predicting the routes of the surrounding vehicles. Further, it is not necessary to calculate evaluation values such as degrees of interference for a myriad of routes as in the prior arts, so that the calculation load can be reduced. - According to
Embodiment 1, thevehicle detection unit 2 includes thelane detection unit 5 to detect a lane where the host vehicle is located, on the basis of the observation results observed by theobservation unit 1, thetracking processing unit 6 to track the vehicles surrounding the host vehicle on the basis of the observation results observed by theobservation unit 1, and thecollision detection unit 7 to detect, among the surrounding vehicles tracked by thetracking processing unit 6, the at least two of the surrounding vehicles having collision possibilities. With such a configuration, at least two surrounding vehicles having collision possibilities can be detected. - According to
Embodiment 1, thelikelihood calculation unit 4 includes theroute prediction unit 8 to predict future positions of the at least two of the surrounding vehicles for each of the hypotheses generated by thehypothesis generation unit 3, and the hypothesislikelihood calculation unit 9 to calculate the likelihood indicating the probability of occurrence of each of the plural hypotheses generated by thehypothesis generation unit 3, on the basis of the future positions of the at least two of the surrounding vehicles predicted by theroute prediction unit 8. With such a configuration, the likelihoods of the predicted routes of at least two surrounding vehicles having collision possibilities can be calculated. - According to
Embodiment 1, the predictedroute analysis unit 10 selects and outputs the predicted routes of the at least two of the vehicles on the basis of the likelihood calculated by the hypothesislikelihood calculation unit 9. With such a configuration, the predicted routes with the highest possibility of occurrence can be expressed as the prediction result of theroute prediction system 100. - In
Embodiment 1, a format in which the predicted route having the maximum confidence level is selectively outputted from the predictedroute analysis unit 10 is disclosed, but it is also possible to output the analysis result in other formats. InEmbodiment 2, a case of outputting an analysis result different from that inEmbodiment 1 will be described. -
Fig. 9 is a configuration diagram illustrating aroute prediction system 100 according toEmbodiment 2. As illustrated inFig. 9 , theroute prediction system 100 according to the embodiment includes theobservation unit 1, thelane detection unit 5, thetracking processing unit 6, thecollision detection unit 7, thehypothesis generation unit 3, theroute prediction unit 8, the hypothesislikelihood calculation unit 9, the predictedroute analysis unit 10, and a predicted route confidencelevel calculation unit 11 provided in the predictedroute analysis unit 10. A hardware configuration that embodies the function of each unit in theroute prediction system 100 illustrated inFig. 9 is expressed by the configuration inFig. 2 orFig. 3 as inEmbodiment 1. - The predicted route confidence
level calculation unit 11 calculates an index representing probability of occurrence of the predicted route of each vehicle as a predicted route confidence level. For example, the confidence level that a vehicle i takes a predicted route based on a collision avoidance model j is calculated by Equation (22). The left side of Equation (22) is the confidence level that the vehicle i takes the predicted route based on the collision avoidance model j. P (l i,j | Φm) in Equation (23), which is a term related to combination, is set to 1 if the predicted route is included in the hypothesis Φm, and 0 if not included.

- Further, as in Equation (24), a value obtained by normalizing the predicted route based on the collision avoidance model j for the vehicle i with the confidence level of all collision avoidance models may be a replacement as the predicted route confidence level.

Embodiment 1, description thereof will be omitted. - According to
Embodiment 2 described above, the predictedroute analysis unit 10 includes the predicted route confidencelevel calculation unit 11 to calculate, on the basis of the likelihood calculated by thelikelihood calculation unit 4, a predicted route confidence level indicating probability of occurrence of each of the predicted routes of at least two surrounding vehicles for each of the predicted routes. With such a configuration, instead of determining one predicted route for each vehicle as described inEmbodiment 1, a quantitative value indicating probability of occurrence of the predicted route is outputted; this allows a user to understand intuitively. This makes it easier for other systems to use the invention. - In the embodiment, a configuration for displaying the output of the
route prediction system 100 ofEmbodiments -
Fig. 10 is a configuration diagram illustrating aroute prediction system 100 according toEmbodiment 3. As illustrated inFig. 10 , theroute prediction system 100 according toEmbodiment 3 includes theobservation unit 1, asignal processing unit 20, and adisplay unit 30; thesignal processing unit 20 includes thevehicle detection unit 2, thehypothesis generation unit 3, thelikelihood calculation unit 4, and the predictedroute analysis unit 10, which are described inEmbodiments route prediction system 100 illustrated inFig. 10 is expressed, as inEmbodiment 1, by the configuration inFig. 2 orFig. 3 . - The
route prediction system 100 according to the embodiment includes theobservation unit 1 to observe, as inEmbodiments signal processing unit 20 to generate, as inEmbodiments display unit 30 to display on a display screen the predicted routes that at least two surrounding vehicles can take and the confidence level corresponding to each of the predicted routes. - As described above, according to
Embodiment 3, there is provided theobservation unit 1 to observe a position of a host vehicle and positions and speeds of vehicles surrounding the host vehicle, thesignal processing unit 20 to generate, on the basis of the observation results observed by theobservation unit 1, plural hypotheses expressing collision avoidance models for at least two detected surrounding vehicle having collision possibilities, and calculate predicted route confidence levels of the predicted routes of the at least two surrounding vehicles corresponding to each of the plural hypotheses, and thedisplay unit 30 to display the predicted routes and the predicted route confidence levels of the at least two surrounding vehicles on the basis of the predicted route confidence levels calculated by thesignal processing unit 20. With such a configuration, theroute prediction system 100 enables visual understanding of a predicted route of a surrounding vehicle. Further, by displaying the predicted route with a color corresponding to predicted route confidence level, a user can more accurately recognize the predicted route having a high predicted route confidence level. - In
Embodiments Embodiments Embodiment 4, a case of outputting analysis results different from those inEmbodiments -
Fig. 13 is a configuration diagram illustrating aroute prediction system 100 according toEmbodiment 4. As illustrated inFig. 13 , theroute prediction system 100 according to the embodiment includes theobservation unit 1, thelane detection unit 5, thetracking processing unit 6, thecollision detection unit 7, thehypothesis generation unit 3, theroute prediction unit 8, the hypothesislikelihood calculation unit 9, the predictedroute analysis unit 10, the predicted route confidencelevel calculation unit 11 provided in the predictedroute analysis unit 10, and aconfidence level memory 12. A hardware configuration that embodies the function of each unit in theroute prediction system 100 illustrated inFig. 13 is expressed by the configuration inFig. 2 orFig. 3 as inEmbodiment 1. - The hypothesis
likelihood calculation unit 9 in thelikelihood calculation unit 4 calculates a hypothesis likelihood for each hypothesis on the basis of the temporary routes calculated by theroute prediction unit 8. Here, the hypothesis likelihood is calculated by the following equation, where the likelihood evaluation value P(Z(k) | Φm) regarding the magnitude of collision, which is defined by Equation (19) or (20) inEmbodiment 1, is multiplied by a likelihood evaluation value P(Trj(k) | Φm) regarding an avoidance trajectory.
- A method of calculating the likelihood evaluation value regarding the avoidance trajectory in Equation (25) will be described below. First, a method of calculating the likelihood regarding the avoidance trajectory by the right steering will be described below. At the time of avoidance by the right steering, a speed is generated in the right direction with respect to the straight traveling direction. The likelihood of the right steering avoidance trajectory is calculated by Equation (26) using the lateral speed.


Vx : Typical lateral speed at time of lane change
σvx,k : Standard deviation of estimated lateral speed error The typical lateral speed at the time of lane change is set as a parameter. - Alternatively, using the feature that avoidance to the right results in the movement to the right adjacent lane, instead of Equation (27), Equation (28) may be used, in which the likelihood is higher as the lateral position is closer to the center line of the right adjacent lane.

LINEx : Lateral position of center line of right adjacent lane


- Next, a method of calculating the likelihood of the avoidance trajectory regarding braking avoidance will be described below. At the time of avoidance by braking, acceleration is generated with respect to the straight traveling direction. Thus, using the acceleration at the time of braking, the likelihood of the braking avoidance trajectory is calculated by Equation (29).


ay : Typical longitudinal acceleration at time of braking
σαy,k : Standard deviation of estimated longitudinal acceleration error The typical acceleration at the time of braking is set as a parameter. - The estimated longitudinal acceleration and the standard deviation of the estimated longitudinal acceleration error can be calculated by the tracking processing based on the constant acceleration motion model. When the estimation accuracy of the acceleration is not sufficient, calculation of the likelihood is difficult; thus, a likelihood calculation method using speed will be described below.


σvy,k : Standard deviation of estimated longitudinal speed error - As in Equation (32), for all vehicles included in the hypothesis Φm, the sum of the likelihoods based on respective collision avoidance models is calculated.

hypothesis 1 inFig. 6 , since the vehicle A steers to the right and the vehicle C brakes, a likelihood of the right steering avoidance trajectory is calculated for the vehicle A, a likelihood of braking avoidance trajectory is calculated for the vehicle C, and these likelihoods are added. - The predicted
route analysis unit 10 calculates, with Equation (33), the hypothesis confidence level at the current sampling time k.
confidence level memory 12 and read out to be used. - The predicted route confidence
level calculation unit 11 calculates, as the predicted route confidence level, an index representing the probability of occurrence of the predicted route of each vehicle. For example, the confidence level that the vehicle i takes the predicted route based on the collision avoidance model j is calculated by Equation (34). The left side of Equation (34) is the confidence level that the vehicle i takes the predicted route based on the collision avoidance model j.
- Alternatively, as in Equation (24) in
Embodiment 1, a value obtained by normalizing the predicted route based on the collision avoidance model j for the vehicle i with the confidence level of all collision avoidance models may be a replacement as the predicted route confidence level. Since the other processing is the same as that inEmbodiments - According to
Embodiment 4 described above, thelikelihood calculation unit 4 calculates a hypothesis likelihood on the basis of the estimated value and the estimated error covariance matrix outputted from thetracking processing unit 6, and the predictedroute analysis unit 10 includes the predicted route confidencelevel calculation unit 11 that calculates, on the basis of the likelihood calculated by thelikelihood calculation unit 4 and the hypothesis confidence level at the preceding sampling time, the predicted route confidence level indicating probability of occurrence of predicted routes of at least two surrounding vehicles for each predicted route. With such a configuration, the likelihood of the predicted route of each vehicle is modified according to the change in the motion of each vehicle, and the confidence level with continuity in the time direction is calculated; thus, in addition to the effects ofEmbodiments - Note that, in
Embodiment 4, the description of the same processing as inEmbodiments Embodiment 1 and Embodiments 1 and 2 are included in the present invention. -
- 1: observation unit, 2: vehicle detection unit, 3: hypothesis generation unit,
- 4: likelihood calculation unit, 5: lane detection unit, 6: tracking processing unit
- 7: collision detection unit, 8: route prediction unit,
- 9: hypothesis likelihood calculation unit, 10: predicted route analysis unit,
- 11: predicted route confidence level calculation unit, 12: confidence level memory,
- 20: signal processing unit, 30: display unit, 100: route prediction system,
- 201,203: reception device, 202,204: processing circuitry, 205: memory
Claims (10)
- A route prediction system comprising:an observation unit to observe a position of a host vehicle and positions and speeds of vehicles surrounding the host vehicle;a vehicle detection unit to detect the host vehicle and at least two of the surrounding vehicles having collision possibilities on a basis of observation results observed by the observation unit;a hypothesis generation unit to generate a plurality of hypotheses for the at least two of the surrounding vehicles detected by the vehicle detection unit to avoid collision;a likelihood calculation unit to calculate a likelihood indicating probability of occurrence of each of the plurality of hypotheses generated by the hypothesis generation unit; anda predicted route analysis unit to analyze predicted routes of the at least two of the surrounding vehicles, on a basis of the likelihood calculated by the likelihood calculation unit, and output the analysis result.
- The route prediction system according to claim 1, wherein the vehicle detection unit comprises:a lane detection unit to detect a lane where the host vehicle is located, on a basis of the observation results observed by the observation unit;a tracking processing unit to track the surrounding vehicles on a basis of the observation results observed by the observation unit; anda collision detection unit to detect, among the surrounding vehicles tracked by the tracking processing unit, the at least two of the surrounding vehicles having collision possibilities.
- The route prediction system according to claim 1 or claim 2, wherein the likelihood calculation unit comprises:a route prediction unit to predict future positions of the at least two of the surrounding vehicles for each of the plurality of hypotheses generated by the hypothesis generation unit; anda hypothesis likelihood calculation unit to calculate, on a basis of the future positions of the at least two of the surrounding vehicles predicted by the route prediction unit, the likelihood indicating the probability of occurrence of each of the plurality of hypotheses generated by the hypothesis generation unit.
- The route prediction system according to claim 3, wherein the hypothesis likelihood calculation unit calculates, on a basis of estimated speeds and estimated speed errors at a current time of the at least two surrounding vehicles predicted by the route prediction unit, the likelihood indicating the probability of occurrence of each of the plurality of hypotheses generated by the hypothesis generation unit.
- The route prediction system according to claim 3, wherein the hypothesis likelihood calculation unit calculates, on a basis of estimated accelerations and estimated acceleration errors at a current time of the at least two surrounding vehicles predicted by the route prediction unit, the likelihood indicating the probability of occurrence of each of the plurality of hypotheses generated by the hypothesis generation unit.
- The route prediction system according to any one of claims 1 to 5, wherein the predicted route analysis unit selects and outputs the predicted routes of the at least two of the surrounding vehicles on a basis of the likelihood calculated by the likelihood calculation unit.
- The route prediction system according to any one of claims 1 to 6, wherein the predicted route analysis unit comprises a predicted route confidence level calculation unit to calculate, on a basis of the likelihood calculated by the likelihood calculation unit, a predicted route confidence level indicating probability of occurrence of each of the predicted routes of the at least two of the surrounding vehicles for each of the predicted routes.
- The route prediction system according to any one of claims 1 to 7, wherein the predicted route analysis unit comprises a predicted route confidence level calculation unit to calculate, on a basis of the likelihood calculated by the likelihood calculation unit, a confidence level of each of the plurality of hypotheses including the predicted routes of the at least two of the surrounding vehicles.
- The route prediction system according to claim 7 or claim 8, wherein the predicted route confidence level calculation unit calculates, on a basis of a confidence level of each of the plurality of hypotheses including the predicted routes of the at least two of the surrounding vehicles calculated at a preceding time, the predicted route confidence level for each of the predicted routes.
- A route prediction system comprising:an observation unit to observe a position of a host vehicle and positions and speeds of vehicles surrounding the host vehicle;a signal processing unit to generate, on a basis of the observation results observed by the observation unit, a plurality of hypotheses expressing collision avoidance models for at least two of the detected surrounding vehicles having collision possibilities, and calculate predicted route confidence levels of predicted routes of the at least two of the surrounding vehicles corresponding to each of the plurality of hypotheses; anda display unit to display, on a basis of the predicted route confidence levels calculated by the signal processing unit, the predicted routes and the predicted route confidence levels of the at least two of the surrounding vehicles.
Applications Claiming Priority (2)
| Application Number | Priority Date | Filing Date | Title |
|---|---|---|---|
| PCT/JP2015/069131 WO2017002258A1 (en) | 2015-07-02 | 2015-07-02 | Route prediction device |
| PCT/JP2016/063161 WO2017002441A1 (en) | 2015-07-02 | 2016-04-27 | Route prediction device |
Publications (3)
| Publication Number | Publication Date |
|---|---|
| EP3319065A1 true EP3319065A1 (en) | 2018-05-09 |
| EP3319065A4 EP3319065A4 (en) | 2019-02-27 |
| EP3319065B1 EP3319065B1 (en) | 2024-04-10 |
Family
ID=57608470
Family Applications (1)
| Application Number | Title | Priority Date | Filing Date |
|---|---|---|---|
| EP16817551.1A Active EP3319065B1 (en) | 2015-07-02 | 2016-04-27 | Route prediction device |
Country Status (5)
| Country | Link |
|---|---|
| US (1) | US10741079B2 (en) |
| EP (1) | EP3319065B1 (en) |
| JP (1) | JP6272566B2 (en) |
| CN (1) | CN107710304B (en) |
| WO (2) | WO2017002258A1 (en) |
Families Citing this family (22)
| Publication number | Priority date | Publication date | Assignee | Title |
|---|---|---|---|---|
| US10460534B1 (en) | 2015-10-26 | 2019-10-29 | Allstate Insurance Company | Vehicle-to-vehicle accident detection |
| WO2019072949A2 (en) * | 2017-10-13 | 2019-04-18 | Robert Bosch Gmbh | Systems and methods for vehicle to improve an orientation estimation of a traffic participant |
| FR3076045A1 (en) * | 2017-12-22 | 2019-06-28 | Orange | METHOD FOR MONITORING AN ENVIRONMENT OF A FIRST ELEMENT POSITIONED AT THE LEVEL OF A CIRCULATION PATH, AND ASSOCIATED SYSTEM |
| EP3598414A1 (en) * | 2018-07-20 | 2020-01-22 | Volvo Car Corporation | System and method for avoiding a collision course |
| CN113544030B (en) * | 2019-03-18 | 2023-11-17 | 三菱电机株式会社 | Route generation system, route generation method, and computer-readable storage medium |
| US20200298859A1 (en) * | 2019-03-21 | 2020-09-24 | The Regents Of The University Of Michigan | Safe Autonomous Overtaking with Intention Estimation |
| CN111736592A (en) | 2019-03-25 | 2020-10-02 | 本田技研工业株式会社 | Route determination device, robot, and route determination method |
| DE112019007147T5 (en) * | 2019-04-01 | 2022-01-05 | Mitsubishi Electric Corporation | Vehicle path generation device, vehicle path generation method, and vehicle control device |
| JP7181997B2 (en) * | 2019-05-23 | 2022-12-01 | 日立Astemo株式会社 | Vehicle control system and vehicle control method |
| JP7098580B2 (en) | 2019-07-05 | 2022-07-11 | 株式会社東芝 | Predictors, predictors, programs and vehicle control systems |
| US11697412B2 (en) * | 2019-11-13 | 2023-07-11 | Zoox, Inc. | Collision monitoring using statistic models |
| US11648939B2 (en) * | 2019-11-13 | 2023-05-16 | Zoox, Inc. | Collision monitoring using system data |
| EP4030403A4 (en) * | 2020-03-04 | 2022-10-19 | Huawei Technologies Co., Ltd. | Method and device for predicting exit for vehicle |
| US20210339741A1 (en) * | 2020-04-30 | 2021-11-04 | Zoox, Inc. | Constraining vehicle operation based on uncertainty in perception and/or prediction |
| US11945472B2 (en) | 2020-08-28 | 2024-04-02 | Motional Ad Llc | Trajectory planning of vehicles using route information |
| CN112124319B (en) * | 2020-08-28 | 2021-04-23 | 青岛慧拓智能机器有限公司 | Intelligent driving system |
| US20220282980A1 (en) * | 2021-03-03 | 2022-09-08 | International Business Machines Corporation | Pedestrian route guidance that provides a space buffer |
| CN113753038B (en) * | 2021-03-16 | 2023-09-01 | 京东鲲鹏(江苏)科技有限公司 | Track prediction method and device, electronic equipment and storage medium |
| JP7175344B1 (en) | 2021-05-11 | 2022-11-18 | 三菱電機株式会社 | VEHICLE CONTROL DEVICE, VEHICLE CONTROL SYSTEM, VEHICLE CONTROL METHOD AND VEHICLE CONTROL PROGRAM |
| US11938959B2 (en) * | 2021-10-12 | 2024-03-26 | Here Global B.V. | Driving assistance device, system thereof, and method thereof |
| JP7191179B1 (en) | 2021-10-27 | 2022-12-16 | 三菱電機株式会社 | VEHICLE CONTROL DEVICE, VEHICLE CONTROL SYSTEM, VEHICLE CONTROL METHOD AND VEHICLE CONTROL PROGRAM |
| JP7224421B1 (en) | 2021-11-12 | 2023-02-17 | 三菱電機株式会社 | Route prediction device, route prediction method, and vehicle control system |
Family Cites Families (21)
| Publication number | Priority date | Publication date | Assignee | Title |
|---|---|---|---|---|
| JP3714258B2 (en) | 2002-02-01 | 2005-11-09 | 日産自動車株式会社 | Recommended operation amount generator for vehicles |
| US7729857B2 (en) * | 2005-08-18 | 2010-06-01 | Gm Global Technology Operations, Inc. | System for and method of detecting a collision and predicting a vehicle path |
| JP4353192B2 (en) | 2006-03-02 | 2009-10-28 | トヨタ自動車株式会社 | Course setting method, apparatus, program, and automatic driving system |
| WO2007102367A1 (en) * | 2006-02-28 | 2007-09-13 | Toyota Jidosha Kabushiki Kaisha | Object course prediction method, device, program, and automatic driving system |
| JP4062353B1 (en) * | 2006-11-10 | 2008-03-19 | トヨタ自動車株式会社 | Obstacle course prediction method, apparatus, and program |
| JP4623057B2 (en) | 2007-06-05 | 2011-02-02 | トヨタ自動車株式会社 | Moving area acquisition device for own vehicle |
| JP5250290B2 (en) | 2008-04-02 | 2013-07-31 | 富士重工業株式会社 | 4D optimal route guidance system for aircraft |
| JP2010033352A (en) * | 2008-07-29 | 2010-02-12 | Toyota Central R&D Labs Inc | Lane change alarm and program |
| CN100570523C (en) * | 2008-08-18 | 2009-12-16 | 浙江大学 | A kind of mobile robot's barrier-avoiding method based on the barrier motion prediction |
| CN101813492B (en) * | 2010-04-19 | 2012-11-14 | 清华大学 | Vehicle navigation system and method |
| CN101943916B (en) * | 2010-09-07 | 2012-09-26 | 陕西科技大学 | Kalman filter prediction-based robot obstacle avoidance method |
| JP5189157B2 (en) * | 2010-11-30 | 2013-04-24 | 株式会社豊田中央研究所 | Moving object target state determination device and program |
| US8466807B2 (en) * | 2011-06-01 | 2013-06-18 | GM Global Technology Operations LLC | Fast collision detection technique for connected autonomous and manual vehicles |
| CN102509474A (en) * | 2011-11-09 | 2012-06-20 | 深圳市伊爱高新技术开发有限公司 | System and method for automatically preventing collision between vehicles |
| SE536586C2 (en) * | 2012-07-02 | 2014-03-11 | Scania Cv Ab | Device and method for assessing accident risk when driving a vehicle |
| JP2014241036A (en) * | 2013-06-11 | 2014-12-25 | 三菱電機株式会社 | Vehicle driving assist system |
| US9260095B2 (en) * | 2013-06-19 | 2016-02-16 | Magna Electronics Inc. | Vehicle vision system with collision mitigation |
| EP2851886B1 (en) * | 2013-09-19 | 2018-04-11 | Volvo Car Corporation | Arrangement in a vehicle for providing vehicle driver support, a vehicle, and a method for providing vehicle driver support |
| JP2015155878A (en) * | 2014-02-21 | 2015-08-27 | 株式会社デンソー | Obstacle detection device for vehicle |
| CN104093185B (en) * | 2014-06-06 | 2017-10-20 | 华南理工大学 | A kind of multichannel multi-path routing implementation method towards fleet's MANET |
| CN104157167B (en) * | 2014-08-28 | 2016-09-28 | 银江股份有限公司 | A kind of vehicle collision avoidance method based on collaborative relative localization technology |
-
2015
- 2015-07-02 WO PCT/JP2015/069131 patent/WO2017002258A1/en active Application Filing
-
2016
- 2016-04-27 EP EP16817551.1A patent/EP3319065B1/en active Active
- 2016-04-27 CN CN201680037219.6A patent/CN107710304B/en active Active
- 2016-04-27 JP JP2017526206A patent/JP6272566B2/en active Active
- 2016-04-27 WO PCT/JP2016/063161 patent/WO2017002441A1/en active Application Filing
- 2016-04-27 US US15/739,650 patent/US10741079B2/en active Active
Also Published As
| Publication number | Publication date |
|---|---|
| CN107710304B (en) | 2020-09-29 |
| WO2017002258A1 (en) | 2017-01-05 |
| WO2017002441A1 (en) | 2017-01-05 |
| US10741079B2 (en) | 2020-08-11 |
| EP3319065A4 (en) | 2019-02-27 |
| CN107710304A (en) | 2018-02-16 |
| JPWO2017002441A1 (en) | 2017-09-14 |
| US20180182245A1 (en) | 2018-06-28 |
| EP3319065B1 (en) | 2024-04-10 |
| JP6272566B2 (en) | 2018-01-31 |
Similar Documents
| Publication | Publication Date | Title |
|---|---|---|
| EP3319065B1 (en) | Route prediction device | |
| CN107451521B (en) | Vehicle lane map estimation | |
| JP6800575B2 (en) | Methods and systems to assist drivers in their own vehicles | |
| CN110352450B (en) | Driving assistance method and driving assistance device | |
| EP2562060B1 (en) | A method and system for predicting movement behavior of a target traffic object | |
| US9196163B2 (en) | Driving support apparatus and driving support method | |
| US10102761B2 (en) | Route prediction device | |
| US10493987B2 (en) | Target-lane relationship recognition apparatus | |
| JP7156394B2 (en) | Other Vehicle Motion Prediction Method and Other Vehicle Motion Prediction Device | |
| JPWO2018193535A1 (en) | Driving support method and driving support device | |
| CN113412212A (en) | Other-vehicle behavior prediction method and other-vehicle behavior prediction device | |
| CN114906164A (en) | Trajectory verification for autonomous driving | |
| CN110858301A (en) | Eccentricity map | |
| EP3527450B1 (en) | Vehicle control apparatus | |
| JPWO2020044512A1 (en) | In-vehicle device, information processing method and information processing program | |
| CN114423657A (en) | Vehicle control device, vehicle control method, vehicle motion control system, and lane estimation device | |
| US20210197811A1 (en) | Course prediction device, computer readable medium, and course prediction method | |
| JP2015069287A (en) | Own vehicle position recognition device | |
| JP7356892B2 (en) | Vehicle driving environment estimation method and driving environment estimation system | |
| JP2018112461A (en) | Probability calculation device and probability calculation method | |
| CN114291116B (en) | Surrounding vehicle track prediction method and device, vehicle and storage medium | |
| KR20230014008A (en) | Method and apparatus for determining the possibility of collision of a driving vehicle using an artificial neural network | |
| JP6330868B2 (en) | Vehicle control device | |
| JP6594565B1 (en) | In-vehicle device, information processing method, and information processing program | |
| JP2010224786A (en) | Collision risk degree estimating device and program |
Legal Events
| Date | Code | Title | Description |
|---|---|---|---|
| STAA | Information on the status of an ep patent application or granted ep patent |
Free format text: STATUS: THE INTERNATIONAL PUBLICATION HAS BEEN MADE |
|
| PUAI | Public reference made under article 153(3) epc to a published international application that has entered the european phase |
Free format text: ORIGINAL CODE: 0009012 |
|
| STAA | Information on the status of an ep patent application or granted ep patent |
Free format text: STATUS: REQUEST FOR EXAMINATION WAS MADE |
|
| 17P | Request for examination filed |
Effective date: 20171219 |
|
| AK | Designated contracting states |
Kind code of ref document: A1 Designated state(s): AL AT BE BG CH CY CZ DE DK EE ES FI FR GB GR HR HU IE IS IT LI LT LU LV MC MK MT NL NO PL PT RO RS SE SI SK SM TR |
|
| AX | Request for extension of the european patent |
Extension state: BA ME |
|
| DAV | Request for validation of the european patent (deleted) | ||
| DAX | Request for extension of the european patent (deleted) | ||
| A4 | Supplementary search report drawn up and despatched |
Effective date: 20190128 |
|
| RIC1 | Information provided on ipc code assigned before grant |
Ipc: G08G 1/16 20060101AFI20190122BHEP Ipc: G08G 1/133 20060101ALI20190122BHEP Ipc: H04W 4/44 20180101ALI20190122BHEP |
|
| STAA | Information on the status of an ep patent application or granted ep patent |
Free format text: STATUS: EXAMINATION IS IN PROGRESS |
|
| 17Q | First examination report despatched |
Effective date: 20210525 |
|
| STAA | Information on the status of an ep patent application or granted ep patent |
Free format text: STATUS: EXAMINATION IS IN PROGRESS |
|
| GRAP | Despatch of communication of intention to grant a patent |
Free format text: ORIGINAL CODE: EPIDOSNIGR1 |
|
| STAA | Information on the status of an ep patent application or granted ep patent |
Free format text: STATUS: GRANT OF PATENT IS INTENDED |
|
| RIC1 | Information provided on ipc code assigned before grant |
Ipc: B60W 60/00 20200101ALI20231020BHEP Ipc: B60W 30/095 20120101ALI20231020BHEP Ipc: G08G 1/16 20060101AFI20231020BHEP |
|
| INTG | Intention to grant announced |
Effective date: 20231122 |
|
| GRAS | Grant fee paid |
Free format text: ORIGINAL CODE: EPIDOSNIGR3 |
|
| GRAA | (expected) grant |
Free format text: ORIGINAL CODE: 0009210 |
|
| STAA | Information on the status of an ep patent application or granted ep patent |
Free format text: STATUS: THE PATENT HAS BEEN GRANTED |
|
| AK | Designated contracting states |
Kind code of ref document: B1 Designated state(s): AL AT BE BG CH CY CZ DE DK EE ES FI FR GB GR HR HU IE IS IT LI LT LU LV MC MK MT NL NO PL PT RO RS SE SI SK SM TR |
|
| REG | Reference to a national code |
Ref country code: GB Ref legal event code: FG4D |